Embed Size (px)
Citation preview
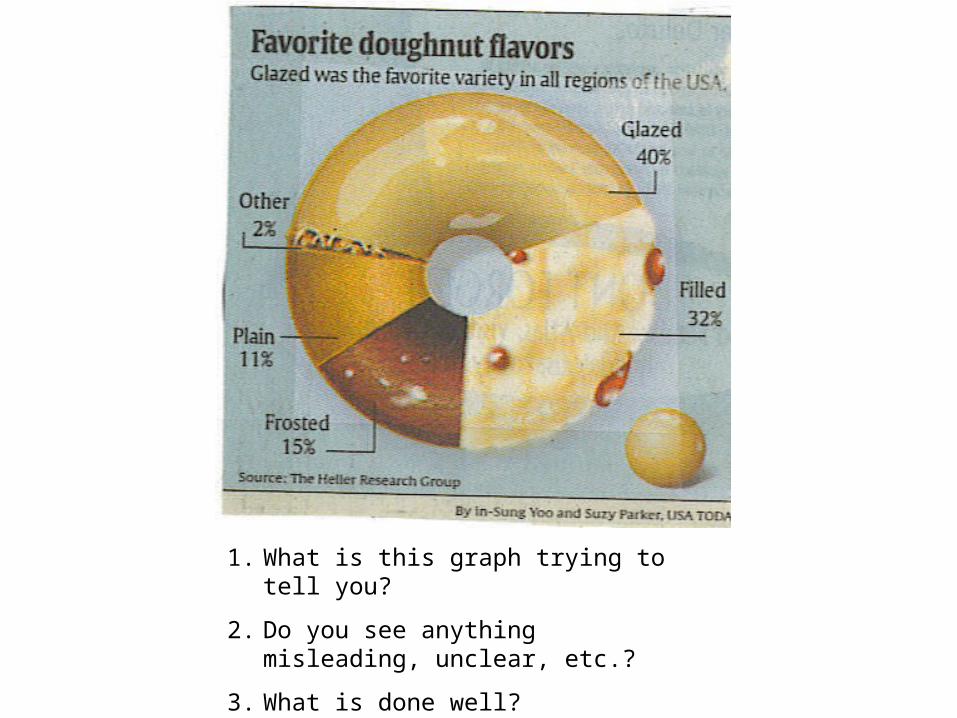
1. What is this graph trying to tell you?
2. Do you see anything misleading, unclear, etc.?
3. What is done well?
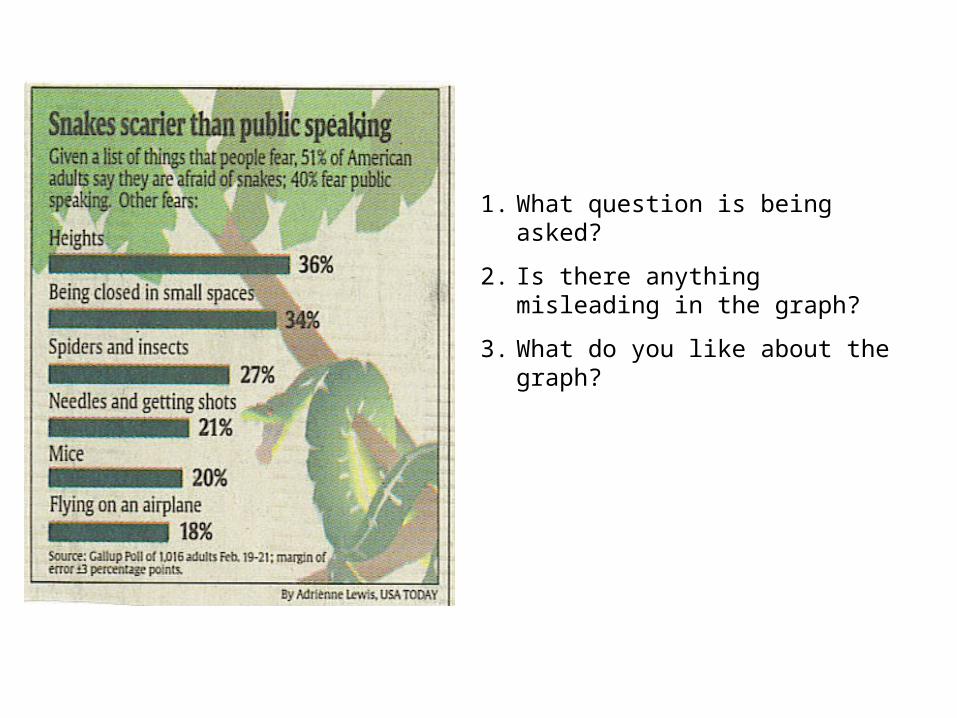
1. What question is being asked?
2. Is there anything misleading in the graph?
3. What do you like about the graph?
Why do Students study statistics?
• To Read and Understand Studies in various fields (I need to know vocab, symbols, concepts, statistical procedures)
• To Conduct Research in your field(I need to design experiments, collect, organize, analyze, and summarize data, make reliable predictions for the future and communicate my
findings.)
• To Become a better Consumer and Citizen. (I need to make intelligent decisions about products to purchase based on consumer studies, government spending based on utilization studies, etc.)
What is Statistics?
Statistics
The science of conducting studies to collect, organize, summarize, analyze, and draw conclusions from data
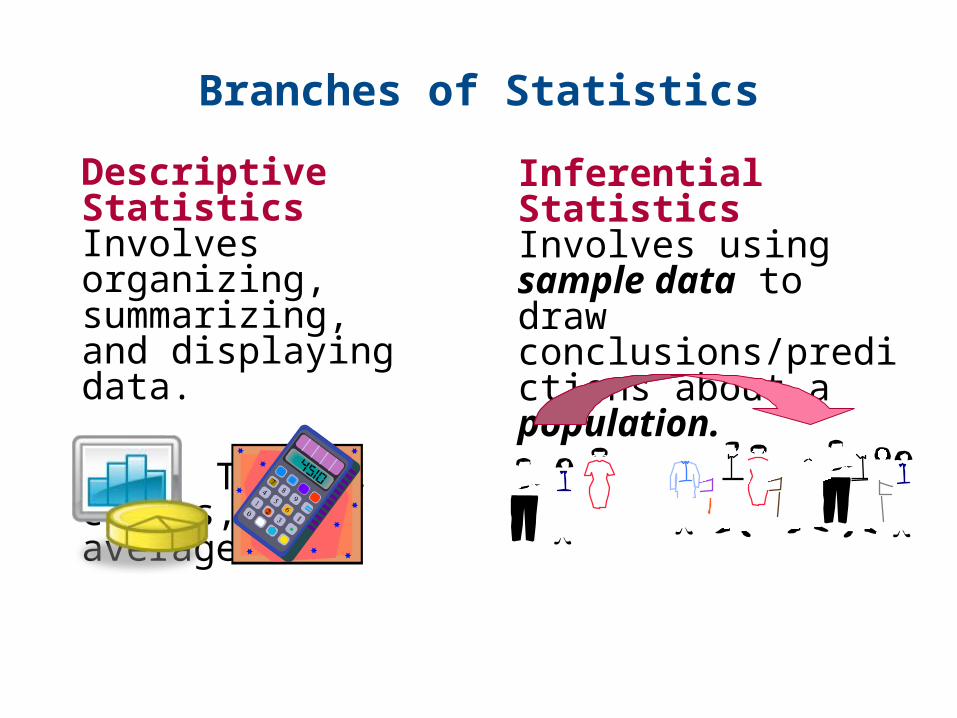
Branches of Statistics
Descriptive Statistics Involves organizing, summarizing, and displaying data.
e.g. Tables, charts, averages
Inferential Statistics Involves using sample data to draw conclusions/predictions about a population.
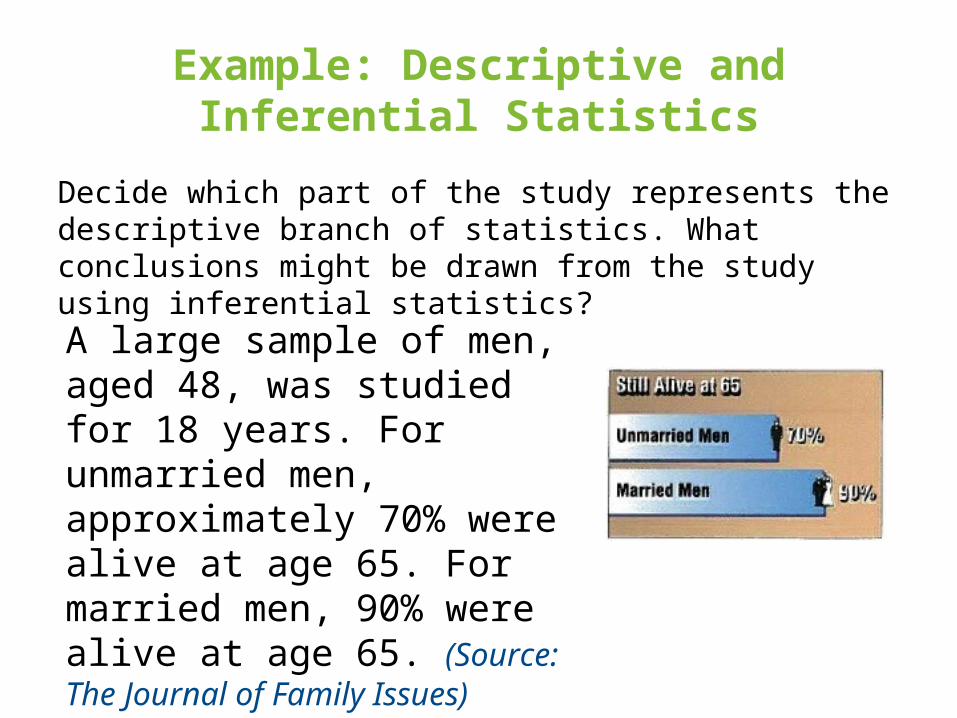
Example: Descriptive and Inferential Statistics
Decide which part of the study represents the descriptive branch of statistics. What conclusions might be drawn from the study using inferential statistics?
A large sample of men, aged 48, was studied for 18 years. For unmarried men, approximately 70% were alive at age 65. For married men, 90% were alive at age 65. (Source: The Journal of Family Issues)

Solution: Descriptive and Inferential Statistics
Descriptive statistics involves statements such as “For unmarried men, approximately 70% were alive at age 65” and “For married men, 90% were alive at 65.”
A possible inference drawn from the study is that being married is associated with a longer life for men.
Hypothesis Testing
Used in Inferential Statistics
A decision-making process for evaluating claims about a population, based on information obtained from samples.
1-1 Statistical Terms
• Variable: A characteristic or attribute that can assume different values.
• Data:THE VALUES (measurements or observations) that the variables can assume.
• Random Variables:Variables whose values are determined by chance.
Examples of Data
• “People who eat three daily servings of whole grains have been shown to reduce their risk of…stroke by 37%.” (Source: Whole Grains Council)
• “Seventy percent of the 1500 U.S. spinal cord injuries to minors result from vehicle accidents, and 68 percent were not wearing a seatbelt.” (Source: UPI)
Data Sets
Population The collection of all subjects (human or otherwise) that are being studied.
Sample A subset of the population.A group of subjects from a population.
Example: Identifying Data Sets
In a recent survey, 1500 adults in the United States were asked if they thought there was solid evidence for global warming. Eight hundred fifty-five of the adults said yes. Identify the population and the sample. Describe the data set. (Adapted from: Pew Research Center)

Solution: Identifying Data Sets
• The population consists of the responses of all adults in the U.S.
• The sample consists of the responses of the 1500 adults in the U.S. in the survey.
• The sample is a subset of the responses of all adults in the U.S.
• The data set consists of 855 yes’s and 645 no’s.
Responses of adults in the U.S. (population)
Responses of adults in survey (sample)
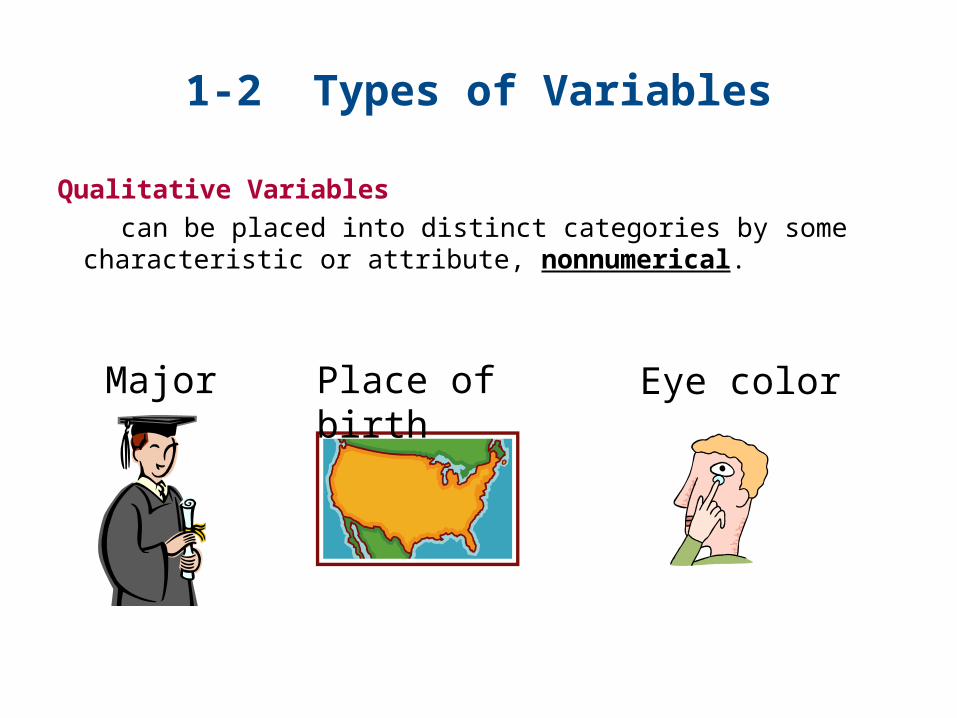
1-2 Types of Variables
Qualitative Variables
can be placed into distinct categories by some characteristic or attribute, nonnumerical.
Major Place of birth Eye color
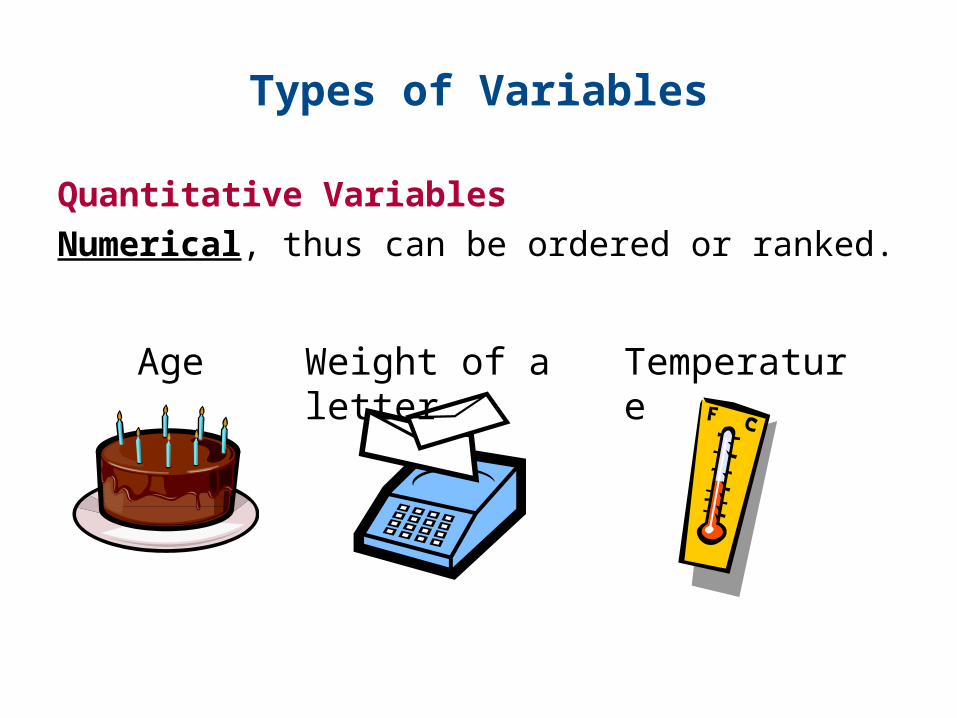
Types of Variables
Quantitative Variables
Numerical, thus can be ordered or ranked.
Age Weight of a letter Temperature
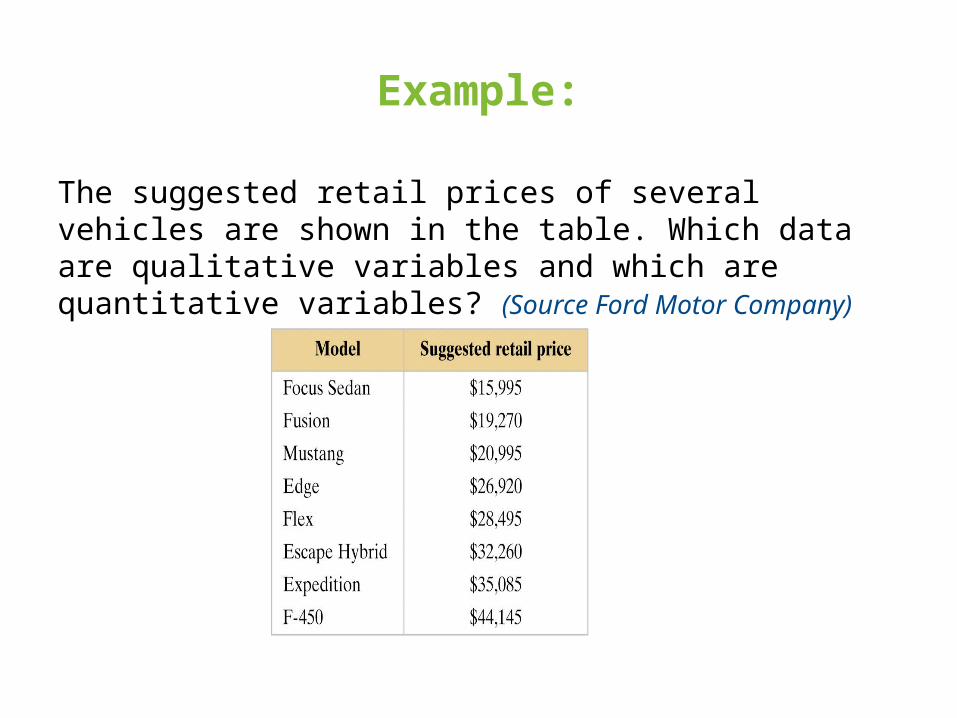
Example:
The suggested retail prices of several vehicles are shown in the table. Which data are qualitative variables and which are quantitative variables? (Source Ford Motor Company)
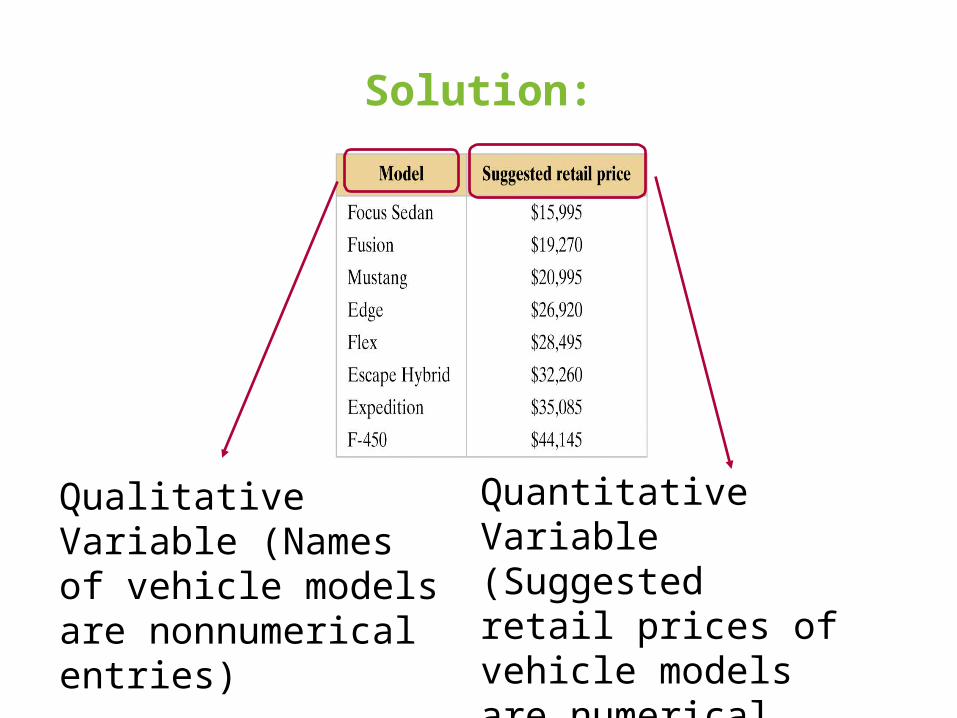
Solution:
Quantitative Variable (Suggested retail prices of vehicle models are numerical entries)
Qualitative Variable (Names of vehicle models are nonnumerical entries)
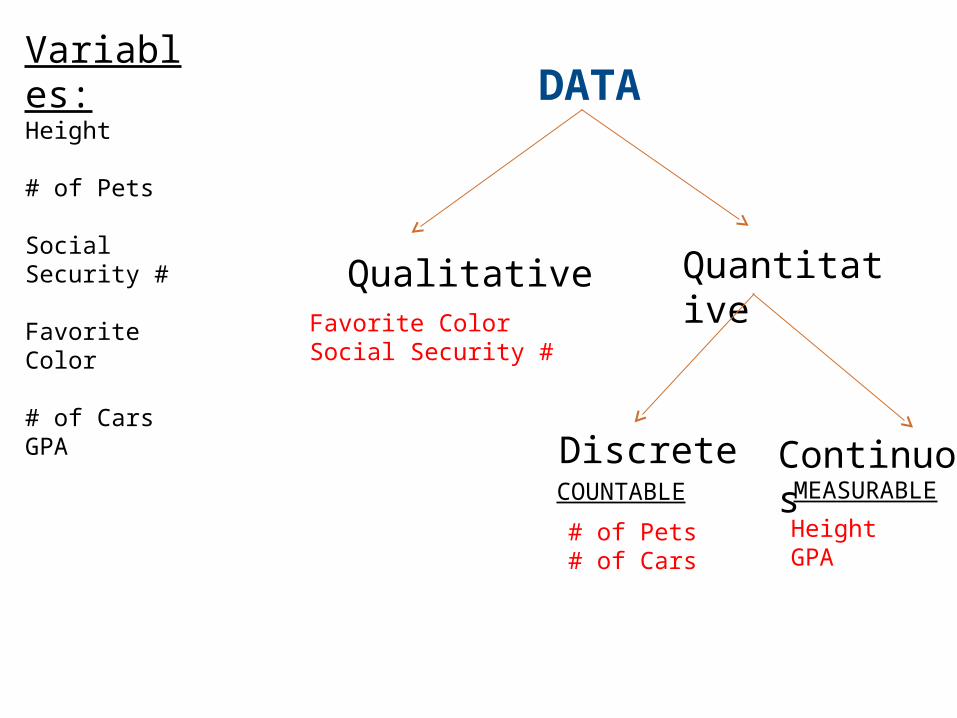
DATA
Qualitative Quantitative
ContinuousDiscrete
Variables:Height
# of Pets
Social Security #
Favorite Color
# of CarsGPA
Favorite ColorSocial Security #
COUNTABLE MEASURABLE
HeightGPA
# of Pets# of Cars
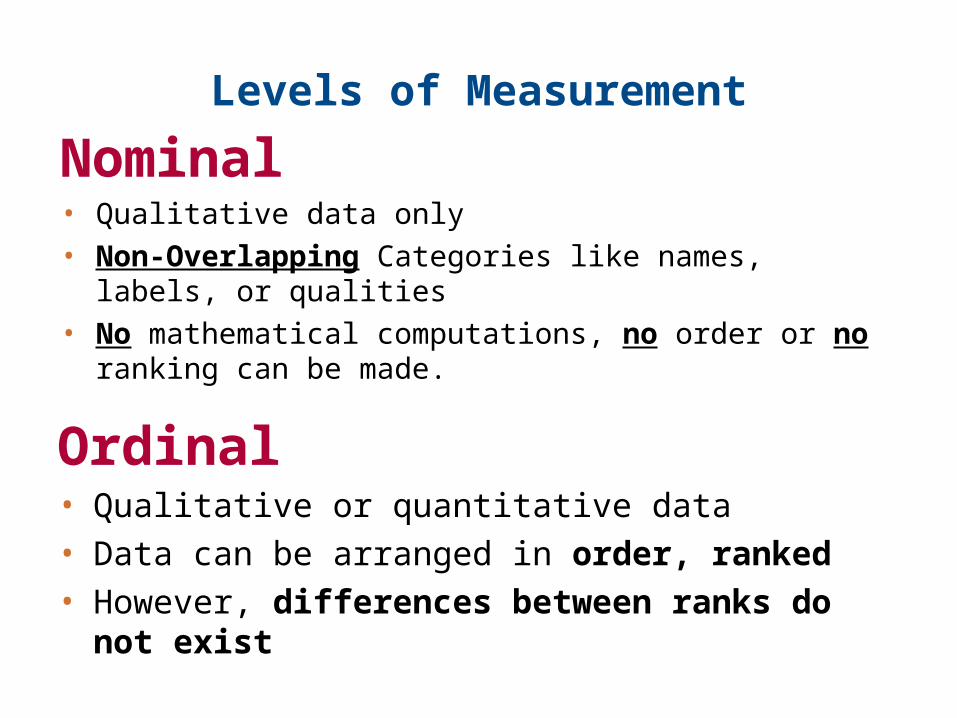
Levels of Measurement
Nominal• Qualitative data only
• Non-Overlapping Categories like names, labels, or qualities
• No mathematical computations, no order or no ranking can be made.
Ordinal• Qualitative or quantitative data
• Data can be arranged in order, ranked
• However, differences between ranks do not exist

Example: Classifying Variables by Level
Two data sets are shown. Which data set consists of data at the nominal level? Which data set consists of data at the ordinal level? (Source: Nielsen Media Research)

Solution: Classifying Variables by Level
Ordinal level (lists the ranks of five TV programs. Data can be ordered. Difference between ranks do not exist.)
Nominal level (just a list of the call letters of each network affiliate, no order or rank.

Levels of Measurement
Interval • Quantitative data
• Data can be ordered, ranked
• Differences between data entries DO EXIST
• No meaningful Zero. Zero just represents a position on a scale. Zero does not imply “none”
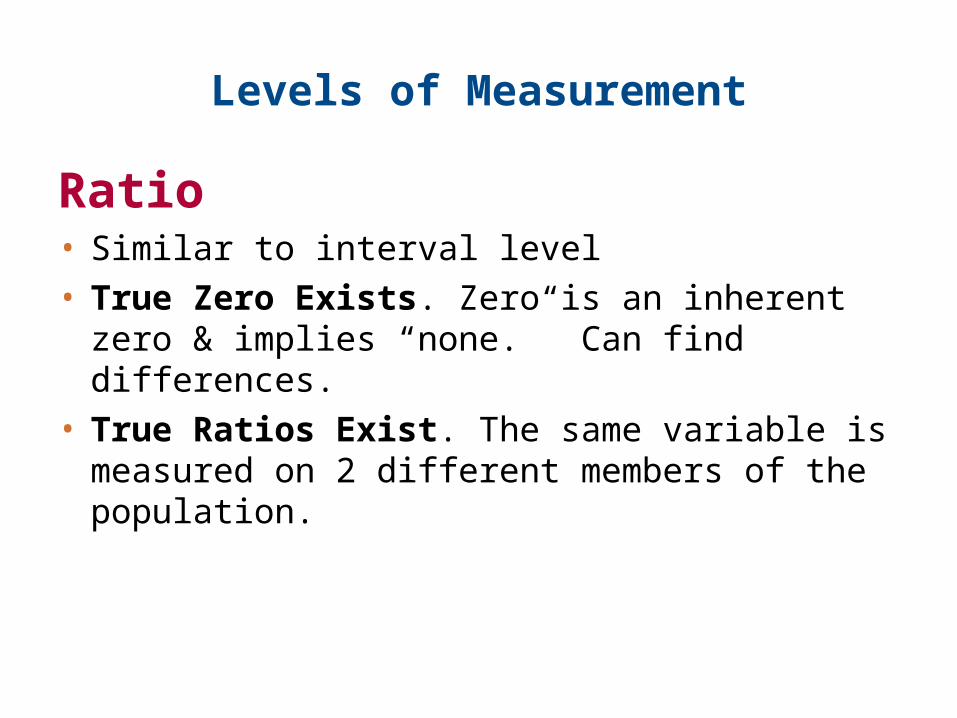
Levels of Measurement
Ratio • Similar to interval level
• True Zero Exists. Zero is an inherent zero & implies “none.” Can find differences.
• True Ratios Exist. The same variable is measured on 2 different members of the population.
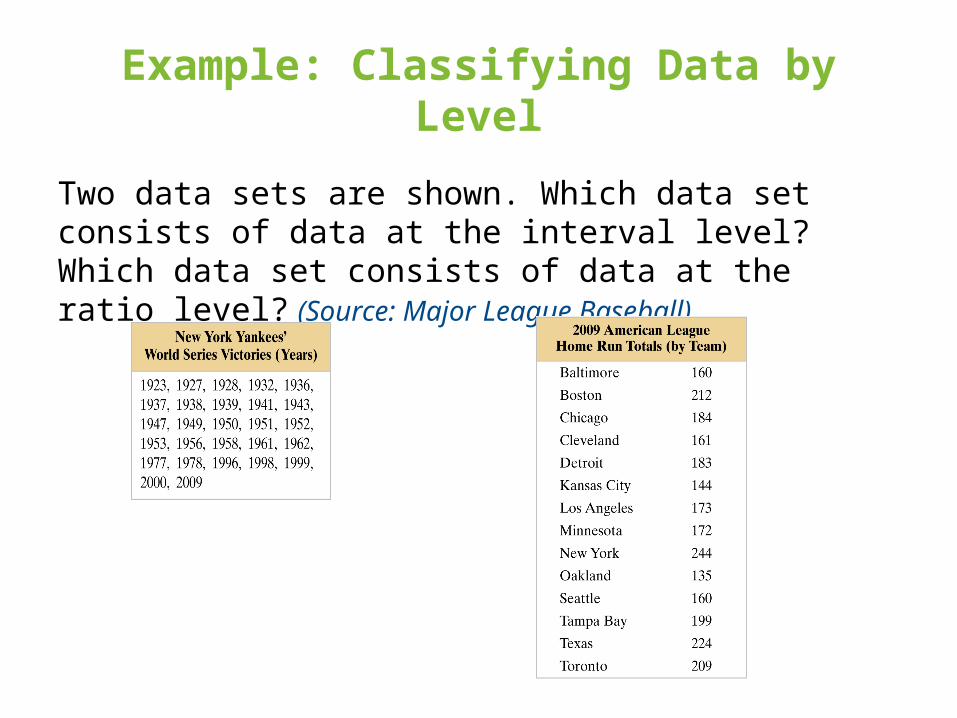
Example: Classifying Data by Level
Two data sets are shown. Which data set consists of data at the interval level? Which data set consists of data at the ratio level? (Source: Major League Baseball)
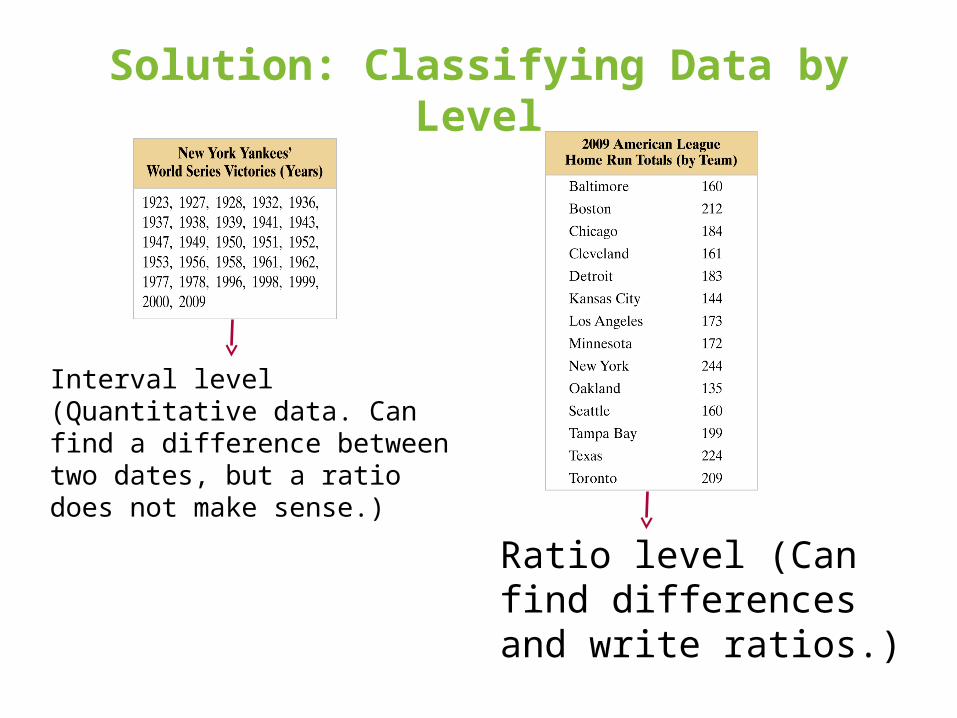
Solution: Classifying Data by Level
Interval level (Quantitative data. Can find a difference between two dates, but a ratio does not make sense.)
Ratio level (Can find differences and write ratios.)

Summary of Four Levels of Measurement
Level ofMeasurement
Put data in
categories
Arrangedata inorder
Subtractdata
values
Determine if one data value is a
multiple of another
Nominal Yes No No No
Ordinal Yes Yes No No
Interval Yes Yes Yes No
Ratio Yes Yes Yes Yes
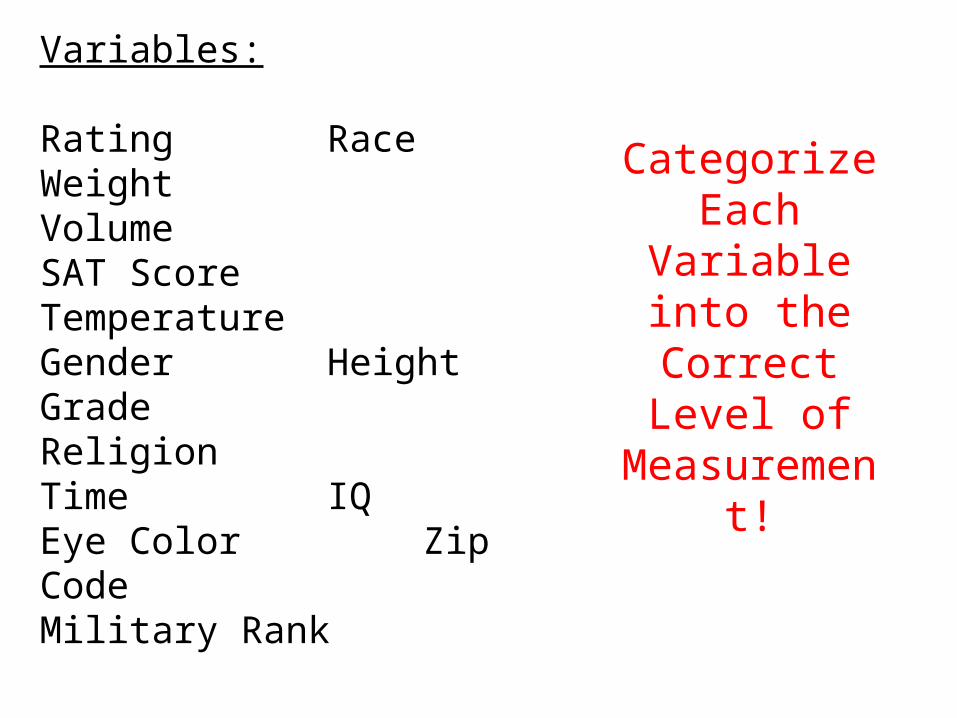
Variables:
Rating RaceWeight VolumeSAT Score TemperatureGender HeightGrade ReligionTime IQEye Color Zip CodeMilitary Rank
CategorizeEach Variable
into the Correct Level
of Measurement!
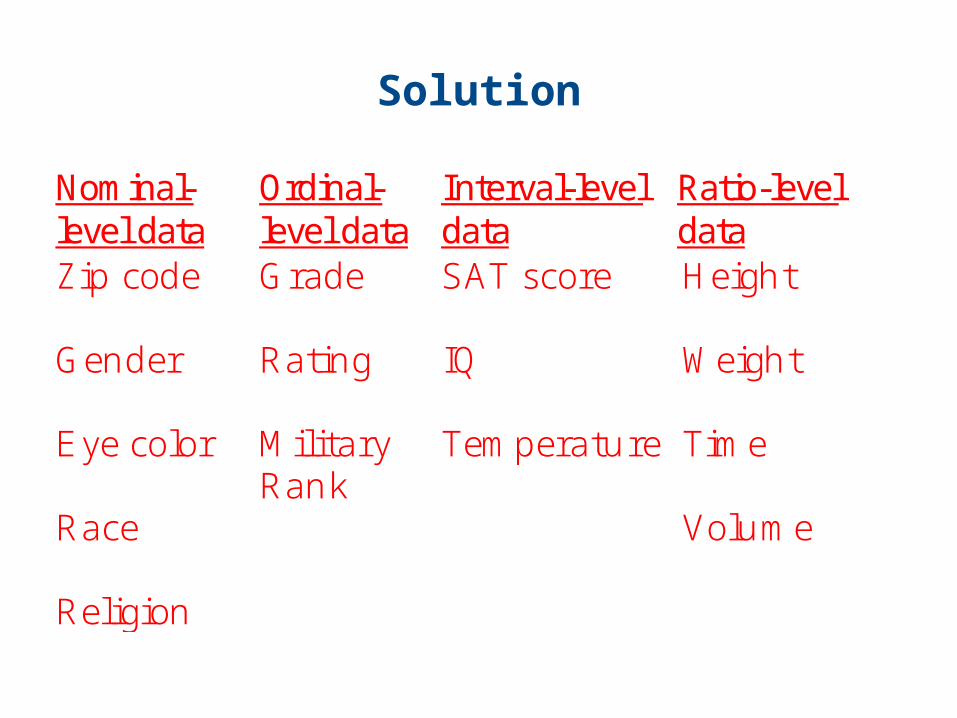
Solution
Nominal-level data
Ordinal-level data
Interval-level data
Ratio-level data
Zip code Gender Eye color Race Religion
Grade Rating Military Rank
SAT score IQ Temperature
Height Weight Time Volume
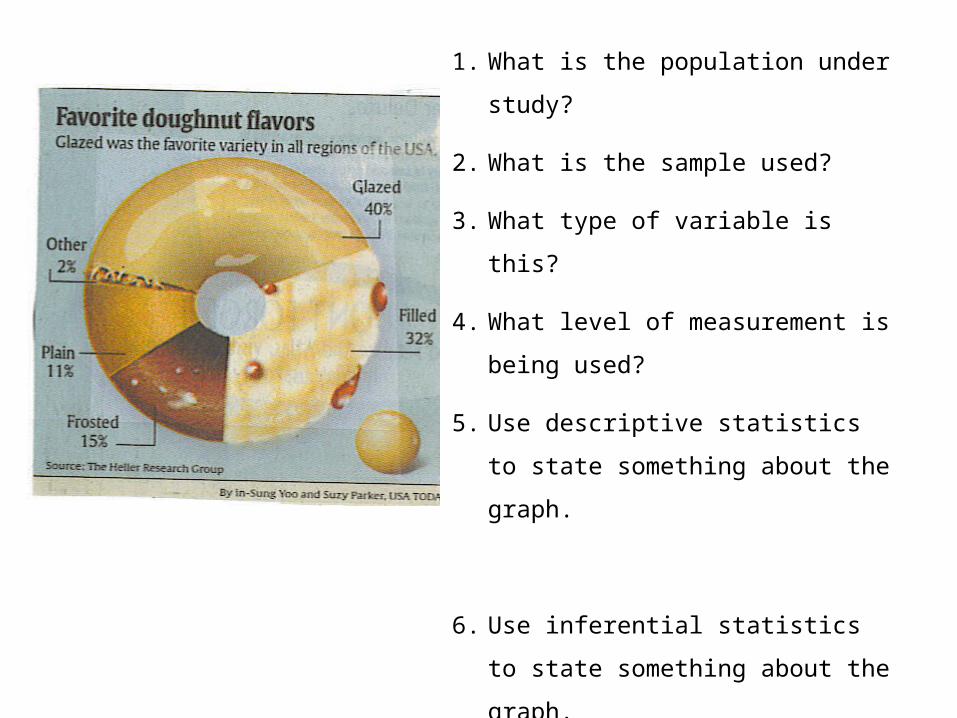
1. What is the population under study?
2. What is the sample used?
3. What type of variable is this?
4. What level of measurement is being
used?
5. Use descriptive statistics to state
something about the graph.
6. Use inferential statistics to state
something about the graph.
7. What kind of graph is it?
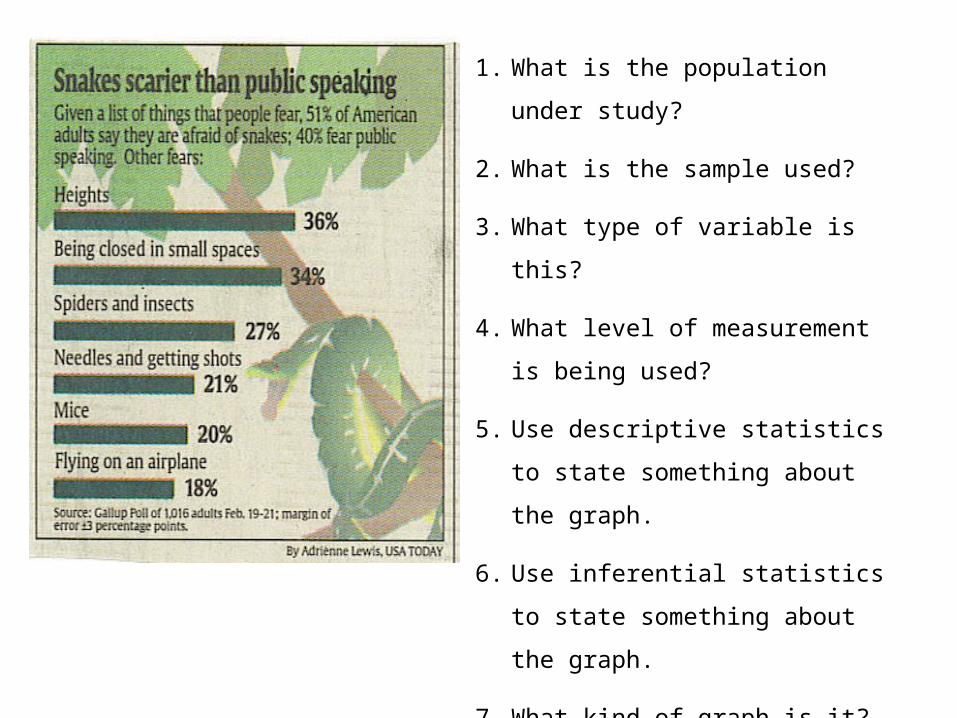
1. What is the population under
study?
2. What is the sample used?
3. What type of variable is this?
4. What level of measurement is
being used?
5. Use descriptive statistics to state
something about the graph.
6. Use inferential statistics to state
something about the graph.
7. What kind of graph is it?