Embed Size (px)
Citation preview

S T U D Y O F C O N S U M E R C A R W A S H I N G
A T T I T I U D E S A N D H A B I T S
By Market Research and Statistics Division,Smith, Bucklin & Associates, Inc.
www.CarCareCentral.com
2
0
0
2

Table of Contents
2005 International Carwash Association Study of Consumer Car Washing Attitudes and Habits All rights reserved © September 2005
Letter from the Executive Director of the International Carwash Association Methodology i – iii Executive Summary iv Key Findings 1 - 13 Home Washer Results 14 - 25 Full-Service Customer Results 26 - 38 Exterior Customer Results 38 - 49 Stationary Automatic Customer Results 50 - 61 Self-Service Customer Results 62 - 73 Appendix A: Demographics and Mini Screen Survey Appendix B: 2005 Consumer Questionnaire
International Carwash Association Serving the Professional Car Care Industry
Unauthorized use or duplication of this publication is prohibited by law

Dear Industry Professional, Today’s competitive landscape of our marketplace requires us to operate our businesses as efficient as possible. In order for your business to maximize resources and deliver a premier product that will sustain our consumer base, we must first understand the motivational drivers that keep customers returning to your business. Only by systematically recognizing the factors that make consumers of the professional car care industry consistently return, we must be able to produce a product that meets their evolving needs and wants. The International Carwash Association recognizes this opportunity for you to gain insight on your consumers and has completed its research on this fourth edition of the only research of its kind; the 2005 Study of Consumer Car Washing Attitudes and Habits. Originally conducted in 1996, this research has been delivered to the professional car care industry every three years since. This study has undergone significant evolutions as it has captured nearly a decades worth of essential data on the consumers of our industry. This study allows you to track the evolution of data over different versions of this research to see where the consumer market has been, and where the trends of your customers are going. This information can be used to illustrate the opportunities that lie ahead for you and for the industry. Trends that affect social, economic and technological advances can have lasting impacts on our business. The International Carwash Association launched a nation wide consumer public relations campaign in February of 2003 that has continued through today. Millions of readers, viewers and listeners have been exposed to the campaign entitled ‘Car Love’. This national attention is touching your consumers in markets all over the country and international markets through media outlets such as radio, television and local newspapers. The success of this campaign is not only measured in terms of the number of people that it reaches, but by how it changes the perception and usage of the professional car care industry. The metric to this change is captured in the respondents answer to the question of usage of washing their vehicle at home versus at a professional car wash. The data collected in this year’s study represents a 12% decrease in the usage of home car washing; by 15% from 1999 and 20% from 1996. This data is important both in terms of the increased demand from our industry and the economic potential that exists from consumers. We are pleased to present the results of the 2005 Study of Consumer Car Washing Attitudes and Habits, and find it encouraging that much of the data has been confirmed over 9 years of research. Changing the attitudes and habits of consumers takes time, and we are encouraged to see a continuous trend in a decline of our greatest competition – the home washer. The mission of the International Carwash Association reinforces our commitment to ‘enhance the success of members and the car care industry by collecting and disseminating information and knowledge by stimulating and facilitating the exchange of thoughts and ideas’. If you have any questions about the contents of this report, please contact the International Carwash Association via www.carcarecentral.com or by email at [email protected]. Sincerely,
Mark O. Thorsby, CAE Executive Director International Carwash Association

Methodology
International Carwash Association Serving the Professional Car Care Industry

Methodology
2005 International Carwash Association Study of Consumer Car Washing Attitudes and Habits All rights reserved © August 2005
-ii-
Background The objective of the 2005 Study of Consumer Car Washing Attitudes & Habits is three-fold: to collect and disseminate reliable information to the professional car care industry; to obtain knowledge about public perceptions regarding car washers so that an informational campaign could be established; and to collect information on the professional car care industry number one competitor, the home car washer. In order to address the changing needs of our industry, questions were added to the questionnaire which asked car wash customers to rate the importance of a car washing being environmentally safe and the influence of providing self-pay kiosk at car wash shops. These questions were used as a tool to assess the impact of the Associations’ environmental awareness campaign on car wash consumers. The information presented in this report is intended to provide members with a further understanding of the car wash user and to give insight into the preferences and perceptions of non-users. It is the goal of this report to provide a compelling strategic marketing tool that can be used to make business decisions. Sampling Two questionnaires were developed in order to collect sufficient data concerning car washing behaviors, usage and attitudes. The first survey, an eight-question mini-survey, was sent to 40,000 households in January of 2005. The sample was balanced to reflect the population of the United States in terms of household income, geographic region, population density, head of household age and household size. This mini survey was used as a tool to determine who would be eligible (i.e., households that own or lease at least one car) to receive the follow-up, more detailed survey. The International Carwash Association received 21,588 responses to the mini-survey, which represents a 54 percent response rate. In March of 2005, the International Carwash Association mailed an eight-page consumer questionnaire to a random sample of 7,223 eligible households identified from the mini-survey. This sample of households was also balanced to reflect the population of the United States in the same manner as the mini-survey population. A total of 5,283 completed surveys were returned which represents a 73 percent response rate. Statistical tests for reliability show that a sample of this size gives an estimated ±5 percent margin of error at a 95 percent confidence level. In other words, we can be 95 percent confident that a census of all owners or leasers would reveal results within ±5 percentage points of the overall results shown in this report. In addition, please note, as the sample size decreases for a given region within a customer segment, the error rate increases. Such circumstances where we have insufficient data are indicated with an asterisk (“*”). For the detailed questionnaire, respondents were asked to indicate which specific type of car wash they use most often. The respondent base, or number of responses within each customer segment for the 1999, 2002 and 2005 study years’ is as follows: Customer Segment 2005 Study Base – (n) 2002 Study Base - (n) 1999 Study Base - (n) 1996 Study Base - (n) Home washers 1,868 1,414 1,369 1,458 Full-service customers 914 596 511 530 Exterior customers 675 402 357 322 Stationary automatic customers
704
417
391
346
Self-service customers 751 458 419 508 Charity customers 57 25 30 18 No Answer 314 337 290 214 TOTAL Number of Surveys Returned
5,283
3,649
3,367
3,396

Methodology
2005 International Carwash Association Study of Consumer Car Washing Attitudes and Habits All rights reserved © August 2005
-iii-
Sampling – continued Each specific type of car wash or consumer segment, excluding charity car washing, was analyzed against the results of the questionnaire. Charity customers were not included as a customer segment due to their small respondent base. Also note, slightly over 314 respondents did not indicate what wash type they use most often in 2005. Please note that data shown for each customer segment is not weighted. How To Read This Report The 2005 Study of Consumer Car Washing Attitudes and Habits is divided into six key sections: ♦ Key Findings ♦ Home Washer Results ♦ Full-service Customer Results ♦ Exterior Customer Results ♦ Stationary Automatic Customer Results ♦ Self-service Customer Results The Key Findings section gives an overview of significant highlights in this year’s study. Following this section are the detailed results for the five different consumer segments, based on which type of wash a respondent indicated they use most often. Within these sections, results are shown overall and regionally (refer to the regional map in Appendix A). In addition, these sections include “new information” which highlight new findings from questions that were either not asked on the1999 and 2002 surveys or compares the results between study years (i.e., 2005, 2002 and 1999) when possible. The following statistics are shown in the report: ♦ Means are derived by adding all values and dividing the total number of responses; the average. Means are weighted unless
stated otherwise. ♦ The median (50th Percentile) is obtained by finding the value below which 50% of the responses lie when the values are
arranged in order of magnitude. ♦ Percentages are derived by dividing the number of responses per category by the total number of the responses to the
survey. Percentages presented in graphs are shown in whole percents and percentages shown in the tables are rounded to the first decimal. It is important to note that some questions allowed respondents to choose more than one answer and therefore these percentages will not equal 100 percent.
♦ Top-Two Box Net, or the percentage of respondents rating the aspect of a survey question a “4” or “5” (the top-two options) is
shown for questions where respondents were asked to use a rating scale of 1 to 5 with “5” being the highest score and “1” being the lowest score.
The following symbols are shown in the report: ♦ Tables show an asterisk (“*”) to denote that less than 0.5 percent is presented for a response category. ♦ Tables show a dash (“-”) to indicate that a particular response did not appear in the corresponding survey year or that the
response option is not applicable to that particular survey category. ♦ A double asterisk (“**”) indicates that no data or response was submitted for the corresponding survey option.

Methodology
2005 International Carwash Association Study of Consumer Car Washing Attitudes and Habits All rights reserved © August 2005
-iv-
How to Read This Report – continued Survey results are presented in tables, charts and/or graphs. Table results must be read vertically because column percents are shown. Figures are based on the number of responses to a particular survey question. When reviewing tables throughout the report, percentages may not sum to the “total population” due to non-response by participants in a category and/or rounding. No open-ended questions were asked this year. Appended to the report is the Demographics sections which shows the demographic make-up, washing attitudes and habits of respondents; following this section is a copy of the screener mini survey and the 2005 International Carwash Association Consumer Survey from which results are presented (Appendix A, B and C respectively). One way to review this report is to glance through the questionnaire in Appendix B to get an idea of the types of questions asked, and then consult the table of contents for the appropriate pages. The results in the report do not necessarily appear in the same order as the questionnaire. Word of Caution Users of this report should consider the following issues when reviewing, discussing or making decisions based on the findings indicated in this document. Key issues include: ♦ The margin of error is only an approximation since participation was voluntary and hence not purely random. ♦ The data shown throughout this report is not weighted. However, reflects a representative sample of the U.S population. ♦ SmithBucklin Corporation did not independently verify the data provided by each respondent, and does not express an
opinion on the results in this report.
Key Findings
International Carwash Association Serving the Professional Car Care Industry

Key Findings
Demographic Characteristics This section outlines key findings of the consumer survey. Please note that data shown for each customer segment is not weighted. The following three charts show the relationship between gender, age, income, region, and wash type used most often. ♦ In 2005, more respondents were female than male. Stationary automatic and exterior customers were least likely to be male
whereas home washers and self-service customers were more likely to be male.
Type of Car Wash Used Most Often – Male versus Female 1999, 2002, 2005 2005 2002 1999
Type of Car Wash
Male
Female
Male
Female
Male
Female
Home wash 46.3% 53.7% 42.3% 57.7% 46.2% 53.8% Full-service wash 42.2% 57.8% 45.3% 54.7% 45.9% 45.1% Exterior wash 36.7% 63.3% 35.7% 64.3% 44.3% 55.7% Stationary Automatic wash 38.4% 61.6% 34.1% 65.9% 40.3% 59.7% Self-service wash 45.3% 54.7% 43.1% 56.9% 46.1% 53.9%
♦ More than 30 percent of the self-service ‘most-often’ customers (36.2%) are under 40 years of age, while 63 percent of full-
service most often customers are 50 years and older.
Wash Type Used Most Often Head of Household Age
Overall
Home
washers
Full-service customers
Exterior
customers
Stationary automatic customers
Self-service customers
Under 30 years 7.9% 7.7% 4.5% 6.2% 9.5% 13.8% 30 to 39 years 17.8% 19.2% 12.4% 15.6% 21.9% 22.4% 40 to 49 years 22.9% 25.4% 20.2% 19.6% 22.9% 24.5% 50 to 59 years 21.7% 19.6% 25.5% 21.8% 22.0% 20.1% 60 years or older 29.7% 28.2% 37.4% 36.9% 23.7% 19.2%
♦ Full-service ‘most-often’ customers (41.8%) dominated the $75,000 and over income categories.
Wash Type Used Most Often Total Annual Household Income
Overall
Home
washers
Full-service customers
Exterior
customers
Stationary automatic customers
Self-service customers
Under $20,000 16.3% 16.3% 10.4% 12.9% 13.5% 24.8% $20,000 to $39,999 24.1% 25.3% 19.8% 21.8% 22.9% 28.8% $40,000 to $59,000 18.6% 18.2% 17.4% 18.6% 20.3% 20.2% $60,000 to $74,999 10.0% 10.4% 10.5% 9.8% 12.2% 7.5% $75,000 to $99,999 15.6% 15.8% 19.3% 18.2% 16.1% 9.6% $100,000 to $149,999
11.6%
10.5%
16.5%
14.1%
11.7%
7.3%
$150,000 and Over 3.9% 3.5% 6.0% 4.7% 3.3% 1.7% Note: The “Overall” figures presented on this page include respondents who may not have selected a most often used wash type.
2005 International Carwash Association Study of Consumer Car Washing Attitudes and Habits All rights reserved © September 2005
- 2 -

Key Findings Demographic Characteristics ♦ The largest percentage of responding customers use stationary automatic car washes (20.6%) in the West North Central
region followed by the exterior customers (19.0%) in the East North Central region. In comparison, fewer exterior customers reside in the West South Central region (3.7%).
Wash Type Used Most Often
Regions
Overall
Home
washers
Full-service customers
Exterior
customers
Stationary automatic customers
Self-service customers
New England 10.2% 11.5% 10.2% 18.7% 4.5% 4.3% Middle Atlantic 12.2% 11.7% 14.8% 17.8% 7.2% 10.7% East North Central 11.7% 9.7% 9.2% 19.0% 15.1% 11.3% West North Central 10.6% 7.3% 6.1% 9.0% 20.6% 18.0% South Atlantic 11.7% 14.2% 10.9% 6.8% 11.8% 9.7% East South Central 10.5% 13.3% 7.4% 4.9% 12.4% 9.9% West South Central 10.7% 10.2% 11.6% 3.7% 10.5% 16.9% Mountain 10.4% 8.2% 12.4% 9.0% 12.5% 14.1% Pacific 11.8% 13.8% 17.4% 11.1% 5.4% 5.2%
♦ Overall, more responding customers live in metropolitan areas larger than 2 million in population density. However, stationary
automatic and self-service customers are most likely to live in non-metropolitan areas.
Wash Type Used Most Often Population Density
Overall
Home
washers
Full-service customers
Exterior
customers
Stationary automatic customers
Self-service customers
Non-MSA* 18.3% 19.1% 8.9% 10.8% 24.0% 29.8% MSA (to ½ mil.) 19.0% 18.0% 15.9% 16.4% 22.0% 23.4% MSA (½ mil. to 2 mil.) 24.0% 25.1% 22.1% 24.3% 25.0% 21.8% MSA (over 2 mil.) 38.7% 37.7% 53.2% 48.4% 29.0% 24.9%
*MSA – Metropolitan Statistical Area ♦ The majority of home washers and car wash customers drive and wash a car most often. However, stationary automatic
customers, as well as full-service customers, are more likely to drive a SUV. Self-service customers are more likely to drive a truck than are the other type of car wash customer.
Wash Type Used Most Often
Primary Vehicle Driven and Washed Most Often
Overall
Home
washers
Full-service customers
Exterior
customers
Stationary automatic customers
Self-service customers
Car 59.1% 56.0% 63.9% 64.8% 54.9% 55.9% Van 10.5% 11.3% 8.9% 10.7% 12.7% 9.1% Truck 12.5% 16.3% 7.2% 6.2% 11.1% 17.2% SUV 17.8% 16.4% 20.0% 18.3% 21.3% 17.9%
Note: The “Overall” figures presented on this page include respondents who may not have selected a most often used wash type.
2005 International Carwash Association Study of Consumer Car Washing Attitudes and Habits All rights reserved © September 2005
- 3 -

Key Findings Demographic Characteristics - continued ♦ The majority of the respondents drive between 51 to 100 miles per week.
Wash Type Used Most Often Number of Miles Driven Per Week
Overall
Home
washers
Full-service customers
Exterior
customers
Stationary automatic customers
Self-service customers
50 miles or less 24.4% 26.1% 24.9% 24.1% 19.6% 21.3% 51 to 100 miles 32.8% 32.7% 29.5% 32.9% 33.8% 33.8% 101 to 200 miles 23.7% 24.2% 25.3% 21.4% 23.3% 25.7% 201 to 300 miles 11.2% 10.1% 12.6% 13.2% 13.2% 10.1% 301 to 500 miles 5.8% 5.2% 6.2% 6.3% 7.1% 6.6% More than 500 miles 2.0% 1.7% 1.5% 2.1% 3.0% 2.5%
♦ More respondents live in households of two. Home washers are more likely to live in households of four or more and self-
service customers are more likely to live in households of three.
Wash Type Used Most Often Household Size
Overall
Home
washers
Full-service customers
Exterior
customers
Stationary automatic customers
Self-service customers
One 26.0% 22.1% 29.3% 31.1% 24.0% 25.4% Two 38.3% 37.9% 42.5% 37.8% 40.3% 32.5% Three 15.4% 16.3% 11.6% 13.3% 15.9% 19.3% Four 12.4% 14.7% 10.0% 11.4% 11.5% 13.8% Five or more 8.0% 9.0% 6.7% 6.4% 8.2% 8.9%
♦ Overall, more respondents (59.2%) are married than widowed, divorced, separated or single.
Wash Type Used Most Often Marital Status
Overall
Home
washers
Full-service customers
Exterior
customers
Stationary automatic customers
Self-service customers
Married 59.2% 63.1% 58.1% 56.8% 61.9% 54.6% Widowed 8.2% 7.2% 10.1% 10.5% 6.8% 5.7% Divorced 15.3% 14.2% 15.6% 15.9% 13.4% 17.5% Separated 1.4% 1.2% 1.1% 1.2% 0.7% 2.2% Never Married 15.9% 14.2% 15.2% 15.6% 17.2% 20.0%
Note: The “Overall” figures presented on this page include respondents who may not have selected a most often used wash type.
2005 International Carwash Association Study of Consumer Car Washing Attitudes and Habits All rights reserved © September 2005
- 4 -

Key Findings Type of Washing ♦ The table below shows that home washing is down by 12 percent from 2002; by 15 percent from 1999; by 20 percent from
1996. Interestingly, stationary automatic washing increased to 13 percent from 2002. From 2002, in comparison, full-service washing increased by 3 percent; self-service washing increased by 10 percent; and exterior washing increased by 12 percent.
Type of Wash Used Most Often
47.6%
17.2% 15.2%15.3%
14.3%13.7%
18.6%38.0%
18.1%13.9%
12.7%12.2%
43.0%
13.6%12.7%
11.6%
16.6%
44.5%
9.5%
10.4%
0%
25%
50%
75%
100%
2005 38.0% 18.6% 13.7% 14.3% 15.3%
2002 43.0% 18.1% 12.2% 12.7% 13.9%
1999 44.5% 16.6% 11.6% 12.7% 13.6%
1996 47.6% 17.2% 10.4% 9.5% 15.2%
Home wash Full-service wash Exterior wash Stationary automatic wash Self-service wash
Note: The formula for calculating the “percent change” is to divide the current year (noted) by the previous year (noted), then to multiply this figure by 100 and then to subtract the final figure by 100. ♦ When asked to indicate which specific types of washes they have ever used, respondents reported that home wash (84.0%)
was the type of car wash most everyone has ever used.
Type of W ash Ever Used
50.0% 47.0% 43.2%53.3%
45.0%
90%
51% 48%41%
59%53.2%
84.0%
43.6%53.1%51.0% 56.3%
83.4%
60.1%54.6%
87.9%
0%
25%
50%
75%
100%
2005 84% 53% 50% 47% 43%
2002 83% 51% 53% 44% 56%
1999 88% 55% 53% 45% 60%
1996 90% 51% 48% 41% 59%
Hom e wash Full-service wash Exterior wash Stationary autom atic wash Self-service wash
2005 International Carwash Association Study of Consumer Car Washing Attitudes and Habits All rights reserved © September 2005
- 5 -

Key Findings Washing Attitudes Respondents were asked how important several factors were in the selection of a car wash. These questions are based on a 5-point scale where “5” equals “Very Important” and “1” equals “Not very/Not at all Important.” The respondents were asked to rate the delivery of each of these factors when it came to the car wash types they have ever used. The responses for this question are based on a 5-point scale where 5 equals “Excellent” and 1 equals “Poor.” ♦ Across all types of car washes ever used, home washers and customers rated their satisfaction with the quality of the wash
higher than the importance of it. Interestingly, stationary automatic customers gave higher end-product delivery ratings than importance ratings for all categories surveyed, except for quality of wash, safety of car’s exterior and importance of value.
Exterior wash customers rated their satisfaction with less work higher than the importance of it, while home washers rated the satisfaction of less work significantly lower than the importance of it. For self-service customers, there was very little difference between what they define as important and what they receive in regards to the less work of cleaning their vehicles. Stationary automatic customers are less concerned about the cost associated with cleaning their vehicle than any other type of customer. However, the difference between the importance of and their satisfaction with cost-related issues is the largest for full-service customers.
Type of Car Wash Ever Used Importance & Satisfaction
(with End-Product) Ratings Mean (Top-two box net percent)
Home wash
Full-service wash
Exterior wash
Stationary automatic wash
Self-service wash
Importance of quality of the wash 89.1% 96.7% 91.5% 90.8% 88.2% Satisfaction with quality of the wash 92.8% 93.7% 83.8% 76.4% 83.1% Importance of less work 40.2% 67.0% 66.6% 65.3% 43.2% Satisfaction with less work 28.3% 91.8% 92.0% 91.6% 42.0% Importance of faster overall 40.8% 64.0% 67.2% 62.6% 46.6% Satisfaction with faster overall 38.6% 86.9% 92.7% 90.7% 55.6% Importance of conveniently located 67.3% 82.0% 79.8% 78.8% 78.8% Satisfaction with conveniently located 93.1% 81.1% 84.6% 86.4% 81.3% Importance of ease of use 69.0% 84.1% 83.6% 83.4% 82.9% Satisfaction with ease of use 80.0% 92.8% 92.3% 93.8% 78.7% Importance of environmentally safe 51.8% 56.7% 54.5% 50.4% 51.7% Satisfaction with environmentally safe 73.4% 64.9% 62.1% 57.8% 58.1% Importance of safety of car’s exterior 85.9% 89.6% 89.1% 89.0% 84.6% Satisfaction with safety of car’s exterior 92.4% 84.0% 72.2% 74.7% 80.8% Importance of value (quality of wash for money spent)
83.5%
91.2%
87.9%
88.6%
86.9%
Satisfaction with of value (quality of wash for money spent)
93.8%
78.6%
77.2%
76.8%
77.2%
*Respondents were not asked to rate the delivery of customer service. “Top-two box net” is the percentage who rated the factors a “4” or “5.”
2005 International Carwash Association Study of Consumer Car Washing Attitudes and Habits All rights reserved © September 2005
- 6 -

Key Findings Washing attitudes – continued ♦ Respondents were asked to rank in order of importance a list of 12 additional services that could be offered at the same
location as a car wash. Overall, a gas station was ranked first as the additional services that could be added, followed by an express detailing and oil change/quick lube.
Type of Car Wash Used Most Often - 2005
Additional Services (In Rated #1 Service, Percent Rank Order Based on Overall)
Overall
Home
washers
Full-service customers
Exterior
customers
Stationary automatic customers
Self-service customers
Gas station 1.62 1.62 1.71 1.57 1.51 1.68 Express detailing 1.82 1.91 1.78 1.70 1.86 1.84 Oil change/Quick lube 1.92 1.89 1.85 1.92 2.02 1.99 ATM 1.97 1.93 1.97 2.12 2.13 1.89 Convenience store 2.01 2.07 1.95 2.04 2.02 1.95 Other 2.05 2.17 1.81 2.07 2.40 1.72 Paintless dent-repair 2.13 2.13 2.13 2.22 2.10 2.09 Dry cleaner 2.14 2.29 2.00 2.15 2.00 2.29 Brakes 2.19 2.05 2.29 2.36 2.41 2.06 Windshield repair 2.24 2.23 2.18 2.31 2.28 2.38 Water dispenser 2.25 2.38 2.07 2.16 2.39 2.10 Quick-service restaurant 2.32 2.27 2.20 2.38 2.44 2.43 Tune up 2.38 2.35 2.46 2.43 2.40 2.31 Propane gas 2.42 2.38 2.23 2.50 2.41 2.80 Gift shop 2.45 2.40 2.42 2.31 2.55 2.59 Truck rental 2.77 2.88 2.25 3.00 3.00 3.00
Rating scale: “1” = first choice, “2” = second choice and “3” = third choice of additional services. ** = No data was submitted. ♦ As seen in Appendix A, (i.e., Demographic Characteristics) spot-free rinse and wheel/hubcap cleaning were identified by
respondents as the top-two most important factors they consider when selecting the type of car wash to use. Not surprising, full-service customers ranked interior vacuuming the highest (81.1%) followed by hand towel drying (69.9%).
Type of Car Wash Used Most Often
Important Factors in Car Wash Selection (In Percent Rank Order Based on Overall)
Overall
Home
washers
Full-service customers
Exterior
customers
Stationary automatic customers
Self-service customers
Spot-free rinse 59.0% 47.6% 66.1% 61.0% 72.9% 67.5% Wheel/hubcap cleaning 48.6% 46.5% 65.4% 49.6% 39.2% 42.7% Interior vacuuming 48.1% 44.8% 81.1% 30.8% 24.9% 51.9% Under body wash 41.8% 33.9% 46.2% 52.3% 60.8% 32.8% Hand towel drying 36.5% 35.0% 69.9% 35.4% 11.5% 24.0% Wax/paint protectant coating 36.0% 27.8% 42.6% 38.5% 44.6% 39.0% Hand wax/protectant application 14.0% 14.5% 18.1% 9.3% 8.8% 14.8% Triple color protectant (foam) conditioner 11.3% 7.4% 15.5% 11.6% 16.2% 10.7% Carpet shampooing 7.6% 7.1% 13.0% 3.4% 4.1% 7.3%
** = No data was submitted.
2005 International Carwash Association Study of Consumer Car Washing Attitudes and Habits All rights reserved © September 2005
- 7 -

Key Findings Washing attitudes – continued Respondents were asked to rate the importance of services in judging the quality of a car wash. They were then asked to rate the delivery of these same services. The following six (6) charts outline the responses of importance as compared to delivery of each service for each car wash type, i.e., home wash, full-service wash, exterior wash, stationary automatic wash and self-service wash. ♦ Thoroughly cleaned wheels were most important to full-service customers, but least important to stationary automatic
customers.
Importance of thoroughly cleaned wheels compared to the delivery of it…
Home
washers
Full-service
wash
Exterior
wash
Stationary automatic
wash
Self-service
wash Importance – Mean (Top-two box net)
4.16 (77.0%)
4.30 (82.5%)
4.07 (75.3%)
3.90 (67.6%)
4.04 (72.5%)
Delivery – Mean (Top-two box net)
4.23 (79.8%)
4.20 (83.3%)
3.75 (64.9%)
3.59 (55.5%)
3.88 (69.2%)
♦ Thoroughly cleaned windows were rated most important to full-service customers. However, home washers are most
satisfied with how thoroughly they clean their windows.
Importance of thoroughly cleaned windows compared to the delivery of it…
Home wash
Full-service
wash
Exterior
wash
Stationary automatic
wash
Self-service
wash Importance – Mean (Top-two box net)
4.73 (95.6%)
4.83 (97.9%)
4.72 (96.0%)
4.67 (94.4%)
4.68 (94.6%)
Delivery – Mean (Top-two box net)
4.53 (89.2%)
4.49 (92.8%)
4.24 (81.9%)
4.19 (80.7%)
4.29 (83.4%)
♦ A thoroughly cleaned car body was important to all customers, but all rated the delivery of this service lower.
Importance of thoroughly cleaned car body compared to the delivery of it…
Home wash
Full-service
wash
Exterior
wash
Stationary automatic
wash
Self-service
wash Importance – Mean (Top-two box net)
4.74 (96.8%)
4.84 (98.7%)
4.77 (98.5%)
4.75 (97.4%)
4.72 (96.1%)
Delivery – Mean (Top-two box net)
4.52 (90.2%)
4.46 (91.6%)
4.22 (84.0%)
4.12 (80.2%)
4.28 (84.4%)
Rating scale: 5 = “Very Important” and 1 = “Not very/Not at all Important” for Importance. 5 = “Excellent” and 1 = “Poor” for Delivery.
Note: Presented in the table above the “Top-Two Box Net” is the percentage of respondents who rated the service a “4” or “5”.
2005 International Carwash Association Study of Consumer Car Washing Attitudes and Habits All rights reserved © September 2005
- 8 -

Key Findings Washing attitudes – continued ♦ A thoroughly cleaned windshield is least important to stationary automatic customers, but stationary automatic customers
rated the delivery of service the lowest.
Importance of thoroughly cleaned windshield compared to the delivery of it…
Home Wash
Full-service
wash
Exterior
wash
Stationary automatic
wash
Self-service
wash Importance – Mean (Top-two box net)
4.78 (96.1%)
4.88 (98.1%)
4.76 (96.0%)
4.70 (94.7%)
4.72 (95.2%)
Delivery – Mean (Top-two box net)
4.56 (90.0%)
4.52 (93.0%)
4.34 (85.8%)
4.23 (82.3%)
4.34 (85.7%)
♦ The lowest rating for importance AND delivery of thoroughly cleaned mats/carpets was indicated by stationary automatic
washes.
Importance of thoroughly cleaned mats/carpets compared to the delivery of it…
Home wash
Full-service
wash
Exterior
wash
Stationary automatic
wash
Self-service
wash Importance – Mean (Top-two box net)
3.73 (61.6%)
4.11 (78.7%)
3.24 (45.3%)
3.11 (38.1%)
3.46 (50.9%)
Delivery – Mean (Top-two box net)
3.88 (66.3%)
3.91 (70.5%)
2.44 (24.3%)
2.09 (16.1%)
3.12 (39.0%)
♦ Having a thoroughly cleaned front dash/console is least important to stationary automatic customers and the quality of the
delivery was rated the lowest.
Importance of thoroughly cleaned front dash/console compared to the delivery of it…
Home wash
Full-service
wash
Exterior
wash
Stationary automatic
wash
Self-service
wash Importance – Mean (Top-two box net)
3.75 (62.1%)
4.16 (80.8%)
3.28 (46.7%)
3.16 (40.7%)
3.49 (53.1%)
Delivery – Mean (Top-two box net)
3.97 (69.3%)
3.94 (71.5%)
2.51 (26.7%)
2.08 (16.7%)
3.06 (39.8%)
♦ The importance AND delivery of a thoroughly dried car after wash was rated highest for full-service washes. In comparison,
self-service washes received the lowest importance rating and stationary automatic washes received the lowest delivery ratings.
Importance of thoroughly dried car after wash compared to the delivery of it…
Home wash
Full-service
wash
Exterior
wash
Stationary automatic
wash
Self-service
wash Importance – Mean (Top-two box net)
3.83 (65.1%)
4.32 (83.6%)
3.80 (65.7%)
3.54 (55.9%)
3.46 (51.6%)
Delivery – Mean (Top-two box net)
3.90 (67.8%)
4.12 (77.7%)
3.34 (50.0%)
2.99 (35.8%)
3.00 (40.0%)
Rating scale: 5 = “Very Important” and 1 = “Not very/Not at all Important” for Importance. 5 = “Excellent” and 1 = “Poor” for Delivery.
Note: Presented in the table above the “Top-Two Box Net” is the percentage of respondents who rated the service a “4” or “5”.
2005 International Carwash Association Study of Consumer Car Washing Attitudes and Habits All rights reserved © September 2005
-8-

Key Findings Washing attitudes – continued ♦ The tables below show the type of car wash used most often and the factors influencing the use of a car wash.
Wash Type Used Most Often - 2005 Factors Influencing Use of Car Wash (In Mean Rank Order Based on Overall)
Overall
Home wash
Full-service wash
Exterior
wash
Stationary automatic
wash
Self-service wash
Special prices/discount coupons 3.55 3.35 3.88 3.92 3.58 3.32 For special occasions 3.39 3.18 3.47 3.60 3.56 3.51 Appearance of car wash 3.31 3.06 3.59 3.44 3.44 3.38 Discounted or free wash with gas purchase 3.25 3.22 3.05 3.24 3.66 3.24 Car wash offers extra services 3.07 2.81 3.78 3.05 2.99 2.92 Discounted gas with car wash purchase 2.96 2.94 2.88 2.89 3.12 2.99 On impulse 2.89 2.63 2.92 3.07 3.17 3.12 Environmentally safe to wash car 2.80 2.65 3.07 2.90 2.76 2.79 Frequent washer discount 2.73 2.47 3.18 2.94 2.75 2.65 Pay with credit/debit card 2.57 2.36 3.03 2.51 2.84 2.28 Recommendation of a friend 2.57 2.48 2.75 2.61 2.53 2.51 Prepaid for multiple car washes at discounted price 2.47 2.31 2.70 2.60 2.51 2.40 Free/discounted oil change 2.43 2.46 2.41 2.34 2.41 2.48 Advertisements 2.33 2.20 2.68 2.42 2.23 2.20 Self-pay kiosk 2.31 2.19 2.03 2.03 2.84 2.70 Recognized carwash name/use of brand name products
2.28
2.17
2.46
2.24
2.33
2.28
Rating scale: 1 to 5 where 5 = “A great deal of influence” and a 1 = “Little or no influence.” - = Not Applicable. Wash Type Used Most Often
2005 and 2002 Gap Analysis Factors Influencing Use of Car Wash
2005 Overall
2002 Overall
Gap Analysis
Recommendation of a friend 2.57 2.71 -0.14 Advertisements 2.33 2.54 -0.21 Special prices/discount coupons 3.55 3.63 -0.08 Discounted or free wash with a gas purchase 3.25 3.39 -0.14 Discounted gas with car wash purchase 2.96 3.17 -0.21 Car wash offers extra services 3.07 3.25 -0.18 For special occasions 3.39 3.54 -0.15 On impulse 2.89 3.07 -0.18 Frequent washer discount 2.73 2.87 -0.14 Environmentally safe to wash car 2.80 2.92 -0.12 Free/discounted oil change 2.43 2.60 -0.17 Appearance of car wash 3.31 3.38 -0.07 Prepaid for multiple car washes at discounted price 2.47 2.63 -0.16 Pay with credit/debit card 2.57 2.54 +0.03 Self-pay kiosk 2.31 - - Recognized carwash name/use of brand name products 2.28 2.58 -0.30 Rating scale: 1 to 5 where 5 = “A great deal of influence” and a 1 = “Little or no influence.” - = Not Applicable.
2005 International Carwash Association Study of Consumer Car Washing Attitudes and Habits All rights reserved © September 2005
-9-

Key Findings Washing attitudes – continued ♦ Respondents were asked to choose which type of washing is better in a number of areas. The graph below shows the
reasons why respondents believe professional car washing is better than home washing. The results are benchmarked across study years. As in 1996 and 1999, the majority of respondents felt that car washing was better than home washing because it requires less work; it’s faster overall, more enjoyable and more convenient.
Car W ashing is Better in the Follow ing Areas
88%79%
59%51%
83%
59% 52%54% 55%
- -
51% 51%
93%78%
88%
0%
25%
50%
75%
100%
2005 88% 79% 59% 51%
2002 93% 83% 59% 52%
1999 88% 78% 54% 55%
1996 - - 51% 51%
Less work Faster overall More enjoyable More convenient
♦ The table below shows what type of car wash a respondent, who stated that the listed features would get them to use a professional car wash more often, has used in the past four weeks. The results show that customers are mostly influenced by lower cost.
Features by car wash type…
Overall
Home wash
Full-service
wash
Exterior
wash
Stationary automatic
wash
Self-service
wash Lower cost 74.9% 70.7% 76.3% 80.1% 79.3% 78.8% Coupons 62.8% 53.4% 74.7% 73.9% 69.9% 59.5% Frequent washer club
34.1%
20.6%
47.7%
45.8%
44.9%
33.8%
VIP treatment 17.8% 13.7% 27.7% 19.6% 18.9% 12.6% If I had more time
25.0%
24.9%
21.7%
21.0%
23.6%
34.9%
If it took less time
17.5%
16.0%
17.4%
14.1%
8.9%
21.7%
Able to self-pay at an automated kiosk/station
10.9%
8.8%
5.8%
8.7%
19.2%
17.0%
2005 International Carwash Association Study of Consumer Car Washing Attitudes and Habits All rights reserved © September 2005
-10-

Key Findings Washing Habits ♦ Responding full-service, exterior and stationary automatic customers were also asked what type of wash they use: spray,
cloth or hand. The majority of all wash type customers (i.e., full-service, exterior and stationary automatic) indicated they use high-pressure spray wash.
Preferred Type of Wash
47%27%
7%19%
51%
28%
1%20%
55%
20%0%
25%
0%
25%
50%
75%
100%
Full-service 47% 27% 7% 19%
Exterior wash 51% 28% 1% 20%
Stationary automatic wash 55% 20% 0% 25%
Spray wash (touch-free) Cloth wash Hand wash No response
♦ When washing the exterior of their vehicle, about half of home washers (51.1%) usually clean the interior while less than half (42.6%) sometimes clean the interior. Interestingly, less than half of all professional wash types usually (34.1%) or sometimes (48.4%) have the interior of their vehicle cleaned when they have the exterior washed.
Cleaning the Vehicle's Interior
6%
43%51%
18%
48%34%
0%
25%
50%
75%
100%
Home W asher 6% 43% 51%
All Professional Customers 18% 48% 34%
Don't usually clean interior
Sometimes clean interior Usually clean interior
2005 International Carwash Association Study of Consumer Car Washing Attitudes and Habits All rights reserved © September 2005
-11-
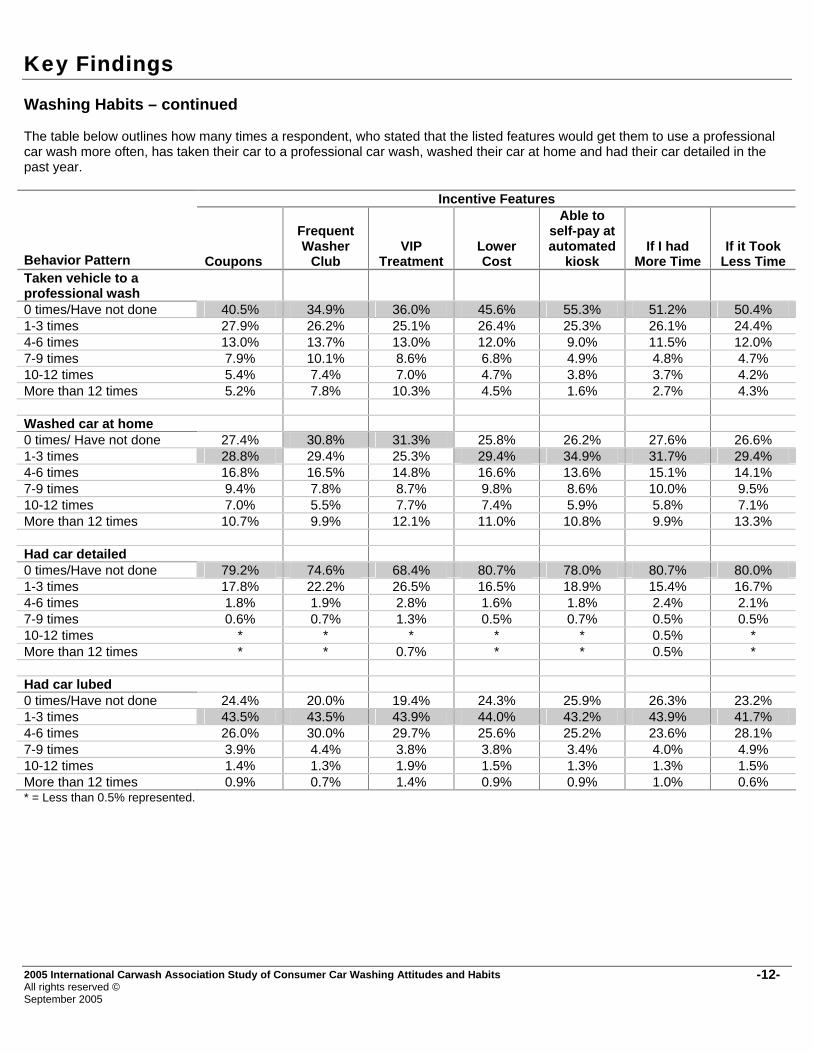
Key Findings Washing Habits – continued The table below outlines how many times a respondent, who stated that the listed features would get them to use a professional car wash more often, has taken their car to a professional car wash, washed their car at home and had their car detailed in the past year.
Incentive Features Behavior Pattern
Coupons
Frequent Washer
Club
VIP Treatment
Lower Cost
Able to self-pay at automated
kiosk
If I had More Time
If it Took Less Time
Taken vehicle to a professional wash
0 times/Have not done 40.5% 34.9% 36.0% 45.6% 55.3% 51.2% 50.4% 1-3 times 27.9% 26.2% 25.1% 26.4% 25.3% 26.1% 24.4% 4-6 times 13.0% 13.7% 13.0% 12.0% 9.0% 11.5% 12.0% 7-9 times 7.9% 10.1% 8.6% 6.8% 4.9% 4.8% 4.7% 10-12 times 5.4% 7.4% 7.0% 4.7% 3.8% 3.7% 4.2% More than 12 times 5.2% 7.8% 10.3% 4.5% 1.6% 2.7% 4.3% Washed car at home 0 times/ Have not done 27.4% 30.8% 31.3% 25.8% 26.2% 27.6% 26.6% 1-3 times 28.8% 29.4% 25.3% 29.4% 34.9% 31.7% 29.4% 4-6 times 16.8% 16.5% 14.8% 16.6% 13.6% 15.1% 14.1% 7-9 times 9.4% 7.8% 8.7% 9.8% 8.6% 10.0% 9.5% 10-12 times 7.0% 5.5% 7.7% 7.4% 5.9% 5.8% 7.1% More than 12 times 10.7% 9.9% 12.1% 11.0% 10.8% 9.9% 13.3% Had car detailed 0 times/Have not done 79.2% 74.6% 68.4% 80.7% 78.0% 80.7% 80.0% 1-3 times 17.8% 22.2% 26.5% 16.5% 18.9% 15.4% 16.7% 4-6 times 1.8% 1.9% 2.8% 1.6% 1.8% 2.4% 2.1% 7-9 times 0.6% 0.7% 1.3% 0.5% 0.7% 0.5% 0.5% 10-12 times * * * * * 0.5% * More than 12 times * * 0.7% * * 0.5% * Had car lubed 0 times/Have not done 24.4% 20.0% 19.4% 24.3% 25.9% 26.3% 23.2% 1-3 times 43.5% 43.5% 43.9% 44.0% 43.2% 43.9% 41.7% 4-6 times 26.0% 30.0% 29.7% 25.6% 25.2% 23.6% 28.1% 7-9 times 3.9% 4.4% 3.8% 3.8% 3.4% 4.0% 4.9% 10-12 times 1.4% 1.3% 1.9% 1.5% 1.3% 1.3% 1.5% More than 12 times 0.9% 0.7% 1.4% 0.9% 0.9% 1.0% 0.6% * = Less than 0.5% represented.
2005 International Carwash Association Study of Consumer Car Washing Attitudes and Habits All rights reserved © September 2005
-12-

Home Washing
International Carwash Association Serving the Professional Car Care Industry

Home Washer Results
Overview This section examines home washers’ responses to the consumer survey. Home washers are those respondents who indicated they most often wash their car(s) at home. Please note that data shown in this section is not weighted.
M ost O ften H om e W ashers
38%43% 45% 48%
0%
25%
50%
75%
100%
2005 2002 1999 1996
Demographic Characteristics ♦ The following table shows the gender for home washers by region. Across regions, home washers tend to be female, except
in the New England and North West Central regions.
Regions – 2005 Gender
Overall
New
England
Middle Atlantic
East North
Central
West North
Central
South
Atlantic
East South
Central
West South
Central
Mountain
Pacific Male 46.3% 52.6% 46.1% 46.4% 50.4% 46.6% 42.3% 41.0% 42.9% 48.4% Female 53.7% 47.4% 53.9% 53.6% 49.6% 53.4% 57.7% 59.0% 57.1% 51.6% ♦ Home washers are least likely to be under 30 years of age.
Head of Household Age - Overall
8%19%
25% 20%28%
8%16%
23% 21%33%
5%19%
25% 21%30%
0%
25%
50%
75%
100%
2005 8% 19% 25% 20% 28%
2002 8% 16% 23% 21% 33%
1999 5% 19% 25% 21% 30%
Under 30 years 30 to 39 years 40 to 49 years 50 to 59 years 60 years or older
2005 International Carwash Association Study of Consumer Car Washing Attitudes and Habits All rights reserved © September 2005
-14-

Home Washer Results Demographic Characteristics – continued ♦ Across regions, the majority of home washers have an average total household income of $20,000 to $39,999. Those with an
income of $150,000 and over are the least likely group to be home washers.
Regions – 2005 Total Annual Household Income
Overall
New
England
Middle Atlantic
East North
Central
West North
Central
South
Atlantic
East South
Central
West South
Central
Mountain
Pacific Under $20,000 16.3% 11.7% 11.4% 13.9% 18.2% 14.0% 23.4% 18.1% 18.2% 17.6% $20K to $39,999 25.3% 21.6% 18.3% 20.0% 28.5% 23.6% 33.9% 33.0% 26.6% 23.1% $40K to $59,999 18.2% 25.4% 16.0% 19.4% 10.9% 17.1% 19.4% 20.7% 19.5% 14.5% $60K to $74,999 10.4% 10.8% 12.8% 9.4% 13.9% 11.2% 7.3% 4.8% 14.9% 10.6% $75K to $99,999 15.8% 17.8% 18.7% 20.0% 13.9% 18.2% 9.7% 12.8% 11.7% 18.0% $100K to $149,999 10.5% 8.9% 16.9% 14.4% 11.7% 12.4% 4.0% 8.0% 6.5% 11.8% $150K and over 3.5% 3.8% 5.9% 2.8% 2.9% 3.5% 2.4% 2.7% 2.6% 4.3% ♦ More than half of the home washers (62.8%) live in areas of one half of a million people or more.
Regions – 2005 Population Density
Overall
New
England
Middle Atlantic
East North
Central
West North
Central
South
Atlantic
East South
Central
West South
Central
Mountain
Pacific Non-MSA* 19.1% 18.1% 13.2% 16.0% 24.1% 16.2% 37.3% 19.5% 24.0% 6.6% MSA (to ½ mil.) 18.0% 11.6% 7.8% 21.0% 19.0% 20.8% 24.1% 21.1% 22.1% 16.3% MSA (½ mil. to 2 mil.)
25.1%
40.9%
17.8%
21.5%
10.2%
23.8%
34.5%
26.3%
25.3%
19.8%
MSA (over 2 mil.) 37.7% 29.3% 61.2% 41.4% 46.7% 39.2% 4.0% 33.2% 28.6% 57.4% *MSA – Metropolitan Statistical Area ♦ The following table shows the primary vehicle driven and washed most often for home washers by region.
Regions – 2005 Primary Vehicle Driven & Washed Most Often
Overall
New
England
Middle Atlantic
East North
Central
West North
Central
South
Atlantic
East South
Central
West South
Central
Mountain
Pacific Car 56.0% 59.1% 61.2% 55.8% 51.1% 52.1% 51.8% 49.7% 53.9% 65.8% Van 11.3% 9.8% 10.5% 16.0% 16.1% 13.6% 11.3% 10.6% 9.9% 6.2% Truck 16.3% 14.4% 10.5% 16.6% 19.0% 13.2% 19.0% 23.2% 15.1% 17.1% SUV 16.4% 16.7% 17.8% 11.6% 13.9% 21.1% 17.8% 16.4% 21.1% 10.9%
2005 International Carwash Association Study of Consumer Car Washing Attitudes and Habits All rights reserved © September 2005
-15-

Home Washer Results Demographic Characteristics – continued ♦ Across regions, more home washers drive between 51 to 100 miles per week than any other mileage category.
Regions – 2005 Number of Miles Driven Per Week
Overall
New
England
Middle Atlantic
East North
Central
West North
Central
South
Atlantic
East South
Central
West South
Central
Mountain
Pacific 50 miles or less 26.1% 24.9% 29.8% 32.8% 25.0% 25.5% 19.0% 23.7% 30.9% 26.5% 51 to 100 miles 32.7% 28.6% 29.8% 26.1% 38.2% 34.6% 36.3% 32.1% 30.9% 36.6% 101 to 200 miles 24.2% 28.6% 23.4% 21.7% 21.3% 24.3% 24.2% 30.5% 21.1% 21.4% 201 to 300 miles 10.1% 11.3% 11.5% 10.6% 11.8% 8.4% 12.1% 6.8% 7.2% 10.5% 301 to 500 miles 5.2% 5.6% 4.1% 7.2% 3.7% 4.2% 6.5% 5.3% 6.6% 3.9% More than 500 miles
1.7%
0.9%
1.4%
1.7%
**
3.0%
2.0%
1.6%
3.3%
1.2%
** = No data submitted. ♦ Overall, approximately 38 percent of home washers live in households of two.
Regions – 2005
Household Size
Overall
New
England
Middle Atlantic
East North
Central
West North
Central
South
Atlantic
East South
Central
West South
Central
Mountain
Pacific One 22.1% 20.9% 14.2% 18.2% 23.4% 24.2% 20.1% 28.4% 17.5% 29.5% Two 37.9% 39.5% 38.4% 29.3% 37.2% 38.9% 36.9% 36.8% 38.3% 43.0% Three 16.3% 14.9% 20.5% 22.7% 16.1% 17.7% 15.3% 14.7% 15.6% 10.5% Four 14.7% 15.8% 19.2% 21.0% 13.9% 10.6% 16.5% 9.5% 16.9% 11.2% Five or more 9.0% 8.8% 7.8% 8.8% 9.5% 8.7% 11.2% 10.5% 11.7% 5.8% ♦ Home washers are most likely to be married.
Regions – 2005
Marital Status
Overall
New
England
Middle Atlantic
East North
Central
West North
Central
South
Atlantic
East South
Central
West South
Central
Mountain
Pacific Married 63.1% 62.4% 66.4% 71.8% 67.4% 61.4% 65.2% 58.6% 66.2% 53.9% Widowed 7.2% 7.0% 7.8% 5.1% 5.2% 9.1% 2.8% 10.2% 4.5% 11.0% Divorced 14.2% 13.6% 7.8% 9.6% 13.3% 15.5% 18.6% 15.1% 17.5% 15.7% Separated 1.2% 0.9% 1.4% 1.7% 0.7% 1.1% 1.2% 1.1% 0.6% 1.6% Never Married 14.2% 16.0% 16.6% 11.9% 13.3% 12.9% 12.1% 15.1% 11.0% 17.7%
2005 International Carwash Association Study of Consumer Car Washing Attitudes and Habits All rights reserved © September 2005
-16-

Home Washer Results Type of Car Wash ♦ The largest percentages of the respondents who most often wash their car at home have used a self-service wash in the past.
When comparing 2005 data to 2002 data, a smaller percentage of most often home washers reported that they have ever used an exterior wash.
T yp es o f C ar W ash es E ver U sed100%
41% 41% 36 %54%
100%
3 9% 46%35%
53%
10 0%
55% 55% 47%63 %
0%
25%
50%
75%
100%
2005 100% 41% 41% 36% 54%
2002 100% 39% 46% 35% 53%
1999 100% 55% 55% 47% 63%
H om e w ash F u ll-se rv ice w ash E xte rio r w ash S ta tionary au tom atic w ash S e lf-se rv ice w ash
Regions – 2005 Car Washes Ever Used
Overall
New
England
Middle Atlantic
East North
Central
West North
Central
South
Atlantic
East South
Central
West South
Central
Mountain
Pacific Home wash 100.0% 100% 100% 100% 100% 100% 100% 100% 100% 100% Full-service wash 40.7% 44.2% 42.5% 34.3% 34.3% 43.4% 36.5% 40.5% 44.2% 43.4% Exterior wash 41.4% 44.2% 42.5% 53.6% 40.9% 41.9% 35.7% 36.8% 46.1% 35.3% Stationary automatic wash
36.2%
25.1%
20.5%
52.5%
45.3%
37.4%
45.4%
44.2%
41.6%
23.3%
Self-service wash 53.7% 42.8% 47.5% 62.4% 59.9% 50.2% 64.3% 63.7% 61.0% 40.7% ♦ Most home washers indicated that they had most recently washed their car at home. Overall, the second most recently used
type of car wash was self-service car shops. Besides a home wash, this was also the type of car wash home washers were most likely to have ever used.
Regions – 2005
Car Wash Used Most Recently
Overall
New
England
Middle Atlantic
East North
Central
West North
Central
South
Atlantic
East South
Central
West South
Central
Mountain
Pacific Home wash 70.1% 57.6% 64.0% 47.0% 62.8% 79.5% 70.7% 76.9% 70.4% 90.2% Full-service 6.7% 14.1% 10.5% 8.9% 5.0% 5.6% 3.1% 3.8% 5.2% 4.3% Exterior wash 7.5% 16.2% 12.0% 16.1% 5.8% 2.4% 4.4% 2.7% 8.1% 3.0% Stationary automatic wash
5.8%
2.5%
4.0%
15.5%
13.2%
4.4%
7.1%
4.9%
4.4%
0.9%
Self-service wash 9.9% 9.6% 9.5% 12.5% 13.2% 8.0% 14.7% 11.5% 11.9% 1.7%
2005 International Carwash Association Study of Consumer Car Washing Attitudes and Habits All rights reserved © September 2005
-17-

Home Washer Results Washing Attitudes Shown below are home washer ratings of different types of car washes. The table compares how home washers in 2005 rate the importance of several factors when selecting a particular type of car wash and their perception of the delivery of these factors as compared to home washers in 2002 and 1999. ♦ Similar to 1999 and 2002, the most important factor to home washers in their selection of a car wash is still quality of wash,
which earned a mean score of 4.52 (89.1% top-two box net). In 2002, respondents rated quality of wash 4.52 (87.4% top-two box net) and 4.61 (90.5% top-two box net) in 1999. Across study years, second to quality of wash in importance was safety of car’s exterior which yielded a mean score of 4.43 (85.9%), 4.72 (85. 2%) and 4.53 (87.7%) respectively.
Most Often Home Washers’ Delivery Ratings of…
Selection Factors (Top-Two Box Net)
Importance of Car Wash Selection
Factors to Most Often Home Washers
Home wash
Full-service
wash
Exterior
wash
Stationary automatic
wash
Self-service
wash Quality of wash
2005 89.1% 92.8% 77.9% 62.4% 50.8% 67.3% 2002 87.4% 92.5% 73.9% 76.8% 78.1% 86.7% 1999 90.5% 94.0% 65.3% 48.8% 37.2% 61.3%
Less work 2005 40.2% 28.3% 88.6% 85.6% 77.9% 36.9% 2002 36.6% 27.5% 9.8% 8.4% 8.0% 16.1% 1999 - - - - - -
Faster overall 2005 40.8% 38.6% 75.7% 81.8% 74.6% 44.1% 2002 39.0% 38.3% 12.2% 12.6% 8.1% 21.3% 1999 66.7% 70.9% 60.9% 70.4% 63.7% 57.0%
*Conveniently located 2005 67.3% 93.1% 53.0% 58.5% 58.3% 59.4% 2002 65.9% 93.8% 86.2% 82.5% 81.9% 87.4% 1999 79.7% 85.0% 64.7% 71.3% 66.2% 63.1%
Ease of use 2005 69.0% 80.0% 80.9% 80.6% 79.2% 62.9% 2002 68.0% 78.3% 43.0% 40.2% 38.8% 59.1% 1999 - - - - - -
Environmentally safe 2005 51.8% 73.4% 51.0% 46.8% 46.0% 45.9% 2002 - - - - - - 1999 - - - - - -
Safety of car’s exterior 2005 85.9% 92.4% 53.9% 47.2% 46.3% 68.3% 2002 85.2% 94.1% 87.2% 85.7% 87.8% 88.5% 1999 87.7% 95.1% 42.4% 32.5% 35.0% 63.1%
Value 2005 83.5% 93.8% 39.6% 41.8% 42.3% 54.7% 2002 81.7% 94.3% 80.4% 81.3% 79.7% 86.2% 1999 84.4% 94.2% 31.0% 29.3% 32.6% 41.6%
Importance rating scale: 1 to 5 where 5 = “Very Important” to “1” = “Not very/Not at all Important.” Delivery rating scale: 1 to 5 where “5” represents “Excellent” and “1” represents “Poor.” - = Not Applicable. *In the 1999 survey, the selection factor “conveniently located” was defined only as “convenience.” Note: “Top-Two Box Net” is the percentage of respondents who rated the factor a “4” or “5.”
2005 International Carwash Association Study of Consumer Car Washing Attitudes and Habits All rights reserved © September 2005
-18-

Home Washer Results Washing Attitudes – continued ♦ Value and conveniently located received the best overall mean satisfaction ratings in 2002 and 2005. In 1999, however,
exterior safety received the best overall mean satisfaction ratings among home washers. While conveniently located received the second best overall mean rating in 2005, safety received the second best overall mean rating in 2002 and value ranked second in 1999.
2005
2002
1999 Satisfaction (with End-Product) Ratings (In Mean Rank Order Based on 2005) Mean % Mean % Mean % Value
4.71
93.8%
4.73
94.3%
4.74
94.2%
*Conveniently located
4.70
93.1%
4.73
93.8%
4.46
85.0%
Safety of car’s exterior
4.66
92.4%
4.72
94.1%
4.77
95.1%
Quality of wash
4.63
92.8%
4.63
92.5%
4.70
94.0%
Ease of use
4.31
80.0%
4.24
78.3%
-
-
Environmentally safe
4.14
73.4%
-
-
-
-
Faster overall
3.19
38.6%
3.20
38.3%
4.11
70.9%
Less work
2.83
28.3%
2.76
27.5%
-
-
- = Not Applicable. *In the 1999 survey, the aspect “conveniently located” was defined only as “convenience.” Note: Percentage scores represent the “Top-Two box Net,” that is the percentage of respondents rating the factor a “4” or “5.”
♦ Unlike 2002, spot-free rinse was chosen in 2005 by home washers as an extra service that would be a factor in their car
selection (47.6%). Wheel/hubcap cleaning was chosen by the greatest number of home washers in 2002 (53.0%) and interior vacuuming was selected in 1999 (58.5%) when choosing a type of car wash.
Importance of Extra Services (In Percent Rank Order Based on 2005)
2005
2002
1999
Spot-free rinse 47.6% 49.3% 54.2% Wheel/hubcap cleaning 46.5% 53.0% 47.0% Interior vacuuming 44.8% 51.4% 58.5% Hand towel drying 35.0% 37.8% 44.9% Under body wash 33.9% 38.2% 41.1% Wax/paint protectant coating 27.8% 34.2% 38.3% None of these are important 22.9% 8.7% 14.4% Never go to car wash 15.9% 5.3% - Hand wax/protectant application 14.5% 15.4% 15.1% Triple color protectant (foam) conditioner
7.4%
6.3%
-
Carpet shampooing 7.1% 6.5% 10.6% - = Not Applicable.
2005 International Carwash Association Study of Consumer Car Washing Attitudes and Habits All rights reserved © September 2005
-19-

Home Washer Results Washing Attitudes – continued A list of additional services was provided in the survey. Respondents were asked to rank each profit center in order of importance. ♦ Overall, home washers gave gas station the best mean score (1.62). The importance of having an oil change/quick lube
received the second best mean score (1.89) and having express detailing received the third best mean score (1.91). For home washers in the Mountain region, however, having a tune up (1.92) is one of the most important profit centers to include.
Regions – 2005 Additional
Services (In Mean Rank Order Based on Overall)
Overall
New
England
Middle Atlantic
East North
Central
West North
Central
South
Atlantic
East South
Central
West South
Central
Mountain
Pacific Gas station 1.62 1.63 1.69 1.54 1.42 1.65 1.60 1.71 1.73 1.63 Oil change/Quick lube
1.89
2.05
1.86
1.98
1.94
1.74
1.94
1.80
1.96
1.79
Express detailing 1.91 1.76 2.11 1.91 1.86 1.81 2.08 1.72 1.80 1.97 ATM 1.93 2.04 1.72 1.91 1.79 2.18 1.66 2.14 2.12 1.89 Brakes 2.05 2.00 2.22 2.17 2.67 1.89 1.67 1.92 2.50 2.71 Convenience Store
2.07
1.97
2.08
2.12
2.11
2.06
2.19
2.00
2.07
1.94
Paintless Dent-Repair
2.13
2.45
2.18
1.79
2.43
2.22
2.50
2.00
1.75
2.07
Other 2.17 2.29 2.13 2.00 1.67 2.13 2.44 2.00 2.50 2.00 Windshield repair 2.23 2.38 2.22 2.33 2.38 2.33 2.14 2.19 1.87 2.50 Quick-Service restaurant
2.27
2.30
2.35
2.47
2.35
2.14
2.08
2.24
2.25
2.34
Dry cleaner 2.29 2.00 2.00 2.18 ** 2.22 2.14 2.50 3.00 3.00 Tune up 2.35 2.07 2.33 2.71 2.50 2.50 2.45 2.31 1.92 2.44 Propane gas 2.38 2.29 2.00 2.43 2.67 2.50 3.00 2.60 2.25 2.13 Water dispenser 2.38 2.20 2.44 2.43 2.25 2.31 2.54 2.56 2.10 2.44 Gift Shop 2.40 3.00 2.56 2.50 2.80 2.29 2.50 2.27 2.33 2.19 Truck rental 2.88 2.67 ** ** 3.00 3.00 3.00 3.00 ** ** Rating scale: “1” = First choice, “2” = Second choice, “3” = Third choice. ** = No data submitted. Note: The means presented in this table are not weighted.
2005 International Carwash Association Study of Consumer Car Washing Attitudes and Habits All rights reserved © September 2005
-20-

Home Washer Results Washing Attitudes – continued ♦ Similar to 2002 findings, home washers rated having a thoroughly clean windshield as the most important factor in judging the
quality of a car wash with a mean score of 4.78 in 2005. Windshield also received the highest mean score, 4.56, for the cleanest part of the car. Interestingly, a thoroughly cleaned windshield was rated as the most important factor in 1999 while home washers were most satisfied with the delivery of a thoroughly cleaned car body.
2005 2002 1999 Importance Rating of
Thoroughly Cleaned or Dried Part (In Mean Rank Order Based on 2005)
Overall
Mean Score
Top-Two Box Net
Overall
Mean Score
Top-Two Box Net
Overall
Mean Score
Top-Two Box Net
Windshield 4.78 96.1% 4.76 92.1% 4.81 96.8% Car body 4.74 96.8% 4.75 93.0% 4.77 96.6% Windows 4.73 95.6% 4.71 91.5% 4.77 96.3% Wheels 4.16 77.0% 4.13 73.5% 4.13 75.4% Car thoroughly dried after wash 3.83 65.1% 3.82 61.8% - - Front dash/console 3.75 62.1% 3.72 58.4% 3.82 65.3% Mats/carpet 3.73 61.6% 3.71 57.9% 3.80 64.6% *the entire car - - - - 4.04 72.2% Rating scale: 1 to 5, where 5 = “Very important” and 1 = “Not very/Not at all important.”
2005 2002 1999 Delivery Rating of Thoroughly Cleaned or Dried Part (In Mean Rank Order Based on 2005)
Overall
Mean Score
Top-Two Box Net
Overall
Mean Score
Top-Two Box Net
Overall
Mean Score
Top-Two Box Net
Windshield 4.56 90.0% 4.57 85.0% - - Windows 4.53 89.2% 4.52 83.8% 4.42 85.7% Car body 4.52 90.2% 4.53 82.9% 4.46 88.1% Wheels 4.23 79.8% 4.24 75.8% 4.12 75.3% Front dash/console 3.97 69.3% 3.92 62.6% 3.85 65.1% Car thoroughly dried after wash 3.90 67.8% 3.95 61.2% - - Mats/carpet 3.88 66.3% 3.89 60.4% 3.75 61.5% *the entire car - - - - 3.86 65.8%
Rating scale: 1 to 5, where 5 = “Excellent” and 1 = “Poor.” - = Not applicable. Note: “Top-Two Box Net” is the percentage of respondents who rated the factor a “4” or “5.”
2005 International Carwash Association Study of Consumer Car Washing Attitudes and Habits All rights reserved © September 2005
-21-

Home Washer Results Washing Attitudes – continued ♦ In 2002 and 2005, home washers indicated that if they were to receive special prices/discount coupons for getting their car
professionally cleaned, they would be more likely to go. In comparison, home washers in 1999 reported that the biggest influence over whether they might go to a professional car wash was for a special occasion such as a wedding, a holiday, etc. Interestingly, all the factors listed had more influence over home washers’ decisions to wash their car at a professional wash in 2005 than in 2002.
2005 2002 1999
Factors Influencing Use of Car Wash (In Mean Rank Order Based on 2005)
Mean
Top-Two Box Net
Mean
Top-Two Box Net
Mean
Top-Two Box Net
Special prices/discount coupons 3.35 54.1% 3.25 51.0% 3.47 57.9% A discounted or free wash is given with a gas purchase
3.22
50.6%
3.18
50.0%
3.52
58.2%
For a special occasion such as a wedding, a holiday, etc….
3.18
48.6%
3.13
48.1%
3.67
62.6%
Appearance of car wash 3.06 43.4% 2.89 38.5% - - Discounted gas is given with a car wash purchase
2.94
40.9%
2.78
36.9%
-
-
The car wash offers extra services… 2.81 35.7% 2.67 30.9% 2.84 33.5% Environmentally safe to wash my car 2.65 27.0% 2.43 22.2% - - On impulse 2.63 26.5% 2.49 23.9% 2.85 29.9% Recommendation of a friend 2.48 26.5% 2.42 25.7% 2.70 32.4% Frequent washer discount 2.47 24.0% 2.24 17.7% 2.60 25.1% Free/discounted oil change 2.46 26.2% 2.23 20.5% 2.65 29.5% Allows me to pay with credit/debit card 2.36 25.1% 2.07 18.5% - - Prepaid for multiple car washes at a discounted price
2.31
20.2%
2.13
15.8%
-
-
Advertisements 2.20 13.9% 2.13 15.0% 2.40 16.9% Self-pay kiosk 2.19 17.0% - - - - Recognized carwash name/use of brand name products
2.17
15.7%
2.15
16.4%
2.53
22.6%
Rating scale of 1 to 5 where 5 = “A great deal of influence” and a 1 = “Little or no influence.” - = Not Applicable. Note: Percentage scores represent the “Top-Two box Net,” that is the percentage of respondents rating the factor a “4” or “5.”
♦ As in 2002, the majority of home washers in 2005 felt that home washing was better in all areas listed, except for faster overall
and less work. These two items were not asked in the 1999 survey. Similar to 2002, the largest number of home washers felt home washing was a lower cost (95.2%), safer for the car (94.8%) and a better overall value (93.0%). Across study years, more than a quarter of home washers felt car washing was more enjoyable (35.8%, 32.7% and 27.6% respectively).
2005 2002 1999 Which is better in the following
areas? Home Wash Car Wash Home Wash Car Wash Home Wash Car Wash Safer for the environment 74.1% 20.1% 77.8% 22.2% 71.2% 16.3% Safer for the car 94.8% 1.9% 96.3% 3.7% 90.4% 1.4% A better overall quality of wash 83.4% 13.3% 82.2% 17.8% 83.9% 9.6% A better overall value 93.0% 3.2% 96.0% 4.0% 89.6% 1.9% More convenient 75.0% 23.1% 76.1% 23.9% 72.8% 21.4% A lower cost 95.2% 2.1% 97.4% 2.6% 92.7% 1.0% More enjoyable 59.6% 35.8% 67.3% 32.7% 62.8% 27.6% Faster overall 32.9% 63.0% 33.3% 66.7% - - Less work 14.5% 80.4% 12.9% 87.1% - -
- = Not Applicable.
2005 International Carwash Association Study of Consumer Car Washing Attitudes and Habits All rights reserved © September 2005
-22-

Home Washer Results Washing Attitudes – continued ♦ As we saw on the previous page, more home washers felt that a car wash provided a faster overall process than home
washing and 80 percent felt car washing was less work than home washing. But, it can be determined by the bar graph below that mainly cost, safety and overall value influence home washers.
F acto rs th a t In flu en ce H o m e W ash ers
95% 95% 93%9 7% 96% 96%9 3% 90% 90%
0%
2 5%
5 0%
7 5%
10 0%
2005 95% 95% 93%
2002 97% 96% 96%
1999 93% 90% 90%
Low er cos t S a fe r fo r the ca r A be tte r ove ra ll va lue
♦ Similar to the results in 1999 and 2002, more than half of the home washers responded that they would use a car wash more often if it cost less and coupons were offered.
- = Not Applicable.
H o m e W ash ers W o u ld U se C ar W ash M o re O ften , If…
71%53%
21% 14% 9%25% 16%
64%54%
20% 13%-
76%59%
24%14%
- -0%
25%
50%
75%
100%
2005 71% 53% 21% 14% 9% 25% 16%
2002 64% 54% 20% 13% - 14% 14%
1999 76% 59% 24% 14% - - -
Low er cos t C oupons F requen t w asher c lub V IP trea tm en t S e lf-pay k iosk If I had m ore
tim eIf it took less
tim e
-
2005 International Carwash Association Study of Consumer Car Washing Attitudes and Habits All rights reserved © September 2005
-23-

Home Washer Results Washing Habits ♦ The home washers using stationary automatic washes used spray wash 4 percent less in 2005 than in 2002, while using
spray wash 4 percent more in 2002 than in 1999. In comparison, home washers using stationary automatic car washes used cloth wash 3 percent less in 2005 than in 2002 and used cloths about 3 percent less in 2002 compared to 1999.
2005 2002 1999
Type of wash
Full-service wash
Exterior
wash
Stationary-Automatic
wash
Full-service wash
Exterior
wash
Stationary-Automatic
wash
Full-service wash
Exterior
wash
Stationary-Automatic
wash Spray wash (touch-free)
47.9%
50.3%
49.4%
52.6%
65.8%
53.8%
49.2%
62.8%
50.2%
Cloth wash 24.3% 25.9% 22.0% 24.9% 26.3% 24.7% 26.1% 24.0% 27.7% Hand wash 5.9% 1.4% - 4.2% 0.9% - 3.1% 0.8% - No response 21.8% 22.4% 28.6% 18.3% 7.0% 21.5% 21.5% 12.4% 22.1% - = Not Applicable.
♦ In 2005, slightly more than half of the home washers reported that they usually clean the interior of their car when the exterior
is washed. As in 1999 and 2002, the majority (93.7%) of respondents stated that they usually or sometimes clean the interior of their car when they wash the exterior.
2005 2002 1999 How Often
Interior is Cleaned
Usually
Sometimes
Not Usually
Usually
Sometimes
Not Usually
Usually
Sometimes
Not Usually
Overall 51.1% 42.6% 6.3% 51.8% 41.9% 6.2% 53.5% 42.0% 4.5% New England 49.8% 46.9% 3.3% 52.2% 41.9% 5.9% 53.3% 42.7% 4.0% Middle Atlantic
52.1%
39.6%
8.3%
52.1%
44.8%
3.0%
52.5%
42.6%
4.9%
East North Central
43.8%
48.3%
7.9%
51.5%
41.9%
6.6%
48.4%
44.5%
7.0%
West North Central
44.9%
44.1%
11.0%
38.5%
52.3%
9.2%
43.9%
51.0%
5.1%
South Atlantic
53.6%
41.5%
4.9%
57.5%
38.3%
4.2%
52.8%
42.6%
4.6%
East South Central
51.0%
44.9%
4.0%
54.5%
40.4%
5.1%
57.1%
41.2%
1.6%
West South Central
59.5%
36.3%
4.2%
53.8%
38.5%
7.7%
58.6%
34.6%
6.8%
Mountain 49.4% 43.5% 7.1% 53.3% 35.0% 11.7% 60.5% 37.7% 1.8% Pacific 51.8% 40.0% 8.2% 48.0% 45.9% 6.1% 52.2% 42.7% 5.1%
2005 International Carwash Association Study of Consumer Car Washing Attitudes and Habits All rights reserved © September 2005
-24-

Home Washer Results Washing Habits - Continued ♦ Eighty percent of home washers indicated they washed their car at home once or twice in the past four weeks. Also, nearly all
home washers (98.9%) have used a full-service car wash once or twice over the past four weeks.
Types of car washes used in past four weeks – 2005 Type of car wash used in past four (4) weeks by all respondents
Home wash
Full-Service wash
Exterior conveyor
wash
Stationary automatic
wash
Self-service
wash 52.0% 4.8% 6.1% 6.4% 10.4% How often in the past four (4) weeks all respondents have washed their car at…
One time 49.9% 80.9% 64.0% 74.8% 62.6% Two times 30.1% 18.0% 27.2% 17.6% 25.6% 3 – 4 times 16.6% 1.1% 7.9% 5.9% 7.7% Five or more times 3.4% ** 0.9% 1.7% 4.1% ** = No data submitted.
♦ About 83 percent of home washers indicated they have not had their car detailed in the past year. While 66 percent stated that they have had their car lubed up to six times in the past year.
Number of times in the past year – 2005
How often in the past year have you done the following…
0 times
1-3 times
4-6 times
7-9 times
10-12 times
More than 12 times
Had your car professionally washed 61.2% 27.9% 6.6% 2.4% 1.0% 0.9% Washed your car at home 1.7% 17.5% 22.2% 16.8% 14.4% 27.4% Had your car detailed 83.4% 13.2% 2.0% 0.6% * 0.7% Had your car lubed 28.6% 42.1% 24.2% 3.2% 0.8% 1.1% *= Less than 0.5 percent.
♦ According to home washers, 41 percent spend between $8.51 and $15.50 to have their vehicle professionally cleaned at a
full-service car wash, 40 percent have paid between $6.51 and $10.50 at an exterior wash and 54 percent have paid $2.51 to $6.50 getting their car cleaned at a stationary automatic shop. More home washers (65.9%) pay less than $2.50 and up to $4.50 at a self-service wash when getting their car professionally cleaned.
2005
Cost Spent for Professional Washing
Full-service wash
Exterior wash
Stationary automatic wash
Self-service wash
$2.50 or less 6.2% 8.2% 9.6% 21.7% $2.51 to $4.50 4.6% 12.8% 16.8% 25.5% $4.51 to $5.50 5.1% 13.8% 19.7% 18.7% $5.51 to $6.50 8.3% 12.2% 17.0% 8.7% $6.51 to $7.50 6.6% 14.5% 10.9% 5.2% $7.51 to $8.50 8.6% 11.3% 7.6% 2.5% $8.51 to $10.50 17.2% 14.2% 5.1% 4.7% $10.51 to $15.50 23.3% 6.6% 3.9% 4.1% $15.51 to $25.50 13.6% 4.1% 5.3% 5.0% More than $25.50 6.4% 2.3% 4.1% 3.9%
2005 International Carwash Association Study of Consumer Car Washing Attitudes and Habits All rights reserved © September 2005
-25-

Full Service Results
International Carwash Association Serving the Professional Car Care Industry

Full-Service Customer Results
Overview This section examines full-service customers’ responses to the consumer survey. Full-service customers are those respondents who indicated they most often use a full-service conveyor car wash to clean their car(s). A full-service shop pulls a car through the wash by a conveyor and includes extra services such as interior cleaning and waxing. Note, the data represented in this section of the report is not weighted.
Most Often Full-service Customers
19% 18% 17%
0%
25%
50%
75%
100%
2005 2002 1999
Demographic Characteristics ♦ The following table shows the gender for full-service customers by region. Overall, more often full-service customers are
female than male.
Regions – 2005 Gender
Overall
New
England
Middle Atlantic
East North
Central
West North
Central
South
Atlantic
East South
Central
West South
Central
Mountain
Pacific Male 42.2% 46.2% 46.7% 39.0% 38.9% 38.0% 35.3% 34.6% 46.4% 46.5% Female 57.8% 53.8% 53.3% 61.0% 61.1% 62.0% 64.7% 65.4% 53.6% 53.5% ♦ The following table shows the head of household age of full-service customers by region. Typically, full-service customers
tend to be 60 years and older.
Regions – 2005 Head of Household Age
Overall
New
England
Middle Atlantic
East North
Central
West North
Central
South
Atlantic
East South
Central
West South
Central
Mountain
Pacific Under 30 years 4.5% 5.4% 5.2% 10.7% 3.6% 5.0% 1.5% 2.8% 6.2% 1.3% 30 to 39 years 12.4% 8.6% 15.6% 17.9% 12.5% 15.0% 10.3% 10.4% 12.4% 9.4% 40 to 49 years 20.2% 22.6% 28.1% 21.4% 19.6% 17.05 22.1% 15.1% 19.5% 17.0% 50 to 59 years 25.5% 23.7% 25.2% 19.0% 23.2% 23.0% 30.9% 32.1% 21.2% 28.9% 60 years or older 37.4% 39.8% 25.9% 31.0% 41.1% 40.0% 35.3% 39.6% 40.7% 43.4%
2005 International Carwash Association Study of Consumer Car Washing Attitudes and Habits All rights reserved © September 2005
-26-

Full-Service Customer Results Demographic Characteristics– continued ♦ The following table shows the total annual household income of full-service customers by region. Overall, 42 percent of full-
service customers have an income of $75,000 and over.
Regions – 2005 Total Annual Household Income
Overall
New
England
Middle Atlantic
East North
Central
West North
Central
South
Atlantic
East South
Central
West South
Central
Mountain
Pacific Under $20,000 10.4% 13.5% 6.7% 11.9% 10.7% 8.1% 20.6% 14.3% 8.2% 7.1% $20K to $39,999 19.8% 18.0% 9.6% 23.8% 25.0% 23.2% 27.9% 15.2% 20.0% 22.6% $40K to $59,999 17.4% 16.9% 18.5% 21.4% 14.3% 17.2% 11.8% 19.05 20.9% 14.8% $60K to $74,999 10.5% 9.0% 8.1% 15.5% 17.9% 3.0% 13.2% 9.5% 12.7% 11.0% $75K to $99,999 19.3% 14.6% 21.5% 14.3% 17.9% 21.2% 13.2% 19.0% 21.8% 23.2% $100K to $149,999
16.5%
16.9%
28.1%
10.7%
10.7%
24.2%
7.4%
19.0%
10.0%
13.5%
$150K and over 6.0% 11.2% 7.4% 2.4% 3.6% 3.0% 5.9% 3.8% 6.4% 7.7% ♦ The following table shows the population density of full-service customers by region. Over 75 percent of full-service
customers live in areas of one half a million people or more.
Regions – 2005 Population Density
Overall
New
England
Middle Atlantic
East North
Central
West North
Central
South
Atlantic
East South
Central
West South
Central
Mountain
Pacific Non-MSA* 8.9% 9.7% 1.5% 25.0% 19.6% 4.0% 17.6% 6.6% 9.7% 2.5% MSA (to ½ mil.) 15.9% 10.8% 5.9% 11.9% 16.1% 28.0% 35.3% 17.9% 15.9% 11.9% MSA (½ mil. to 2 mil.)
22.1%
45.2%
11.9%
17.9%
3.6%
28.0%
39.7%
20.8%
23.0%
15.1%
MSA (over 2 mil.) 53.2% 34.4% 80.7% 45.2% 60.7% 40.0% 7.4% 54.7% 51.3% 70.4% *MSA – Metropolitan Statistical Area ♦ The following table shows the primary vehicle that is driven and washed most often for full-service customers by region.
Second to driving a car, more full-service customers tend to drive a SUV than a van or a truck.
Regions – 2005 Primary Vehicle Driven & Washed Most Often
Overall
New
England
Middle Atlantic
East North
Central
West North
Central
South
Atlantic
East South
Central
West South
Central
Mountain
Pacific Car 63.9% 68.8% 65.7% 64.3% 71.4% 62.6% 66.2% 63.8% 55.0% 62.9% Van 8.9% 9.7% 8.2% 9.5% 7.1% 9.1% 7.4% 5.7% 13.5% 8.8% Truck 7.2% 3.2% 2.2% 7.1% 7.1% 7.1% 8.8% 11.4% 8.1% 9.4% SUV 20.0% 18.3% 23.9% 19.0% 14.3% 21.2% 17.6% 19.0% 23.4% 18.9%
2005 International Carwash Association Study of Consumer Car Washing Attitudes and Habits All rights reserved © September 2005
-27-

Full-Service Customer Results Demographic Characteristics– continued ♦ The following table shows the number of miles driven per week by full-service customers by region. More full-service
customers (54.8%) drive between 51 to 200 miles than any other mileage category.
Regions – 2005 Number of Miles Driven Per Week
Overall
New
England
Middle Atlantic
East North
Central
West North
Central
South
Atlantic
East South
Central
West South
Central
Mountain
Pacific 50 miles or less 24.9% 21.5% 36.6% 28.0% 28.6% 22.2% 16.4% 19.2% 23.2% 24.5% 51 to 100 miles 29.5% 24.7% 31.3% 24.4% 28.6% 34.3% 29.9% 25.0% 28.6% 34.0% 101 to 200 miles 25.3% 28.0% 17.9% 23.2% 25.0% 21.2% 34.3% 28.8% 25.0% 27.7% 201 to 300 miles 12.6% 18.3% 9.7% 12.2% 14.3% 16.2% 9.0% 15.4% 16.1% 6.3% 301 to 500 miles 6.2% 6.5% 4.5% 8.5% 3.6% 5.1% 7.5% 8.7% 5.4% 6.3% More than 500 miles
1.5%
1.1%
**
3.7%
**
1.0%
3.0%
2.9%
1.8%
1.3%
** = No data was submitted. ♦ Full-service customers are most likely to live in a one or two-person household (71.8%). Across all regions, except in New
England, less than 10 percent of full-service customers live in households of five or more.
Regions – 2005
Household Size
Overall
New
England
Middle Atlantic
East North
Central
West North
Central
South
Atlantic
East South
Central
West South
Central
Mountain
Pacific One 29.3% 30.1% 27.4% 23.8% 28.6% 27.0% 33.8% 27.4% 31.9% 32.7% Two 42.5% 37.6% 37.8% 41.7% 48.2% 47.0% 38.2% 52.8% 39.8% 41.5% Three 11.6% 15.1% 11.1% 13.1% 12.5% 9.0% 14.7% 11.3% 8.0% 11.9% Four 10.0% 6.5% 16.3% 13.1% 5.4% 11.0% 8.8% 4.7% 11.5% 8.8% Five or more 6.7% 10.8% 7.4% 8.3% 5.4% 6.0% 4.4% 3.8% 8.8% 5.0%
Household Size - Overall 2005
Five or more7%
Four10%
Three12%
One29%
Two43%
2005 International Carwash Association Study of Consumer Car Washing Attitudes and Habits All rights reserved © September 2005
-28-
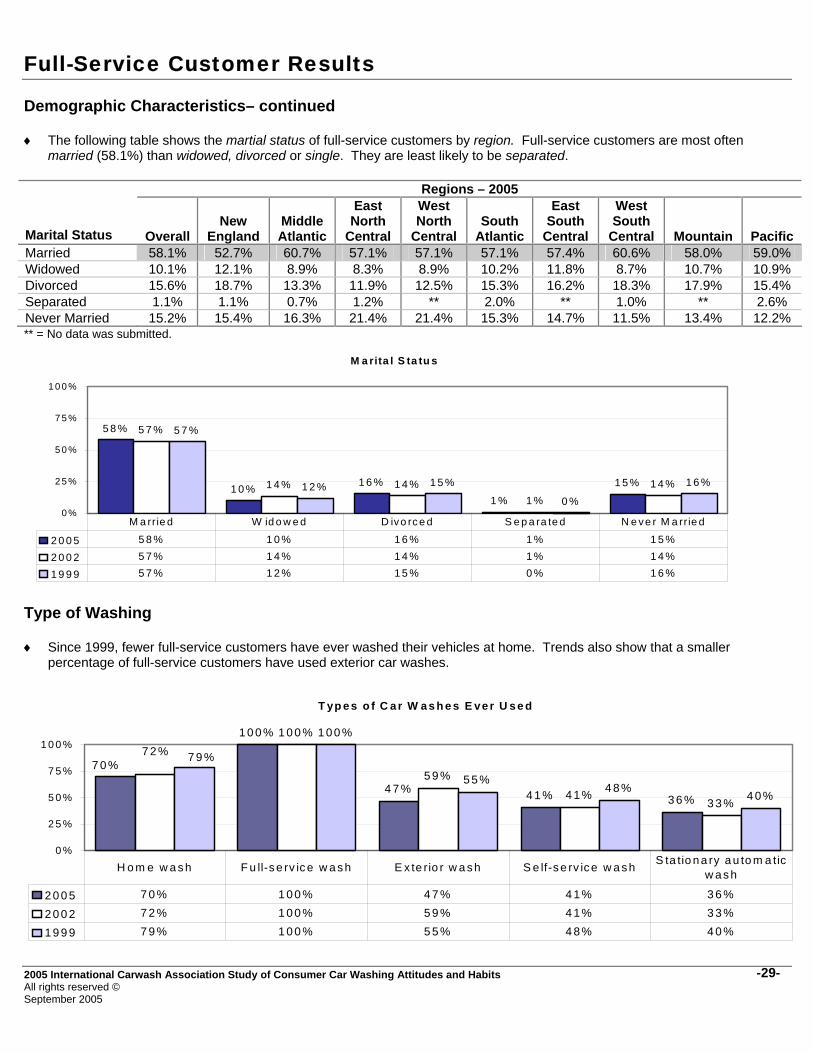
Full-Service Customer Results Demographic Characteristics– continued ♦ The following table shows the martial status of full-service customers by region. Full-service customers are most often
married (58.1%) than widowed, divorced or single. They are least likely to be separated.
Regions – 2005
Marital Status
Overall
New
England
Middle Atlantic
East North
Central
West North
Central
South
Atlantic
East South
Central
West South
Central
Mountain
Pacific Married 58.1% 52.7% 60.7% 57.1% 57.1% 57.1% 57.4% 60.6% 58.0% 59.0% Widowed 10.1% 12.1% 8.9% 8.3% 8.9% 10.2% 11.8% 8.7% 10.7% 10.9% Divorced 15.6% 18.7% 13.3% 11.9% 12.5% 15.3% 16.2% 18.3% 17.9% 15.4% Separated 1.1% 1.1% 0.7% 1.2% ** 2.0% ** 1.0% ** 2.6% Never Married 15.2% 15.4% 16.3% 21.4% 21.4% 15.3% 14.7% 11.5% 13.4% 12.2% ** = No data was submitted.
M a rita l S ta tu s
5 8 %
1 0 % 1 6 %
1 %
1 5 %
5 7 %
1 4 % 1 4 %1 %
1 4 %
5 7 %
1 2 % 1 5 %
0 %
1 6 %
0 %
2 5 %
5 0 %
7 5 %
1 0 0 %
2 0 0 5 5 8 % 1 0 % 1 6 % 1 % 1 5 %
2 0 0 2 5 7 % 1 4 % 1 4 % 1 % 1 4 %
1 9 9 9 5 7 % 1 2 % 1 5 % 0 % 1 6 %
M a rrie d W id o w e d D ivo rc e d S e p a ra te d N e ve r M a rrie d
Type of Washing ♦ Since 1999, fewer full-service customers have ever washed their vehicles at home. Trends also show that a smaller
percentage of full-service customers have used exterior car washes.
T yp e s o f C a r W a s h e s E ve r U s e d
1 0 0%
4 7 % 4 1 % 3 6 %
1 00 %
5 9 %
4 1%3 3 %
1 00 %
5 5%4 8%
4 0%
7 0%7 2% 7 9 %
0 %
2 5 %
5 0 %
7 5 %
1 0 0 %
20 0 5 7 0 % 1 00 % 4 7 % 4 1% 3 6 %
20 0 2 7 2 % 1 00 % 5 9 % 4 1% 3 3 %
19 9 9 7 9 % 1 00 % 5 5 % 4 8% 4 0 %
H o m e w a s h F u ll-s e rv ic e w a s h E x te rio r w a sh S e lf-s e rv ic e w a s h S ta tio na ry a u to m a tic w as h
-29-2005 International Carwash Association Study of Consumer Car Washing Attitudes and Habits All rights reserved © September 2005

Full-Service Customer Results Type of Washing – continued ♦ Most full-service customers, 84 percent, indicated that they had most recently used a full-service car wash. The second most
recently used professional car shop was an exterior conveyor wash (4.4%). Second to utilizing a full-service wash, this was also the type of car wash full-service customers were most likely to have ever used.
Regions – 2005
Car Wash Used Most Recently
Overall
New
England
Middle Atlantic
East North
Central
West North
Central
South
Atlantic
East South
Central
West South
Central
Mountain
Pacific Home wash 5.2% 4.9% 4.8% 1.4% 3.7% 8.4% 4.6% 2.1% 3.8% 9.3% Full-service wash 84.2% 84.0% 86.5% 81.7% 77.8% 80.0% 86.2% 81.4% 86.7% 88.0% Exterior wash 4.4% 9.9% 5.6% 4.2% 11.1% 1.1% 1.5% 4.1% 5.7% 0.7% Stationary- automatic wash
3.9%
**
1.6%
9.9%
5.6%
5.3%
6.2%
7.2%
2.9%
1.3%
Self-service wash 2.3% 1.2% 1.6% 2.8% 1.9% 5.3% 1.5% 5.2% 1.0% 0.7% ** = No data was submitted.
Types of Car Washes Recently Used
84%
4% 4% 2%
84%
5% 6% 2% 3%
84%
7% 4% 1% 4%5%0%
25%
50%
75%
100%
2005 5% 84% 4% 4% 2%
2002 84% 5% 6% 2% 3%
1999 84% 7% 4% 1% 4%
Full-service wash Home wash Exterior wash Self-service wash Stationary automatic wash
2005 International Carwash Association Study of Consumer Car Washing Attitudes and Habits All rights reserved © September 2005
-30-

Full-Service Customer Results Washing Attitudes Shown below are full-service customer ratings of different types of car washes. The table compares how full-service customers in 2005 rate the importance of several factors when selecting a particular type of car wash and their perception of the delivery of these factors as compared to full-service customers in 2002 and 1999. When rating delivery, each type of car wash attribute (e.g., quality of wash) was rated on a scale from 1 to 5 where 5 = “Excellent” and 1 = “Poor.” ♦ As in both 1999 and 2002, quality of wash continues to be the most important factor to full-service customers in their selection
of a car wash, earning a mean score of 4.75 (96.7% top-two box net) in 2005. Second to quality of wash, is value with a mean score of 4.49 (91.2% top-two box net) followed by safety of car’s exterior with a mean score of 4.52 (89.6% top-two box net).
♦ Full-service customers rated the importance of environmentally safe followed by faster overall as the lowest selection factors.
In the table below, trends show that full-service customers are more quality and convenience-driven consumers.
Most Often Full Service Customers’ Delivery Ratings of… Selection Factors (Top-Two Box Net)
Importance of Car Wash Selection
Factors to Most Often Full-service Customers
Home wash
Full-service
wash
Exterior
wash
Stationary automatic
wash
Self-service
wash Quality of wash
2005 96.7% 78.2% 93.7% 66.4% 42.7% 50.0% 2002 96.3% 77.4% 90.6% 91.2% 88.9% 78.5% 1999 95.2% 72.7% 91.2% 56.0% 32.9% 47.9%
Less work 2005 67.0% 12.0% 91.8% 81.6% 70.0% 12.0% 2002 68.1% 88.2% 89.8% 92.3% 93.3% 94.8% 1999 - - - - - -
Faster overall 2005 64.0% 12.4% 86.9% 80.7% 72.2% 18.8% 2002 62.1% 74.3% 84.7% 74.5% 65.4% 77.6% 1999 80.2% 17.5% 87.4% 79.7% 75.2% 30.9%
*Conveniently located 2005 82.0% 86.4% 81.1% 67.8% 66.2% 49.7% 2002 77.7% 51.2% 76.9% 59.5% 57.8% 48.5% 1999 90.9% 27.9% 93.5% 84.7% 74.9% 35.7%
Ease of use 2005 84.1% 45.6% 92.8% 84.3% 70.8% 37.7% 2002 81.4% 81.4% 89.6% 87.1% 90.7% 87.1% 1999 - - - - - -
Environmentally safe 2005 56.7% 44.7% 64.9% 49.4% 43.2% 28.4% 2002 - - - - - - 1999 - - - - - -
Safety of car’s exterior 2005 89.6% 82.1% 84.0% 61.3% 55.8% 61.7% 2002 89.0% 48.4% 78.3% 76.3% 71.0% 59.8% 1999 86.7% 82.2% 76.8% 53.7% 39.8% 56.7%
Value 2005 91.2% 82.6% 78.6% 64.4% 50.0% 48.0% 2002 89.3% 41.0% 73.5% 56.6% 53.7% 41.8% 1999 87.1% 71.0% 72.6% 53.6% 33.2% 36.1%
- = Not Applicable. *In the 1999 survey, the selection factor “conveniently located” was defined only as “convenience.” Note: The percentages shown represent the Top-Two Box Net score, the percentage of respondents rating the factor a “4” or “5.”
2005 International Carwash Association Study of Consumer Car Washing Attitudes and Habits All rights reserved © September 2005
-31-

Full-Service Customer Results Washing Attitudes – continued ♦ As shown below, full-service quality of wash, safety of exterior, value and ease of use received the top ranked mean ratings in
2005.
Top Four Importance Mean Ratings - 2005
4.264.494.524.75
0.00
1.00
2.00
3.00
4.00
5.00
Quality of wash Safety of exterior Value Ease of use
A list of additional services was provided in the survey. Respondents were asked to rank each profit center in order of importance. Overall, full-service customers rated gas station the first choice mean score (1.71). Express detailing received the second best mean score (1.78) and other additional services received the third best mean score (1.81). However, full-service customers in the Mountain region (see regional map on page 13) ranked truck rental first (1.00), dry cleaner second (1.25) and gas station third (1.67). The means presented in the table below are not weighted.
Regions – 2005 Additional Services (In Mean Rank Order Based on Overall)
Overall
New
England
Middle Atlantic
East North
Central
West North
Central
South
Atlantic
East South
Central
West South
Central
Mountain
Pacific
Gas station 1.71 1.69 1.79 1.66 1.83 1.76 1.84 1.72 1.67 1.58 Express detailing 1.78 1.91 1.95 1.67 1.64 1.88 1.45 1.77 1.83 1.73 Other 1.81 1.00 1.67 2.00 1.25 2.00 2.00 1.50 3.00 2.50 Oil change/Quick lube
1.85
2.00
1.85
1.97
1.94
1.79
1.76
1.61
2.00
1.80
Convenience store
1.95
2.07
1.79
2.05
1.83
1.83
2.09
1.79
2.11
1.98
ATM 1.97 1.73 1.86 2.10 1.93 1.94 2.00 2.18 2.00 2.07 Dry cleaner 2.00 3.00 2.13 2.00 2.00 1.29 2.00 2.67 1.25 2.00 Water dispenser 2.07 2.00 2.10 2.00 2.20 2.08 2.50 2.50 2.17 1.67 Paintless dent-repair
2.13
2.14
2.23
2.15
2.00
1.83
2.42
2.00
2.15
2.10
Windshield repair 2.18 1.92 2.40 2.75 2.40 2.25 2.20 2.31 1.86 2.40 Quick-service restaurant
2.20
2.33
2.39
1.79
2.20
2.42
2.08
2.20
2.00
2.27
Propane gas 2.23 2.67 1.50 2.00 2.50 2.50 2.00 2.50 2.50 1.50 Truck rental 2.25 3.00 3.00 2.00 ** ** ** ** 1.00 ** Brakes 2.29 2.67 2.00 2.00 ** 2.00 2.40 3.00 2.33 2.33 Gift shop 2.42 2.33 2.38 3.00 2.60 2.50 2.10 2.37 2.33 2.45 Tune up 2.46 2.22 2.50 2.57 2.33 2.42 2.33 2.67 2.50 2.60 Rating Scale: 1 = first choice, 2 = second choice, 3 = third choice. ** = No data was submitted.
2005 International Carwash Association Study of Consumer Car Washing Attitudes and Habits All rights reserved © September 2005
-32-

Full-Service Customer Results Washing Attitudes – continued ♦ Interior vacuuming was chosen by the greatest number of full-service customers as an extra service that they would like
offered at their car wash of choice.
Importance of Extra Services (In Percent Rank Order Based on 2005)
2005
2002
1999
Interior vacuuming 81.1% 80.9% 86.8% Hand towel drying 69.9% 74.2% 75.2% Spot-free rinse 66.1% 61.4% 63.1% Wheel/hubcap cleaning 65.4% 70.5% 68.1% Under body wash 46.2% 42.0% 48.7% Wax/paint protectant coating 42.6% 43.4% 53.5% None of these are important 21.0% 3.0% 2.8% Never go to car wash 18.4% ** - Hand wax/protectant application 18.1% 19.1% 19.8% Triple color protectant (foam) conditioner 15.5% 13.4% - Carpet shampooing 13.0% 11.4% 16.4% ** = No data was submitted. - = Not Applicable.
♦ Full-service customers rated having a thoroughly clean windshield as the most important part to be cleaned on their vehicle.
The second most important factor in judging the quality of a clean car was the body of their car. However, the delivery mean score for windshields being thoroughly cleaned was a 4.52 (93.0% top-two box net), a 0.36 point difference in score.
2005 2002 1999 Importance Rating of
Thoroughly Cleaned or Dried Part (In Mean Rank Order Based on 2005)
Overall
Mean Score
Top-Two Box Net
Overall
Mean Score
Top-Two Box Net
Overall
Mean Score
Top-Two Box Net
Windshield 4.88 98.1% 4.84 95.2% 4.82 97.8% Car body 4.84 98.7% 4.81 95.5% 4.78 98.2% Windows 4.83 97.9% 4.81 94.6% 4.81 98.0% Car thoroughly dried after wash 4.32 83.6% 4.32 80.9% - - Wheels 4.30 82.5% 4.29 79.3% 4.04 74.6% Front dash/console 4.16 80.8% 4.18 75.4% 4.20 82.9% Mats/carpet 4.11 78.7% 4.09 73.4% 4.12 81.1% *the entire car - - - - 4.42 85.7% Rating scale: 1 to 5, where 5 = “Very Important” and 1 = “Not very/Not at all Important.”
2005 2002 1999 Delivery Rating of Thoroughly Cleaned or Dried Part (In Mean Rank Order Based on 2005)
Overall Mean Score
Top-Two Box Net
Overall Mean Score
Top-Two Box Net
Overall Mean Score
Top-Two Box Net
Windshield 4.52 93.0% 4.44 86.6% - - Windows 4.49 92.8% 4.42 86.5% 4.37 87.8% Car body 4.46 91.6% 4.43 86.9% 4.39 89.2% Wheels 4.20 83.3% 4.17 79.7% 4.01 75.0% Car thoroughly dried after wash 4.12 77.7% 4.04 72.8% - - Front dash/console 3.94 71.5% 3.89 64.9% 3.92 69.5% Mats/carpet 3.91 70.5% 3.83 65.0% 3.86 67.4% *the entire car - - - - 4.17 79.0%
Rating scale: 1 to 5, where 5 = “Excellent” and 1 = “Poor.” - = Not Applicable.
2005 International Carwash Association Study of Consumer Car Washing Attitudes and Habits All rights reserved © September 2005
-33-

Full-Service Customer Results Note: Top-Two Box Net represents the percentage of respondents rating the part a “4” or “5.” Washing Attitudes – continued ♦ The graph below shows responding full-service customers’ top four mean ratings for the importance in the delivery of
thoroughly cleaned or dried parts of their car. Please be reminded, the scale used to determine such importance was a rating scale of 1 to 5, where 5 = “Very important” and 1 = “Not very/Not at all important.”
Top Four M ean Ratings for Delivery of Service - 2005
4.49 4.464.20
4.52
0.00
1.00
2.00
3.00
4.00
5.00
W indshield W indows Car body W heels
♦ Since 1999, full-service customers have indicated that the greatest influence over whether they might go to a professional car wash was if special prices discount coupons were offered. All of the factors listed had more of an influence over full-service customers’ decision to wash their car at a professional wash in 2005 than in 2002, with the exception of being recognized for its name/use of brand name products.
2005 2002 1999
Factors Influencing Use of Car Wash (In Mean Rank Order Based on 2005)
Mean
Top-Two Box Net
Mean
Top-Two Box Net
Mean
Top-Two Box Net
Special prices/discount coupons 3.88 70.5% 3.82 68.7% 4.00 74.5% Car wash offers extra services 3.78 65.6% 3.72 66.8% 3.52 58.0% Appearance of car wash 3.59 57.7% 3.47 55.4% - - For special occasions 3.47 55.5% 3.44 55.4% 3.96 70.8% Frequent washer discount 3.18 44.6% 3.09 42.8% 3.30 48.8% Environmentally safe to wash car 3.07 36.6% 2.86 32.7% - - Discounted or free wash with gas purchase
3.05
43.7%
2.83
34.6%
3.36
51.4%
Pay with credit/debit card 3.03 43.7% 2.66 34.0% - - On impulse 2.92 33.2% 2.79 29.5% 3.02 33.3% Discounted gas with car wash purchase 2.88 37.3% 2.55 26.6% - - Recommendation of a friend 2.75 31.8% 2.63 28.1% 2.98 39.4% Prepaid for multiple car washes at discounted price
2.70
32.2%
2.49
26.5%
-
-
Advertisements 2.68 25.1% 2.53 21.1% 2.80 26.9% Recognized carwash name/use of brand name products
2.46
22.6%
2.59
28.0%
2.84
31.4%
Free/discounted oil change 2.41 23.8% 2.16 16.8% 2.62 25.6% Self-pay kiosk 2.03 12.7% - - - - Rating scale: 1 to 5, where 5 = “A great deal of influence” and a 1 = “Little or no influence.” - = Not Applicable. Note: The percentages shown represent the Top-Two Box Net, the percentage of respondents rating the factor a “4” or “5.”
2005 International Carwash Association Study of Consumer Car Washing Attitudes and Habits All rights reserved © September 2005
-34-

Full-Service Customer Results
2005 International Carwash Association Study of Consumer Car Washing Attitudes and Habits All rights reserved © September 2005
-35-

Full-Service Customer Results Washing Attitudes – continued ♦ As in 1999 and 2002, the majority of full-service customers felt that professional car washing was safer for the environment, a
better overall quality of wash, more convenient, more enjoyable, faster (overall process) and less work than home washing. Full-service customers felt home washing was a lower cost (79.4%), safer for the car (67.0%) and a better overall value (59.1%).
2005 2002 1999 Which is better in the following
areas? Home Wash Car Wash Home Wash Car Wash Home Wash Car Wash Safer for the environment 38.0% 54.0% 31.6% 68.4% 34.1% 59.3% Safer for the car 67.0% 27.1% 64.9% 35.1% 65.2% 28.6% A better overall quality of wash 40.4% 56.3% 34.3% 65.7% 39.3% 58.1% A better overall value 59.1% 35.4% 58.4% 41.6% 61.6% 33.7% More convenient 21.4% 75.6% 24.1% 75.9% 12.7% 84.3% A lower cost 79.4% 14.1% 83.2% 16.8% 83.4% 12.3% More enjoyable 12.3% 81.4% 12.4% 87.6% 12.1% 82.0% Faster overall 4.7% 90.9% 3.6% 96.4% 3.9% 93.3% Less work 2.0% 94.5% 1.6% 98.4% 1.4% 95.7%
♦ More than 50 percent of full-service customers stated they would use a car wash more often, if it coupons or cost less.
Regions – 2005 Use Car Wash More Often, If… (In % Rank Order Based on Overall)
Overall
New
England
Middle Atlantic
East North
Central
West North
Central
South
Atlantic
East South
Central
West South
Central
Mountain
Pacific Lower cost 76.3% 69.9% 83.7% 73.8% 83.9% 68.0% 83.8% 81.1% 74.3% 72.3% Coupons 74.7% 67.7% 77.0% 78.6% 80.4% 79.0% 70.6% 81.1% 69.9% 71.1% Frequent Washer Club
47.7%
39.8%
45.2%
45.2%
42.9%
55.0%
55.9%
45.3%
50.4%
49.1%
VIP treatment 27.7% 23.7% 26.7% 27.4% 25.0% 33.0% 27.9% 26.4% 30.1% 27.7% If I had more time
21.7%
28.0%
23.0%
20.2%
25.0%
18.0%
32.4%
18.9%
15.0%
20.8%
If it took less time
17.4%
11.8%
14.1%
17.9%
14.3%
19.0%
27.9%
14.2%
18.6%
20.1%
Self-pay kiosk 5.8% 3.2% 10.4% 6.0% 12.5% 5.0% 4.4% 4.7% 2.7% 5.0%
2005 International Carwash Association Study of Consumer Car Washing Attitudes and Habits All rights reserved © September 2005
-36-

Full-Service Customer Results Washing Habits ♦ Across study years, more full-service customers reported using professional car washes with spray wash than with cloth or
hand wash. The full-service customers using exterior washes used spray wash about 3.6 percent more in 2002 than in 1999. However, full-service customers used spray wash at exterior washes 11.5 percent less in 2005 than in 2002.
2005 2002 1999
Type of wash
Full-service wash
Exterior
wash
Stationary automatic
wash
Full-service wash
Exterior
wash
Stationary automatic
wash
Full-service wash
Exterior
wash
Stationary automatic
wash Spray wash 49.2% 55.1% 49.8% 48.2% 66.6% 52.4% 46.8% 63.0% 55.7% Cloth wash 27.6% 27.8% 21.9% 28.2% 25.4% 26.4% 31.7% 24.0% 21.7% Hand wash 8.8% 1.2% - 10.1% 3.0% - 7.0% 1.5% - No response 14.4% 15.9% 28.2% 13.5% 5.0% 21.2% 14.5% 11.5% 22.6% - = Not Applicable.
♦ In 2005, more than 50 percent of the full-service customers reported that they usually have the interior of their car cleaned
when they get the exterior washed. This was true overall and throughout all regions, except in the New England and East North Central regions.
2005 2002 1999 How Often
Interior is Cleaned
Usually
Sometimes
Not Usually
Usually
Sometimes
Not Usually
Usually
Sometimes
Not Usually
Overall 58.3% 33.1% 8.6% 58.9% 32.3% 8.7% 62.9% 30.6% 6.5% New England
38.5%
49.5%
12.1%
38.0%
48.0%
14.0%
44.4%
46.7%
8.9%
Middle Atlantic
58.5%
31.5%
10.0%
55.3%
37.6%
7.1%
68.4%
22.8%
8.8%
East North Central
42.0%
49.4%
8.6%
47.4%
45.6%
7.0%
49.2%
42.9%
7.9%
West North Central
50.0%
40.7%
9.3%
56.7%
40.0%
3.3%
57.7%
42.3%
0.0%
South Atlantic
68.4%
27.6%
4.1%
65.8%
28.8%
5.5%
69.5%
22.0%
8.5%
East South Central
65.1%
28.6%
6.3%
45.5%
48.5%
6.1%
51.5%
45.5%
3.0%
West South Central
64.8%
25.7%
9.5%
68.8%
24.7%
6.5%
73.3%
21.7%
5.0%
Mountain 64.5% 27.3% 8.2% 69.7% 16.7% 13.6% 75.5% 22.4% 2.0% Pacific 63.3% 28.0% 8.7% 64.4% 23.8% 11.9% 65.9% 26.1% 8.0%
2005 International Carwash Association Study of Consumer Car Washing Attitudes and Habits All rights reserved © September 2005
-37-
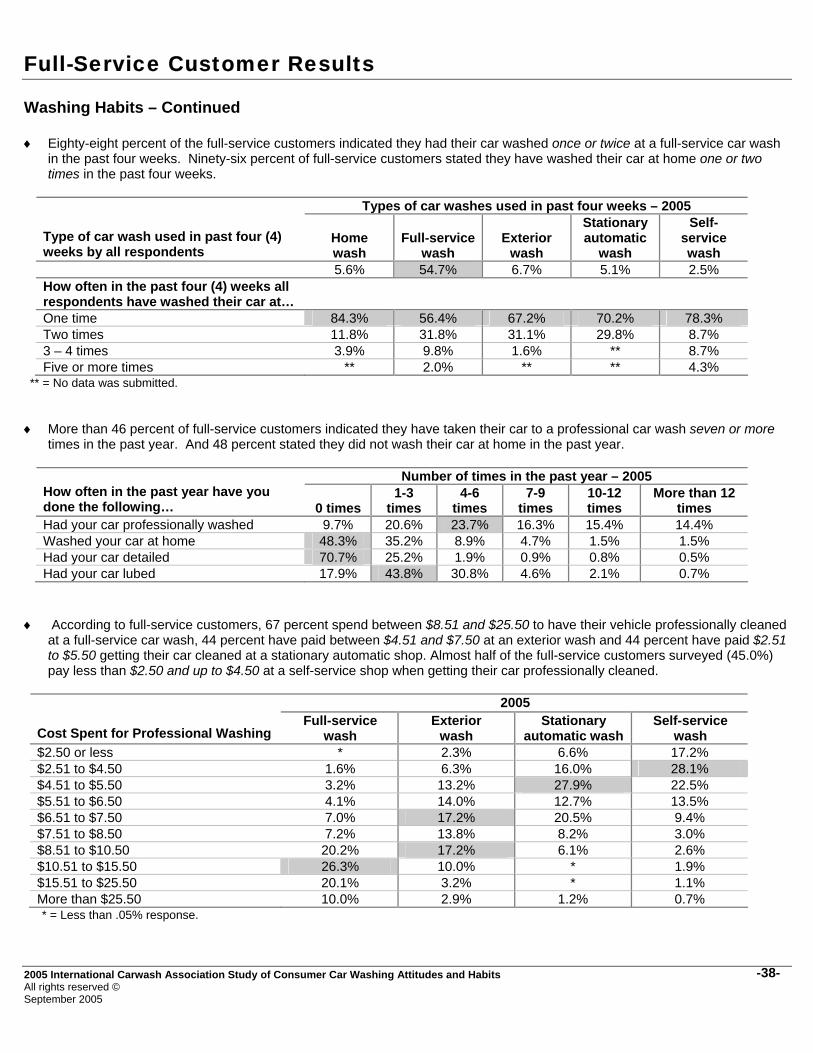
Full-Service Customer Results Washing Habits – Continued ♦ Eighty-eight percent of the full-service customers indicated they had their car washed once or twice at a full-service car wash
in the past four weeks. Ninety-six percent of full-service customers stated they have washed their car at home one or two times in the past four weeks.
Types of car washes used in past four weeks – 2005
Type of car wash used in past four (4) weeks by all respondents
Home wash
Full-service
wash
Exterior
wash
Stationary automatic
wash
Self-service wash
5.6% 54.7% 6.7% 5.1% 2.5% How often in the past four (4) weeks all respondents have washed their car at…
One time 84.3% 56.4% 67.2% 70.2% 78.3% Two times 11.8% 31.8% 31.1% 29.8% 8.7% 3 – 4 times 3.9% 9.8% 1.6% ** 8.7% Five or more times ** 2.0% ** ** 4.3%
** = No data was submitted. ♦ More than 46 percent of full-service customers indicated they have taken their car to a professional car wash seven or more
times in the past year. And 48 percent stated they did not wash their car at home in the past year.
Number of times in the past year – 2005 How often in the past year have you done the following…
0 times
1-3 times
4-6 times
7-9 times
10-12 times
More than 12 times
Had your car professionally washed 9.7% 20.6% 23.7% 16.3% 15.4% 14.4% Washed your car at home 48.3% 35.2% 8.9% 4.7% 1.5% 1.5% Had your car detailed 70.7% 25.2% 1.9% 0.9% 0.8% 0.5% Had your car lubed 17.9% 43.8% 30.8% 4.6% 2.1% 0.7%
♦ According to full-service customers, 67 percent spend between $8.51 and $25.50 to have their vehicle professionally cleaned
at a full-service car wash, 44 percent have paid between $4.51 and $7.50 at an exterior wash and 44 percent have paid $2.51 to $5.50 getting their car cleaned at a stationary automatic shop. Almost half of the full-service customers surveyed (45.0%) pay less than $2.50 and up to $4.50 at a self-service shop when getting their car professionally cleaned.
2005
Cost Spent for Professional Washing
Full-service wash
Exterior wash
Stationary automatic wash
Self-service wash
$2.50 or less * 2.3% 6.6% 17.2% $2.51 to $4.50 1.6% 6.3% 16.0% 28.1% $4.51 to $5.50 3.2% 13.2% 27.9% 22.5% $5.51 to $6.50 4.1% 14.0% 12.7% 13.5% $6.51 to $7.50 7.0% 17.2% 20.5% 9.4% $7.51 to $8.50 7.2% 13.8% 8.2% 3.0% $8.51 to $10.50 20.2% 17.2% 6.1% 2.6% $10.51 to $15.50 26.3% 10.0% * 1.9% $15.51 to $25.50 20.1% 3.2% * 1.1% More than $25.50 10.0% 2.9% 1.2% 0.7% * = Less than .05% response.
2005 International Carwash Association Study of Consumer Car Washing Attitudes and Habits All rights reserved © September 2005
-38-

Exterior Customer Results
International Carwash Association Serving the Professional Car Care Industry

Exterior Customer Results
Overview This section examines exterior customers’ response to the consumer survey. Exterior customers are those respondents who indicated they most often use an exterior conveyor car wash to wash their car(s). An exterior car wash pulls the car through the wash by a conveyor but the car does not move. Please note, the data presented in this section is not weighted.
Most Often Exterior Customers
14% 12% 12%
0%
25%
50%
75%
100%
2005 2002 1999
Demographic Characteristics ♦ The following table shows the gender for exterior customers by region. Similar to home washers and full-service customers,
the majority of exterior customers are female, regardless of geographical location.
Regions – 2005 Gender
Overall
New
England
Middle Atlantic
East North
Central
West North
Central
South
Atlantic
East South
Central
West South
Central
Mountain
Pacific Male 36.7% 43.7% 41.5% 32.0% 39.3% 39.1% 27.3% 28.0% 29.5% 34.7% Female 63.3% 56.3% 58.5% 68.0% 60.7% 60.9% 72.7% 72.0% 70.5% 65.3% ♦ The following table shows the head of household age of exterior customers by region. Over half of exterior customers
(58.7%) tend to be 50 years and over.
Regions – 2005 Head of Household Age
Overall
New
England
Middle Atlantic
East North
Central
West North
Central
South
Atlantic
East South
Central
West South
Central
Mountain
Pacific Under 30 years 6.2% 4.8% 4.2% 10.9% 11.5% 8.7% 9.1% ** 4.9% ** 30 to 39 years 15.6% 19.8% 15.8% 17.2% 18.0% 6.5% 12.1% 28.0% 11.5% 9.3% 40 to 49 years 19.6% 19.0% 20.0% 21.1% 26.2% 6.5% 24.2% 20.0% 18.0% 18.7% 50 to 59 years 21.8% 21.4% 24.2% 22.7% 14.8% 17.4% 18.2% 20.0% 27.9% 22.7% 60 years or older 36.9% 34.9% 35.8% 28.1% 29.5% 60.9% 36.4% 32.0% 37.7% 49.3% ** = No data was submitted.
2005 International Carwash Association Study of Consumer Car Washing Attitudes and Habits All rights reserved © August 2005
-38-

Exterior Customer Results Demographic Characteristics - continued ♦ The following table shows the total annual household income of exterior customers by region.
Regions – 2005 Total Annual Household Income
Overall
New
England
Middle Atlantic
East North
Central
West North
Central
South
Atlantic
East South
Central
West South
Central
Mountain
Pacific Under $20,000 12.9% 13.7% 9.4% 10.4% 13.1% 17.4% 18.2% 8.3% 14.8% 16.0% $20K to $39,999 21.8% 25.0% 17.1% 20.0% 23.0% 28.3% 24.2% 25.0% 19.7% 21.3% $40K to $59,999 18.6% 20.2% 19.7% 19.2% 13.1% 15.2% 24.2% 25.0% 18.0% 16.0% $60K to $74,999 9.8% 6.5% 6.8% 12.8% 11.5% 8.7% 6.1% 16.7% 16.4% 8.0% $75K to $99,999 18.2% 18.5% 23.1% 21.6% 21.3% 15.2% 6.1% 12.5% 13.1% 14.7% $100K to $149,999
14.1%
10.5%
17.9%
11.2%
18.0%
10.9%
18.2%
4.2%
14.8%
18.7%
$150K and over 4.7% 5.6% 6.0% 4.8% ** 4.3% 3.0% 8.3% 3.3% 5.3% ** = No data was submitted. ♦ For each region, the following table shows population density for exterior customers. Nearly three-quarters (72.7%) of exterior
customers live in areas of half a million or more people.
Regions – 2005 Population Density
Overall
New
England
Middle Atlantic
East North
Central
West North
Central
South
Atlantic
East South
Central
West South
Central
Mountain
Pacific Non-MSA* 10.8% 10.3% 1.7% 9.4% 11.5% 15.2% 33.3% 4.0% 27.9% 4.0% MSA (to ½ mil.) 16.4% 13.5% 5.8% 16.4% 18.0% 17.4% 33.3% 12.0% 24.6% 24.0% MSA (½ mil. to 2 mil.)
24.3%
36.5%
25.0%
17.2%
13.1%
17.4%
24.2%
48.0%
18.0%
25.3%
MSA (over 2 mil.)
48.4%
39.7%
67.5%
57.0%
57.4%
50.0%
9.1%
36.0%
29.5%
46.7%
*MSA – Metropolitan Statistical Area ♦ The following table shows the primary vehicle that is driven and washed most often by exterior customers by region. Other
than a car, more exterior customers (18.3%) are likely to drive a SUV than a van or a truck.
Regions – 2005 Primary Vehicle Driven & Washed Most Often
Overall
New
England
Middle Atlantic
East North
Central
West North
Central
South
Atlantic
East South
Central
West South
Central
Mountain
Pacific Car 64.8% 70.6% 67.2% 57.8% 57.4% 71.7% 65.6% 56.0% 59.0% 72.0% Van 10.7% 11.1% 7.6% 11.7% 13.1% 13.0% 12.5% 16.0% 9.8% 8.0% Truck 6.2% 4.0% 3.4% 9.4% 6.6% 4.3% 12.5% 4.0% 6.6% 8.0% SUV 18.3% 14.3% 21.8% 21.1% 23.0% 10.9% 9.4% 24.0% 24.6% 12.0%
2005 International Carwash Association Study of Consumer Car Washing Attitudes and Habits All rights reserved © August 2005
-39-

Exterior Customer Results Demographic Characteristics – continued ♦ The following table shows number of miles driven per week for exterior customers living in each region. Similar to home
washers and full-service customers, exterior customers tend to drive 51 to 100 miles per week.
Regions – 2005 Number of Miles Driven Per Week
Overall
New
England
Middle Atlantic
East North
Central
West North
Central
South
Atlantic
East South
Central
West South
Central
Mountain
Pacific 50 miles or less 24.1% 21.4% 26.9% 22.0% 23.0% 23.9% 18.8% 24.0% 27.9% 28.0% 51 to 100 miles 32.9% 27.8% 30.3% 30.9% 36.1% 39.1% 31.3% 40.0% 34.4% 40.0% 101 to 200 miles 21.4% 20.6% 20.2% 25.2% 18.0% 19.6% 21.9% 12.0% 27.9% 20.0% 201 to 300 miles 13.2% 19.0% 13.4% 13.8% 13.1% 10.9% 15.6% 16.0% 8.2% 5.3% 301 to 500 miles 6.3% 8.7% 6.7% 6.5% 6.6% 2.2% 12.5% 8.0% 1.6 4.0% More than 500 miles
2.1%
2.4%
2.5%
1.6%
3.3%
4.3%
**
**
**
2.7%
** = No data was submitted. ♦ The following chart shows the household size for exterior customers by region. Exterior customers are more likely to live in a
one or two-person household (68.9%).
Regions – 2005 Household Size
Overall
New
England
Middle Atlantic
East North
Central
West North
Central
South
Atlantic
East South
Central
West South
Central
Mountain
Pacific One 31.1% 35.7% 31.7% 24.2% 26.2% 39.1% 24.2% 32.0% 29.5% 37.3% Two 37.8% 36.5% 34.2% 36.7% 34.4% 50.0% 51.5% 32.0% 41.0% 36.0% Three 13.3% 8.7% 11.7% 21.9% 13.1% 6.5% 12.1% 16.0% 14.8% 12.0% Four 11.4% 11.1% 15.0% 13.3% 14.8% 2.2% 6.1% 16.0% 9.8% 8.0% Five or more 6.4% 7.9% 7.5% 3.9% 11.5% 2.2% 6.1% 4.0% 4.9% 6.7% ♦ The following chart shows the marital status of exterior customers by region. Across regions, most exterior customers are
least likely to be separated.
Regions – 2005
Marital Status
Overall
New
England
Middle Atlantic
East North
Central
West North
Central
South
Atlantic
East South
Central
West South
Central
Mountain
Pacific Married 56.8% 46.8% 58.5% 64.6% 58.3% 50.0% 65.6% 56.0% 59.0% 55.4% Widowed 10.5% 10.5% 11.9% 8.7% 3.3% 28.3% 15.6% 4.0% 11.5% 5.4% Divorced 15.9% 13.7% 14.4% 11.0% 18.3% 13.0% 12.5% 24.0% 23.0% 23.0% Separated 1.2% 0.8% 1.7% ** 1.7% 4.3% ** ** 1.6% 1.4% Never Married 15.6% 28.2% 13.6% 15.7% 18.3% 4.3% 6.3% 16.0% 4.9% 14.9% ** = No data was submitted.
2005 International Carwash Association Study of Consumer Car Washing Attitudes and Habits All rights reserved © August 2005
-40-

Exterior Customer Results Type of Washing ♦ Since 2002, fewer exterior customers have ever washed their car at home. This represents a 4 percent decrease from 1999.
Also, stationary automatic is the wash type least likely to have ever been used by exterior washers.
Type of Car Washes Ever Used by Exterior Customers - All Regions
74%
53%
100%
42%
100%
42%
59%
100%
51%
36%
74% 54%
31%
78%
33%
0%
25%
50%
75%
100%
2005 74% 53% 100% 36% 42%
2002 74% 54% 100% 31% 42%
1999 78% 59% 100% 33% 51%
Home wash Full-service wash Exterior wash Stationary automatic wash Self-service wash
Regions – 2005 Car Wash Ever Used
New
England
Middle Atlantic
East North
Central
West North
Central
South
Atlantic
East South
Central
West South
Central
Mountain
Pacific Home wash 69.8% 66.7% 76.6% 83.6% 76.1% 84.8% 88.0% 75.4% 70.7% Full-service wash 38.9% 51.7% 50.0% 68.9% 54.3% 72.7% 72.0% 50.8% 53.3% Exterior wash 100.0% 100.0% 100.0% 100.0% 100.0% 100.0% 100.0% 100.0% 100.0% Stationary automatic wash
26.2%
30.0%
43.0%
59.0%
37.0%
36.4%
68.0%
34.4%
22.7%
Self-service wash 34.9% 39.2% 45.3% 54.1% 28.3% 51.5% 80.0% 42.6% 30.7% ♦ Not surprising, most exterior customers have most recently used an exterior wash to clean their car. The second most
recently used types of washes were full-service and stationary automatic shops, as well as home washing (6.3% and 4.3% respectively).
Regions – 2005
Car Wash Used Most Recently
Overall
New
England
Middle Atlantic
East North
Central
West North
Central
South
Atlantic
East South
Central
West South
Central
Mountain
Pacific Home wash 4.3% 5.0% 2.8% 2.5% 1.7% 6.7% 10.7% 4.2% 3.5% 7.4% Full-service wash
6.3%
3.3%
11.0%
5.0%
6.9%
8.9%
3.6%
8.3%
5.3%
5.9%
Exterior wash 82.2% 87.6% 82.6% 88.3% 69.0% 75.6% 75.0% 83.3% 80.7% 80.9% Stationary automatic wash
4.3%
2.5%
**
3.3%
19.0%
8.9%
**
4.2%
5.3%
1.5%
Self-service wash
2.9%
1.7%
3.7%
0.8%
3.4%
**
10.7%
**
5.3%
4.4%
** = No data was submitted.
2005 International Carwash Association Study of Consumer Car Washing Attitudes and Habits All rights reserved © August 2005
-41-

Exterior Customer Results Washing Attitudes Shown below are exterior customer ratings of different types of car washes. Respondents were first asked to rate the importance of several factors in their selection of a car wash. The factors were: ♦ Quality of wash ♦ Less work ♦ Faster overall ♦ Conveniently located ♦ Ease of use ♦ Environmentally safe ♦ Safety of your car’s exterior ♦ Value (quality of wash for money spent) ♦ Of all factors rated for importance in selection of a car wash, the quality of the wash earned the highest overall mean score of
4.57 (91.5% top-two box net) in 2005. In 1999, convenience received the highest overall mean score of 4.58 (95.2% top-two box net). Mean scores were determined by totaling the point value a factor received and dividing by the number of responses.
O v e ra ll T o p -T w o B o x N e t o n S e le c tio n F a c to rs
6 7 %
8 0 %
9 2 % 8 9 % 8 8 %
6 7 %
8 4 %
5 5 %
7 7 %9 2 %
5 9 %
7 8 %8 9 % 8 8 %
9 5 %
8 6 %7 8 %
-
8 4 % 8 5 %
0 %
2 5 %
5 0 %
7 5 %
1 0 0 %
2 0 0 5 9 2 % 6 7 % 6 7 % 8 0 % 8 4 % 5 5 % 8 9 % 8 8 %
2 0 0 2 9 2 % 6 8 % 5 9 % 7 7 % 8 4 % 7 8 % 8 9 % 8 8 %
1 9 9 9 8 6 % - 7 8 % 9 5 % - - 8 4 % 8 5 %
Q u a lity o f w a s h L e s s w o rk F a s te r o ve ra ll *C o n ve n ie n tly
lo c a te d E a s e o f u s e E n v iro n m e n -ta lly s a fe
S a fe ty o f yo u r c a r's e xte rio r V a lu e
--
84%
Most Often Used Exterior Customers’ Importance Ratings Aspects of Car Wash (In Mean Rank Order Based on 2005) Mean - 2005 Mean - 2002 Mean - 1999 Quality of wash 4.57 4.54 4.28 Safety of your car’s exterior 4.47 4.47 4.24 Value 4.43 4.34 4.20 Ease of use 4.23 4.26 - *Conveniently located 4.16 4.13 4.58 Less work 3.85 3.89 - Faster overall 3.84 3.66 4.08 Environmentally safe 3.56 4.18 4.05 Rating scale: 1 to 5 where 5 = “Very Important” and 1 = “Not very/Not at all Important.” - = Not Applicable. *In the 1999 survey, the selection factor “conveniently located” was defined only as “convenience.” Note: The percentages shown represent the Top-Two Box Net score, the percentage of respondents rating the factor a “4” or “5.”
2005 International Carwash Association Study of Consumer Car Washing Attitudes and Habits All rights reserved © August 2005
-42-

Exterior Customer Results Washing Attitudes - continued The table below compares how exterior customers in 2005 rate their perception of the delivery of these factors as compared to exterior customers in 2002 and 1999. ♦ Followed by the quality of the wash, exterior customers believe the safety of the car’s exterior is the second most important
factor in the selection of a car wash. In regards to full-service shops, exterior customers are most satisfied with the fact that they require less work. Exterior customers believe that exterior washes provide the fastest overall process (92.7% top-two box net). The least important factor to exterior customers is that the car wash is environmentally safe (54.5% top-two box net).
Most Often Exterior Customers’ Delivery Ratings of…
Selection Factors (Top-Two Box Net)
Importance of Car Wash Selection
Factors to Most Often Exterior Customers
Home Wash
Full-service
wash
Exterior
wash
Stationary automatic
wash
Self-service
wash Quality of wash
2005 91.5% 77.7% 91.9% 83.8% 48.1% 60.3% 2002 91.8% 66.5% 66.5% 79.6% 69.3% 68.8% 1999 86.2% 77.8% 87.6% 76.6% 39.3% 57.7%
Less work 2005 66.6% 9.9% 93.0% 92.0% 75.9% 15.1% 2002 67.6% 84.3% 78.1% 89.5% 87.1% 91.3% 1999 - - - - - -
Faster overall 2005 67.2% 12.6% 77.8% 92.7% 69.2% 18.3% 2002 58.6% 78.8% 80.6% 86.1% 82.8% 82.5% 1999 77.5% 19.1% 72.7% 90.8% 67.7% 26.5%
*Conveniently located 2005 79.8% 85.6% 65.4% 84.6% 64.0% 55.6% 2002 77.0% 54.5% 67.2% 82.6% 59.1% 53.4% 1999 95.2% 29.1% 85.3% 94.3% 69.9% 36.3%
Ease of use 2005 83.6% 42.3% 87.3% 92.3% 73.2% 45.4% 2002 83.6% 81.8% 80.7% 91.7% 85.3% 83.0% 1999 - - - - - -
Environmentally safe 2005 54.5% 52.6% 55.8% 62.1% 47.6% 40.2% 2002 - - - - - - 1999 - - - - - -
Safety of car’s exterior 2005 89.1% 85.2% 70.3% 72.2% 61.5% 68.7% 2002 89.0% 46.2% 55.8% 70.0% 60.1% 45.4% 1999 84.4% 84.6% 69.0% 71.7% 47.5% 68.9%
Value 2005 87.9% 88.3% 57.5% 77.2% 51.4% 57.4% 2002 87.7% 40.3% 55.1% 68.6% 55.1% 42.2% 1999 84.6% 75.2% 51.9% 72.5% 46.0% 44.5%
Rating scale: 1 to 5 where 5 = “Excellent” and 1 = “Poor.” - = Not Applicable. *In the 1999 survey, the selection factor “conveniently located” was defined only as “convenience.” Note: The percentages shown represent the Top-Two Box Net score, the percentage of respondents rating the factor a “4” or “5.”
2005 International Carwash Association Study of Consumer Car Washing Attitudes and Habits All rights reserved © August 2005
-43-

Exterior Customer Results Washing Attitudes - continued A list of additional services was provided in the survey. From this list, respondents were asked to choose three additional services they would like offered at the same location as a car wash in order of importance. ♦ Overall, exterior customers gave gas station the best mean score (1.57) followed by express detailing (1.70) and oil
change/quick lube (1.92). However, exterior customers living in the South Atlantic region (see regional map on page 13) ranked paintless dent-repair first (1.50). Those located in the East South Central region also ranked having a water dispenser first (1.50) and those living in the West South Central region ranked having express detailing first (1.25). The means presented in the table below are not weighted.
Regions – 2005 Additional
Services (In Mean Rank Order Based on Overall)
Overall
New
England
Middle Atlantic
East North
Central
West North
Central
South
Atlantic
East South
Central
West South
Central
Mountain
Pacific
Gas station 1.57 1.55 1.47 1.61 1.47 1.60 1.50 2.00 1.67 1.55 Express detailing
1.70
1.75
1.76
1.63
1.67
2.17
1.83
1.25
1.92
1.67
Oil change/Quick lube
1.92
1.89
2.19
1.80
2.21
1.68
1.60
2.10
2.00
1.82 Convenience store
2.04
1.98
2.04
2.11
1.94
1.95
2.55
2.10
1.88
2.14
Other 2.07 1.25 1.80 2.80 2.00 ** 2.67 ** 1.00 2.29 ATM 2.12 2.21 1.96 2.15 1.94 2.43 2.00 2.43 1.87 2.29 Dry cleaner 2.15 2.20 2.29 1.80 2.67 3.00 2.00 1.50 ** 2.00 Water dispenser 2.16 1.40 2.25 2.00 3.00 2.20 1.50 2.67 2.60 2.00 Paintless dent-repair
2.22
2.50
2.13
2.25
2.50
1.50
2.25
1.50
2.33
2.11
Gift shop 2.31 3.00 1.75 2.75 2.00 ** 1.50 2.25 3.00 2.17 Windshield repair
2.31
2.20
2.30
2.57
2.80
2.33
2.00
3.00
2.15
2.11
Brakes 2.36 2.50 2.00 2.60 2.50 3.00 2.25 ** 2.00 3.00 Quick-service restaurant
2.38
2.55
2.45
2.40
2.25
2.08
2.40
1.67
2.33
2.53
Tune up 2.43 2.33 2.67 2.56 2.17 2.60 2.75 2.50 2.00 2.17 Propane gas 2.50 2.57 3.00 2.25 2.50 ** ** ** 3.00 2.25 Truck rental 3.00 ** ** 3.00 ** ** ** ** ** ** Rating scale: “1” = First choice, “2” = Second choice, “3” = Third choice. ** = No data was submitted.
2005 International Carwash Association Study of Consumer Car Washing Attitudes and Habits All rights reserved © August 2005
-44-

Exterior Customer Results Washing Attitudes - continued ♦ Spot-free rinse was chosen by the greatest number of exterior customers as an extra service that would be a factor in their car
wash selection in 2005 (61%), 2002 (53.5%) and 1999 (55.9%).
Importance of Extra Services to Exterior Customers
50%
22%11%
3%
19%12%
35%
9%
61%52%
39%31%
13%
38%54%49%
38%
30%14%
6%4%
43%50%
43%44%41%
0%
25%
50%
75%
100%
2005 31% 50% 39% 52% 3% 61% 9% 35% 12% 19% 22%
2002 30% 52% 38% 49% 5% 54% 11% 38% 13% 13% 0%
1999 41% 44% 43% 50% 4% 56% 6% 43% - 14% -
Interior vacuuming
Wheel/hubcap cleaning
Wax/paint protectant
coating
Under body wash
Carpet shampooing
Spot-free rinse
Hand wax/protectant application
Hand towel drying
Triple color protectant
(foam)
None of these are important
Never go to car wash
5% - -
56%
- = Not Applicable. ♦ In 2005, the majority of exterior customers felt that professional car washing was better with regards to the following: more
convenient (location), more enjoyable, faster (overall process) and less work. Most exterior customers felt home washing was a lower cost (82.4%), safer for the car (73.2%) and a better overall value (69.3%). Few exterior customers felt home washing was less work (2.2%) and a faster (overall process) (4.1%).
2005 2002 1999 Which is better in the following
areas? Home Wash Car Wash Home Wash Car Wash Home Wash Car Wash Safer for the environment 46.7% 46.2% 42.6% 57.4% 38.5% 43.8% Safer for the car 73.2% 21.2% 75.3% 24.7% 70.8% 15.8% A better overall quality of wash 52.0% 44.3% 46.2% 53.8% 55.9% 34.5% A better overall value 69.3% 25.6% 66.0% 34.0% 63.7% 23.0% More convenient (location) 23.6% 74.5% 17.7% 82.3% 9.3% 84.8% A lower cost 82.4% 12.4% 86.0% 14.0% 74.8% 15.2% More enjoyable 17.6% 76.4% 18.7% 81.3% 11.8% 76.4% Faster overall 4.1% 92.3% 2.3% 97.7% - - Less work 2.2% 95.6% 1.0% 99.0% - - - = Not Applicable.
2005 International Carwash Association Study of Consumer Car Washing Attitudes and Habits All rights reserved © August 2005
-45-

Exterior Customer Results Washing Attitudes – continued A rating scale of 1 to 5, where 5 = “Very Important” and 1 = “Not very/Not at all Important” was used to determine the importance for exterior customers of having different parts of their car thoroughly cleaned or dried. This is compared with the mean score for how exterior customers rated the delivery of these services. ♦ Exterior customers rated having a thoroughly clean car body and a thoroughly clean car windshield as the most important
factors in judging the quality of a car wash. The biggest variance in importance versus delivery is in regards to cleaning the car body. Exterior customers rated the importance of a thoroughly clean car body a 4.77, but the delivery of a thoroughly clean car body a 4.22, which represents a difference of 0.55 points.
2005 2002 1999 Importance Rating of
Thoroughly Cleaned or Dried Part (In Mean Rank Order Based on 2005)
Overall
Mean Score
Top-Two Box Net
Overall
Mean Score
Top-Two Box Net
Overall
Mean Score
Top-Two Box Net
Car body 4.77 98.5% 4.81 93.8% 4.74 96.8% Windshield 4.76 96.0% 4.81 93.9% 4.74 95.2% Windows 4.72 96.0% 4.74 93.4% 4.68 94.3% Wheels 4.07 75.3% 3.98 69.9% 3.78 61.8% Car thoroughly dried after wash 3.80 65.7% 3.80 62.3% - - Front dash/console 3.28 46.7% 3.25 42.9% 3.20 42.3% Mats/carpet 3.24 45.3% 3.24 41.3% 3.19 40.5% *the entire car - - - - 3.91 68.2% Rating scale: 1 to 5, where 5 = “Very Important” and 1 = “Not very/Not at all Important.”
2005 2002 1999 Delivery Rating of Thoroughly Cleaned or Dried Part (In Mean Rank Order Based on 2005)
Overall Mean Score
Top-Two Box Net
Overall Mean Score
Top-Two Box Net
Overall Mean Score
Top-Two Box Net
Windshield 4.34 85.8% 4.28 81.3% - - Windows 4.24 81.9% 4.18 77.7% 4.08 78.3% Car body 4.22 84.0% 4.18 79.4% 4.18 81.8% Wheels 3.75 64.9% 3.65 56.3% 3.66 59.0% Car thoroughly dried after wash 3.34 50.0% 3.20 40.3% - - Front dash/console 2.51 26.7% 2.34 17.0% 2.59 26.2% Mats/carpet 2.44 24.3% 2.31 15.5% 2.56 24.9% *the entire car - - - - 3.45 53.5% Rating scale: 1 to 5, where 5 = “Excellent” and 1 = “Poor.”
- = Not Applicable. Note: The Top-Two Box Net is the percentage of respondents who rated the factor a “4” or “5.”
2005 International Carwash Association Study of Consumer Car Washing Attitudes and Habits All rights reserved © August 2005
-46-

Exterior Customer Results Washing Attitudes - continued ♦ In 2002 and 2005, exterior customers indicated that the biggest influence over whether they might go to a professional car
wash was for special prices/discount coupons. In 1999, however, exterior customers reported that the biggest influence for whether they would go to a professional car wash was for a special occasion such as a wedding, a holiday, etc.
2005 2002 1999
Factors Influencing Decision to Use Car Wash (In Mean Rank Order Based on 2005)
Mean
Top-Two Box Net
Mean
Top-Two Box Net
Mean
Top-Two Box Net
Special prices/discount coupons 3.92 72.1% 3.90 72.2% 3.93 73.6% For a special occasion such as a wedding, a holiday, etc.
3.60
60.5%
3.56
58.3%
3.97
72.5%
Appearance of car wash 3.44 52.0% 3.54 56.4% - - A discounted or free wash is given with a gas purchase
3.24
49.8%
3.45
57.3%
3.66
63.2%
On impulse 3.07 38.8% 3.03 36.1% 3.22 39.4% The car wash offers extra services (i.e., Interior vacuuming, Wheel/hubcap cleaning)
3.05
40.4%
3.15
42.4%
2.99
36.6%
Frequent washer discount 2.94 38.0% 2.97 39.7% 3.16 43.2% Environmentally safe to wash my car 2.90 34.9% 2.91 33.8% - - Discounted gas is given with a car wash purchase 2.89 39.1% 3.00 40.7% - - Recommendation of a friend 2.61 27.1% 2.50 24.4% 2.81 32.7% Prepaid for multiple car washes at a discounted price
2.60
29.7%
2.77
32.9%
-
-
Allows me to pay with credit/debit card 2.51 27.9% 2.43 26.7% - - Advertisements 2.42 19.6% 2.41 17.1% 2.62 20.5% Free/discounted oil change 2.34 22.4% 2.28 21.5% 2.69 31.3% Recognized carwash name/use of brand name products
2.24
16.5%
2.51
22.7%
2.63
26.0%
Self-pay kiosk 2.03 14.2% - - - - Rating scale: 1 to 5 where 5 = “A great deal of influence” and a 1 = “Little or no influence.” - = Not Applicable.
Note: The percentages shown represent the Top-Two Box Net score, the percentage of respondents rating the factor a “4” or “5.” ♦ It can be determined by the bar graph below that exterior customers are influenced mainly by price (e.g., lower costs and
coupons).
W ould Use Car W ash M ore Frequently, If...
74%
46%
20%
80%
9%21% 14%
80%
55%
19%
81%
-
68%
40%
12%
75%
- -0%
25%
50%
75%
100%
2005 74% 46% 20% 80% 9% 21% 14%
2002 80% 55% 19% 81% - 17% 13%
1999 68% 40% 12% 75% - - -
Coupons Frequent washer c lub VIP treatm ent Lower cost Self-pay kiosk If I had m ore
tim eIf it took less
tim e
-
2005 International Carwash Association Study of Consumer Car Washing Attitudes and Habits All rights reserved © August 2005
-47-

Exterior Customer Results - = Not Applicable. Washing Habits ♦ Across study years, more exterior customers reported using professional car washes with spray wash than with cloth or hand
wash. Interestingly, though, exterior customers that use stationary automatic car washes tend to use spray wash 16.8 percent less in 2002 than in 1999, while using a cloth wash 6.6 percent more in 2002 than in 1999. This trend does not continue when looking at exterior customers’ usage of spray versus cloth wash at stationary car shops in 2005 compared to 2002.
2005 2002 1999
Type of wash
Full-service wash
Exterior
wash
Stationary automatic
wash
Full-service wash
Exterior
wash
Stationary automatic
wash
Full-service wash
Exterior
wash
Stationary automatic
wash Spray wash 48.7% 51.0% 52.5% 43.0% 64.0% 51.1% 46.8% 61.1% 67.9% Cloth wash 31.8% 32.0% 21.7% 34.5% 32.5% 23.0% 36.4% 33.1% 16.4% Hand wash 5.6% 1.2% - 6.3% 2.0% - 3.9% 0.6% - No response 13.8% 15.9% 25.8% 16.2% 1.5% 25.9% 13.0% 5.3% 15.7% - = Not Applicable.
♦ Almost 80 percent of exterior customers reported that they usually or sometimes clean the interior of their car when the
exterior is washed.
2005 2002 1999 How Often Interior is Cleaned
Usually
Sometimes
Not Usually
Usually
Sometimes
Not Usually
Usually
Sometimes
Not Usually
Overall 23.9% 55.8% 20.4% 23.1% 55.9% 21.0% 23.2% 60.0% 16.8% New England 24.2% 52.4% 23.4% 21.9% 57.8% 20.3% 22.6% 56.5% 21.0% Middle Atlantic 20.5% 63.2% 16.2% 25.8% 58.1% 16.1% 24.6% 58.5% 16.9% East North Central
19.4%
61.3%
19.4%
17.7%
53.1%
29.2%
23.9%
59.7%
16.4%
West North Central
18.3%
60.0%
21.7%
25.8%
51.6%
22.6%
16.7%
50.0%
33.3%
South Atlantic 34.1% 38.6% 27.3% 6.7% 73.3% 20.0% 25.0% 50.0% 25.0% East South Central
29.0%
58.1%
12.9%
42.9%
50.0%
7.1%
21.1%
68.4%
10.5%
West South Central
32.0%
48.0%
20.0%
25.0%
56.3%
18.8%
28.6%
71.4%
ΡΡ
Mountain 25.4% 59.3% 15.3% 25.8% 48.4% 25.8% 32.3% 61.3% 6.5% Pacific 28.4% 45.9% 25.7% 32.6% 54.3% 13.0% 16.2% 73.0% 10.8% ♦ In the previous four weeks, most exterior customers had their car washed at an exterior conveyor shop (55%) and only 4
percent had their vehicles cleaned at a self-service wash.
T y p e o f W a s h U s e d i n t h e P a s t F o u r W e e k s
5 % 9 %
5 5 %
6 % 4 %7 % 1 2 %
6 8 %
8 % 6 %1 5 % 1 6 %
8 4 %
1 1 % 8 %
0 %2 5 %5 0 %7 5 %
1 0 0 %
2 0 0 5 5 % 9 % 5 5 % 6 % 4 %
2 0 0 2 7 % 1 2 % 6 8 % 8 % 6 %
1 9 9 9 1 5 % 1 6 % 8 4 % 1 1 % 8 %
H o m e w a s h F u l l - s e r v ic e w a s h E x t e r io r w a s h S t a t io n a r y a u t o m a t ic w a s h S e l f - s e r v ic e w a s h
2005 International Carwash Association Study of Consumer Car Washing Attitudes and Habits All rights reserved © August 2005
-48-
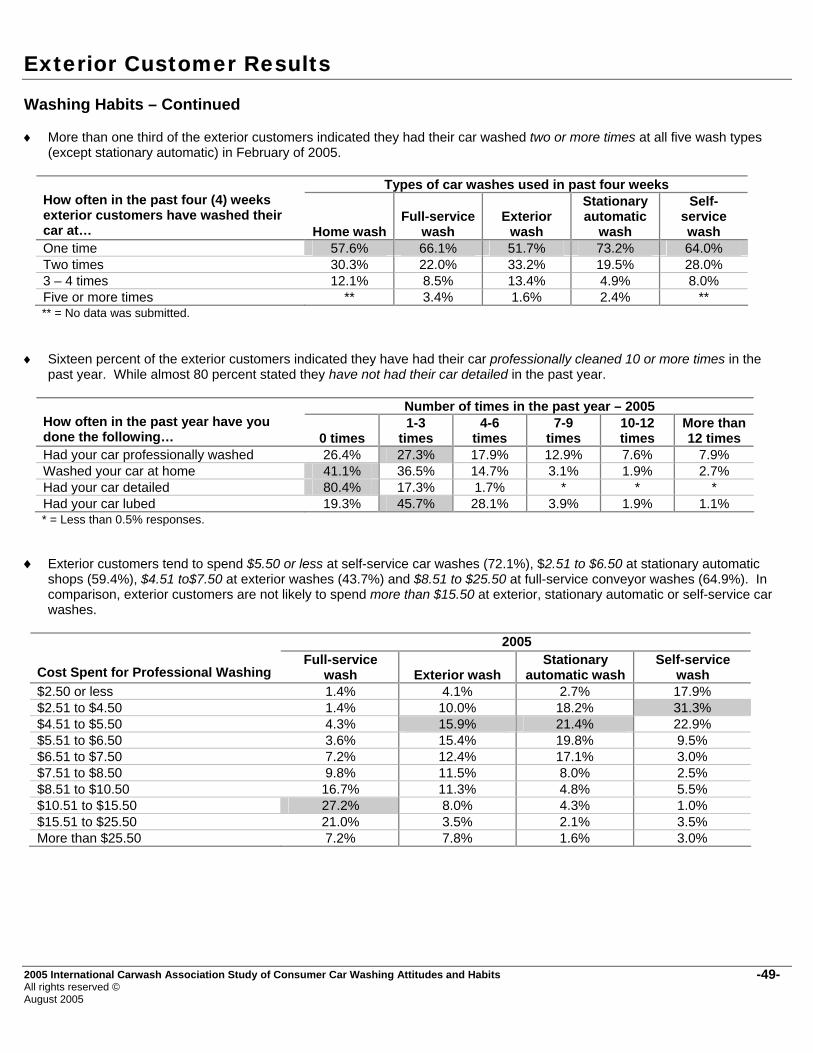
Exterior Customer Results Washing Habits – Continued ♦ More than one third of the exterior customers indicated they had their car washed two or more times at all five wash types
(except stationary automatic) in February of 2005.
Types of car washes used in past four weeks How often in the past four (4) weeks exterior customers have washed their car at…
Home wash
Full-service
wash
Exterior
wash
Stationary automatic
wash
Self-service wash
One time 57.6% 66.1% 51.7% 73.2% 64.0% Two times 30.3% 22.0% 33.2% 19.5% 28.0% 3 – 4 times 12.1% 8.5% 13.4% 4.9% 8.0% Five or more times ** 3.4% 1.6% 2.4% ** ** = No data was submitted.
♦ Sixteen percent of the exterior customers indicated they have had their car professionally cleaned 10 or more times in the past year. While almost 80 percent stated they have not had their car detailed in the past year.
Number of times in the past year – 2005
How often in the past year have you done the following…
0 times
1-3 times
4-6 times
7-9 times
10-12 times
More than 12 times
Had your car professionally washed 26.4% 27.3% 17.9% 12.9% 7.6% 7.9% Washed your car at home 41.1% 36.5% 14.7% 3.1% 1.9% 2.7% Had your car detailed 80.4% 17.3% 1.7% * * * Had your car lubed 19.3% 45.7% 28.1% 3.9% 1.9% 1.1% * = Less than 0.5% responses.
♦ Exterior customers tend to spend $5.50 or less at self-service car washes (72.1%), $2.51 to $6.50 at stationary automatic
shops (59.4%), $4.51 to$7.50 at exterior washes (43.7%) and $8.51 to $25.50 at full-service conveyor washes (64.9%). In comparison, exterior customers are not likely to spend more than $15.50 at exterior, stationary automatic or self-service car washes.
2005
Cost Spent for Professional Washing
Full-service wash
Exterior wash
Stationary automatic wash
Self-service wash
$2.50 or less 1.4% 4.1% 2.7% 17.9% $2.51 to $4.50 1.4% 10.0% 18.2% 31.3% $4.51 to $5.50 4.3% 15.9% 21.4% 22.9% $5.51 to $6.50 3.6% 15.4% 19.8% 9.5% $6.51 to $7.50 7.2% 12.4% 17.1% 3.0% $7.51 to $8.50 9.8% 11.5% 8.0% 2.5% $8.51 to $10.50 16.7% 11.3% 4.8% 5.5% $10.51 to $15.50 27.2% 8.0% 4.3% 1.0% $15.51 to $25.50 21.0% 3.5% 2.1% 3.5% More than $25.50 7.2% 7.8% 1.6% 3.0%
2005 International Carwash Association Study of Consumer Car Washing Attitudes and Habits All rights reserved © August 2005
-49-

Stationary Automatic Customer Results
International Carwash Association Serving the Professional Car Care Industry

Stationary Automatic Customer Results
Overview This section examines stationary automatic customers’ response to the consumer survey. Stationary automatic customers are those respondents who indicated they most often use a stationary automatic wash to clean their car(s). A stationary automatic wash automatically cleans a car but the car does not move. The figures presented in this section are not weighted.
Most Often Stationary Automatic Customers
14% 13% 13%
0%
25%
50%
75%
100%
2005 2002 1999
Demographic Characteristics ♦ The following table shows the gender of stationary automatic customers by region. In general, most stationary automatic
customers are female, except for those living in the Middle Atlantic region.
Regions – 2005 Gender
Overall
New
England
Middle Atlantic
East North
Central
West North
Central
South
Atlantic
East South
Central
West South
Central
Mountain
Pacific Male 38.4% 37.5% 54.9% 44.2% 35.2% 34.1% 35.6% 33.8% 35.2% 44.7% Female 61.6% 62.5% 45.1% 55.8% 64.8% 65.9% 64.4% 66.2% 64.8% 55.3% ♦ The following table shows the head of household age of stationary automatic customers by region. Stationary automatic
customers are least likely to be under 30 years old.
Regions – 2005 Head of Household Age
Overall
New
England
Middle Atlantic
East North
Central
West North
Central
South
Atlantic
East South
Central
West South
Central
Mountain
Pacific Under 30 years 9.5% 9.4% 9.8% 12.3% 13.8% 7.2% 9.2% 5.4% 8.0% 2.6% 30 to 39 years 21.9% 25.0% 25.5% 25.5% 24.8% 18.1% 24.1% 17.6% 18.2% 13.2% 40 to 49 years 22.9% 28.1% 23.5% 28.3% 18.6% 18.1% 26.4% 25.7% 20.5% 21.1% 50 to 59 years 22.0% 18.8% 21.6% 19.8% 22.1% 28.9% 14.9% 17.6% 22.7% 39.5% 60 years or older 23.7% 18.8% 19.6% 14.2% 20.7% 27.7% 25.3% 33.8% 30.7% 23.7%
2005 International Carwash Association Study of Consumer Car Washing Attitudes and Habits All rights reserved © September 2005
-50-

Stationary Automatic Customer Results Demographic Characteristics – continued ♦ The following table shows total annual household income for stationary automatic customers by region. The largest number
of stationary automatic customers (43.2%) had an average income between $20,000 and $59,999. The graph below compares the total annual household income in 2005 versus 2002 and 1999.
Regions
Total Annual Household Income
Overall
New
England
Middle Atlantic
East North
Central
West North
Central
South
Atlantic
East South
Central
West South
Central
Mountain
Pacific Under $20,000 13.5% 12.5% 14.0% 17.0% 11.7% 9.6% 17.2% 10.8% 14.8% 13.2% $20K to $39,999 22.9% 34.4% 12.0% 9.4% 30.3% 15.7% 27.6% 28.4% 23.9% 28.9% $40K to $59,999 20.3% 6.3% 32.0% 18.9% 23.4% 22.9% 26.4% 14.9% 15.9% 10.5% $60K to $74,999 12.2% 9.4% 10.0% 17.9% 9.0% 9.6% 10.3% 10.8% 20.5% 7.9% $75K to $99,999 16.1% 18.8% 14.0% 20.8% 15.2% 22.9% 6.9% 13.5% 15.9% 18.4% $100K to $149,999
11.7%
9.4%
14.0%
14.2%
5.5%
14.5%
8.0%
20.3%
9.1%
18.4%
$150K and over 3.3% 9.4% 4.0% 1.9% 4.8% 4.8% 3.4% 1.4% ** 2.6% ** = No data was submitted.
Total Annual Household Income - All Regions
23% 20% 16%3%
27% 21%13%
3%16%
30% 22%9% 17%
7% 2%12%12%
14% 10%13%14%
0%
25%
50%
75%
100%
2005 14% 23% 20% 12% 16% 12% 3%
2002 14% 27% 21% 13% 13% 10% 3%
1999 16% 30% 22% 9% 17% 7% 2%
Under $20,000
$20,000-$39,999
$40,000-59,999
$60,000-74,999
$75,000-99,999
$100,000-$149,999
$150,000 and over
♦ The following graph shows the population density for stationary automatic customers across study years. In both 1999 and
2005, over 50 percent of stationary automatic customers have lived in areas of over ½ million people.
Population Density
24% 22% 25% 29%31%23% 24% 23%28% 21%
30%21%
0%
25%
50%
75%
100%
2005 24% 22% 25% 29%
2002 31% 23% 24% 23%
1999 28% 21% 30% 21%
Non-MSA MSA - (to 1/2 m illion) MSA - (1/2 m illion to 2 m illion) MSA - (over 2 m illion)
2005 International Carwash Association Study of Consumer Car Washing Attitudes and Habits All rights reserved © September 2005
-51-

Stationary Automatic Customer Results Demographic Characteristics – continued ♦ For each region, the following table shows the primary vehicle that is driven and washed most often by stationary automatic
customers. In addition to driving a car, stationary automatic customers are more likely to drive a SUV than a truck or van. In the South Atlantic region, however, stationary automatic customers are more likely to drive a van than a SUV or a truck.
Regions – 2005 Primary
Vehicle Driven & Washed Most Often
Overall
New
England
Middle Atlantic
East North
Central
West North
Central
South
Atlantic
East South
Central
West South
Central
Mountain
Pacific Car 54.9% 68.8% 52.9% 52.4% 56.9% 60.2% 50.6% 56.8% 48.3% 54.1% Van 12.7% 6.3% 13.7% 13.3% 13.9% 20.5% 11.5% 4.1% 12.6% 13.5% Truck 11.1% 6.3% 11.8% 9.5% 11.8% 3.6% 16.1% 12.2% 14.9% 10.8% SUV 21.3% 18.8% 21.6% 24.8% 17.4% 15.7% 21.8% 27.0% 24.1% 21.6%
Primary Vehicle Driven & Washed Most OftenOverall 2005
SUV21%
Truck11%
Car55%
Van13%
♦ The following table shows the number of miles driven per week for stationary automatic customers in each region. Overall,
more stationary automatic customers drive 51 to 100 miles per week than any other category. Interestingly, stationary automatic customers living in the Pacific region are more likely to drive between 101 and 200 miles per week.
Regions – 2005
Number of Miles Driven Per Week
Overall
New
England
Middle Atlantic
East North
Central
West North
Central
South
Atlantic
East South
Central
West South
Central
Mountain
Pacific 50 miles or less 19.6% 21.9% 13.7% 23.5% 18.1% 19.3% 18.6% 8.2% 30.7% 19.4% 51 to 100 miles 33.8% 31.3% 35.3% 28.4% 35.4% 31.3% 39.5% 34.2% 35.2% 30.6% 101 to 200 miles 23.3% 15.6% 17.6% 20.6% 20.8% 30.1% 24.4% 34.2% 14.8% 36.1% 201 to 300 miles 13.2% 28.1% 19.6% 16.7% 11.1% 8.4% 11.6% 12.3% 13.6% 5.6% 301 to 500 miles 7.1% 3.1% 7.8% 8.8% 10.4% 9.6% 3.5% 6.8% 4.5% ** More than 500 miles
3.0%
**
5.9%
2.0%
4.2%
1.2%
2.3%
4.1%
1.1%
8.3%
** = No data was submitted.
2005 International Carwash Association Study of Consumer Car Washing Attitudes and Habits All rights reserved © September 2005
-52-

Stationary Automatic Customer Results Demographic Characteristics – continued ♦ The following table shows the household size of stationary automatic customers by region. Stationary automatic customers
are more likely to live in two-person households (40.3%), while they are least likely to live in a household with five or more (8.2%).
Regions – 2005
Household Size
Overall
New
England
Middle Atlantic
East North
Central
West North
Central
South
Atlantic
East South
Central
West South
Central
Mountain
Pacific One 24.0% 31.3% 21.6% 19.8% 28.3% 24.1% 18.4% 21.6% 23.9% 34.2% Two 40.3% 28.1% 37.3% 37.7% 40.0% 48.2% 42.5% 40.5% 42.0% 36.8% Three 15.9% 15.6% 25.5% 18.9% 11.0% 9.6% 19.5% 18.9% 15.9% 13.2% Four 11.5% 18.8% 5.9% 15.1% 11.7% 12.0% 13.8% 10.8% 6.8% 7.9% Five or more 8.2% 6.3% 9.8% 8.5% 9.0% 6.0% 5.7% 8.1% 11.4% 7.9%
Household Size
24%
40%
16% 12% 8%
29%38%
14% 11% 8%
25%37%
15% 15% 9%
0%
25%
50%
75%
100%
2005 24% 40% 16% 12% 8%
2002 29% 38% 14% 11% 8%
1999 25% 37% 15% 15% 9%
One Two Three Four Five or m ore
♦ Stationary automatic customers are least likely to be separated or widowed. Across study years, more than half of the
stationary automatic customers surveyed were married and less than a quarter have never been married.
M arital S tatus
62%
7%13%
1%
17%
59%
8%15%
2%16%
62%
9% 12%1%
16%
0%
25%
50%
75%
100%
2005 62% 7% 13% 1% 17%
2002 59% 8% 15% 2% 16%
1999 62% 9% 12% 1% 16%
M arried W idowed D ivorced Separated N ever M arried
2005 International Carwash Association Study of Consumer Car Washing Attitudes and Habits All rights reserved © September 2005
-53-

Stationary Automatic Customer Results Type of Washing ♦ Across study years, customers are least likely to ever use exterior washes.
Type of Car Washes Ever Used by Stationary Automatic Customers
79%
42% 41%
100%
60%76%
43% 38%
100%
58%
83%
52%44%
100%
64%
0%
25%
50%
75%
100%
2005 79% 42% 41% 100% 60%
2002 76% 43% 38% 100% 58%
1999 83% 52% 44% 100% 64%
Home wash Full-service wash Exterior wash Stationary automatic wash Self-service wash
Regions – 2005
Car Wash Ever Used
New
England
Middle Atlantic
East North
Central
West North
Central
South
Atlantic
East South
Central
West South
Central
Mountain
Pacific Home wash 71.9% 86.3% 84.0% 70.3% 83.1% 79.3% 78.4% 78.4% 84.2% Full-service wash 40.6% 35.3% 48.1% 41.4% 51.8% 28.7% 41.9% 44.3% 44.7% Exterior wash 53.1% 52.9% 50.9% 41.4% 41.0% 27.6% 23.0% 42.0% 39.5% Stationary automatic wash
100.0%
100.0%
100.0%
100.0%
100.0%
100.0%
100.0%
100.0%
100.0%
Self-service wash 46.9% 74.5% 55.7% 62.8% 48.2% 60.9% 68.9% 72.7% 28.9% ♦ Most stationary automatic customers (79.8%) indicated that they had most recently used a stationary automatic wash.
Regions – 2005 Car Wash Recently Used
Overall
New
England
Middle Atlantic
East North
Central
West North
Central
South
Atlantic
East South
Central
West South
Central
Mountain
Pacific Home wash 5.8% 7.1% 4.0% 3.1% 3.7% 2.6% 9.6% 5.9% 8.4% 15.2% Full-service wash 3.4% 3.6% 6.0% 4.1% 3.0% 2.6% 1.2% 4.4% 2.4% 6.1% Exterior wash 3.8% 14.3% 8.0% 3.1% 3.7% 5.2% 3.6% ** 2.4% ** Stationary automatic wash
79.8%
67.9%
66.0%
82.7%
80.7%
89.6%
80.7%
80.9%
77.1%
78.8%
Self-service wash 7.2% 7.1% 16.0% 7.1% 8.9% ** 4.8% 8.8% 9.6% ** ** = No data was submitted.
2005 International Carwash Association Study of Consumer Car Washing Attitudes and Habits All rights reserved © September 2005
-54-

Stationary Automatic Customer Results Washing Attitudes Shown below are stationary automatic customer ratings of different types of car washes. Respondents were first asked to rate the importance of several factors in their selection of a car wash. The factors were: ♦ Quality of wash ♦ Less work ♦ Faster overall ♦ Conveniently located ♦ Ease of use ♦ Environmentally safe ♦ Safety of your car’s exterior ♦ Value (quality of wash for money spent) Of all the factors rated for importance in selection of a car wash, quality of the wash earned the highest overall mean score of 4.58 (90.8% top-two box net) in 2005 and a 4.54 mean score (91.1% top-two box net) in 2002. In comparison, *convenience was most important to stationary automatic customers in 1999 (mean score = 4.58, 94.6% top-two box net) . Mean scores were determined by totaling the point value a factor received and dividing by the number of responses.
Overall Top-Two Box Net on Selection Factors
91%79%
50%
89%83%
89%
63%65%
83%
64%83% 87%87%91% 78%95%
78%84%86%
85%
0%
25%
50%
75%
100%
2005 91% 65% 63% 79% 83% 50% 89% 89%
2002 91% 72% 64% 83% 89% 83% 87% 87%
1999 85% - 78% 95% - 78% 86% 84%
Quality of wash Less work Faster overall *Conveniently
located Ease of use Environmen-tally safe
Safety of your car's exterior Value
- -
Most Often Stationary Automatic Customers’ Importance Rating Aspects of Car Wash
(In Mean Rank Order Based on 2005) Mean - 2005 Mean - 2002 Mean - 1999 Quality of wash 4.58 4.54 4.26 Safety of your car’s exterior 4.46 4.45 4.29 Value 4.40 4.39 4.21 Ease of use 4.26 4.36 - *Conveniently located 4.13 4.20 4.58 Less work 3.82 4.03 - Faster overall 3.73 3.85 - Environmentally safe 3.48 - - Rating scale: 1 to 5 where 5 = “Very Important” and 1 = “Not very/Not at all Important.” - = Not Applicable.
*In the 1999 survey, the selection factor “conveniently located” was defined only as “convenience.” Note: The percentages shown represent the Top-Two Box Net score, the percentage of respondents rating the factor a “4” or “5.”
2005 International Carwash Association Study of Consumer Car Washing Attitudes and Habits All rights reserved © September 2005
-55-

Stationary Automatic Customer Results Washing Attitudes – continued The table below compares stationary automatic customer’s perception of the importance in comparison with the delivery of these factors since 1999. ♦ In addition to quality of wash, stationary automatic customers are most satisfied with the ease of use professional car washes
offer. In addition, they feel that full-service washes and stationary automatic washes require less work, but that stationary automatic washes are faster overall and easiest to use. They are least satisfied with the location of full-service shops and the value (for the money spent) that full-service, exterior and self-service washes provide.
Most Often Stationary Automatic Customers’ Delivery Ratings of…
Selection Factors (Top-Two Box Net)
Importance of Car Wash Selection Factors to Most Often Stationary auto. Customers
Home wash
Full-service wash
Exterior wash
Stationary automatic
wash
Self-service wash
Quality of wash 2005 90.8% 82.3% 91.5% 76.1% 76.4% 67.3% 2002 91.1% 48.9% 36.8% 42.9% 70.7% 57.0% 1999 84.9% 84.8% 86.8% 75.0% 70.7% 68.8%
Less work 2005 65.3% 7.3% 93.0% 86.4% 91.6% 14.4% 2002 71.5% 76.3% 67.5% 76.7% 90.7% 81.7% 1999 - - - - - -
Faster overall 2005 62.6% 9.8% 66.3% 80.9% 90.7% 21.3% 2002 64.0% 72.6% 65.1% 68.3% 90.2% 78.6% 1999 77.6% 18.2% 53.7% 66.1% 95.3% 34.3%
*Conveniently located 2005 78.8% 86.2% 43.2% 54.2% 86.4% 62.2% 2002 83.1% 55.4% 60.1% 59.3% 84.9% 64.6% 1999 94.6% 30.3% 70.4% 70.0% 97.9% 35.7%
Ease of use 2005 83.4% 46.5% 84.9% 84.5% 93.8% 48.1% 2002 88.5% 75.8% 74.5% 74.5% 93.9% 84.9% 1999 - - - - - -
Environmentally safe 2005 50.4% 53.8% 51.1% 47.1% 57.8% 38.2% 2002 - - - - - - 1999 - - - - - -
Safety of car’s exterior 2005 89.0% 85.7% 67.4% 60.6% 74.7% 71.5% 2002 87.2% 45.7% 47.3% 44.4% 74.0% 53.9% 1999 85.8% 92.3% 59.8% 49.7% 72.3% 72.2%
Value 2005 88.6% 85.0% 43.6% 52.5% 76.8% 55.3% 2002 86.9% 41.3% 42.9% 39.7% 71.1% 41.3% 1999 83.7% 82.1% 35.6% 36.7% 72.5% 49.2%
Rating scale: 1 to 5 where 5 = “Excellent” and 1 = “Poor.” - = Not Applicable. *In the 1999 survey, the selection factor “conveniently located” was defined only as “convenience.” Note: Top-Two Box Net is the percentage of respondents who rated the factor a “4” or “5.”
2005 International Carwash Association Study of Consumer Car Washing Attitudes and Habits All rights reserved © September 2005
-55-

Stationary Automatic Customer Results Washing Attitudes – continued A list of additional services was provided in the survey. From this list, respondents were asked to choose three additional services they would like offered at the same location as a car wash in order of importance. ♦ Overall, stationary automatic customers ranked gas station (mean = 1.51) highest amongst the additional services listed.
Regional results also indicate that adding a gas station is the most important profit center for stationary automatic customers, except to those living in the Middle Atlantic, West North Central and South Atlantic regions. Stationary automatic customers in the Middle Atlantic (see regional map on page 13) ranked other additional services first (1.00) and in the West North Central and South Atlantic regions offering dry cleaning was ranked first (1.50). The means in the table below are not weighted.
Regions Additional
Services (In Mean Rank Order Based on Overall)
Overall
New
England
Middle Atlantic
East North
Central
West North
Central
South
Atlantic
East South
Central
West South
Central
Mountain
Pacific
Gas station 1.51 1.35 1.34 1.60 1.37 1.62 1.69 1.60 1.45 1.50 Express detailing
1.86
1.92
1.85
1.96
1.94
1.90
1.77
1.86
1.65
1.75
Dry cleaner 2.00 1.50 3.00 2.00 1.00 1.50 2.00 2.43 ** 2.00 Convenience store
2.02
2.21
2.00
2.15
2.11
2.06
1.93
1.67
1.93
2.00
Oil change/Quick lube
2.02
2.33
2.06
1.83
2.24
1.96
1.91
2.00
1.97
2.15 Paintless dent-repair
2.10
2.20
2.00
2.08
2.33
1.75
2.13
2.29
2.00
2.00
ATM 2.13 1.86 2.25 1.96 2.24 2.13 2.00 2.27 2.38 1.86 Windshield repair
2.28
**
3.00
2.60
2.60
2.33
2.00
1.75
2.31
1.50
Water dispenser 2.39 2.00 2.00 2.50 2.40 2.75 2.38 1.80 3.00 2.75 Tune up 2.40 2.00 3.00 2.33 2.14 2.67 2.43 2.50 2.33 2.50 Other 2.40 3.00 1.00 2.00 2.60 1.67 3.00 3.00 2.83 1.50 Brakes 2.41 ** 2.00 2.29 2.60 1.50 2.55 ** 2.50 3.00 Propane gas 2.41 ** 2.50 2.33 1.50 3.00 3.00 3.00 3.00 2.33 Quick-service restaurant
2.44
2.38
2.86
2.29
2.41
2.43
2.41
2.25
2.55
2.67
Gift shop 2.55 ** 2.50 2.00 2.60 3.00 2.40 2.78 3.00 2.00 Truck rental 3.00 ** 3.00 3.00 ** 3.00 ** ** ** 3.00 Rating scale: “1” = First choice, “2” = Second choice, “3” = Third choice. ** = No data was submitted.
2005 International Carwash Association Study of Consumer Car Washing Attitudes and Habits All rights reserved © September 2005
-56-

Stationary Automatic Customer Results Washing Attitudes – continued ♦ In 2005, spot-free rinse was chosen by the greatest number of stationary automatic customers as an extra service that would
be a factor in their car-wash selection, followed by under body wash.
Im p o r t a n c e o f E x t r a S e r v ic e s t o S t a t io n a r y A u t o m a t ic C u s t o m r s
2 5 %
3 9 %4 5 %
7 3 %
9 % 9 % 1 2 %5 %
6 1 %6 8 %
6 1 %
4 7 %2 7 %
9 %
6 8 %
6 %
5 8 %
4 5 %8 %3 4 %
0 %
2 5 %
5 0 %
7 5 %
1 0 0 %
2 0 0 5 2 5 % 3 9 % 4 5 % 6 1 % 4 % 7 3 % 9 %
2 0 0 2 2 7 % 4 2 % 4 7 % 6 1 % 5 % 6 8 % 9 %
1 9 9 9 3 4 % 3 8 % 4 5 % 5 8 % 6 % 6 8 % 9 %
In te r io r v a c u u m in g
W h e e l/h u b c ap c le a n in g
W a x /p a in t p r o te c ta n t
c o a t in g
U n d e r b o d y w a s h
C a r p e t s h a m p o o in g
S p o t - f r e e r in s e
H a n d w a x /p ro te c ta
n t
H a nd
6%
- = Not Applicable. The following table shows the importance for stationary automatic customers of having different parcleaned or dried. This is compared with the mean score for how stationary automatic customers ratservices. Stationary automatic customers rated having a thoroughly clean car body and a thoroughmost important factors in judging the quality of a car wash.
2005 2002 Importance Rating of Thoroughly Cleaned or Dried Part (In Mean Rank Order Based on 2005)
Overall
Mean Score
Top-Two Box Net
Overall
Mean Score
Top-Two Box Net
Car body 4.75 97.4% 4.79 95.0% Windshield 4.70 94.7% 4.74 94.0% Windows 4.67 94.4% 4.68 92.4% Wheels 3.90 67.6% 3.89 67.1% Car thoroughly dried after wash 3.54 55.9% 3.53 53.3% Front dash/console 3.16 40.7% 3.13 38.3% Mats/carpet 3.11 38.1% 3.12 36.3% *the entire car - - - - Rating scale: 1 to 5, where 5 = “Very Important” and 1 = “Not very/Not at all Important.”
2005 2002 Delivery Rating of Thoroughly Cleaned or Dried Part (In Mean Rank Order Based on 2005)
Overall Mean Score
Top-Two Box Net
Overall Mean Score
Top-Two Box Net
Windshield 4.23 82.3% 4.18 79.9% Windows 4.19 80.7% 4.15 78.9% Car body 4.12 80.2% 4.07 76.2% Wheels 3.59 55.5% 3.45 51.2% Car thoroughly dried after wash 2.99 35.8% 2.86 32.6% Mats/carpet 2.09 16.1% 1.98 14.4% Front dash/console 2.08 16.7% 1.91 12.4% *the entire car - - - - Rating scale: 1 to 5, where 5 = “Excellent” and 1 = “Poor.”
- = Not Applicable. Note: The number in parenthesis is the “Top-Two Box Net,” i.e. the percentage of respondents who rated th
2005 International Carwash Association Study of Consumer Car Washing Attitudes and Habits All rights reserved © September 2005
e
338%
1 6 %1 3 % 1 2 %1 5 %2 1 %1 9 %
1 2 % 1 6 % 2 1 %
1 3 % 1 3 % 1 2 %
1 9 % - 1 5 %
d to w e l r y in g
T r ip le c o p r o te c ta
( f o a m )
N o n e o f t h e s e a r e im p o r ta n t
lo rn t-
13%
ts of their car thoroughly ed the delivery of these ly clean windshield as the
1999
Overall Mean Score
Top-Two Box Net
4.75 97.3% 4.74 95.1% 4.66 94.1% 3.68 58.0%
- - 3.14 38.0% 3.09 36.6% 3.44 49.4%
1999 Overall
Mean Score Top-Two Box Net
- - 4.01 74.2% 4.05 76.4% 3.45 50.3%
- - 2.17 18.3% 2.17 19.2% 2.82 31.9%
e factor a “4” or “5.”
-57-

Stationary Automatic Customer Results Washing Attitudes – continued ♦ Across study years, stationary automatic customers indicated that the biggest influence over whether they might go to a
professional car wash is for a discounted/free wash with gas purchase. It is important to note that the influence of offering a discounted or free wash with a gas purchase has diminished since 1999 (4.00 in 1999 and 3.73 in 2002).
2005 2002 1999
Factors Influencing Decision to Use Car Wash (In Mean Rank Order Based on 2005)
Mean
Top-Two Box Net
Mean
Top-Two Box Net
Mean
Top-Two Box Net
A discounted or free wash is given with a gas purchase 3.66 62.8% 3.73 67.9% 4.00 79.7% Special prices/discount coupons 3.58 60.0% 3.63 64.9% 3.74 66.9% For a special occasion such as a wedding, a holiday, etc.
3.56
58.1%
3.51
56.2%
3.91
73.5%
Appearance of car wash 3.44 50.6% 3.35 49.9% - - On impulse 3.17 41.8% 3.11 38.8% 3.17 42.9% Discounted gas is given with a car wash purchase 3.12 46.6% 3.11 46.8% - - The car wash offers extra services (i.e., Interior vacuuming, Wheel/hubcap cleaning)
2.99
38.1%
3.04
42.0%
2.76
33.8%
Allows me to pay with credit/debit card 2.84 38.7% 2.47 29.3% - - Self-pay kiosk 2.84 34.7% - - - - Environmentally safe to wash my car 2.76 27.8% 2.69 25.9% - - Frequent washer discount 2.75 32.3% 2.73 32.5% 2.97 39.3% Recommendation of a friend 2.53 26.0% 2.47 22.8% 2.81 33.2% Prepaid for multiple car washes at a discounted price 2.51 24.5% 2.40 22.6% - - Free/discounted oil change 2.41 23.3% 2.36 22.7% 2.69 33.4% Recognized carwash name/use of brand name products
2.33
17.8%
2.34
18.0%
2.53
23.4%
Advertisements 2.23 14.5% 2.28 16.0% 2.46 18.5% Rating scale: 1 to 5, where 5 = “A great deal of influence” and a 1 = “Little or no influence.” - = Not applicable.
Note: Top-Two Box Net is the percentage of respondents who rated the factor a “4” or “5.”
♦ While stationary automatic customers continue to feel that car washing was safer for the environment, the percentage feeling
so decreased by 9.8 percentage points since 2002. The largest number of stationary automatic customers felt home washing was a lower cost (82.5%), safer for the car (75.7%) and a better overall value (71.4%). The smallest number of stationary automatic customers felt home washing was less work (1.7%) and faster (overall process) (4.5 percent).
2005 2002 1999 Which is better in the following
areas? Home Wash Car Wash Home Wash Car Wash Home Wash Car Wash Safer for the environment 46.4% 46.9% 43.3% 56.7% 43.2% 47.8% Safer for the car 75.7% 19.7% 75.1% 24.9% 76.5% 18.2% A better overall quality of wash 57.5% 39.9% 52.0% 48.0% 65.2% 31.2% A better overall value 71.4% 24.9% 65.4% 34.6% 71.1% 24.3% More convenient (location) 23.7% 74.7% 16.3% 83.7% 10.2% 10.1% A lower cost 82.5% 13.9% 84.4% 15.6% 82.6% 14.1% More enjoyable 19.7% 76.1% 17.8% 82.2% 15.9% 78.3% Faster overall 4.5% 92.9% 2.5% 97.5% 2.0% 96.0% Less work 1.7% 96.2% 1.5% 98.5% 1.0% 97.4%
Note: Figures will not equal 100% in 1999 and 1996 because “no responses” were analyzed.
2005 International Carwash Association Study of Consumer Car Washing Attitudes and Habits All rights reserved © September 2005
-58-

Stationary Automatic Customer Results Washing Attitudes – continued ♦ It can be determined by the bar graph below that stationary automatic customers are influenced mainly by price.
Stationary Automatic Customers Would Use Car Wash More Frequently, If...
70%
45%
19%
79%
19% 24% 19%
74%
52%
19%
80%
-
64%
38%
14%
82%
- -0%
25%
50%
75%
100%
2005 70% 45% 19% 79% 19% 24% 19%
2002 74% 52% 19% 80% - 17% 16%
1999 64% 38% 14% 82% - - -
Coupons Frequent washer club VIP treatment Lower cost Self-pay kiosk If I had more
timeIf it took less
time
-
- = Not Applicable. Washing Habits ♦ More stationary automatic customers reported using professional car washes with spray wash than with cloth wash across
study years. However, stationary automatic customers using stationary automatic washes utilized spray wash 5 percent less in 2002 than in 1999. It should be noted, though, that stationary automatic customers used spray wash 3 percent more in 2005 than in 2002.
2005 2002 1999
Type of wash
Full-service wash
Exterior
wash
Stationary automatic
wash
Full-service wash
Exterior
wash
Stationary automatic
wash
Full-service wash
Exterior
wash
Stationary automatic
wash Spray wash 47.1% 49.8% 65.9% 49.5% 63.4% 62.5% 47.1% 58.8% 67.3% Cloth wash 31.6% 31.2% 15.8% 35.2% 29.9% 17.5% 35.9% 30.2% 23.3% Hand wash 4.7% 1.1% - 4.4% 0.6% - 6.3% 0.5% - No response 16.5% 17.9% 18.3% 10.9% 6.1% 20.0% 10.8% 10.6% 9.5% - = Not Applicable.
2005 International Carwash Association Study of Consumer Car Washing Attitudes and Habits All rights reserved © September 2005
-59-
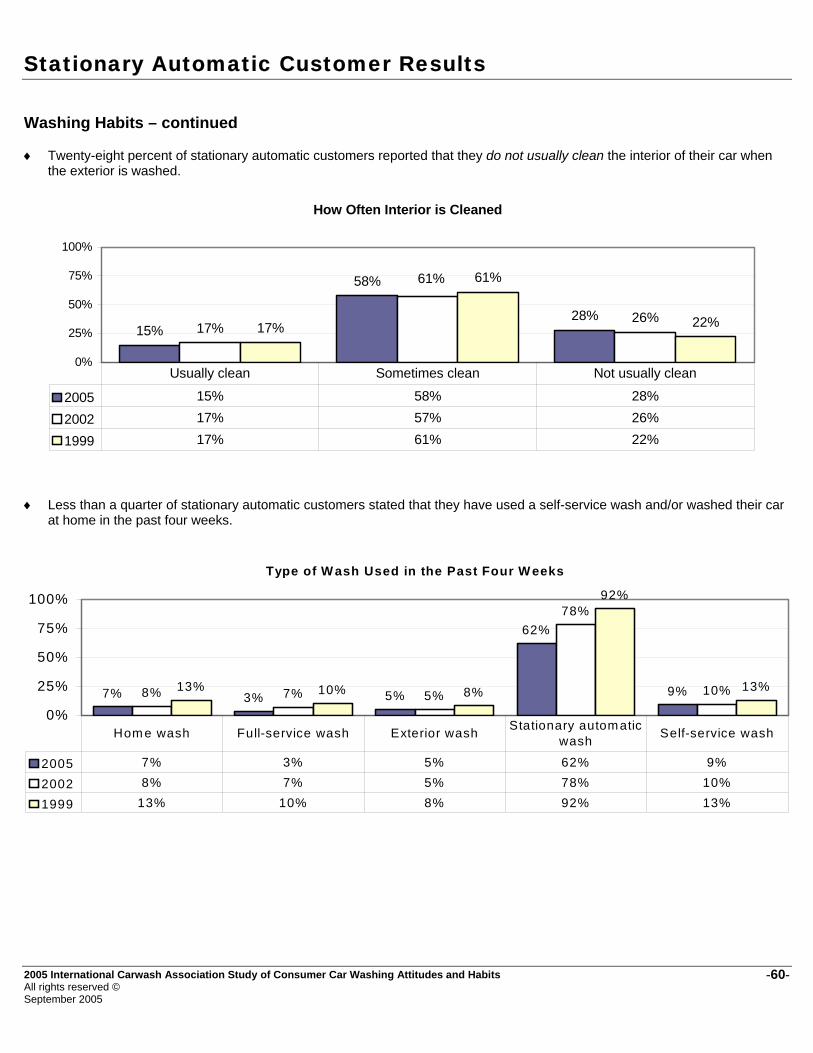
Stationary Automatic Customer Results Washing Habits – continued ♦ Twenty-eight percent of stationary automatic customers reported that they do not usually clean the interior of their car when
the exterior is washed.
How Often Interior is Cleaned
15%28% 26%
17%
61%
22%
58%
17%
0%
25%
50%
75%
100%
2005 15% 58% 28%
2002 17% 57% 26%
1999 17% 61% 22%
Usually clean Sometimes clean Not usually clean
61%
♦ Less than a quarter of stationary automatic customers stated that they have used a self-service wash and/or washed their car at home in the past four weeks.
Type of W ash Used in the Past Four W eeks
7% 3% 5%
62%
9%8% 7% 5%
78%
10%13% 10% 8%
92%
13%
0%
25%
50%
75%
100%
2005 7% 3% 5% 62% 9%
2002 8% 7% 5% 78% 10%
1999 13% 10% 8% 92% 13%
Home wash Full-service wash Exterior wash Stationary automatic wash Self-service wash
2005 International Carwash Association Study of Consumer Car Washing Attitudes and Habits All rights reserved © September 2005
-60-

Stationary Automatic Customer Results Washing Habits – continued ♦ The table below shows how often stationary automatic customers had their car washed in the past four weeks (i.e., February
of 2005).
Types of car washes used in past four weeks How often in the past four (4) weeks stationary automatic customers have washed their car at…
Home wash
Full-service wash
Exterior wash
Stationary automatic
wash
Self-service
wash One time 70.0% 83.3% 71.4% 50.3% 69.8% Two times 18.0% 16.7% 22.9% 33.6% 20.6% 3 – 4 times 10.0% ** 5.7% 15.6% 9.5% Five or more times 2.0% ** ** 0.5% ** ** = No data was submitted.
♦ Less than 10 percent of stationary automatic customers indicated they have had their car professionally cleaned seven or
more times in the past year. While more than 80 percent stated they have not had their car detailed in the past year.
Number of times in the past year – 2005 How often in the past year have you done the following…
0 times
1-3 times
4-6 times
7-9 times
10-12 times
More than 12 times
Had your car professionally washed 56.0% 25.6% 9.7% 4.3% 1.6% 2.8% Washed your car at home 39.3% 38.1% 13.3% 3.9% 2.8% 2.5% Had your car detailed 82.1% 15.8% 1.2% * * 0.5% Had your car lubed 20.7% 43.8% 29.2% 4.2% 1.3% 0.7% * = Less than 0.5 percent represented. ** = No data was submitted.
♦ The table below shows how much stationary automatic customers typically spend when getting their car professionally
washed at the following four car wash types.
2005 Cost Spent for Professional Washing
Full-service wash
Exterior wash
Stationary automatic wash
Self-service wash
$2.50 or less 1.5% 3.4% 4.3% 14.5% $2.51 to $4.50 0.5% 5.4% 13.5% 28.4% $4.51 to $5.50 4.1% 13.8% 18.7% 22.5% $5.51 to $6.50 4.1% 13.3% 18.1% 10.4% $6.51 to $7.50 2.5% 13.3% 15.2% 4.7% $7.51 to $8.50 8.6% 14.8% 9.7% 3.8% $8.51 to $10.50 11.2% 14.8% 3.6% 4.7% $10.51 to $15.50 29.4% 10.8% 3.3% 4.4% $15.51 to $25.50 29.4% 8.4% 4.8% 3.0% More than $25.50 8.6% 2.0% 8.9% 3.6%
2005 International Carwash Association Study of Consumer Car Washing Attitudes and Habits All rights reserved © September 2005
-61-

Self-service Customer Results
International Carwash Association Serving the Professional Car Care Industry

Self-Service Customer Results Overview This section examines self-service customers’ response to the consumer survey. Self-service customers are those respondents who indicated they most often use a self-service coin-operated car wash to wash their car(s). Self-service shops are car wash facilities where customers wash their car themselves by using coin-operated washing equipment. Please note, data presented in this section is not weighted.
Most Often Self-Service Customers
15% 14% 14% 15%
0%
25%
50%
75%
100%
2005 2002 1999 1996
Demographic Characteristics ♦ The following table shows the gender for self-service customers by region. Overall, more self-service customers are female
than male.
Regions – 2005 Gender
Overall
New
England
Middle Atlantic
East North
Central
West North
Central
South
Atlantic
East South
Central
West South
Central
Mountain
Pacific Male 45.3% 56.3% 45.0% 45.9% 42.5% 45.2% 47.3% 41.7% 44.3% 56.4% Female 54.7% 43.8% 55.0% 54.1% 57.5% 54.8% 52.7% 58.3% 55.7% 43.6% ♦ The following table shows the head of household age for self-service customers by region. Self-service customers are most
likely to be 50 years and older, with 39 percent of self-service washers falling in this age range.
Regions – 2005 Head of Household Age
Overall
New
England
Middle Atlantic
East North
Central
West North
Central
South
Atlantic
East South
Central
West South
Central
Mountain
Pacific Under 30 years 13.8% 6.3% 8.8% 23.5% 15.6% 8.2% 13.5% 14.2% 15.1% 10.3% 30 to 39 years 22.4% 28.1% 25.0% 17.6% 28.9% 27.4% 31.1% 15.0% 17.9% 10.3% 40 to 49 years 24.5% 34.4% 23.8% 21.2% 23.0% 27.4% 23.0% 23.6% 27.4% 23.1% 50 to 59 years 20.1% 12.5% 21.3% 17.6% 14.1% 19.2% 20.3% 28.3% 20.8% 23.1% 60 years or older 19.2% 18.8% 21.3% 20.0% 18.5% 17.8% 12.2% 18.9% 18.9% 33.3%
2005 International Carwash Association Study of Consumer Car Washing Attitudes and Habits All rights reserved © August 2005
-63-

Self-Service Customer Results Demographic Characteristics – continued ♦ The following table shows the total annual household income for self-service customers by region. More self-service
customers (53.6%) have an average income of less then $39,999 than those that gross more than $40K (46.3%).
Regions – 2005 Total Annual Household Income
Overall
New
England
Middle Atlantic
East North
Central
West North
Central
South
Atlantic
East South
Central
West South
Central
Mountain
Pacific Under $20,000 24.8% 18.8% 29.1% 24.7% 21.5% 23.6% 36.5% 26.8% 20.8% 17.9% $20K to $39,999 28.8% 25.0% 25.3% 21.2% 35.6% 26.4% 31.1% 26.0% 34.0% 28.2% $40K to $59,999 20.2% 25.0% 27.8% 21.2% 20.0% 18.1% 14.9% 16.5% 21.7% 20.5% $60K to $74,999 7.5% 9.4% 1.3% 12.9% 9.6% 8.3% 2.7% 10.2% 5.7% 2.6% $75K to $99,999 9.6% 15.6% 11.4% 7.1% 6.7% 8.3% 6.8% 12.6% 10.4% 12.8% $100K to $149,999
7.3%
6.3%
2.5%
10.6%
5.9%
13.9%
6.8%
6.3%
4.7%
15.4%
$150K and over 1.7% ** 2.5% 2.4% 0.7% 1.4% 1.4% 1.6% 2.8% 2.6% ** = No data was submitted. ♦ The following table shows the population density for self-service customers by region. Forty-seven percent of self-service
customers live in areas of one half a million people or more.
Regions – 2005 Population Density
Overall
New
England
Middle Atlantic
East North
Central
West North
Central
South
Atlantic
East South
Central
West South
Central
Mountain
Pacific Non-MSA* 29.8% 18.8% 23.8% 32.9% 47.4% 23.3% 41.9% 25.2% 21.7% 10.3% MSA (to ½ mil.) 23.4% 21.9% 21.3% 17.6% 22.2% 28.8% 27.0% 21.3% 26.4% 28.2% MSA (½ mil. to 2 mil.)
21.8%
31.3%
22.5%
16.5%
19.3%
12.3%
28.4%
30.7%
21.7%
10.3%
MSA (over 2 mil.) 24.9% 28.1% 32.5% 32.9% 11.1% 35.6% 2.7% 22.8% 30.2% 51.3% *MSA – Metropolitan Statistical Area ♦ The following table shows the primary vehicle that is driven and washed most often for self-service customers by region.
Other than a car, more self-service customers’ drive and wash a truck or a SUV more often than a van.
Regions – 2005 Primary Vehicle Driven & Washed Most Often
Overall
New
England
Middle Atlantic
East North
Central
West North
Central
South
Atlantic
East South
Central
West South
Central
Mountain
Pacific Car 55.9% 62.5% 57.5% 53.6% 57.0% 69.9% 56.8% 50.4% 47.2% 61.5% Van 9.1% 6.3% 2.5% 13.1% 11.1% 12.3% 6.8% 11.0% 6.6% 7.7% Truck 17.2% 9.4% 10.0% 14.3% 18.5% 6.8% 27.0% 23.6% 20.8% 10.3% SUV 17.9% 21.9% 30.0% 19.0% 13.3% 11.0% 9.5% 15.0% 25.5% 20.5%
2005 International Carwash Association Study of Consumer Car Washing Attitudes and Habits All rights reserved © August 2005
-64-

Self-Service Customer Results Demographic Characteristics – continued ♦ The following table shows the number of miles driven per week for self-service customers by region.
Regions – 2005 Number of Miles Driven Per Week
Overall
New
England
Middle Atlantic
East North
Central
West North
Central
South
Atlantic
East South
Central
West South
Central
Mountain
Pacific 50 miles or less 21.3% 12.5% 24.1% 14.5% 23.0% 19.2% 17.8% 18.1% 33.3% 20.5% 51 to 100 miles 33.8% 12.5% 34.2% 42.2% 31.9% 35.6% 34.2% 37.0% 29.5% 35.9% 101 to 200 miles 25.7% 50.0% 26.6% 25.3% 23.7% 23.3% 27.4% 25.2% 22.9% 23.1% 201 to 300 miles 10.1% 21.9% 8.9% 9.6% 11.1% 6.8% 12.3% 9.4% 8.6% 7.7% 301 to 500 miles 6.6% 3.1% 5.1% 7.2% 6.7% 11.0% 5.5% 8.7% 1.9% 10.3% More than 500 miles
2.5%
**
1.3%
1.2%
3.7%
4.1%
2.7%
1.6%
3.8%
2.6%
**= No data was submitted. ♦ The majority of self-service customers are one or two-person households (57.9%). Less than 10 percent of self-service
customers live in households of five or more.
Regions – 2005 Household Size
Overall
New
England
Middle Atlantic
East North
Central
West North
Central
South
Atlantic
East South
Central
West South
Central
Mountain
Pacific One 25.4% 28.1% 31.3% 25.9% 24.4% 17.8% 29.7% 22.0% 22.6% 38.5% Two 32.5% 31.3% 31.3% 30.6% 29.6% 32.9% 21.6% 39.4% 35.8% 38.5% Three 19.3% 18.8% 18.8% 21.2% 22.2% 24.7% 20.3% 15.7% 17.0% 12.8% Four 13.8% 18.8% 10.0% 15.3% 14.1% 12.3% 14.9% 11.8% 19.8% 5.1% Five or more 8.9% 3.1% 8.8% 7.1% 9.6% 12.3% 13.5% 11.0% 4.7% 5.1% ♦ The following table shows the marital status for self-service customers by region. Self-service customers are most likely to be
married (54.6%).
Regions – 2005
Marital Status
Overall
New
England
Middle Atlantic
East North
Central
West North
Central
South
Atlantic
East South
Central
West South
Central
Mountain
Pacific Married 54.6% 46.9% 45.5% 59.0% 55.2% 55.6% 56.9% 57.4% 58.1% 43.6% Widowed 5.7% 6.3% 6.5% 4.8% 6.0% 8.3% 6.9% 4.1% 2.9% 10.3% Divorced 17.5% 25.0% 24.7% 15.7% 12.7% 13.9% 19.4% 21.3% 15.2% 15.4% Separated 2.2% ** 3.9% 1.2% 0.7% 6.9% 1.4% 2.5% 1.0% 2.6% Never Married 20.0% 21.9% 19.5% 19.3% 25.4% 15.3% 15.3% 14.8% 22.9% 28.2% **= No data was submitted.
2005 International Carwash Association Study of Consumer Car Washing Attitudes and Habits All rights reserved © August 2005
-65-

Self-Service Customer Results Types of Washing ♦ In 2005, more self-service customers have ever used full-service professional car washes (42%) than in 2002 (34%), thus
representing a percentage increase of 8 percent. And the percentage of self-service customers who have ever washed their car(s) at home decreased by 1 percent since 2002.
Regions – 2005
Car Wash Ever Used
New
England
Middle Atlantic
East North
Central
West North
Central
South
Atlantic
East South
Central
West South
Central
Mountain
Pacific Home wash 75.0% 71.3% 75.3% 77.8% 90.4% 85.1% 79.5% 83.0% 84.6% Full-service wash 46.9% 42.5% 42.4% 29.6% 42.5% 44.6% 40.9% 42.5% 74.4% Exterior wash 43.8% 43.8% 45.9% 35.6% 43.8% 44.6% 43.3% 45.3% 59.0% Stationary automatic wash
37.5%
33.8%
56.5%
57.8%
53.4%
60.8%
50.4%
54.7%
43.6%
Self-service wash 100.0% 100.0% 100.0% 100.0% 100.0% 100.0% 100.0% 100.0% 100.0%
Type of Car Washes Ever Used by Self-Service Customers - Overall
80%
42% 44%52%
100%
81%
34%42% 48%
100%
39% 40% 44%
100%
83%
0%
25%
50%
75%
100%
2005 80% 42% 44% 52% 100%
2002 81% 34% 42% 48% 100%
1999 83% 39% 40% 44% 100%
Home wash Full-service wash Exterior wash Stationary automatic wash Self-service wash
♦ A large majority of self-service customers indicated that they had most recently had their car washed at a self-service wash.
Type of Car Washes Used Recently by Self-Service Customers
12%4% 3% 8%
74%
8% 2% 3% 6%
81%
8% 2% 3% 5%
81%
0%
25%
50%
75%
100%
2005 12% 4% 3% 8% 74%
2002 8% 2% 3% 6% 81%
1999 8% 2% 3% 5% 81%
Home wash Full-service wash Exterior wash Stationary automatic Self-service
2005 International Carwash Association Study of Consumer Car Washing Attitudes and Habits All rights reserved © August 2005
-66-

Self-Service Customer Results Washing Attitudes Shown below are stationary automatic customer ratings of different types of car washes. Respondents were first asked to rate the importance of several factors in their selection of a car wash. The factors were: ♦ Quality of wash ♦ Less work ♦ Faster overall ♦ Conveniently located ♦ Ease of use ♦ Environmentally safe ♦ Safety of your car’s exterior ♦ Value (quality of wash for money spent) Of all factors rated for importance in selection of a car wash, quality of the wash continues to earn the highest overall mean score. Mean scores were determined by totaling the point value a factor received and dividing by the number of responses.
Most Often Self-service Customers’ Importance Ratings 2005 2002 1999
Aspects of Car Wash (In Mean Rank Order Based on 2005)
Mean Top-Two Box
Net
Mean Top-Two Box
Net
Mean Top-Two Box
Net Quality of wash 4.51 88.2% 4.42 86.3% 4.42 85.9% Safety of car’s exterior 4.39 84.6% 4.37 84.5% 4.16 83.0% Value 4.39 86.9% 4.36 86.1% 4.20 85.9% Ease of use 4.22 82.9% 4.23 83.0% - - *Conveniently located 4.13 78.8% 4.17 82.7% 4.56 92.0% Environmentally safe 3.50 51.7% - - - - Faster overall 3.37 46.6% 3.45 52.0% 3.97 73.9% Less work 3.29 43.2% 3.35 48.8% - -
Rating scale: 1 to 5 where 5 = “Very important” and 1 = “Not very/Not at all important.” - = Not applicable.
Top Five Important Selection Factors: Overall 2005 versus 1999 and 2002 (Top Two Box Net)
88% 87% 85% 83% 79%86% 86% 85% 83% 83%86% 86% 83%
-0%
25%
50%
75%
100%
2005 88% 87% 85% 83% 79%
2002 86% 86% 85% 83% 83%
1999 86% 86% 83% -
Quality of wash Value Safety of car's exterior Ease of use Conveniently located
-
92%
- = Not Applicable.
*In the 1999 survey, the selection factor “conveniently located” was defined only as “convenience.” Note: The “Top-Two Box Net” is the percentage of respondents who rated the service a “4” or “5.”
2005 International Carwash Association Study of Consumer Car Washing Attitudes and Habits All rights reserved © August 2005
-67-

Self-Service Customer Results Washing Attitudes – continued Shown below are self-service customer ratings of different types of car washes. The table compares how self-service customers in 2005 rate the importance of several factors when selecting a particular type of car wash and their perception of the delivery of these factors as compared to self-service customers in 2002 and 1999. ♦ While the quality of wash remains the most important factor to self-service customers this year, self-service customers are
also most satisfied with the quality of wash they receive at self-service shops (4.20 mean; 83.1% top-two box net). In comparison, self-service customers also indicated in 2002 that quality of wash was the most important factor to them (4.42 mean; 86.3% top-two box net), but they were most satisfied with the location of self-service shops (4.24 mean; 83.8%).
Most Often Self-service Customer Delivery Ratings of…
Selection Factors (Top-Two Box Net)
Importance of Car Wash Selection Factors to Most
Often Self- service Customers
Home wash
Full-service wash
Exterior wash
Stationary automatic
wash
Self-service wash
Quality of wash 2005 88.2% 82.3% 86.8% 71.0% 58.6% 83.1% 2002 86.3% 64.5% 45.9% 57.4% 65.6% 82.2% 1999 85.9% 83.5% 74.3% 60.5% 50.5% 85.8%
Less work 2005 43.2% 17.2% 93.0% 89.5% 81.7% 42.0% 2002 48.8% 32.0% 10.7% 15.0% 12.4% 43.7% 1999 - - - - - -
Faster overall 2005 46.6% 22.0% 77.0% 86.7% 78.1% 55.6% 2002 52.0% 39.8% 15.3% 16.0% 14.2% 57.7% 1999 - 47.6% 66.1% 76.7% 75.1% 86.1%
*Conveniently located 2005 78.8% 91.2% 51.0% 64.1% 67.9% 81.3% 2002 82.7% 57.9% 46.3% 55.0% 59.0% 83.8% 1999 92.0% 58.9% 73.1% 78.1% 79.0% 90.4%
Ease of use 2005 82.9% 61.1% 85.9% 86.4% 83.0% 78.7% 2002 83.0% 59.6% 38.4% 37.0% 38.8% 80.9% 1999 - - - - - -
Environmentally safe 2005 51.7% 57.2% 54.1% 52.2% 52.8% 58.1% 2002 - - - - - - 1999 - - - - - -
Safety of car’s exterior 2005 84.6% 86.2% 65.6% 51.6% 57.6% 80.8% 2002 84.5% 66.3% 60.5% 66.4% 72.1% 79.6% 1999 83.0% 88.8% 42.9% 40.7% 42.9% 83.7%
Value 2005 86.9% 87.0% 45.9% 46.9% 48.5% 77.2% 2002 86.1% 50.9% 36.6% 44.2% 48.2% 73.4% 1999 85.9% 83.8% 34.2% 35.4% 37.9% 81.4%
Rating scale: 1 to 5 where 5 = “Excellent” and 1 = “Poor.” - = Not Applicable. *In the 1999 survey, the selection factor “conveniently located” was defined only as “convenience.” Note: Top-Two Box Net is the percentage of respondents who rated the service a “4” or “5.”
2005 International Carwash Association Study of Consumer Car Washing Attitudes and Habits All rights reserved © August 2005
-67-

Self-Service Customer Results Washing Attitudes - continued A list of additional profit centers was provided in the survey. The respondents were asked to rank each profit center in order of importance. ♦ Similar to 2002 study results, self-service customers overall gave gas station the best mean score (1.68). While ATM (1.87)
and oil change/quick lube (1.92) received the second and third best mean score respectively in 2002, other additional services (1.72) and express detailing (1.84) ranked second and third (respectively) in 2005. Self-service customers overall ranked truck rental the lowest (3.00) followed by propane gas (2.80). The means presented in the table below are not weighted.
Regions Additional
Services (In Mean Rank Order Based on Overall)
Overall
New
England
Middle Atlantic
East North
Central
West North
Central
South
Atlantic
East South
Central
West South
Central
Mountain
Pacific
Gas station 1.68 1.92 1.66 1.90 1.49 1.88 1.77 1.63 1.52 1.75 Other (please specify)
1.72
1.00
2.00
2.50
1.75
1.80
1.67
1.20
2.00
**
Express Detailing
1.84
1.40
1.78
1.88
1.96
1.70
2.10
1.67
1.96
1.67
ATM 1.89 1.50 2.00 1.78 1.93 1.96 1.69 2.00 1.76 2.29 Convenience Store
1.95
1.75
1.83
2.03
1.99
1.94
1.92
1.97
2.06
1.73
Oil change/Quick lube
1.99
2.09
2.37
1.79
2.23
2.12
2.00
1.80
1.77
1.70 Brakes 2.06 1.33 2.67 1.67 2.33 2.60 1.40 3.00 2.50 1.00 Paintless dent-repair
2.09
2.00
1.67
2.67
1.80
1.78
1.67
2.09
2.29
3.00
Water dispenser 2.10 3.00 2.20 1.60 2.00 1.86 1.33 2.39 2.25 2.75 Dry Cleaner 2.29 3.00 2.50 2.67 3.00 1.00 3.00 2.00 1.00 3.00 Tune up 2.31 2.80 2.00 2.25 2.25 1.86 2.36 2.13 2.44 2.50 Windshield repair
2.38
2.00
3.00
2.50
2.50
2.00
2.29
2.29
2.43
2.40
Quick-service restaurant
2.43
2.75
2.35
2.33
2.47
2.42
2.38
2.44
2.47
2.25
Gift shop 2.59 2.50 2.50 3.00 2.50 2.63 2.75 2.82 2.50 1.50 Propane gas 2.80 ** 2.50 ** 2.75 3.00 3.00 3.00 2.80 ** Truck rental 3.00 ** ** ** ** 3.00 ** ** ** ** Rating scale: “1” = First choice, “2” = Second choice, “3” = Third choice. ** = No data was submitted.
2005 International Carwash Association Study of Consumer Car Washing Attitudes and Habits All rights reserved © August 2005
-68-

Self-Service Customer Results Washing Attitudes - continued ♦ Spot-free rinse was chosen by the greatest number of self-service customers as an extra service, that would be a factor in
their car wash selection in 2005 (67.5%), in 2002 (60.1%) and in 1999 (61.9%). Spot-free rinse was not an option on the survey in 1996.
Importance of Extra Services (In Percent Rank Order Based on 2005)
2005
2002
1999
Spot-free rinse 67.5% 60.1% 61.9% Interior vacuuming 51.9% 46.6% 57.5% Wheel/hubcap cleaning 42.7% 43.0% 31.7% Wax/paint protectant coating 39.0% 32.3% 41.5% Under body wash 32.8% 31.8% 32.2% None of these are important 25.8% 13.0% 15.5% Hand towel drying 24.0% 23.2% 23.8% Never go to car wash 21.7% 1.3% - Hand wax/protectant application 14.8% 8.9% 10.6% Triple color protectant (foam) conditioner
10.7%
5.3%
-
Carpet shampooing 7.3% 3.6% 6.6% - = Not Applicable.
♦ Across study years, the majority of self-service customers felt that car washing was better in the following areas: more
convenient, more enjoyable, faster (overall process) and less work. In 2002, self-service customers also felt that washing their vehicles at self-service shops were safer for the environment (54.4%) than home washing (45.6%). In 2005, 2002 and 1999, the largest number of self-service customers have felt home washing was a lower cost (84.3%, 86.0% and 81.4%, respectively). In 2005, 2002 and 1999, the largest number of self-service customers felt car washing was less work (91.7%, 96.6% and 91.6%, respectively).
2005 2002 1999 Which is better in the following
areas? Home Wash Car Wash Home Wash Car Wash Home Wash Car Wash Safer for the environment 48.6% 46.1% 45.6% 54.4% 44.9% 46.1% Safer for the car 79.4% 16.5% 79.4% 20.6% 71.8% 21.5% A better overall quality of wash 59.8% 37.3% 57.4% 42.6% 56.3% 40.6% A better overall value 74.0% 22.2% 76.6% 23.4% 71.8% 23.6% More convenient (location) 45.0% 52.7% 43.9% 56.1% 33.4% 64.2% A lower cost 84.3% 12.8% 86.0% 14.0% 81.4% 14.8% More enjoyable 34.1% 60.7% 37.5% 62.5% 36.8% 57.8% Faster overall 12.4% 84.4% 8.7% 91.3% 10.5% 87.1% Less work 5.5% 91.7% 3.4% 96.6% 5.0% 91.6%
2005 International Carwash Association Study of Consumer Car Washing Attitudes and Habits All rights reserved © August 2005
-69-

Self-Service Customer Results Washing Attitudes – continued ♦ Self-service customers continue to believe that the biggest influence over whether they might go to a professional car wash is
for a special occasion such as a wedding, a holiday, etc. with a mean score of 3.51 (57.1% top-two box net) in 2005, 3.55 (60.0% top-two box net) in 2002 and 3.93 (73.5% top-two box net) in 1999. Respondents in 1996 gave this factor a mean score of 4.03 (72.9% top-two box net).
2005 2002 1999
Factors Influencing Decision to Use Car Wash (In Mean Rank Order Based on 2005)
Mean
Top-Two Box Net
Mean
Top-Two Box Net
Mean
Top-Two Box Net
For a special occasion such as a wedding, a holiday, etc.
3.51
57.1%
3.55
60.0%
3.93
73.5%
Appearance of car wash 3.38 52.0% 3.27 50.5% - - Special prices/discount coupons 3.32 52.9% 3.09 47.8% 3.36 42.4% A discounted or free wash is given with a gas purchase
3.24
50.8%
3.11
49.4%
3.51
56.6%
On impulse 3.12 39.8% 3.12 42.4% 3.28 41.9% Discounted gas is given with a car wash purchase 2.99 41.6% 2.76 37.3% - - The car wash offers extra services (i.e., Interior vacuuming, Wheel/hubcap cleaning)
2.92
37.0%
2.74
33.2%
2.79
31.0%
Environmentally safe to wash my car 2.79 29.5% 2.69 29.5% - - Self-pay kiosk 2.70 29.4% - - - - Frequent washer discount 2.65 28.1% 2.42 21.4% 2.87 34.6% Recommendation of a friend 2.51 25.5% 2.21 20.8% 2.79 30.8% Free/discounted oil change 2.48 25.6% 2.28 21.8% 2.75 33.3% Prepaid for multiple car washes at a discounted price
2.40
22.6%
2.17
16.8%
-
-
Allows me to pay with credit/debit card 2.28 20.4% 1.89 13.4% - - Recognized carwash name/use of brand name products
2.28
17.2%
2.13
16.8%
2.53
23.2%
Advertisements 2.20 13.7% 1.98 10.0% 2.40 16.8% Rating scale: 1 to 5 where 5 = “A great deal of influence” and a 1 = “Little or no influence.” - = Not Applicable. Note: Top-Two Box Net is the percentage of respondents rating the factor a “4” or “5.”
Self-Service Customers' Top Four Factors Influencing Decision to Use a Car Wash
3.51 3.55 3.273.93
-
3.363.243.32
3.38 3.113.09
3.51
0.001.002.003.004.005.00
2005 3.51 3.38 3.32 3.24
2002 3.55 3.27 3.09 3.11
1999 3.93 - 3.36 3.51
For a special occasion Appearance of car wash Special prices/discount coupons
A discounted or free wash is given with a gas purchase
2005 International Carwash Association Study of Consumer Car Washing Attitudes and Habits All rights reserved © August 2005
-70-

Self-Service Customer Results Washing Attitudes continued ♦ Self-service customers rated having a thoroughly clean car body and a thoroughly cleaned windshield as the most important
factors in judging the quality of a car wash with a mean score of 4.72. And according to customers, the part of the vehicle cleaned or dried the best was the windshield (mean score 4.34), followed by windows (mean score 4.29).
2005 2002 1999 Importance Rating of
Thoroughly Cleaned or Dried Part (In Mean Rank Order Based on 2005)
Overall
Mean Score
Top-Two Box Net
Overall
Mean Score
Top-Two Box Net
Overall
Mean Score
Top-Two Box Net
Car body 4.72 96.1% 4.74 94.4% 4.73 97.3% Windshield 4.72 95.2% 4.67 92.1% 4.73 95.2% Windows 4.68 94.6% 4.63 90.8% 4.69 95.7% Wheels 4.04 72.5% 3.97 66.8% 3.85 66.5% Front dash/console 3.49 53.1% 3.43 45.9% 3.47 54.2% Car thoroughly dried after wash 3.46 51.6% 3.34 47.8% - - Mats/carpet 3.46 50.9% 3.45 47.1% 3.43 53.9% *the entire car - - - - 3.32 49.4% Rating scale: 1 to 5, where 5 = “Very Important” and 1 = “Not very/not at all Important.” 2005 2002 1999 Delivery Rating of Thoroughly Cleaned or Dried Part (In Mean Rank Order Based on 2005)
Overall
Mean Score
Top-Two Box Net
Overall
Mean Score
Top-Two Box Net
Overall
Mean Score
Top-Two Box Net
Windshield 4.34 85.7% 4.29 84.1% - - Windows 4.29 83.4% 4.24 80.8% 4.21 80.8% Car body 4.28 84.4% 4.24 82.0% 4.29 84.5% Wheels 3.88 69.2% 3.86 67.7% 3.88 67.4% Mats/carpet 3.12 39.0% 3.02 36.6% 3.03 36.1% Front dash/console 3.06 39.8% 2.86 32.0% 3.03 37.1% Car thoroughly dried after wash 3.00 40.0% 2.77 31.8% - - *the entire car - - - - 2.94 36.4%
Rating scale: 1 to 5, where 5 = “Excellent” and 1 = “Poor.” - = Not Applicable. Note: Top-Two Box Net is the percentage of respondents who rated the service a “4” or “5.”
♦ It can be determined by the bar graph below that self-service customers are influenced mainly by price.
S e lf -S e r v ic e C u s to m e r s W o u ld U s e C a r W a s h M o r e F r e q u e n t ly , I f . . .
6 0 %
3 4 %1 7 % 1 3 %
3 5 %2 2 %
8 0 %
5 7 %
3 3 %
1 2 % 1 3 %
7 5 %
5 3 %3 4 %
1 6 % 1 4 % 1 3 %2 %
7 9 %
0 %
2 5 %
5 0 %
7 5 %
1 0 0 %
2 0 0 5 7 9 % 6 0 % 3 4 % 1 7 % 1 3 % 3 5 % 2 2 %
2 0 0 2 8 0 % 5 7 % 3 3 % 1 2 % 1 3 % 2 6 % 2 2 %
1 9 9 9 7 5 % 5 3 % 3 4 % 1 6 % 1 4 % 1 3 % 2 %
L o w e r c o s t C o u p o n s F re q u e n t w a s h e r c lu b S e lf -p a y k io s k V IP t re a tm e n t I f I h a d m o re
t im eI f i t to o k le s s
t im e
2 6 % 2 2 %
2005 International Carwash Association Study of Consumer Car Washing Attitudes and Habits All rights reserved © August 2005
-71-

Self-Service Customer Results Washing Habits ♦ Across study years, more self-service customers reported using professional car washes that offered spray wash rather than
a cloth or hand wash.
2005 2002 1999 Type of wash
Full-service wash
Exterior
wash
Stationary automatic
wash
Full-service wash
Exterior
wash
Stationary automatic
wash
Full-service wash
Exterior
wash
Stationary automatic
wash Spray wash 40.0% 51.4% 58.2% 48.8% 68.0% 63.1% 55.0% 74.1% 55.0% Cloth wash 26.7% 23.9% 18.8% 28.4% 24.9% 20.0% 23.5% 14.6% 23.0% Hand wash 5.7% 1.2% - 6.2% 1.0% - 3.4% 1.9% - No response 27.6% 23.5% 22.9% 16.6% 6.1% 16.9% 18.1% 9.4% 22.0% - = Not Applicable.
♦ Slightly more than half of the self-service customers reported that they sometimes clean the interior of their car when the exterior was cleaned in 2005, 2002 and 1999. The same was reported in the 1996 study.
How Often Interior is Cleaned
33%16%
32%16%
34%
54%
12%
51%
0%
25%
50%
75%
100%
2005 33% 51% 16%
2002 32% 52% 16%
1999 34% 54% 12%
Usually clean Sometimes clean Not usually clean
54%
♦ More than half of the self-service customers indicated they have washed their car(s) at a self-service wash two or more times in the past four weeks. Interestingly, 97 percent of self-service customers stated they have used a full-service car wash once or twice in the past four weeks. In 2002, 85 percent of self-service customers reported doing the same. This indicates a 12 percent increase in usage of full-service washes by self-service customers.
Types of car washes used in past four weeks – 2005
Type of car wash used in past four (4) weeks by all respondents
Home wash
Full-service wash
Exterior wash
Stationary automatic
wash
Self-service
wash 13.6% 3.7% 4.3% 11.3% 56.7% How often in the past four (4) weeks all respondents have washed their car at…
One time 51.0% 78.6% 68.8% 70.6% 45.1% Two times 30.4% 17.9% 25.0% 21.2% 34.0% 3 – 4 times 11.8% 3.6% 6.3% 5.9% 16.9% Five or more times 6.9% ** ** 2.4% 4.0%
2005 International Carwash Association Study of Consumer Car Washing Attitudes and Habits All rights reserved © August 2005
-72-

Self-Service Customer Results Washing Habits – continued ♦ Seventy-one percent of responding self-service customers indicated they have not taken their car to a professional car wash
in the past year. Interestingly, 65 percent have had their vehicle lubed one to six times in the past year.
Number of times in the past year – 2005 How often in the past year have you done the following…
0 times
1-3 times
4-6 times
7-9 times
10-12 times
More than 12 times
Had your car professionally washed 71.0% 20.4% 5.0% 2.1% 0.6% 1.0% Washed your car at home 31.8% 33.6% 5.1% 7.5% 5.0% 7.0% Had your car detailed 82.2% 14.7% 2.0% * * * Had your car lubed 28.8% 42.3% 23.1% 3.6% 1.5% 0.7% * = Less than 0.5 percent.
♦ According to self-service customers, 60 percent spend between $8.51 and $25.50 to have their vehicle professionally cleaned
at a full-service car wash. This represents an increase of 20 percent reporting the same in 2002. Forty percent have paid between $4.51 and $7.50 at an exterior wash and 57 percent have paid $2.51 to $6.50 getting their car cleaned at a stationary automatic shop. Most self-service customers (44.9%) pay less than $2.50 up to $4.50 at a self-service shop when getting their car professionally cleaned.
2005
Cost Spent for Professional Washing
Full-service wash
Exterior wash
Stationary automatic wash
Self-service wash
$2.50 or less 1.0% 4.7% 4.4% 19.6% $2.51 to $4.50 3.6% 9.0% 14.8% 25.3% $4.51 to $5.50 5.1% 13.2% 24.9% 14.3% $5.51 to $6.50 6.6% 12.3% 16.8% 6.8% $6.51 to $7.50 9.2% 14.6% 11.8% 4.0% $7.51 to $8.50 9.2% 11.8% 5.7% 3.9% $8.51 to $10.50 15.3% 15.6% 4.7% 4.3% $10.51 to $15.50 24.0% 9.0% 5.7% 4.0% $15.51 to $25.50 20.9% 6.6% 5.7% 6.1% More than $25.50 5.1% 3.3% 5.4% 11.5%
2005 International Carwash Association Study of Consumer Car Washing Attitudes and Habits All rights reserved © August 2005
-73-

Appendix A
International Carwash Association Serving the Professional Car Care Industry

Appendix A: Demographic Characteristics
2005 International Carwash Association Study of Consumer Car Washing Attitudes and Habits All rights reserved © September 2005
Overview For each customer section of this report, the following demographic characteristics are listed: ♦ Gender ♦ Head of Household Age ♦ Total Annual Household Income ♦ Population Density
♦ Primary Vehicle Driven and Washed Most Often ♦ Number of Miles Driven Per Week ♦ Household Size ♦ Marital Status
The demographic characteristics are shown overall for the consumer survey sample in this section of the report. When reviewing the five washer sections of this report, i.e., Home Washer, Full-service Customers, Exterior Customers, Stationary Automatic Customers, and Self-service Customers, it will be useful to compare the demographic characteristics of those respondents to the overall demographic characteristics shown here. Please note, the data presented in this report is not weighted. Regional Findings ♦ The regional response was very similar to the regional population of the United States. The map below illustrates the nine
regions of the U.S., as defined by the U.S. Census Bureau that are used in this report.
M o u n ta in
W e s t S o u th C e n tra l
P a c ific W e s t N o rth C e n tra l E a s t N o rth C e n tra lN e w E n g la n d
M id d leA tla n tic
S o u thA tla n tic
E a s t S o u th C e n tra l
♦ In order to understand the relationship between demographics and the car wash selections, it was extremely important that our sample represent these demographic differences in population. Below and on the following pages we show the demographic characteristics nationally and by region of those households that own or lease a car.
Regions – 2005
Percent
New
England
Middle Atlantic
East North
Central
West North
Central
South
Atlantic
East South
Central
West South
Central
Mountain
Pacific Respondents in each region
10.2%
12.2%
11.7%
10.6%
11.7%
10.5%
10.7%
10.4%
11.8%

Appendix A: Demographic Characteristics
2005 International Carwash Association Study of Consumer Car Washing Attitudes and Habits All rights reserved © September 2005

Appendix A: Demographic Characteristics
2005 International Carwash Association Study of Consumer Car Washing Attitudes and Habits All rights reserved © September 2005
Regional Findings – continued ♦ The following table shows the gender for all respondents by region. Across regions, the majority of the respondents were
female.
Regions – 2005 Gender
Overall
New
England
Middle Atlantic
East North
Central
West North
Central
South
Atlantic
East South
Central
West South
Central
Mountain
Pacific Male 42.6% 48.0% 45.3% 41.5% 41.3% 42.2% 39.9% 38.4% 41.2% 45.5% Female 57.4% 52.0% 54.7% 58.5% 58.7% 57.8% 60.1% 61.6% 58.8% 54.5% ♦ The following table shows the head of household age of all respondents by region. Based on the age categories listed below,
more respondents reported that they are either 60 years of age or older.
Regions – 2005 Head of Household Age
Overall
New
England
Middle Atlantic
East North
Central
West North
Central
South
Atlantic
East South
Central
West South
Central
Mountain
Pacific Under 30 years 7.9% 5.6% 6.7% 12.9% 12.3% 5.2% 8.6% 7.1% 10.3% 2.9% 30 to 39 years 17.8% 17.0% 19.3% 19.2% 21.8% 17.1% 21.4% 16.9% 15.9% 12.1% 40 to 49 years 22.9% 25.9% 24.8% 24.4% 22.7% 21.3% 23.6% 21.5% 21.2% 20.8% 50 to 59 years 21.7% 20.4% 22.7% 20.8% 17.5% 22.1% 21.1% 24.9% 21.0% 24.1% 60 years or older 29.7% 31.1% 26.6% 22.6% 25.7% 34.4% 25.2% 29.6% 31.5% 40.1% ♦ The following table shows total annual household income for all respondents by region. Overall, nearly 60 percent (59.0%) of
the respondent’s total annual household income is less than $60,000.
Regions – 2005 Total Annual Household Income
Overall
New
England
Middle Atlantic
East North
Central
West North
Central
South
Atlantic
East South
Central
West South
Central
Mountain
Pacific Under $20,000 16.3% 13.4% 13.0% 15.0% 16.8% 14.7% 24.4% 19.1% 16.4% 15.0% $20K to $39,999 24.1% 23.2% 16.9% 19.3% 29.3% 23.2% 30.7% 26.6% 25.3% 23.6% $40K to $59,999 18.6% 20.8% 19.7% 19.7% 17.7% 17.5% 19.0% 19.1% 19.1% 15.2% $60K to $74,999 10.0% 9.1% 9.1% 12.7% 11.3% 8.8% 8.0% 8.0% 13.1% 9.9% $75K to $99,999 15.6% 17.0% 18.2% 17.9% 13.6% 17.7% 8.7% 13.7% 14.6% 18.1% $100K to $149,999
11.6%
10.8%
17.4%
12.4%
8.9%
14.4%
6.5%
10.7%
8.6%
12.9%
$150K and over 3.9% 5.8% 5.8% 3.1% 2.5% 3.6% 2.7% 2.9% 2.9% 5.2%
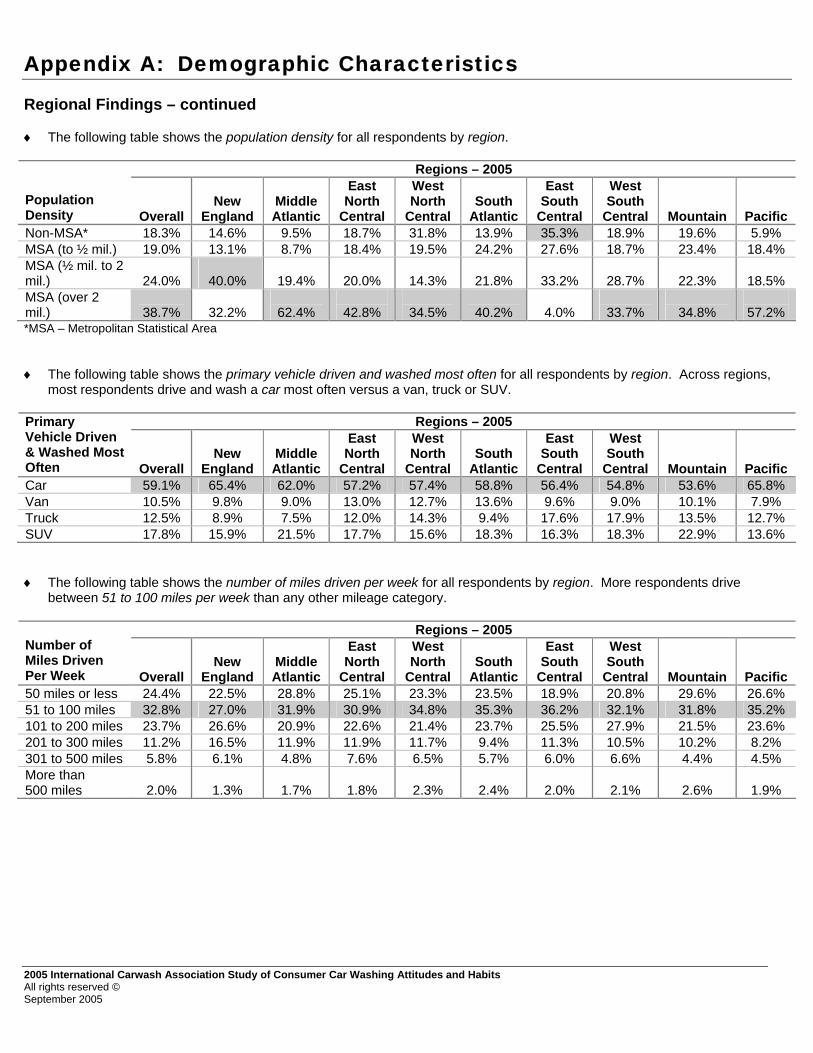
Appendix A: Demographic Characteristics
2005 International Carwash Association Study of Consumer Car Washing Attitudes and Habits All rights reserved © September 2005
Regional Findings – continued ♦ The following table shows the population density for all respondents by region.
Regions – 2005 Population Density
Overall
New
England
Middle Atlantic
East North
Central
West North
Central
South
Atlantic
East South
Central
West South
Central
Mountain
Pacific Non-MSA* 18.3% 14.6% 9.5% 18.7% 31.8% 13.9% 35.3% 18.9% 19.6% 5.9% MSA (to ½ mil.) 19.0% 13.1% 8.7% 18.4% 19.5% 24.2% 27.6% 18.7% 23.4% 18.4% MSA (½ mil. to 2 mil.)
24.0%
40.0%
19.4%
20.0%
14.3%
21.8%
33.2%
28.7%
22.3%
18.5%
MSA (over 2 mil.)
38.7%
32.2%
62.4%
42.8%
34.5%
40.2%
4.0%
33.7%
34.8%
57.2%
*MSA – Metropolitan Statistical Area ♦ The following table shows the primary vehicle driven and washed most often for all respondents by region. Across regions,
most respondents drive and wash a car most often versus a van, truck or SUV.
Regions – 2005 Primary Vehicle Driven & Washed Most Often
Overall
New
England
Middle Atlantic
East North
Central
West North
Central
South
Atlantic
East South
Central
West South
Central
Mountain
Pacific Car 59.1% 65.4% 62.0% 57.2% 57.4% 58.8% 56.4% 54.8% 53.6% 65.8% Van 10.5% 9.8% 9.0% 13.0% 12.7% 13.6% 9.6% 9.0% 10.1% 7.9% Truck 12.5% 8.9% 7.5% 12.0% 14.3% 9.4% 17.6% 17.9% 13.5% 12.7% SUV 17.8% 15.9% 21.5% 17.7% 15.6% 18.3% 16.3% 18.3% 22.9% 13.6% ♦ The following table shows the number of miles driven per week for all respondents by region. More respondents drive
between 51 to 100 miles per week than any other mileage category.
Regions – 2005 Number of Miles Driven Per Week
Overall
New
England
Middle Atlantic
East North
Central
West North
Central
South
Atlantic
East South
Central
West South
Central
Mountain
Pacific 50 miles or less 24.4% 22.5% 28.8% 25.1% 23.3% 23.5% 18.9% 20.8% 29.6% 26.6% 51 to 100 miles 32.8% 27.0% 31.9% 30.9% 34.8% 35.3% 36.2% 32.1% 31.8% 35.2% 101 to 200 miles 23.7% 26.6% 20.9% 22.6% 21.4% 23.7% 25.5% 27.9% 21.5% 23.6% 201 to 300 miles 11.2% 16.5% 11.9% 11.9% 11.7% 9.4% 11.3% 10.5% 10.2% 8.2% 301 to 500 miles 5.8% 6.1% 4.8% 7.6% 6.5% 5.7% 6.0% 6.6% 4.4% 4.5% More than 500 miles
2.0%
1.3%
1.7%
1.8%
2.3%
2.4%
2.0%
2.1%
2.6%
1.9%

Appendix A: Demographic Characteristics
2005 International Carwash Association Study of Consumer Car Washing Attitudes and Habits All rights reserved © September 2005
Regional Findings – continued ♦ The following table shows the household size for all respondents by region. For respondents, the average household size is
two across regions. The graph below shows a comparison between the average household size of customers in 1999, 2002 and 2005.
Regions – 2005
Household Size
Overall
New
England
Middle Atlantic
East North
Central
West North
Central
South
Atlantic
East South
Central
West South
Central
Mountain
Pacific One 26.0% 29.1% 23.6% 22.3% 26.1% 24.8% 24.7% 26.6% 25.2% 31.6% Two 38.3% 35.7% 36.8% 34.6% 36.6% 42.4% 36.8% 40.9% 38.4% 41.7% Three 15.4% 14.1% 16.6% 20.0% 15.9% 15.2% 16.0% 14.5% 13.9% 11.7% Four 12.4% 12.8% 15.1% 15.7% 12.1% 10.2% 13.7% 9.2% 13.8% 9.3% Five or more 8.0% 8.3% 7.9% 7.4% 9.3% 7.4% 8.8% 8.8% 8.7% 5.8%
Overall Household Size
26%38%
15% 12% 8%
28%40%
13% 12% 7%24%
37%
16% 14% 9%
0%
25%
50%
75%
100%
2005 26% 38% 15% 12% 8%
2002 28% 40% 13% 12% 7%
1999 24% 37% 16% 14% 9%
One Two Three Four Five or m ore
♦ The following table shows the marital status for all respondents by region. Nationally, more respondents are married than
widowed, divorced, separated or single.
Regions – 2005 Marital Status
Overall
New
England
Middle Atlantic
East North
Central
West North
Central
South
Atlantic
East South
Central
West South
Central
Mountain
Pacific Married 59.2% 52.8% 60.2% 64.3% 59.3% 59.9% 61.8% 58.1% 60.5% 55.2% Widowed 8.2% 9.1% 8.5% 6.5% 6.2% 10.6% 6.8% 8.7% 8.0% 9.6% Divorced 15.3% 17.0% 12.6% 11.6% 12.9% 14.2% 17.4% 17.3% 17.9% 17.4% Separated 1.4% 0.8% 1.9% 1.1% 0.9% 2.3% 1.1% 1.4% 0.7% 1.8% Never Married 15.9% 20.4% 16.8% 16.4% 20.7% 13.0% 13.0% 14.4% 12.9% 16.1%

Appendix A: Demographic Characteristics
2005 International Carwash Association Study of Consumer Car Washing Attitudes and Habits All rights reserved © September 2005
Type of Washing Respondents were asked to indicate which specific type of car washes they use most often, use most recently and have ever used. The wash categories and their definitions shown in this report are:
♦ Home wash: washing your car at home ♦ Full-service conveyor car wash: car is pulled through the wash by a conveyor and extra services such as interior cleaning
and waxing are offered ♦ Exterior conveyor car wash: car is pulled through the wash by a conveyor and the outside of the car is washed ♦ Stationary automatic car wash: car is washed automatically but car does not move ♦ Self-service coin-operated car wash: car wash facility where you wash your car yourself using coin-operated washing
equipment ♦ Charity (car) wash: car wash offered by a school, church or other community organization or group to raise money for a
charity or event Survey results in this report are most often cross-tabulated by home washers, full-service customers, exterior customers, stationary automatic customers, and self-service customers (refer to their washing usage in the graph below). Charity customers were not included in the analysis because of their small respondent base. Only 1 percent of the respondents reported that they most often use charity washes.
T yp e o f W a s h U s e d M o s t O fte n
38%
19 % 14% 14% 15%
4 3%
18% 12% 13% 14%
45 %
17% 12% 13% 14%
0%
25%
50%
75%
100%
2 0 0 5 3 8 % 1 9 % 1 4 % 1 4 % 1 5 %
2 0 0 2 4 3 % 1 8 % 1 2 % 1 3 % 1 4 %
1 9 9 9 4 5 % 1 7 % 1 2 % 1 3 % 1 4 %
H o m e w a sh F u ll-se rv ice w a sh E xte rio r w a sh S ta tio n a ry a u to m a tic w a sh S e lf-se rv ice w a s h
♦ The table below shows the car wash used most often by region. The largest percentage of survey respondents were home
washers (48.7%) in the East South Central region followed by the home washers (46.7%) in the South Atlantic region. While these figures represent the largest percentage of respondents (similar to the 2002 study) their most often chosen method of car washing (i.e., home washing) has decreased slightly from what was reported in the 2002 study (58.0% and 52.6%). In comparison, the smallest segment is the West South Central exterior customers (4.8%).
Regions – 2005
Car Wash Used Most Often
New
England
Middle Atlantic
East North
Central
West North
Central
South
Atlantic
East South
Central
West South
Central
Mountain
Pacific Home wash 43.2% 36.2% 31.0% 25.7% 46.7% 48.7% 36.4% 29.5% 45.3% Full-service wash 18.7% 22.3% 14.4% 10.5% 17.6% 13.3% 20.3% 21.6% 27.9% Exterior wash 25.3% 19.8% 21.9% 11.4% 8.1% 6.5% 4.8% 11.7% 13.2% Stationary automatic wash
6.4%
8.4%
18.2%
27.2%
14.6%
17.0%
14.2%
16.9%
6.7%
Self-service wash 6.4% 13.2% 14.6% 25.3% 12.9% 14.5% 24.3% 20.3% 6.9%

Appendix A: Demographic Characteristics
2005 International Carwash Association Study of Consumer Car Washing Attitudes and Habits All rights reserved © September 2005
Type of Washing – continued ♦ The table below shows the car wash used most often by head of household age. Individuals under the age of 30 tend to wash
their cars at self-service washes (26.2%) followed by stationary automatic washes (16.9%) when they do not wash their vehicles at home. Individuals that are 50 years or older tend to wash their vehicles at full-service washes (46.0%) when they choose not to wash at home.
Regions – 2005 Car Wash Used
Most Often Under 30 years 30 to 39 years 40 to 49 years 50 to 59 years 60 or older Home wash 36.0% 39.9% 41.7% 34.8% 36.8% Full-service wash 10.3% 12.6% 16.3% 22.1% 23.9% Exterior wash 10.6% 11.7% 11.6% 14.0% 17.4% Stationary automatic wash
16.9%
17.1%
14.2%
14.7%
11.7%
Self-service wash 26.2% 18.7% 16.2% 14.4% 10.1% ♦ The following table shows car wash used most often for all respondents by total annual household income. The majority of
full-service customers’ (77.4%) and exterior customers’ (48.7%) total annual household income is $75,000 and above. In comparison, for most self-service customers the total annual household income ranges from under $20,000 to almost $60,000. Stationary automatic customers (47.7%) average between $40,000 to almost $75,000.
Household Income Categories – 2005
Car Wash Used Most Often
Under $20,000
$20,000 to $39,999
$40,000 to $59,999
$60,000 to $74,999
$75,000 to $99,999
$100,000 to $149,999
$150,000 and Over
Home wash 39.5% 40.1% 37.0% 39.0% 37.9% 33.9% 34.9% Full-service wash 12.3% 15.2% 17.2% 19.2% 22.5% 25.9% 29.0% Exterior wash 11.3% 12.4% 13.6% 13.1% 15.7% 16.3% 16.7% Stationary automatic wash
12.5%
13.8%
15.7%
17.4%
14.6%
14.3%
12.4%
Self-service wash 24.4% 18.5% 16.6% 11.3% 9.3% 9.6% 7.0%

Appendix A: Demographic Characteristics
2005 International Carwash Association Study of Consumer Car Washing Attitudes and Habits All rights reserved © September 2005
Type of Washing – continued ♦ The table below shows car wash used most often for all respondents by primary vehicle driven and washed most often. Other
than home washing, more customers tend to wash their vans at stationary automatic shops and clean their trucks at self-service washes. Besides home washing, more customers prefer to wash their car and SUV at full-service washes than at other types of professional washes.
Primary Vehicle Driven & Washed Most Often – 2005
Car Wash Used Most Often Car Van Truck SUV Home wash 36.4% 40.4% 49.1% 34.2% Full-service wash 20.3% 15.6% 10.5% 20.4% Exterior wash 15.2% 13.8% 6.8% 13.8% Stationary automatic wash 13.4% 17.1% 12.6% 16.7% Self-service wash 14.6% 13.1% 20.9% 15.0% ♦ When asked what type of car wash they used most recently in 1999, 2002 and 2005 respondents answered home wash more
often than any other wash type. Interestingly, more consumers used exterior and stationary automatic washes most recently than the percentage reported in the 1999 and 2002 studies.
Car W ash Used M ost Recently
31%20% 16% 16% 17%
35%20% 14% 15% 16%
36%
18% 14% 15% 17%
0%
25%
50%
75%
100%
2005 31% 20% 16% 16% 17%
2002 35% 20% 14% 15% 16%
1999 36% 18% 14% 15% 17%
Hom e wash Full-service wash Exterior wash Stationary autom atic wash Self-service wash

Appendix A: Demographic Characteristics
2005 International Carwash Association Study of Consumer Car Washing Attitudes and Habits All rights reserved © September 2005
Washing Attitudes Following these general questions, respondents were lead through a series of questions dealing with different aspects of car washing. Respondents were first asked to rate the importance of several factors in their selection of a car wash. The factors were: ♦ Quality of wash ♦ Less work ♦ Faster overall ♦ Conveniently located
♦ Ease of use ♦ Environmentally safe ♦ Safety of your car’s exterior ♦ Value (quality of wash for money spent)
♦ For customers who have ever used a professional car wash, quality of wash earned the highest overall mean score of 4.60
(91% top-two box net) followed by safety of car’s exterior and value which both received an overall mean score of 4.40 in 2005 (87% and 86% top-two box net respectively) as the top two importance factors in the selection of a car wash. Mean scores were determined by totaling the value a factor received and dividing by the number of responses.
O v e ra ll T o p -T w o B o x N e t o n S e le c t io n F a c to rs fo r E v e r U s e d C a r W a s h C u s to m e rs
5 3 %
7 5 %
5 1 %
7 3 %
8 7 %
- -
5 3 %
7 8 %
5 4 %
8 6 %8 7 %
9 1 %
-
8 5 %8 6 %
7 4 %
9 0 %
8 5 %8 6 %
-
8 9 %
0 %
2 5 %
5 0 %
7 5 %
1 0 0 %
2 0 0 5 9 1 % 5 4 % 5 3 % 7 5 % 7 8 % 5 3 % 8 7 % 8 6 %
2 0 0 2 9 0 % 5 2 % 5 1 % 7 4 % 7 7 % - 8 6 % 8 5 %
1 9 9 9 8 9 % - 7 3 % 8 7 % - - 8 6 % 8 5 %
Q u a lity o f w a s h L e s s w o rk F a s te r o v e ra ll *C o n v e n ie n t ly
lo c a te d E a s e o f u s e E n v iro n m e n -ta lly s a fe
S a fe ty o f y o u r c a r 's e x te r io r V a lu e
5 2 %
- = Not Applicable. *In the 1999 survey, the selection factor “conveniently located” was defined only as “convenience.” Note: “Top-two box net” is the percentage of respondents who rated the factors a “4” or “5.”
Ever Used Car Wash Customers’ Importance Ratings
Aspects of Car Wash (In Mean Rank Order Based on 2005)
Mean - 2005 Mean - 2002 Mean - 1999
Quality of wash 4.60 4.55 4.34 Safety of your car’s exterior 4.40 4.43 4.23 Value 4.40 4.33 4.13 Ease of use 4.10 4.07 - *Conveniently located 4.00 4.01 4.30 Environmentally safe 3.50 - - Less work 3.50 3.48 - Faster overall 3.50 3.46 3.87
Scale: 1 to 5, where 5 represents “Very Important” and 1 represents “Not very/Not at all Important.” - = Not Applicable. *In the 1999 survey, the aspect “conveniently located” was defined only as “convenience.”

Appendix A: Demographic Characteristics
2005 International Carwash Association Study of Consumer Car Washing Attitudes and Habits All rights reserved © September 2005
Washing Attitudes – continued ♦ Customers are most satisfied with the location and quality of wash for money spent when home washing. They are most
satisfied that less work is involved when washing at full-service and exterior shops and the ease of use that is found at stationary automatic washes. They also believe that self-service washes provide safety of (a) car’s exterior.
Type of Car Wash Ever Used– 2005
Satisfaction (with End-Product) Ratings Mean (Top-two box net percent)
Home wash
Full-service
wash
Exterior wash
Stationary automatic
wash
Self-service
wash Quality of the wash 4.43
(85.6%) 4.33
(87.6%) 3.92
(71.5%) 3.67
(59.2%) 3.89
(69.1%) Less work 2.45
(20.2%) 4.56
(91.0%) 4.39
(86.9%) 4.24
(81.5%) 2.93
(30.8%) Faster overall 2.74
(26.4%) 4.22
(79.3%) 4.31
(84.6%) 4.17
(79.2%) 3.19
(38.9%) *Conveniently located 4.61
(89.9%) 3.81
(63.9%) 3.89
(67.3%) 3.98
(70.5%) 3.83
(64.7%) Ease of use 3.86
(63.7%) 4.39
(87.1%) 4.31
(85.2%) 4.26
(82.4%) 3.70
(60.5%) Environmentally safe 3.85
(61.9%) 3.73
(57.3%) 3.62
(52.1%) 3.58
(50.9%) 3.49
(45.8%) Safety of car’s exterior 4.51
(88.0%) 3.93
(70.0%) 3.68
(58.6%) 3.73
(60.3%) 3.95
(71.1%) Quality of wash for money spent 4.58
(89.1%) 3.64
(57.8%) 3.65
(57.2%) 3.63
(56.6%) 3.73
(60.5%) Rating scale: 1 to 5, where 5 represents “Very Important” and 1 represents “Not very/Not at all Important.” *In the 1999 survey, the aspect “conveniently located” was defined only as “convenience.” Note: “Top-Two Box Net” is the percentage of respondents who rated the factor a “4” (Important) or “5” (Very Important). ♦ Respondents were asked to choose three additional services they would like offered at the same location as a car wash.
Truck rental was ranked #1 by the least number of respondents (4.5%) and received the worst mean score rank, 2.77.
2005 2002 1999 Additional Services
Overall Mean
Score
Percent who ranked service
#1
*Overall Mean
Score
Percent who ranked service
#1
*Overall Mean
Score
Percent who ranked service
#1 Gas station 1.62 54.3% 1.63 53.4% 1.88 52.9% Express detailing 1.82 44.1% 1.90 40.0% 3.62 23.1% Oil change/Quick lube 1.92 33.7% 1.90 34.1% 2.97 21.9% ATM 1.97 38.9% 1.89 45.0% 3.57 21.3% Convenience store 2.01 28.6% 2.05 25.9% 2.65 22.5% Other 2.05 36.3% 2.18 31.7% - - Paintless dent-repair 2.13 27.9% 2.21 23.2% - - Dry cleaner 2.14 26.0% 2.08 26.0% 6.01 2.3% Brakes 2.19 26.5% 2.12 26.2% 5.35 4.1% Windshield repair 2.24 17.9% 2.27 17.3% 5.42 6.4% Water dispenser 2.25 22.5% 2.35 20.9% - - Quick-service restaurant 2.32 18.3% 2.34 15.0% 3.97 9.4% Tune up 2.38 13.4% 2.44 13.1% 4.93 4.0% Propane gas 2.42 12.2% 2.44 13.6% 6.28 2.7% Gift shop 2.45 16.9% 2.41 18.5% - - Truck rental 2.77 4.5% 2.50 18.8% 7.17 1.0%
Rating scale: 1 to 3, with “1” being their first choice, “2” being their second choice and “3” being their third choice.

Appendix A: Demographic Characteristics
2005 International Carwash Association Study of Consumer Car Washing Attitudes and Habits All rights reserved © September 2005
- = Not Applicable. Note: The means presented in this table are not weighted. *In 1999, respondents ranked up to 16 choices.

Appendix A: Demographic Characteristics
2005 International Carwash Association Study of Consumer Car Washing Attitudes and Habits All rights reserved © September 2005
Washing Attitudes – continued ♦ According to respondents, the top-three most important factors in car wash selection (overall) are spot-free rinse,
wheel/hubcap cleaning and interior vacuuming while carpet shampooing was stated as the least important factor in car wash selection. Surprisingly, 20 percent of the respondents reported that they never go to a car wash.
Important Factors in Car Wash Selection (In Percent Rank Order Based on 2005)
2005
2002
1999
Spot-free rinse 59.0% 56.8% 59.1% Wheel/hubcap cleaning 48.6% 53.4% 46.8% Interior vacuuming 48.1% 51.0% 58.3% Under body wash 41.8% 43.5% 44.9% Hand towel drying 36.5% 39.7% 43.6% Wax/paint protectant coating 36.0% 38.6% 43.6% None of these are important 22.6% 8.6% 12.9% Never go to car wash 19.9% 2.3% - Hand wax/protectant application 14.0% 13.8% 13.9% Triple color protectant (foam) conditioner 11.3% 9.9% - Carpet shampooing 7.6% 6.9% 10.1% - = Not Applicable.
♦ The greatest overall difference between the importance score and the delivery score is found with having the car body
thoroughly cleaned, where the importance mean score was 4.76, but the delivery of mean score was 4.37 in 2005.
2005 2002 1999 Importance Rating of Thoroughly Cleaned or Dried Part (In Mean Rank Order by 2005)
Overall
Mean Score
Top-Two Box Net
Overall
Mean Score
Top-Two Box Net
Overall
Mean Score
Top-Two Box Net
Windshield 4.77 96.0% 4.76 92.5% 4.78 96.1% Car body 4.76 97.2% 4.76 93.1% 4.75 96.8% Windows 4.73 95.7% 4.72 91.7% 4.74 95.8% Wheels 4.13 75.8% 4.09 71.8% 3.97 69.9% Car thoroughly dried after wash 3.83 65.7% 3.82 62.5% - - Front dash/console 3.65 59.8% 3.66 55.5% 3.68 60.6% Mats/carpet 3.62 58.3% 3.63 54.6% 3.64 59.6% *the entire car - - - - 3.91 68.2% Rating scale: 1 to 5, where “5” represents “Very Important” and “1” represents “Not very/Not at all Important.”
2005 2002 1999 Delivery Rating of Thoroughly Cleaned or Dried Part (In Mean Rank Order by 2005)
Overall Mean Score
Top-Two Box Net
Overall Mean Score
Top-Two Box Net
Overall Mean Score
Top-Two Box Net
Windshield 4.44 88.1% 4.41 82.9% - - Windows 4.39 86.6% 4.36 81.3% 4.28 83.0% Car body 4.37 87.1% 4.36 81.1% 4.34 85.5% Wheels 4.01 73.1% 4.00 69.0% 3.92 68.9% Car thoroughly dried after wash 3.59 58.3% 3.57 52.9% - - Front dash/console 3.37 52.3% 3.38 46.7% 3.41 52.5% Mats/carpet 3.33 50.4% 3.36 46.3% 3.36 50.0% *the entire car - - - - 3.62 58.8% Rating scale: 1 to 5, where “5” represents “Excellent” and “1” represents “Poor.”
- = Not Applicable.
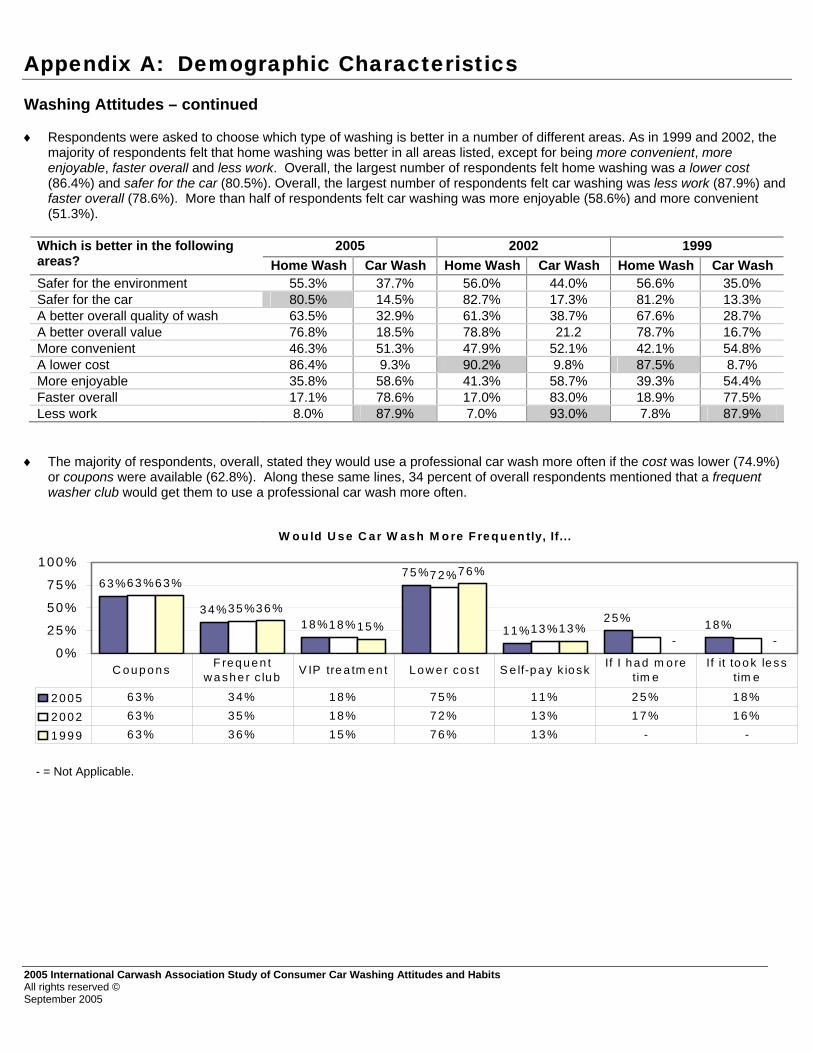
Appendix A: Demographic Characteristics
2005 International Carwash Association Study of Consumer Car Washing Attitudes and Habits All rights reserved © September 2005
Washing Attitudes – continued ♦ Respondents were asked to choose which type of washing is better in a number of different areas. As in 1999 and 2002, the
majority of respondents felt that home washing was better in all areas listed, except for being more convenient, more enjoyable, faster overall and less work. Overall, the largest number of respondents felt home washing was a lower cost (86.4%) and safer for the car (80.5%). Overall, the largest number of respondents felt car washing was less work (87.9%) and faster overall (78.6%). More than half of respondents felt car washing was more enjoyable (58.6%) and more convenient (51.3%).
2005 2002 1999 Which is better in the following
areas? Home Wash Car Wash Home Wash Car Wash Home Wash Car Wash Safer for the environment 55.3% 37.7% 56.0% 44.0% 56.6% 35.0% Safer for the car 80.5% 14.5% 82.7% 17.3% 81.2% 13.3% A better overall quality of wash 63.5% 32.9% 61.3% 38.7% 67.6% 28.7% A better overall value 76.8% 18.5% 78.8% 21.2 78.7% 16.7% More convenient 46.3% 51.3% 47.9% 52.1% 42.1% 54.8% A lower cost 86.4% 9.3% 90.2% 9.8% 87.5% 8.7% More enjoyable 35.8% 58.6% 41.3% 58.7% 39.3% 54.4% Faster overall 17.1% 78.6% 17.0% 83.0% 18.9% 77.5% Less work 8.0% 87.9% 7.0% 93.0% 7.8% 87.9%
♦ The majority of respondents, overall, stated they would use a professional car wash more often if the cost was lower (74.9%)
or coupons were available (62.8%). Along these same lines, 34 percent of overall respondents mentioned that a frequent washer club would get them to use a professional car wash more often.
- = Not Applicable.
W o u ld U se C ar W ash M o re F req u en tly, If...
63%
3 4%18%
75 %
11%25% 18%
63 %
35%18%
7 2%
13%
63%
36%15%
76%
13 %- -
0%
25%
50%
75%
100%
2005 63% 34% 18% 75% 11% 2 5% 18%
2002 63% 35% 18% 72% 13% 1 7% 16%
1999 63% 36% 15% 76% 13% - -
C oup ons F requen t w a she r c lub V IP tre a tm en t Low er cos t S e lf-pay k iosk If I had m o re
tim eIf it took less
tim e

Appendix A: Demographic Characteristics
2005 International Carwash Association Study of Consumer Car Washing Attitudes and Habits All rights reserved © September 2005
Washing Habits ♦ Full-service, exterior, and stationary automatic wash customers were also asked what type of wash they use: spray, cloth, or
hand. As in 1999 and 2002, the majority of all wash type customers (i.e., full-service, exterior and stationary-automatic) indicated they use spray wash (touch-free) in 2005.
2005 2002 1999
Type of wash
Full-service wash
Exterior
wash
Stationary automatic
wash
Full-service wash
Exterior
wash
Stationary-automatic
wash
Full-service wash
Exterior
wash
Stationary automatic
wash Spray wash (touch-free)
47.4%
50.6%
55.4%
48.5%
64.8%
55.9%
48.0%
61.6%
56.3%
Cloth wash 26.9% 27.8% 19.6% 28.0% 26.9% 22.2% 29.0% 24.9% 23.1% Hand wash 6.7% 1.3% - 6.8% 1.8% - 4.7% 1.1% - No response 19.1% 20.3% 25.1% 16.7% 6.5% 21.9% 18.3% 12.4% 20.5% - = Not Applicable.
♦ Overall, a large majority (87.9%) of respondents stated that they usually or sometimes clean the interior of their car when they
wash the exterior in 2005. In comparison, approximately 91 percent reported that they usually or sometimes cleaned the interior of their car when washing the exterior in 1999.
How Often Interior of Car is Cleaned
41% 46%
13%
43% 45%
12%
45% 46%
9%
0%
25%
50%
75%
100%
2005 41% 46% 13%
2002 43% 45% 12%
1999 45% 46% 9%
Usually Sometimes Not Usually
♦ Approximately 14 percent of the respondents used a full-service car wash in the past four weeks. Almost 89 percent of the full-service customers stated they washed their car one or two times during that period of time.
Types of car washes used in past four weeks
Type of car wash used in past four (4) weeks by all respondents
Home wash
Full-service wash
Exterior
wash
Stationary automatic
wash
Self-service
wash 24.9% 14.0% 12.2% 14.3% 14.5% How often in the past four (4) weeks all respondents have washed their car at…
One time 51.6% 61.8% 57.4% 59.2% 53.1% Two times 29.3% 27.6% 30.5% 28.0% 29.6% 3 – 4 times 15.6% 8.4% 10.7% 11.7% 13.6% Five or more times 3.5% 2.2% 1.4% 1.1% 3.8%

Appendix A: Demographic Characteristics
2005 International Carwash Association Study of Consumer Car Washing Attitudes and Habits All rights reserved © September 2005
Washing Habits – continued ♦ Respondents were also asked how often in the past year that they had their car professionally cleaned, detailed or washed at
home. The frequency of such use is reported in the table below.
Number of times in the past year How often in the past year have you done the following…
0 times
1-3 times
4-6 times
7-9 times
10-12 times
More than 12 times
Had your car professionally washed 47.6% 24.9% 11.4% 6.7% 4.8% 4.7% Washed your car at home 25.5% 28.0% 16.5% 9.5% 7.3% 13.0% Had your car detailed 80.1% 16.7% 1.9% 0.5% * 0.5% Had your car lubed 24.3% 43.2% 26.3% 3.8% 1.4% 1.0% * = Less than 0.5 percent.
♦ Responding exterior customers (42.3%) tend to spend between $4.51 and $7.50 when they get their vehicle professionally
washed. Self-service customers (26.4%) tend to spend $2.51 to $4.50 for professional washing, stationary automatic (21.1%) spend $4.51 to $5.50 and full-service customers (25.4%) tend to spend $10.51 to $15.50.
2005
Cost Spent for Professional Washing
Full-service
wash
Exterior
wash
Stationary automatic
wash
Self-service
wash $2.50 or less 2.1% 5.1% 5.9% 19.2% $2.51 to $4.50 2.6% 9.7% 15.6% 26.4% $4.51 to $5.50 4.0% 14.4% 21.1% 18.8% $5.51 to $6.50 5.7% 13.7% 16.9% 9.0% $6.51 to $7.50 6.9% 14.2% 14.2% 5.1% $7.51 to $8.50 8.3% 12.0% 8.1% 3.1% $8.51 to $10.50 17.6% 13.9% 4.8% 4.5% $10.51 to $15.50 25.4% 8.3% 3.7% 3.7% $15.51 to $25.50 19.2% 4.7% 4.5% 4.5% More than $25.50 8.0% 4.0% 5.4% 5.8%

PLEASE READ THIS SIDE FIRST1. Please record the following information for each car you own and/or lease.Do not own or lease a car B α (SKIP TO QU. 8)Own Lease Year of Car________Car #1.................... B B ________Car #2.................... B B ________Car #3.................... B B ________B BCar #4....................Please have the person who most often washes thecar(s) complete the rest of the questionnaire.Who in your Male Female Other Otherhouseholdà Head Head Male Female2. Is completing thisquestionnaire? ...... B B B B3.Ever washes/has the car(s)washed?................ B B B B4.Most oftenwashes/has thecar(s) washed? ..... B B B B5. Where is the car(s) washed most often? BUsually/always at home .........................................Evenly split between at home and at a car wash... BUsually or always at a car wash ............................ B6a. Listed below are several types of car washes. Whichhave ever been used to wash the car(s) in yourhousehold? (ôXö ALL THAT APPLY)6b.Which type has been used most often to wash thecar(s) in your household? (ôXö ONLY ONE)6a. 6b.Ever UseUsed MostWash car at home................................ B BHand wash (washed by hand by car B Bwash employees)................................Conveyor car wash (pulled throughwash by conveyor).............................. B BStationary automatic car wash (carwashed automatically but does notmove) .................................................. B BSelf-service coin operated car wash.... B BCharity car wash ................................... B B7. Which statement best describes the car(s) you mostoften drive?The car(s) is almost always kept clean ................ BBThe car(s) is kept clean more than half the time..The car(s) is kept clean less than half the time.... BThe car(s) is usually not kept clean...................... B


![Consumer durable [washing machine]](https://img.pdfslide.net/doc/110x75/5872832e1a28abc7068b69d5/consumer-durable-washing-machine.jpg)