Embed Size (px)
Citation preview
1
A Luminescent Aluminium Salen Complex Allows for
Monitoring Dynamic Vesicle Trafficking from Golgi
Apparatus to Lysosomes in Living Cells
Juan Tang,† Hao-Yan Yin,† and Jun-Long Zhang†*† Beijing National Laboratory for Molecular Sciences, State Key Laboratory of Rare Earth Materials Chemistry and Applications, College of Chemistry and Molecular Engineering, Peking University, Beijing 100871, P.R. China.
Electronic Supplementary Material (ESI) for Chemical Science.This journal is © The Royal Society of Chemistry 2018
2
1. General experimental information
All solvents and chemicals for synthesis were purchased from Alfa Aesar and J&K and used as
received without further purification, unless otherwise specified. Cellular imaging trackers and
endocytosis inhibitors were purchased from Thermo Fisher Scientific. Phospholipids were
purchased from A.V.T. (Shanghai) Pharmaceutical Co., Ltd and used as received without further
purification.
The 1H NMR spectroscopic measurements were carried out using a Bruker-400 NMR at 400
MHz with tetramethysilane (TMS) as internal reference. Electrospray ionization (ESI) mass
spectra were performed on a Fourier Transform Ion Cyclotron Resonance Mass Spectrometer
(Bruker, USA), positive-ion mode. The steady-state absorption spectra were obtained with an
Agilent 8453 UV-vis spectrophotometer in 1 cm path length quartz cells. Single-photon
luminescence spectra were recorded using fluorescence lifetime (Edinburgh Instrument FLS980)
and steady state spectrophotometer (Hitachi F7000). Quantum yields of one photon emission of all
the synthesized compounds were measured relative to the fluorescence of Rhodamine B (Ф =
0.65) in ethanol. The two photon fluorescence data was acquired using a Tsunami femtosecond Ti:
Sapphire laser (pulse width ≤ 100 fs, 80 MHz repetition rate, tuning range 790 - 880 nm, Spectra
Physics Inc., USA). FT-IR spectrum was taken on a Nicolet iN10 MX Fourier Transform Infrared
Spectrometer. Isothermal Titration Calorimetry (ITC) was performed using MicroCal iTC200
(USA, Marvin). Confocal fluorescent images of living cells were performed using Nikon A1R-si
Laser Scanning Confocal Microscope (Japan), equipped with lasers of 405/488/543/638 nm. Two
photon fluorescence microscopy images were performed on a ZEISS LSM 510 META microscope
system (Germany). ImageStream cytometry was measured by ImageStreamX markII (USA,
Amnis).
2. Synthesis and characteristics
ZnSalen and AlL were fully characterized by 1H NMR, high-resolution ESI-Mass (HR-ESI), and
IR spectroscopes.
3
O
NH
O
N
O
N
CHO
O
N
NC
N
CN
OZn
NN
O
N
NC
N
CN
OAl
NN
Cl
OH
N
CHO
ZnSalen Golgi-Al
1 2 3
(i) (ii) (iii)
(v)(iv)
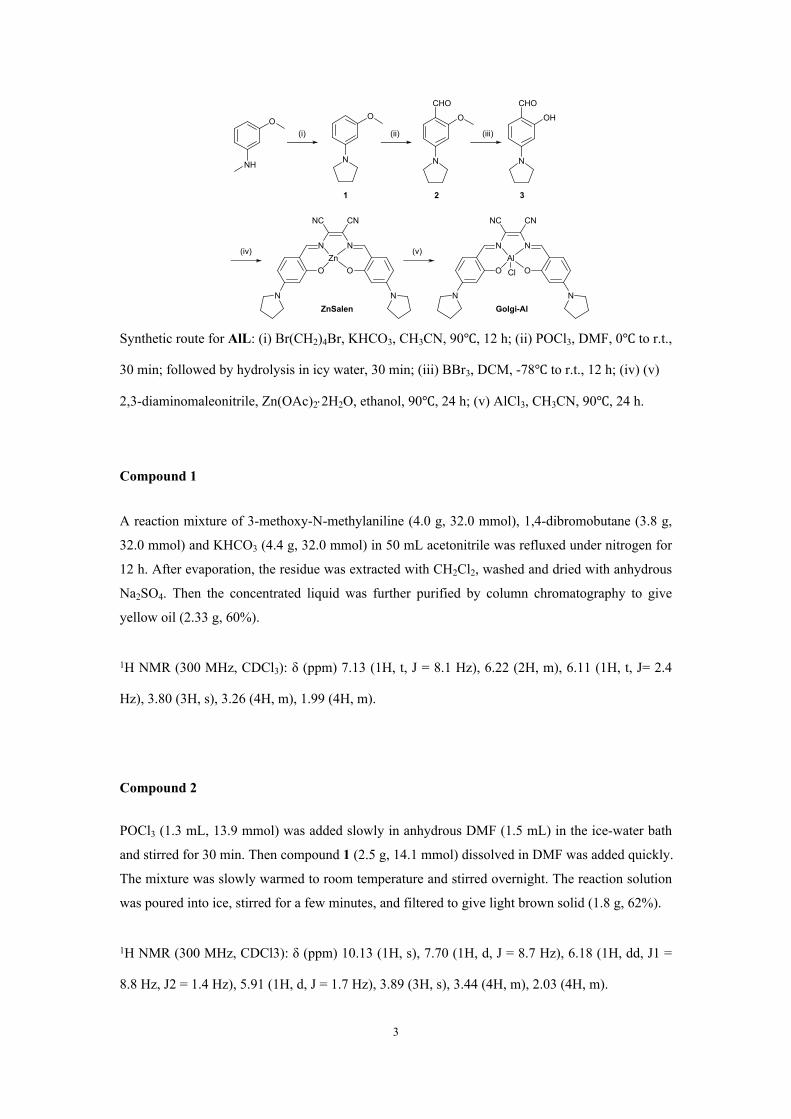
Synthetic route for AlL: (i) Br(CH2)4Br, KHCO3, CH3CN, 90℃, 12 h; (ii) POCl3, DMF, 0℃ to r.t.,
30 min; followed by hydrolysis in icy water, 30 min; (iii) BBr3, DCM, -78℃ to r.t., 12 h; (iv) (v)
2,3-diaminomaleonitrile, Zn(OAc)22H2O, ethanol, 90℃, 24 h; (v) AlCl3, CH3CN, 90℃, 24 h.
Compound 1
A reaction mixture of 3-methoxy-N-methylaniline (4.0 g, 32.0 mmol), 1,4-dibromobutane (3.8 g,
32.0 mmol) and KHCO3 (4.4 g, 32.0 mmol) in 50 mL acetonitrile was refluxed under nitrogen for
12 h. After evaporation, the residue was extracted with CH2Cl2, washed and dried with anhydrous
Na2SO4. Then the concentrated liquid was further purified by column chromatography to give
yellow oil (2.33 g, 60%).
1H NMR (300 MHz, CDCl3): δ (ppm) 7.13 (1H, t, J = 8.1 Hz), 6.22 (2H, m), 6.11 (1H, t, J= 2.4
Hz), 3.80 (3H, s), 3.26 (4H, m), 1.99 (4H, m).
Compound 2
POCl3 (1.3 mL, 13.9 mmol) was added slowly in anhydrous DMF (1.5 mL) in the ice-water bath
and stirred for 30 min. Then compound 1 (2.5 g, 14.1 mmol) dissolved in DMF was added quickly.
The mixture was slowly warmed to room temperature and stirred overnight. The reaction solution
was poured into ice, stirred for a few minutes, and filtered to give light brown solid (1.8 g, 62%).
1H NMR (300 MHz, CDCl3): δ (ppm) 10.13 (1H, s), 7.70 (1H, d, J = 8.7 Hz), 6.18 (1H, dd, J1 =
8.8 Hz, J2 = 1.4 Hz), 5.91 (1H, d, J = 1.7 Hz), 3.89 (3H, s), 3.44 (4H, m), 2.03 (4H, m).
4
Compound 3
2 (1.45 g, 7.1 mmol) was dissolved in 30 mL refreshed CH2Cl2, and boron tribromide (1.6 mL,
17.2 mmol) was added at -78℃. The mixture was warmed slowly to room temperature and stirred
for 12 h. Cold methanol was added to quench extra boron tribromide. After evaporation and
extraction, the residue was purified by column chromatography to give yellow oil (1.04 g, 77%).
1H NMR (300 MHz, CDCl3): δ (ppm) 11.69 (1H, s), 9.50 (1H, s), 7.28 (1H, d, J = 8.9 Hz), 6.17
(1H, dd, J1 = 2.1 Hz, J2 = 8.7 Hz), 5.97 (1H, d, J = 2.0 Hz), 3.38 (4H, t, J = 6.6 Hz), 2.04 (4H, m).
ZnSalen
A reaction mixture of compound 3 (76.4 mg, 0.4 mmol), 2,3-diaminomaleonitrile (21.6 mg, 0.2
mmol) and Zn(OAc)2·2H2O (43.8 mg, 0.2 mmol) in 10 mL ethanol was refluxed under nitrogen
for 24 h. The system turned dark brown precipitate formed. After cooling to the room temperature
and evaporating the solvent, the mixture was filtered and the solid was washed in turn by ethanol,
ethyl acetate and petroleum ether. After dried under reduced pressure, compound ZnSalen was
obtained as brown black solid (74.4 mg, 72%).
1H NMR (400 MHz, d6-DMSO): δ (ppm) 8.13 (2H, s), 7.18 (2H, d, J = 9.0 Hz), 6.15 (2H, dd, J1 =
1.9 Hz, J2 = 9.0 Hz), 5.71 (2H, d, J = 1.7 Hz), 3.36 (8H, m), 1.96 (8H, m).
HR MS (ESI+, d6-DMSO, FT-ICR): m/z calcd. for C26H35N6NaO2Zn ([M+Na]+): 549.19324,
found m/z: 549.19400.
FT-IR (KBr pellete, cm-1): 2205 (C≡N), 1620 (C=N).
AlL
A reaction mixture of ZnSalen (76.4 mg, 0.4 mmol) and AlCl3 (43.8 mg, 0.2 mmol) in 10 mL
acetonitrile was refluxed under nitrogen for 24 h. After cooling to the room temperature, the
system was added with anhydrous ether. During this process, black precipitate could be observed.
The mixture was filtered and the solid was washed in turn by mixture solvent of acetonitrile and
5
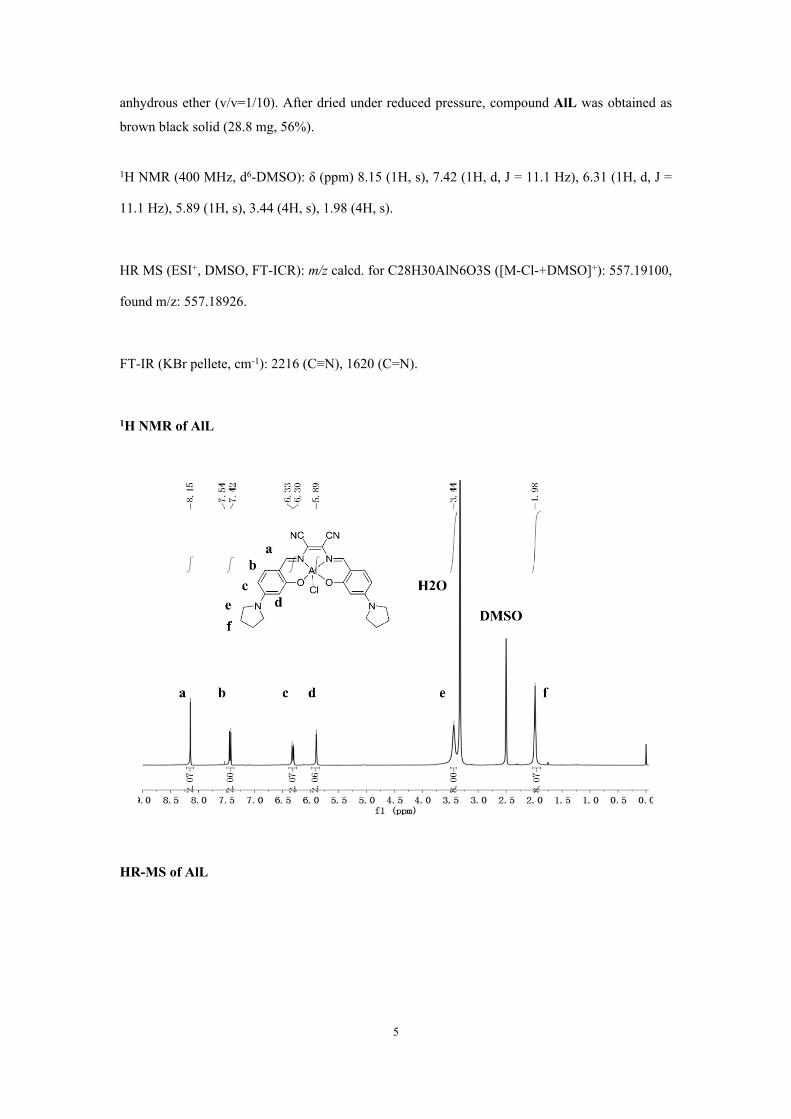
anhydrous ether (v/v=1/10). After dried under reduced pressure, compound AlL was obtained as
brown black solid (28.8 mg, 56%).
1H NMR (400 MHz, d6-DMSO): δ (ppm) 8.15 (1H, s), 7.42 (1H, d, J = 11.1 Hz), 6.31 (1H, d, J =
11.1 Hz), 5.89 (1H, s), 3.44 (4H, s), 1.98 (4H, s).
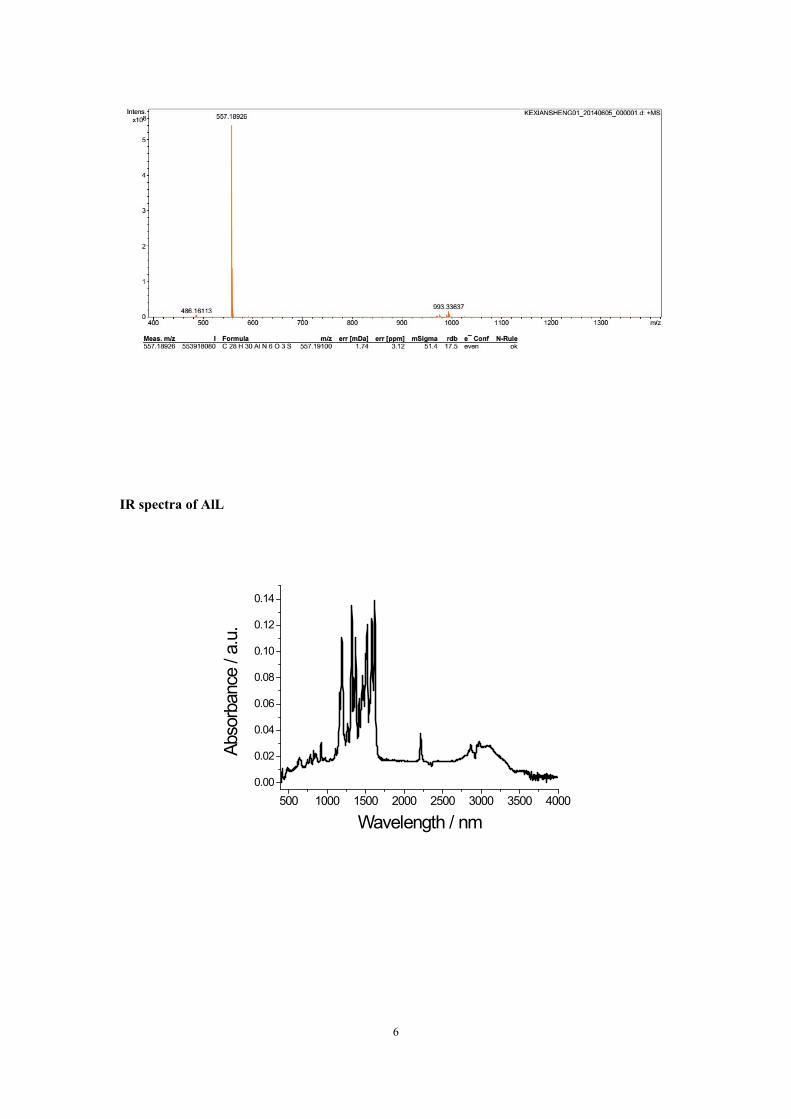
HR MS (ESI+, DMSO, FT-ICR): m/z calcd. for C28H30AlN6O3S ([M-Cl-+DMSO]+): 557.19100,
found m/z: 557.18926.
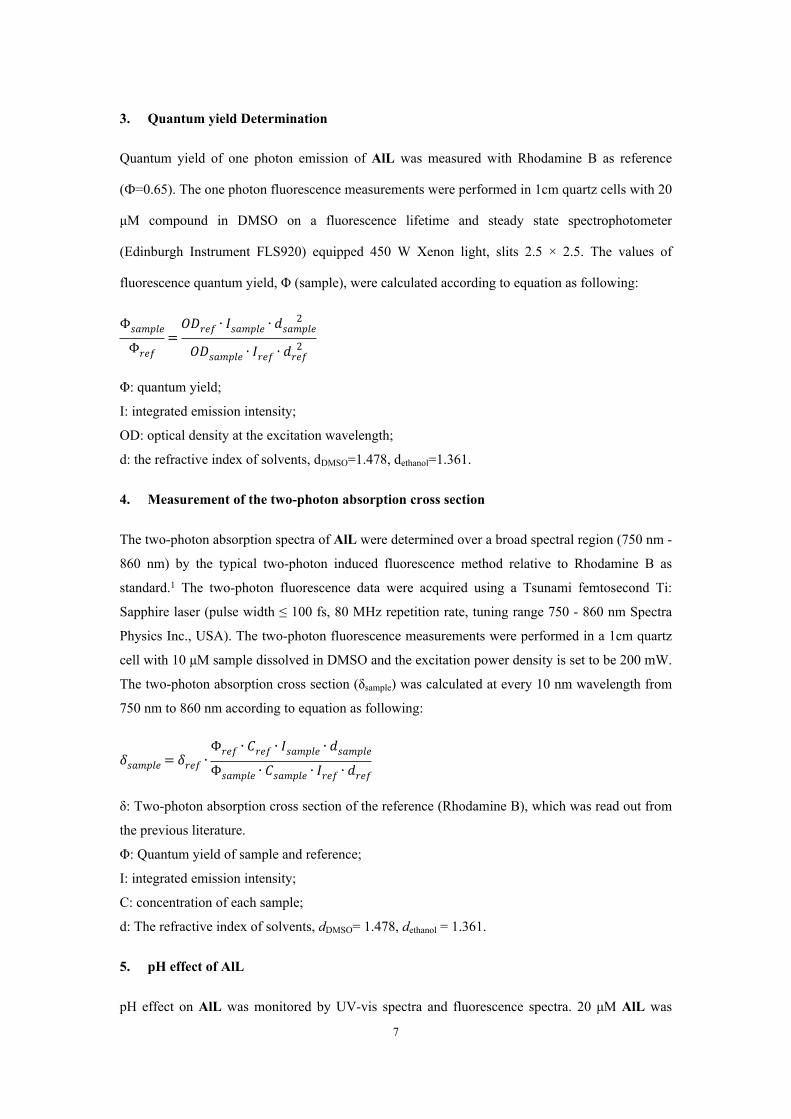
FT-IR (KBr pellete, cm-1): 2216 (C≡N), 1620 (C=N).
1H NMR of AlL
HR-MS of AlL
6
IR spectra of AlL
500 1000 1500 2000 2500 3000 3500 40000.00
0.02
0.04
0.06
0.08
0.10
0.12
0.14
Abso
rban
ce /
a.u.
Wavelength / nm
7
3. Quantum yield Determination
Quantum yield of one photon emission of AlL was measured with Rhodamine B as reference
(Ф=0.65). The one photon fluorescence measurements were performed in 1cm quartz cells with 20
μM compound in DMSO on a fluorescence lifetime and steady state spectrophotometer
(Edinburgh Instrument FLS920) equipped 450 W Xenon light, slits 2.5 × 2.5. The values of
fluorescence quantum yield, Φ (sample), were calculated according to equation as following:
Φ𝑠𝑎𝑚𝑝𝑙𝑒
Φ𝑟𝑒𝑓=𝑂𝐷𝑟𝑒𝑓 ∙ 𝐼𝑠𝑎𝑚𝑝𝑙𝑒 ∙ 𝑑
2𝑠𝑎𝑚𝑝𝑙𝑒
𝑂𝐷𝑠𝑎𝑚𝑝𝑙𝑒 ∙ 𝐼𝑟𝑒𝑓 ∙ 𝑑2𝑟𝑒𝑓
Φ: quantum yield;
I: integrated emission intensity;
OD: optical density at the excitation wavelength;
d: the refractive index of solvents, dDMSO=1.478, dethanol=1.361.
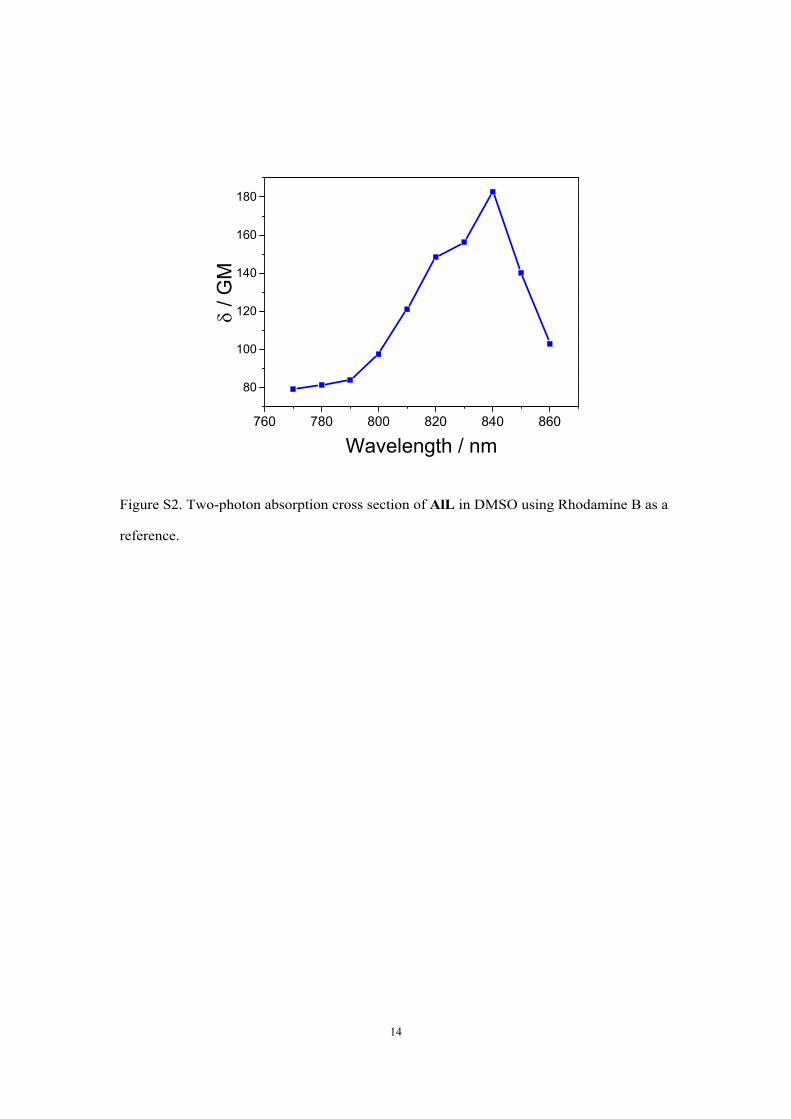
4. Measurement of the two-photon absorption cross section
The two-photon absorption spectra of AlL were determined over a broad spectral region (750 nm -
860 nm) by the typical two-photon induced fluorescence method relative to Rhodamine B as
standard.1 The two-photon fluorescence data were acquired using a Tsunami femtosecond Ti:
Sapphire laser (pulse width ≤ 100 fs, 80 MHz repetition rate, tuning range 750 - 860 nm Spectra
Physics Inc., USA). The two-photon fluorescence measurements were performed in a 1cm quartz
cell with 10 μM sample dissolved in DMSO and the excitation power density is set to be 200 mW.
The two-photon absorption cross section (δsample) was calculated at every 10 nm wavelength from
750 nm to 860 nm according to equation as following:
𝛿𝑠𝑎𝑚𝑝𝑙𝑒= 𝛿𝑟𝑒𝑓 ∙Φ𝑟𝑒𝑓 ∙ 𝐶𝑟𝑒𝑓 ∙ 𝐼𝑠𝑎𝑚𝑝𝑙𝑒 ∙ 𝑑𝑠𝑎𝑚𝑝𝑙𝑒Φ𝑠𝑎𝑚𝑝𝑙𝑒 ∙ 𝐶𝑠𝑎𝑚𝑝𝑙𝑒 ∙ 𝐼𝑟𝑒𝑓 ∙ 𝑑𝑟𝑒𝑓
δ: Two-photon absorption cross section of the reference (Rhodamine B), which was read out from
the previous literature.
Φ: Quantum yield of sample and reference;
I: integrated emission intensity;
C: concentration of each sample;
d: The refractive index of solvents, dDMSO= 1.478, dethanol = 1.361.
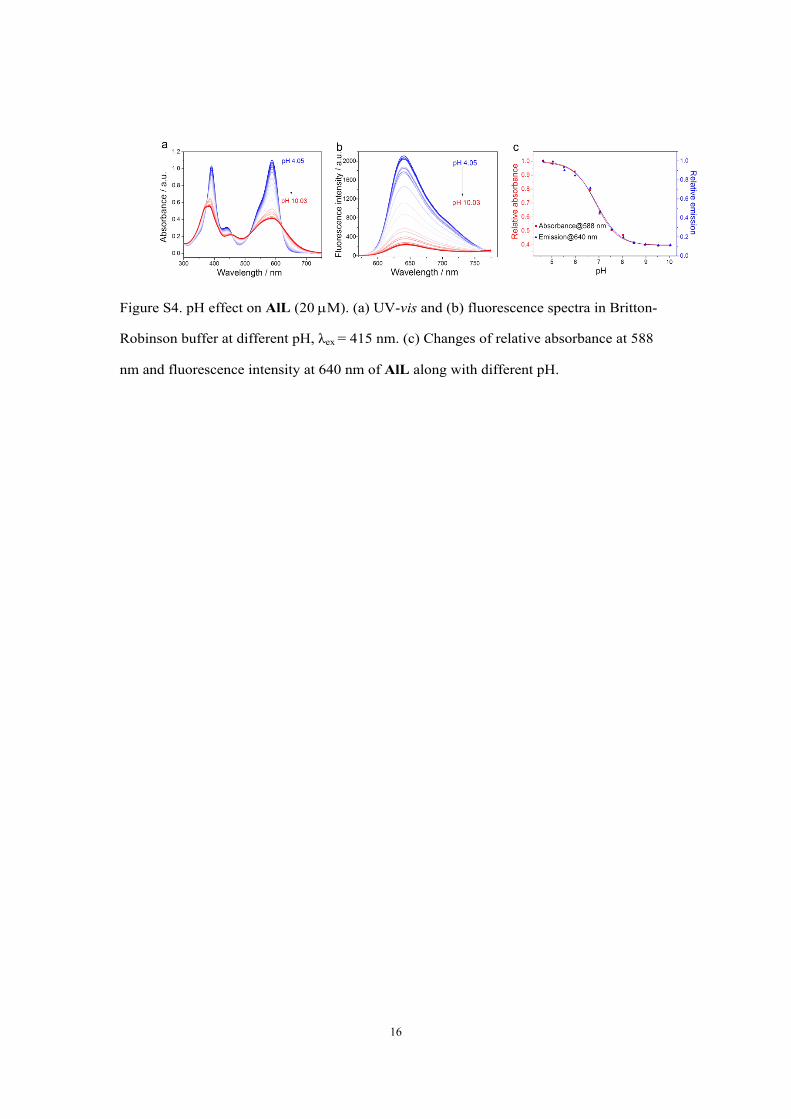
5. pH effect of AlL
pH effect on AlL was monitored by UV-vis spectra and fluorescence spectra. 20 μM AlL was
8
dissolved in Britton-Robinson buffer of different pH (4.0-10.0).
6. Binding ability of AlL to phospholipids
Binding ability was assessed by UV-vis spectra, fluorescence spectra and ITC. The titration was
carried out in Hepes buffer (pH 6.0) containing 20 μM AlL. For the ITC experiments, the titrate
(POPG) and the substrate (AlL) were prepared in the same mixture solution (DMSO: Hepes) to
avoid the solvent dilution heat.
7. Lop P of AlL-PG adduct
Equal amounts of n-octanol and Hepes buffer (pH 6.0, 10 mM) were thoroughly mixed by an oscillator for 24 h. The mixture was then left to separate for another 24 h to finally yield aqueous and octanol phase, each saturated with the other. We first dissolved AlL in HEPES buffer at 20 μM level, and then added 20 μM of PG to in situ form AlL-PG (Co), followed by mixing with equal amounts of octanol (saturated with water) and shaken again as described above. After separation, the final concentrations of compounds in Hepes buffer corresponded to Cw. The final concentration in 1-octanol corresponded to Coil.
[5]
8.
( . S3) oil
water
CP EquationC
8. GUV preparation
GUVs were prepared by gentle hydration method.3 POPC/POPG/FI-PE/cholesterol (molar ratio
10:1: 0.1:2.5; mass ratio 20 mg:2.2 mg:0.2 mg:2 mg) were dissolved in 10 mL mixed solvent of
chloroform and methanol (volume ratio 3:1) in a glass round-bottom flask. The solvent was
evaporated with rotary evaporator. The round-bottom flask was left inside a vacuum chamber
overnight to remove residue solvent. The lipid film was under a stream of water saturated nitrogen
for half an hour to prehydrate the film. About 10 mL of GUV buffer (PBS containing 200 mM
sucrose, pH 7.4) was then gently transferred into the tube and against the tube walls. The round-
bottom flask was left inside the 37℃ water bath overnight. AlL solution (2 mM stocking in
DMSO) was added into the well prepared GUVs solution, and the mixture was stirred softly for
half an hour. To get confocal images, the vesicles were placed in a PBS (pH 7.4) containing 200
mM glucose environment. The effect of gravity could fix the vesicle to make for a snapshot.
9
9. Cell culture
HeLa cells were incubated in complete medium (Dulbecco’s modified Eagle’s Medium,
supplemented with 10% fetal bovine serum (FBS) and 1% penicillin-streptomycin) at 37°C in
atmosphere containing 5% CO2.
10. CCK-8 assay
HeLa cells were seeded in flat-bottomed 96-well plates, 1104 cells per well, with 200 μL
complete culture media for 24 h. After washed with PBS for three times, the cells were incubated
with different concentrations of LD-TPZn. All stock solutions were prepared in DMSO (2 mM)
and diluted with complete media. After cultured for 24 h, the cells were washed with PBS (pH 7.4)
three times. 10 μL Cell Counting Kit-8 (CCK-8) solution and 90 μl PBS (pH 7.4) were added per
well simultaneously. After 2 hours, the absorbance at 450nm was read by 96-well plates reader.
The viability of Hela cells was calculated by the following equation:
CV = (As-Ab) / (Ac-Ab) × 100%
CV stands for the viability of cells, As, Ac and Ab stand for the absorbance of cells containing
LD-TPZn, cell control( 0 μΜ LD-TPZn) and blank control ( wells containing neither cells nor
LD-TPZn).
11. Pulse-chase confocal imaging of AlL
A stock solution of AlL in chromatographic grade, anhydrous DMSO was prepared as 2 mM. The
solution was diluted to a final concentration of 1 μM by complete growth medium. LysoTracker®
Deep Red and Hoechst 33342 were prepared as 1 mM DMSO stock solution and 10 mg mL-1
water solution, respectively. The stock solution was diluted to the working concentration in
complete medium (72 nM and 10 g mL-1 Hoechst 33342).
Hela cells were grown to about 80% confluency and then reseeded in 24-well plates; cells were
transfected with 0.8 μg pECFP-Golgi plasmid, using LipfectamineTM 2000 according to
manufacturer’s instruction. After 6 h, HeLa cells were digested with trypsin and replaced onto 0.1
mM poly-D-lysine coated glasses in complete media and the cells were incubated for 24 h.
HeLa cells were incubated with LysoTracker® Deep Red for 30 min and Hoechst 33342 for 5 min,
respectively. After washed with PBS (pH 7.4) for three times, cells were incubated with 1 μM AlL
for 5 min. Then cells were washed with PBS (pH 7.4) for three times and further incubated in
fresh complete growth medium. Confocal imaging was carried out at 0 min or 30 min The cells
Images were taken under conditions as follows: 60× immersion lens with a resolution of
10
1024×1024 and a speed of 0.25 frame per second; 80% laser power for Hoechst 33342, 405 nm
excitation wavelength and 425 to 475 nm detector slit; 50% laser power for pECFP-Golgi, 488 nm
excitation wavelength and 500 to 530 nm detector slit; 100% laser power for AlL, 543 nm
excitation wavelength and 552 to 617 nm detector slit; 20% laser power for LysoTracker® Deep
Red, 639 nm excitation wavelength and 662 to 737 nm detector slit;. Differential interference
contrast (DIC) and fluorescent images were processed and analyzed using ImageJ. The Pearson’s
Coefficient was calculated by ImageJ.
For ImageStream flow cytometry analysis, cells are detached from culture to produce a cell
suspension of 2106 cells in 2 mL PBS (pH 7.4). Images were acquired on the Imagestream®
imaging cytometer (Amnis Corp., Seattle, WA). At least 10,000 images were collected for each
sample. Cells were collected with the laser scatter image in channel 1, the pECFP-Golgi image in
channel 2 (green, 488 nm excitation wavelength), the AlL image in channel 10 (red, 561 nm
excitation wavelength), LysoTracker® Deep Red image in channel 11 (purple, 642 nm excitation
wavelength), and the bright field image in channel 5 (white). Post-acquisition spectral
compensation and data analysis was performed using IDEAS® image analysis software package
(Amnis Corp.) based on a novel algorithm, the similarity bright detail score (SBDS), which is
designed to quantitate the degree of co-localization of two cell surface proteins. SBDS quantifies
the degree of similarity between any two channel images on a pixel- by-pixel and cell-by-cell
basis. The SBDS is calculated in a three-step process: 1) determination of the opening residue
image for each channel image; 2) calculation of a non-mean normalized Pearson's correlation
coefficient; 3) log transformation of the correlation coefficient to give roughly Gaussian
distributions, the mean of which is the SBDS. The SBDS is calculated for each of ∼10,000 cells
per data file and averaged, thus allowing for a rigorous and statistically significant analysis of each
cell population. Similarity algorithm is now widely used for studying the intracellular localization
and trafficking.
For time-series imaging of the dynamic of the subcellular translocation, HeLa cells were incubated
with 1 μM AlL for 5 min and then incubated in fresh complete growth medium without phenol red.
XYTime images were obtained using a confocal microscope equipped with a live cell incubator.
12. Mechanism of cellular internalization pathway
The cellular uptake of luminescent metal complexes is primarily examined using confocal
microscopy. In the temperature effect assay, cells were placed at 4 oC for 30 minutes, and then
incubated with AlL for 5 min at 4 oC. For endocytosis mechanism investigation, various
endocytosis inhibitors including chlorpromazine (inhibitor of clathrin-mediated endocytosis, 10
μg·mL-1), MβCD (inhibitor of caveolae-mediated endocytosis, 10 mM), cytochalasin D (inhibitor
of macropinocytosis, 5 μg·mL-1) were applied to cells for 30 minutes. Then medium containing
both inhibitors and complex was used for incubation for 5 min. In the membrane potential effect
11
assay, HeLa cells were washed three times with either HBSS (containing 5.8 mM K+) or high K+-
HBSS (containing 170 mM K+). Some of the cells in HBSS were pretreated with 10 µM nigericin
for 30 min at 37°C. The cells were incubated with 1 µM AlL for 5 min at 37°C in one of the
following solutions: HBSS, HBSS with nigericin (to hyperpolarize the cells), or high K+-HBSS
(to depolarize the cells). For the transportation to Golgi apparatus, HeLa cells were pretreated with
nocodazole (60 μM) or Brefeldin A (50 μM) for 1 h, and then were treated with medium
containing both inhibitors and complex for 5 min.
After incubation, the cells were rinsed, and the extent of uptake was analyzed by confocal imaging
and dealt with ImageJ. Images were taken under conditions as follows: 60× immersion lens with a
resolution of 1024×1024 and a speed of 0.5 frame per second, 543 nm excitation wavelength and
552 to 617 nm detector slit, 100% laser power for dye. Differential interference contrast (DIC) and
fluorescent images were processed and analyzed using ImageJ.
13. Mechanism of subcellular translocation
The cellular translocation is primarily examined using a Nikon A1R-si Laser Scanning Confocal
Microscope (Japan). In the temperature effect assay, cells were incubated with 1 μM AlL for 5
min and further incubated in fresh complete growth medium for 30 min at 37℃ or 19.5℃. In the
cytoskeleton effect assay,
To disrupt the function of microtubules, HeLa cells were incubated with 60 µM nocodazole for 2
h. To disrupt the function of microfilaments, HeLa cells were incubated with media containing 5
μgmL-1 cytochalasin B for 30 min. Then cells were incubated with 1 μM AlL for 5 min and
further incubated in fresh complete growth medium for 30 min at 37℃. The inhibitors were
maintained in the cell culture throughout the experiments.
14. Two-photon confocal microscopy imaging
Two photon fluorescence microscopy images were performed on ZEISS LSM 510 META
microscope system. HeLa cells seeded on 0.17 mm-thick cover glasses were incubated with 1 μM
AlL for 5 min. After washed with PBS (pH 7.4) for three times, two-photon imaging was carried
out. The microscopy settings were as follows: 60× objective, a resolution of 1024×1024, 840 nm
excitation wavelength, 80% laser power (50 mW).
12
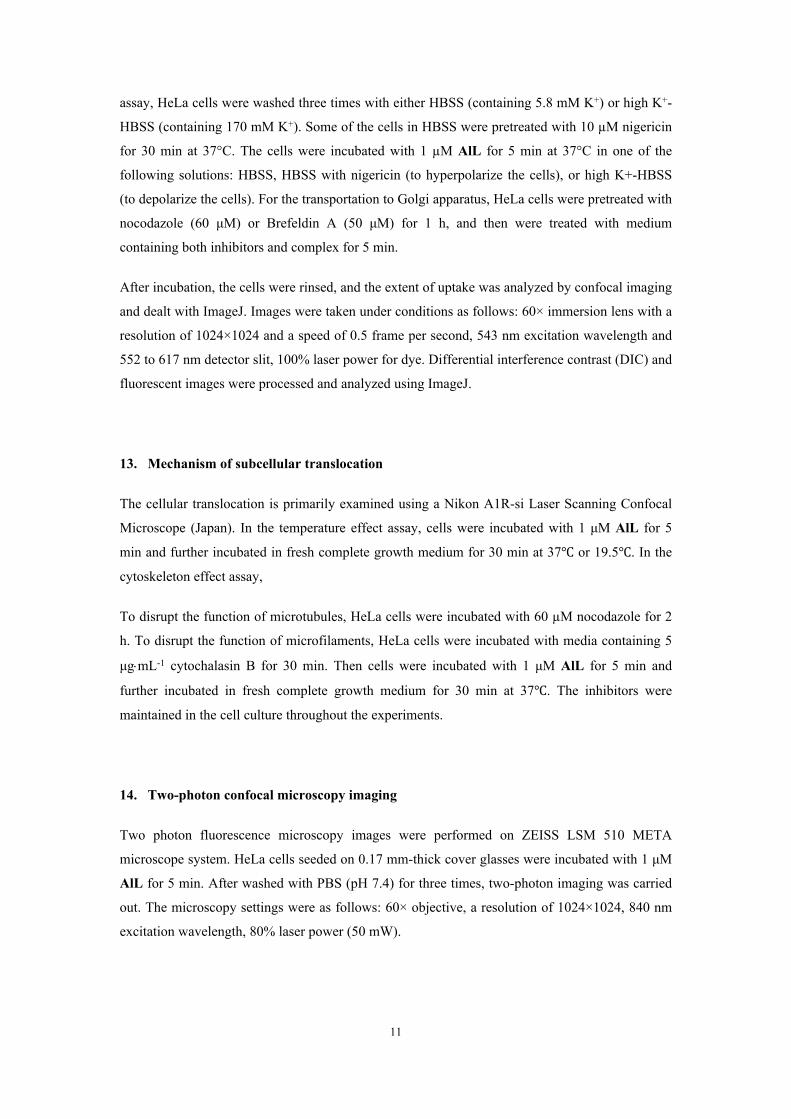
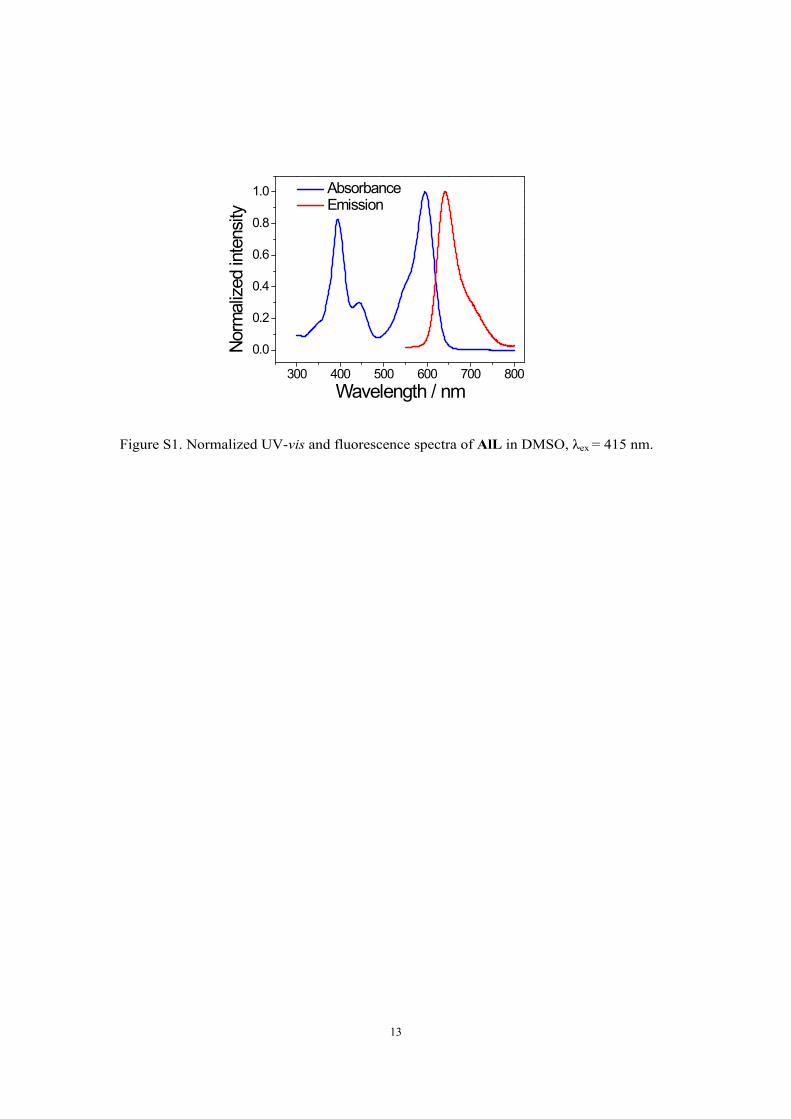
Table S1. Photophysical data of AlL a
λabs(nm) εb (*104M-1cm-1) λem (nm) Φc τ (ns)
394, 443, 595 4.92, 1.73, 5.98 643 0.42 4.3a AlL was dissolved in DMSO (20 M);ε: extinction coefficients. Φ: Quantum yield, which
was measured using Rhodamine B in ethanol as reference; τ: fluorescence lifetime.
13
300 400 500 600 700 800
0.0
0.2
0.4
0.6
0.8
1.0 Absorbance Emission
Wavelength / nm
Norm
alize
d in
tens
ity
Figure S1. Normalized UV-vis and fluorescence spectra of AlL in DMSO, λex = 415 nm.
14
760 780 800 820 840 860
80
100
120
140
160
180
Wavelength / nm
/ G
M
Figure S2. Two-photon absorption cross section of AlL in DMSO using Rhodamine B as a
reference.
15
300 400 500 600 700
0.0
0.5
1.0
1.5A
bsor
banc
e / a
.u.
Wavelength / nm
0 s
7200 s
0 1000 2000 3000 4000 5000 6000 7000 8000
0.1
0.2
In(A
0/A)
Time / s
Equation y = a + b*x
Weight No WeightingResidual Sum of Squares
3.22067E-4
Pearson's r 0.9981Adj. R-Squ 0.99607
Value Standard Er
ln(A0/A)Intercept 0.05196 0.00113Slope 2.88424E 3.48767E-7
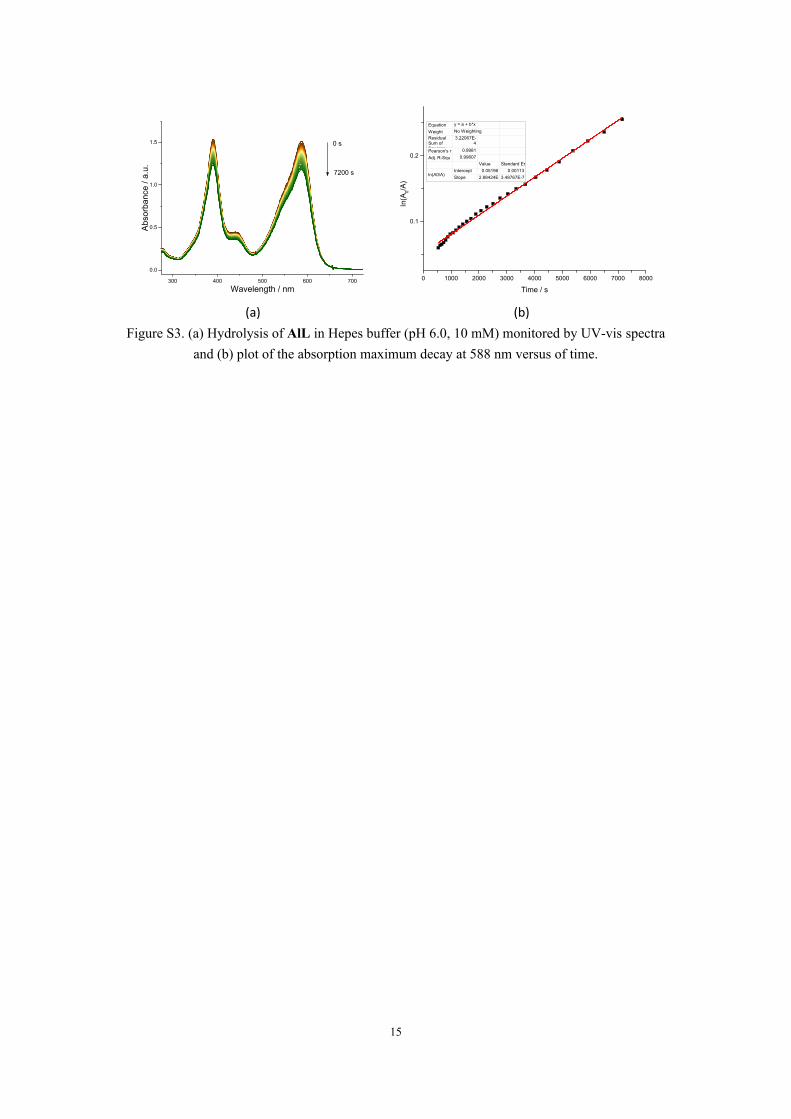
(a) (b)Figure S3. (a) Hydrolysis of AlL in Hepes buffer (pH 6.0, 10 mM) monitored by UV-vis spectra
and (b) plot of the absorption maximum decay at 588 nm versus of time.
16
Figure S4. pH effect on AlL (20 M). (a) UV-vis and (b) fluorescence spectra in Britton-
Robinson buffer at different pH, λex = 415 nm. (c) Changes of relative absorbance at 588
nm and fluorescence intensity at 640 nm of AlL along with different pH.
17
300 400 500 600 7000.0
0.2
0.4
0.6
0.8
1.0Ab
sorb
ance
/ a.
u.
Wavelength / nm
0 equiv 17 equiv 52 equiv 200 equiv
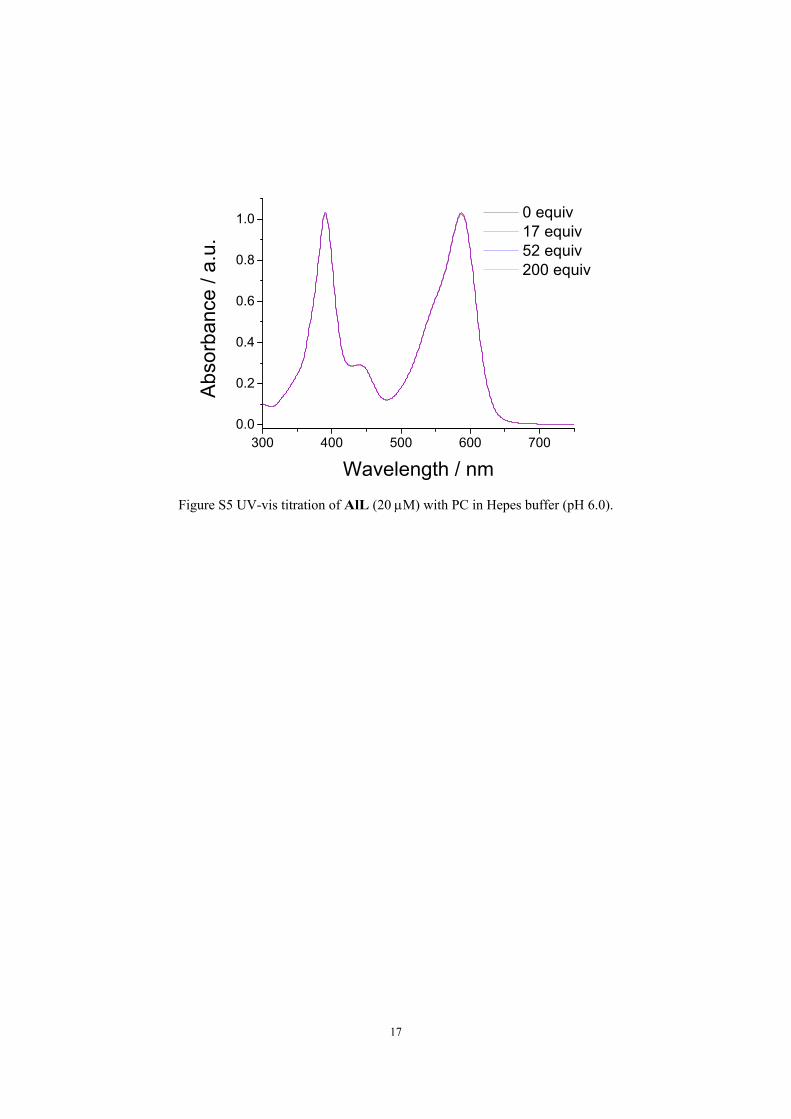
Figure S5 UV-vis titration of AlL (20 M) with PC in Hepes buffer (pH 6.0).
18
300 400 500 600 7000.0
0.2
0.4
0.6
0.8
1.0Ab
sorb
ance
/ a.
u.
Wavelength / nm
0 equiv 17 equiv 52 equiv 200 equiv
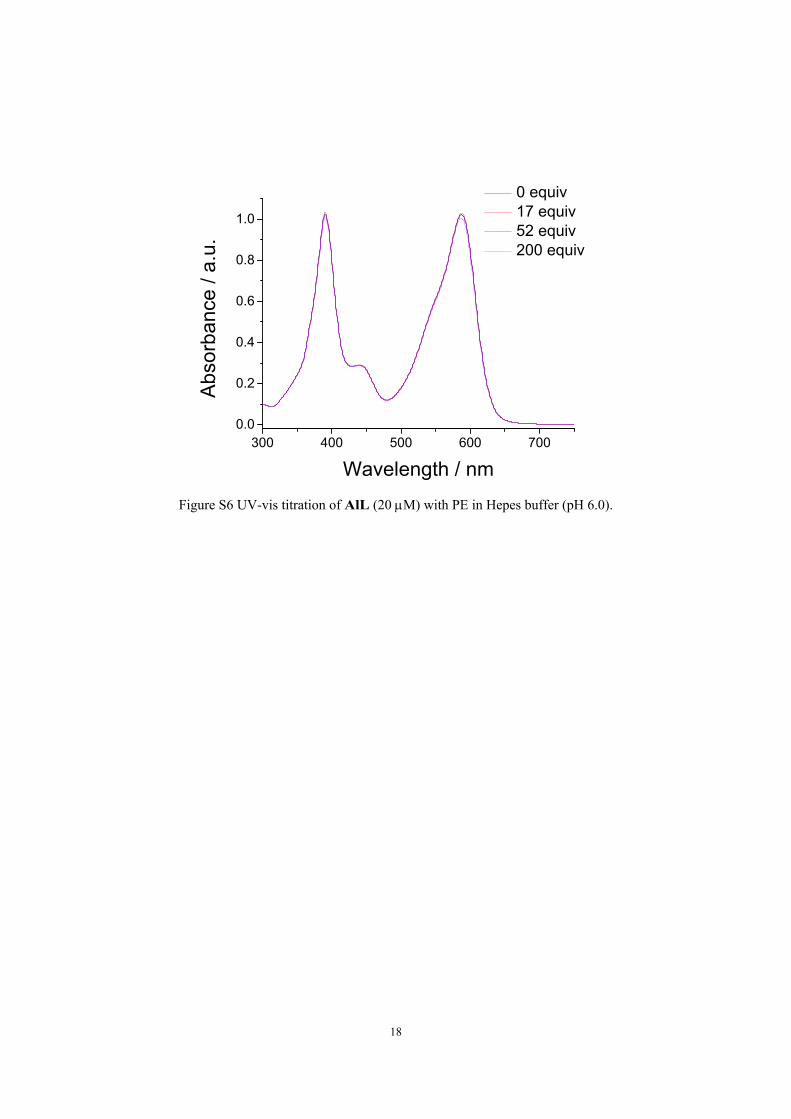
Figure S6 UV-vis titration of AlL (20 M) with PE in Hepes buffer (pH 6.0).
19
300 400 500 600 7000.0
0.2
0.4
0.6
0.8
1.0
Abs
orba
nce
/ a.u
.
Wavelength / nm
0 equiv 0.3 equiv 0.7 equiv 0.9 equiv 1.1 equiv
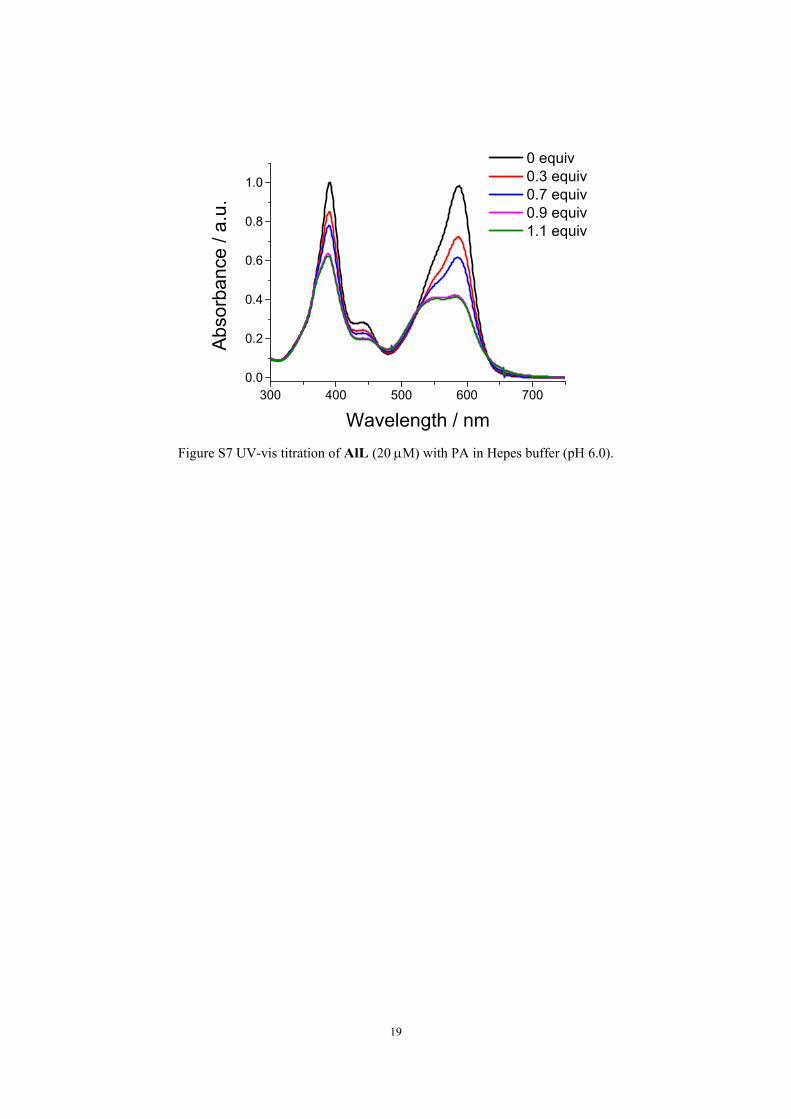
Figure S7 UV-vis titration of AlL (20 M) with PA in Hepes buffer (pH 6.0).
20
400 500 600 700
0.0
0.2
0.4
0.6
0.8
1.0
Abs
orba
nce
/ a.u
.
Wavelength / nm
Golgi-Al Golgi-Al-ctDNA
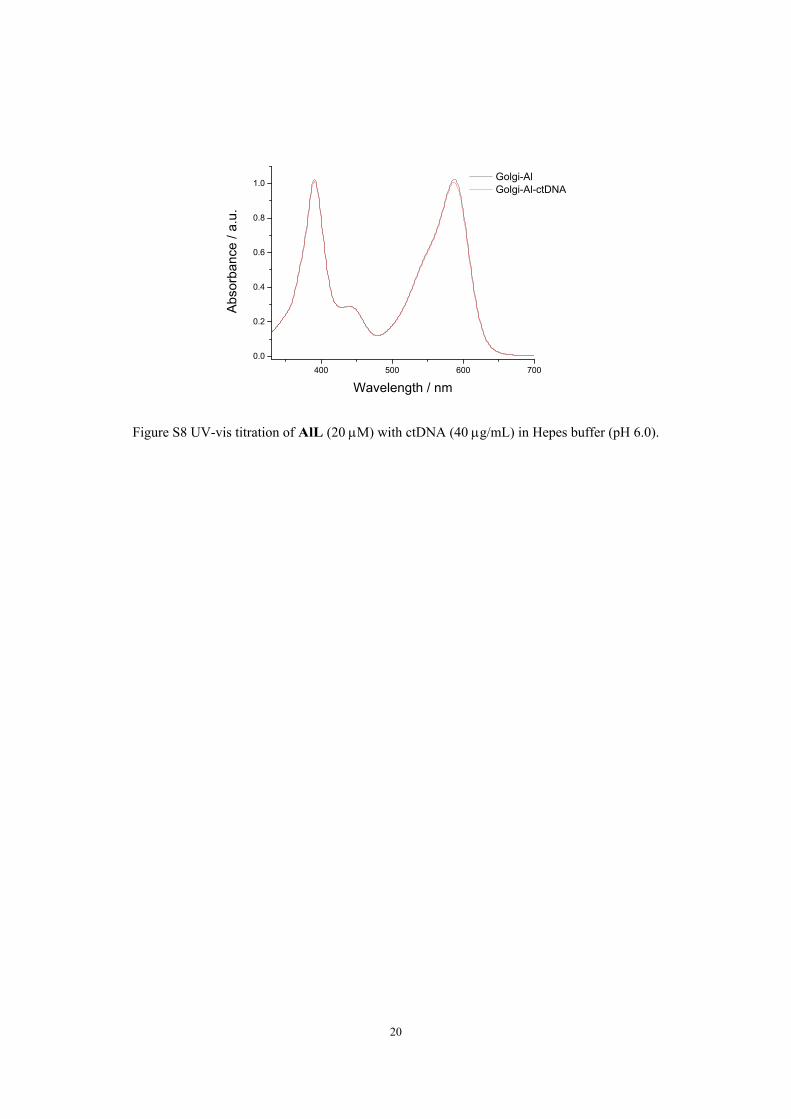
Figure S8 UV-vis titration of AlL (20 M) with ctDNA (40 g/mL) in Hepes buffer (pH 6.0).
21
(a) (b)
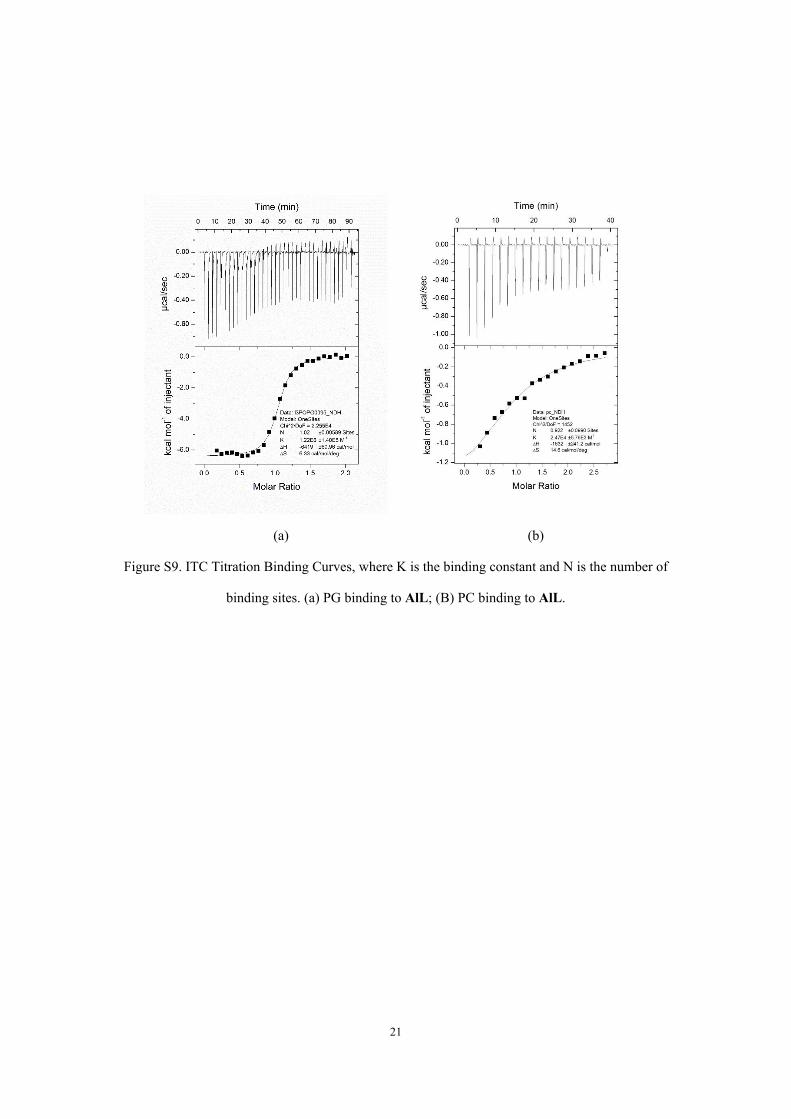
Figure S9. ITC Titration Binding Curves, where K is the binding constant and N is the number of
binding sites. (a) PG binding to AlL; (B) PC binding to AlL.
22
(1)
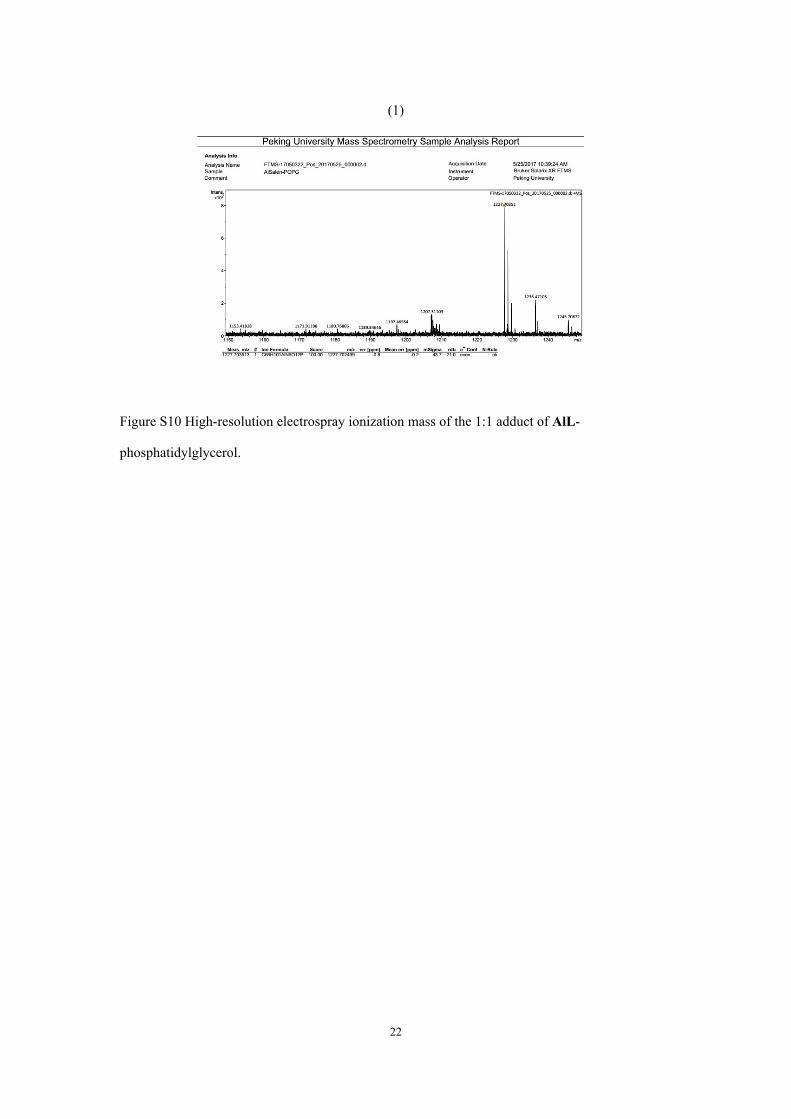
Figure S10 High-resolution electrospray ionization mass of the 1:1 adduct of AlL-
phosphatidylglycerol.
23
300 400 500 600 700
0.0
0.5
1.0
1.5
2.0
Abso
rban
ce /
a.u.
Wavelength / nm
0 s
11 s
-1 0 1 2 3 4 5 6 7 8 9 10 11 12
1.0
1.2
1.4
1.6
1.8
2.0
390 nm 588 nm
Abso
rban
ce /
a.u.
Time / s
Model Exponential
Equationy = y0 + A*exp(R0*x)
Reduced Chi-Sqr
2.51368E-4 0.00151
Adj. R-Squar 0.99192 0.96993Value Standard Err
390y0 1.16866 0.00442A 0.69258 0.01437R0 -0.7986 0.03286
588y0 1.00554 0.01101A 0.86571 0.03498R0 -0.7677 0.06171
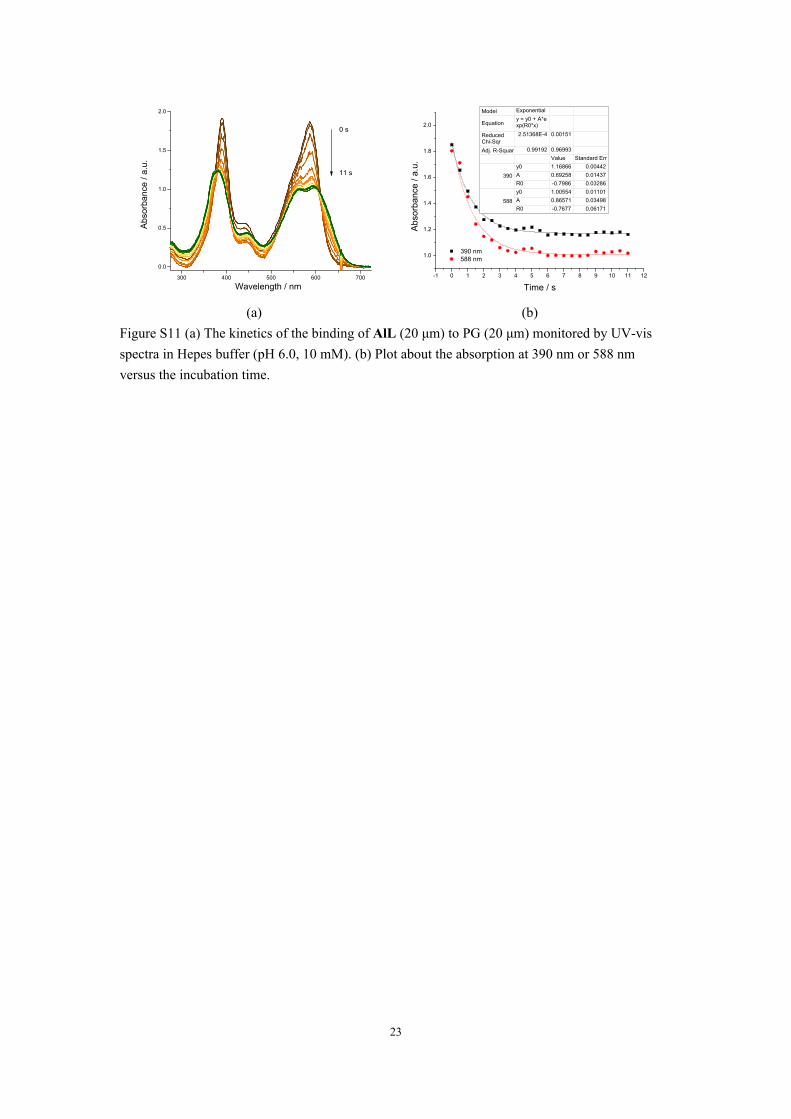
(a) (b) Figure S11 (a) The kinetics of the binding of AlL (20 μm) to PG (20 μm) monitored by UV-vis spectra in Hepes buffer (pH 6.0, 10 mM). (b) Plot about the absorption at 390 nm or 588 nm versus the incubation time.
24
450 500 550 600 650 700 750 8000
200
400
600
800
1000
1200E
mis
sion
/ a.
u.
Wavelength / nm
Hepes buffer CHCl3
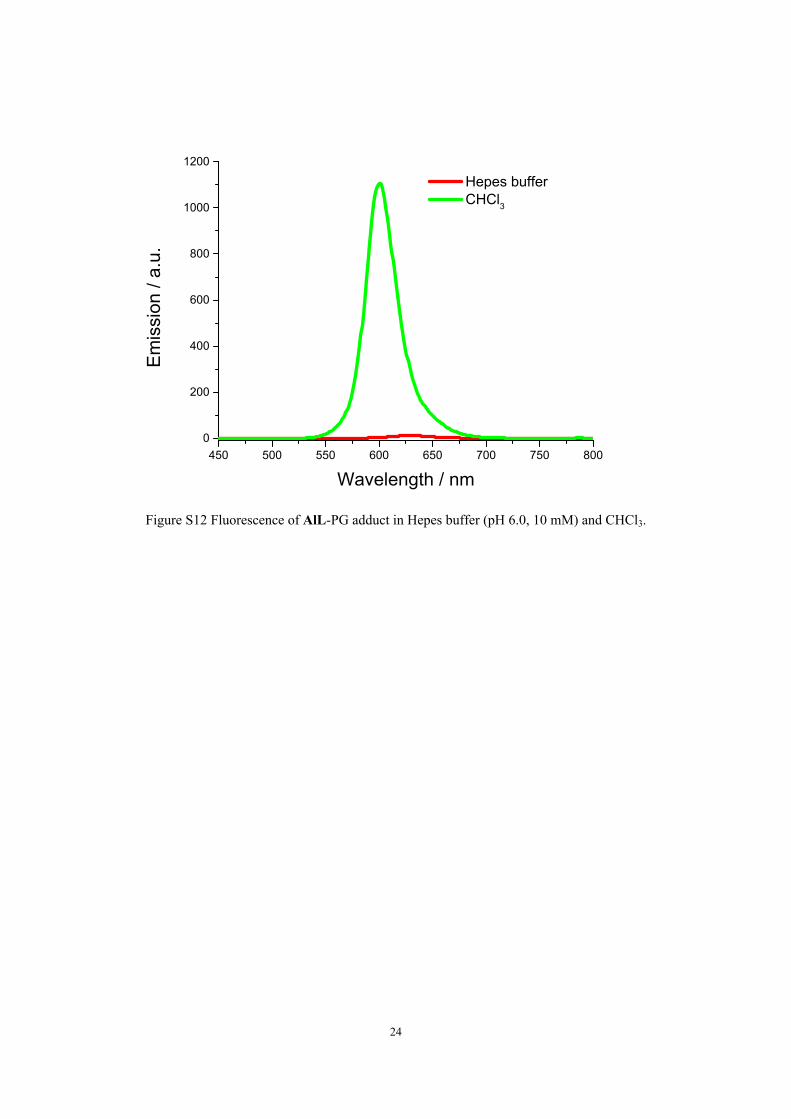
Figure S12 Fluorescence of AlL-PG adduct in Hepes buffer (pH 6.0, 10 mM) and CHCl3.
25
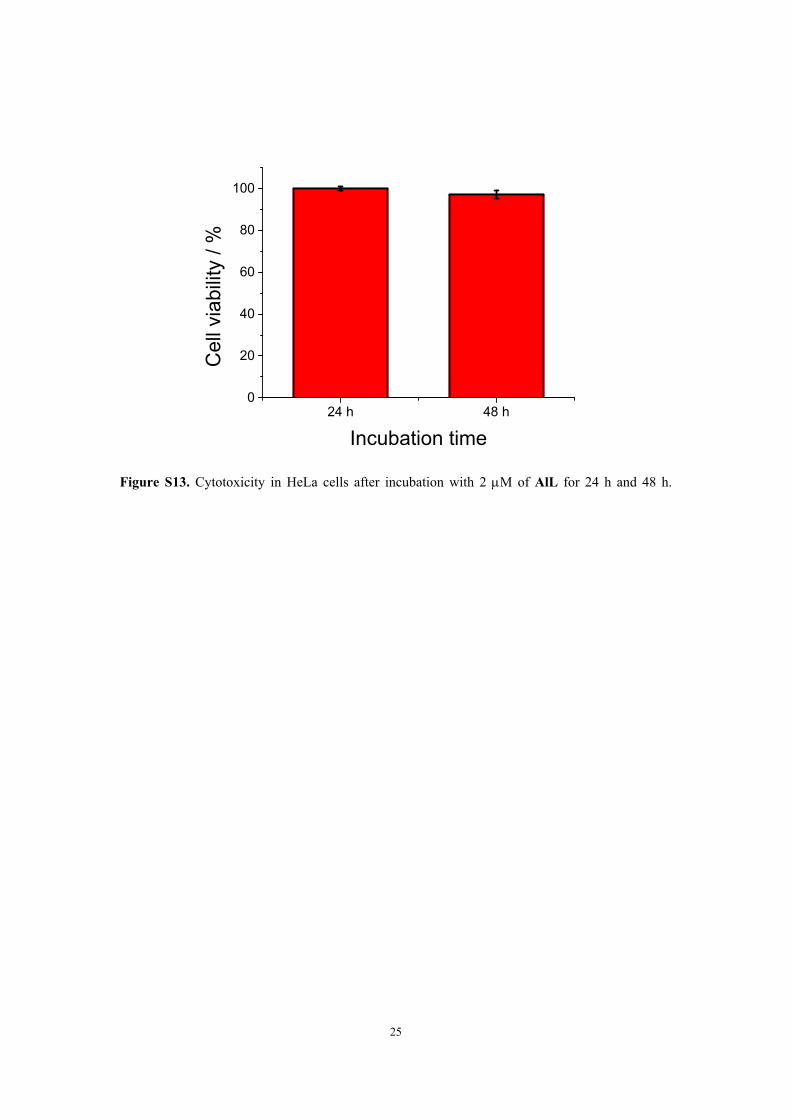
24 h 48 h0
20
40
60
80
100
Cel
l via
bilit
y / %
Incubation time
Figure S13. Cytotoxicity in HeLa cells after incubation with 2 M of AlL for 24 h and 48 h.
26
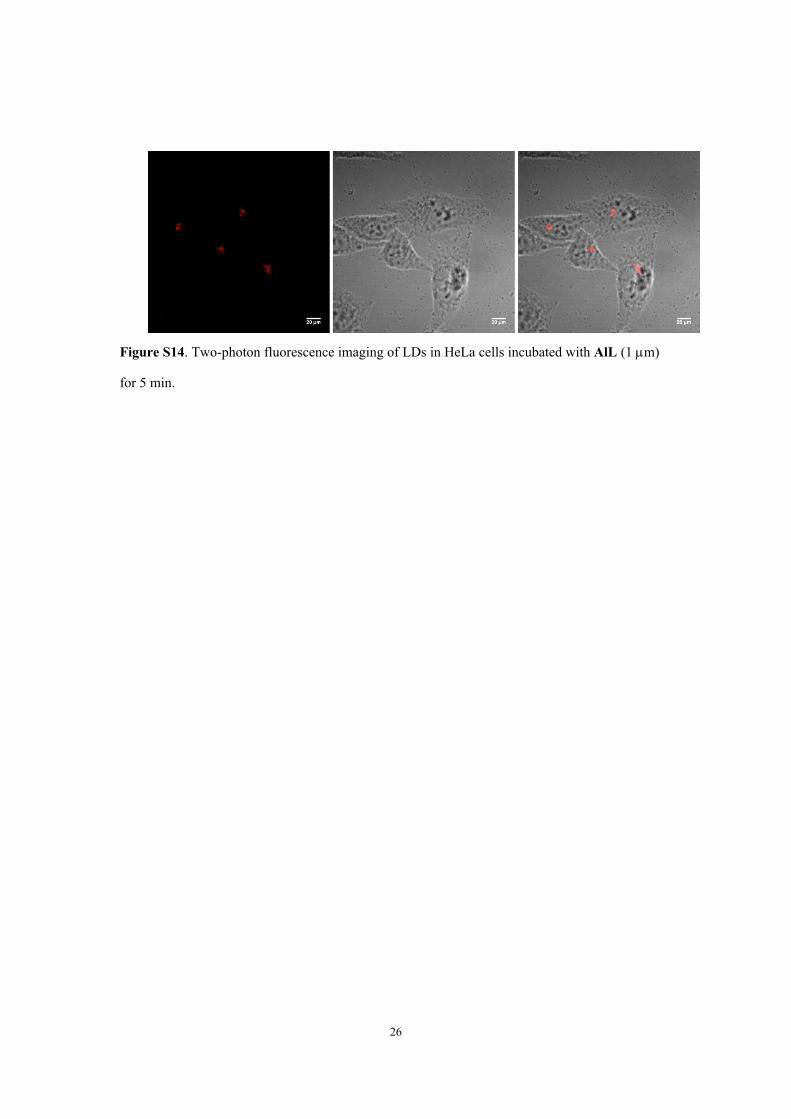
Figure S14. Two-photon fluorescence imaging of LDs in HeLa cells incubated with AlL (1 m)
for 5 min.
27
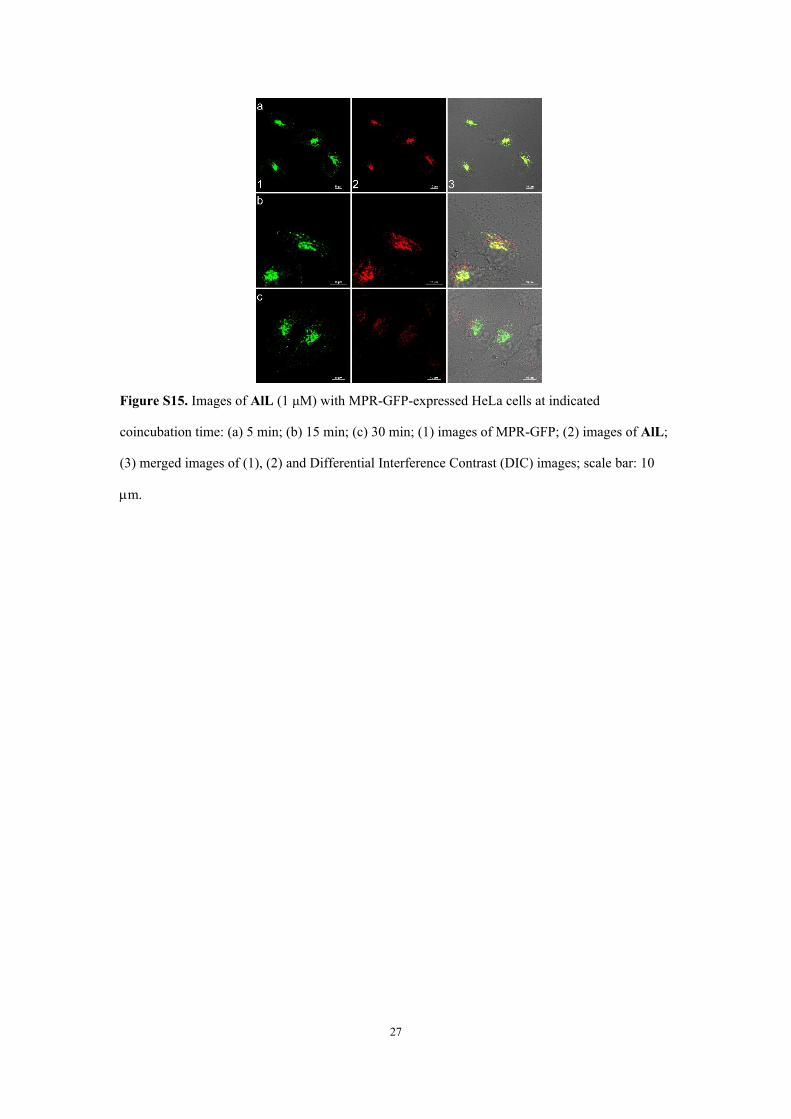
Figure S15. Images of AlL (1 μM) with MPR-GFP-expressed HeLa cells at indicated
coincubation time: (a) 5 min; (b) 15 min; (c) 30 min; (1) images of MPR-GFP; (2) images of AlL;
(3) merged images of (1), (2) and Differential Interference Contrast (DIC) images; scale bar: 10
m.


![Supporting Information - RSC · 2021. 2. 16. · 2.3 Synthesis of BCP amides. To a solution of [1.1.1]propellane (2 mL, 0.17 M, 0.34 mmol) was added 2-chloro-2-oxoacetate (0.34 mmol)](https://img.pdfslide.net/doc/110x75/61321fd1dfd10f4dd73a3ec4/supporting-information-2021-2-16-23-synthesis-of-bcp-amides-to-a-solution.jpg)