Embed Size (px)
Citation preview


2 Corporate Information
4 2021 Interim Results Financial Highlights
5 2021 Business Highlights
6 Chief Executive Officer’s Statement
8 Management Discussion and Analysis
19 Unaudited Condensed Consolidated Statement of Profit or Loss and Other Comprehensive Income
22 Unaudited Condensed Consolidated Statement of Financial Position
24 Unaudited Condensed Consolidated Statement of Changes in Equity
25 Unaudited Condensed Consolidated Statement of Cash Flows
26 Notes to the Unaudited Condensed Consolidated Interim Financial Statements
65 Other Information
CO
NTE
NTS

CORPORATE INFORMATION
B C T E C H N O L O G Y G R O U P L I M I T E D I N T E R I M R E P O R T 2 0 2 12
AUTHORISED REPRESENTATIVES
Mr. Lo Ken Bon
Ms. Chau Wing Kei
COMPANY SECRETARY
Ms. Chau Wing Kei
PRINCIPAL BANKERS
The Hongkong and Shanghai Banking Corporation Limited
Bank of China (Hong Kong)
China Merchants Bank
Bank of Communications Co., Limited
Chiyu Banking Corporation Limited
Signature Bank
Silvergate Bank
INDEPENDENT AUDITOR
PricewaterhouseCoopers
Certified Public Accountants and
Registered Public Interest Entity Auditor
LEGAL ADVISOR
Baker & McKenzie
REGISTERED OFFICE
Cricket Square, Hutchins Drive
P.O. Box 2681
Grand Cayman KY1-1111
Cayman Islands
PRINCIPAL PLACE OF BUSINESS IN HONG KONG
39/F, Lee Garden One
33 Hysan Avenue
Causeway Bay, Hong Kong
BOARD OF DIRECTORS
Executive Directors
Mr. Madden Hugh Douglas (Chief Executive Officer)
Mr. Lo Ken Bon (Deputy Chairman)
Mr. Ko Chun Shun, Johnson
Mr. Chapman David James
Mr. Tiu Ka Chun, Gary
Independent Non-Executive Directors
Mr. Chau Shing Yim, David
Mr. Chia Kee Loong, Lawrence
Mr. Tai Benedict
BOARD COMMITTEES
Audit Committee
Mr. Chau Shing Yim, David (Chairman)
Mr. Chia Kee Loong, Lawrence
Mr. Tai Benedict
Remuneration Committee
Mr. Chau Shing Yim, David (Chairman)
Mr. Lo Ken Bon
Mr. Chia Kee Loong, Lawrence
Nomination Committee
Mr. Lo Ken Bon (Chairman)
Mr. Chau Shing Yim, David
Mr. Chia Kee Loong, Lawrence
Risk Management Committee
Mr. Lo Ken Bon (Chairman)
Mr. Chau Shing Yim, David
Mr. Tai Benedict
Mr. Sikora Marek (Chief Risk Officer)

CORPORATE INFORMATION
B C T E C H N O L O G Y G R O U P L I M I T E D I N T E R I M R E P O R T 2 0 2 1 3
PRINCIPAL PLACE OF BUSINESS IN THE PEOPLE’S REPUBLIC OF CHINA
Unit 1704,
Shanghai Times Square,
No. 99 Middle Huaihai Road,
Huangpu District,
Shanghai, China
SHARE REGISTRAR AND TRANSFER OFFICE
Principal Registrars
Conyers Trust Company (Cayman) Limited
Cricket Square, Hutchins Drive
P.O. Box 2681
Grand Cayman KY1-1111
Cayman Islands
Hong Kong Branch Share Registrar and Transfer Office
Tricor Investor Services Limited
Level 54, Hopewell Centre
183 Queen’s Road East
Hong Kong
INVESTOR RELATIONS
Investor Relations Department
Telephone: (852) 3504 3200
Website: bc.group
Email: [email protected]

B C T E C H N O L O G Y G R O U P L I M I T E D I N T E R I M R E P O R T 2 0 2 14
2.8
3.8
69
67
117
114
Assets on platform
2021 Interim Results Financial Highlights
+5,003%
0.06m 3.1m1H2020 1H2021
HKD HKD
Exchange revenue
Significant Revenue Growth Across Digital Asset Business Units
Material Growth in Trading Volume For All Products & Services
Digital asset business revenue
Total digital asset trading volume
+70% YoY to
HKD114 million (m)
+70% YoY toHKD117 billion (b)
Prime brokerage revenue
+65%
63.8m 105.3m1H2020 1H2021
HKD HKD
1H2020
1H2020
31 DEC 2020
1H2021
1H2021
30 JUN 2021
+28%
68b1H2020
HKD
88b1H2021
HKD
Prime brokerage trading volume
SaaS trading volume
+7,506%
0.3b1H2020
HKD
24.3b1H2021
HKD
Exchange trading volume
+180%0.7m 2.1m1H2020 1H2021
HKD HKD
Revenue from custody and other fees
YoY
OSL active clients increased over
10x
Strong Increase in Active Clients and Assets on Platform
+32%
3.5m1H2021
HKD
SaaS service fee revenue
2.7m1H2020
HKD
+3,029%0.2b1H2020
HKD
4.9b1H2021
HKD
+36%
HKD3.8bcompared with 31 Dec 2020 to

B C T E C H N O L O G Y G R O U P L I M I T E D I N T E R I M R E P O R T 2 0 2 1 5
2021 Interim Results Financial Highlights 2021 Business Highlights
Share placement led by Macquarie for HKD543 million,
GIC as sole placee
Technology service provider for the 24/7 DBS digital asset exchange
Joint Venture with Standard Chartered
to create Europe-based institutional digital
asset trading platform
Share placement led byMorgan Stanley for
HKD698 million
Licensed OSL Exchange and Brokerage go live, successfully trades first security token with BCAP
Prime brokerage services for VSAL’s regulated digital asset funds
USD10 millionBitcoin treasury transaction for Meitu
key senior hires, including for OSL SaaS, business
development, operations and technology
6
BC Group was added to the MSCI China All Shares Small Cap Index
Strategic investment in AllInfra, a company that brings access and liquidity to environmental assets using blockchain technology
BC Group was included in the Elwood Blockchain Global Equity Index
Offset carbon footprint for 2018-2020 with carbon credits

CHIEF EXECUTIVE OFFICER’S STATEMENT
6
Dear Shareholders and Partners,
In an environment of ongoing macroeconomic challenges and digital asset price fluctuations, BC Technology Group (the “Group”) maintained market outperformance, with a 54% year-over-year (“YoY”) increase in overall revenues.
This was driven by another strong half-year by the Group’s OSL digital asset platform business, which saw significant growth across all four of its key business units, resulting in a 70% YoY increase in total platform revenues as well as a 70% YoY increase in overall platform volumes.
The OSL software-as-a-service (“SaaS”) business unit, which is a key element of OSL’s growth strategy over the next several years, saw marked improvement in the first half of 2021. SaaS trading volume increased 3,029% YoY to HK$4.9 billion, and SaaS revenues were up 32% YoY.
Institutional investor interest in the Group deepened during the first six months of 2021 (the “Period”). This is evidenced by the growing roster of institutional and professional clients on the OSL platform, the Group’s landmark joint venture with Standard Chartered in June, and by the participation of top-tier institutions — such as Fidelity and GIC — in the Group’s two share placements in the Period, which totaled HK$1.24 billion.
OSL’s success during the Period further reinforces the efficacy and resilience of the Group’s business strategy and approach to the rapidly evolving and growing global digital asset market.
Our licensed venue in Hong Kong, OSL Digital Securities, went live in the first half of 2021 and conducted the first licensed trade of a security token. The Group also bolstered its leading team in the Period by adding senior industry veterans across technology, business development and operations.
Furthermore, the Group made strong advancements in its Environment, Social and Governance (“ESG”) program during the Period, expanding its ESG Committee, initiating a materiality assessment and offsetting its carbon footprint for the last
three years. The Group also made a strategic investment in AllInfra, a blockchain company providing access to climate-related products and services, in the first half of 2021.
In terms of customers, OSL onboarded new brokerage and exchange counterparties to the platform and shifted SaaS client focus to the regulated segment in the first quarter, and there was some short-term impact on revenues as a result. However, a record number of individual, professional and institutional investors onboarded to OSL in the first quarter through its Hong Kong and Singapore exchanges and B2B2C SaaS relationships. Active customer numbers therefore increased more than ten times YoY in the first half of 2021, and revenue from strategic clients climbed over 300% YoY.
OSL saw significant growth across all four of its key business units, resulting in a 70% YoY increase in total platform revenues as well as a 70% YoY increase in overall platform volumes.

CHIEF EXECUTIVE OFFICER’S STATEMENT
B C T E C H N O L O G Y G R O U P L I M I T E D I N T E R I M R E P O R T 2 0 2 1 7
The Group’s Mainland China based businesses saw overall revenues increase 22% YoY, however, this was below pre-COVID levels. The Group expects that the OSL digital asset platform’s revenue will continue to increase as a percentage of Group revenues in-line with our strategic focus and business planning.
The Group’s projects with DBS, Standard Chartered and others are large — and the Company is now investing in a material uplift in technology and people to further scale OSL and commercialise its partnerships. New digital asset regulatory frameworks are also expected to come into effect in 2022. As a result, the Group expects that significant enforcements against unregulated platforms will drive market share to regulated players. This represents an opportunity for OSL given its positioning as a globally trusted partner, its licenses, and ability to deliver highly regulatory compliant products and services.
Accordingly, the Group will place even more focus on OSL platform scalability initiatives for the remainder of 2021 to ensure it takes full advantage of what is shaping up to be a bumper period in 2022 and beyond.
In addition, the Group has made a strong effort to emphasize ESG strategy and carbon neutrality. Competitors have followed this example and this is a net positive for the sector. The blockchain and digital asset industry has the ability to react and innovate very quickly on important matters such as ESG. It is my belief that we are on the cusp of an era of innovation that combines digital assets and sustainability as related sectors.
ESG is therefore another opportunity for the Group, and I’m personally committed to assisting the company to develop green and sustainable products and making sustainability part of our company ethos and culture.
I am very proud of how we have responded to the challenges in the past half year and how our staff has continued to prioritize value for our clients with a pioneering spirit and relentless execution.
It is the Group’s strong belief that worldwide adoption will continue to catalyze growth in digital assets and that increasing regulatory clarity will also drive greater participation by major financial institutions. OSL is poised to scale exponentially in these circumstances.
At every level — from investors and customers, to the Company’s approach to regulatory compliance, and its business model and strategy — OSL is now uniquely positioned as one of the most regulated, institutionally ready digital asset participants in the world.
I speak for the entire team at BC Group and OSL when I say we are truly humbled and forever grateful for the trust and confidence that our clients and partners have placed in us.
Madden Hugh DouglasChief Executive Officer
Hong Kong, 17 August 2021
At every level — from investors and customers, to the company’s approach to regulatory compliance, and its business model and strategy — OSL is now uniquely positioned as one of the most regulated, institutionally ready digital asset participants in the world.

MANAGEMENT DISCUSSION AND ANALYSIS
B C T E C H N O L O G Y G R O U P L I M I T E D I N T E R I M R E P O R T 2 0 2 18
MATERIAL EVENTSPlacing of Existing Shares and Top-up Subscription of New Shares under General Mandate
On 5 January 2021, the Company and East Harvest Global Limited (the “Vendor”) entered into the placing and subscription agreement (the “Placing and Subscription Agreement”) with Morgan Stanley & Co International PLC (“Morgan Stanley”) pursuant to which Morgan Stanley agreed to act as agent for the Vendor to place a total of 45,000,000 placing shares (“January Placing Shares”) owned by the Vendor at a price of HK$15.50 per placing share (the “January Placing”) to no less than six independent placees (“January Placees”).
The January Placees were professional, institutional or other investors approved, selected and/or procured by or on behalf of Morgan Stanley as contemplated by the Placing and Subscription Agreement, who and whose respective ultimate beneficial owners were third parties independent of the Company and its connected persons and who would not become substantial shareholders of the Company after completion of the January Placing. The Vendor conditionally agreed to subscribe for, and the Company conditionally agreed to allot and issue to the Vendor 45,000,000 subscription shares (“January Subscription Shares”) at the subscription price, which was equal to the placing price (the “January Subscription”). The closing price of Subscription Shares on the date of entering the Placing and Subscription Agreement (i.e. 5 January 2021), was HK$19.22 per January Subscription Share. The aggregate nominal value of the 45,000,000 subscription shares was HK$450,000.
The Company considered that the Placing and the Subscription represented an opportunity to raise capital for the Group while broadening its shareholder base and would also strengthen the financial position of the Group for the expansion of the Group’s digital assets and blockchain platform business.
The gross proceeds and the received net proceeds from the January Subscriptions were approximately HK$697.5 million and approximately HK$658 million, respectively. The Company intends to use the net proceeds as to (i) approximately HK$40 million for developing and enhancing platform technology of digital asset platform business; (ii) approximately HK$225 million for maintaining sufficient liquid capital to satisfy the Hong Kong Securities and Futures Commission (“SFC”) license requirement of the licensed entity and the expansion of prime brokerage business; (iii) approximately HK$293 million for operating working capital including rental expenses, staff costs, marketing and IT expenses, other general expenses and professional fees; and (iv) approximately HK$100 million for potential future acquisition and general working capital of the Group. The net price per January Subscription Share was approximately HK$14.62.

MANAGEMENT DISCUSSION AND ANALYSIS
B C T E C H N O L O G Y G R O U P L I M I T E D I N T E R I M R E P O R T 2 0 2 1 9
Placing of New Shares under General Mandate
On 11 June 2021, the Company and Macquarie Capital Limited (“Macquarie”) entered into the placing agreement (the “Placing Agreement”) pursuant to which the Company appointed Macquarie to place a total of 31,952,500 placing shares (“June Placing Share”) at a price of HK$17.00 per June Placing Share (“June Placing”).
The Company considers that the June Placing represents an opportunity to raise capital for the development and furtherance of the Group’s business and will also strengthen the financial position of the Group for the development and expansion of the Group’s digital assets and blockchain platform business.
The closing price on the last trading day prior to signing of the Placing Agreement for June Placing Shares (i.e. 10 June 2021) was HK$19.26 per share. The aggregate nominal value of the June Placing Shares was HK$319,525. The June Placing Shares were placed to one placee, namely GIC (“GIC”). GIC is a global investment management company established in 1981 to manage Singapore’s foreign reserves. GIC invests internationally in equities, fixed income, foreign exchange, commodities, money markets, alternative investments, real estate and private equity. Headquartered in Singapore, GIC has investments in over 40 countries and employs over 1,800 people across 10 offices in key financial cities worldwide.
The gross proceeds from the June Placing were approximately HK$543.19 million. The received net proceeds, after deduction of all relevant expenses (including but not limited to placing commission, legal expenses and disbursements) incidental to the June Placing, were approximately HK$534 million, representing a net issue price of approximately HK$16.74 per June Placing Share.
The Company intends to use the net proceeds from the June Placing as to (i) approximately HK$198 million for IT-related costs including digital transformation, developing and enhancing platform technology of digital asset platform business; (ii) approximately HK$236 million for operating working capital other than IT-related costs including rental expenses, staff costs, marketing expenses, other general expenses and professional fees; and (iii) approximately HK$100 million as reserves for future expansion in markets including the United Kingdom (“UK”), Singapore and Americas.

MANAGEMENT DISCUSSION AND ANALYSIS
B C T E C H N O L O G Y G R O U P L I M I T E D I N T E R I M R E P O R T 2 0 2 110
Use of Net Proceeds for January Subscription and Placing and June Placing
The proceeds from the January Subscription and Placing of Shares and the June Placing of Shares have been utilized as intended subsequent to the Company’s announcement dated 5 January 2021 and 11 June 2021. The table below sets out the actual use of proceeds during the six months ended 30 June 2021 (the “Period”):
Event Purpose of the net proceeds
Amount of net proceeds
intended to be allocated
Actual utilised amount as of
30 June 2021
Unutilised amount as of
30 June 2021
Expected timeline for
utilisation of the unutilised
proceedsHK$ million HK$ million HK$ million
(approximately) (approximately) (approximately)
January Subscription and Placing
For developing and enhancing platform technology of digital asset platform business 40 12.9 27.1
On or before 31 December 2022
For maintaining sufficient liquid capital to satisfy SFC license requirement of the licensed entity and the expansion of prime brokerage business 225 225 – N/AFor operating working capital including rental expenses, staff costs, marketing and IT expenses, other general expenses and professional fees 293 157.7 135.3
On or before30 June 2022
For potential future acquisition and general working capital of the Group 100 38.61 61.39
On or before31 December 2022
658 434.21 223.79
June Placing For IT-related costs including digital transformation, developing and enhancing platform technology of digital asset platform business 198 – 198
On or before30 June 2024
For operating working capital other than IT-related costs including rental expenses, staff costs, marketing expenses, other general expenses and professional fee 236 – 236
On or before30 June 2023
As reserves for future expansion in markets including UK, Singapore and Americas 100 – 100
On or before30 June 2023
534 – 534

MANAGEMENT DISCUSSION AND ANALYSIS
B C T E C H N O L O G Y G R O U P L I M I T E D I N T E R I M R E P O R T 2 0 2 1 11
FINANCIAL ANALYSISChange of presentation currency
The consolidated financial statements were presented in Renminbi (“RMB”) in prior years. Starting from 1 January 2021, the Directors consider that as a result of the Group’s future internationalisation strategy and the source of funding, the Group has changed its presentation currency for the preparation of its unaudited condensed consolidated interim financial statements from RMB to Hong Kong Dollars (“HK$”). The Directors considered that the change of presentation currency to HK$ enables the shareholders and potential investors of the Company to have a more accurate picture of the Group by aligning the Group’s financial performance with its share price.
The effects of the change in the presentation currency have been accounted for retrospectively with comparative figures restated. The comparative figures have been restated to reflect the change in presentation currency to HK$ accordingly. The Group has also presented the consolidated statement of financial position as at 1 January 2020 without related notes.
Overall Performance
For the Period, the Group recorded total revenue and income of HK$152.8 million, representing an increase of approximately 54.2%, or HK$53.7 million, from HK$99.1 million for the corresponding period of 2020, driven by an increase in trading income from the OSL digital asset and blockchain platform business.
The operating loss of the Group was HK$141.4 million for the Period, representing an increase of HK$60.3 million or 74.3%, from net operating loss of HK$81.1 million for the corresponding period of 2020.
The net loss of the Group increased from HK$99.6 million for the six months ended 30 June 2020 to HK$157.9 million for the Period, an increase of HK$58.3 million or 58.5%.
Loss per share of the Group for the Period was HK$44 cents (for the six months ended 30 June 2020: HK$34 cents).
Digital Assets and Blockchain Platform Business: OSL
The OSL digital asset and blockchain platform business started in 2018 and grew substantially in the Period, and continues to be the largest business revenue and income contributor to the Group. During the Period, the digital assets and blockchain platform business generated income of HK$114.0 million, which was up 69.5% as compared to income of HK$67.3 million in the corresponding period in 2020. The significant increase was driven by an increase in trading volume from the Group’s digital asset trading services and the provision of digital assets software-as-a-service (“SaaS”) and related services.
Income from facilitation of trading of digital assets, service fee from SaaS, interest income from inventories financing and other digital asset and blockchain platform related business were HK$107.0 million, HK$3.5 million, HK$1.4 million and HK$2.1 million, respectively. Of the HK$114.0 million in income from the digital assets and blockchain platform business, HK$4.7 million was generated from service fees or trading income from our licensed SaaS customers.
MANAGEMENT DISCUSSION AND ANALYSIS
B C T E C H N O L O G Y G R O U P L I M I T E D I N T E R I M R E P O R T 2 0 2 112
Advertising and Business Park Area Management Services Businesses
Revenue from the advertising business for the Period was HK$15.7 million, an increase of HK$2.7 million or 21.1% as compared with the corresponding period of 2020.
Rental income from business park area management services for the Period was HK$23.1 million, representing an increase of 22.6% compared to HK$18.9 million in the corresponding period of 2020.
During the Period, the cost of generating revenues from advertising and business park area management services mainly comprised expenses and costs for procuring advertising space, staff remuneration, event organising lease expense, production costs and holding the lease on the business park area. The cost of revenue from advertising and business park area management services for the Period was HK$22.7 million, representing an increase of 11.1% or HK$2.3 million as compared with HK$20.5 million for the corresponding period of 2020. The cost of revenue increased correspondingly with the rise in revenue in the advertising business.
The gross profit for advertising and business park area management services for the Period was HK$16.1 million, representing an increase of HK$4.7 million as compared to HK$11.4 million for the corresponding period of 2020. The Group’s gross profit margin for advertising and business park area management services was 41.5% (six months ended 30 June 2020: 35.7%). The increase was mainly attributable to the increase in the proportion of rental income from the business park area management services segment which generated higher gross profit margins.
Selling and Distribution Expenses
Selling and distribution expenses increased by HK$53.1 million from HK$8.7 million in the corresponding period of 2020 to HK$61.8 million for the Period. The increase was mainly attributable to warrant expenses incurred for the Period. The intention of the warrant is to promote liquidity within the Group’s trading platforms by encouraging trading activities of J Digital 5 LLC in order to create quantitative benefits to the Group in the form of trading commissions or revenues resulting from client transaction volumes attributable to the liquidity provided.
Administrative and Other Operating Expenses
Administrative and other operating expenses for the Period increased by HK$58.5 million to HK$209.3 million as compared to the corresponding period of 2020. The increase was mainly due to the increase in expenditures related to establishing the corporate and technical infrastructure for the regulated institutional digital asset segment, including technology, legal and compliance, marketing, insurance and staff costs.
Net Loss
Net loss of the Group for the Period was HK$157.9 million, an increase of HK$58.3 million as compared with HK$99.6 million for the corresponding period of 2020. Despite the significant increase in income from the digital assets and blockchain platform business for the Period, the increase in net loss was primarily due to warrant expenses and the expansion of the Group’s digital assets and blockchain platform business.
Interim Dividends
The Board has resolved not to recommend an interim dividend in respect of the six months ended 30 June 2021 to the holders of ordinary shares of the Company.

MANAGEMENT DISCUSSION AND ANALYSIS
B C T E C H N O L O G Y G R O U P L I M I T E D I N T E R I M R E P O R T 2 0 2 1 13
Liquidity and Financial Resources
As at 30 June 2021, the Group recorded total assets of HK$5,491.9 million (31 December 2020: HK$4,039.8 million), total liabilities of HK$4,164.2 million (31 December 2020: HK$3,879.4 million) and total shareholders’ equity of HK$1,327.7 million (31 December 2020: HK$160.4 million). As at 30 June 2021, the gross gearing ratio (defined as total liabilities over total assets) was approximately 75.8% (31 December 2020: 96.0%).
The Group mainly used internal cash flows from operating activities, borrowings and issuing equity to satisfy its working capital requirements.
As at 30 June 2021, total borrowings amounted to HK$265.6 million (31 December 2020: HK$566.3 million). The Group’s borrowings comprised other loans denominated in HK$, RMB and United States Dollars (“USD”). HK$115.1 million (31 December 2020: HK$420.2 million) borrowings were interest bearing with interest rates ranging from 3% to 8% per annum (31 December 2020: 3% to 8% per annum). The remaining borrowings were non-interest bearing.
HK$214.3 million (31 December 2020: HK$250.1 million) borrowings were secured by RMB deposits, or digital assets (31 December 2020: secured by RMB deposits, or digital assets). As at 30 June 2021, the Group was in a net current assets position (31 December 2020: net current assets position).
Treasury Policy
It is the Group’s treasury management policy not to engage in any principal financial investments or use of speculative derivative instrument with high risks. During the Period, the Group continued to adopt a conservative approach in financial risk management and did not employ any material financial instrument for hedging purposes. Most of the assets, receipts and payments of the Group were denominated in RMB, HK$ and USD.
Exposure to Fluctuations in Exchange Rates and Related Hedges
The Group currently operates mainly in Hong Kong, Singapore and Mainland China.
For operations in Hong Kong, most of the transactions are denominated in HK$ and USD. The exchange rate of USD against HK$ is relatively stable, and the related currency exchange risk is considered minimal. For operations in Mainland China, most of the transactions are settled in RMB, the impact of foreign exchange exposure to the Group is minimal. For operations in Singapore, as digital asset trading transactions and other business transactions are denominated in USD mainly, with only some local operating expenses being settled in Singapore dollars (“SGD”), any SGD-related exposure to foreign exchange risk is minimal.
No financial instrument was used for hedging purposes for the Period. However, the Group is closely monitoring the currency exchange risk of RMB and is looking for any opportunities to mitigate the currency exchange risk of RMB.
Material Acquisitions and Disposals of Subsidiaries
During the Period, the Group did not have any material acquisitions and disposals of subsidiaries.
Charge on the Group’s Assets
As at 30 June 2021 and 31 December 2020, the Group pledged RMB deposits or digital assets.

MANAGEMENT DISCUSSION AND ANALYSIS
B C T E C H N O L O G Y G R O U P L I M I T E D I N T E R I M R E P O R T 2 0 2 114
Future Plans for Material Investments or Capital Assets and Capital Expenditure Commitments
In June 2021, BC HoldCo I Limited, a wholly-owned subsidiary of the Company, entered into agreements with an independent third party in relation to the acquisition of 24.99% equity interest in Zodia Markets Holdings Limited, which was incorporated in the UK. As at 30 June 2021, the Group’s total commitments contracted but not provided for investment in an associate were USD1.75 million (equivalent to approximately HK$13.6 million) and an assignment of an intellectual property.
Contingent Liabilities
As at 30 June 2021 and 31 December 2020, the Group did not have any significant contingent liabilities.
Human Resources Cost
As at 30 June 2021, the Group had a total of 186 employees across its Hong Kong, Singapore, UK, Americas and Mainland China offices (30 June 2020: 130 employees). The total staff cost during the Period was HK$140.0 million (30 June 2020: HK$109.7 million).
The emoluments of the Directors and senior management are decided by the remuneration committee and the Board, as authorised by the shareholders at the annual general meeting, having regarded to the Group’s operating results, individual performance and comparable market statistics. The emolument policy of the Group is on the basis of the qualifications and contributions of individuals to the Group.
The Company has adopted a share option scheme and a share award plan as an incentive to Directors and eligible employees and consultants providing similar services, details of the share option scheme and share award plan are set out under “Other Information” section in the interim report.
Business Overview
In the first six months of 2021, the world continued to grapple with geopolitical risks, inflationary fears and the ongoing COVID-19 pandemic, and anticipated economic recoveries in major markets were muted as a result. Digital assets were also impacted by the broader macroeconomic environment, as well as other factors, such as stricter regulatory rhetoric from Mainland China and the United States and questions around the environmental sustainability of Bitcoin. This created uncertainty in the retail segment globally, and the digital asset market saw a significant selloff and price retraction.
Despite these headwinds, the Group and OSL experienced important development milestones and continued on a pace of outperformance, with overall Group revenues of HK$152.8 million for the Period, an increase of 54.2% from HK$99.1 million in the first half of 2020.
The OSL digital asset platform led the Group’s growth, with revenues of HK$114.0 million for the Period, an increase of 69.5% year-over-year (“YoY”) from HK$67.3 million in the first half of 2020.
OSL digital asset platform volumes were up 70% YoY to HK$117 billion from HK$69 billion in the first half of 2020, and total assets on platform increased 36.1% to HK$3.8 billion at the end of Period from HK$2.8 billion for the six months ended 30 June 2020. The Digital assets and blockchain platform business now accounts for 74.6% of all Group revenues, an increase of 9.9% from the first half of 2020.

MANAGEMENT DISCUSSION AND ANALYSIS
B C T E C H N O L O G Y G R O U P L I M I T E D I N T E R I M R E P O R T 2 0 2 1 15
Furthermore, OSL rapidly expanded its footprint as a result of a landmark joint venture with Standard Chartered and SC Ventures in the UK and Europe; and the Group’s licensed venue in Hong Kong, OSL Digital Securities, went live, conducting the first licensed trade of a security token in the market. OSL also bolstered its leading team, adding six senior industry veterans across technology, business development, and operations in the first half of 2021. It also invested in operational scalability and technology resiliency to broaden the scope and size of its banking relationships, and frequently transact directly and at a larger, institutional scale with other licensed securities companies and asset managers.
Additionally, the Group closed two share placements totaling HK$1.24 billion with participation from long-term strategic investors Robeco, Fidelity, UBS and GIC, amongst others.
These achievements were in-line with the broader digital asset sector, which saw investment into its infrastructure ecosystem continue at pace, while participation from both the institutional and retail segments also continued to rapidly increase, even as price action trended downward.
The Group’s Mainland China business showed improved performance during the Period with overall revenue increasing 22.0% YoY to HK$38.8 million, up from HK$31.8 million in the first half of 2020.
During the Period, the Group made significant progress on its Environmental, Social and Governance (“ESG”) efforts, and offset its carbon footprint for the last three years (2018-2020) through the purchase and retirement of voluntary carbon credits via the AirCarbon Exchange, a Singapore-based carbon credit exchange. The credits were issued under Verra’s Verified Carbon Standard (VCS) Program and were generated from a solar renewable power project in India, which also meets a number of the United Nations Sustainable Development Goals, including goals related to climate action, good health, quality education, clean water and economic growth.
Further, the Group expanded the activities of its ESG Committee, initiating a full materiality assessment, and also made a strategic investment in AllInfra, a blockchain company providing access to climate-related products and services.
The OSL Digital Asset Platform
In the first half of 2021, OSL again delivered on its strategic roadmap and objectives, exponentially growing its SaaS technology capabilities, reach and client numbers. The first quarter was a transition period, as the Company focused on onboarding new brokerage and exchange counterparties to the platform and shifting its SaaS client focus to the regulated segment.
While these activities had some short-term impact on revenues, a record number of individual, professional and institutional investors also onboarded to the platform in the first quarter through the Group’s Hong Kong and Singapore exchanges and its B2B2C SaaS network. As a result, active users and platform volumes rose to new highs in the second quarter, setting the stage for continued growth in the second half of 2021 as OSL becomes the platform of choice for global digital asset trading infrastructure.
The OSL platform experienced revenue growth across all business units in the Period. Prime brokerage revenues in the first half of 2021 were up 65.0% YoY to HK$105.3 million from HK$63.8 million during the same period the previous year. Exchange revenues for the Period were up 5,003.3% YoY to HK$3.1 million from HK$0.06 million in the first half of 2020. Revenue from custody and other fees were up 179.9% YoY to HK$2.1 million from HK$0.7 million during the same period the year before, and SaaS service fee revenue increased 32.2% YoY to HK$3.5 million from HK$2.7 million in the first half of 2020.

MANAGEMENT DISCUSSION AND ANALYSIS
B C T E C H N O L O G Y G R O U P L I M I T E D I N T E R I M R E P O R T 2 0 2 116
In addition, OSL saw material volume increases across all platform products and services in the first half of 2021. Exchange volumes were up 7,506% YoY to HK$24.3 billion as compared to HK$319 million in the first half of 2020. Brokerage trading volume increased 28% to HK$88.0 billion as compared to HK$68.0 billion in the same period the previous year, and SaaS trading volume increased 3,029% to HK$4.9 billion as compared to HK$155.0 million in the first half of 2020.
During the Period, active clients for the OSL digital asset platform grew by more than ten times compared to the same period the previous year.
On 2 June 2021, the Group announced that it had agreed with SC Ventures, the innovation and ventures unit of Standard Chartered, to create a partnership to establish a digital asset brokerage and exchange platform for institutional and corporate clients in the UK and Europe. The Group’s former Chief Information Officer Usman Ahmad is now Chief Executive Officer of the new company, and Nick Philpott, formerly of SC Ventures, is the Chief Operating Officer.
The joint venture will be underpinned by the Group’s leading OSL digital-asset technology and Standard Chartered’s global network and experience in brokerage and providing access to European markets. Based in the UK, and initially targeting the European market, the company will connect institutional traders to counterparties across markets, delivering access to deep pools of liquidity in Bitcoin, Ethereum and other digital assets. The joint venture aims to launch in the fourth quarter of 2021, subject to regulatory approvals.
In March 2021, the Group announced that it had signed an memorandum of understanding (“MOU”) with Venture Smart Asia Limited (“VSAL”), a Hong Kong-licensed asset manager and investment advisory firm, to provide brokerage and related services for VSAL’s Hong Kong-regulated digital asset funds (the DigiTrackers Bitcoin fund and the Arrano Alpha Fund).
The agreement is the first collaboration between the first SFC-approved digital asset manager and the Group, which is the parent of the first SFC-licensed brokerage and exchange in Hong Kong. Under the MOU, OSL will provide brokerage services, including trade execution and capital introduction services to the Arrano Alpha Fund. OSL and VSAL’s blockchain arm, known as Arrano Capital, will also explore opportunities to jointly create digital asset products.
In April 2021, OSL Digital Securities, acted as the trade execution and custody partner for Hong Kong-listed Meitu, Inc. (HKEX: 1357) (Meitu) and facilitated a purchase of approximately 175 units of Bitcoin with a total value of USD10 million.
In line with the Group’s commitment to business expansion and being an employer of choice, OSL in June announced six key senior hires across software-as-a-service, business development, operations and technology, including Mr. Colm Furlong as Head of SaaS (formerly of Fidessa), Mr. Arion Ho as Head of UK Exchange Operations, and Mr. Joe Zhou as Director of Business Development (both formerly of the Hong Kong Stock Exchange).
With growth during the Period at every level — from investors and customers, to the Company’s approach to regulatory compliance, and in terms of business model and strategy — OSL is now uniquely positioned as one of the most regulated and institutionally ready digital asset participants in the world.

MANAGEMENT DISCUSSION AND ANALYSIS
B C T E C H N O L O G Y G R O U P L I M I T E D I N T E R I M R E P O R T 2 0 2 1 17
Advertising and Business Park Area Management Services Business in Mainland China
The Group has two core Mainland China businesses, a business park area management services business and an advertising and marketing communications services business.
The Group’s business park area management services business provides operations and management services for commercial property in the Jingwei Park business park in Shanghai.
During the Period, rental income generated from the business park area management services segment was HK$23.1 million, representing an increase of 22.6% compared to HK$18.9 million in the first half of 2020. This was mainly attributable to the appreciation of exchange rates of RMB against HK$ and the increment in rental income. The business park office space had a 100% occupancy rate in both periods. The business park is fully leased and occupied by a leading real estate and shared workspace company under a long-term agreement.
The Group’s advertising business includes the provision of professional and customised one-stop integrated marketing communication services to customers through diversified communication platforms comprising traditional advertising, digital advertising and roadshows. Traditional advertising includes outdoor, TV and print advertising while digital advertising mainly covers blogging and bulletin board sites. The Group’s major customers are from the automotive industry.
The Group’s advertising business reported HK$15.7 million in revenue during the Period, representing an increase of 21.1% compared to HK$13.0 million in the first half of 2020. However, as compared to second half of 2020, revenue declined by 8.1%, or HK$1.4 million. This was the result of a continuous loss of customers projects due to keen competition, especially competition from the new on-line advertising medias. The Group will on one hand carefully review the business strategy of the advertising business going forward, but on the other hand continue to increase focus and resources on the digital asset business as a strategic and growth priority.
Prospects
Throughout the Period, the Group’s OSL digital asset platform business revenues increased in a robust and volatile market. The Group’s footprint also grew substantially through its partnership with Standard Chartered and SC Ventures in the UK and Europe, the addition of new platform clients, and by hiring key senior business leaders across OSL business units. This led to a more diversified customer base and provided further resiliency against potential business interruption due to the ongoing global pandemic. Progress made in the Period, particularly onboarding new clients and partners in the second quarter, has primed the business for growth in the second half of 2021 and beyond.
These gains were possible because of OSL’s leading position as a Hong Kong-licensed entity and material investments made in the business to build operational scalability and technological resiliency.
Continuing the trend from previous reporting periods, OSL digital asset platform and SaaS revenues grew at a faster rate in the Period than the Group’s advertising and business park area management services lines. The Group’s rapidly growing SaaS business also demonstrates its potential to contribute as a material revenue driver in the near future. The nature of the Group’s SaaS engagements are highly complex and represent long-term commitments from strategic partners.
In the post results period, the Group continued to successfully execute its geographic expansion strategy in the digital assets sector with the launch of the OSL Americas business. The Group is committed to growing in key markets in the near future, including in the UK.

MANAGEMENT DISCUSSION AND ANALYSIS
B C T E C H N O L O G Y G R O U P L I M I T E D I N T E R I M R E P O R T 2 0 2 118
The Group has proved itself as one of the few market participants willing to comply with new and emerging regulations and positioned itself to continue to win the trust of large financial institutions and institutional investors entering the market. The Group’s Singapore license application is currently under review by the Monetary Authority of Singapore, and the Group is optimistic on the application’s prospects for approval. Moving forward, the Group will pursue additional licenses and partnerships in key jurisdictions globally.
Further, the Group will continue to enhance its unique capabilities in technology, security, risk and compliance systems to meet emerging regulatory standards as well as the operational and technical requirements of existing and potential partners and counterparties. Accordingly, the Group has hired additional key senior staff who will onboard in the second half of 2021 with the aim of further growing OSL’s leading position in the global digital asset market.
The Group believes that regulated firms will continue to gain market share as unlicensed competitors face increased pressure to adhere to a maturing regulatory framework. The transition to licenced entities is accelerating and has positioned the OSL digital asset platform to increase its client base, grow market share and generate revenue.
Looking forward, the Group will strengthen its efforts to diversify digital asset and SaaS revenue and expand its customer base in Hong Kong and other key jurisdictions where it has a competitive advantage. The Group will be conservative when pursuing growth opportunities in its advertising and business park management services business in Mainland China.
To support organic and inorganic growth and its working capital base, the Group is actively continuing to strengthen its financial resources through debt and equity.

UNAUDITED CONDENSED CONSOLIDATED STATEMENT OFPROFIT OR LOSS AND OTHER COMPREHENSIVE INCOME
B C T E C H N O L O G Y G R O U P L I M I T E D I N T E R I M R E P O R T 2 0 2 1 19
UnauditedFor the six months ended
30 June2021 2020
Notes HK$’000 HK$’000(Restated)
Continuing operationsIncome from principal activities:— Income from digital assets and blockchain platform business 8 113,970 67,255— Revenue from advertising business 7 15,711 12,974— Rental income from business park area management services 23,133 18,870
152,814 99,099Cost of revenue (23,639) (20,461)Other income 9 546 384Other (losses)/gains, net 9 (27) 85Selling and distribution expenses (61,770) (8,657)Administrative and other operating expenses (209,347) (150,868)Provision for impairment losses on financial assets and contract assets, net – (725)
Operating loss (141,423) (81,143)
Finance income 5,277 5,030Finance costs (20,205) (25,064)
Finance costs, net (14,928) (20,034)Share of net loss of an associate accounted for using the equity method (190) –
Loss before income tax (156,541) (101,177)Income tax expense 11 (1,320) (810)
Loss from continuing operations (157,861) (101,987)
Profit from discontinued operations (attributable to the owners of the Company) 12 – 2,389
Loss for the period (157,861) (99,598)

UNAUDITED CONDENSED CONSOLIDATED STATEMENT OFPROFIT OR LOSS AND OTHER COMPREHENSIVE INCOME
B C T E C H N O L O G Y G R O U P L I M I T E D I N T E R I M R E P O R T 2 0 2 120
UnauditedFor the six months ended
30 June2021 2020
HK$’000 HK$’000(Restated)
Loss for the period (157,861) (99,598)
Other comprehensive income/(loss)Item that may be reclassified to profit or loss:Currency translation differences on translation of foreign operations with a functional currency different from the Company’s presentation currency 3,383 (2,762)Release of exchange reserve upon disposal of subsidiaries – (315)
Other comprehensive income/(loss) for the period 3,383 (3,077)
Total comprehensive loss for the period (154,478) (102,675)
Loss for the period attributable to: Owners of the Company — Loss from continuing operations (158,099) (104,408) — Profit from discontinued operations – 2,389
(158,099) (102,019)
Non-controlling interests — Profit from continuing operations 238 2,421
(157,861) (99,598)

UNAUDITED CONDENSED CONSOLIDATED STATEMENT OFPROFIT OR LOSS AND OTHER COMPREHENSIVE INCOME
B C T E C H N O L O G Y G R O U P L I M I T E D I N T E R I M R E P O R T 2 0 2 1 21
UnauditedFor the six months ended
30 June2021 2020
Notes HK$’000 HK$’000(Restated)
Loss per share for loss from continuing operations attributable to the owners of the Company Basic (HK$ per share) 14 (0.44) (0.34) Diluted (HK$ per share) 14 (0.44) (0.34)
Loss per share for loss from continuing and discontinued operations attributable to the owners of the Company Basic (HK$ per share) 14 (0.44) (0.34) Diluted (HK$ per share) 14 (0.44) (0.34)
Total comprehensive loss for the period attributable to: Owners of the Company — Loss from continuing operations (154,795) (107,373) — Profit from discontinued operations – 2,389
(154,795) (104,984) Non-controlling interests — Profit from continuing operations 317 2,309
(154,478) (102,675)
The above unaudited condensed consolidated statement of profit or loss and other comprehensive income should be read in conjunction with accompanying notes.

UNAUDITED CONDENSED CONSOLIDATED STATEMENT OF FINANCIAL POSITION
B C T E C H N O L O G Y G R O U P L I M I T E D I N T E R I M R E P O R T 2 0 2 122
Unaudited Audited AuditedAs at
30 June 2021
As at 31 December
2020
As at 1 January
2020Notes HK$’000 HK$’000 HK$’000
(Restated) (Restated)
ASSETSNon-current assetsProperty, plant and equipment 15 175,198 186,736 229,738Intangible assets 16 46,997 52,548 56,917Investment in an associate 24,054 – –Financial asset at fair value through profit or loss 23,299 – –Prepayments, deposits and other receivables 19,414 20,601 136,832Inventories due from counterparties 19 – – 19,467Deferred income tax assets 4,505 4,406 3,679
Total non-current assets 293,467 264,291 446,633
Current assetsInventories 17 2,697,649 3,106,885 499,569Contract assets 7(b) 9,789 6,528 31,739Trade and bills receivables 18 22,621 20,654 38,157Financial asset at fair value through profit or loss 1,574 – –Prepayments, deposits and other receivables 237,355 189,872 46,880Collateral receivables 274,866 – –Inventories due from counterparties 19 777 38,061 –Cash and cash equivalents 1,953,804 413,487 214,625
5,198,435 3,775,487 830,970
Assets directly associated with assets classified as held for sale – – 2,939
Total current assets 5,198,435 3,775,487 833,909
Total assets 5,491,902 4,039,778 1,280,542
LIABILITIESNon-current liabilitiesDeposits received and other payables 16,754 16,571 15,046Collateral payables – – 25,392Lease liabilities 21 132,074 151,803 186,528Borrowings 23 63,809 79,451 294,104Financial liability at fair value through profit or loss – – 6,773Deferred income tax liabilities 8,411 8,983 10,632
Total non-current liabilities 221,048 256,808 538,475

UNAUDITED CONDENSED CONSOLIDATED STATEMENT OF FINANCIAL POSITION
B C T E C H N O L O G Y G R O U P L I M I T E D I N T E R I M R E P O R T 2 0 2 1 23
Unaudited Audited AuditedAs at
30 June 2021
As at 31 December
2020
As at 1 January
2020Notes HK$’000 HK$’000 HK$’000
(Restated) (Restated)
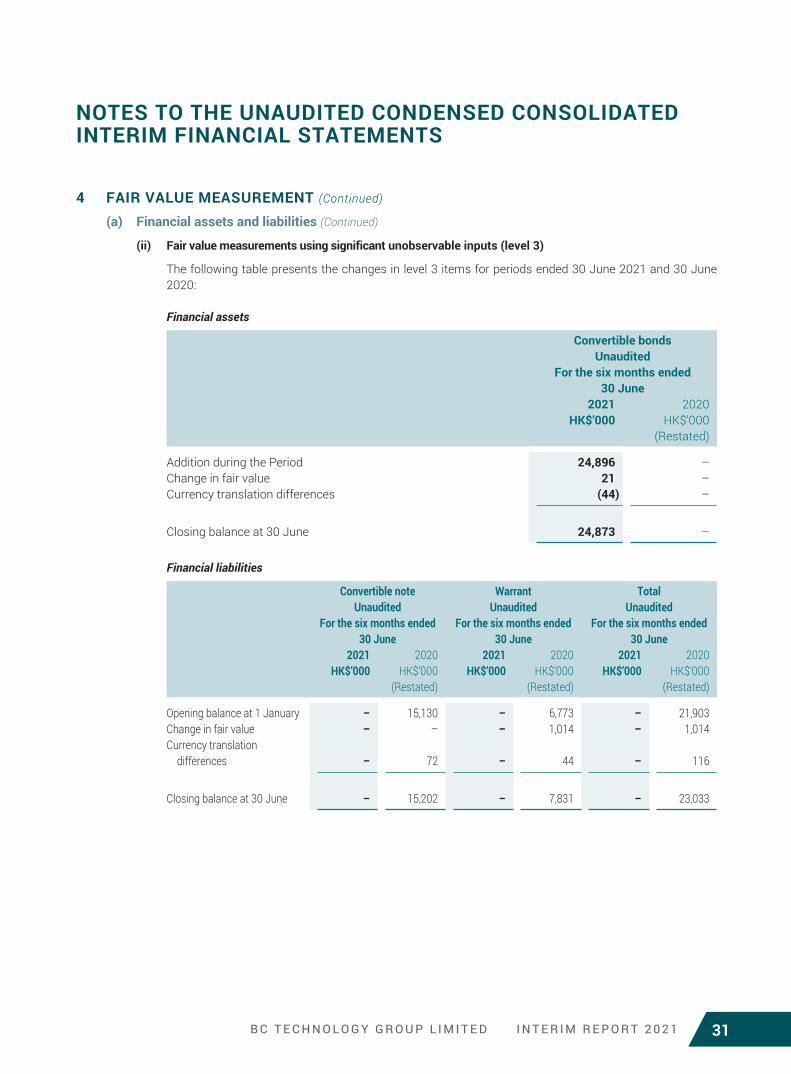
LIABILITIESCurrent liabilitiesTrade payables 20 76,163 51,477 46,139Collateral payables 63,711 179,559 10,301Accruals and other payables 53,047 50,198 57,375Contract liabilities 7(b) 5,524 7,391 2,860Liabilities due to customers 22 3,496,571 2,801,429 555,087Lease liabilities 21 39,857 38,112 33,347Financial liability at fair value through profit or loss – – 15,130Borrowings 23 201,764 486,866 84,267Current income tax liabilities 6,486 7,551 3,987
3,943,123 3,622,583 808,493
Liabilities directly associated with assets classified as held for sale – – 7,726
Total current liabilities 3,943,123 3,622,583 816,219
Total liabilities 4,164,171 3,879,391 1,354,694
EQUITYEquity attributable to owners of the CompanyShare capital 24 4,193 3,366 2,845Other reserves 2,297,335 972,132 446,658Accumulated losses (963,715) (806,066) (526,510)
1,337,813 169,432 (77,007)Non-controlling interests (10,082) (9,045) 2,855
Total equity/(deficit) 1,327,731 160,387 (74,152)
The above unaudited condensed consolidated statement of financial position should be read in conjunction with accompanying notes.

UNAUDITED CONDENSED CONSOLIDATED STATEMENT OF CHANGES IN EQUITY
B C T E C H N O L O G Y G R O U P L I M I T E D I N T E R I M R E P O R T 2 0 2 124
Attributable to owners of the Company
Share capital
Share premium
Capital surplus
Exchange reserve
Statutory reserve
Share-based payments
reserveAccumulated
losses Sub-total
Non-controlling
interests
Total (deficit)/
equityNotes HK$’000 HK$’000 HK$’000 HK$’000 HK$’000 HK$’000 HK$’000 HK$’000 HK$’000 HK$’000
At 1 January 2020 (Restated) 2,845 376,205 3,724 (25,665) 18,039 74,355 (526,510) (77,007) 2,855 (74,152)
(Loss)/profit for the period (Restated) – – – – – – (102,019) (102,019) 2,421 (99,598)Other comprehensive loss:Currency translation differences (Restated) – – – (2,650) – – – (2,650) (112) (2,762)Release of exchange reserve upon disposal of subsidiaries (Restated) – – – (315) – – – (315) – (315)
Total comprehensive (loss)/income (Restated) – – – (2,965) – – (102,019) (104,984) 2,309 (102,675)
Issuance of new shares (Restated) 24 431 279,719 – – – – – 280,150 – 280,150Equity-settled share-based payments under share option scheme (Restated) 29 – – – – – 18,765 – 18,765 – 18,765Equity-settled share-based payments under share award scheme (Restated) 28 – – – – – 30,475 – 30,475 – 30,475
At 30 June 2020 (Restated) 3,276 655,924 3,724 (28,630) 18,039 123,595 (628,529) 147,399 5,164 152,563
At 1 January 2021 (Restated) 3,366 760,601 3,724 (12,795) 18,850 201,752 (806,066) 169,432 (9,045) 160,387
(Loss)/profit for the period – – – – – – (158,099) (158,099) 238 (157,861)Other comprehensive income:Currency translation differences – – – 3,304 – – – 3,304 79 3,383
Total comprehensive income/(loss) – – – 3,304 – – (158,099) (154,795) 317 (154,478)
Issuance of new shares 24 792 1,191,260 – – – – – 1,192,052 – 1,192,052Equity-settled share-based payments under share option scheme 29 – – – – – 25,769 – 25,769 – 25,769Equity-settled share-based payments under share award scheme 28 – – – – – 25,355 – 25,355 – 25,355Exercise of share options 24 35 41,643 – – – (11,504) – 30,174 – 30,174Share awards vested 28 – 5,032 – – – (5,032) – – – –Equity-settled share-based payments for a warrant 10 – – – – – 49,826 – 49,826 – 49,826Dividend paid to non-controlling interests – – – – – – – – (1,354) (1,354)Transfer of statutory reserve upon deregistration of a subsidiary – – – – (450) – 450 – – –
At 30 June 2021 4,193 1,998,536 3,724 (9,491) 18,400 286,166 (963,715) 1,337,813 (10,082) 1,327,731
The above unaudited condensed consolidated statement of changes in equity should be read in conjunction with accompanying notes.

UNAUDITED CONDENSED CONSOLIDATED STATEMENT OF CASH FLOWS
B C T E C H N O L O G Y G R O U P L I M I T E D I N T E R I M R E P O R T 2 0 2 1 25
UnauditedFor the six months ended
30 June2021 2020
Notes HK$’000 HK$’000(Restated)
Cash flows from operating activitiesCash generated from operations 532,628 108,539Income tax paid (3,197) (1,834)
Net cash generated from operating activities 529,431 106,705
Cash flows from investing activitiesInterest received 212 239Addition of property, plant and equipment 15 (11,156) (1,658)Addition of intangible assets 16 – (5,433)Disposal of subsidiaries, net of cash disposal 25 – (133)Proceeds from disposals of property, plant and equipment – 86Acquisition of an associate (13,609) –Addition of financial assets at fair value through profit or loss (24,896) –
Net cash used in investing activities (49,449) (6,899)
Cash flows from financing activitiesInterest paid (17,672) (20,236)Proceeds from borrowings – 66,299Repayment of borrowing (124,317) (111,779)Principal elements of lease liabilities (19,425) (13,208)Proceeds from issuance of new shares 24(a) 1,192,052 280,150Proceeds from exercise of share options 30,174 –Dividend paid to non-controlling interests (1,354) –
Net cash generated from financing activities 1,059,458 201,226
Net increase in cash and cash equivalents 1,539,440 301,032
Effect of exchange rate changes on cash and cash equivalents 877 (703)Cash and cash equivalents at the beginning of the period 413,487 214,625
Cash and cash equivalents at the end of the period 1,953,804 514,954
The above unaudited condensed consolidated statement of cash flows should be read in conjunction with accompanying notes.

NOTES TO THE UNAUDITED CONDENSED CONSOLIDATEDINTERIM FINANCIAL STATEMENTS
B C T E C H N O L O G Y G R O U P L I M I T E D I N T E R I M R E P O R T 2 0 2 126
1 GENERAL INFORMATIONThe principal activity of the Company is investment holding. During the period, the Group was principally engaged in the digital assets and blockchain platform business in Hong Kong and Singapore, and the provision for traditional advertising and business park area management services in the People’s Republic of China (the “PRC”).
The Company was incorporated as an exempted company with limited liability in the Cayman Islands on 15 March 2011. The Company’s registered office is located at Cricket Square, Hutchins Drive, P.O. Box 2681, Grand Cayman KY1-1111, Cayman Islands. Its principal place of business is located at 39/F, Lee Garden One, 33 Hysan Avenue, Causeway Bay, Hong Kong.
In the opinion of the Directors of the Company, the ultimate holding company of the Company is Bell Haven Limited, which was incorporated in the British Virgin Islands.
The consolidated financial statements were presented in RMB in prior years. Starting from 1 January 2021, the Directors consider that as a result of the Group’s future internationalisation strategy and the source of funding, the Group has changed its presentation currency for the preparation of its unaudited condensed consolidated interim financial statements from RMB to HK$. The Directors considered that the change of presentation currency to HK$ enables the shareholders and potential investors of the Company to have a more accurate picture of the Group by aligning the Group’s financial performance with its share price.
The effects of the change in the presentation currency have been accounted for retrospectively with comparative figures restated. The comparative figures have been restated to reflect the change in presentation currency to HK$ accordingly. The Group has also presented the consolidated statement of financial position as at 1 January 2020 without related notes.
2 BASIS OF PREPARATION AND ACCOUNTING POLICIESThe unaudited condensed consolidated interim financial statements for the six months ended 30 June 2021 have been prepared in accordance with International Accounting Standard (“IAS”) 34 “Interim Financial Reporting” issued by the International Accounting Standards Board and the applicable disclosure requirements of the Rules Governing the Listing of Securities on The Stock Exchange of Hong Kong Limited (“Listing Rules”).
The unaudited condensed consolidated interim financial information should be read in conjunction with the audited consolidated financial statements of the Group for the year ended 31 December 2020 (the “2020 Annual Financial Statements”), which have been prepared in accordance with the International Financial Reporting Standards (“IFRSs”). The condensed consolidated interim financial information are unaudited but have been reviewed by the Audit Committee.

NOTES TO THE UNAUDITED CONDENSED CONSOLIDATEDINTERIM FINANCIAL STATEMENTS
B C T E C H N O L O G Y G R O U P L I M I T E D I N T E R I M R E P O R T 2 0 2 1 27
2 BASIS OF PREPARATION AND ACCOUNTING POLICIES (Continued)
The accounting policies and method of computation used in the preparation of the unaudited condensed consolidated interim financial statements of the Group for the period are consistent with those applied in the 2020 Annual Financial Statements except for the adoption of amended standards and framework and changes in accounting policies as set out below.
(a) Amendments to standards effective in current accounting period and are relevant to the Group’s operations
The Group has applied the following amendments to standards and framework for the first time for their reporting period commencing on 1 January 2021:
Amendments to IFRS 9, IAS 39, IFRS 7, IFRS 4 and IFRS 16
Interest rate benchmark reform — phase 2
Amendments to IFRS 16 COVID-19-related rent concessions
The adoption of amendments to standards and framework listed above did not have any impact on the amounts recognised in prior periods and are not expected to significantly affect the current or future periods.
(b) Changes in accounting policies in current accounting period
(i) Foreign currency translation
In preparing the financial statements of each individual group entity, transactions in currencies other than the functional currency of that entity (foreign currencies) are recognised at the rates of exchanges prevailing on the dates of the transactions. At the end of the reporting period, monetary items denominated in foreign currencies are retranslated at the rates prevailing at that date. Non-monetary items carried at fair value that are denominated in foreign currencies are retranslated at the rates prevailing on the date when the fair value was determined. Non-monetary items that are measured in terms of historical cost in a foreign currency are not retranslated.
Exchange differences arising on the settlement of monetary items, and on the retranslation of monetary items, are recognised in profit or loss in the period in which they arise.
For the purposes of presenting the unaudited condensed consolidated interim financial statements, the assets and liabilities of the Group’s operations are translated into the presentation currency of the Group (i.e. HK$) using exchange rates prevailing at the end of the reporting period. Income and expenses items are translated at the average exchange rates for the period, unless exchange rates fluctuate significantly during the period, in which case, the exchange rates prevailing at the dates of transactions are used. Exchange differences arising, if any, are recognised in other comprehensive income and accumulated in equity under the heading of exchange reserve (attributed to non-controlling interests as appropriate).
Exchange differences relating to the retranslation of the Group’s net assets in RMB to the Group’s presentation currency (i.e. HK$) are recognised directly in other comprehensive income and accumulated in exchange reserve.
The change in presentation currency of the Company was applied retrospectively, as if the new presentation currency had always been applied.

NOTES TO THE UNAUDITED CONDENSED CONSOLIDATEDINTERIM FINANCIAL STATEMENTS
B C T E C H N O L O G Y G R O U P L I M I T E D I N T E R I M R E P O R T 2 0 2 128
2 BASIS OF PREPARATION AND ACCOUNTING POLICIES (Continued)
(b) Changes in accounting policies in current accounting period (Continued)
(ii) Principles of consolidation and equity accounting
(a) Associates
Associates are all entities over which the Group has significant influence but not control or joint control. This is generally the case where the Group holds between 20% and 50% of the voting rights. Investments in associates are accounted for using the equity method of accounting (see (b) below), after initially being recognised at cost.
(b) Equity method
Under the equity method of accounting, the investments are initially recognised at cost and adjusted thereafter to recognise the Group’s share of the post-acquisition profits or losses of the investee in profit or loss, and the Group’s share of movements in other comprehensive income of the investee in other comprehensive income. Dividends received or receivable from associates are recognised as a reduction in the carrying amount of the investment.
Where the Group’s share of losses in an equity-accounted investment equals or exceeds its interest in the entity, including any other unsecured long-term receivables, the Group does not recognise further losses, unless it has incurred obligations or made payments on behalf of the other entity.
Unrealised gains on transactions between the Group and its associates are eliminated to the extent of the Group’s interest in these entities. Unrealised losses are also eliminated unless the transaction provides evidence of an impairment of the asset transferred. Accounting policies of equity-accounted investees have been changed where necessary to ensure consistency with the policies adopted by the Group.

NOTES TO THE UNAUDITED CONDENSED CONSOLIDATEDINTERIM FINANCIAL STATEMENTS
B C T E C H N O L O G Y G R O U P L I M I T E D I N T E R I M R E P O R T 2 0 2 1 29
2 BASIS OF PREPARATION AND ACCOUNTING POLICIES (Continued)
(c) New standard and amendments to standards that are not yet effective and have not been early adopted by the Group
Certain new amendments to standards and accounting guideline have been published that are not mandatory for financial year beginning on 1 January 2021 and have not been early adopted by the Group.
Effective foraccounting
periods beginningon or after
Amendments to IAS 16 Property, Plant and Equipment: Proceeds before intended use
1 January 2022
Amendments to IAS 37 Onerous contracts — costs of fulfilling a contract 1 January 2022Amendments to IFRS 3 Reference to the conceptual framework 1 January 2022Amendments to IFRS Standards
Annual Improvements to IFRS Standards 2018–2020 1 January 2022
Amendments to IAS 1 Classification of liabilities as current or non-current 1 January 2023Amendments to IAS 1 and IFRS Practice Statement 2
Disclosure of Accounting Policies 1 January 2023
IFRS 17 Insurance contracts 1 January 2023Amendments to IAS 8 Definition of accounting estimates 1 January 2023Amendments to IAS 12 Deferred Tax related to Assets and Liabilities
arising from a Single Transaction1 January 2023
Amendments to IFRS 10 and IAS 28
Sale or contribution of assets between an investor and its associate or joint venture
To be determined
The Group’s management assessed that there are no new amendments to standards and accounting guideline that are not yet effective and that would be expected to have a material impact on the entity in the current or future reporting periods and on foreseeable future transactions.
3 RISK DISCLOSURESThe Group operates in three main business segments, including a digital assets and blockchain platform business, an advertising business and a business park area management services business, each of which carries distinct risks related to their business model and correlation with the macroeconomic environment.
The unaudited condensed consolidated interim financial information does not include all risk management information and disclosures required in the annual financial statements, and should be read in conjunction with the 2020 Annual Financial Statements. There have been no changes in any risk management policies since the year end.

NOTES TO THE UNAUDITED CONDENSED CONSOLIDATEDINTERIM FINANCIAL STATEMENTS
B C T E C H N O L O G Y G R O U P L I M I T E D I N T E R I M R E P O R T 2 0 2 130
4 FAIR VALUE MEASUREMENT(a) Financial assets and liabilities
This note explains the judgements and estimates made in determining the fair values of the financial instruments that are recognised and measured at fair value in the unaudited condensed consolidated interim financial statements. To provide an indication about the reliability of the inputs used in determining fair value, the Group has classified its financial instruments into the three levels prescribed under the accounting standards. An explanation of each level follows underneath the table.
(i) Fair value hierarchy
Recurring fair value measurements
Level 1 Level 2 Level 3 TotalFinancial assets and liabilities Notes HK$’000 HK$’000 HK$’000 HK$’000
UnauditedAt 30 June 2021Financial assets at fair value through profit or loss — Convertible bonds – – 24,873 24,873
Liabilities due to customers — Digital asset liabilities 22 2,079,518 574,519 – 2,654,037Liabilities due to customers — Fiat currency liabilities 22 842,534 – – 842,534
2,922,052 574,519 – 3,496,571
AuditedAt 31 December 2020 (Restated)Liabilities due to customers — Digital asset liabilities 22 2,518,343 6,166 – 2,524,509Liabilities due to customers — Fiat currency liabilities 22 276,920 – – 276,920
2,795,263 6,166 – 2,801,429
There were no transfers between levels 1, 2 and 3 for recurring fair value measurements during the period.
Level 1: Quoted prices (unadjusted) in active markets for identical assets or liabilities.
Level 2: Inputs other than quoted prices included within level 1 that are observable for the asset or liability, either directly (that is, as prices) or indirectly (that is, derived from prices).
Level 3: Inputs for the asset or liability that are not based on observable market data (that is, unobservable inputs).
NOTES TO THE UNAUDITED CONDENSED CONSOLIDATEDINTERIM FINANCIAL STATEMENTS
B C T E C H N O L O G Y G R O U P L I M I T E D I N T E R I M R E P O R T 2 0 2 1 31
4 FAIR VALUE MEASUREMENT (Continued)
(a) Financial assets and liabilities (Continued)
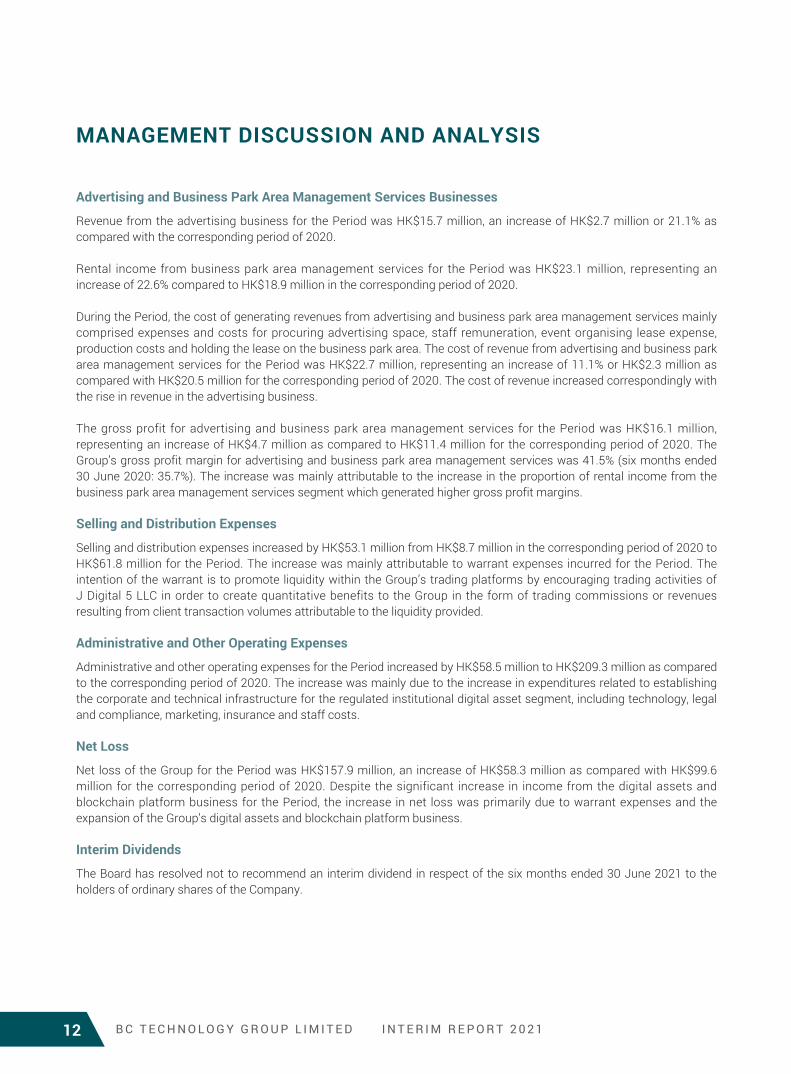
(ii) Fair value measurements using significant unobservable inputs (level 3)
The following table presents the changes in level 3 items for periods ended 30 June 2021 and 30 June 2020:
Financial assets
Convertible bondsUnaudited
For the six months ended30 June
2021 2020HK$’000 HK$’000
(Restated)
Addition during the Period 24,896 –Change in fair value 21 –Currency translation differences (44) –
Closing balance at 30 June 24,873 –
Financial liabilities
Convertible note Warrant TotalUnaudited
For the six months ended30 June
UnauditedFor the six months ended
30 June
UnauditedFor the six months ended
30 June2021 2020 2021 2020 2021 2020
HK$’000 HK$’000 HK$’000 HK$’000 HK$’000 HK$’000(Restated) (Restated) (Restated)
Opening balance at 1 January – 15,130 – 6,773 – 21,903Change in fair value – – – 1,014 – 1,014Currency translation differences – 72 – 44 – 116
Closing balance at 30 June – 15,202 – 7,831 – 23,033

NOTES TO THE UNAUDITED CONDENSED CONSOLIDATEDINTERIM FINANCIAL STATEMENTS
B C T E C H N O L O G Y G R O U P L I M I T E D I N T E R I M R E P O R T 2 0 2 132
4 FAIR VALUE MEASUREMENT (Continued)
(a) Financial assets and liabilities (Continued)
(iii) Valuation inputs and relationships to fair value
Fair value Significant unobservable inputs
Financial instruments
UnauditedAs at
30 June 2021
AuditedAs at
31 December 2020
Fairvalue hierarchy
Valuation techniquesand key inputs
30 June 2021
31 December 2020
HK$’000 HK$’000(Restated)
Financial assetsFinancial asset at fair value through profit or loss — Convertible bond (Note a)
23,299 – Level 3 Recent transaction price is adopted.
N/A N/A
Financial asset at fair value through profit or loss — Convertible bond (Note b)
1,574 – Level 3 Discount cash flow method is adopted and the key input is discount rate.
Discount rate of 4.99%
N/A
Financial liabilitiesLiabilities due to customers — Digital asset liabilities (Note c)
574,519 6,166 Level 2 The digital asset is quoted in unit of Bitcoin (“BTC”). Price of the digital assets at level 2 fair value is referenced to quoted price of BTC.
Quotedprice
of BTC
Quoted price of BTC
Notes:
(a) The fair value of the convertible bond has been determined by reference to the recent transaction price.
(b) The Group engaged external, independent and qualified valuers to determine the fair value of the Group’s financial asset at fair value through profit or loss at the end of reporting period. As at 30 June 2021, the fair value of the convertible bond was determined by ValQuest Advisory (Hong Kong) Limited.
(c) Digital asset inventories are held mainly for the purpose of trading in the ordinary course of the Group’s digital assets and blockchain platform business in the over-the-counter (“OTC”) market, the provision of automated digital assets trading services through its proprietary platforms and the provision of technology solutions to others. Based on respective rights and obligations between the Group and its customers under various agreements, and the obligations to settle or deliver such digital assets held by the Group in designated customer accounts are recognised as digital asset liabilities due to customers.

NOTES TO THE UNAUDITED CONDENSED CONSOLIDATEDINTERIM FINANCIAL STATEMENTS
B C T E C H N O L O G Y G R O U P L I M I T E D I N T E R I M R E P O R T 2 0 2 1 33
4 FAIR VALUE MEASUREMENT (Continued)
(a) Financial assets and liabilities (Continued)
(iii) Valuation inputs and relationships to fair value (Continued)
As at 30 June 2021 and 31 December 2020, the digital assets liabilities due to customers are measured at level 1 or level 2 fair value. The determination of fair value hierarchy level for valuation of the liabilities due to customers would depend on whether the underlying digital asset is traded in an active market.
In determining fair values, the relevant available markets are identified by the Group, and the Group considers accessibility to and activity within those markets in order to identify the principal digital asset markets dealt with by the Group. Reference is made to the quoted prices from the principal digital asset markets in determining the fair values of the corresponding digital assets.
Certain type of digital assets is not traded in an active market for fiat currency, instead, it is only traded for another type of digital assets. In such case, the digital asset inventories and the corresponding liabilities due to customers are measured at level 2 fair value and the Group takes reference to the quoted price of the other digital assets in determining the fair value.
The Group reviews significant unobservable input and performs valuation adjustment for the fair values of the financial assets and financial liabilities at fair value through profit or loss. The directors are of the opinion that any reasonable changes in the unobservable inputs would not result in a significant change in the Group’s result. Accordingly, no sensitivity analysis is presented for level 3 financial instruments.

NOTES TO THE UNAUDITED CONDENSED CONSOLIDATEDINTERIM FINANCIAL STATEMENTS
B C T E C H N O L O G Y G R O U P L I M I T E D I N T E R I M R E P O R T 2 0 2 134
4 FAIR VALUE MEASUREMENT (Continued)
(b) Non-financial assets and liabilities
(i) Fair value hierarchy
This note explains the judgements and estimates made in determining the fair values of the non-financial assets and liabilities that are recognised and measured at fair value in the unaudited condensed consolidated interim financial statements. To provide an indication about the reliability of the inputs used in determining fair value, the Group has classified its non-financial assets and liabilities into the three levels prescribed under the accounting standards. An explanation of each level is provided in Note 4(a) above.
Recurring fair value measurements
Level 1 Level 2 Level 3 TotalNotes HK$’000 HK$’000 HK$’000 HK$’000
UnauditedAt 30 June 2021Non-financial assetsDigital asset inventories 17 2,080,755 616,894 – 2,697,649Collateral receivables 274,866 – – 274,866Interest receivables arising from inventories due from counterparties – 11 – 11Inventories due from counterparties 19 – 777 – 777
2,355,621 617,682 – 2,973,303
Non-financial liabilitiesCollateral payables 63,711 – – 63,711Interest payables arising from inventories borrowed from counterparties 247 55 – 302Inventories borrowed from counterparties 23 16,623 5,437 – 22,060
80,581 5,492 – 86,073 AuditedAt 31 December 2020 (Restated)Non-financial assetsDigital asset inventories 17 3,036,648 70,237 – 3,106,885Interest receivables arising from inventories due from counterparties 15 92 – 107Inventories due from counterparties 19 1,707 36,354 – 38,061
3,038,370 106,683 – 3,145,053
Non-financial liabilitiesCollateral payables 179,559 – – 179,559Interest payables arising from inventories borrowed from counterparties 2,069 – – 2,069Inventories borrowed from counterparties 23 203,062 – – 203,062
384,690 – – 384,690
There were no transfers between levels 1, 2 and 3 for recurring fair value measurements during the period.

NOTES TO THE UNAUDITED CONDENSED CONSOLIDATEDINTERIM FINANCIAL STATEMENTS
B C T E C H N O L O G Y G R O U P L I M I T E D I N T E R I M R E P O R T 2 0 2 1 35
4 FAIR VALUE MEASUREMENT (Continued)
(b) Non-financial assets and liabilities (Continued)
(ii) Valuation inputs and relationships to fair value
Fair value Significant unobservable input
Non-financial assets/liabilities
UnauditedAs at
30 June2021
AuditedAs at
31 December2020
Fair value hierarchy
Valuation techniquesand key inputs
30 June 2021
31 December 2020
HK$’000 HK$’000(Restated)
Digital asset inventories 616,894 70,237 Level 2 The digital asset is quoted in unit of BTC. Price of the digital assets at level 2 fair value is referenced to quoted price of BTC.
Quoted priceof BTC
Quoted priceof BTC
Interest receivables arising from inventories due from counterparties
11 92 Level 2 The digital asset is quoted in unit of BTC. Price of the digital assets at level 2 fair value is referenced to quoted price of BTC.
Quoted priceof BTC
Quoted priceof BTC
Inventories due from counterparties
777 36,354 Level 2 The digital asset is quoted in unit of BTC. Price of the digital assets at level 2 fair value is referenced to quoted price of BTC.
Quoted priceof BTC
Quoted priceof BTC
Interest payable arising from inventories borrowed from counterparties
55 – Level 2 The digital asset is quoted in unit of BTC. Price of the digital assets at level 2 fair value is referenced to quoted price of BTC.
Quoted priceof BTC
N/A
Inventories borrowed from counterparties
5,437 – Level 2 The digital asset is quoted in unit of BTC. Price of the digital assets at level 2 fair value is referenced to quoted price of BTC.
Quoted priceof BTC
N/A
Digital asset inventories are held mainly for the facilitation of trading in the ordinary course of the Group’s digital assets and blockchain platform business in the OTC market, the provision of automated digital assets trading services through its proprietary platforms and the provision of technology solutions to others. There are also digital assets received or receivable by the Group under digital asset financing arrangements. Based on respective rights and obligations between the Group and its counterparties under various agreements, digital assets held in the Group’s wallets are recognised as the Group’s inventories.
As at 30 June 2021 and 31 December 2020, the digital asset inventories are measured at level 1 or level 2 fair value. The determination of fair value hierarchy level for valuation of the digital asset inventories would depend on whether the underlying digital assets are traded in an active market.
In determining fair values, the relevant available markets are identified by the Group, and the Group considers accessibility to and activity within those markets in order to identify the principal digital asset markets dealt with by the Group. Reference is made to the quoted prices from the principal digital asset markets in determining the fair values of the corresponding digital assets.
Certain type of digital assets is not traded in an active market for fiat currency, instead, it is only traded for another type of digital assets. In such case, the digital asset inventories and the corresponding liabilities due to customers are measured at level 2 fair value and the Group takes reference to the quoted price of the other digital assets in determining the fair value.

NOTES TO THE UNAUDITED CONDENSED CONSOLIDATEDINTERIM FINANCIAL STATEMENTS
B C T E C H N O L O G Y G R O U P L I M I T E D I N T E R I M R E P O R T 2 0 2 136
5 CRITICAL ACCOUNTING ESTIMATES AND JUDGMENTSThe preparation of the unaudited condensed consolidated interim financial statements requires the use of accounting estimates which, by definition, will seldom equal the actual results. Management also needs to exercise judgement in applying the Group’s accounting policies.
Estimates and judgements are continually evaluated by the Group and are based on historical experience and other factors, including expectations of future events that may have a financial impact on the entity and that are believed to be reasonable under the circumstances.
In preparing the unaudited condensed consolidated interim financial statements, the significant judgements made by management in applying the Group’s accounting policies and the key sources of estimation uncertainty were the same as those that applied to the 2020 Annual Financial Statements.
6 SEGMENT REPORTINGThe chief operating decision-maker of the Group has been identified as the executive directors of the Company. The executive directors regularly review revenue/income and operating results derived from different segments.
The Group has three reportable segments (30 June 2020: four reportable segments, including the discontinued operations) during the period. The segments are managed separately as each business offers different services and requires different business strategies. The following summary describes the operations in each of the Group’s reportable segments:
— Digital assets and blockchain platform business — facilitation of trading of digital assets in the OTC market and provision of automated digital assets trading services through its proprietary platforms, licensing of its proprietary platforms and technology solutions as a SaaS and others related businesses.
— Business park area management — providing operation and management services in business park area in the PRC.
— Traditional advertising — provision of traditional advertising services, public relation services and event marketing services in the PRC.
— Wireless advertising — provision of wireless advertising services in the PRC (Note).
Note: The Board had decided to discontinue the operation of wireless advertising business on 29 December 2016. In accordance with IFRS 5, the segment of wireless advertising service for the period ended 30 June 2020 was classified as discontinued operations in the Group’s unaudited condensed consolidated interim financial statements.

NOTES TO THE UNAUDITED CONDENSED CONSOLIDATEDINTERIM FINANCIAL STATEMENTS
B C T E C H N O L O G Y G R O U P L I M I T E D I N T E R I M R E P O R T 2 0 2 1 37
6 SEGMENT REPORTING (Continued)
Continuing operationsDigital
assets andblockchain
platformbusiness
Businesspark area
managementTraditionaladvertising Unallocated Total
HK$’000 HK$’000 HK$’000 HK$’000 HK$’000
Unaudited for the six months ended 30 June 2021ResultsIncome from other sources:Income from digital assets and blockchain platform business 107,043 – – – 107,043Rental income from business park area management services – 23,133 – – 23,133Revenue from contracts with customers:Revenue from advertising – – 15,711 – 15,711Service fee from SaaS 3,511 – – – 3,511Interest income from inventories financing and other revenues 3,416 – – – 3,416
(Loss)/profit for the period (61,582) 4,136 (1,043) (99,372) (157,861)
Unaudited as at 30 June 2021Assets and liabilitiesReportable segment assets (Note (ii)) 4,680,629 141,884 69,520 599,869 5,491,902
Reportable segment liabilities (Note (ii)) 3,727,563 117,783 18,561 300,264 4,164,171

NOTES TO THE UNAUDITED CONDENSED CONSOLIDATEDINTERIM FINANCIAL STATEMENTS
B C T E C H N O L O G Y G R O U P L I M I T E D I N T E R I M R E P O R T 2 0 2 138
6 SEGMENT REPORTING (Continued)
Continuing operationsDiscontinued
operationsDigital
assets andblockchain
platformbusiness
Businesspark area
managementTraditionaladvertising Unallocated Sub-total
Wirelessadvertising Total
HK$’000 HK$’000 HK$’000 HK$’000 HK$’000 HK$’000 HK$’000
Unaudited for the six months ended 30 June 2020 (Restated)ResultsIncome from other sources:Income from digital assets and blockchain platform business 62,259 – – – 62,259 – 62,259Rental income from business park area management services – 18,870 – – 18,870 – 18,870Revenue from contracts with customers:Revenue from advertising – – 12,974 – 12,974 – 12,974Service fee from SaaS 2,656 – – – 2,656 – 2,656Interest income from inventories financing and other revenues 2,340 – – – 2,340 – 2,340
(Loss)/profit for the period (151) 1,361 (2,921) (100,276) (101,987) 2,389 (99,598)
(Loss)/profit for the period from continuing operations (151) 1,361 (2,921) (100,276) (101,987) – (101,987)Profit for the period from discontinued operations – – – – – 2,389 2,389
(151) 1,361 (2,921) (100,276) (101,987) 2,389 (99,598)
Audited as at 31 December 2020 (Restated)Assets and liabilitiesReportable segment assets (Note (ii)) 3,522,724 147,473 75,281 294,300 4,039,778 – 4,039,778
Reportable segment liabilities (Note (ii)) 3,333,607 125,876 25,017 394,891 3,879,391 – 3,879,391
Notes:
(i) All revenue and income were generated from external customers. There were no sales or other transactions between the business segments for the periods ended 30 June 2021 and 2020.
(ii) Unallocated assets mainly include cash and cash equivalents held by head office and pledged deposits. Unallocated liabilities mainly include borrowings.

NOTES TO THE UNAUDITED CONDENSED CONSOLIDATEDINTERIM FINANCIAL STATEMENTS
B C T E C H N O L O G Y G R O U P L I M I T E D I N T E R I M R E P O R T 2 0 2 1 39
7 REVENUE FROM CONTRACTS WITH CUSTOMERS UNDER IFRS 15(a) Disaggregation of revenue from contracts with customers
During the period ended 30 June 2021, all sources of revenue from contracts with customers were recognised over time (30 June 2020: same).
UnauditedFor the six months ended
30 June2021 2020
HK$’000 HK$’000(Restated)
Revenue from advertising business 15,711 12,974Service fee from SaaS (Note 8) 3,511 2,656Interest income from inventories financing (Note 8) 1,336 1,597Others (Note 8) 2,080 743
(b) Assets and liabilities related to contracts with customers
The Group has recognised the following assets and liabilities related to contracts with customers:
Unaudited AuditedAs at
30 JuneAs at
31 December2021 2020
HK$’000 HK$’000(Restated)
Contract assets from advertising business 5,099 2,230Contract assets from digital assets and blockchain platform business 1,743 442Less: loss allowance in relation to advertising business (116) (115)
6,726 2,557Assets recognised from costs to fulfill revenue contracts 3,063 3,971
Total contract assets 9,789 6,528
Contract liabilities 5,524 7,391

NOTES TO THE UNAUDITED CONDENSED CONSOLIDATEDINTERIM FINANCIAL STATEMENTS
B C T E C H N O L O G Y G R O U P L I M I T E D I N T E R I M R E P O R T 2 0 2 140
7 REVENUE FROM CONTRACTS WITH CUSTOMERS UNDER IFRS 15 (Continued)
(b) Assets and liabilities related to contracts with customers (Continued)
The below table reconciles the impairment loss allowance which is related to contract assets:
Unaudited 30 June
Audited 31 December
2021 2020HK$’000 HK$’000
(Restated)
At the beginning of the period/year 115 2,263Reversal of provision for impairment of contract assets in relation to advertising business – (2,148)Provision for impairment of contract assets in relation to digital assets and blockchain platform business – 2,292Write-off of provision for impairment of contract assets in relation to digital assets and blockchain platform business – (2,292)Currency translation differences 1 –
At the end of the period/year 116 115
(i) Contract assets and liabilities
Contract assets represent revenue recognised prior to the date on which it is invoiced to customers and contract liabilities represent advance payments received from customers for goods or services that have not yet been transferred to the customers.
(ii) Revenue recognised in relation to contract liabilities
The following shows how much of the revenue recognised in the current reporting period relates to carried-forward contract liabilities and how much relates to performance obligations that were satisfied in a prior period.
UnauditedFor the six months ended
30 June2021 2020
HK$’000 HK$’000(Restated)
Revenue recognised that was included in the contract liabilities balance at the beginning of the period 1,884 1,731

NOTES TO THE UNAUDITED CONDENSED CONSOLIDATEDINTERIM FINANCIAL STATEMENTS
B C T E C H N O L O G Y G R O U P L I M I T E D I N T E R I M R E P O R T 2 0 2 1 41
8 INCOME FROM DIGITAL ASSETS AND BLOCKCHAIN PLATFORM BUSINESSUnaudited
For the six months ended 30 June
2021 2020HK$’000 HK$’000
(Restated)
Income from digital assets and blockchain platform business:Trading of digital assets (Note (a)) 104,340 62,435Net fair value gain/(loss) on digital asset inventories (Note (a)) 2,703 (176)Service fee from SaaS 3,511 2,656Interest income from inventories financing 1,336 1,597Others 2,080 743
113,970 67,255
Note:
(a) The Group’s digital assets and blockchain platform business includes primarily OTC trading business to trade digital assets with corporate and individual customers, and the provision of automated digital assets trading services through its proprietary platforms. Income from digital assets trading business represents trading margin arising from trading various digital assets and net gains or losses from remeasurement of digital asset inventories to the extent it is not offset by remeasurement of digital assets liabilities due to customers arising from Digital Assets Trading Agreement (“DATA”). The Group is exposed to net trading gain or loss from holding digital assets for trading up to the point when a trade (to buy or sell digital assets) with a customer is concluded with fixed terms of trade with respect to the type, unit and price of digital assets.
9 OTHER INCOME AND OTHER (LOSSES)/GAINS, NETUnaudited
For the six months ended 30 June
2021 2020HK$’000 HK$’000
(Restated)
Other incomeGovernment grants (Note) 546 384
Other (losses)/gains, netExchange (losses)/gains, net (158) 861Fair value changes of financial assets and financial liabilities at fair value through profit or loss 21 (1,014)Gain on disposals of property, plant and equipment – 86Others 110 152
Total (27) 85
Note: The amount mainly represented cash subsidies in respect of the Financial Sector Development Fund under the Monetary Authority of Singapore and Jobs Support Scheme granted by the Singapore Government (30 June 2020: COVID-19 related Employment Support Scheme and Research and Development Cash Rebate Scheme) for which the conditions of the grants have been fully satisfied as at the end of the period.

NOTES TO THE UNAUDITED CONDENSED CONSOLIDATEDINTERIM FINANCIAL STATEMENTS
B C T E C H N O L O G Y G R O U P L I M I T E D I N T E R I M R E P O R T 2 0 2 142
10 EXPENSES BY NATURECost of revenue, selling and distribution expenses, administrative and other operating expenses and provision for impairment losses on financial assets and contract assets, net included the following:
UnauditedFor the six months ended
30 June2021 2020
HK$’000 HK$’000(Restated)
Continuing operationsAmortisation of intangible assets 6,101 5,327Cost of revenue relating to advertising services (excluding employee benefits) 12,417 10,558Cost of revenue relating to provision of SaaS 908 –Depreciation of property, plant and equipment (excluding right-of-use assets) 5,292 5,094Depreciation of right-of-use assets 18,111 18,172Employee benefit expenses (including directors’ emoluments) 140,036 101,031Expense relating to short-term leases (included in administrative and other operating expenses) 4,262 1,104Share-based payment to warrant holder (Note (a)) 49,826 –IT costs 13,870 9,290
Note (a):
During the six months ended 30 June 2021, share-based payment expenses to warrant holder of approximately HK$49,826,000 (30 June 2020: Nil) was recognised under “selling and distribution expenses”.
The following table presents the key inputs for the share-based payment expenses related to the warrants:
Weight average share price of the Company as at the measurement dates HK$13.30
Number of warrant shares expected to vest up to 30 June 2021 11,526,270
No warrant shares were exercised by the warrant holder during the six months ended 30 June 2021 and 2020.

NOTES TO THE UNAUDITED CONDENSED CONSOLIDATEDINTERIM FINANCIAL STATEMENTS
B C T E C H N O L O G Y G R O U P L I M I T E D I N T E R I M R E P O R T 2 0 2 1 43
11 INCOME TAX EXPENSENo provision for Hong Kong profits tax and Singapore corporate income tax have been made as the Group did not generate any assessable profits arising in Hong Kong and Singapore during the six months ended 30 June 2021 and 2020.
Taxes on profits assessable in the PRC have been calculated at the prevailing tax rates, based on existing legislation, interpretations and practices in respect thereof. The PRC corporate income tax rate of all the PRC subsidiaries during the six months ended 30 June 2021 and 2020 was 25% on their taxable profits.
The amount of income tax expense charged to the unaudited condensed consolidated statement of profit or loss represents:
UnauditedFor the six months ended
30 June2021 2020
HK$’000 HK$’000(Restated)
Current tax PRC corporate income tax 2,023 1,423Deferred income tax (703) (613)
Income tax expense 1,320 810

NOTES TO THE UNAUDITED CONDENSED CONSOLIDATEDINTERIM FINANCIAL STATEMENTS
B C T E C H N O L O G Y G R O U P L I M I T E D I N T E R I M R E P O R T 2 0 2 144
12 DISCONTINUED OPERATIONSOn 29 December 2016, the Board decided to discontinue the operation of the wireless advertising business. The discontinued operations have no operation results and cash flows for the six months ended 30 June 2021. An analysis of the results and cash flows of the discontinued operations for the six months ended 30 June 2020 is as below:
UnauditedFor the
six monthsended 30 June
2020HK$’000
(Restated)
Discontinued operations
Statement of profit or loss of the discontinued operations:
Other gains –*Administrative and other operating expenses (4)Gain on disposal of on discontinued operations 2,393
Profit for the period from discontinued operations (attributable to owners of the Company) 2,389
Statement of cash flows of the discontinued operations:
Net cash used in operating activities and net cash outflows (1)
* Represents amount less than HK$1,000
13 DIVIDENDSThe Board did not recommend the payment of any dividend for the six months ended 30 June 2021 (30 June 2020: Nil).

NOTES TO THE UNAUDITED CONDENSED CONSOLIDATEDINTERIM FINANCIAL STATEMENTS
B C T E C H N O L O G Y G R O U P L I M I T E D I N T E R I M R E P O R T 2 0 2 1 45
14 LOSS PER SHAREFor continuing and discontinued operations
The calculation of the basic and diluted loss per share from continuing operations attributable to the owners of the Company is based on the following data:
UnauditedFor the six months ended
30 June2021 2020
HK$’000 HK$’000(Restated)
Loss from continuing operations:
Loss for the period attributable to the owners of the Company 158,099 102,019Add: Profit for the period from discontinued operations (attributable to the owners of the Company) – 2,389
Loss for the period from continuing operations attributable to owners of the Company for the purpose of basic and diluted loss per share 158,099 104,408
The calculation of the basic and diluted loss per share from continuing and discontinued operations attributable to the owners of the Company is based on the following data:
UnauditedFor the six months ended
30 June2021 2020
HK$’000 HK$’000(Restated)
Loss from continuing and discontinued operations:
Loss for the period attributable to the owners of the Company for the purpose of basic and diluted loss per share 158,099 102,019

NOTES TO THE UNAUDITED CONDENSED CONSOLIDATEDINTERIM FINANCIAL STATEMENTS
B C T E C H N O L O G Y G R O U P L I M I T E D I N T E R I M R E P O R T 2 0 2 146
14 LOSS PER SHARE (Continued)
For continuing and discontinued operations (Continued)
UnauditedFor the six months ended
30 June2021 2020
Number of shares:
Weighted average number of ordinary shares used as the denominator in calculating basic and diluted loss per share 359,387,646 303,666,406
HK$ HK$(Restated)
Loss per share for loss from continuing operations attributable to the owners of the Company Basic (per share) (0.44) (0.34) Diluted (per share) (0.44) (0.34)
Loss per share for loss from continuing and discontinued operations attributable to the owners of the Company Basic (per share) (0.44) (0.34) Diluted (per share) (0.44) (0.34)
Basic and diluted loss per share is calculated by dividing the loss attributable to the owners of the Company by the weighted average number of ordinary shares in issue during the period.
The share options, share award, convertible note and warrants granted by the Company and the Company’s subsidiaries could have potential dilutive effect on the loss per share. During the six months ended 30 June 2021, the share options, share award and a warrant granted by the Company (30 June 2020: the share options, share award granted by the Company, and a convertible note and a warrant by the Company’s loss-making subsidiaries) had anti-dilutive effect to the Group as the assumed conversion of these instruments would result in a decrease in loss per share.
15 PROPERTY, PLANT AND EQUIPMENTDuring the Period, the Group acquired property, plant and equipment with a cost of approximately HK$11,156,000 (six months ended 30 June 2020: approximately HK$1,658,000).
16 INTANGIBLE ASSETSIntangible assets included computer software and domain, goodwill, acquired lease with favorable terms and capitalised development costs. During the six months ended 30 June 2020, the Group capitalised and subsequently transferred to computer software and domain with a cost of approximately HK$5,433,000.
As at 30 June 2021, intangible assets included goodwill of approximately HK$11,155,000 (31 December 2020: approximately HK$10,993,000) arose from the acquisition of 上海憬威企業發展有限公司 (“Shanghai Jingwei”), on 1 October 2016, whose principal activity is the provision of operation and management services of the business park area.

NOTES TO THE UNAUDITED CONDENSED CONSOLIDATEDINTERIM FINANCIAL STATEMENTS
B C T E C H N O L O G Y G R O U P L I M I T E D I N T E R I M R E P O R T 2 0 2 1 47
17 INVENTORIESUnaudited Audited
As at 30 June
As at 31 December
2021 2020HK$’000 HK$’000
(Restated)
Digital asset inventories: — Held in own wallets of the Group 2,637,572 3,088,329 — Digital assets held on exchange institutions (Note) 60,077 18,556
2,697,649 3,106,885
Note: The digital assets held on third party exchange institutions are measured at fair value. They represent balance of digital assets attributable to the Group held in shared wallets of the third party exchanges.
Given the good reputation of the exchanges and no history of default on demanding immediate withdrawal of digital assets, management believes counterparty credit risk is minimal at 30 June 2021 and 31 December 2020.
As at 30 June 2021, inventory balance of approximately USD2,541,000, equivalent to approximately HK$19,737,000 (31 December 2020: approximately USD2,300,000, equivalent to approximately HK$17,829,000), represents digital assets held on a trading account with a third party digital assets exchange (“Third Party Trading Platform”) for the purpose of hedging risks arising from the digital asset trading business of a subsidiary of the Group. Due to inquiries by a governmental agency having jurisdiction over the Third Party Trading Platform, the Group’s access to the trading account with the Third Party Trading Platform has been put on hold. The underlying digital assets held on the trading account comprised mainly Bitcoin and other stablecoins which continued to be measured at fair value as at the end of the reporting periods. Management is confident that the Group can retrieve the digital assets balance once the governmental agency’s inquiries are resolved with the Third Party Trading Platform.
As at 30 June 2021, the balance of digital asset inventories included digital assets held by the Group in designated customer accounts under various contractual arrangements totaling approximately HK$2,654,037,000 (31 December 2020: approximately HK$2,524,509,000) (Note 22). It also included the Group’s proprietary inventories of approximately HK$43,612,000 (31 December 2020: approximately HK$582,376,000). The balance is measured at fair value through profit or loss.
Net fair value gain of approximately HK$2,703,000 (30 June 2020: loss of approximately HK$176,000) from remeasurement of digital assets inventories at 30 June 2021 to the extent it is not offset by remeasurement of digital asset liabilities due to customers at the same dates is presented as part of the “income from digital assets and blockchain platform business” in the unaudited condensed consolidated statement of profit or loss (Note 8).

NOTES TO THE UNAUDITED CONDENSED CONSOLIDATEDINTERIM FINANCIAL STATEMENTS
B C T E C H N O L O G Y G R O U P L I M I T E D I N T E R I M R E P O R T 2 0 2 148
18 TRADE AND BILLS RECEIVABLESUnaudited Audited
As at 30 June
As at 31 December
2021 2020HK$’000 HK$’000
(Restated)
Trade receivables from business park area management services 6,207 5,859Less: loss allowance (5,946) (5,859)Trade receivables from advertising business 7,215 13,540Less: loss allowance (1,405) (1,385)
6,071 12,155
Trade receivables from digital assets and blockchain platform business 22,707 14,869Less: loss allowance (6,157) (6,370)
16,550 8,499
Trade receivables 22,621 20,654
For the advertising services, the Group may take up to 360 days to issue billing to the customers after service delivery and further grants a credit term of 30 to 90 days after the invoice date, while prepayments from customers for provision of business park area management services are generally required.
Customers of the digital assets and blockchain platform business are generally required to prefund their accounts prior to trades. Trades with liquidity providers and certain counterparties that are considered creditworthy can be on credit.
The Group has policies in place to ensure that sales are made to reputable and creditworthy customers with an appropriate financial strength and credit history. It also has other monitoring procedures to ensure that follow-up actions are taken to recover overdue debts.

NOTES TO THE UNAUDITED CONDENSED CONSOLIDATEDINTERIM FINANCIAL STATEMENTS
B C T E C H N O L O G Y G R O U P L I M I T E D I N T E R I M R E P O R T 2 0 2 1 49
18 TRADE AND BILLS RECEIVABLES (Continued)
At 30 June 2021 and 31 December 2020, the ageing analysis of the Group’s trade receivables, based on invoice date, were as follows:
Unaudited AuditedAs at
30 JuneAs at
31 December2021 2020
HK$’000 HK$’000(Restated)
0–30 days 15,131 13,99831–90 days 567 6,43591–180 days 497 –181–365 days 6,426 –Over 365 days – 221
22,621 20,654
19 INVENTORIES DUE FROM COUNTERPARTIESUnaudited Audited
As at 30 June
As at 31 December
2021 2020HK$’000 HK$’000
(Restated)
Inventories due from counterparties 777 38,061
The balance represented the lending of the Group’s digital assets to counterparties in terms of stablecoins being the loan principal. The loans are secured by collateral (as explained below) and they bear a fixed interest rate of 10.0% (31 December 2020: ranging from 6.5% to 9.5%) per annum. The loan principal and interest thereon are repayable by delivery of the outstanding units of the stablecoins upon maturity date of the arrangements which fall within 1 year (31 December 2020: 1 year) from the end of the reporting period.
The relevant stablecoin are asset-backed and has a market value of approximately USD1 per unit with minimal fluctuation. As such, fair value risk in relation to these loan principals and interest receivables (included in “other receivables”) is considered to be insignificant.
NOTES TO THE UNAUDITED CONDENSED CONSOLIDATEDINTERIM FINANCIAL STATEMENTS
B C T E C H N O L O G Y G R O U P L I M I T E D I N T E R I M R E P O R T 2 0 2 150
19 INVENTORIES DUE FROM COUNTERPARTIES (Continued)
In relation to the above-mentioned loan arrangements, the Group requires the counterparties to deliver another type of digital assets (BTC) to the Group as collateral at a level of 150% (31 December 2020: ranging from 125% to 200%) of loan principal in terms of fair value against the loan at inception. Additional collateral is required to be delivered to the Group at any time if the fair value of the digital assets collateral is less than or equal to a level of 135% (31 December 2020: ranging from 112.5% to 185%) of loan principal such that collateral level will be maintained at individual initial required collateral level of the loan principal. Consequently, management believes credit risk associated with these loan receivables is low.
As at 30 June 2021, the Group received digital asset collateral with fair value of approximately HK$1,301,000 from counterparties as collateral for the lending of digital assets to counterparties (31 December 2020: approximately HK$179,559,000). The collateral was included in “inventories” (Note 17) as the Group is able to utilise the digital assets received for its own economic benefits, with a corresponding “collateral payable” due to the counterparties, both measured at fair value through profit or loss on the unaudited condensed consolidated statement of financial position.
20 TRADE PAYABLESTrade payables are unsecured and are normally with credit terms of 90–180 days.
An ageing analysis of the Group’s trade payables as at the end of the reporting periods, based on the invoice date, was as follows:
Unaudited AuditedAs at
30 JuneAs at
31 December2021 2020
HK$’000 HK$’000(Restated)
0–30 days 65,553 43,99931–90 days 769 1,72791–180 days 722 754181–365 days 8,947 2,931Over 365 days 172 2,066
76,163 51,477

NOTES TO THE UNAUDITED CONDENSED CONSOLIDATEDINTERIM FINANCIAL STATEMENTS
B C T E C H N O L O G Y G R O U P L I M I T E D I N T E R I M R E P O R T 2 0 2 1 51
21 RIGHT-OF-USE ASSETS AND LEASE LIABILITIES(a) Amounts recognised in the unaudited condensed consolidated statement of financial position
The unaudited condensed consolidated statement of financial position shows the following amounts relating to leases:
Unaudited AuditedAs at
30 JuneAs at
31 December2021 2020
HK$’000 HK$’000(Restated)
Right-of-use assets (Note)Properties 136,203 153,213
Lease liabilities (Note)Non-current 132,074 151,803Current 39,857 38,112
171,931 189,915
Note: Included in the line item ‘property, plant and equipment’ and ‘lease liabilities’ in the unaudited condensed consolidated statement of financial position.
During the period ended 30 June 2021, there was no addition to the right-of-use assets (31 December 2020: Nil).

NOTES TO THE UNAUDITED CONDENSED CONSOLIDATEDINTERIM FINANCIAL STATEMENTS
B C T E C H N O L O G Y G R O U P L I M I T E D I N T E R I M R E P O R T 2 0 2 152
21 RIGHT-OF-USE ASSETS AND LEASE LIABILITIES (Continued)
(b) Amounts recognised in the unaudited condensed consolidated statement of profit or loss
The unaudited condensed consolidated statement of profit or loss shows the following amounts relating to leases:
UnauditedFor the six months ended
30 June2021 2020
HK$’000 HK$’000(Restated)
Depreciation charge of right-of-use assets Properties 18,111 18,172
UnauditedFor the six months ended
30 June2021 2020
HK$’000 HK$’000(Restated)
Interest expense on lease liabilities 10,784 12,244Expense relating to short-term leases (included in administrative and other operating expenses) (Note 10) 4,262 1,104
15,046 13,348
The total cash outflow for leases during the period ended 30 June 2021 was approximately HK$34,471,000 (30 June 2020: approximately HK$26,556,000).

NOTES TO THE UNAUDITED CONDENSED CONSOLIDATEDINTERIM FINANCIAL STATEMENTS
B C T E C H N O L O G Y G R O U P L I M I T E D I N T E R I M R E P O R T 2 0 2 1 53
22 LIABILITIES DUE TO CUSTOMERSUnaudited Audited
As at 30 June
As at 31 December
2021 2020HK$’000 HK$’000
(Restated)
Liabilities due to customers— Fiat currency liabilities 842,534 276,920— Digital assets liabilities 2,654,037 2,524,509
3,496,571 2,801,429
Liabilities due to customers arise in the ordinary course of the Group’s digital assets and blockchain platform business, where the Group’s contractual relationship with its customers is primarily governed by the DATA and other relevant agreements.
Based on the respective rights and obligations of the Group and its customers under various arrangements, fiat currency and digital assets held by the Group in the customers’ accounts are recognised as the Group’s assets with a corresponding liability due to the customers. The liabilities are measured at fair value through profit or loss with changes in fair values recognised in the unaudited condensed consolidated statement of profit or loss in the period of the changes as part of the “income from digital assets and blockchain platform business”.

NOTES TO THE UNAUDITED CONDENSED CONSOLIDATEDINTERIM FINANCIAL STATEMENTS
B C T E C H N O L O G Y G R O U P L I M I T E D I N T E R I M R E P O R T 2 0 2 154
23 BORROWINGSUnaudited Audited
As at 30 June
As at 31 December
2021 2020HK$’000 HK$’000
(Restated)
Non-currentSecured borrowings 63,809 63,691Unsecured borrowings – 8,000Inventories borrowed from counterparties – 7,760
63,809 79,451
CurrentSecured borrowings 150,508 186,368Unsecured borrowings 29,196 105,196Inventories borrowed from counterparties 22,060 195,302
201,764 486,866
Total borrowings 265,573 566,317
As at 30 June 2021, approximately HK$115,065,000 (31 December 2020: approximately HK$420,211,000) borrowings were interest bearing with interest rates ranging from 3% to 8% per annum (31 December 2020: 3% to 8% per annum). The remaining borrowings were non-interest bearing. Approximately HK$150,508,000 (31 December 2020: approximately HK$146,106,000) borrowings were secured by deposits of approximately HK$156,180,000 (31 December 2020: approximately HK$149,407,000). Borrowings were provided by a non-financial institution with a principal amount of approximately USD8,216,000 (equivalent to approximately HK$63,809,000) (31 December 2020: approximately USD13,410,000 (equivalent to approximately HK$103,953,000)). Under the terms of loan, the Group has pledged a total of 1,035 BTC (31 December 2020: 2,090 BTC).
The following table is prepared based on the scheduled repayment date set out in the relevant agreement:
Unaudited AuditedAs at
30 JuneAs at
31 December2021 2020
HK$’000 HK$’000(Restated)
On demand 21,195 –Within 1 year 180,569 486,866Between 1 and 2 years 63,809 79,451
265,573 566,317

NOTES TO THE UNAUDITED CONDENSED CONSOLIDATEDINTERIM FINANCIAL STATEMENTS
B C T E C H N O L O G Y G R O U P L I M I T E D I N T E R I M R E P O R T 2 0 2 1 55
24 SHARE CAPITALUnaudited Audited
As at 30 June As at 31 December2021 2020
Number of shares HK$’000
Number of shares HK$’000
(Restated)
Authorised:
Ordinary shares of HK$0.01 each at 30 June 2021 and 31 December 2020 2,000,000,000 20,000 2,000,000,000 20,000
Issued and fully paid:
At the beginning of the period/year 336,621,033 3,366 284,483,913 2,845Issuance of new shares (Notes (a) and (b)) 79,113,360 792 49,164,687 492Issuance of new shares upon conversion of a convertible note (Note (c)) – – 1,638,655 16Exercise of share options (Note (d)) 3,547,703 35 1,333,778 13
At the end of the period/year 419,282,096 4,193 336,621,033 3,366
Notes:
(a) On 5 January 2021, the Company allotted and issued a total of 45,000,000 ordinary shares at a subscription price of HK$15.50 per share to no less than 6 independent placees through a placing and top up subscription agreement with East Harvest Global Limited as vendor and Morgan Stanley & Co. International PLC as agent. Upon the issuance of the shares, HK$450,000 was credited to share capital and HK$657,549,000 was credited to share premium. On 11 June 2021, the Company placed a total of 31,952,500 ordinary shares at a price of HK$17.00 per share to one placee. Upon the issuance of the shares, HK$320,000 was credited to share capital and HK$533,733,000 was credited to share premium. (2020: On 24 January 2020, the Company allotted and issued 43,100,000 ordinary shares at a subscription price of HK$6.50 per share to 7 subscribers. Upon the issuance of the shares, HK$431,000 was credited to share capital and HK$279,719,000 was credited to share premium.)
(b)(i) During the six months ended 30 June 2021, the Company issued 2,160,860 new shares at HK$0.01 for each share to the trustee, pursuant to the share award plan adopted on 21 August 2018, to recognise and reward the contribution of employees and consultants providing similar services for providing services to the Group. The Board applied HK$22,000, in the share premium account of the Company to issue new shares credited as fully paid to the trustee. (2020: the Company issued 5,013,474 new shares at HK$0.01 for each share to the trustee, pursuant to the share award plan adopted on 21 August 2018, to recognise and reward the contribution of directors, employees and consultants providing similar services for providing services to the Group. The Board applied HK$50,000, in the share premium account of the Company to issue new shares credited as fully paid to the trustee.)
(b)(ii) On 6 July 2020, the Company allotted and issued 1,051,213 ordinary shares of the Company to J Digital 5 LLC at a consideration of HK$7,800,000 and the subscription consideration was used to set off against the repurchase costs of the warrant issued during the year ended 31 December 2018. Consequently, HK$11,000 was credited to share capital and HK$7,789,000 was credited to share premium.
(c) On 23 December 2020, J Digital 5 LLC exercised the conversion right to fully convert the convertible note into 1,638,655 ordinary shares of the Company at a conversion price of HK$9.52 per share. Consequently, HK$16,000 was credited to share capital and HK$16,281,000 was credited to share premium.
(d) During the six months ended 30 June 2021, 3,547,703 share options were exercised by the employees and consultants providing similar services for providing services to the Company and its subsidiaries. Consequently, HK$35,000 was credited to share capital and HK$41,643,000 was credited to share premium. (2020: 1,333,778 share options were exercised by the employees and consultants providing similar services for providing services to the Company and its subsidiaries. Consequently, HK$13,000 was credited to share capital and HK$14,934,000 was credited to share premium.)

NOTES TO THE UNAUDITED CONDENSED CONSOLIDATEDINTERIM FINANCIAL STATEMENTS
B C T E C H N O L O G Y G R O U P L I M I T E D I N T E R I M R E P O R T 2 0 2 156
25 DISPOSAL OF SUBSIDIARIESOn 1 December 2019, the Group entered into two agreements with an independent third party for the disposal of the Group’s 100% equity interest in each of 上海巨流信息科技有限公司 (“巨流信息”) and 上海巨流軟件有限公司 (“巨流軟件”), which are principally engaged in wireless advertising business in the PRC. The disposals of 巨流信息 and 巨流軟件 were completed on 17 January 2020 and 15 June 2020 respectively.
The net assets and liabilities of 巨流信息 and 巨流軟件 at the date of disposal were as follows:
17 January 2020 15 June 2020 Total巨流信息 巨流軟件
HK$’000 HK$’000 HK$’000(Restated) (Restated) (Restated)
Analysis of assets and liabilities over which control was lost:
Property, plant and equipment 87 – 87Other receivables 3,754 1,598 5,352Cash and cash equivalents 133 –* 133Trade and other payables (Note) (4,629) (2,295) (6,924)Contract liabilities (271) – (271)Current income tax liabilities (263) (192) (455)
Net liabilities disposed of (1,189) (889) (2,078)
Gain on disposal of subsidiaries:
Consideration received – – –Net liabilities disposed of 1,189 889 2,078Release of exchange reserve upon disposal of subsidiaries 162 153 315
Gain on disposal of subsidiaries 1,351 1,042 2,393
Net cash outflow on disposal of subsidiaries
Cash consideration – – –Less: cash and cash equivalents disposed of (133) –* (133)
(133) –* (133)
* Represents amount less than HK$1,000
Note: Balance is net of available debt waiver.

NOTES TO THE UNAUDITED CONDENSED CONSOLIDATEDINTERIM FINANCIAL STATEMENTS
B C T E C H N O L O G Y G R O U P L I M I T E D I N T E R I M R E P O R T 2 0 2 1 57
26 RELATED PARTY TRANSACTIONS(a) Significant related party transactions
Save as disclosed elsewhere in these unaudited condensed consolidated interim financial statements, the Group had the following material related party transactions:
UnauditedFor the six months ended
30 June2021 2020
HK$’000 HK$’000(Restated)
Interest expenses accrued on borrowings from related companies of a director (Note (i)) 74 2,407Interest expenses accrued on borrowings from directors and a related party (Note (ii)) 189 –Interest expenses accrued on inventories borrowed from a related company of Mr. Chapman David James and Mr. Madden Hugh Douglas (Note (iii)) 444 –Income from digital assets trading with Mr. Madden Hugh Douglas (Note (iv)) 508 –Income from digital assets trading with a related company of Mr. Ko Chun Shun, Johnson (Note (v)) 298 –
1,513 2,407
Notes:
(i) The above transactions were conducted in the normal course of business of the Group and charged at terms mutually agreed by the parties concerned. An executive director of the Company, Mr. Ko Chun Shun Johnson, is also the sole owner of the related companies.
(ii) The above transactions were conducted in the normal course of business of the Group and charged at terms mutually agreed by the parties concerned. The executive directors of the Company, Mr. Chapman David James, Mr. Madden Hugh Douglas and Mr. Lo Ken Bon and an executive director of the ultimate holding company of the Company, Ms. Cheng Wan Gi, are the lenders of such transactions.
(iii) The above transactions were conducted in the normal course of business of the Group and charged at terms mutually agreed by the parties concerned under the digital asset loan agreement. The executive directors of the Company, Mr. Chapman David James and Mr. Madden Hugh Douglas, are also the directors of the related company.
(iv) The above executive director is regarded as counterparty as the Group has a contractual relationship with him governed by the DATA in the ordinary course of the Group’s digital asset trading business.
(v) The related company is regarded as a counterparty governed by the DATA in the ordinary course of the Group’s digital asset trading business. The executive director of the Company, Mr. Ko Chun Shun, Johnson, is also the ultimate shareholder of the related company.

NOTES TO THE UNAUDITED CONDENSED CONSOLIDATEDINTERIM FINANCIAL STATEMENTS
B C T E C H N O L O G Y G R O U P L I M I T E D I N T E R I M R E P O R T 2 0 2 158
26 RELATED PARTY TRANSACTIONS (Continued)
(b) Balances with related parties
Save as disclosed elsewhere in these unaudited condensed consolidated interim financial statements, the Group had the following material balances with its directors and related parties:
UnauditedAs at
30 June2021
AuditedAs at
31 December2020
HK$’000 HK$’000(Restated)
Fiat currency and digital assets liabilitiesAmount due to Mr. Chapman David James (Note (i)) 191,961 139,371Amount due to Mr. Madden Hugh Douglas (Note (i)) 2,605 3,421Amount due to Mr. Lo Ken Bon (Note (i)) 57,005 14,348Amount due to a related company of Mr. Chapman David James and Mr. Madden Hugh Douglas (Notes (i) and (ii)) 284,213 71,940Amount due to a related company of Mr. Madden Hugh Douglas (Notes (i) and (iii)) 87,919 100,447Amount due to Ms. Lau Ka Wing, Claudia (Notes (i) and (iv)) 1,017 –Amount due to a related company of Mr. Chapman David James (Notes (i) and (v)) 195 –Amount due to a related company of Mr. Ko Chun Shun, Johnson (Notes (i) and (vi)) 11,253 –
636,168 329,527
Borrowing and interest payableAmount due to Mr. Chapman David James (Note (vii)) – 7,508Amount due to Mr. Madden Hugh Douglas (Note (vii)) – 7,508Amount due to Mr. Lo Ken Bon (Note (vii)) – 7,508Amount due to Ms. Cheng Wan Gi (Note (vii)) – 7,508Inventories borrowed from and its interest payable to a related company of Mr. Chapman David James and Mr. Madden Hugh Douglas (Note (viii)) – 68,121Amounts due to related companies of Mr. Ko Chun Shun, Johnson (Note (ix)) 147 56,074
147 154,227

NOTES TO THE UNAUDITED CONDENSED CONSOLIDATEDINTERIM FINANCIAL STATEMENTS
B C T E C H N O L O G Y G R O U P L I M I T E D I N T E R I M R E P O R T 2 0 2 1 59
26 RELATED PARTY TRANSACTIONS (Continued)
(b) Balances with related parties (Continued)
Notes:
(i) The above executive directors/related companies/an associate of executive director are regarded as counterparties which the Group has a contractual relationship with them governed by the DATA in the ordinary course of the Group’s digital asset trading business.
Based on the respective rights and obligations of the Group and its counterparties under the DATA, fiat currency and digital assets held by the Group in the customers’ accounts are recognised as the Group’s assets with a corresponding liability due to the customers. Refer to Note 22 to the unaudited condensed consolidated interim financial statements for details.
(ii) The related company is a counterparty of the Group’s digital assets trading business governed by the DATA. The executive directors of the Company, Mr. Chapman David James and Mr. Madden Hugh Douglas, are also the directors of the related company.
(iii) The related company is a counterparty of the Group’s digital assets trading business governed by the DATA. The executive director of the Company, Mr. Madden Hugh Douglas, is also the director of the related company.
(iv) The related party is a counterparty of the Group’s digital assets trading business governed by the DATA. Ms. Lau Ka Wing, Claudia, is an employee of the Group and she is an associate of Mr. Lo Ken Bon, executive director of the Group.
(v) The related company is a counterparty of the Group’s digital assets trading business governed by the DATA. The executive director of the Company, Mr. Chapman David James, is also the director of the related company.
(vi) The related company is a counterparty of the Group’s digital assets trading business governed by the DATA. The executive director of the Company, Mr. Ko Chun Shun, Johnson, is also the ultimate shareholder of the related company.
(vii) The borrowings, which were unsecured, interest bearing at 6% per annum and repayable in 12 months from the year ended 31 December 2020, had been reassigned by a related company controlled by an executive director of the Company, Mr. Ko Chun Shun, Johnson during the year ended 31 December 2020 to the executive directors of the Company, Mr. Chapman David James, Mr. Madden Hugh Douglas and Mr. Lo Ken Bon, and an executive director of the ultimate holding company of the Company, Ms. Cheng Wan Gi. The borrowings were repaid during the period ended 30 June 2021.
(viii) The borrowing was unsecured, interest bearing at 3% per annum and due in accordance with the terms of the underlying digital asset loan agreement. The executive directors of the Company, Mr. Chapman David James and Mr. Madden Hugh Douglas, are also the directors of the lender. The borrowing was repaid during the period ended 30 June 2021.
(ix) The borrowings were unsecured, interest bearing at 6% per annum and due in accordance with the terms of the underlying agreements. The borrowings were repaid during the period ended 30 June 2021.

NOTES TO THE UNAUDITED CONDENSED CONSOLIDATEDINTERIM FINANCIAL STATEMENTS
B C T E C H N O L O G Y G R O U P L I M I T E D I N T E R I M R E P O R T 2 0 2 160
27 FINANCIAL INSTRUMENTS BY CATEGORYThe carrying amounts of each of the categories of financial instruments as at the end of each reporting period are as follows:
Unaudited AuditedAs at
30 JuneAs at
31 December2021 2020
HK$’000 HK$’000(Restated)
Financial assets at amortised cost
Contract assets (excluding costs to fulfill revenue contract) (Note 7 (b)) 6,726 2,557Trade receivables (Note 18) 22,621 20,654Prepayments, deposits and other receivables (excluding prepayments, other tax receivables and interest receivables arising from inventories due from counterparties) 230,071 198,775Cash and cash equivalents 1,953,804 413,487
2,213,222 635,473
Financial assets at fair value through profit or loss
Convertible bonds 24,873 –
Financial liabilities measured at amortised cost
Trade payables (Note 20) 76,163 51,477Accruals, other payables and deposits received (excluding employee benefits, other tax payables and non-financial interest payables) 64,291 48,618Lease liabilities (Note 21) 171,931 189,915Borrowings (excluding inventories borrowed from counterparties) (Note 23) 243,513 363,255
555,898 653,265
Financial liabilities at fair value through profit or loss
Liabilities due to customers (Note 22) 3,496,571 2,801,429
NOTES TO THE UNAUDITED CONDENSED CONSOLIDATEDINTERIM FINANCIAL STATEMENTS
B C T E C H N O L O G Y G R O U P L I M I T E D I N T E R I M R E P O R T 2 0 2 1 61
28 SHARE AWARD PLANThe Company has adopted a share award plan (the “Share Award Plan”) on 21 August 2018. The purposes of the Share Award Plan are to recognise and reward the contribution of certain Eligible Participants to the growth and development of the Group, to give incentives to Eligible Participants in order to retain them for the continual operation and development of the Group, and to attract suitable personnel for further development of the Group.
Tricor Trust (HK) Limited, a company incorporated in Hong Kong and authorised to undertake trust business in accordance with the laws of Hong Kong, was appointed as the trustee (the “Trustee”) for the administration of the share award plan. The Trustee will hold the shares on trust for the selected participants. The Trustee and its ultimate beneficial owners are third parties independent of, and not connected with, the Group or its connected persons.
The Group shall pay the Trustee service fee and reimburse its proper expenses incurred in the operation of the trust under the trust deed. The service fees to be paid to the Trustee are determined after considering the service fees to be charged by other independent trustee companies and on arm’s length negotiations between the Group and the Trustee.
The aggregate number of Shares (“Awarded Shares”) currently permitted to be awarded under the Share Award Plan throughout the duration of the Share Award Plan is limited to 5% of the issued share capital of the Company to be refreshed by the Board from time to time subject to the approval of the shareholders in general meeting.
Under the Share Award Plan, the employees and consultants of the Group (“Selected Participants”) are entitled to receive shares in the Company. New shares have been allotted and issued by the Company to an independent trustee which holds the shares for the benefits of the Selected Participants before the Awarded Shares are vested.
When a Selected Participant has satisfied all vesting conditions, which might include service and/or performance conditions, specified by the Board at the time of making the award and become entitled to the shares of the Company forming the subject of the award, the Trustee shall transfer the relevant vested Awarded Shares to that employee at no cost.
The Trustee shall not exercise the voting rights in respect of any shares of the Company held under the Trust, including, inter alia, the Awarded Shares and further shares of the Company acquired out of the income derived therefrom.
The 3% Plan Limit (“Refreshed Scheme Limit”) was refreshed by the shareholders at the annual general meeting of the Company held on 28 June 2019. The maximum number of shares which can be granted under the Refreshed Scheme Limit shall be 8,510,982 shares, representing 2.03% of the shares in issue.

NOTES TO THE UNAUDITED CONDENSED CONSOLIDATEDINTERIM FINANCIAL STATEMENTS
B C T E C H N O L O G Y G R O U P L I M I T E D I N T E R I M R E P O R T 2 0 2 162
28 SHARE AWARD PLAN (Continued)
On 27 January 2021, 2,160,860 Awarded Shares were granted and among 2,160,860 Awarded Shares granted, (i) 364,666 Awarded Shares have been vested on 7 April 2021 and in respect of 549,860 Awarded Shares, one-third of the Awarded Shares will be vested on 7 January 2022; and (ii) in respect of 1,611,000 Awarded Shares, one-fourth of the Awarded Shares will be vested on each of 4 September 2021, 4 September 2022, 4 September 2023 and 4 September 2024. The movement of Awarded Shares during the Period was illustrated as below:
Award typeOutstanding at
1 January 2021Issued
during the PeriodForfeited
during the PeriodRegrant
during the PeriodVested
during the PeriodOutstanding at 30 June 2021
Share Award grant 6,155,446 2,160,860 (256,815) 216,140 (364,666) 7,910,965
Award typeOutstanding at
1 January 2020Issued
during the PeriodForfeited
during the PeriodRegrant
during the PeriodVested
during the PeriodOutstanding at 30 June 2020
Share Award grant 9,736,474 3,288,974 (646,351) 150,000 – 12,529,097
The Group recognised an expense of approximately HK$25,355,000 (30 June 2020: HK$30,475,000) for the period ended 30 June 2021 in relation to the Awarded Shares granted by the Company.
At the date of this interim report, the total number of Awarded Shares which can be granted under the Refreshed Scheme Limit was 1,336,648, representing 0.32% of the share in issue.
29 SHARE OPTION SCHEMEThe Company adopted a share option scheme (the “2012 Share Option Scheme”) on 10 April 2012. The Company terminated the 2012 Share Option Scheme and a new share option scheme (the “2021 Share Option Scheme”) was adopted on 28 May 2021. The terms of the 2012 Share Option Scheme and 2021 Share Option Scheme are in accordance with provisions of Chapter 17 of the Listing Rules.
During the period ended 30 June 2021, the Company granted 3,500,000 share options under the 2012 Share Option Scheme, while 290,000 share options had been lapsed and 3,547,703 share options had been exercised, hence 40,980,353 share options were remained outstanding. No share options under the 2021 Share Option Scheme were granted, exercised, cancelled or lapsed. Hence, no outstanding options were noted at the end of the reporting period under the 2021 Share Option Scheme.

NOTES TO THE UNAUDITED CONDENSED CONSOLIDATEDINTERIM FINANCIAL STATEMENTS
B C T E C H N O L O G Y G R O U P L I M I T E D I N T E R I M R E P O R T 2 0 2 1 63
29 SHARE OPTION SCHEME (Continued)
The Company has used Black-Scholes option pricing model for assessing the fair value of the share options granted. The following table lists the fair value and the assumptions adopted in the calculation of the fair value at the grant dates as below:
Date of grantNumber of
options
Exerciseprice per
option
Closingprice ofshares before
the date of grant
Vesting period ofshare options Exercise period of share options
Fair valueon grant
date
Risk-freeInterest
rate
Expecteddividend
yieldExpectedvolatility
(HK$) (HK$) (HK$) (%) (Note 2) (Note 3)
1. 22 August 2018 (2018 Share Option 1)
16,715,556 8.88 8.75 22 August 2018 to22 August 2020
(i) two-thirds: 22 August 2020 to 21 August 2023 3.53 2.03
22 August 2018 to22 August 2021
(ii) one-third: 22 August 2021 to 21 August 2023 3.77 2.03
2. 10 December 2018 (2018 Share Option 2)
433,333 7.84 7.80 10 December 2018 to 22 August 2020
(i) two-thirds: 22 August 2020 to 21 August 2023 3.04 2.03
10 December 2018 to 22 August 2021
(ii) one-third: 22 August 2021 to 21 August 2023 3.26 2.03
3. 18 January 2019 (2019 Share Option 1)
2,851,111 7.53 7.50 18 January 2019 to22 August 2020
(i) two-thirds: 22 August 2020 to 21 August 2023 2.88 2.03
18 January 2019 to22 August 2021
(ii) one-third: 22 August 2021 to 21 August 2023 3.09 2.03
4. 15 January 2020 (2020 Share Option 1)
1,700,000 7.45 7.45 15 January 2020 to22 August 2020
(i) two-thirds: 22 August 2020 to 21 August 2023 2.33 1.34
15 January 2020 to22 August 2021
(ii) one-third: 22 August 2021 to 21 August 2023 2.59 1.42
5. 12 June 2020 (2020 Share Option 2) (Note 1)
21,300,000 7.99 7.99 12 June 2020 to22 August 2021
(i) one-third of 14,300,000 shares: 22 August 2021 to 22 August 2025
2.83 0.34
12 June 2020 to22 August 2022
(ii) one-third of 14,300,000 shares: 22 August 2022 to 22 August 2025
3.03 0.35
12 June 2020 to22 August 2023
(iii) one-third of 14,300,000 shares: 22 August 2023 to 22 August 2025
3.21 0.37
12 June 2020 to22 August 2021
(iv) one-third of 6,800,000 shares: 22 August 2021 to 22 August 2025 (Note 1)
2.84 0.34
12 June 2020 to22 August 2022
(v) one-third of 6,800,000 shares: 22 August 2022 to 22 August 2025 (Note 1)
3.04 0.35
12 June 2020 to22 August 2023
(vi) one-third of 6,800,000 shares: 22 August 2023 to 22 August 2025 (Note 1)
3.22 0.37
12 June 2020 to22 August 2021
(vii) two-thirds of 200,000 shares: 22 August 2021 to 22 August 2025
2.83 0.34
12 June 2020 to22 August 2022
(viii) one-third of 200,000 shares: 22 August 2022 to 22 August 2025
3.03 0.35
6. 13 August 2020 (2020 Share Option 3)
1,838,500 10.99 10.56 13 August 2020 to22 August 2020
(i) one-fifth: 22 August 2020 to 22 August 2025 3.34 0.07
13 August 2020 to22 August 2021
(ii) one-fifth: 22 August 2021 to 22 August 2025 3.66 0.09
13 August 2020 to22 August 2022
(iii) one-fifth: 22 August 2022 to 22 August 2025 3.94 0.10
13 August 2020 to22 August 2023
(iv) one-fifth: 22 August 2023 to 22 August 2025 4.21 0.12
13 August 2020 to22 August 2024
(v) one-fifth: 22 August 2024 to 22 August 2025 4.45 0.14
7. 27 January 2021 (2021 Share Option 1)
3,500,000 14.39 13.80 27 January 2021 to22 August 2021
(i) one-fourth: 22 August 2021 to 22 August 2026 4.94 0.16
27 January 2021 to22 August 2022
(ii) one-fourth: 22 August 2022 to 22 August 2026 5.33 0.21
27 January 2021 to22 August 2023
(iii) one-fourth: 22 August 2023 to 22 August 2026 5.68 0.26
27 January 2021 to22 August 2024
(iv) one-fourth: 22 August 2024 to 22 August 2026 6.00 0.30
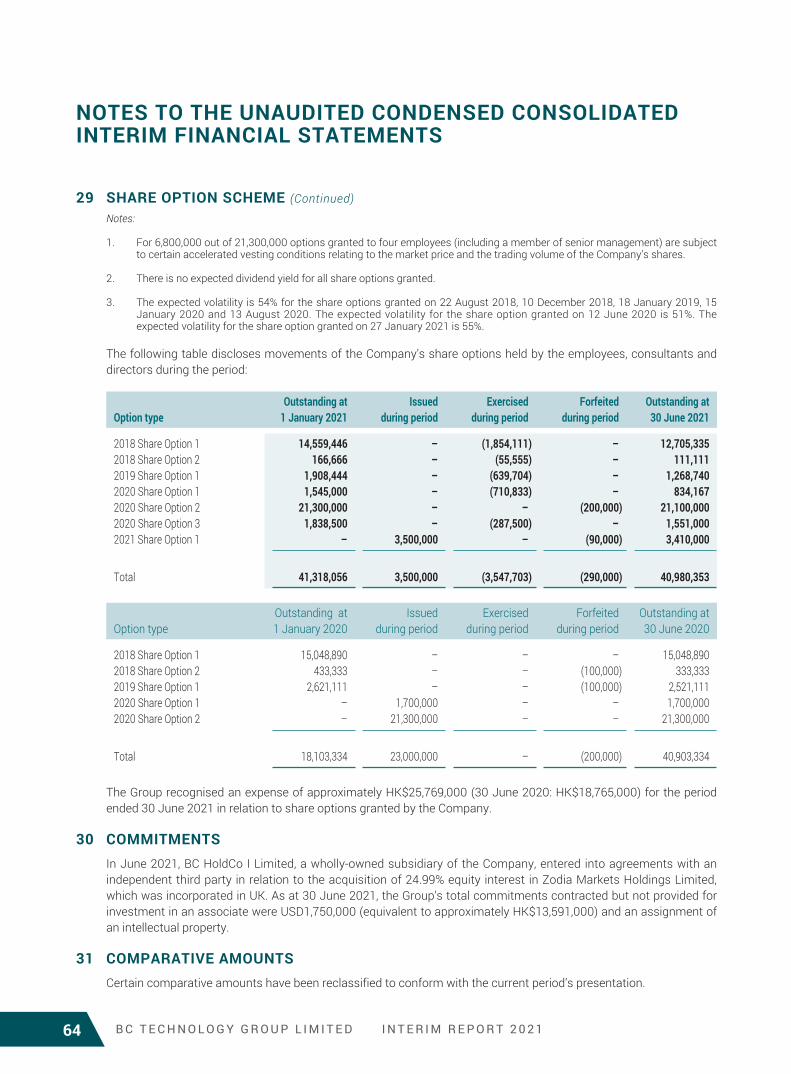
NOTES TO THE UNAUDITED CONDENSED CONSOLIDATEDINTERIM FINANCIAL STATEMENTS
B C T E C H N O L O G Y G R O U P L I M I T E D I N T E R I M R E P O R T 2 0 2 164
29 SHARE OPTION SCHEME (Continued)Notes:
1. For 6,800,000 out of 21,300,000 options granted to four employees (including a member of senior management) are subject to certain accelerated vesting conditions relating to the market price and the trading volume of the Company’s shares.
2. There is no expected dividend yield for all share options granted.
3. The expected volatility is 54% for the share options granted on 22 August 2018, 10 December 2018, 18 January 2019, 15 January 2020 and 13 August 2020. The expected volatility for the share option granted on 12 June 2020 is 51%. The expected volatility for the share option granted on 27 January 2021 is 55%.
The following table discloses movements of the Company’s share options held by the employees, consultants and directors during the period:
Option typeOutstanding at
1 January 2021Issued
during periodExercised
during periodForfeited
during periodOutstanding at 30 June 2021
2018 Share Option 1 14,559,446 – (1,854,111) – 12,705,3352018 Share Option 2 166,666 – (55,555) – 111,1112019 Share Option 1 1,908,444 – (639,704) – 1,268,7402020 Share Option 1 1,545,000 – (710,833) – 834,1672020 Share Option 2 21,300,000 – – (200,000) 21,100,0002020 Share Option 3 1,838,500 – (287,500) – 1,551,0002021 Share Option 1 – 3,500,000 – (90,000) 3,410,000
Total 41,318,056 3,500,000 (3,547,703) (290,000) 40,980,353
Option typeOutstanding at1 January 2020
Issuedduring period
Exercisedduring period
Forfeitedduring period
Outstanding at30 June 2020
2018 Share Option 1 15,048,890 – – – 15,048,8902018 Share Option 2 433,333 – – (100,000) 333,3332019 Share Option 1 2,621,111 – – (100,000) 2,521,1112020 Share Option 1 – 1,700,000 – – 1,700,0002020 Share Option 2 – 21,300,000 – – 21,300,000
Total 18,103,334 23,000,000 – (200,000) 40,903,334
The Group recognised an expense of approximately HK$25,769,000 (30 June 2020: HK$18,765,000) for the period ended 30 June 2021 in relation to share options granted by the Company.
30 COMMITMENTSIn June 2021, BC HoldCo I Limited, a wholly-owned subsidiary of the Company, entered into agreements with an independent third party in relation to the acquisition of 24.99% equity interest in Zodia Markets Holdings Limited, which was incorporated in UK. As at 30 June 2021, the Group’s total commitments contracted but not provided for investment in an associate were USD1,750,000 (equivalent to approximately HK$13,591,000) and an assignment of an intellectual property.
31 COMPARATIVE AMOUNTSCertain comparative amounts have been reclassified to conform with the current period’s presentation.

OTHER INFORMATION
B C T E C H N O L O G Y G R O U P L I M I T E D I N T E R I M R E P O R T 2 0 2 1 65
THE INTERESTS AND SHORT POSITIONS OF DIRECTORS AND CHIEF EXECUTIVE IN THE SHARES, UNDERLYING SHARES AND DEBENTURES OF THE COMPANY OR ANY ASSOCIATED CORPORATIONSAs at 30 June 2021, the interests and short positions of the Directors and chief executive of the Company in the Shares, underlying Shares and debentures of the Company or its associated corporations (within the meaning of Part XV of the SFO) which were required to be notified to the Company and the Stock Exchange under Divisions 7 and 8 of Part XV of the SFO (including any interests or short positions which they are taken or deemed to have under such provisions of the SFO) or required to be entered in the register of the Company pursuant to section 352 of the SFO, or required to be notified to the Company and the Stock Exchange pursuant to the Model Code for Securities Transactions by Directors of Listed Issuers as set out in Appendix 10 of the Listing Rules, were as follows:
Long Positions in Shares and Underlying Shares of the Company
Number of Ordinary Shares Held Number of underlying shares held
% of the issued
share capitalof the
Company*Name of DirectorPersonal
InterestFamily
InterestCorporateInterests Total
PersonalInterests
FamilyInterests Total
GrandTotal
Mr. Ko Chun Shun, Johnson – – 187,536,194(Note (i))
187,536,194 4,200,000(Note (iii))
– 4,200,000 191,736,194 45.73%
Mr. Lo Ken Bon – 60,000(Note (ii))
– 60,000 5,200,000(Note (iii))
1,131,111(Note (iv))
6,331,111 6,391,111 1.52%
Mr. Madden Hugh Douglas – – – – 5,200,000(Note (iii))
– 5,200,000 5,200,000 1.24%
Mr. Chapman David James – – – – 5,200,000(Note (iii))
– 5,200,000 5,200,000 1.24%
Mr. Tiu Ka Chun, Gary – – – – 900,000(Note (iii))
– 900,000 900,000 0.21%
Mr. Chau Shing Yim, David 20,000 – – 20,000 480,000(Note (iii))
– 480,000 500,000 0.12%
Mr. Chia Kee Loong, Lawrence
133,333 – – 133,333 366,667(Note (iii))
– 366,667 500,000 0.12%
Mr. Tai Benedict 30,000 – – 30,000 470,000(Note (iii))
– 470,000 500,000 0.12%
* The percentage has been calculated based on 419,282,096 Shares in issue as at 30 June 2021.
Notes:
(i) Mr. Ko is deemed to be interested in the 187,536,194 ordinary shares of the Company held by East Harvest Global Limited under the SFO by Virtue of his interests in Colour Day Limited.
(ii) These shares were held by the spouse of Mr. Lo.
(iii) These represent the share options of the Company granted to the respective Directors under the Company’s 2012 Share Option Scheme.
(iv) This represents the share options of the Company granted to the spouse of Mr. Lo under the Company’s 2012 Share Option Scheme.
Save as disclosed above, on 30 June 2021, none of the Directors had any interests or short positions in the shares or underlying shares of the Company or any of its associated corporations which had been recorded in the register required to be kept under Section 352 of the SFO or otherwise notified to the Company and the Stock Exchange pursuant to the Model Code.

OTHER INFORMATION
B C T E C H N O L O G Y G R O U P L I M I T E D I N T E R I M R E P O R T 2 0 2 166
DIRECTORS’ RIGHTS TO ACQUIRE SHARESSave as disclosed in the section titled “THE INTERESTS AND SHORT POSITION OF DIRECTORS AND CHIEF EXECUTIVE IN THE SHARES, UNDERLYING SHARES AND DEBENTURES OF THE COMPANY OR ANY ASSOCIATED CORPORATIONS” above at no time during the Period were rights to acquire benefits by means of the acquisition of shares in the Company granted to any Director or their respective spouse or minor children, or were any such rights exercised by them; or was the Company or any of its subsidiaries a party to any arrangement to enable the Directors to acquire such rights in any other body corporate.
SUBSTANTIAL SHAREHOLDERS’ AND OTHER PERSONS’ INTERESTS IN SHARESAs at 30 June 2021, other than the interests and short positions of the Directors or chief executive of the Company as disclosed in the section titled “THE INTERESTS AND SHORT POSITION OF DIRECTORS AND CHIEF EXECUTIVE IN THE SHARES, UNDERLYING SHARES AND DEBENTURES OF THE COMPANY OR ANY ASSOCIATED CORPORATIONS” above, the following interests of 5% or more of the issued share capital of the Company were recorded in the register of interests required to be kept by the Company pursuant to Section 336 of the SFO:
Number of Ordinary Shares Held % of the issued share
capital ofthe Company*Name
Direct Beneficially
owned
Through controlled
Corporation Total
East Harvest Global Limited 187,536,194 – 187,536,194 44.73%Wise Aloe Limited – 187,536,194
(Note (i))187,536,194 44.73%
Bell Haven Limited – 187,536,194(Note (ii))
187,536,194 44.73%
Colour Day Limited – 187,536,194(Note (iii))
187,536,194 44.73%
Mr. Ko Chun Shun, Johnson 4,200,000(Note (v))
187,536,194(Note (iv))
191,736,194 45.73%
GIC Private Limited 37,634,000 – 37,634,000 8.98%Zhang Chong 23,221,000 – 23,221,000 5.54%FIL Investment Management (Hong Kong) Limited
21,165,500 – 21,165,500 5.05%
FIL Asia Holdings Pte Limited – 21,165,500 21,165,500(Note (vi))
5.05%
FIL Limited – 21,165,500 21,165,500(Note (vii))
5.05%
Pandanus Partner L.P. – 21,165,500 21,165,500(Note (viii))
5.05%
Pandanus Associates Inc. – 21,165,500 21,165,500(Note (ix))
5.05%
* The percentage has been calculated based on 419,282,096 Shares in issue as at 30 June 2021.

OTHER INFORMATION
B C T E C H N O L O G Y G R O U P L I M I T E D I N T E R I M R E P O R T 2 0 2 1 67
SUBSTANTIAL SHAREHOLDERS’ AND OTHER PERSONS’ INTERESTS IN SHARES (Continued)
Notes:
(i) Wise Aloe Limited is deemed to be interested in the 187,536,194 ordinary shares of the Company held by East Harvest Global Limited under the SFO by virtue of its interests in East Harvest Global Limited.
(ii) Bell Haven Limited is deemed to be interested in the 187,536,194 ordinary shares of the Company held by East Harvest Global Limited under the SFO by virtue of its interests in Wise Aloe Limited. Bell Haven Limited is held as to 30.82% by Mr. Lo Ken Bon, and 22.09% by each of Mr. Madden Hugh Douglas and Mr. Chapman David James.
(iii) Colour Day Limited is deemed to be interested in the 187,536,194 ordinary shares of the Company held by East Harvest Global Limited under the SFO by virtue of its interests in East Harvest Global Limited.
(iv) Mr. Ko is deemed to be interested in the 187,536,194 ordinary shares of the Company held by East Harvest Global Limited under the SFO by virtue of its interests in Colour Day Limited.
(v) This represents the share options of the Company granted to Mr. Ko under the Company’s 2012 Share Option Scheme.
(vi) FIL Asia Holdings Pte Limited is deemed to be interested in the 21,165,500 ordinary shares of the Company in which FIL Investment Management (Hong Kong) Limited has an interest under the SFO by virtue of its interests in FIL Investment Management (Hong Kong) Limited.
(vii) FIL Limited is deemed to be interested in the 21,165,500 ordinary shares of the Company in which FIL Investment Management (Hong Kong) Limited has an interest under the SFO by virtue of its interests in FIL Asia Holdings Pte Limited.
(viii) Pandanus Partner L.P. is deemed to be interested in the 21,165,500 ordinary shares of the Company in which FIL Investment Management (Hong Kong) Limited has an interest under the SFO by virtue of its interests in FIL Limited.
(ix) Pandanus Associates Inc. is deemed to be interested in the 21,165,500 ordinary shares of the Company in which FIL Investment Management (Hong Kong) Limited has an interest under the SFO by virtue of its interests in Pandanus Partner L.P.
Save as disclosed above, at 30 June 2021, no other person (other than the Directors or chief executive of the Company whose interests are set out in the section titled “THE INTERESTS AND SHORT POSITION OF DIRECTORS AND CHIEF EXECUTIVE IN THE SHARES, UNDERLYING SHARES AND DEBENTURES OF THE COMPANY OR ANY ASSOCIATED CORPORATIONS” above) had registered an interest or short position in the shares or underlying shares of the Company that was required to be recorded pursuant to Section 336 of the SFO.

OTHER INFORMATION
B C T E C H N O L O G Y G R O U P L I M I T E D I N T E R I M R E P O R T 2 0 2 168
SHARE OPTION SCHEME OF THE COMPANYThe Company adopted the 2012 Share Option Scheme on 10 April 2012. On 28 May 2021, the Company terminated the 2012 Share Option Scheme and adopted the 2021 Share Option Scheme. The purpose of the Share Option Scheme is to attract and retain the eligible persons, to provide incentive to them and to promote the success of the business of the Group.
During the Period, the Company granted 3,500,000 share options under the 2012 Share Option Scheme (30 June 2020: 23,000,000), while 290,000 share options had been lapsed (30 June 2020: 200,000) and 3,547,703 share options had been exercised (30 June 2020: Nil), hence 40,980,353 share options were remained outstanding (30 June 2020: 40,903,334). No share options under the 2021 Share Option Scheme were granted during the Period.
The following table discloses the movements in the Company’s share options held by each of the directors, chief executive or substantial shareholders or their respective associates, and each of the employees and consultants providing similar services of the Company in aggregate granted under the 2012 Share Option Scheme during the period ended 30 June 2021:
Number of share options
Name or category of grantees
Date ofgrant ofshare options
ExercisePrice Validity Period
Balanceas at
1 January2021
Grantedduring
the period
Exercisedduring
the period
Lapsedduring
the period
Canceledduring
the period
Balanceas at
30 June2021
Weightedaverage
closing price of shares
immediatelybefore the
date on whichthe share
options were exercised
Closingprice
of sharesbefore the
date of grant
HK$ HK$ HK$
(i) Executive Directors
Mr. Ko Chun Shun, Johnson 22 August 2018 8.88 22 August 2018 to 21 August 2023 (Note 1)
1,000,000 – – – – 1,000,000 – 8.75
12 June 2020 7.99 12 June 2020 to 22 August 2025 (Note 2)
3,200,000 – – – – 3,200,000 – 7.99
Mr. Lo Ken Bon 22 August 2018 8.88 22 August 2018 to 21 August 2023 (Note 1)
2,000,000 – – – – 2,000,000 – 8.75
12 June 2020 7.99 12 June 2020 to 22 August 2025 (Note 2)
3,200,000 – – – – 3,200,000 – 7.99
Mr. Madden Hugh Douglas 22 August 2018 8.88 22 August 2018 to 21 August 2023 (Note 1)
2,000,000 – – – – 2,000,000 – 8.75
12 June 2020 7.99 12 June 2020 to 22 August 2025 (Note 2)
3,200,000 – – – – 3,200,000 – 7.99
Mr. Chapman David James 22 August 2018 8.88 22 August 2018 to 21 August 2023 (Note 1)
2,000,000 – – – – 2,000,000 – 8.75
12 June 2020 7.99 12 June 2020 to 22 August 2025 (Note 2)
3,200,000 – – – – 3,200,000 – 7.99
Mr. Tiu Ka Chun, Gary 15 January 2020 7.45 15 January 2020 to 21 August 2023 (Note 1)
300,000 – – – – 300,000 – 7.45
27 January 2021 14.39 27 January 2021 to 22 August 2026 (Note 7)
– 600,000 – – – 600,000 – 13.80

OTHER INFORMATION
B C T E C H N O L O G Y G R O U P L I M I T E D I N T E R I M R E P O R T 2 0 2 1 69
Number of share options
Name or category of grantees
Date ofgrant ofshare options
ExercisePrice Validity Period
Balanceas at
1 January2021
Grantedduring
the period
Exercisedduring
the period
Lapsedduring
the period
Canceledduring
the period
Balanceas at
30 June2021
Weightedaverage
closing price of shares
immediatelybefore the
date on whichthe share
options were exercised
Closingprice
of sharesbefore the
date of grant
HK$ HK$ HK$
(ii) Independent Non-Executive Directors
Mr. Chau Shing Yim, David 22 August 2018 8.88 22 August 2018 to 21 August 2023 (Note 1)
200,000 – (20,000) – – 180,000 16.50 8.75
12 June 2020 7.99 12 June 2020 to 22 August 2025 (Note 2)
300,000 – – – – 300,000 – 7.99
Mr. Chia Kee Loong, Lawrence 22 August 2018 8.88 22 August 2018 to 21 August 2023 (Note 1)
66,667 – – – – 66,667 – 8.75
12 June 2020 7.99 12 June 2020 to 22 August 2025 (Note 2)
300,000 – – – – 300,000 – 7.99
Mr. Tai Benedict 22 August 2018 8.88 22 August 2018 to 21 August 2023 (Note 1)
190,000 – (20,000) – – 170,000 17.78 8.75
12 June 2020 7.99 12 June 2020 to 22 August 2025 (Note 2)
300,000 – – – – 300,000 – 7.99
Directors in aggregate 21,456,667 600,000 (40,000) – – 22,016,667
(iii) Associates of Directors
Ms. Lau Ka Wing, Claudia (Note 5) 22 August 2018 8.88 22 August 2018 to 21 August 2023 (Note 1)
1,051,111 – – – – 1,051,111 – 8.75
27 January 2021 14.39 27 January 2021 to 22 August 2026 (Note 7)
– 80,000 – – – 80,000 – 13.80
Ms. Ko Wing Yan, Samantha (Note 6) 12 June 2020 7.99 12 June 2020 to 22 August 2025 (Note 2)
300,000 – – – – 300,000 – 7.99
Associates of Directors in aggregate 1,351,111 80,000 – – – 1,431,111
(iv) Other employees 22 August 2018 8.88 22 August 2018 to 21 August 2023 (Note 1)
5,809,446 – (1,703,000) – – 4,106,446 17.85 8.75
10 December 2018 7.84 10 December 2018 to 21 August 2023 (Note 1)
166,666 – (55,555) – – 111,111 13.80 7.80
18 January 2019 7.53 18 January 2019 to 21 August 2023 (Note 1)
1,908,444 – (639,704) – – 1,268,740 15.73 7.50
15 January 2020 7.45 15 January 2020 to 21 August 2023 (Note 1)
1,245,000 – (710,833) – – 534,167 16.17 7.45
12 June 2020 7.99 12 June 2020 to 22 August 2025 (Note 3)
7,000,000 – – (200,000) – 6,800,000 – 7.99
13 August 2020 10.99 13 August 2020 to 22 August 2025 (Note 4)
1,838,500 – (287,500) – – 1,551,000 18.74 10.56
27 January 2021 14.39 27 January 2021 to 22 August 2026 (Note 7)
– 2,715,000 – (90,000) – 2,625,000 – 13.80
Other employees in aggregate 17,968,056 2,715,000 (3,396,592) (290,000) – 16,996,464
(v) Other consultants 22 August 2018 8.88 22 August 2018 to 21 August 2023 (Note 1)
242,222 – (111,111) – – 131,111 19.70 8.75
12 June 2020 7.99 12 June 2020 to 22 August 2025 (Note 2)
300,000 – – – – 300,000 – 7.99
27 January 2021 14.39 27 January 2021 to 22 August 2026 (Note 7)
– 105,000 – – – 105,000 – 13.80
Others consultants in aggregate 542,222 105,000 (111,111) – – 536,111
Total 41,318,056 3,500,000 (3,547,703) (290,000) – 40,980,353
SHARE OPTION SCHEME OF THE COMPANY (Continued)

OTHER INFORMATION
B C T E C H N O L O G Y G R O U P L I M I T E D I N T E R I M R E P O R T 2 0 2 170
SHARE OPTION SCHEME OF THE COMPANY (Continued)
Notes:
1. The exercise period is (i) two-thirds of the options granted shall be exercisable on or after 22 August 2020, and (ii) one-third of the options granted shall be exercisable on or after 22 August 2021.
2. The exercise period is one-third of the options granted shall vest on each of 22 August 2021, 22 August 2022 and 22 August 2023.
3. For 6,800,000 options granted to four employees (including a member of senior management), one-third of the options granted shall vest on each of 22 August 2021, 22 August 2022 and 22 August 2023 subject to certain accelerated vesting conditions relating to the market price and the trading volume of the shares. For 200,000 options granted to an employee, (i) two-thirds of the options shall be exercisable on or after 22 August 2021, and (ii) one-third of the options granted shall be exercisable on or after 22 August 2022.
4. The exercise period is one-fifth of the options granted shall vest on each of 22 August 2020, 22 August 2021, 22 August 2022, 22 August 2023 and 22 August 2024.
5. Ms. Lau Ka Wing, Claudia, is an employee of the Group and she is an associate of Mr. Lo Ken Bon, executive Director of the Group.
6. Ms. Ko Wing Yan, Samantha, is a consultant of the Group and she is an associate of Mr. Ko Chun Shun, Johnson, an executive Director of the Group.
7. The exercise period is one-fourth of the options granted shall vest on each of 22 August 2021, 22 August 2022, 22 August 2023 and 22 August 2024.
The Company has used Black-Scholes model for assessing the fair value of the share options granted. It should be noted that the value of options varies with different variables of certain subjective assumptions, any change in variables or valuation model so adopted may materially affect the fair value estimate. Please refer to Note 29 to the unaudited condensed consolidated interim financial statements for the assumptions adopted in the calculation of the fair value at the grant dates.
Details of the movements in the share options of the Company during the Period are set out in Note 29 to the unaudited condensed consolidated interim financial statements.
SHARE AWARD PLAN OF THE COMPANYThe Company has adopted the Share Award Plan on 21 August 2018.
Details of the movements of the Awarded Shares of the Company during the Period are set out in Note 28 to the unaudited condensed consolidated interim financial statements.

OTHER INFORMATION
B C T E C H N O L O G Y G R O U P L I M I T E D I N T E R I M R E P O R T 2 0 2 1 71
DIRECTORS’ MATERIAL INTERESTS IN TRANSACTIONS, ARRANGEMENTS OR CONTRACTSSave as disclosed in Note 26 to the unaudited condensed consolidated interim financial statements, there were no transactions, arrangements or contracts of significance in relation to the Group’s business to which the Company or its subsidiaries was a party and in which a Director of the Company had a material interest, whether directly or indirectly, subsisted at the end of the year or at any time during the Period.
PURCHASE, REDEMPTION OR SALE OF LISTED SECURITIES OF THE COMPANYThe Company has not redeemed any of its listed securities during the Period. Neither the Company nor any of its subsidiaries, has purchased or sold any of the Company’s listed securities during the Period.
MODEL CODE FOR DIRECTORS’ SECURITIES TRANSACTIONSThe Company has adopted a code of conduct regarding securities transactions by Directors on terms no less exacting than the Model Code for Securities Transactions by Directors of Listed Issuers (the “Model Code”) as set out in Appendix 10 to the Listing Rules.
Having made specific enquiry with all the Directors, each of the Directors confirmed that he has complied with the required standards as set out in the Model Code throughout the six months ended 30 June 2021.
COMPLIANCE WITH THE CORPORATE GOVERNANCE CODEThroughout the six months ended 30 June 2021, the Board has reviewed the Group’s corporate governance practices and is satisfied that the Company has complied with the provisions of the relevant Corporate Governance Code from time to time, as set out in Appendix 14 to the Listing Rules.
All other information on the Corporate Governance Code of the Company have been disclosed in the Corporate Governance Report contained in the 2020 Annual Report of the Company issued in April 2021.
OTHER INFORMATION
B C T E C H N O L O G Y G R O U P L I M I T E D I N T E R I M R E P O R T 2 0 2 172
AUDIT COMMITTEEThe Company has an Audit Committee which was established in compliance with Rule 3.21 of the Listing Rules. The Audit Committee has adopted the terms of reference which are in line with the Corporate Governance Code. The primary duties of the Audit Committee are to review and supervise the financial reporting process and internal control system of the Group.
Currently, the Audit Committee comprises three independent non-executive Directors of the Company namely Mr. Chau Shing Yim, David (chairman), Mr. Chia Kee Loong, Lawrence and Mr. Tai Benedict.
The Audit Committee together with the management has reviewed the accounting principles and practices adopted by the Group and discussed the financial reporting matters including the review of the Group’s unaudited condensed consolidated interim financial statements for the six months ended 30 June 2021.
By order of the BoardBC Technology Group Limited
Lo Ken BonExecutive Director
Hong Kong, 17 August 2021