Embed Size (px)
Citation preview

9The Geographic Clustering of High-Tech Industry, Science & Innovation in Appalachia
2 Appalachia’s High-Tech Industrial BaseRather than utilize a single definition and measure of high-technology industrial activity, we char-
acterize Appalachia’s industrial base by synthesizing findings generated with three kinds of re-
lated information:The location of employment by sectors classified according to three levels oftechnology intensity;The location of employment in eight high-tech value-chains, where each value-chain is a group of linked technology-intensive industries as revealed by ananalysis of 1992 input-output patterns;The location of science and engineering workers in thirteen technology cat-egories.8
In the cases of sectoral employment and value-chain employment, we use county-level data and
statistical measures of spatial association to identify unique multi-county areas where technology-
related activity is significantly concentrated.9 We cannot use the same approach for the occupation
analysis since data on science and engineering workers are available only for metropolitan areas. Thus
an exact screening of individual counties based on the three measures is impossible. Nevertheless, we
produce graphic overlays of the results to aid identification of those sub-regions within and along the
border of Appalachia where technology-related activity is especially pronounced. Concepts, measures,
and data sources utilized in this section are summarized in Table 2.
8. There is no single widely accepted means of characterizing the geography of a region’s technology-intensiveindustrial base. Standard definitions of high-technology industry are necessarily problematic, secondary datasources are limited (often representing some sectors better than others), and government-defined sectoraldefinitions are imprecise. While high-technology industries might be viewed as those sectors undertakingsignificant R&D or employing scientists and engineers (the “input” view), definitions based on the technol-ogy-intensity of the production process (e.g., the adoption of advanced production machinery and methods;the “process” view) or the complement of technology in the final product (the “output” view) are equallyuseful in various research and policy contexts.
9. We also use ZIP codes as a unit of analysis in the case of high-tech employment.

10The Geographic Clustering of High-Tech Industry, Science & Innovation in Appalachia
We recognize that even with the use of varying industry and occupational classification schemes,
our approach may obscure some important underlying industrial strengths in advanced technology. Our
approach is a compromise between the obvious desirability of a highly detailed county-by-county in-
vestigation and the practical need for a methodology that is manageable for a large and diverse 406-
county region. Our objective is to shed light on the broader spatial pattern of technology-oriented
activity in Appalachia, to identify focus areas for strategic policy design, and to derive a set of sub-
regions that can be subjected to more detailed investigation.
2.1 Technology-Intensive Industry Employment
We begin by identifying spatial concentrations of private sector industry employment by grouping
high-tech sectors into three categories based on their utilization of scientists/engineers and volume of
R&D spending: very technology-intensive (VTI), moderately technology-intensive (MTI), and some-
what technology-intensive (STI).10 The specific SIC codes included under each category are reported in
Appendix Table 1. The following gives a broad (and non-exhaustive) indication of the components of
each group:VTI sectors: Pharmaceuticals, computer and communications equipment, aircraft,computer programming services and software, engineering services, commercialand noncommercial research houses, and testing laboratories;MTI sectors: Industrial chemicals, plastics, electronic components, vehicles, medicalinstruments, general hospitals, and medical and dental labs;
10. The classification, which is from the North Carolina Employment Security Commission as originally utilizedin NCACTs 1995, was based on early BLS studies of the proportion of scientists and engineers by sector andNational Science Foundation data on the conduct of R&D by sector (personal communication with Dr. WalterPlosila, former executive director of the North Carolina Alliance for Competitive Technologies).
Table 2
Study measurement of high-tech industrial activity
Concept Classification Variable Year(s)Concentration
measure Areal unit Data source
Technology-intensive industry
Three levels: Very technology-intensive, moderately technology-intensive, somewhat technology-intensive; from U.S. Bureau of Labor Statistics
Industry employment
1989, 1998
Location quotient,G statistic
Counties, zip codes
Confidential ES-202 series, U.S. Bureau of Labor Statistics
Value-chains Eight value chains developed via an input-output analysis of buyer-supplier patterns among high-technology sectors
Industry employment
1989, 1998
Location quotient,G statistic
Counties, zip codes
Confidential ES-202 series, US Bureau of Labor Statistics; 1992 benchmark input-output accounts, U.S. Bureau of Economic Analysis
Scientists & engineers
Scientific, engineering, and engineering technician ccupations
Occupational employment
1999 Location quotient
Metro areas
U.S. Bureau of Labor Statistics Occupational Employment Survey

11The Geographic Clustering of High-Tech Industry, Science & Innovation in Appalachia
STI sectors: Miscellaneous chemicals, engines, machinery, household appliances,electrical equipment, truck and bus bodies and trailers, medical appliances andsupplies, and miscellaneous communications services.
Data are from the confidential unsuppressed Unemployment Insurance Data Base (UDB) of the
U.S. Bureau of Labor Statistics, obtained with special permission.11 The UDB data, which contain em-
ployment and wage figures by establishment for all fifty states, permit us to take a fine-grained look at
employment patterns even in very small counties. Publicly available sources of employment data, such
as County Business Patterns, contain significant data suppression for detailed industries in small coun-
ties, either limiting the analysis to aggregated industries or requiring data estimation schemes that
introduce unknown error. Geographic identifiers in the UDB also permit the use of alternative spatial
units of analysis. We compare results using both counties and ZIP codes in order to minimize the
potential bias that can result from examining geographical patterns using arbitrarily shaped areal units.12
We use simple county-level location quotients as well as a measure of spatial association called a
G statistic to identify localized concentrations of activity. While a location quotient indicates a concen-
tration of activity within a single county that is relatively high compared to the national average, the G
statistic helps reveal broader multi-county areas where technology-related activity is especially pro-
nounced. The G works by analyzing the full multi-county spatial distribution of values of a given
indicator, such as high-tech employment, to detect where high and low values of the indicator are
clustered together. The details of the location quotient and G calculations are described in the Methods
Appendix.
Because the impacts of neither technology-oriented industries nor knowledge infrastructure re-
spect jurisdictional boundaries, the study area includes the 406 counties under the policy jurisdiction of
11. The ES-202 file reports employment and wage data for all firms subject to federal and state employmentsecurity law, with only the very smallest enterprises and sole proprietorships excluded. At the time of study,1998 was the most recent year available, with reliable data stretching back to 1989. The UDB data, along withthe BLS’ new Longitudinal Establishment Microdata (or LDB), are described in Pivetz, Searson et al. 2000.Strengths and limitations of BLS ES-202 data are discussed generally in White, Zipp et al. (1990) and Davis,Haltiwanger et al. (1996).
12. We use counties as the primary spatial unit because of the stability of their boundaries over time, their roughlysimilar size within the study region, and the relative accuracy with which the ES-202 data could be aggregatedto this unit. For the most part, counties are large enough to reflect a relatively homogenous economic unit, butsmall enough to capture local specializations. Yet counties are still an arbitrary unit of analysis for measuringeconomic interactions; county boundaries were developed independent of the concentrations of economicactivity we are attempting to identify. This creates a unique methodological dilemma known as the modifi-able area unit boundary problem (MAUP). MAUP implies that a redrawing of spatial boundaries (or alteringthe spatial aggregation) on which a given analysis is based could very well generate different results(Fotheringham and Wong 1991; Amrhein 1995; Wrigley 1995). To offset the possibility of MAUP error at thecounty level, we conduct supplementary analyses using approximated ZIP code boundaries. ZIP codes aretypically much smaller than counties, especially in urban areas, and help to pick up areas of tight spatialconcentration that get “washed-out” at the county level.
12The Geographic Clustering of High-Tech Industry, Science & Innovation in Appalachia
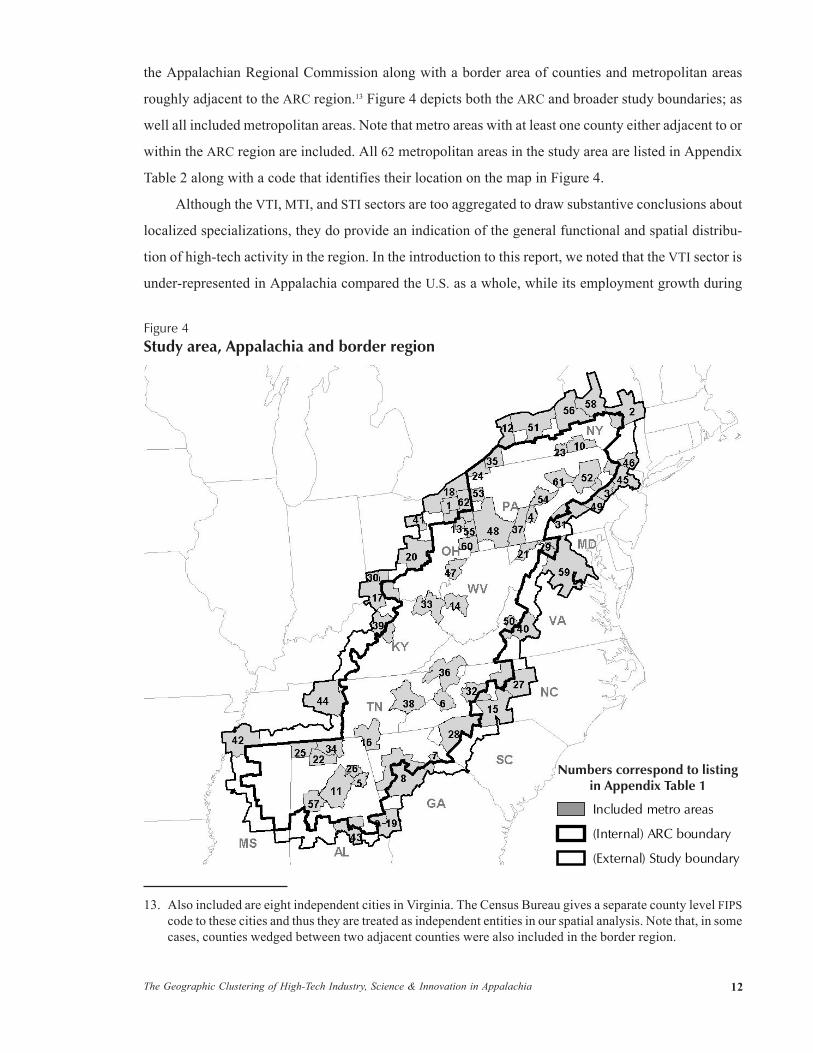
the Appalachian Regional Commission along with a border area of counties and metropolitan areas
roughly adjacent to the ARC region.13 Figure 4 depicts both the ARC and broader study boundaries; as
well all included metropolitan areas. Note that metro areas with at least one county either adjacent to or
within the ARC region are included. All 62 metropolitan areas in the study area are listed in Appendix
Table 2 along with a code that identifies their location on the map in Figure 4.
Although the VTI, MTI, and STI sectors are too aggregated to draw substantive conclusions about
localized specializations, they do provide an indication of the general functional and spatial distribu-
tion of high-tech activity in the region. In the introduction to this report, we noted that the VTI sector is
under-represented in Appalachia compared the U.S. as a whole, while its employment growth during
13. Also included are eight independent cities in Virginia. The Census Bureau gives a separate county level FIPScode to these cities and thus they are treated as independent entities in our spatial analysis. Note that, in somecases, counties wedged between two adjacent counties were also included in the border region.
Figure 4Study area, Appalachia and border region
Numbers correspond to listingin Appendix Table 1
(Internal) ARC boundary
Included metro areas
(External) Study boundary

13The Geographic Clustering of High-Tech Industry, Science & Innovation in Appalachia
the 1990s was sluggish (see Table 1). Likewise, although Appalachia is slightly over-represented com-
pared to the nation in the STI sector, employment in STI industries are barely expanding (a mere 0.5
percent net growth in employment between 1990 and 1998). Indeed, the trends suggest that Appalachia’s
high-tech industrial base is shifting toward industries in the MTI category. MTI industries as a group
posted the fastest rate of job growth among the three sectors between 1989 and 1998 (17 percent growth
in Appalachia compared to 14.1 percent at the national level). They also account for the largest share of
technology-related employment in the region (at 7.3 percent of private sector activity). As we show
below, MTI concentrations are also well represented throughout northern, central, and southern Appalachia.
To characterize the spatial distribution of VTI, MTI, and STI employment, we calculated our
measures of concentration (the local G statistic and location quotient) several different ways. First, we
calculated employment location quotients for each county for 1998. Next, we computed G statistics
first using counties and then ZIP codes as the units of analysis, with 1998 employment as the variable of
study. Finally, we calculated county-level local G statistics with the change in employment between
1989 and 1998 as the variable of interest. Figures 5–7 overlay the results, highlighting only significant
values for each measure. In the case of the G, highlighted values are those that are statistically signifi-
cant at the 95 percent level. In the case of the location quotient, highlighted values are those in excess
of 1.1. Employment location quotients appreciably greater than 1.0 indicate that there is a higher share
of the given activity in the study county than the U.S. as a whole (thus suggesting a relative specializa-
tion in that county).14
Figure 5 shows that substantial multi-county concentrations of VTI employment in the region are
very few (as represented by the significant G values for counties and ZIP codes). They are found in the
Binghamton, Knoxville, Huntsville, and greater Atlanta metro areas. There are no concentrations of
VTI employment growth within Appalachia, though there is some activity along its northwest border in
New York (near Rochester) and its northeastern border (associated with the Albany area, greater New
York City, and Washington DC).
By contrast, Figure 6 reveals roughly fifteen significant concentrations of MTI employment scat-
tered throughout the region, with the most extensive in the vicinities of Charleston, WV (and extending
north to Parkersburg), Pittsburgh, Johnson City, Birmingham/Tuscaloosa, and Greenville-Spartanburg.
Employment growth in the MTI sector over the 1990s was especially concentrated in the Birmingham/
14. Many of the counties posting significant location quotients or G values are in metro areas. For convenience,Appendix Table 3 indicates whether evidence of spatial concentration was determined in at least one countyor ZIP code in each metro area in the study region. The table should be interpreted cautiously. It does notindicate a concentration for an entire metro area but rather for one or more counties/ZIP codes within givenmetro areas.

14The Geographic Clustering of High-Tech Industry, Science & Innovation in Appalachia
Tuscaloosa area, as well in the Carolinas (Asheville, NC and Greenville, SC). Border concentrations of
MTI activity are found in New York (Buffalo, Rochester, Albany, Newburgh), Akron, and central Kentucky.
While MTI concentrations are distributed throughout Appalachia, concentrations of STI employ-
ment and employment growth are oriented toward the north (in New York, Pennsylvania, and Ohio)
and the south (Tennessee, the Carolinas, Georgia and Alabama). Interestingly, there are no substantial
STI concentrations in West Virginia or eastern Kentucky (see Figure 7). Indeed, only a few counties in
those areas even post location quotients above 1.1.
2.2 High-Tech Value-Chains
Given a general sense of how Appalachia’s industrial high-tech base is oriented toward sectors that are
moderately to somewhat technology-intensive, we next utilized a different industrial classification
scheme that acknowledges functional relationships between sectors to consider the region’s specific
strengths by industry. Specifically, we re-sorted the four-digit SIC components of the STI, MTI, and VTI
Figure 5Spatial concentration: Very tech-intensive industries, 1998
significant Gi, county growth
ARC boundary
location quotient > 1.1
significant Gi, counties, zips
Map Legend
Analysis buffer

15The Geographic Clustering of High-Tech Industry, Science & Innovation in Appalachia
sectors into new groups that represent distinct value-chains, or groups of high-tech industries that are
significant trading partners.
The value-chains are based on a detailed analysis of national 1992 input-output patterns and,
therefore, represent the core technology-intensive buyer-supplier chains in the U.S. economy.15 The
details of their derivation are summarized in the Methods Appendix. Each of the eight chains, which
are listed in Table 3, is comprised of between eight and thirty diverse four-digit SIC codes (see Appen-
dix Table 4). For example, the motor vehicles value-chain includes chemicals, machinery, electronics
and transportation equipment industries. The value-chains are not mutually exclusive since some sec-
15. The technology value-chains are derived from a statistical analysis of national input-output data. Input-out-put data provide a useful characterization of trading patterns and general technological similarities among allU.S. industries, but with an emphasis on manufacturing. The value-chains are therefore groups of technologi-cally intensive industries that constitute final market producers and their first, second, and third tier suppliersectors. Their derivation is discussed in the Methods Appendix; a discussion of general issues related to theidentification of linked industries is available in Bergman and Feser 1999.
Figure 6Spatial concentration: Moderately tech-intensive industries, 1998
significant Gi, county growth
ARC boundary
location quotient > 1.1
significant Gi, counties, zips
Map Legend
Analysis buffer

16The Geographic Clustering of High-Tech Industry, Science & Innovation in Appalachia
tors are linked to multiple industries, a feature that reinforces their characterization of interdependence
in the economy.16 The high-tech value-chains are a good starting point for assessing unique industrial
specializations in Appalachia since they go beyond simple sectoral definitions to include groups of
industries that share similar competitive pressures and, in some cases, utilize similar production
technologies.
In employment terms, the largest high-tech value-chains in Appalachia are information technol-
ogy and instruments, communications software and services, chemicals and plastics, and motor ve-
16. There are 149 four-digit SIC codes classified as very, moderately, or somewhat technology-intensive in Ap-pendix Table 1. In the input-output analysis, nineteen of those sectors failed to link to any other major groupsof sectors. The largest of these in terms of employment in Appalachia and the U.S. is general hospitals.Twelve of the nineteen sectors are classified in the STI sector; only one (noncommercial research organiza-tion, SIC 8733) is classified in the VTI sector. Because it is questionable whether general hospitals can beregarded as high-tech industries, and because most of the remaining eighteen sectors were in the low-technol-ogy category, the nineteen “unlinked” industries are not included in the value-chain analysis.
Figure 7Spatial concentration: Somewhat tech-intensive industries, 1998
significant Gi, county growth
ARC boundary
location quotient > 1.1
significant Gi, counties, zips
Map Legend
Analysis buffer
17The Geographic Clustering of High-Tech Industry, Science & Innovation in Appalachia
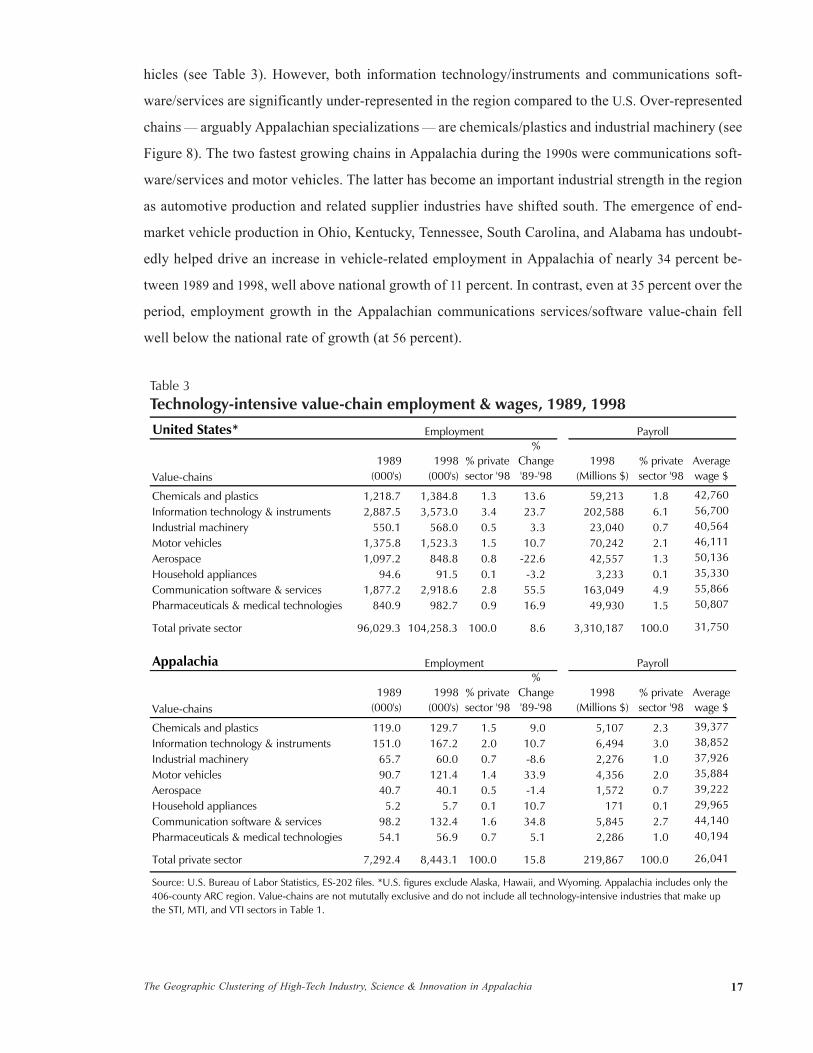
hicles (see Table 3). However, both information technology/instruments and communications soft-
ware/services are significantly under-represented in the region compared to the U.S. Over-represented
chains — arguably Appalachian specializations — are chemicals/plastics and industrial machinery (see
Figure 8). The two fastest growing chains in Appalachia during the 1990s were communications soft-
ware/services and motor vehicles. The latter has become an important industrial strength in the region
as automotive production and related supplier industries have shifted south. The emergence of end-
market vehicle production in Ohio, Kentucky, Tennessee, South Carolina, and Alabama has undoubt-
edly helped drive an increase in vehicle-related employment in Appalachia of nearly 34 percent be-
tween 1989 and 1998, well above national growth of 11 percent. In contrast, even at 35 percent over the
period, employment growth in the Appalachian communications services/software value-chain fell
well below the national rate of growth (at 56 percent).
United States*
Value-chains1989
(000's)1998
(000's)% private sector '98
% Change '89-'98
1998 (Millions $)
% private sector '98
Average wage $
Chemicals and plastics 1,218.7 1,384.8 1.3 13.6 59,213 1.8 42,760 Information technology & instruments 2,887.5 3,573.0 3.4 23.7 202,588 6.1 56,700 Industrial machinery 550.1 568.0 0.5 3.3 23,040 0.7 40,564 Motor vehicles 1,375.8 1,523.3 1.5 10.7 70,242 2.1 46,111 Aerospace 1,097.2 848.8 0.8 -22.6 42,557 1.3 50,136 Household appliances 94.6 91.5 0.1 -3.2 3,233 0.1 35,330 Communication software & services 1,877.2 2,918.6 2.8 55.5 163,049 4.9 55,866 Pharmaceuticals & medical technologies 840.9 982.7 0.9 16.9 49,930 1.5 50,807
Total private sector 96,029.3 104,258.3 100.0 8.6 3,310,187 100.0 31,750
Appalachia
Value-chains1989
(000's)1998
(000's)% private sector '98
% Change '89-'98
1998 (Millions $)
% private sector '98
Average wage $
Chemicals and plastics 119.0 129.7 1.5 9.0 5,107 2.3 39,377 Information technology & instruments 151.0 167.2 2.0 10.7 6,494 3.0 38,852 Industrial machinery 65.7 60.0 0.7 -8.6 2,276 1.0 37,926 Motor vehicles 90.7 121.4 1.4 33.9 4,356 2.0 35,884 Aerospace 40.7 40.1 0.5 -1.4 1,572 0.7 39,222 Household appliances 5.2 5.7 0.1 10.7 171 0.1 29,965 Communication software & services 98.2 132.4 1.6 34.8 5,845 2.7 44,140 Pharmaceuticals & medical technologies 54.1 56.9 0.7 5.1 2,286 1.0 40,194
Total private sector 7,292.4 8,443.1 100.0 15.8 219,867 100.0 26,041
Source: U.S. Bureau of Labor Statistics, ES-202 files. *U.S. figures exclude Alaska, Hawaii, and Wyoming. Appalachia includes only the 406-county ARC region. Value-chains are not mututally exclusive and do not include all technology-intensive industries that make up the STI, MTI, and VTI sectors in Table 1.
Employment
Employment
Payroll
Payroll
Table 3Technology-intensive value-chain employment & wages, 1989, 1998

18The Geographic Clustering of High-Tech Industry, Science & Innovation in Appalachia
As in the case of the STI, MTI, and VTI sectors, we calculated and compared the two different
measures of concentration for several different units of analysis (counties, ZIP codes) and variables
(employment, employment growth). Figures 9–16 plot the indicators using the same overlay approach.
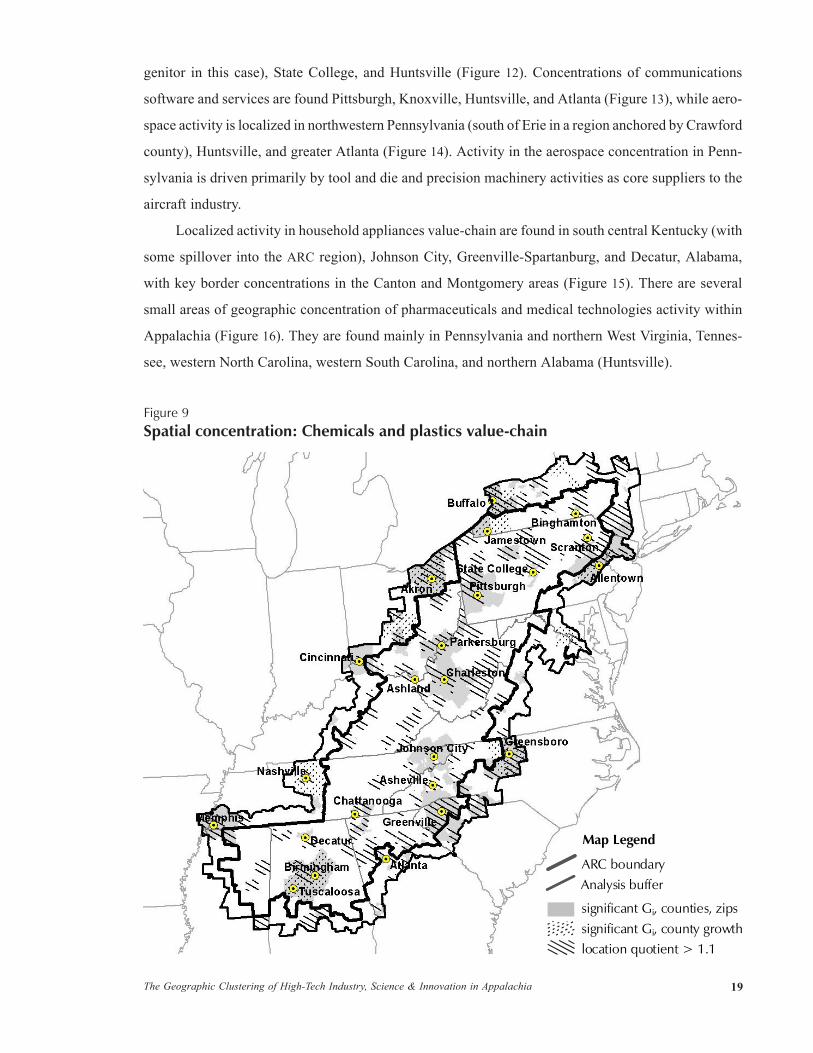
Evidence of localized clustering in the region is strongest for three value-chains: chemicals and
plastics (Figure 9), motor vehicles (Figure 10), and industrial machinery (Figure 11). Sub-regional
concentrations of chemicals and plastics employment, in particular, can be found in a large number of
locations in Appalachia, including the Pittsburgh area, central and eastern Pennsylvania, West Virginia
and Southern Ohio (near Parkersburg and Charleston), northeastern Tennessee, the Carolinas, and cen-
tral Alabama (Birmingham and Tuscaloosa). In contrast, motor vehicles employment closely tracks the
I-71, I-65, and I-85 corridors, putting most of the localized activity along the region’s borders. Particu-
larly heavy concentrations with potential spillovers to Appalachia are found in central Kentucky (home
of Ford, GM, and Toyota), central Ohio, western North Carolina (a key location for vehicle parts manu-
facturing) and the Greenville-Spartanburg area (home of BMW). Smaller concentrations are found in
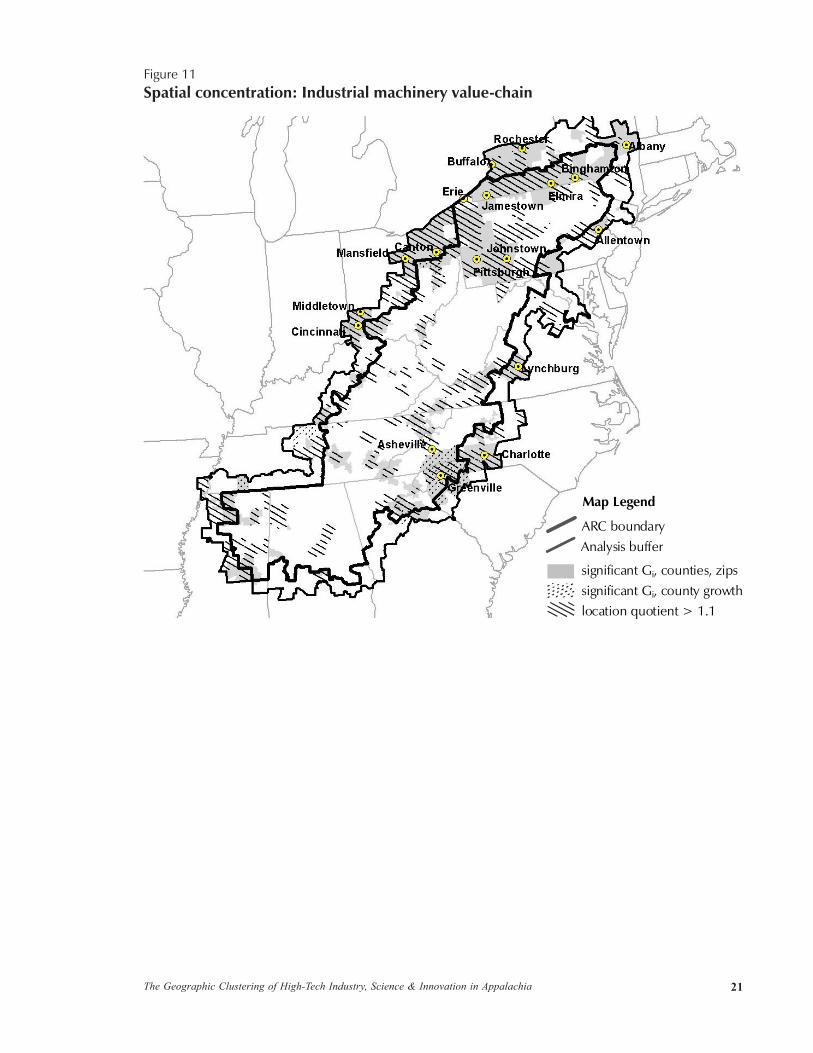
northern Pennsylvania, Tennessee, and northern Alabama. Concentrations of industrial machinery
employment are particularly heavy in Pennsylvania (Johnstown, Pittsburgh), New York, western Vir-
ginia, and an extended region that runs from Charlotte through Greenville-Spartanburg to Atlanta.
The remaining technology value-chains show only limited evidence of localization in the region.
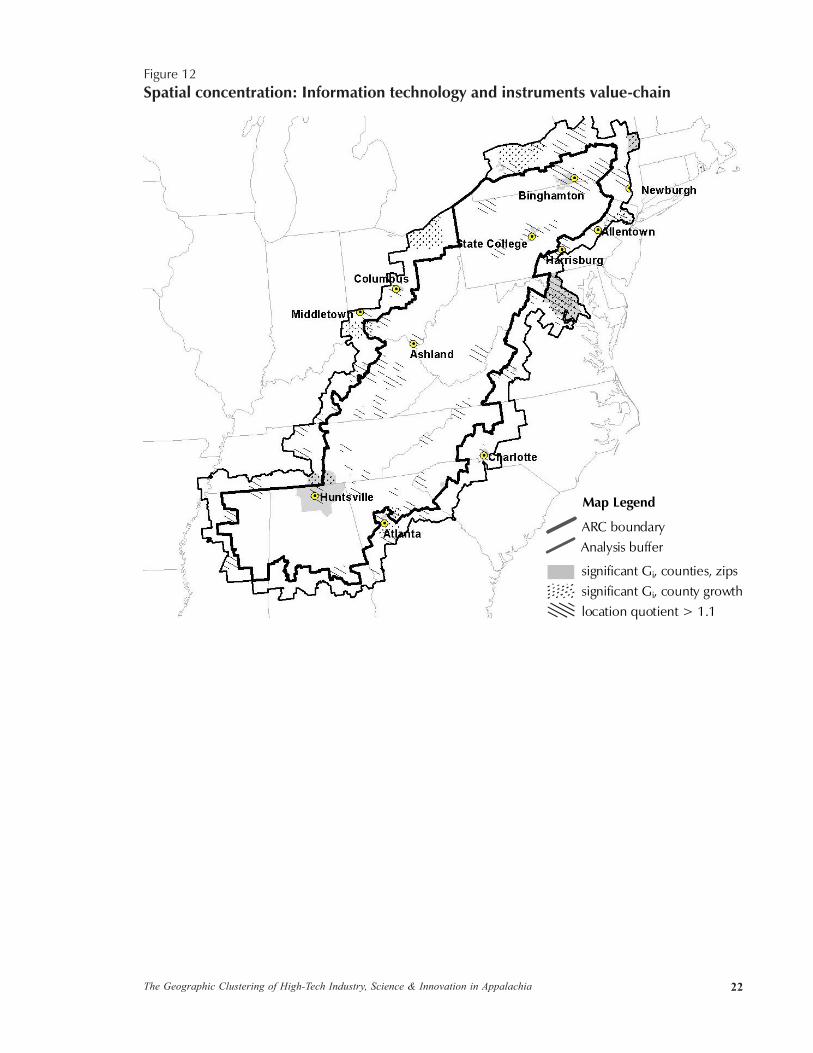
As noted above, Appalachia is relatively weak in information technology and instruments. The value-
chain (essentially production of IT-related hardware) is concentrated in Binghamton (IBM is the pro-
1.3
3.4
0.5
1.5
0.8
0.1
2.8
0.9
1.5
2.0
0.7
1.4
0.5
0.1
1.6
0.7
0.0 0.5 1.0 1.5 2.0 2.5 3.0 3.5 4.0
Pharmaceuticals/med techs
Communications services/software
Household appliances
Aerospace
Motor vehicles
Industrial machinery
IT/instruments
Chemicals and plastics
Figure 8Percent private sector employment by value-chain, 1998
Shaded bar: U.S.*White bar: Appalachia
Source: U.S. Bureau of Labor Statistics. *Excludes WY, AK, & HI.
19The Geographic Clustering of High-Tech Industry, Science & Innovation in Appalachia
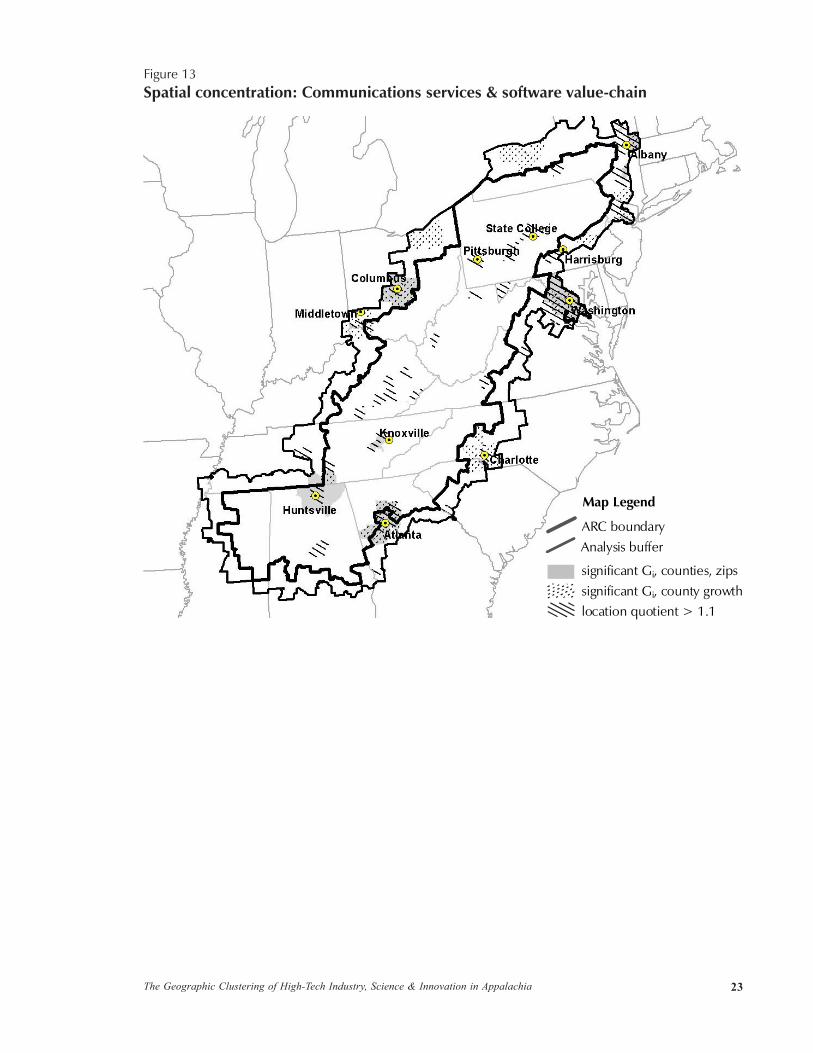
genitor in this case), State College, and Huntsville (Figure 12). Concentrations of communications
software and services are found Pittsburgh, Knoxville, Huntsville, and Atlanta (Figure 13), while aero-
space activity is localized in northwestern Pennsylvania (south of Erie in a region anchored by Crawford
county), Huntsville, and greater Atlanta (Figure 14). Activity in the aerospace concentration in Penn-
sylvania is driven primarily by tool and die and precision machinery activities as core suppliers to the
aircraft industry.
Localized activity in household appliances value-chain are found in south central Kentucky (with
some spillover into the ARC region), Johnson City, Greenville-Spartanburg, and Decatur, Alabama,
with key border concentrations in the Canton and Montgomery areas (Figure 15). There are several
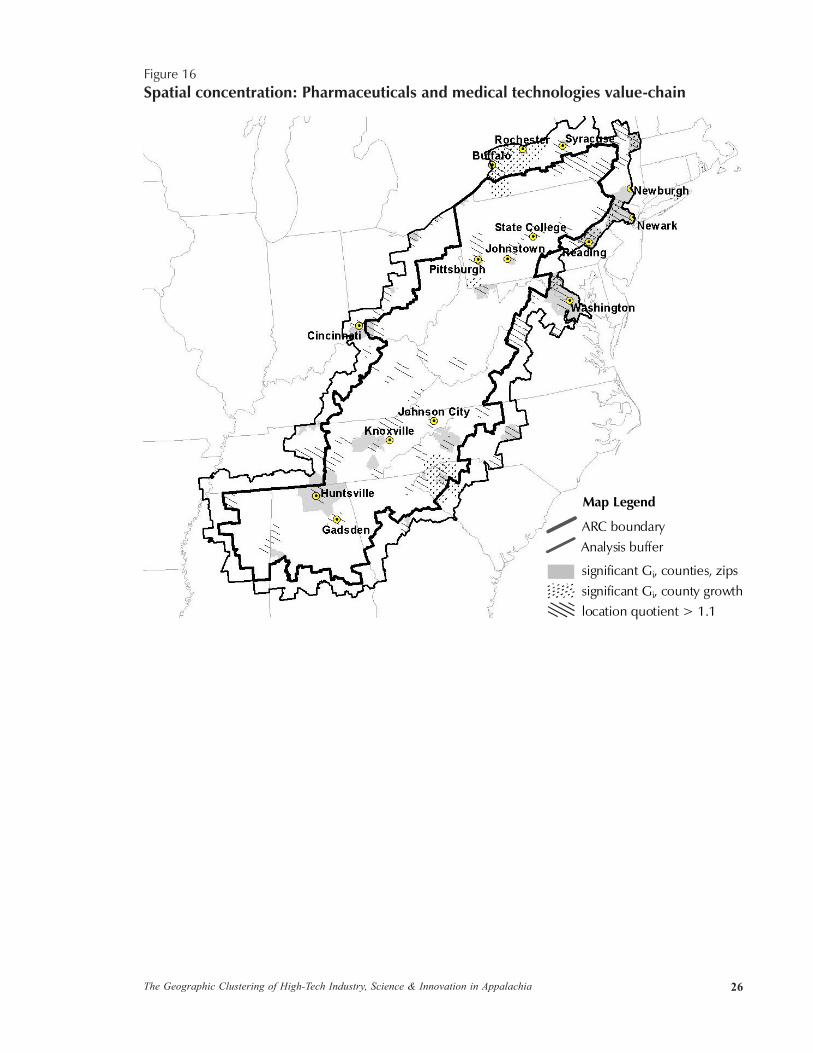
small areas of geographic concentration of pharmaceuticals and medical technologies activity within
Appalachia (Figure 16). They are found mainly in Pennsylvania and northern West Virginia, Tennes-
see, western North Carolina, western South Carolina, and northern Alabama (Huntsville).
Figure 9Spatial concentration: Chemicals and plastics value-chain
significant Gi, county growth
ARC boundary
location quotient > 1.1
significant Gi, counties, zips
Map Legend
Analysis buffer

20The Geographic Clustering of High-Tech Industry, Science & Innovation in Appalachia
Figure 10Spatial concentration: Motor vehicles value-chain
significant Gi, county growth
ARC boundary
location quotient > 1.1
significant Gi, counties, zips
Map Legend
Analysis buffer
21The Geographic Clustering of High-Tech Industry, Science & Innovation in Appalachia
Figure 11Spatial concentration: Industrial machinery value-chain
significant Gi, county growth
ARC boundary
location quotient > 1.1
significant Gi, counties, zips
Map Legend
Analysis buffer
22The Geographic Clustering of High-Tech Industry, Science & Innovation in Appalachia
Figure 12Spatial concentration: Information technology and instruments value-chain
significant Gi, county growth
ARC boundary
location quotient > 1.1
significant Gi, counties, zips
Map Legend
Analysis buffer
23The Geographic Clustering of High-Tech Industry, Science & Innovation in Appalachia
Figure 13Spatial concentration: Communications services & software value-chain
significant Gi, county growth
ARC boundary
location quotient > 1.1
significant Gi, counties, zips
Map Legend
Analysis buffer

24The Geographic Clustering of High-Tech Industry, Science & Innovation in Appalachia
Figure 14Spatial concentration: Aerospace value-chain
significant Gi, county growth
ARC boundary
location quotient > 1.1
significant Gi, counties, zips
Map Legend
Analysis buffer

25The Geographic Clustering of High-Tech Industry, Science & Innovation in Appalachia
Figure 15Spatial concentration: Household appliances value-chain
significant Gi, county growth
ARC boundary
location quotient > 1.1
significant Gi, counties, zips
Map Legend
Analysis buffer
26The Geographic Clustering of High-Tech Industry, Science & Innovation in Appalachia
Figure 16Spatial concentration: Pharmaceuticals and medical technologies value-chain
significant Gi, county growth
ARC boundary
location quotient > 1.1
significant Gi, counties, zips
Map Legend
Analysis buffer

27The Geographic Clustering of High-Tech Industry, Science & Innovation in Appalachia
17. The 1999 OES survey is described in BLS (2001). OES data are accessible directly via the Internet at http://www.bls.gov/oes.
18. We also identified a reduced set of 36 occupations that includes scientists and engineers only (no techni-cians). Location quotients for scientists/engineers and technicians separately are reported in Appendix Tables7 and 8.
Appendix Table 5 summarizes these findings by metro area. In terms of a diversity of technology-
related industry, there are clearly five leading or “first-tier” metropolitan areas in Appalachia:
Binghamton, Greenville-Spartanburg, Huntsville, Johnson City, and Pittsburgh. We found evidence of
high-tech concentrations in four or more value-chains in at least parts of each of those cities (seven and
six in the cases of Huntsville and Greenville-Spartanburg, respectively). A second tier of cities that are
also home to multiple value-chain concentrations include Asheville, Decatur, Erie, Knoxville, and
State College, PA. In Section 3, we consider the spatial distribution of patent grants in technology areas
that roughly correspond to those of the value-chains, allowing us to eventually compare a measure of
productive activity (employment) with innovation.
2.3 Scientists, Engineers, and Technicians
Occupational employment statistics provide a third means of characterizing the location of technology-
intensive activity, where the latter is broadened to include both the private and public sectors. Sub-state
occupational employment data are available from the U.S. Bureau of Labor Statistics’ Occupational
Employment Statistics (OES) series.17 The OES data are available only for metropolitan areas however,
forcing us to ignore rural areas and to use only the location quotient measure of concentration. Never-
theless, the metro-level analysis of the region’s scientific, engineering and technician workforce is a
useful supplement to our analyses of the geography of industry employment and patents.
From the 709 occupations reported in the 1999 OES data, we identified 56 specific science, engi-
neering, and engineering technician occupations. We organized the 56 occupations into thirteen sub-
stantive groups that roughly parallel, though are more detailed, than the eight value-chain industries
(see Table 4). The 56 included occupations and their match to one of thirteen aggregate categories are
reported in Appendix Table 6.18
A few of the remaining 653 occupations in the 1999 OES data bear mentioning since the reasons
for excluding them from our classification of scientists and engineers helps clarify our objectives. For
example, we did not include civil engineers/technicians and opthalmic and dental lab technicians among
the 56 science and engineering occupations. The vast majority of individuals employed as civil engi-
neers or health lab technicians are not engaged in science or innovation activities. We also did not
include teachers in the various science and engineering fields in the set of 56 S&T occupations. Because
there are such a large number of teachers in a broad array of fields (a significant share of whom are
28The Geographic Clustering of High-Tech Industry, Science & Innovation in Appalachia
engaged primarily in instruction rather than research), they tend to dominate other occupational cat-
egories. As an indicator of science and engineering activity, occupational employment loses much of
its precision when teachers are added to the mix. The role of post-secondary educational institutions in
both teaching and research is considered in Section 3.
As survey-based data, BLS occupation statistics must be used very cautiously. The data for many
metro areas, particularly smaller ones, are often incomplete due to inadequate sample sizes and data
confidentiality regulations that necessitate suppression or non-reporting. BLS also does not report data
for occupations with fewer than 50 workers. The publicly available metro-level data therefore often
constitute undercounts for smaller MSAs when they are aggregated up from detailed occupational cat-
egories. Yet because data are generally reported for occupations with a substantial number of workers
and employing companies, they can still be useful for highlighting significant industrial specializations
in various technology areas.
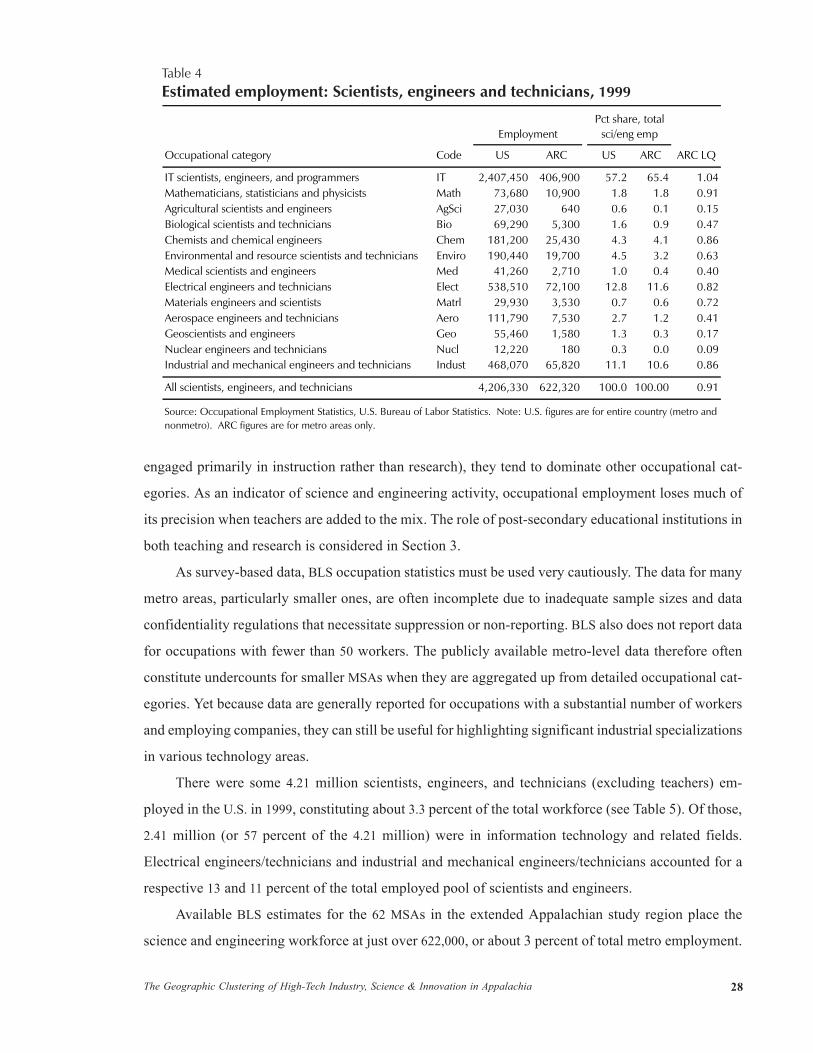
There were some 4.21 million scientists, engineers, and technicians (excluding teachers) em-
ployed in the U.S. in 1999, constituting about 3.3 percent of the total workforce (see Table 5). Of those,
2.41 million (or 57 percent of the 4.21 million) were in information technology and related fields.
Electrical engineers/technicians and industrial and mechanical engineers/technicians accounted for a
respective 13 and 11 percent of the total employed pool of scientists and engineers.
Available BLS estimates for the 62 MSAs in the extended Appalachian study region place the
science and engineering workforce at just over 622,000, or about 3 percent of total metro employment.
Table 4Estimated employment: Scientists, engineers and technicians, 1999
Occupational category Code US ARC US ARC ARC LQ
IT scientists, engineers, and programmers IT 2,407,450 406,900 57.2 65.4 1.04Mathematicians, statisticians and physicists Math 73,680 10,900 1.8 1.8 0.91Agricultural scientists and engineers AgSci 27,030 640 0.6 0.1 0.15Biological scientists and technicians Bio 69,290 5,300 1.6 0.9 0.47Chemists and chemical engineers Chem 181,200 25,430 4.3 4.1 0.86Environmental and resource scientists and technicians Enviro 190,440 19,700 4.5 3.2 0.63Medical scientists and engineers Med 41,260 2,710 1.0 0.4 0.40Electrical engineers and technicians Elect 538,510 72,100 12.8 11.6 0.82Materials engineers and scientists Matrl 29,930 3,530 0.7 0.6 0.72Aerospace engineers and technicians Aero 111,790 7,530 2.7 1.2 0.41Geoscientists and engineers Geo 55,460 1,580 1.3 0.3 0.17Nuclear engineers and technicians Nucl 12,220 180 0.3 0.0 0.09Industrial and mechanical engineers and technicians Indust 468,070 65,820 11.1 10.6 0.86
All scientists, engineers, and technicians 4,206,330 622,320 100.0 100.00 0.91
EmploymentPct share, total
sci/eng emp
Source: Occupational Employment Statistics, U.S. Bureau of Labor Statistics. Note: U.S. figures are for entire country (metro and nonmetro). ARC figures are for metro areas only.

29The Geographic Clustering of High-Tech Industry, Science & Innovation in Appalachia
Again, that figure is likely a modest undercount, given suppressed data and non-reporting in the base
data. The science and engineering workforce in the 62 metro areas within and nearby Appalachia ap-
pears to be comprised more heavily of occupations in the information technology field. IT scientists,
engineers, and programmers constitute an estimated 65 percent of all scientists, engineers, and techni-
cians in the MSAs included in the study.
Table 5 suggests that if Washington, DC is excluded from the analysis, the southern third of the
study region is slightly more “science and engineering-intensive” than the northern and central regions,
at least as measured by the share of scientists and engineers in the workforce. Indeed, it is notable that
absent Washington, the share of scientists and engineers in the metro Appalachian workforce would
fall to roughly 2.2 percent, well below the 3.3 percent national average. Table 5 also shows that the
metro science and engineering workforce in and nearby Appalachia is evenly split between scientists/
engineers and less skilled technicians (each group accounting for about 1.5 percent of the total workforce).
Nationwide, less skilled technicians account for a somewhat smaller share of employment in science
and engineering occupations.
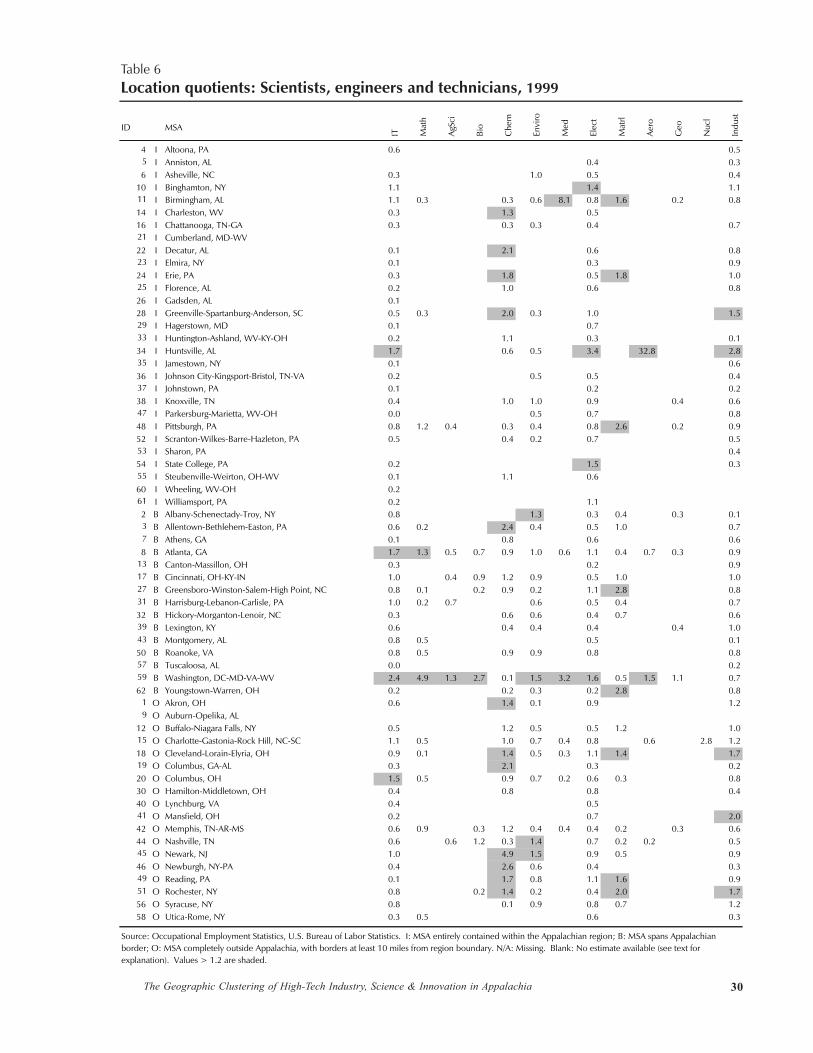
Employment location
quotients by study MSA for
the thirteen science and en-
gineering occupation catego-
ries are reported in Table 6
and displayed in Figures 17–
19.19 Relatively few MSAs
wholly within Appalachia
post location quotients sig-
nificantly above 1.0 (e.g.,
>1.25), indicating a specialization in the given technology area. Exceptions are Binghamton and State
College in electrical engineering; Birmingham in medicine and material sciences; Charleston, Decatur,
Greenville-Spartanburg, and Erie in chemicals; Pittsburgh in materials sciences and mathematics; and
Huntsville in information technology, electrical engineering, aerospace, and industrial engineering.
There are much more substantial concentrations of scientists and engineers in metro areas along
the border of the region, primarily in the areas of chemicals, materials, and industrial engineering. The
legacy of chemicals production in and around the region is especially pronounced in the north, with
19. A blank cell in Table 6 or Appendix Tables 7 or 8 indicates that OES data were not available due to fewemployees in the occupational category, confidentiality restrictions, or inadequate sample size.
Region
Scientists, engineers, & technicians
Scientists & engineers
onlyTechnicians
only
US (Metro and Nonmetro) 3.3 1.8 1.5 ARC MSAs 3.0 1.5 1.5 Northern 2.2 1.1 1.1 Central 4.4 2.3 2.1 Central (w/o Washington, DC) 2.4 1.3 1.1 Southern 2.8 1.4 1.4
Source: Occupational Employment Statistics, U.S. Bureau of Labor Statistics.
Table 5Employment shares: Scientists, engineers and techniciansPercent total employment in each region, 1999
30The Geographic Clustering of High-Tech Industry, Science & Innovation in Appalachia
ID MSA
IT Mat
h
AgSc
i
Bio
Che
m
Envi
ro
Med
Elec
t
Mat
rl
Aero
Geo
Nuc
l
Indu
st
4 I Altoona, PA 0.6 0.55 I Anniston, AL 0.4 0.36 I Asheville, NC 0.3 1.0 0.5 0.4
10 I Binghamton, NY 1.1 1.4 1.111 I Birmingham, AL 1.1 0.3 0.3 0.6 8.1 0.8 1.6 0.2 0.814 I Charleston, WV 0.3 1.3 0.516 I Chattanooga, TN-GA 0.3 0.3 0.3 0.4 0.721 I Cumberland, MD-WV 22 I Decatur, AL 0.1 2.1 0.6 0.823 I Elmira, NY 0.1 0.3 0.924 I Erie, PA 0.3 1.8 0.5 1.8 1.025 I Florence, AL 0.2 1.0 0.6 0.826 I Gadsden, AL 0.128 I Greenville-Spartanburg-Anderson, SC 0.5 0.3 2.0 0.3 1.0 1.529 I Hagerstown, MD 0.1 0.733 I Huntington-Ashland, WV-KY-OH 0.2 1.1 0.3 0.134 I Huntsville, AL 1.7 0.6 0.5 3.4 32.8 2.835 I Jamestown, NY 0.1 0.636 I Johnson City-Kingsport-Bristol, TN-VA 0.2 0.5 0.5 0.437 I Johnstown, PA 0.1 0.2 0.238 I Knoxville, TN 0.4 1.0 1.0 0.9 0.4 0.647 I Parkersburg-Marietta, WV-OH 0.0 0.5 0.7 0.848 I Pittsburgh, PA 0.8 1.2 0.4 0.3 0.4 0.8 2.6 0.2 0.952 I Scranton-Wilkes-Barre-Hazleton, PA 0.5 0.4 0.2 0.7 0.553 I Sharon, PA 0.454 I State College, PA 0.2 1.5 0.355 I Steubenville-Weirton, OH-WV 0.1 1.1 0.660 I Wheeling, WV-OH 0.261 I Williamsport, PA 0.2 1.12 B Albany-Schenectady-Troy, NY 0.8 1.3 0.3 0.4 0.3 0.13 B Allentown-Bethlehem-Easton, PA 0.6 0.2 2.4 0.4 0.5 1.0 0.77 B Athens, GA 0.1 0.8 0.6 0.68 B Atlanta, GA 1.7 1.3 0.5 0.7 0.9 1.0 0.6 1.1 0.4 0.7 0.3 0.9
13 B Canton-Massillon, OH 0.3 0.2 0.917 B Cincinnati, OH-KY-IN 1.0 0.4 0.9 1.2 0.9 0.5 1.0 1.027 B Greensboro-Winston-Salem-High Point, NC 0.8 0.1 0.2 0.9 0.2 1.1 2.8 0.831 B Harrisburg-Lebanon-Carlisle, PA 1.0 0.2 0.7 0.6 0.5 0.4 0.732 B Hickory-Morganton-Lenoir, NC 0.3 0.6 0.6 0.4 0.7 0.639 B Lexington, KY 0.6 0.4 0.4 0.4 0.4 1.043 B Montgomery, AL 0.8 0.5 0.5 0.150 B Roanoke, VA 0.8 0.5 0.9 0.9 0.8 0.857 B Tuscaloosa, AL 0.0 0.259 B Washington, DC-MD-VA-WV 2.4 4.9 1.3 2.7 0.1 1.5 3.2 1.6 0.5 1.5 1.1 0.762 B Youngstown-Warren, OH 0.2 0.2 0.3 0.2 2.8 0.8
1 O Akron, OH 0.6 1.4 0.1 0.9 1.29 O Auburn-Opelika, AL
12 O Buffalo-Niagara Falls, NY 0.5 1.2 0.5 0.5 1.2 1.015 O Charlotte-Gastonia-Rock Hill, NC-SC 1.1 0.5 1.0 0.7 0.4 0.8 0.6 2.8 1.218 O Cleveland-Lorain-Elyria, OH 0.9 0.1 1.4 0.5 0.3 1.1 1.4 1.719 O Columbus, GA-AL 0.3 2.1 0.3 0.220 O Columbus, OH 1.5 0.5 0.9 0.7 0.2 0.6 0.3 0.830 O Hamilton-Middletown, OH 0.4 0.8 0.8 0.440 O Lynchburg, VA 0.4 0.541 O Mansfield, OH 0.2 0.7 2.042 O Memphis, TN-AR-MS 0.6 0.9 0.3 1.2 0.4 0.4 0.4 0.2 0.3 0.644 O Nashville, TN 0.6 0.6 1.2 0.3 1.4 0.7 0.2 0.2 0.545 O Newark, NJ 1.0 4.9 1.5 0.9 0.5 0.946 O Newburgh, NY-PA 0.4 2.6 0.6 0.4 0.349 O Reading, PA 0.1 1.7 0.8 1.1 1.6 0.951 O Rochester, NY 0.8 0.2 1.4 0.2 0.4 2.0 1.756 O Syracuse, NY 0.8 0.1 0.9 0.8 0.7 1.258 O Utica-Rome, NY 0.3 0.5 0.6 0.3
Source: Occupational Employment Statistics, U.S. Bureau of Labor Statistics. I: MSA entirely contained within the Appalachian region; B: MSA spans Appalachian border; O: MSA completely outside Appalachia, with borders at least 10 miles from region boundary. N/A: Missing. Blank: No estimate available (see text for explanation). Values > 1.2 are shaded.
Table 6Location quotients: Scientists, engineers and technicians, 1999
31The Geographic Clustering of High-Tech Industry, Science & Innovation in Appalachia
Albany: Enviro
Binghamton: Elect
Newark: Chem, Enviro
Allentown: Chem
Reading: Chem, Matrl
State College: Elect
Rochester: Chem, Matrl, Indust
Akron: Chem
Pittsburgh: Math, Matrl
Newburgh: ChemCleveland:Chem,
Matrl, Indust
Erie: Chem, Matrl
Youngstown: Matrl
Metro area
ARC boundaryMap Legend
State boundaryAnalysis buffer
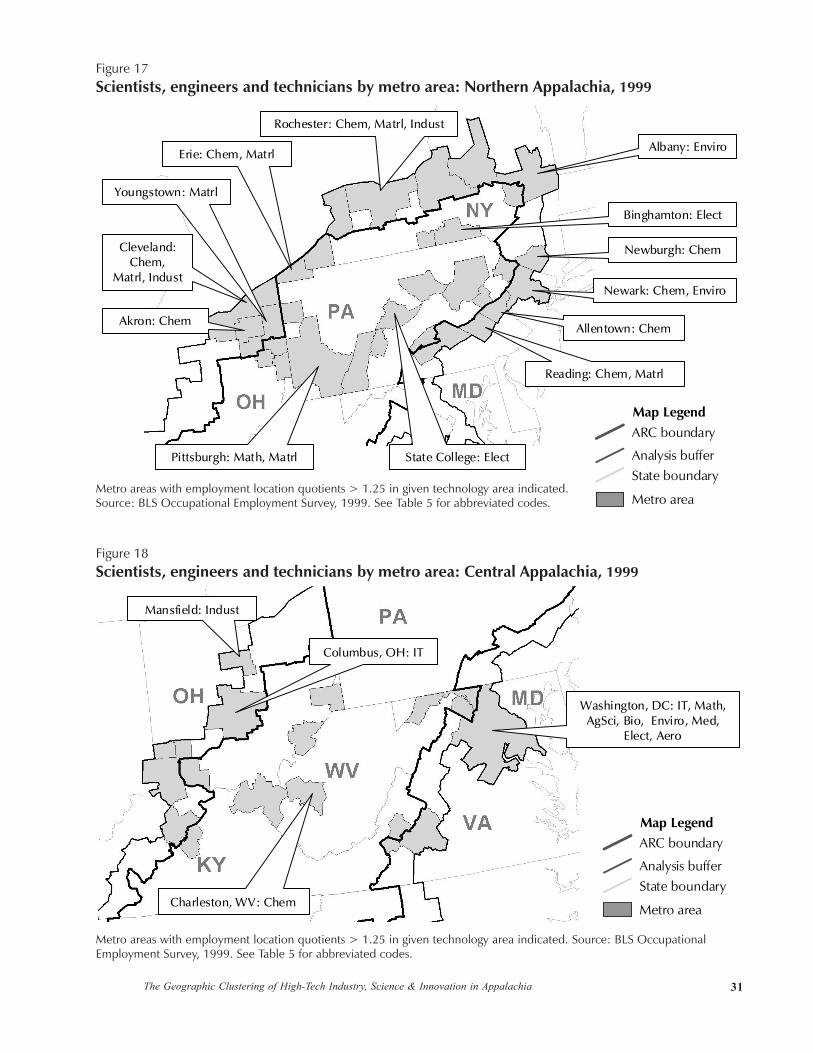
Metro areas with employment location quotients > 1.25 in given technology area indicated.Source: BLS Occupational Employment Survey, 1999. See Table 5 for abbreviated codes.
Figure 17Scientists, engineers and technicians by metro area: Northern Appalachia, 1999
Columbus, OH: IT
Charleston, WV: Chem
Washington, DC: IT, Math,AgSci, Bio, Enviro, Med,
Elect, Aero
Mansfield: Indust
Figure 18Scientists, engineers and technicians by metro area: Central Appalachia, 1999
Metro areas with employment location quotients > 1.25 in given technology area indicated. Source: BLS OccupationalEmployment Survey, 1999. See Table 5 for abbreviated codes.
Metro area
ARC boundaryMap Legend
State boundaryAnalysis buffer

32The Geographic Clustering of High-Tech Industry, Science & Innovation in Appalachia
above average shares of chemists and chemicals engineers in several MSAs in eastern Pennsylvania and
northern Ohio. By the location quotient measure, Columbus, Atlanta, and Washington are specialized
in IT-related science and engineering.
2.4 Summary
We have sought to characterize the high-tech industrial base of Appalachia using two basic indicators
(industry employment and occupational employment) and three related sectoral classification schemes
(technology-intensity, value-chain linkages, and occupational category). While the concordances are
imperfect, it is possible to map the occupational categories to the eight value-chain categories to permit
a focus on a manageable set of technology areas or sectors. Overlaying the employment and occupation
data then generates a rich picture of technology-intensive industrial specializations and strengths within
and nearby the ARC region. We present those detailed overlay maps in Section 4, along with additional
data layers representing various dimensions of Appalachia’s knowledge infrastructure (the subject of
Metro area
ARC boundaryMap Legend
State boundaryAnalysis buffer
Figure 19Scientists, engineers and technicians by metro area: Southern Appalachia, 1999
Metro areas with employment location quotients > 1.25 in given technology area indicated.Source: BLS Occupational Employment Survey, 1999. See Table 5 for abbreviated codes.
Atlanta: IT, Math
Greenville-Spartanburg: Chem, Indust
Charlotte: Nucl
Greensboro-Winston-Salem: Matrl
Birmingham: Med, Elect, Matrl
Nashville: Enviro
Columbus: Chem
Huntsville: IT, Elect,Aero, Indust
Decatur: Chem
33The Geographic Clustering of High-Tech Industry, Science & Innovation in Appalachia
20. Throughout the report, we often label concentrations of activity according to the nearest major city. However,because many concentrations encompass several cities and even adjoining rural areas, the labels themselvesshould be viewed as indicating only the general vicinity of the given cluster.
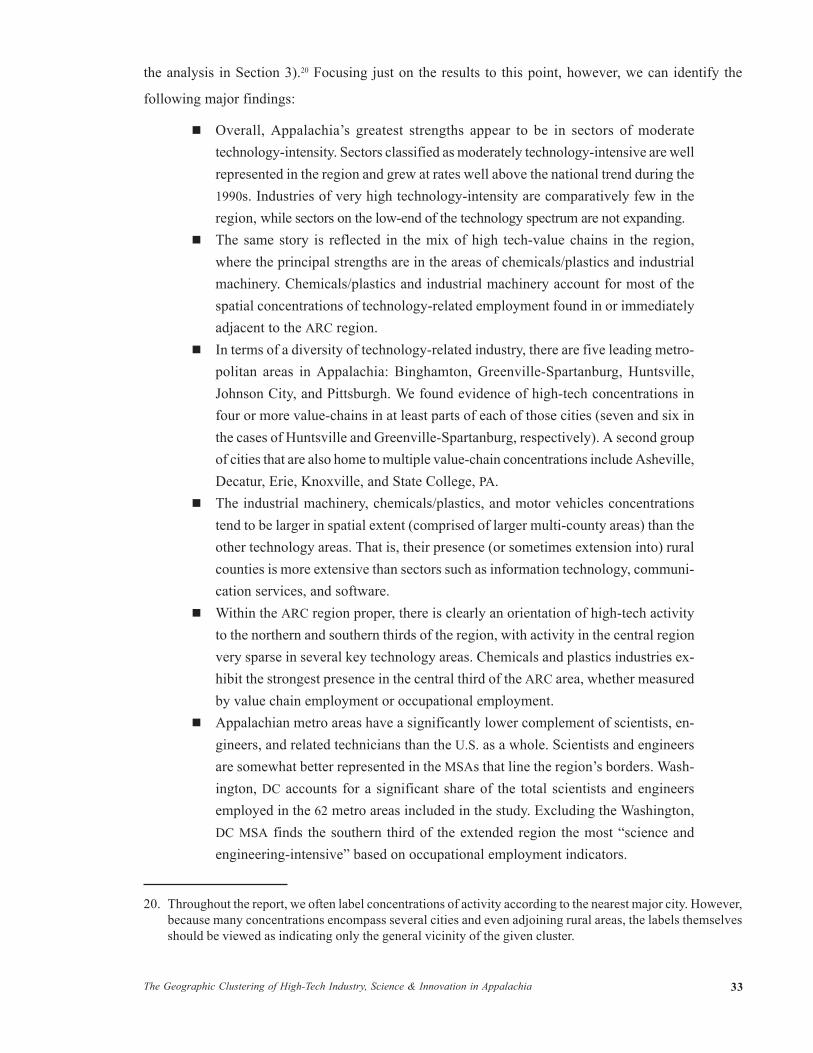
the analysis in Section 3).20 Focusing just on the results to this point, however, we can identify the
following major findings:
Overall, Appalachia’s greatest strengths appear to be in sectors of moderatetechnology-intensity. Sectors classified as moderately technology-intensive are wellrepresented in the region and grew at rates well above the national trend during the1990s. Industries of very high technology-intensity are comparatively few in theregion, while sectors on the low-end of the technology spectrum are not expanding.The same story is reflected in the mix of high tech-value chains in the region,where the principal strengths are in the areas of chemicals/plastics and industrialmachinery. Chemicals/plastics and industrial machinery account for most of thespatial concentrations of technology-related employment found in or immediatelyadjacent to the ARC region.In terms of a diversity of technology-related industry, there are five leading metro-politan areas in Appalachia: Binghamton, Greenville-Spartanburg, Huntsville,Johnson City, and Pittsburgh. We found evidence of high-tech concentrations infour or more value-chains in at least parts of each of those cities (seven and six inthe cases of Huntsville and Greenville-Spartanburg, respectively). A second groupof cities that are also home to multiple value-chain concentrations include Asheville,Decatur, Erie, Knoxville, and State College, PA.The industrial machinery, chemicals/plastics, and motor vehicles concentrationstend to be larger in spatial extent (comprised of larger multi-county areas) than theother technology areas. That is, their presence (or sometimes extension into) ruralcounties is more extensive than sectors such as information technology, communi-cation services, and software.Within the ARC region proper, there is clearly an orientation of high-tech activityto the northern and southern thirds of the region, with activity in the central regionvery sparse in several key technology areas. Chemicals and plastics industries ex-hibit the strongest presence in the central third of the ARC area, whether measuredby value chain employment or occupational employment.Appalachian metro areas have a significantly lower complement of scientists, en-gineers, and related technicians than the U.S. as a whole. Scientists and engineersare somewhat better represented in the MSAs that line the region’s borders. Wash-ington, DC accounts for a significant share of the total scientists and engineersemployed in the 62 metro areas included in the study. Excluding the Washington,DC MSA finds the southern third of the extended region the most “science andengineering-intensive” based on occupational employment indicators.