Embed Size (px)
Citation preview

Industry summary 2016
Australian goat

MLA’s Market information & Industry insights – Australian goat industry summary 2016
Contents
While endeavouring to ensure that the information contained in this publication iscorrect, MLA makes no representation as to, and accepts no liability for, the accuracyof such information including, but not limited to, the forecasts.
Published by Meat & Livestock Australia Ltd April 2016© Meat & Livestock Australia Ltd, 2016
Author: Jack O’ConnorFor more information call MLA on 02 9463 9333
ii
Introduction ........................................................................................................... 1
2015 – the key numbers ..................................................................................... 2
Australian goat situation and overview ............................................................ 3
Australian goat industry
Goat flock .......................................................................................................................... 4
Slaughter ............................................................................................................................ 4
Over-the-hook indicators ................................................................................................ 4
Goat production ............................................................................................................... 5
Average carcase weights ................................................................................................ 5
Demand summary .............................................................................................. 6
Australian goatmeat exports .............................................................................. 7
North America ...................................................................................................... 8
Asia ......................................................................................................................... 9
Caribbean ............................................................................................................ 10
Live exports – summary ..................................................................................... 11
Appendix 1 – Goatmeat exports by destination ............................................ 12
Sources, acknowledgements and acronyms ............................................... 13
List of Figures
Table 1 Situation and overview for the Australian goat industry ........................... 3Table 2 Australian exports of goatmeat .................................................................... 7Table 3 Australian live goat exports .......................................................................... 11Table 4 Australian goatmeat exports to destinations by the main cuts ............ 12
List of Tables
Figure 1 Australian rainfall 1 January 2015 – 31 December 2015 .............................. 4Figure 2 Eastern states weekly goat slaughter .......................................................... 4Figure 3 Australian goat slaughter ................................................................................. 4Figure 4 Export OTH goat indicators ............................................................................ 4Figure 5 OTH Indicator comparison .............................................................................. 4Figure 6 2015 Australian goatmeat production by state ........................................... 5Figure 7 Australian goatmeat production .................................................................... 5Figure 8 Australian average carcase weights ............................................................. 5Figure 9 Australian goatmeat exports and values ...................................................... 6Figure 10 Australian goatmeat exports to North America ........................................ 8Figure 11 A$ against US$ ................................................................................................. 8Figure 12 Export value to North America ..................................................................... 8Figure 13 Australian goatmeat exports to Japan, Korea and Malaysia .................. 9Figure 14 Australian goatmeat exports to China, Hong Kong and Vietnam .......... 9Figure 15 Australian goatmeat exports to Taiwan ...................................................... 9Figure 16 Australian goatmeat exports to Trinidad and Tobago ............................ 10Figure 17 Australian goatmeat exports to Jamaica .................................................. 10Figure 18 Australian goatmeat exports to the Caribbean ....................................... 10Figure 19 Australian live goat exports and value ........................................................ 11Figure 20 Australian live goat exports ......................................................................... 11Figure 21 2015 Australian live goat exports by state of loading .............................. 11
Australian goat industry summary 2016
All use of MLA publications, reports andinformation is subject to MLA’s Market Reportand Information Terms of Use. Please read ourterms of use carefully and ensure you arefamiliar with its content.
CLICK HERE FOR MLA publications TERMS OF USE

1MLA’s Market information & Industry insights – Australian goat industry summary 2016
Introduction
Meat & Livestock Australia’sMarket InformationMLA produces a wide range of market information publications, whichcan be accessed for the latest news, analysis and statistics for theAustralian red meat and livestock industry. From fortnightly over-the-hook goat price reports through to annual statistical compilations, theprovision of timely, accurate and continuous market information is akey service provided to MLA members and stakeholders.
All of MLA’s market information publications, including the AustralianGoat Industry Summary 2016, are available at www.mla.com.au, orthrough a direct email service. If you would like to contact MLA’sMarket Information Service, please email [email protected],or call (02) 9463 9333.
Goatmeat is one of the most widely consumed meats in the world, with a great deal of
production consumed in the country of which it is produced. Goatmeat is a part of
cultural and religious observations of many ethnic groups. North Africa, Asia and the
Middle East are some of the largest consumers of goatmeat, and are the major trading
partners to the Australian goat industry.
Total world goatmeat production was just over 5.3 million tonnes cwt in 2012 (FAO) – up
1% year-on-year. In 2013, China was the largest producer of goatmeat, accounting for just
over 2.0 million tonnes cwt, followed by India (509,000 tonnes cwt) and Pakistan (297,000
tonnes cwt).
Domestically, goat prices have increased incrementally over the past decade, assisted by
strengthening international demand. Australia is the largest goatmeat exporting nation,
with around 95% of Australian goatmeat sent offshore and accounting for around 50% of
the global goatmeat trade.
Extensive production systems are continuing to grow in the Australian goat industry, with a
large portion comprising of semi-arid rangeland enterprises across the eastern states.
Through effective management practises and better established export market
opportunities, the popularity of goat production has increased substantially in past years.

2MLA’s Market information & Industry insights – Australian goat industry summary 2016
Figure 1 Australian rainfall1 January 2015 - 31 December 2015
Source: Australian Bureau of Meteorology
Legend
Highest on record
Lowest on recordVery much below averageBelow averageAverageAbove averageVery much above average
2015 – the key numbers
In 2015, Australian goat slaughter surpassed the previous year'srecord by 1%, reaching 2.14 million head.
Goat production totalled 32,746 tonnes cwt, down 1% year-on-year1.
Live goat exports were 2% higher than the previous year, at90,190 head.
Malaysia remained the largest live export destination forAustralian goats in 2015, at 84,380 head (up 2% year-on-year).
Goatmeat shipments decreased 16% year-on-year, to 29,965tonnes swt.
The majority of Australian goatmeat in 2015 was shipped to theUS, at 17,626 tonnes swt – down 8% year-on-year.
Australian goatmeat exports were valued at $243.2 million – up1% year-on-year.
1 Reported by the ABS. There may be some discrepancies between ABS figures and true commercialoperations.
GOAT
Goat Shoulder
Goat Leg
Goat Neck
Goat Forequarter
Goat Tenderloin
Goat Eye of Shoulder
Goat Shank
Goat Rack
3
5
6
7
10
8
9
www.trueaussiegoat.com
Fillet/tenderloin
Boned and rolled loin roast
Loin chop Eye of Shortloin/Backstrap
Foreshank
Neck chop
AUSTRALIAN GOAT CUTS
Goat Chump2
Goat Shortloin4
Goat Breast and Flap11
9
1
2
3
115
6
10 9
4
7
8
HAM 5172
HAM 4801
HAM 5020
HAM 4932
HAM 5080
HAM Fore 5030/Hind 5031
HAM 4972
HAM 4790
HAM 4880
HAM 4995
HAM 5151
Riblets
Easy carve leg roast Leg knuckle mini roast
Goat rump
Frenched cutlet Frenched rack of lamb (8 rib)
Forequarter chop Forequarter rack(4 rib)
Forequarter boned and rolled
Boned and rolledshoulder
Easy carveshoulder roast
Neck filllet roast
Hindshank
1
Barbecue
Hotpot/Casserole
Oven Roast
Stir-fry
Pan-fry
LEGEND
Chump chop
NOTE: Goatmeat primal cut HAM codes are the same as Sheepmeat. When ordering, ensure you specify if it is goatmeat or sheepmeat.
The majorityof Australiangoatmeat in2015 wasshipped tothe US

3MLA’s Market information & Industry insights – Australian goat industry summary 2016
2005 2006 2007 2008 2009 2010 2011 2012 2013 2014 2015 %change
total 1,204 1,201 1,035 1,124 1,637 1,676 1,739 1,857 2,073 2,129 2,140 0.5%
total 15.3 15.5 15.5 15.6 15.7 15.8 16.3 16.1 15.3 15.5 15.3 -1.0%
total 18.4 18.6 16.1 17.5 25.8 26.5 28.4 29.8 31.7 32.9 32.7 -0.6%
total 18.2 19.5 16.7 18.2 24.8 25.9 25.9 29.1 32.7 35.8 30.0 -16.3%
total 41.7 57.6 89.9 79.8 97.6 77.4 63.3 61.9 75.1 88.5 90.2 1.9%
total 5,086 7,126 11,367 9,190 11,491 10,346 8,408 8,114 8,373 8,646 10,319 19.3%
Source: ABS, DAWR
Slaughterings ('000 head)
Avg carcase weight (kg)
Production ('000 tonnes carcase weight)
Goat exports ('000 tonnes shipped weight)
Live goat exports ('000 head)
Live goat exports ('000 A$)
“Australian goatmeat exports were
valued at $243.6 million – 1%
greater than 2014 levels”
Australian goat situation and overviewTable 1 Situation and overview for the Australian goatmeat industry

4MLA’s Market information services – Australian goat industry summary 2016
Figure 5 OTH Indicator comparison
Source: MLA06 07 08 09 10 11 12 13 14 15
100
200
300
400
500
600A¢/kg cwt
Goat 12 - 16kg Lamb 18 - 22kg Mutton 18 - 24kg
Figure 4 Export OTH goat indicators
Source: MLA06 07 08 09 10 11 12 13 14 15
100
200
300
400
500
600
700
800
900A¢/kg cwt
OTH (12.1 - 16 kg) Unit export value
Source: ABS
97 98 99 00 01 02 03 04 05 06 07 08 09 10 11 12 13 14 150
500
1000
1500
2000
2500'000 head
Figure 3 Australian goat slaughter
Australian goat industry
Figure 2 Eastern states weekly goat slaughter
Source: MLAJan Feb Mar Apr May Jun Jul Aug Sep Oct Nov Dec
0
10
20
30
40
50
60Average head/week ('000)
2013 2014 2015
2 Official ABS data. There may be some discrepancies between ABS figures and true commercial operations, despite descrepancies the underlying trends are considered to be reliable.
Goat flock According to the latest Australian Bureau of Statistics
(ABS) survey (2011-12), the Australian managed goat
flock was 516,142 head, with most of the flock (46%)
in NSW, Queensland (39%), and Victoria (10%).
In addition to the managed goat flock is the rangeland
population, which in 2011 was estimated to be in the
range of 4-6 million head. However, the accuracy of
the estimate is questionable, given the vast spread of
the population, and dependence upon seasonal
conditions.
Slaughter For 2015, Australian goat slaughter reached 2.14
million head, up 1% on the 2014 total, and 8% on the
five-year average (ABS)2. Reflecting the expansion of
industry, as producers move from opportunistic
harvesting to more managed enterprises, goat
slaughter has nearly doubled in the past decade.
Queensland slaughter for 2015 was 7% lower than the
year before, at 710,844 head. Reflecting the 'below
average' rainfall recorded over the year for most south
eastern regions, processing in SA decreased 15% on
year-ago levels, at 303,295 head, while NSW was fairly
similar year-on-year, totalling 110,606 head. WA saw a
considerable increase in goat slaughter in 2015, up
81%, to 30,983 head.
Over-the-hook indicators Underpinned by strong international demand, over-
the-hook (OTH) indicators reached new highs in 2015,
with most weight categories averaging 435¢/kg cwt
(10.1-12kg cwt to 20.1kg+ cwt) – up 45% year-on-
year.
The OTH indicators in 2015 also averaged 48%
above the five-year average, with solid global
demand able to absorb the high kill levels seen during
the winter months. Prices were further assisted by the
depreciation of the A$ in the latter half of 2015.

5MLA’s Market information services – Australian goat industry summary 2016
Australian goat industry continued...
Figure 6 2015 Australian goatmeat production by state
Source: ABS
NSW4.5%
Victoria43.7%
SA13.7%
QLD36.7%
WA1.4%
Source: ABS
97 98 99 00 01 02 03 04 05 06 07 08 09 10 11 12 13 14 150
5
10
15
20
25
30
35'000 tonnes cwt
Figure 7 Australian goatmeat production
3 Official ABS data. There may be some discrepancies between ABS
figures and true commercial operations, despite descrepancies theunderlying trends are considered to be reliable.
Goat production In 2015, goat production reached 32,746 tonnes cwt –
slightly lower (1%) than the record volumes in 2014,
although still 5% above the five-year average (ABS)3.
Production in Queensland was 12,001 tonnes cwt in
2015, down 5% year-on-year, however still slightly up on
the five-year average. In Victoria, production totalled
14,312 tonnes cwt, 10% higher year-on-year and 18%
above the five-year average. In NSW, production eased
12% year-on-year, to 1,485 tonnes cwt, although was still
5% above the five-year average. Production in SA was
back 15% from 2014 levels, at 4,477 tonnes cwt, while in
WA, production nearly doubled off the back of low
volumes in 2014, at 466 tonnes cwt.
According to the Goat Industry Council of Australia
(GICA), 90% of goatmeat production is from rangeland
enterprises. Boer goats are typically heavier than
rangeland goats and have a higher yield potential.
Therefore increases in productivity in the national flock
will be influenced by the rate of Boer goat genetic
infusion into the flock. Kalahari Red (South African
descent) is another breed in Australian goatmeat
production, well known for its adaptability to the harsher
climates seen across producing regions.
Average carcase weights For 2015, Australian goat carcase weights averaged
15.3kg/head, representing a slight decline (0.2kg/head)
on the year prior. ‘Below-average’ rainfall across most
major producing regions contributed to the 2% decline
on the five-year average (15.68kg/head) year-on-year.
For the past decade, carcase weights have averaged
above 15.6kg/head. In 2011 however, when seasonal
conditions were particularly favourable, average
carcase weights peaked at 16.31kg/head.
Source: ABS
97 98 99 00 01 02 03 04 05 06 07 08 09 10 11 12 13 14 1512
14
16
18
20
22
24
kg/head
Goat Lamb
Figure 8 Australian average carcase weights

6MLA’s Market information services – Australian goat industry summary 2016
Demand summary
During 2015, Australian goatmeat exports totalled
29,965 tonnes swt, down 16% on the record volume
the year prior.
The total value of goatmeat exports in 2015 reached
$243.2 million – 1% higher year-on-year.
Australia is the largest goatmeat exporter in the world,
with an estimated 95% of production exported.
Source: DAWR, ABS/GTA
97 98 99 00 01 02 03 04 05 06 07 08 09 10 11 12 13 14 150
10
20
30
40'000 tonnes swt
0
50
100
150
200
250
300A$ millions
Export volume (LHS) Export value (RHS)
Figure 9 Australian goatmeat exports and values Over the past decade, the volume of Australian
goatmeat exports have more than doubled.
The depreciating A$ assisted trade in 2015, averaging
75US¢ for the year – back 17% on 2014 levels.
Over the pastdecade, the volumeof goatmeatexported has morethan doubled

7MLA’s Market information services – Australian goat industry summary 2016
2005 2006 2007 2008 2009 2010 2011 2012 2013 2014 2015 % change
To:
US (volume) 9.35 11.33 9.96 10.55 12.80 14.47 15.16 16.08 15.48 19.09 17.63 -7.7%
US (value) 39,373 52,044 39,196 37,525 46,198 65,730 72,534 66,888 64,261 126,548 159,025 25.7%
Taiwan (volume) 5.90 5.16 3.31 3.90 4.00 4.00 3.91 3.97 3.86 5.07 3.72 -26.7%
Taiwan (value) 20,990 20,203 10,669 12,545 11,798 13,585 15,170 14,308 16,138 25,116 19,252 -23.3%
Canada (volume) 0.89 1.05 1.13 1.09 1.20 1.89 1.57 2.04 1.90 2.22 1.72 -22.4%
Canada (value) 4,121 5,408 4,310 3,582 4,992 8,430 8,017 8,332 8,635 12,689 10,976 -13.5%
Hong Kong (volume) 0.00 0.00 0.00 0.00 0.00 0.01 0.02 0.03 0.11 1.43 0.73 -48.6%
Hong Kong (value) 0 37 0 0 204 237 1,591 534 619 10,288 5,682 -44.8%
South Korea (volume) 0.12 0.15 0.21 0.24 0.59 0.86 0.90 0.80 0.93 1.52 1.68 10.0%
South Korea (value) 535 822 970 990 1,923 4,139 4,433 3,842 4,734 9,062 11,675 28.8%
China (volume) 0.00 0.00 0.01 0.01 0.00 0.00 0.04 0.37 4.74 1.11 0.88 -20.9%
China (value) 0 63 0 31 108 0 1,072 2,118 23,793 6,397 6,598 3.1%
Trinidad and Tobago (volume) 1.07 1.11 1.26 1.33 2.02 1.78 1.94 1.89 1.94 1.78 1.72 -3.5%
Trinidad and Tobago (value) 2,887 3,505 3,569 3,437 9,234 6,618 8,634 6,786 7,520 8,679 9,549 10.0%
Malaysia (volume) 0.09 0.07 0.07 0.25 0.14 0.40 0.51 1.54 1.02 0.69 0.18 -74.2%
Malaysia (value) 481 295 319 982 623 1,858 2,276 5,924 3,991 3,030 944 -68.8%
Japan (volume) 0.18 0.16 0.18 0.16 0.15 0.20 0.22 0.25 0.29 0.33 0.40 20.0%
Japan (value) 661 717 674 667 583 1,019 1,053 1,089 1,238 1,744 2,270 30.2%
Jamaica (volume) 0.05 0.05 0.06 0.09 1.38 0.99 0.73 0.85 0.42 0.39 0.10 -73.9%
Jamaica (value) 1,336 2,452 302 151 4,038 3,808 2,793 2,356 1,200 1,388 582 -58.1%
Total (volume) 18.18 19.52 16.66 18.17 24.75 25.91 25.89 29.09 32.67 35.78 29.96 -16.3%
Total (value) 74,212 90,386 61,620 62,102 86,249 113,051 127,587 132,886 160,559 241,761 243,584 0.8%
Source: DAWR Volume = '000 tonnes swt Value = '000 A$ FOB
Table 2 Australian exports of goatmeat
Australian goatmeat exports

8MLA’s Market information services – Australian goat industry summary 2016
Source: RBA
Figure 11 A$ against US$
2000 2001 2002 2003 2004 2005 2006 2007 2008 2009 2010 2011 2012 2013 2014 20150.45
0.55
0.65
0.75
0.85
0.95
1.05
1.15A$/US$
A$/US$
North America
Source: DAWR
97 98 99 00 01 02 03 04 05 06 07 08 09 10 11 12 13 14 150
5
10
15
20
25'000 tonnes swt
US Canada
Figure 10 Australian goatmeat exports to North America
Source: ABS/GTA
97 98 99 00 01 02 03 04 05 06 07 08 09 10 11 12 13 14 150
50
100
150
200A$ millions
Figure 12 Export value to North America
Australian goatmeat exports to the US made up more
than half (53%) of Australia's total goatmeat exports in
2015, at 17,630 tonnes swt – down 8% year-on-year,
although 5% higher than the five-year average.
The value of Australian goatmeat exports to the US
continued to grow in 2015, surging 26% year-on-year
to $159 million FOB.
Although down 12% year-on-year, whole carcases
continue to make up the majority (72%) of Australian
goatmeat exports to the US in 2015. Whole carcases
totalled 12,751 tonnes swt, while shipments of
assorted cuts increased 9%, to 4,011 tonnes swt.
In 2015, goatmeat shipments to Canada decreased
22% on the previous year, to 1,720 tonnes swt. Similar
to the US, almost all Australian goatmeat shipped to
Canada in 2015 was in the form of whole carcase
(1,124 tonnes swt), while shipments of assorted cuts
doubled 2014 levels, to 589 tonnes swt.
Australian goatmeat shipments to Canada returned
$11 million in 2015 – down 14% year-on-year.
Supported by an increase in the Hispanic population,
the US is expected to remain a major importer of
Australian goatmeat. This is also supported by
improving financial conditions in the market, despite
growth forecast to stabilise in 2016 (IMF). Volumes in
2016 will be determined by a number of factors,
however if the US$ strengthens further it will benefit
exporters.

9MLA’s Market information services – Australian goat industry summary 2016
Source: DAWR
Figure 15 Australian goatmeat exports to Taiwan
97 98 99 00 01 02 03 04 05 06 07 08 09 10 11 12 13 14 150
1
2
3
4
5
6
7'000 tonnes swt
Source: DAWR
Figure 14 Australian goatmeat exports to China, Hong Kong and Vietnam
08 09 10 11 12 13 14 150
1
2
3
4
5
6'000 tonnes swt
Hong Kong China Vietnam
Asia
Source: DAWR
Figure 13 Australian goatmeat exports to Japan, Korea and Malaysia
97 98 99 00 01 02 03 04 05 06 07 08 09 10 11 12 13 14 150
0.5
1
1.5
2
2.5
3'000 tonnes swt
Malaysia South Korea Japan
In 2015, Australian goatmeat exports to Asia declined
28% year-on-year, to 8,387 tonnes swt.
Exports to China continued to decline (down 21%) in
2015, at 888 tonnes swt, in the wake of record highs in
2013. Volumes to Malaysia registered a 74% decline in
2015, to 180 tonnes swt.
Shipments to Hong Kong eased 49% to 730 tonnes
swt, while volumes to Taiwan were down 27%, to 3,720
tonnes swt. Encouragingly, exports to Korea lifted 10%
on year-ago levels, to 1,680 tonnes swt.
The value of Australian goatmeat exports to China
increased 3% year-on-year in 2015, to $6.6 million.
Goatmeat export values to Taiwan eased 23% on the
previous year, to $19.3 million, while the value of
shipments to Hong Kong followed a similar trend, back
45% to $5.7 million. In 2015, volumes to Korea
generated over $11.6 million – up 29% on the
corresponding period the year prior.
The International Monetary Fund (IMF) has forecast
slowing GDP growth in China to 6.3%. The broader
ASEAN region is expected to follow suit – at 4.8% in
2015-16, assisted by stronger growth in advanced
economies.
As expected, overall growth in China is evolving
broadly, however the forecast slowdown in imports
and exports is occurring at a faster pace than
anticipated, resulting in uncertainty into how smaller
economies will be affected.

10MLA’s Market information services – Australian goat industry summary 2016
Source: DAWR, ABS/GTA
Figure 18 Australian goatmeat exports to the Caribbean
97 98 99 00 01 02 03 04 05 06 07 08 09 10 11 12 13 14 150
3
5
8
10
13
15
18
20A$ millions
0
500
1000
1500
2000
2500
3000
3500
4000tonnes swt
Export value (LHS) Export volume (RHS)
Caribbean
Source: DAWR
Figure 17 Australian goatmeat exports to Jamaica
97 98 99 00 01 02 03 04 05 06 07 08 09 10 11 12 13 14 150
200
400
600
800
1,000
1,200
1,400
1,600tonnes swt
Source: DAWR
Figure 16 Australian goatmeat exports to Trinidad and Tobago
97 98 99 00 01 02 03 04 05 06 07 08 09 10 11 12 13 14 150
500
1,000
1,500
2,000
2,500tonnes swt
Australian goatmeat exports to the Caribbean in 2015
declined for the third consecutive year, to 1,820 tonnes
swt, with the expansion of other export destinations.
Trinidad and Tobago was the largest market in the
region, despite declining 4% year-on-year, to 1,720
tonnes swt in 2015 – a market worth $9.5 million.
Jamaica was the second biggest market in the region
in 2015, although decreasing 74% year-on-year, to 100
tonnes swt.
The IMF forecasts aggregate GDP across the
Caribbean to ease (0.3%) in 2016, despite positive
growth seen in some countries in the wider region.
The US is expected to continue to take a large portion
of Australian shipments – maintaining pressure on
smaller importing regions such as the Caribbean.
11MLA’s Market information services – Australian goat industry summary 2016
2005 2006 2007 2008 2009 2010 2011 2012 2013 2014 2015 % change
To:
Malaysia (volume) 26.42 42.84 69.52 67.71 89.14 64.08 54.33 59.11 55.40 82.73 84.38 2%
Malaysia (value) 2,109 5,343 7,790 7,746 10,516 8,441 7,008 7,614 6,111 7,515 8,628 15%
Singapore (volume) 10.90 11.10 3.12 3.39 6.89 8.83 8.00 1.90 16.78 4.23 0.35 -
Singapore (value) 741 914 300 307 690 642 957 144 1,540 361 104 -71%
Brunei (volume) 1.41 1.34 1.86 5.35 1.16 1.69 0.61 0.64 1.78 0.12 1.43 -
Brunei (value) 685 119 314 628 147 258 115 62 299 45 488 -
UAE (volume) - - 0.10 - 0.07 - - - 1.00 1.05 3.30 214%
UAE (value) - - 20 - 38 - - - 285 379 869 129%
Other 3.01 2.33 15.45 3.32 0.43 2.81 0.32 0.24 1.15 0.00 4.03 -
Total (volume) 41.73 57.61 89.93 79.76 97.62 77.41 63.26 61.88 75.11 88.53 90.19 2%
Total (value) 5,086 7,126 11,367 9,190 11,491 10,346 8,408 8,114 8,373 8,646 10,320 19%
Source: ABS volume = '000 head value = '000 A$ FOB
Figure 21 2015 Australian live goat exports by state of loadingNSW
33.8%
SA49.8%
Other2.9%
VIC13.5%
Source: ABS
Source: ABS
97 98 99 00 01 02 03 04 05 06 07 08 09 10 11 12 13 14 150
20
40
60
80
100
120
140
160'000 head
0
2
4
6
8
10
12
14A$ millions
Head (LHS) Value (RHS)
Figure 19 Australian live goat exports and value
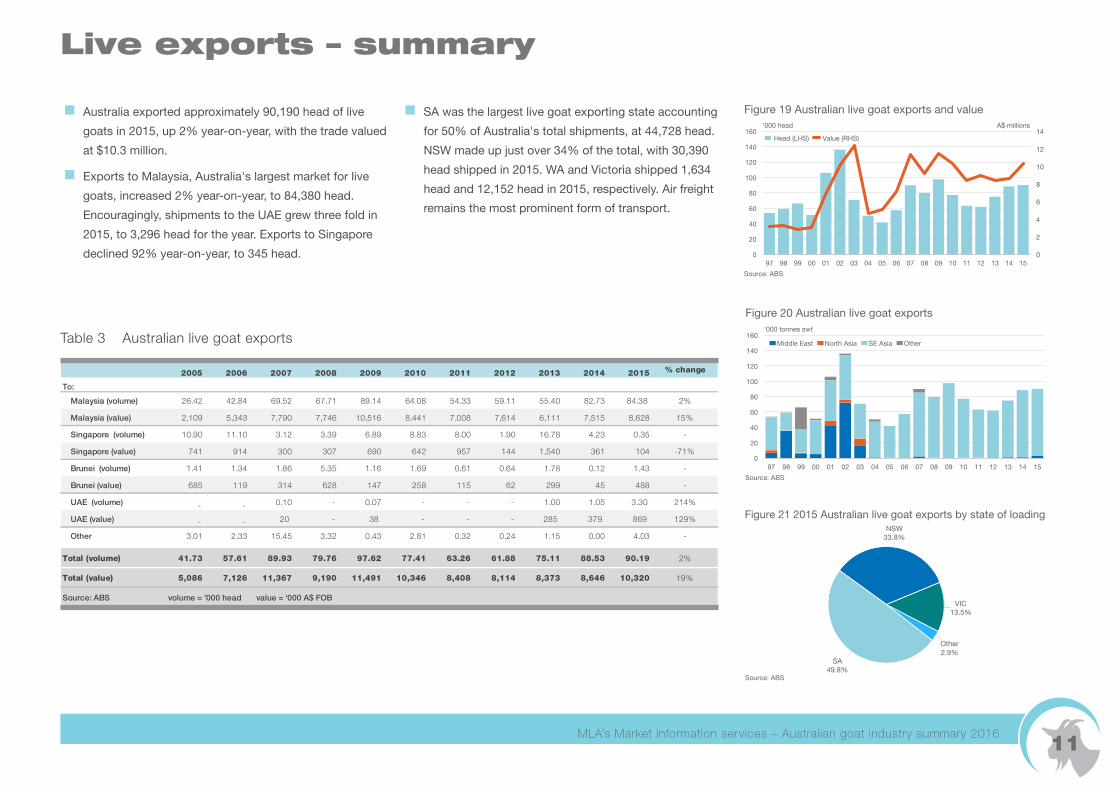
Live exports – summary
Table 3 Australian live goat exports
Australia exported approximately 90,190 head of live
goats in 2015, up 2% year-on-year, with the trade valued
at $10.3 million.
Exports to Malaysia, Australia's largest market for live
goats, increased 2% year-on-year, to 84,380 head.
Encouragingly, shipments to the UAE grew three fold in
2015, to 3,296 head for the year. Exports to Singapore
declined 92% year-on-year, to 345 head.
Source: ABS
97 98 99 00 01 02 03 04 05 06 07 08 09 10 11 12 13 14 150
20
40
60
80
100
120
140
160'000 tonnes swt
Middle East North Asia SE Asia Other
Figure 20 Australian live goat exports
SA was the largest live goat exporting state accounting
for 50% of Australia's total shipments, at 44,728 head.
NSW made up just over 34% of the total, with 30,390
head shipped in 2015. WA and Victoria shipped 1,634
head and 12,152 head in 2015, respectively. Air freight
remains the most prominent form of transport.

12MLA’s Market information & Industry insights – Australian goat industry summary 2016
Destination 2015 tonnageNet change
(Year-on-year)% change 2015 tonnage
Net change (Year-on-year)
% change 2015 tonnageNet change
(Year-on-year)% change 2015 tonnage
Net change (Year-on-year)
% change
World Total 29,965 -5,815 -16% 23,993 -6,145 -20% 5,086 512 11% 887 -181 -17%
US 17,626 -1,464 -8% 12,751 -1,675 -12% 4,011 325 9% 864 -114 -12%
Taiwan 3,721 -1,354 -27% 3,721 -1,341 -26% 0 -5 -100% 0 -8 -100%
Canada 1,720 -498 -22% 1,124 -781 -41% 589 294 100% 7 -11 -62%
Trinidad and Tobago
1,719 -62 -3% 1,317 -43 -3% 394 -7 -2% 8 -12 -58%
South Korea 1,677 153 10% 1,655 138 9% 22 22 0% 0 0 0%
Hong Kong 733 -693 -49% 733 -693 -49% 0 0 0% 0 0 0%
China 880 -233 -21% 876 -207 -19% 0 -16 -100% 4 -10 -72%
Indonesia 89 -656 -88% 89 -645 -88% 0 -11 -100% 0 0 0%
Malaysia 176 -509 -74% 176 -408 -70% 0 -101 -100% 0 0 0%
Vietnam 709 29 4% 709 29 4% 0 0 0% 0 0 0%
Jamaica 101 -287 -74% 101 -287 -74% 0 0 0% 0 0 0%
Japan 399 67 20% 386 66 21% 12 0 1% 1 1 0%
Fiji 138 138 0% 138 138 0% 0 0 0% 0 0 0%
Other 277 -446 -62% 217 -436 -67% 58 11 23% 2 -28 -90%
Source: DAWR
OtherTotal ( all cuts ) Carcase Assorted cuts
Appendix 1 – Goatmeat exports by destination
Table 4 Australian goat exports to destinations by the main cuts
13MLA’s Market information & Industry insights – Australian goat industry summary 2016
Sources, acknowledgements and acronyms
The sources listed below are duly acknowledged for the provision of statistical,
analytical and forecast information used in this document.
Australian Bureau of Agricultural andResource Economics and Sciences (ABARES)
Australian Bureau of Meteorology (BOM)
Australian Bureau of Statistics (ABS)
Department of Agriculture and Water Resources (DAWR), Australia
Food and Agriculture Organisation (FAO) – United Nations
Global Trade Atlas (Australia)
International Monetary Fund (IMF)
Reserve Bank of Australia (RBA)
ABARES – Australian Bureau of Agricultural and Resource Economics
and Sciences
ABS – Australian Bureau of Statistics
CIF – Cost insurance and freight (export price at destination)
cwt – Carcase weight
DAWR – Department of Agriculture and Water Resources, Australia
FAS – Free alongside ship (export price before departure)
FAO – Food and Agriculture Organisation (United Nations)
FOB – Free on board ship (export price loaded on ship before departure)
IMF – International Monetary Fund
lwt – Live weight
MLA – Meat & Livestock Australia
NLRS – National Livestock Reporting Service (Meat & Livestock Australia)
RBA – Reserve Bank of Australia
swt – Shipped weight
US – United States

14MLA’s Market information & Industry insights – Australian goat industry summary 2016
Meat & Livestock AustraliaLevel 1, 40 Mount St
North Sydney NSW 2060Phone: 02 9463 9333
Fax: 02 9463 9393Free call: 1800 023 100 (Australia only)
Email: [email protected]