Embed Size (px)
Citation preview
13
2 Electrolyte-Membrane Equilibria
Introduction
In electrodialysis processes, an electrical current is applied to drive ions through ion-selective membranes. To obtain high current efficiencies, the ratio of counter- overco-ions permeating the membrane should be as high as possible. This ratio is relatedto the ion diffusivities and to their membrane concentration levels. Thedetermination of the diffusivity coefficients is covered in Chapter 3. Theconcentrations are largely determined by equilibrium properties of the membraneand the surrounding solution. The equilibrium distributions of water and differentions between the electrolyte and the membrane phase are the subject of this chapter.In a series of characterisation experiments, the concentration of fixed charges, co-ions and water were determined for every relevant electrolyte-membrane system, asa function of external electrolyte concentration.In section 2.1 equilibrium theory is introduced. The characterisation experimentswith the results are described in section 2.2. In section 2.3, the equilibriumconcentrations are modelled by fitting the experimental activities to multicomponentactivity models.
2.1 Theory of electrolyte-membrane equilibria
The distribution of ions between electrolyte and membrane is governed by theelectrochemical equilibrium equation. For ideal solutions (including the membranephase) the equation only requires a single parameter: the fixed-charge density (orcapacity) of the membrane. However, the model underpredicts the uptake of co-ionsin the membrane, therefore non-idealities must be taken into account. A betterapproach is to allow for membrane inhomogeneities. These result in regions with‘non Donnan-like’ sorption, resulting in a more correct description of electrolyteuptake.
2.1.1 The Donnan equilibriumWhen an electrodialysis membrane is immersed in an electrolyte, ions and watermove through the two phases until equilibrium is reached. Then, for each species,we can define an electrochemical equilibrium between liquid and membrane phase:
( ) ( ) pVzxfRTpVzxfRT iiiiiiii~~~~lnln ++=++ φφ FF (2.1)
Chapter 2
14
which can be written as:
( ) ( )ppRTV
RTz
xfxf ii
ii
ii −+−=
~~~~ln φφ
F(2.2)
For each species this relates the differences between the activities ( )iiii xfxf ~~, , theelectrical potential ( )φφ −~ and pressure ( )pp −~ between the two phases. This is ageneral thermodynamic description of the Donnan equilibrium. In equation 2.2, thetildes denote the properties in the membrane phase, those without tildes are values inthe external solution. For a single electrolyte solution, we can write equation 2.2 forcations (c) and anions (a). By eliminating the potential difference this yields:
( )( )
−
+
= pp
RTVV
ff
xx
xx aaccν
ca
caνa
νc
νa
νc
ac
ac ~exp~
~~νν
(2.3)
The swelling pressure is determined from the membrane water activity. The pressuredifference ( )pp −~ can be obtained from equation 2.14. Its effect on the iondistribution however is small [6, p.143]. Therefore, the swelling pressure is omittedfor the analysis of the ion sorption, by including its (limited) effects in the internalactivity coefficients:
ν
ca
caνa
νc
νa
νc
ff
xx
xxac
ac
=
~
~~ using: ac zν = and: ca z=ν (2.4)
with:
( )ννν1
ac acca fff = ac ννν += (2.5)
This implies that once the internal composition is known from experiment and theexternal activity coefficient is obtained from literature or is calculated from a model,the internal electrolyte activity coefficient can be calculated. Knowledge of the single internal electrolyte activity coefficient, caf~ , is notsufficient for solving equation 2.2. There we need the activity coefficients of theions separately; these can be obtained from multicomponent solution models asthose of Pitzer and Bromley (equation 2.7). An estimate of the Donnan potential cannow be obtained from equation 2.6, when it is solved for all ionic species i:
Electrolyte-Membrane Equilibria
15
+=
ii
ii
i xfxf
zRT
~~ln~F
φφ (2.6)
2.1.2 The estimation of activity coefficients in electrolytes using the methodof BromleySeveral models can predict the activity coefficients of electrolytes [1]. For theequilibrium analysis in this chapter, the Bromley model [1,2] was chosen. For asingle electrolyte, the Bromley model uses only one parameter. For the membranephase, it uses two parameters for each electrolyte-membrane system. The morecomplex and more accurate model by Pitzer [1,3,4] uses three parameter for eachelectrolyte. When this model is applied to the membrane phase, six parameters areneeded. These can be obtained from sorption data, but the number of concentration-dependent experiments to be performed for each electrolyte-membrane systembecomes too large. These models can calculate both the electrolyte activity coefficient and the wateractivity. For the water activity, the osmotic coefficient is evaluated first. In singleelectrolytes, the simplified equations result in a straightforward calculation ofactivity coefficients and osmotic coefficients. However, given the multicomponentcharacter of the electrodialysis electrolytes and the membranes phase, we use themulticomponent version of the Bromley model.
Bromley multicomponent In a multicomponent mixture of electrolytes ca, the single ion activity coefficientcan be calculated from:
ii
i FI
IAz+
+−
=1
log2
γ (2.7)
The Debye-Hückel constant A is related to the Debye-Hückel osmotic constant at25°C, Aφ , by φA.A 3031= . The value of Aφ is 0.39095. For a specific cation C and
an anion A, the term Fi becomes:
∑=a
aCaCaC mZ'BF 2 ∑=c
ccAcAA mZ'BF 2 (2.8)
The summations are taken of all participating ions c and a. In equation 2.8:
Chapter 2
16
( )ca
ac
accaca B
zzI
zzBB +
+
+=
25.11
6.006.0' and
2ac
cazz
Z+
= (2.9)
Again, the activity coefficient of electrolyte CA is obtained from the individual ionactivities using equation 2.10. As stated, only one parameter is needed in this model: the Bromley Bca constant.The values are listed in table 2.1. The values of 1-1 salts are accurate up to I = 6.0,those of the 1-2 salts up to I = 3.0. Cation-cation and anion-anion interactions arenot taken into account in this model.
Table 2.1: Bromley Bca parameter and deviation inlog γ for selected electrolytes.
Electrolyte Bca σHCl –0.1433 0.003NaCl –0.0606 0.002NaOH –0.0574 0.010H2SO4
* –0.0747 0.175Na2SO4 –0.0204 0.008
Once the individual ion activities are calculated, the activity coefficient ofelectrolyte CA is obtained from:
( )ννν γγγ1
ACACCA = with: CA ννν += (2.10)
In order to switch between the molality based activity model (mi, γi) and the molefraction based equilibrium equations (xi, fi), we use the following conversions:
ww Mcc
m ii = and: i
iii mMf γ
+= ∑w0.1
Finally, note that the molality can be defined as:
( ) ( ) νννννν mvvmmm acac acacca ==1
with: ca ννν += (2.11)
* In Bromley’s model, H2SO4 is described as 1-2 salt, with significant standard deviation

Electrolyte-Membrane Equilibria
17
In this equation, mca is the mean molality and m is the solute molality [5].
2.1.3 The estimation of activity coefficients in electrodialysis membranes
Donnan equilibriumThe most obvious way of calculating internal activity coefficients has been pointedout above. When the internal composition is known, and external activitycoefficients have been obtained, equation 2.4 can be used, or equation 2.3 when thewater activities are known. However, the values differ greatly from the valuesexpected in concentrated free solutions with the same composition as the pore fluid,resulting in a poor fit of thermodynamic models to these coefficients, leading in turnto bad modelling of the co-ion uptake.
Introduction of heterogeneity into the equilibrium equationsMore generally, when Donnan theory is compared with real electrolyte uptakes,especially at low solution concentrations, it predicts a too low sorption ofelectrolyte. It is therefore likely that membrane inhomogeneities, resulting in a non-uniformity of the charge distribution, influence the electrolyte uptake [7]. In regionswith a high local fixed-charge concentration, electrolyte uptake is expected to beDonnan-like, but in more empty regions, the exclusion of co-ions will decrease,contributing to a high mean electrolyte uptake. Even when the fixed charges wouldhave been perfectly distributed in the exchanger phase, they would be separated bydistances larger than their ionic atmosphere [9]. In the analysis of Glueckauf [7] a distribution function describing micro-heterogeneity was developed. In a large external concentration range, the functionreduced to:
( )zmm~ −≅ 2 (2.12)
Here, m~ is the observed mean electrolyte uptake, m the mean solution molality. Theconstant z has a value between 0 and +1 and can be obtained from the gradient of the
m~log against mlog plot. Values of z between 0.55 and 0.86 have been observed. More recently, Tugas et al [10] applied equation 2.12 to their equilibriummeasurements of the HCl uptake in three types of anion-exchange membranes,including the ARA membrane. z-Values of 1.5-1.6 are reported. In a similar analysis of sorption data, Meares [8,9] also uses an exponent β whichintroduces the effects of membrane inhomogeneities into the equilibrium equation:
Chapter 2
18
( )βννν α caac mm~m~ ac = with:
=
ca
ca~γγ
α (2.13)
By using natural logarithms in equation 2.13,
caac m)m~m~( ac logloglog1 βαβυ
νν +=
the constant β can be found graphically (from the slope) when the left-hand side isplotted against camlog . From the y-axis intercept α can be found, enabling thecalculation of the internal activity coefficients. This approach improves thedescription of high electrolyte uptake at low external concentrations. The resultinginternal activity coefficients are more in the range of those in concentratedelectrolytes and are consequently better modelled by thermodynamic models.
The modelling of internal activity coefficientsIon-exchange resins and electrodialysis membranes can be considered to be aconcentrated multicomponent electrolyte, containing a mixture of ‘co-ion/counter-ion electrolyte’ and ‘fixed-charge/counter-ion electrolyte’. The multicomponentBromley model (see section 2.1.2) can be applied to this electrolyte mixture,yielding the activity coefficient of the sorbed electrolyte. The two Bromley Bcaconstants can be found by fitting the Bromley model activity coefficients to theexperimentally determined values, using a Marquart-Levenberg parameteroptimisation method. The fit results are presented in section 2.3.3.
2.1.4 Swelling pressure in electrodialysis membranesWe use equation 2.2 to describe the water equilibrium, using zw = 0:
w
w
w~lnaa
VRT=Π with: ( )pp~ −=Π (2.14)
The swelling pressure Π is defined as the difference between the internal andexternal pressure. It can be calculated from the water activities in both phases. Thesolution phase water activity can be obtained quite accurately from multicomponentthermodynamic models, such as those of Bromley and Pitzer [1]. In these models,the osmotic coefficient of the electrolyte is calculated, which is related to the wateractivity by:
φ∑−=i
imMa wwln (2.15)
Electrolyte-Membrane Equilibria
19
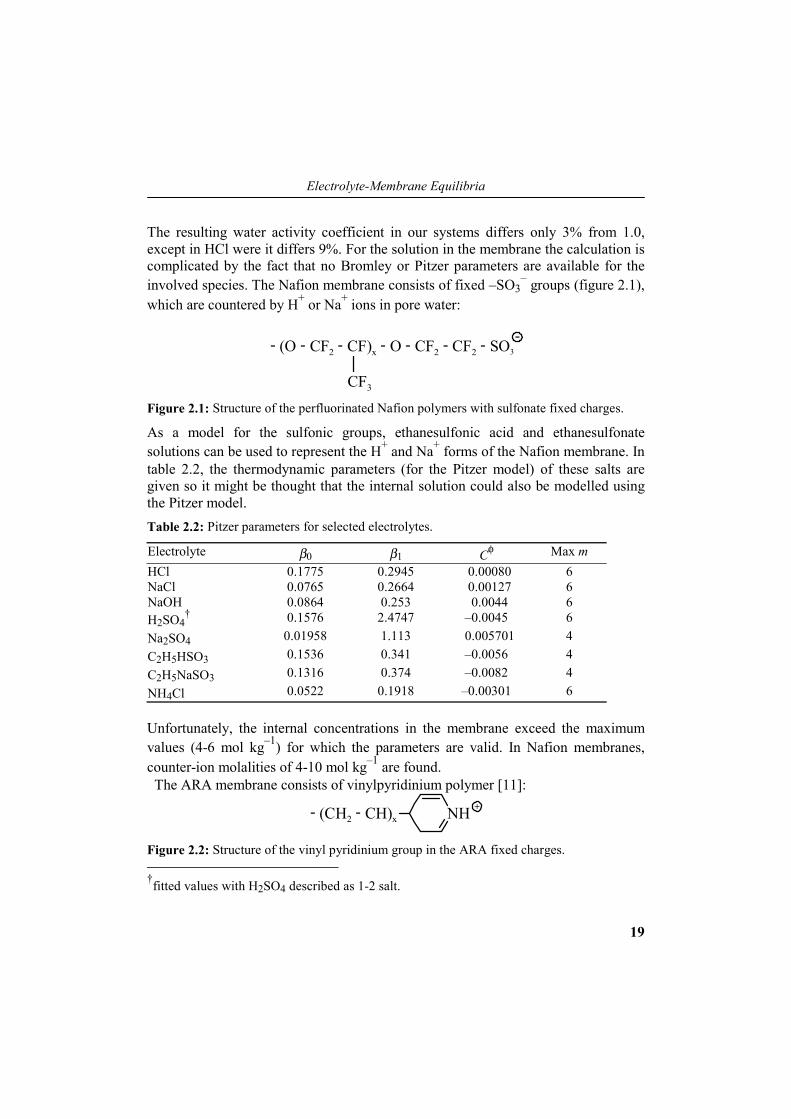
The resulting water activity coefficient in our systems differs only 3% from 1.0,except in HCl were it differs 9%. For the solution in the membrane the calculation iscomplicated by the fact that no Bromley or Pitzer parameters are available for theinvolved species. The Nafion membrane consists of fixed –SO3
– groups (figure 2.1),which are countered by H+ or Na+ ions in pore water:
- (O - CF - CF) - O - CF - CF - SO2 x 2 2 3
CF3
-
Figure 2.1: Structure of the perfluorinated Nafion polymers with sulfonate fixed charges.
As a model for the sulfonic groups, ethanesulfonic acid and ethanesulfonatesolutions can be used to represent the H+ and Na+ forms of the Nafion membrane. Intable 2.2, the thermodynamic parameters (for the Pitzer model) of these salts aregiven so it might be thought that the internal solution could also be modelled usingthe Pitzer model.Table 2.2: Pitzer parameters for selected electrolytes.
Electrolyte β0 β1 Cφ Max mHCl 0.1775 0.2945 –0.00080 6NaCl 0.0765 0.2664 –0.00127 6NaOH 0.0864 0.253 –0.0044 6H2SO4
† 0.1576 2.4747 –0.0045 6Na2SO4 0.01958 1.113 –0.005701 4C2H5HSO3 0.1536 0.341 –0.0056 4C2H5NaSO3 0.1316 0.374 –0.0082 4NH4Cl 0.0522 0.1918 –0.00301 6
Unfortunately, the internal concentrations in the membrane exceed the maximumvalues (4-6 mol kg–1) for which the parameters are valid. In Nafion membranes,counter-ion molalities of 4-10 mol kg–1 are found. The ARA membrane consists of vinylpyridinium polymer [11]:
- (CH - CH)2 x NH +
Figure 2.2: Structure of the vinyl pyridinium group in the ARA fixed charges. †fitted values with H2SO4 described as 1-2 salt.

Chapter 2
20
When this group is modelled as a highly concentrated NH4Cl solution, the situationbecomes even worse with molalities between 14 and 21 mol kg–1. Low water-content and high ion-exchange capacity in the AEM’s contribute to these values. Forlack of better the water activities in the membrane have been taken equal to unity.This implies that the activities are equal to the mole fractions that already have beendetermined in (section 2.2). The results of this method (the calculated swellingpressures) are shown for Nafion, ARA and AW membrane in 2.3.4.
2.2 Membrane characterisation experiments
Some properties of the membranes used in the acid-base concentrating experimentshave to be characterised in detail, to be able to calculate their behaviour in asimulation model. The properties expected to have a large influence on the currentefficiency of an electrodialysis process are:1. the ion-exchange capacity (or concentration of fixed charges) of the membrane2. the co-ion concentration in the membrane. Another parameter we want to be able to calculate later in the mass transfer model,is the electro-osmotic water flux through the membrane. In our view of the masstransfer taking place, a water flux will arise from friction of the water in themembrane with the moving ions, mainly the counter-ions. The important parameterto be measured here is the internal water concentration. To complete our descriptionof the membrane phase, all parameters will be determined as a function of externalconcentration.
2.2.1 Overview of the characterisation measurementsThe measured membranes are Nafion 450, ARA-02 and AW-09. The electrolytesystems are HCl, H2SO4, NaCl, Na2SO4 and NaOH. The experiments aresummarised in tables 2.3 to 2.5.Table 2.3: Membrane, electrolyte and concentration of the ion-exchange capacitymeasurements.
Membrane Electrolyte c / mol m–3
Nafion 450 HCl / NaCl 100 - 4000ARA HCl / HNO3 100 - 4000AW HCl / HNO3 100 - 4000

Electrolyte-Membrane Equilibria
21
Table 2.4: Co-ion sorption measurements.
Membrane Electrolyte c / mol m–3
Nafion 450 HCl / NaCl 100 - 4000H2SO4 250 - 2000NaCl 500 - 4000NaOH 500 - 4000Na2SO4 250 - 1000
ARA HCl / HNO3 100 - 4000H2SO4 250 - 2000
AW HCl / HNO3 100 - 4000H2SO4 250 - 2000
Table 2.5: Water content measurements.
Membrane Electrolyte c / mol m–3
Nafion 450 HCl 1000 - 4000H2SO4 1000 - 4000NaCl 0 - 4000Na2SO4 1000NaOH 1000 - 4000
ARA HCl 0 - 4000H2SO4 4000NaCl 0 - 4000
AW HCl 500 - 4000H2SO4 4000NaCl 0 – 4000
2.2.2 Fixed-charge concentration and co-ion uptake
NafionThe fixed-charge concentration of the Nafion cation-exchange membrane wasdetermined in HCl solutions at different concentrations. By measuring the uptake ofH+ counter-ions as a function of external concentration, not only could the ion-exchange capacity be determined, but also the Cl– co-ion uptake. The followingmethod was applied to determine the internal H+ concentration, in HCl solutions of0.1, 0.5, 1.0, 2.0 and 4.0 M:
Chapter 2
22
1. Converting the membrane (16 x 16 cm) into the H+-form by immersing it in2 dm3 2.0 M HCl solution, two times one hour.
2. Removing the co-ions by equilibrating in de-ionised water (Milli-Q), for twotimes one hour.
3. Equilibrating in HCl (two times one hour) of the specific concentration.4. Measurement of the membrane size and thickness, and drying the surface.5. Rinsing the membrane in 2.0 dm3 0.50 M NaCl solution for two hours6. Determine the amount of released H+ by titration.The internal concentration of H+ can now be calculated from the total number ofmoles of H+ released from the membrane divided by its size. The fixed-chargeconcentration can be calculated by extrapolation of the internal H+ concentration to0 M external concentration. The Cl– co-ion uptake then follows from the differencebetween H+ concentration and fixed-charge concentration. In the Na+-form of theNafion membrane, the internal co-ion concentration was determined in the sameway, except that the membrane was immersed in 2.0 dm3 of de-ionised water at step5. The measured solutions were NaCl and NaOH at 0.5, 1.0, 2.0 and 4.0 M andNa2SO4 at 0.25, 0.5 and 1.0 M.
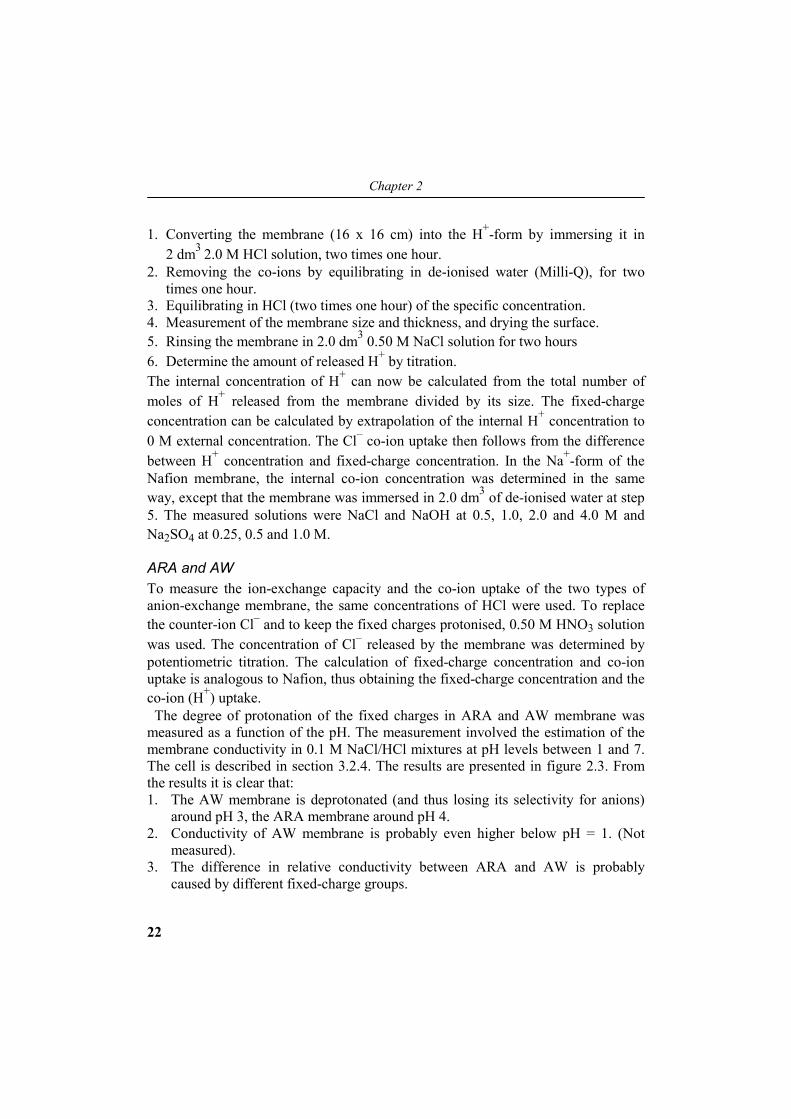
ARA and AWTo measure the ion-exchange capacity and the co-ion uptake of the two types ofanion-exchange membrane, the same concentrations of HCl were used. To replacethe counter-ion Cl– and to keep the fixed charges protonised, 0.50 M HNO3 solutionwas used. The concentration of Cl– released by the membrane was determined bypotentiometric titration. The calculation of fixed-charge concentration and co-ionuptake is analogous to Nafion, thus obtaining the fixed-charge concentration and theco-ion (H+) uptake. The degree of protonation of the fixed charges in ARA and AW membrane wasmeasured as a function of the pH. The measurement involved the estimation of themembrane conductivity in 0.1 M NaCl/HCl mixtures at pH levels between 1 and 7.The cell is described in section 3.2.4. The results are presented in figure 2.3. Fromthe results it is clear that:1. The AW membrane is deprotonated (and thus losing its selectivity for anions)
around pH 3, the ARA membrane around pH 4.2. Conductivity of AW membrane is probably even higher below pH = 1. (Not
measured).3. The difference in relative conductivity between ARA and AW is probably
caused by different fixed-charge groups.
Electrolyte-Membrane Equilibria
23
pH (-)1 2 3 4 5 6 7
0.0
0.2
0.4
0.6
0.8
1.0 ARA AW
K /
K p
H =
1 (-
)
Figure 2.3: Membrane conductivity (relative to the conductivity at pH = 1) of ARA and AWmembrane as a function of the pH, in 0.1 M HCl/NaCl mixtures. The increase inconductivity above pH = 3.5 (ARA) is probably caused by slow deprotonation in time ofsome samples.
2.2.3 Membrane water content
NafionThe internal water concentration of Nafion membrane was measured in HCl, H2SO4,NaCl and NaOH at 0, 1.0, 2.0 and 4.0 M, and in Na2SO4 at 1.0 M. In HCl, H2SO4,NaOH and Na2SO4 pieces of membrane of 4 x 4 cm were used, in duplo. To reducethe experimental error, larger 8 x 8 cm pieces were used in NaCl, at concentrationsof 0, 0.5, 1, 2 and 4 M, also in duplo. The following measurement method was used:1. Equilibration of the membrane piece in the desired solution for at least 8 hours.2. Measurement of the size and thickness of the membrane.3. Weighing the wet membrane after drying the membrane surface by wiping.4. Drying of the membrane in a vacuum oven at 50°C for at least 24 hours.5. Weighing of the dry membrane.The water volume fraction of the membrane can be calculated from:
wwet
drywetw ρ
εV
)mm( −= (2.16)
The internal water concentration then follows from:
Chapter 2
24
w
www
~M
cερ
= (2.17)
From the data we can also calculate the membrane density:
wet
wetm V
m=ρ (2.18)
ARA and AWThe same method for the measurement of the internal water concentration wasapplied for the anion-exchange membranes ARA and AW. Again pieces of 4 x 4 cmwere used. ARA was measured in HCl at 0, 1.0, 2.0 and 4.0 M, in NaCl at 0, 0.5,1.0, 2.0 and 4.0 M and in H2SO4 at 4.0 M. AW was measured in HCl and NaCl at 0,0.5, 1.0, 2.0 and 4.0 M and in H2SO4 at 4.0 M. In the membrane thickness, theconcentration dependency was of the same order as the experimental error.Therefore these were measured again separately using a screw-micrometer. ARAand AW were measured in HCl and H2SO4 at 0, 0.25, 0.5, 1.0, 2.0 and 4.0 M.
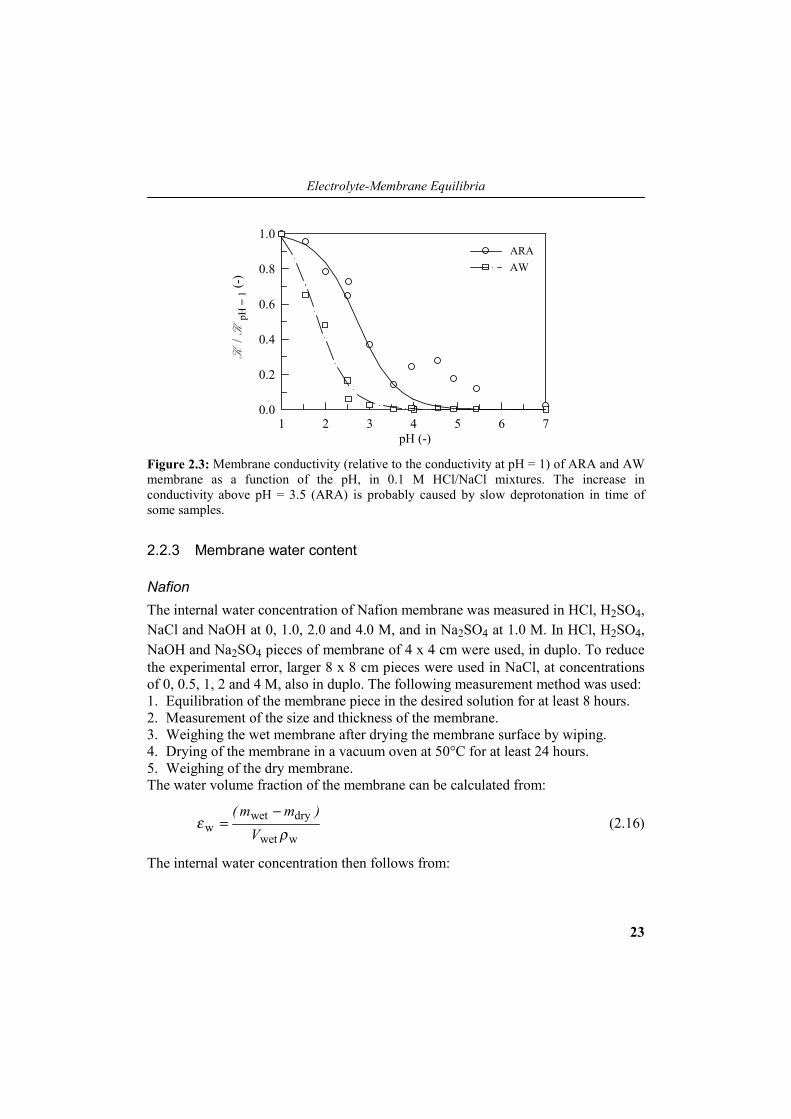
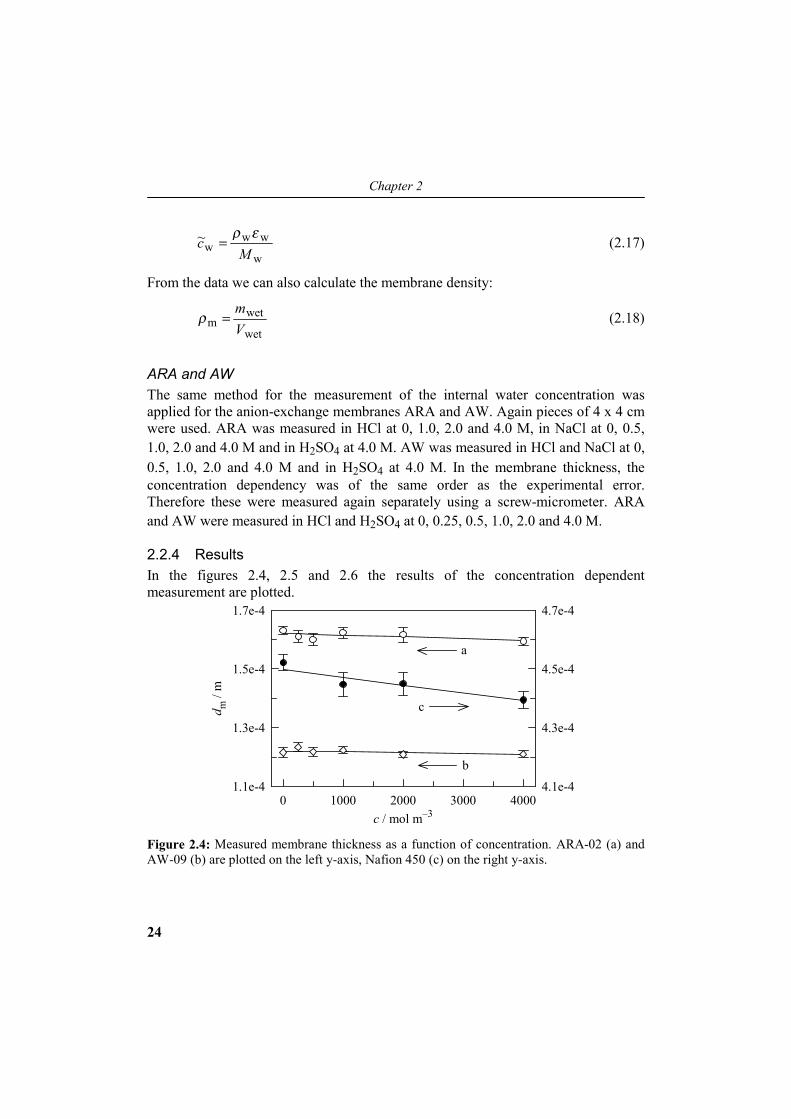
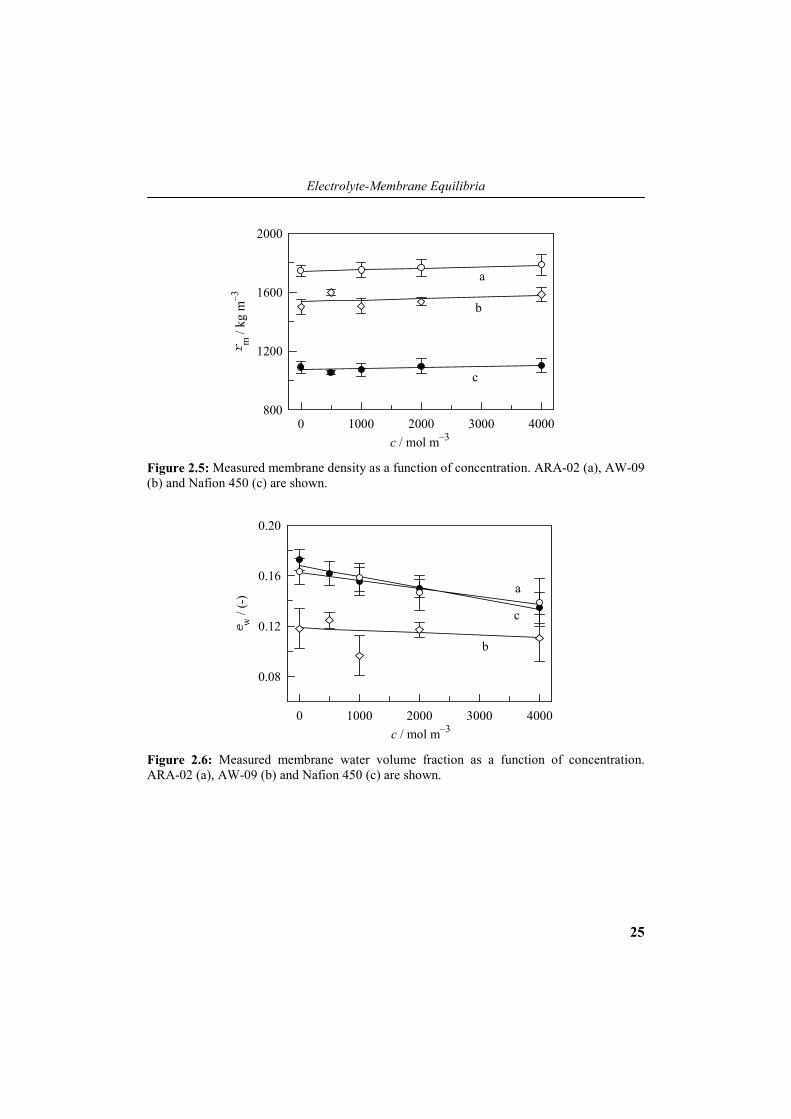
2.2.4 ResultsIn the figures 2.4, 2.5 and 2.6 the results of the concentration dependentmeasurement are plotted.
c / mol m–30 1000 2000 3000 4000
d m /
m
1.1e-4
1.3e-4
1.5e-4
1.7e-4
4.1e-4
4.3e-4
4.5e-4
4.7e-4
a
b
c
Figure 2.4: Measured membrane thickness as a function of concentration. ARA-02 (a) andAW-09 (b) are plotted on the left y-axis, Nafion 450 (c) on the right y-axis.
Electrolyte-Membrane Equilibria
25
c / mol m–30 1000 2000 3000 4000
r m /
kg m
–3
800
1200
1600
2000
a
b
c
Figure 2.5: Measured membrane density as a function of concentration. ARA-02 (a), AW-09(b) and Nafion 450 (c) are shown.
c / mol m–30 1000 2000 3000 4000
e w /
(-)
0.08
0.12
0.16
0.20
a
b
c
Figure 2.6: Measured membrane water volume fraction as a function of concentration.ARA-02 (a), AW-09 (b) and Nafion 450 (c) are shown.

Chapter 2
26
2.3 Modelling of the membrane composition
In electrodialysis modelling, equations are needed to describe the composition insidethe membrane, as a function of the external composition. In this section we translatethe experimental results, described in the preceding section, into mathematicalequations. Most of the properties can be described as a function of electrolyteconcentration using a simple linear regression or parabolic formula. In contrast, forco-ion sorption a much more complex model involving Donnan potentials andmembrane heterogeneity is applied.
2.3.1 Membrane properties as a function of electrolyte concentrationIn this section the equations are given with which some properties of the ARA, AWand Nafion membranes can be calculated from the solution concentration. Nodistinction is made between the specific electrolytes, because the experimental errormade these differences imperceptible.
ThicknessAll measurements are fitted to a linear equation:
21m pcpd += (2.19)
In equation 2.19, dm is the membrane thickness in (m) and c is the electrolyteconcentration in (mol m–3). The parameters p1 and p2 are given in table 2.6. Theequation represents the lines in figure 2.4.
Table 2.6: Linear equation parameters for the calculation of the membrane thickness dm (m).
Membrane p1 p2ARA –5.79E–10 1.62E–04AW –3.10E–10 1.22E–04Nafion –2.65E–09 4.50E–04
Electrolyte-Membrane Equilibria
27
DensityAgain, equation 2.19 is used to fit the experimental results of the concentration-depend measurement, with dm replaced by ρm. The parameters are given in table 2.7.
Table 2.7: Linear equation parameters for the calculation of the membrane wet densityρm (kg m–3).
Membrane p1 p2ARA 1.08E–02 1743.3AW 1.06E–02 1536.4Nafion 0.77E–02 1072.7
Water volume fractionAgain equation 2.19 is used, now with dm replaced by εw. The parameters are givenin table 2.8.Table 2.8: Linear equation parameters for the calculation of the membrane water volumefraction εw (-).
Membrane p1 p2ARA –6.36E–06 0.163AW –1.99E–06 0.119Nafion –8.76E–06 0.168
Fixed-charge concentrationAs is described in section 2.2.2, the fixed-charge concentration (for all threemembrane types) at cext = 0, 0
mc , is obtained from extrapolation of the counter-ionconcentration to zero external concentration. However, at higher externalconcentrations the membrane shrinks, resulting in a higher fixed-chargeconcentration. To keep the total number of fixed-charges constant (for example in asingle piece of stack membrane), and at the same time introduce concentrationdependency into cm we use:
0m
0mmm VcVc = (2.20)
In equation 2.20, 0mV is defined as the measured membrane volume at cext = 0. Vm is
the concentration-dependent membrane volume, which was measured in theequilibrium experiments. The obtained concentration-dependent membrane fixed-
Chapter 2
28
charge concentrations can be described as a function of external electrolyteconcentration by using a parabolic equation:
3ext22ext1m pcpcpc ++= (2.21)
The parameters for equation 2.21 are given in table 2.9. Since the dependency issmall, a graphical representation of the measurement with the fitted equations is notincluded.
Table 2.9: Parabolic parameters for the fixed-charge concentration, cm (mol m–3).
Membrane p1 p2 p3ARA 2.53E–08 6.95E–03 1949.1AW 1.08E–08 4.19E–03 1650.3Nafion 2.68E–08 4.55E–03 1771.9
2.3.2 Calculation of membrane activity coefficientsThe property left to describe is the co-ion uptake in Nafion, ARA and AWmembranes. The first step is to calculate the internal activity coefficient. This can bedone directly by using equation 2.4, or by using equation 2.13, which includes aheterogeneity correction which must be calculated first. This last method was chosenbecause the values of the internal activity coefficients, obtained from equation 2.4,led to unrealistic results from the Bromley model. When written in mole fractions,equation 2.13 originates from:
)~(~ φφβ
−=
RTz
iii
ii
exxf
fF
(2.22)
This is equal to the (Donnan) equilibrium equation when β = 1. For a singleelectrolyte equation 2.22 becomes:
( )βννβν
νν acac acca
caac xx
f~f
x~x~
= (2.23)
When written as:
( ) ( )acac acac xxxx νννν βαβυ
loglog~~log1 += with:
=
ca
caf~f
α (2.24)
Electrolyte-Membrane Equilibria
29
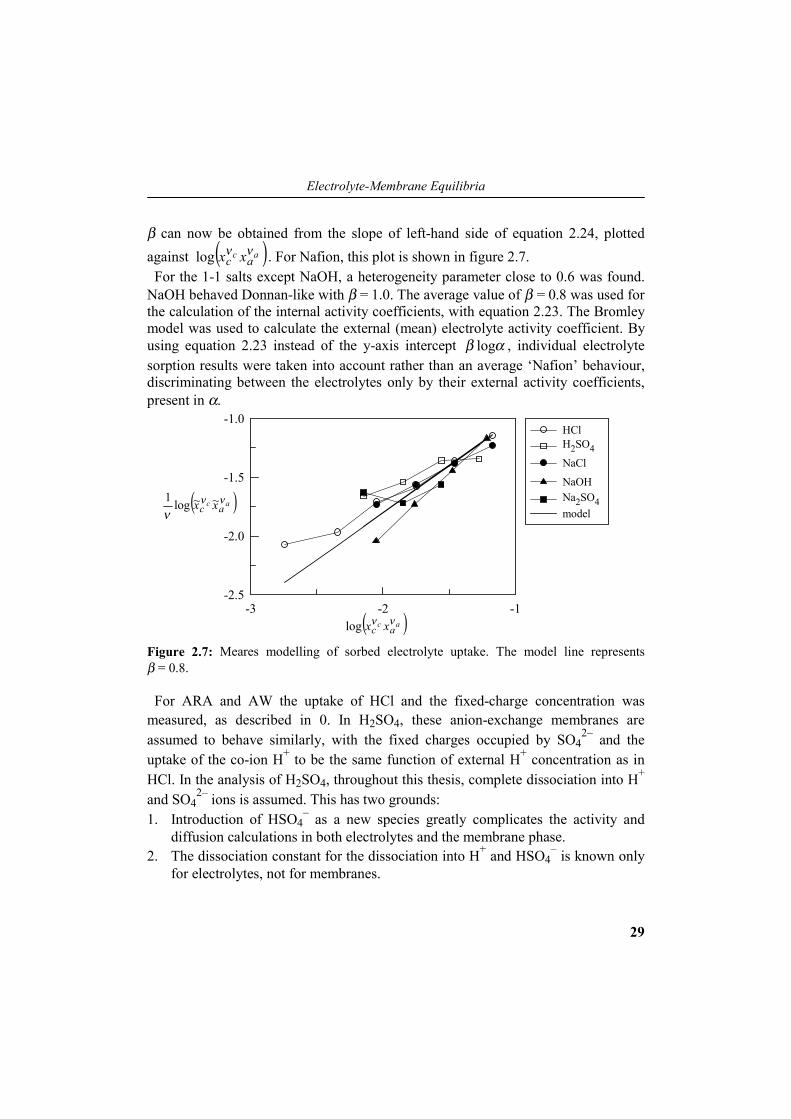
β can now be obtained from the slope of left-hand side of equation 2.24, plottedagainst ( )ac ac xx ννlog . For Nafion, this plot is shown in figure 2.7. For the 1-1 salts except NaOH, a heterogeneity parameter close to 0.6 was found.NaOH behaved Donnan-like with β = 1.0. The average value of β = 0.8 was used forthe calculation of the internal activity coefficients, with equation 2.23. The Bromleymodel was used to calculate the external (mean) electrolyte activity coefficient. Byusing equation 2.23 instead of the y-axis intercept αβ log , individual electrolytesorption results were taken into account rather than an average ‘Nafion’ behaviour,discriminating between the electrolytes only by their external activity coefficients,present in α.
-3 -2 -1
-2.5
-2.0
-1.5
-1.0
model
H2SO4
HCl
NaCl
NaOHNa2SO4
Figure 2.7: Meares modelling of sorbed electrolyte uptake. The model line representsβ = 0.8.
For ARA and AW the uptake of HCl and the fixed-charge concentration wasmeasured, as described in 0. In H2SO4, these anion-exchange membranes areassumed to behave similarly, with the fixed charges occupied by SO4
2– and theuptake of the co-ion H+ to be the same function of external H+ concentration as inHCl. In the analysis of H2SO4, throughout this thesis, complete dissociation into H+
and SO42– ions is assumed. This has two grounds:
1. Introduction of HSO4– as a new species greatly complicates the activity and
diffusion calculations in both electrolytes and the membrane phase.2. The dissociation constant for the dissociation into H+ and HSO4
– is known onlyfor electrolytes, not for membranes.
( )ac ac x~x~ ννν
log1
( )ac ac xx ννlog
Chapter 2
30
For acid solutions, ignoring SO42– ions instead of HSO4
– ions would be morerealistic‡, but in neutral (or alkaline) solutions containing Na2SO4, this is simplyimpossible. The β -factors found in ARA and AW were close to 0.5 in both membranes forHCl, and β = 0.7 was found for H2SO4. The average value of 0.6 was used in theactivity coefficient calculations for both membranes.
2.3.3 Modelling of electrolyte uptake using internal activity coefficientsIn section 2.1.2 the Bromley model was selected to fit the internal activitycoefficients calculated from measurements in the above section. For the differentsorbed electrolytes, the same interactions may occur. For example Na+/m interactionin a Nafion membrane is present in both NaCl and NaOH systems, but only onevalue of the Bromley counter-ion membrane interaction parameter is desired.Therefore, the Bromley constants of the investigated electrolytes were fittedsimultaneously for each membrane. The results are given in table 2.10.Table 2.10: Bromley B parameters in Nafion, ARA and AW membranes.
Electrolyte B(Nafion)
Electrolyte B(ARA)
B(AW)
HCl –0.1805 HCl –0.0322 –0.0606H2SO4 –0.1446 H2SO4 –0.0362 –0.0279NaCl –0.0271 Cl–/m –0.0636 –0.0242NaOH –0.0202 SO4
2–/m –0.1631 –0.1387Na2SO4 –0.0922H+/m –0.0785Na+/m –0.2214
In figure 2.8 the model fit for the Nafion membrane is compared to the calculatedinternal activity coefficients.
‡ It is shown (by Raman spectroscopy) in [10] that sorbed H2SO4 inside ARA membranes ispresent as H+ and HSO4
–.
Electrolyte-Membrane Equilibria
31
c / mol m–30 1000 2000 3000 4000
f ca /
-
0.0
1.0
2.0
3.0
4.0
~
H2SO4
HCl
NaCl
NaOHNa2SO4
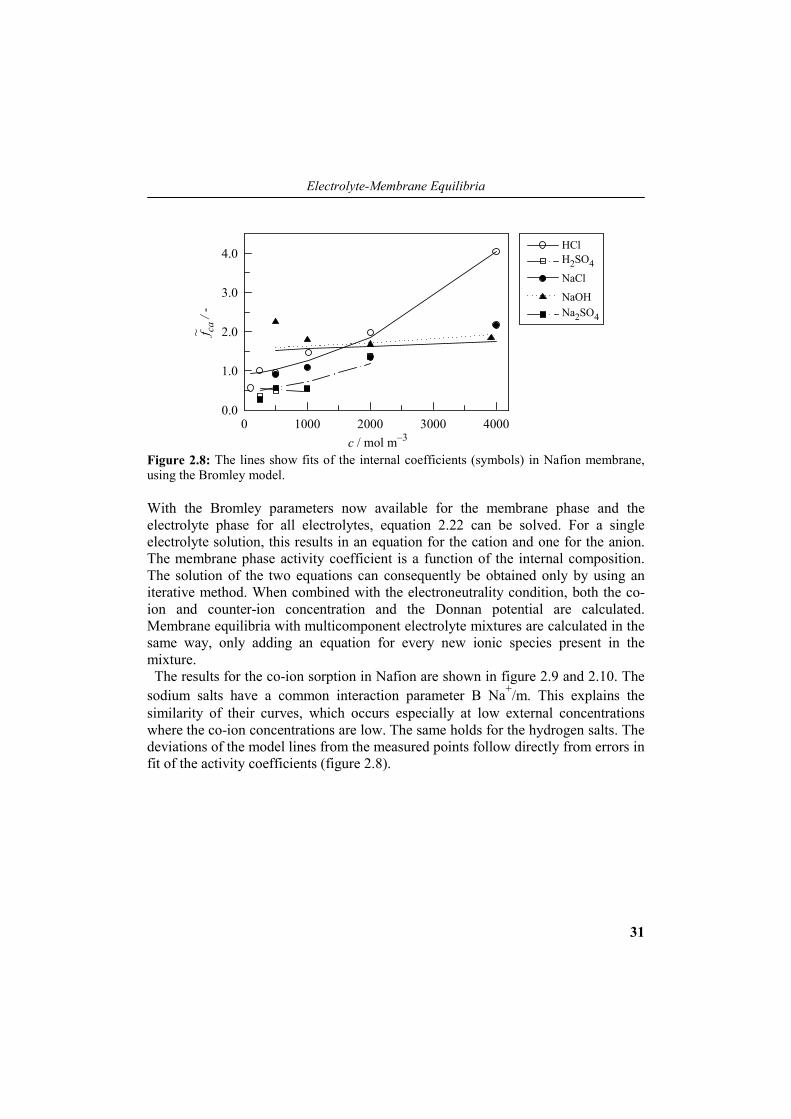
Figure 2.8: The lines show fits of the internal coefficients (symbols) in Nafion membrane,using the Bromley model.
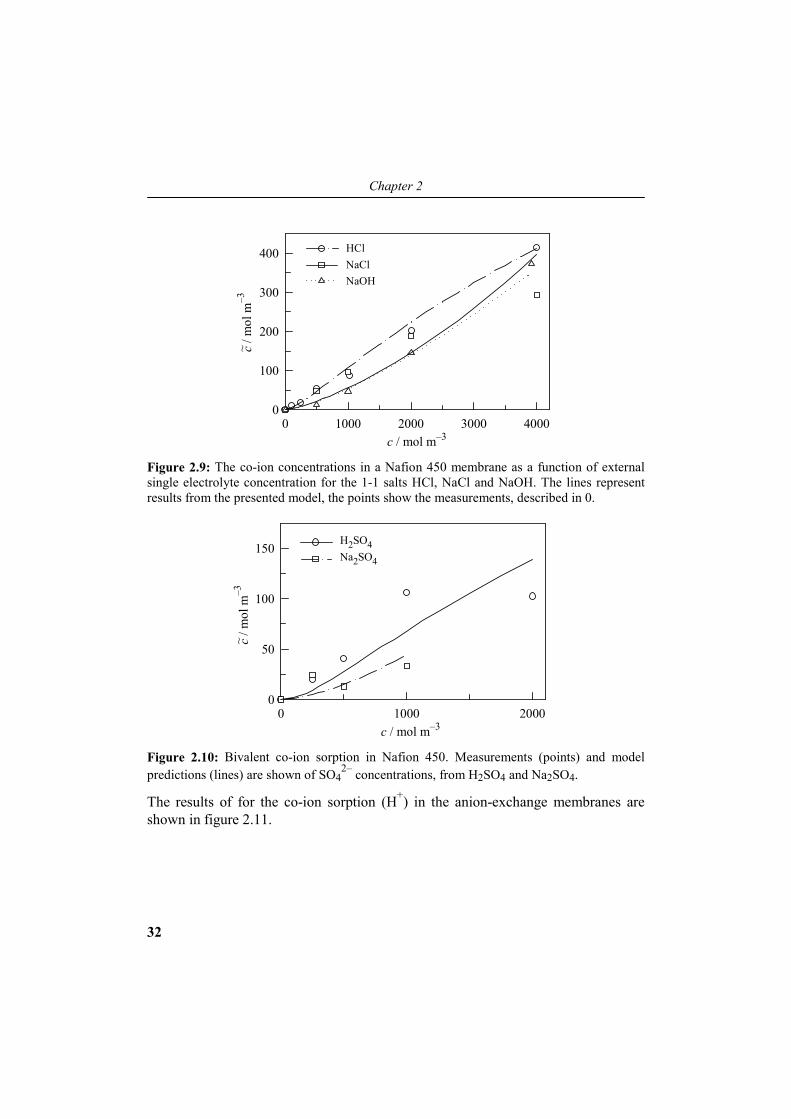
With the Bromley parameters now available for the membrane phase and theelectrolyte phase for all electrolytes, equation 2.22 can be solved. For a singleelectrolyte solution, this results in an equation for the cation and one for the anion.The membrane phase activity coefficient is a function of the internal composition.The solution of the two equations can consequently be obtained only by using aniterative method. When combined with the electroneutrality condition, both the co-ion and counter-ion concentration and the Donnan potential are calculated.Membrane equilibria with multicomponent electrolyte mixtures are calculated in thesame way, only adding an equation for every new ionic species present in themixture. The results for the co-ion sorption in Nafion are shown in figure 2.9 and 2.10. Thesodium salts have a common interaction parameter B Na+/m. This explains thesimilarity of their curves, which occurs especially at low external concentrationswhere the co-ion concentrations are low. The same holds for the hydrogen salts. Thedeviations of the model lines from the measured points follow directly from errors infit of the activity coefficients (figure 2.8).
Chapter 2
32
c / mol m–30 1000 2000 3000 4000
c / m
ol m
–3
0
100
200
300
400~
HCl NaCl NaOH
Figure 2.9: The co-ion concentrations in a Nafion 450 membrane as a function of externalsingle electrolyte concentration for the 1-1 salts HCl, NaCl and NaOH. The lines representresults from the presented model, the points show the measurements, described in 0.
c / mol m–30 1000 2000
c / m
ol m
–3
0
50
100
150
~
H2SO4 Na2SO4
Figure 2.10: Bivalent co-ion sorption in Nafion 450. Measurements (points) and modelpredictions (lines) are shown of SO4
2– concentrations, from H2SO4 and Na2SO4.
The results of for the co-ion sorption (H+) in the anion-exchange membranes areshown in figure 2.11.
Electrolyte-Membrane Equilibria
33
c / mol m–30 1000 2000 3000 4000
0
200
400
600
800
1000 ARA AW
c / m
ol m
–3~
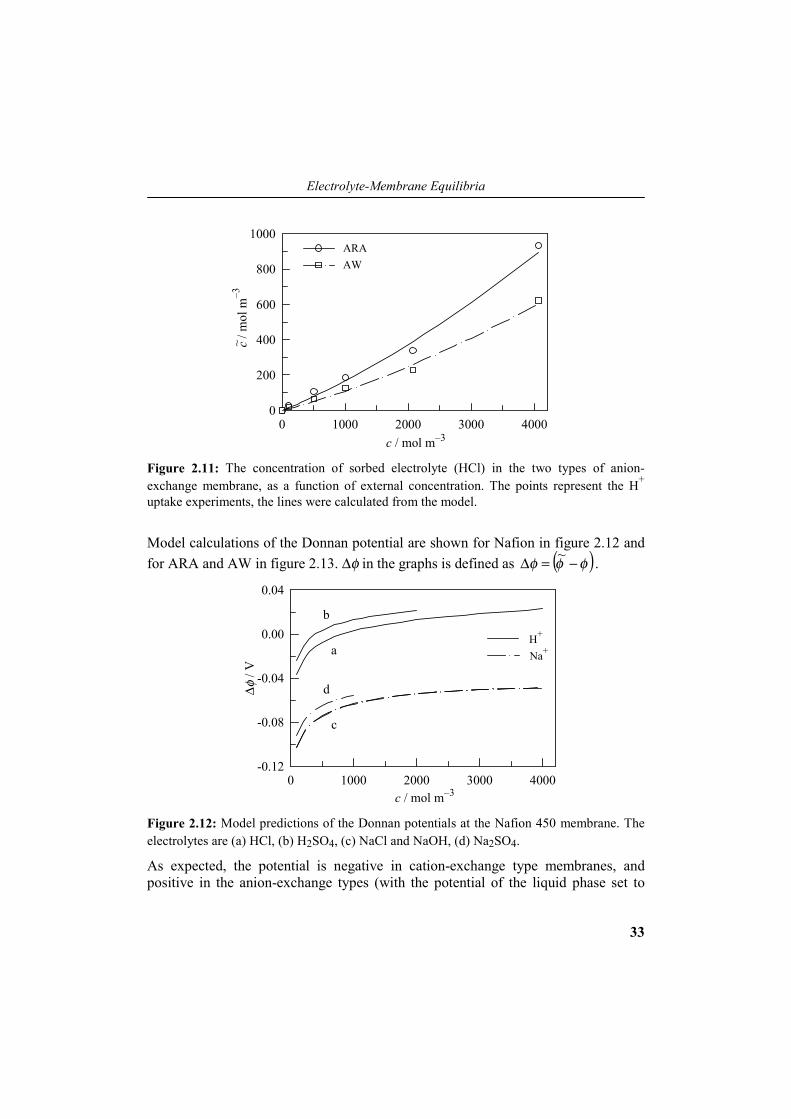
Figure 2.11: The concentration of sorbed electrolyte (HCl) in the two types of anion-exchange membrane, as a function of external concentration. The points represent the H+
uptake experiments, the lines were calculated from the model.
Model calculations of the Donnan potential are shown for Nafion in figure 2.12 andfor ARA and AW in figure 2.13. ∆φ in the graphs is defined as ( )φφφ −=∆ ~ .
c / mol m–30 1000 2000 3000 4000
∆φ /
V
-0.12
-0.08
-0.04
0.00
0.04
H+
Na+
b
a
d
c
Figure 2.12: Model predictions of the Donnan potentials at the Nafion 450 membrane. Theelectrolytes are (a) HCl, (b) H2SO4, (c) NaCl and NaOH, (d) Na2SO4.
As expected, the potential is negative in cation-exchange type membranes, andpositive in the anion-exchange types (with the potential of the liquid phase set to
Chapter 2
34
zero). At low external concentrations, the higher potential differences result in betterco-ion exclusion.
c / mol m–30 1000 2000 3000 4000
∆φ /
V
0.00
0.02
0.04
0.06
0.08 ARA AW
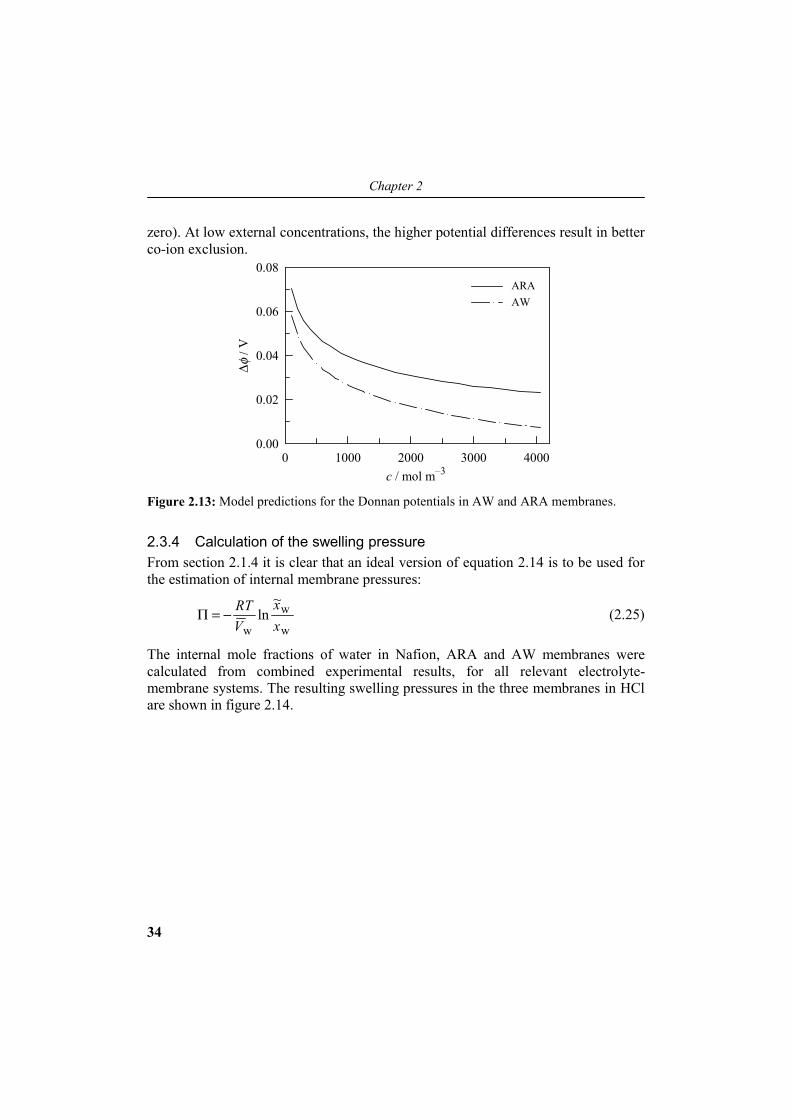
Figure 2.13: Model predictions for the Donnan potentials in AW and ARA membranes.
2.3.4 Calculation of the swelling pressureFrom section 2.1.4 it is clear that an ideal version of equation 2.14 is to be used forthe estimation of internal membrane pressures:
w
w
wln
xx~
VRT−=Π (2.25)
The internal mole fractions of water in Nafion, ARA and AW membranes werecalculated from combined experimental results, for all relevant electrolyte-membrane systems. The resulting swelling pressures in the three membranes in HClare shown in figure 2.14.

Electrolyte-Membrane Equilibria
35
c / mol m–30 1000 2000 3000 4000
Π /
atm
0
200
400
600
a
b
c
d
Figure 2.14: Calculated internal pressures as a function of solution concentration. Comparedare membrane-HCl results of: ARA (a), AW (b) and Nafion450 (c). (d) represents theH2SO4-Nafion system.
For Nafion with the other 1-1 electrolytes NaCl and NaOH, the results are close tocurve (c). The 1-2 electrolyte H2SO4 (line d) shows a much larger concentrationdependency, the same effect was observed with Na2SO4. In the anion-exchangemembranes a high internal pressure close to 500 atm is calculated. In thesemembranes, due to much higher fixed-charge concentrations compared to Nafion,combined with similar water contents, wx~ is lowered. In literature, values of the swelling pressure of up to 600 atm have also beenreported [6, p.112]. A linear proportionality was found between swelling pressureand polymer crosslinking. At 200 atm, 10% crosslinking exists, 500 atm correspondsto 20%.
2.4 Conclusion
For the electrodialysis mass transfer model, apart from the membrane diffusioncoefficients, the membrane compositions have to be known in different electrolytesas a function of concentration. From extensive characterisation experiments thefixed-charge, co-ion, counter-ion and water concentrations were determined. Athermodynamic equilibrium model was applied to the results. However, the internalactivity coefficients could not be described with thermodynamic models such as theBromley model when a homogeneous charge distribution in the membrane wasassumed. For a complete two-phase description, not enough measurements were
Chapter 2
36
available. To overcome the problem, the experiments could be described by theequilibrium equation, extended with a heterogeneity factor, combined with theBromley model for calculation of the internal activity coefficients. As a result of thecalculations, both the membrane-phase electrical potential, and the co-ion sorptionbehaviour could be modelled.
2.5 References
1 Zemaitis, J.F., Clark, D.M., Rafal, M., and Scrivner, N.C. Thermodynamics ofsolutions. In: Handbook of Aqueous Electrolyte Thermodynamics, New York:DIPPR, 1986.
2 Bromley, L.A. Thermodynamic Properties of Strong Electrolytes in AqueousSolutions. AIChE Journal 19(2):313-320, 1973.
3 Pitzer, K.S. and Kim, J.J. Thermodynamics of Electrolytes. IV. Activity andOsmotic Coefficients for Mixed Electrolytes. J.Am.Chem.Soc. 96(18):5701-5708,1974.
4 Pitzer, K.S., Roy, R.N., and Silvester, L.F. Thermodynamics of Electrolytes. 7.Sulfuric Acid. J.Am.Chem.Soc. 99(15):4930-4936, 1977.
5 Robinson, R.A. and Stokes, R.H. Basic Concepts and Defenitions. In: ElectrolyteSolutions, London: Butterworths, 1959,p. 24-39.
6 Helfferich, F. Ion Exchange, New York:McGraw-Hill Company, Inc. 1962.7 Glueckauf, E. and Watts, R.E. The Donnan law and its application to ion
exchanger polymers. Proc.Roy.Soc. A268:339-349, 1962.8 Meares, P. The Permeability of Charged Membranes. Ussing, H.H. and Thorn,
N.A. Copenhagen: Munksgaard. :51-67, 1973.9 Meares, P. Transport in ion exchange membranes. In: Synthetic Membranes:
Science, Engineering and Applications, edited by Bungay, P.M.D. ReidelPublishing Company, 1986, p. 169-179.
10 Tugas, I., Pourcelly, G., and Gavach, C. Electrotransport of protons and chlorineions in anion exchange membranes for the recovery of acids. Part I. Equilibriumproperties. Journal of membrane Science 85:183-184, 1993.
11 Tugas, I., Lambert, J.M., Maillols, J., Bribes, J.L., Pourcelly, G., and Gavach, C.Indentification of the ionic species in anion exchange membranes equilibratedwith sulphuric acid solutions by means of Raman spectroscopy and radiotracers.J.Membr.Sci. 78:25-33, 1993.
12 Pintauro, P.N. and Bennion, D.N. Mass Transport of Electrolytes in membranes.2. Determination of NaCl Equilibrium and Transport Parameters for Nafion. Ind.Eng. Chem. Fundam. 23:234-243, 1984.