Embed Size (px)
Citation preview
2 Energy
2.1 Introduction
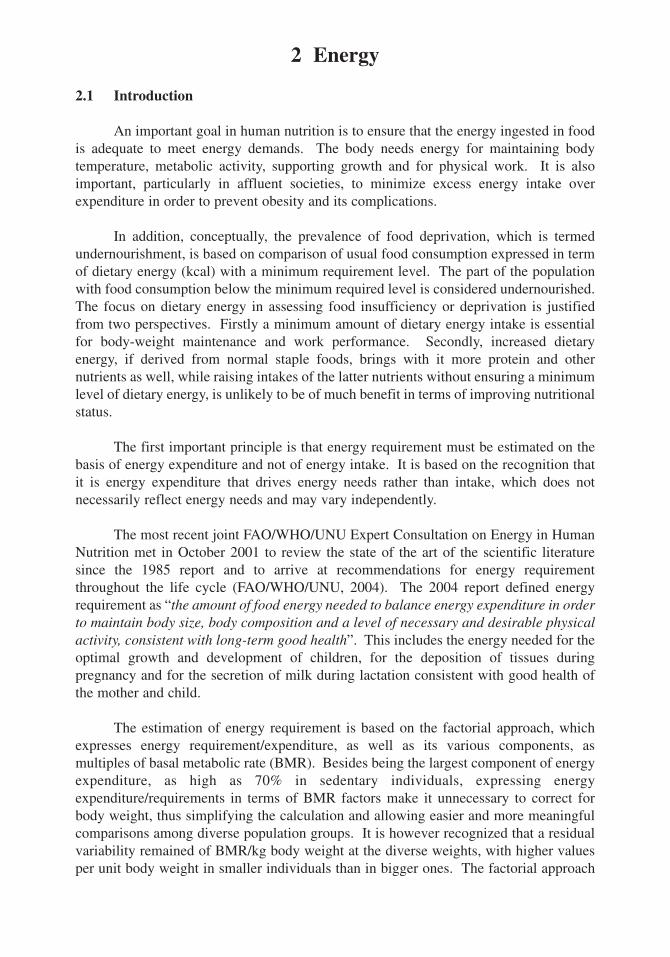
An important goal in human nutrition is to ensure that the energy ingested in foodis adequate to meet energy demands. The body needs energy for maintaining bodytemperature, metabolic activity, supporting growth and for physical work. It is alsoimportant, particularly in affluent societies, to minimize excess energy intake overexpenditure in order to prevent obesity and its complications.
In addition, conceptually, the prevalence of food deprivation, which is termedundernourishment, is based on comparison of usual food consumption expressed in termof dietary energy (kcal) with a minimum requirement level. The part of the populationwith food consumption below the minimum required level is considered undernourished.The focus on dietary energy in assessing food insufficiency or deprivation is justifiedfrom two perspectives. Firstly a minimum amount of dietary energy intake is essentialfor body-weight maintenance and work performance. Secondly, increased dietaryenergy, if derived from normal staple foods, brings with it more protein and othernutrients as well, while raising intakes of the latter nutrients without ensuring a minimumlevel of dietary energy, is unlikely to be of much benefit in terms of improving nutritionalstatus.
The first important principle is that energy requirement must be estimated on thebasis of energy expenditure and not of energy intake. It is based on the recognition thatit is energy expenditure that drives energy needs rather than intake, which does notnecessarily reflect energy needs and may vary independently.
The most recent joint FAO/WHO/UNU Expert Consultation on Energy in HumanNutrition met in October 2001 to review the state of the art of the scientific literaturesince the 1985 report and to arrive at recommendations for energy requirementthroughout the life cycle (FAO/WHO/UNU, 2004). The 2004 report defined energyrequirement as “the amount of food energy needed to balance energy expenditure in orderto maintain body size, body composition and a level of necessary and desirable physicalactivity, consistent with long-term good health”. This includes the energy needed for theoptimal growth and development of children, for the deposition of tissues duringpregnancy and for the secretion of milk during lactation consistent with good health ofthe mother and child.
The estimation of energy requirement is based on the factorial approach, whichexpresses energy requirement/expenditure, as well as its various components, asmultiples of basal metabolic rate (BMR). Besides being the largest component of energyexpenditure, as high as 70% in sedentary individuals, expressing energyexpenditure/requirements in terms of BMR factors make it unnecessary to correct forbody weight, thus simplifying the calculation and allowing easier and more meaningfulcomparisons among diverse population groups. It is however recognized that a residualvariability remained of BMR/kg body weight at the diverse weights, with higher valuesper unit body weight in smaller individuals than in bigger ones. The factorial approach
consists of the summation of various activities representing the energy expenses, such asthe costs of the diverse types of physical activity, the extra energy allocated for pregnancyand lactation and the energy cost of growth.
2.3 Principles of energy balance and energy requirements
Principles of energy balance
The standard unit of energy is the joule and human energetics are usuallyexpressed in term of kilojoules (i.e. joules x 1000). A megajoule (MJ) is 1000 kJ. Onekcalorie or Calorie = 4.184 kJ. It is a fundamental principle of thermodynamics thatenergy cannot ‘disappear’. Food energy eaten has to be either excreted in the faeces, orabsorbed by the body. Once absorbed, a small amount of energy is excreted in the urineas the by-product of protein metabolism and the rest of the absorbed fuel has to bemetabolized for energy or stored in the tissue as protein, fat or as carbohydrate in the formof glycogen. Metabolized energy supports the making of new chemical compoundswithin the body, fuels the muscular activity required to breathe, digest food and maintainbody posture, and also provides the energy for physical activity (James & Schofield,1990).
Principles of energy requirements
Energy needs are determined by energy expenditure. Therefore, in principle,estimates of requirements should be based on measurements of energy expenditure.Components of energy expenditure include basal metabolic rate, physical activity,metabolic cost of food and metabolic cost of growth.
Basal metabolic rate
Physiologically, BMR is defined as the lowest rate of energy exchange in the body,which is related to the organization of bodily functions and production of body heat.Technically, it is defined as the rate of energy expenditure of a fasted and fully-restedindividual in a thermoneutral environment or can simply be defined as the minimal rateof energy expenditure compatible with life.
Since basal metabolic rate (BMR) is the largest component of energy expenditure,it has been adopted by the FAO/WHO/UNU Expert Committee 1981 as the basis forcalculating all components of total energy expenditure. To obtain the total requirement,the estimate of BMR is multiplied by a factor that covers the energy cost of increasedmuscle tone, physical activity, the thermic effect of food, and where relevant, the energyrequirements for growth and lactation (FAO/WHO/UNU,1985).
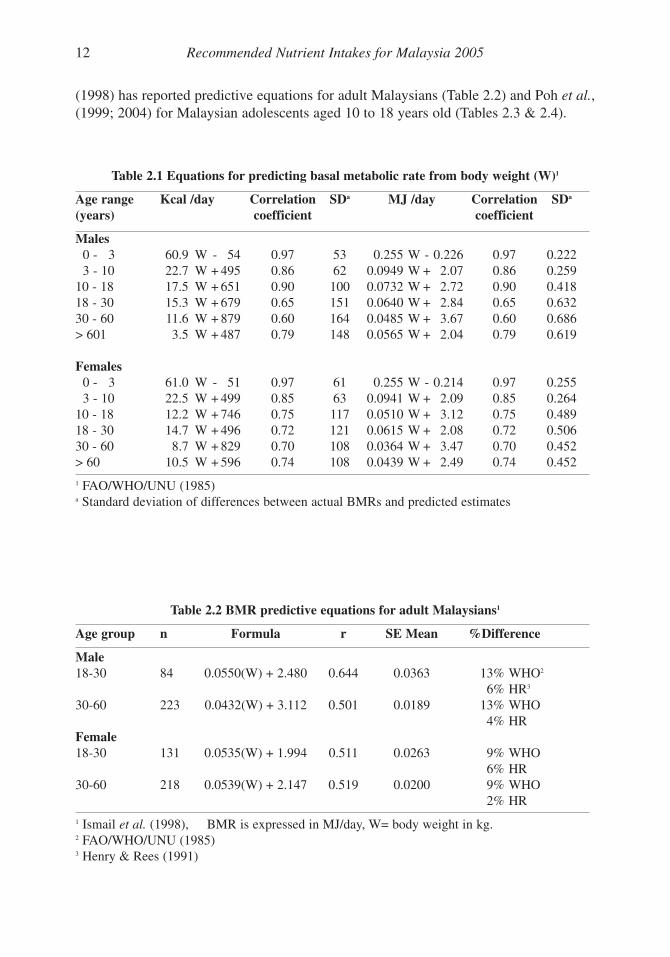
The FAO/WHO/UNU (2004) report adopted the equations for predicting BMRfrom body weight as reported in the 1985 report, presented in Table 2.1. Ismail et al.,
11Energy
12 Recommended Nutrient Intakes for Malaysia 2005
Table 2.1 Equations for predicting basal metabolic rate from body weight (W)1
Age range Kcal /day Correlation SDa MJ /day Correlation SDa
(years) coefficient coefficient
Males0 - 3 60.9 W - 54 0.97 53 0.255 W - 0.226 0.97 0.2223 - 10 22.7 W + 495 0.86 62 0.0949 W + 2.07 0.86 0.259
10 - 18 17.5 W + 651 0.90 100 0.0732 W + 2.72 0.90 0.41818 - 30 15.3 W + 679 0.65 151 0.0640 W + 2.84 0.65 0.63230 - 60 11.6 W + 879 0.60 164 0.0485 W + 3.67 0.60 0.686> 601 3.5 W + 487 0.79 148 0.0565 W + 2.04 0.79 0.619
Females0 - 3 61.0 W - 51 0.97 61 0.255 W - 0.214 0.97 0.2553 - 10 22.5 W + 499 0.85 63 0.0941 W + 2.09 0.85 0.264
10 - 18 12.2 W + 746 0.75 117 0.0510 W + 3.12 0.75 0.48918 - 30 14.7 W + 496 0.72 121 0.0615 W + 2.08 0.72 0.50630 - 60 8.7 W + 829 0.70 108 0.0364 W + 3.47 0.70 0.452> 60 10.5 W + 596 0.74 108 0.0439 W + 2.49 0.74 0.452
1 FAO/WHO/UNU (1985)a Standard deviation of differences between actual BMRs and predicted estimates
Table 2.2 BMR predictive equations for adult Malaysians1
Age group n Formula r SE Mean %Difference
Male18-30 84 0.0550(W) + 2.480 0.644 0.0363 13% WHO2
6% HR3
30-60 223 0.0432(W) + 3.112 0.501 0.0189 13% WHO4% HR
Female18-30 131 0.0535(W) + 1.994 0.511 0.0263 9% WHO
6% HR30-60 218 0.0539(W) + 2.147 0.519 0.0200 9% WHO
2% HR
1 Ismail et al. (1998), BMR is expressed in MJ/day, W= body weight in kg.2 FAO/WHO/UNU (1985)3 Henry & Rees (1991)
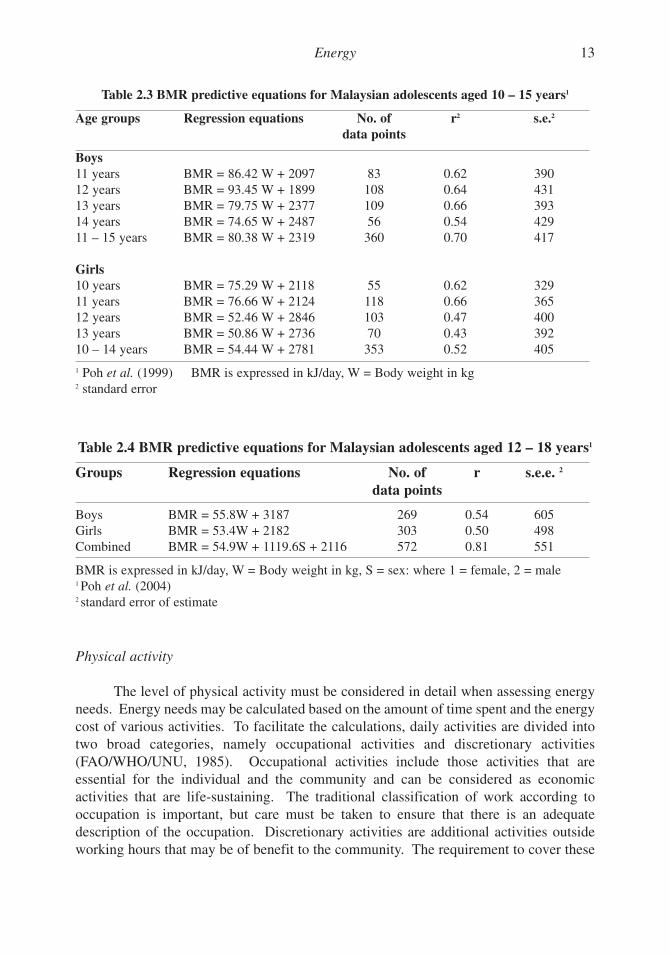
(1998) has reported predictive equations for adult Malaysians (Table 2.2) and Poh et al.,(1999; 2004) for Malaysian adolescents aged 10 to 18 years old (Tables 2.3 & 2.4).
13Energy
Table 2.3 BMR predictive equations for Malaysian adolescents aged 10 – 15 years1
Age groups Regression equations No. of r2 s.e.2
data points
Boys11 years BMR = 86.42 W + 2097 83 0.62 39012 years BMR = 93.45 W + 1899 108 0.64 43113 years BMR = 79.75 W + 2377 109 0.66 39314 years BMR = 74.65 W + 2487 56 0.54 42911 – 15 years BMR = 80.38 W + 2319 360 0.70 417
Girls10 years BMR = 75.29 W + 2118 55 0.62 32911 years BMR = 76.66 W + 2124 118 0.66 36512 years BMR = 52.46 W + 2846 103 0.47 40013 years BMR = 50.86 W + 2736 70 0.43 39210 – 14 years BMR = 54.44 W + 2781 353 0.52 405
1 Poh et al. (1999) BMR is expressed in kJ/day, W = Body weight in kg2 standard error
Table 2.4 BMR predictive equations for Malaysian adolescents aged 12 – 18 years1
Groups Regression equations No. of r s.e.e. 2
data points
Boys BMR = 55.8W + 3187 269 0.54 605Girls BMR = 53.4W + 2182 303 0.50 498Combined BMR = 54.9W + 1119.6S + 2116 572 0.81 551
BMR is expressed in kJ/day, W = Body weight in kg, S = sex: where 1 = female, 2 = male1 Poh et al. (2004)2 standard error of estimate
Physical activity
The level of physical activity must be considered in detail when assessing energyneeds. Energy needs may be calculated based on the amount of time spent and the energycost of various activities. To facilitate the calculations, daily activities are divided intotwo broad categories, namely occupational activities and discretionary activities(FAO/WHO/UNU, 1985). Occupational activities include those activities that areessential for the individual and the community and can be considered as economicactivities that are life-sustaining. The traditional classification of work according tooccupation is important, but care must be taken to ensure that there is an adequatedescription of the occupation. Discretionary activities are additional activities outsideworking hours that may be of benefit to the community. The requirement to cover these
activities should not be considered as dispensable, since it usually contributes to thephysical and intellectual well-being of the individual, household or group.
The FAO/WHO/UNU (2004) consultation endorsed the proposition thatrecommendations for dietary energy intake must be accompanied by recommendationsfor an appropriate level of habitual physical activity.
Metabolic response to food
The increased oxygen uptake after a meal depends on the nutrient composition ofthe food consumed and the amount of energy ingested. The measurement of the energycost of digesting, absorbing and storing ingested nutrients is not easy. It is difficult toseparate the energy expended in excess of the basal rate after eating a meal, from theenergy cost of the physical activity involved in sitting, eating and digesting(FAO/WHO/UNU, 1985).
Growth
The energy cost of growth includes two components: the energy value of the tissueor product formed and the energy cost of synthesizing it. Although the energyrequirement for growth relative to maintenance is small, except for the first months oflife, satisfactory growth is a sensitive indicator of whether needs are being met. Todetermine the energy cost of growth, the energetics of growth must be understood andsatisfactory growth velocities must be defined. Except in the case of young infants andduring lactation, the estimates of energy cost are not very critical, since human growth isa slow process, taking up a small proportion of the energy requirement(FAO/WHO/UNU, 1985).
2.4 Energy deficiencies and excesses
Inadequate energy intake
By comparing the distribution of dietary energy supply (DES) with per caputenergy requirements in different countries, two types of food inadequacy measures areprovided, namely the prevalence and the intensity of food inadequacy. The prevalencemeasure is concerned with the proportion and number of people who have inadequateaccess to food, i.e. whose access falls short of a specified cut-off point while the estimatesof intensity, is to assess by how far access to food falls short of requirement (FAO, 1996).
Energy deficiency can be acute or chronic. Acute energy deficiency (AED) is bynature “episodic”, and characterized by a state of negative energy balance, in which theenergy expenditure is greater than energy intake. Under these conditions, there is aprogressive loss of body weight, along with changes in the pattern of energy expenditure,in an attempt by the body to achieve a new but lower plane of energy equilibrium. If the
14 Recommended Nutrient Intakes for Malaysia 2005
energy deficiency persists, further weight loss occurs along with deterioration in healthultimately leading to death.
On the other hand, chronic energy deficiency (CED) is a “steady state”, due toinadequate food energy over a lifetime. Individuals with CED could be in energy balance,although their anthropometric parameters, may be less than desirable. This state isachieved by the presence of low body weight and fat stores, but the individual’s health isnormal and the body’s physiological function is not compromised to the extent that theindividual is unable to lead an economically productive life. There is good evidence toshow that individuals with CED are less productive and that the CED state is associatedwith higher morbidity and mortality. In addition, the steady state referred to above mustbe appreciated as a theoretical one, subject to periodic fluctuations of physiological andenvironment, such as the menstrual cycle and seasons. A high incidence of LBW babieshas been reported in mothers with low pre-pregnant BMI. Milder energy-nutrientdeficiency leads to stunting, and is also associated with several functional and behavioralconsequences. From a population viewpoint, it is CED that is important to prevent andaddress.
Excess energy intake
Excessive energy intake and positive energy balance are conditioned by adequateavailability of food energy and a sedentary lifestyle, accompanied by marketing strategieswhich stimulate over-consumption of highly palatable energy dense foods. Developmentin many societies in transition is associated with the adoption of a “western” lifestyle.This process is shifting the nutrition related disease burden away from under-nutritionand towards death and disability related to energy excess and positive energy balance.Social factors such as income, education, access to information and cultural beliefs,biological factors associated to a genetic predisposition and metabolic changes associatedto diet and physical activity are the main conditioning factors linked to the risingprevalence of positive energy balance and excessive energy stores. The non-fatal butdebilitating health problems associated with chronic energy excess and obesity includerespiratory difficulties, chronic muscle-skeletal problems, skin problems and infertility.The more life-threatening, chronic health problems fall into four main areas: (a) conditionassociated with insulin resistance, namely Non-Insulin Dependent Diabetes Mellitus(NIDDM), (b) cardiovascular problems including hypertension, stroke and coronaryheart disease, (c) certain types of cancers mainly the hormonal-related and large bowelcancers, and (d) gallbladder disease.
2.5 Sources of dietary energy
Energy for metabolic and physiological functions of humans is derived from thechemical energy bound in food carbohydrates, fats, proteins and alcohol, which act assubstrates or fuels. Each of these macronutrients has numerous sub-types with specificattributes in terms of energy delivery and potential health effects. The gross and
15Energy
16 Recommended Nutrient Intakes for Malaysia 2005
metabolizable energy contents of the macronutrients in their natural forms are wellestablished. The sources of energy is carbohydrates, fat and protein with physiologicalfuel values of 4, 9, 4 kcal/g (16.7kJ, 37.7kJ, 16.7kJ/g), respectively. Ethanol has a caloricvalue of 7kcal/g (29.3kJ/g). The energy value of a food or diet is calculated by applyingthese factors to the amount of substrates determined by chemical analysis, or estimatedfrom appropriate food composition tables (FAO/WHO/UNU, 2004).
The Joint WHO/FAO Expert Consultation on diet, nutrition and the prevention ofchronic diseases (WHO, 2003) recommends that contribution of macronutrients to totaldaily energy intake should be within these ranges: total carbohydrate 55 – 75%, total fat15 – 30% and protein 10 – 15%. The Technical Subcommittee on Energy andMacronutrients decided to adopt the WHO (2003) recommendation with slightmodifications. The TSC recommends that total carbohydrate should contribute 55 – 70%,total fat 20 – 30%, and protein 10 – 15% to total daily energy intake for the Malaysianadult population.
2.6 Factors affecting energy requirement
In view of the fact that energy requirement is determined from energy expenditure,it is therefore affected by the factors that affect basal metabolic rate and physical activity,which are the major components of energy expenditure. The FAO/WHO/UNU (1985)report has provided details of these factors.
Age
The most important component of energy expenditure, the basal metabolic rate,depends on the mass of metabolically active tissue in the body, the proportion of eachtissue in the body, and the contribution of each tissue to the energy metabolism of thewhole body. The changes in body composition with age, therefore, markedly affectenergy requirements, since some organs of the body are much more metabolically activethan others. These changes in body composition in children and adults have to be takeninto account when calculating the energy requirement of a particular section of thepopulation. There are also altered activity patterns with age. Children becomeprogressively more active once they are able to crawl or walk while the physical activitypattern of adults are usually dominated by the nature of their work.
Gender
Men have a relatively greater muscle mass than women, which would tend toreduce their BMR when expressed in terms of lean body mass, since muscle has a lowmetabolic rate. However, the greater body fat content of women means that the observedBMR per unit total body weight is somewhat lower in women. The energy demand forphysical activity will often depend on the different types of employment for men andwomen. In children, basal energy expenditure on a weight basis differs little between pre-adolescent boys and girls, but since there are differences in body weight and composition
from the first few months of life, and different physical demands is made on boys andgirls, their energy requirements are considered separately.
Individual variations
In any assessment of the average requirement, both intra- and inter-individualvariability must be recognized. The former results from short-term fluctuations in energyintake and expenditure. It has been suggested that within individual variations in intakesare more important than between-individual variations, and that the observed inter-individual variations can largely be explained in terms of the intra-individual variations.However, later evidence supports the conclusion that within-subject variations in BMRare small and insignificant, even when energy intake and physical activity areuncontrolled. It is also generally recognized that in a group of apparently comparablepeople, there is much inter-individual variation in habitual energy expenditure.
Population variations
The differences in BMR between populations of the world are equivocal. Somestudies showed 8-10% lower in the tropics while others suggested no difference in BMRbetween Indians and Europeans provided the subjects were well nourished. Otherevidence suggest that the relationship between BMR and standard independent variablessuch as age, sex and body size may vary among populations including seasonal variationsin BMR corresponding with diet and/or temperature changes.
2.7 Setting requirements and recommended intakes of energy
The proposed recommended energy intake for Malaysia is based on the 2004Interim Report on Human Energy Requirements. Although the basic principles set forthin the 1985 report have withstood the test of time, several modifications were proposedin the FAO/WHO/UNU 2004 report. The IOM (2002) report on Dietary ReferenceIntakes for Energy was also used as a reference by the Technical Sub-Committee (TSC)on Energy and Macronutrients. The energy intakes recommended by the TSC for eachgroup are given below in bold and summarised in Appendix 2.1.
Infants
Whitehead, Paul & Cole (1981) compiled energy intakes of infants from theliterature between 1940 up to 1980. These data were later used by the FAO/WHO/UNU1985 consultation to estimate energy requirement of infant set at 5% higher than observedintakes to compensate for underestimation of intake.
Since the 1980’s, even though information on the BMR of infants were available,to estimate requirements from multiples of BMR was not appropriate because reasonableallowance for physical activity were undefined. The FAO/WHO/UNU 1985
17Energy
recommendations were 9 – 39% higher than those reported by Butte (1996). Thesediscrepancies are not trivial and could lead to overfeeding of infants. The currentrecommendations therefore adopted the FAO/WHO/UNU (2004) principles as discussedbelow.
The principle of calculating energy requirements from total energy expenditure(TEE) plus the energy needs for growth applies to infants and children of all ages. TEEhad been shown to have good linear relationship with body weight (Butte et al., 2000),and the predictive equation for infants is as follows:
TEE (MJ/d) = - 0.416 + 0.371W (kg)
Energy needs for growth have two components; namely (i) the energy used tosynthesize growing tissues, and (ii) the energy deposited in those tissues. Hence, energyrequirements in infancy can be calculated by adding the energy deposited in growingtissues to TEE.
Energy requirement for infantsBoys 0 – 5 months 560 kcal/day or 2.34 MJ/day
6 – 11 months 640 kcal/day or 2.68 MJ/day
Girls 0 – 5 months 550 kcal/day or 2.30 MJ/day6 – 11 months 630 kcal/day or 2.64 MJ/day
Children and adolescents
There was very little information available in 1981 on total energy expenditure(TEE) of children. The paucity of information on time allocated to different activities andenergy cost of such activities, did not allow reliable estimates of TEE in children below10 years of age. Consequently, estimates of energy requirements for 1-10 years old werederived from a review of published dietary intake data involving some 6,500 children,mostly from developed countries (Ferro-Luzzi & Durnin, 1981). The FAO/WHO/UNU1985 Consultation felt the need to increase the reported energy intake by 5% toaccommodate a desirable level of physical activity.
The estimation of energy requirements, after 10 years of age, is based on energyexpenditure expressed as multiples of BMR rather than energy intake data. BMR for boysand girls of a given age and weight were predicted with the mathematical equationsderived by Schofield, Schofield & James (1985). The additional energy expended duringthe day was calculated based on the assumed energy cost of activities performed by thechildren and adolescents in developing countries. Extra allowance for growth wasassumed to be 5.6 kcal (23.4 kJ) per gram of expected weight gain. This corresponds toabout 3%, of the daily energy requirement at 1 year of age, with a gradual decrease toabout 1% at 15 years (Torun et al., 1996).
18 Recommended Nutrient Intakes for Malaysia 2005
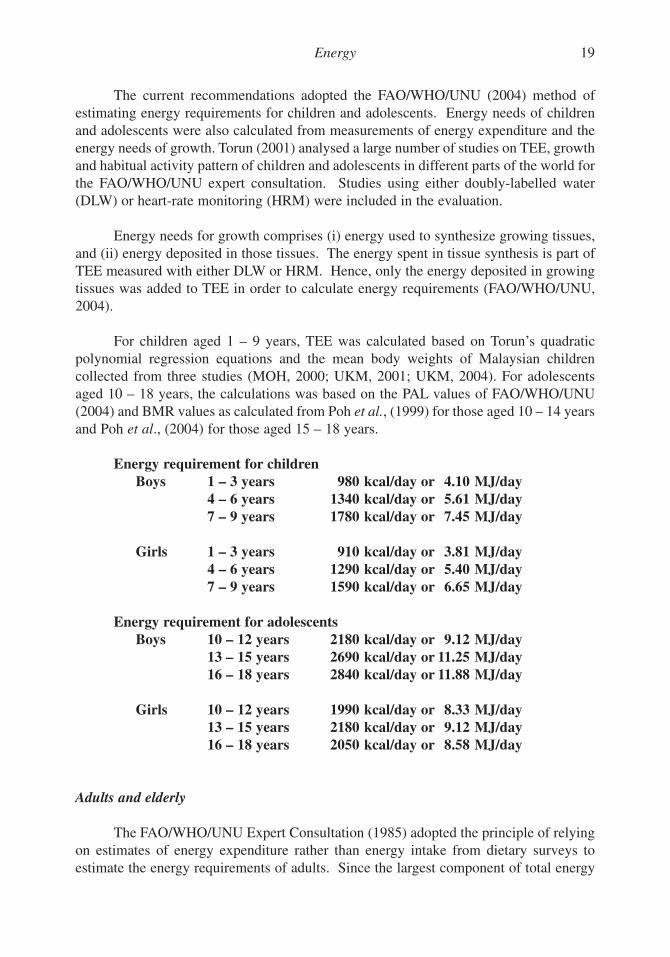
The current recommendations adopted the FAO/WHO/UNU (2004) method ofestimating energy requirements for children and adolescents. Energy needs of childrenand adolescents were also calculated from measurements of energy expenditure and theenergy needs of growth. Torun (2001) analysed a large number of studies on TEE, growthand habitual activity pattern of children and adolescents in different parts of the world forthe FAO/WHO/UNU expert consultation. Studies using either doubly-labelled water(DLW) or heart-rate monitoring (HRM) were included in the evaluation.
Energy needs for growth comprises (i) energy used to synthesize growing tissues,and (ii) energy deposited in those tissues. The energy spent in tissue synthesis is part ofTEE measured with either DLW or HRM. Hence, only the energy deposited in growingtissues was added to TEE in order to calculate energy requirements (FAO/WHO/UNU,2004).
For children aged 1 – 9 years, TEE was calculated based on Torun’s quadraticpolynomial regression equations and the mean body weights of Malaysian childrencollected from three studies (MOH, 2000; UKM, 2001; UKM, 2004). For adolescentsaged 10 – 18 years, the calculations was based on the PAL values of FAO/WHO/UNU(2004) and BMR values as calculated from Poh et al., (1999) for those aged 10 – 14 yearsand Poh et al., (2004) for those aged 15 – 18 years.
Energy requirement for childrenBoys 1 – 3 years 980 kcal/day or 4.10 MJ/day
4 – 6 years 1340 kcal/day or 5.61 MJ/day7 – 9 years 1780 kcal/day or 7.45 MJ/day
Girls 1 – 3 years 910 kcal/day or 3.81 MJ/day4 – 6 years 1290 kcal/day or 5.40 MJ/day7 – 9 years 1590 kcal/day or 6.65 MJ/day
Energy requirement for adolescentsBoys 10 – 12 years 2180 kcal/day or 9.12 MJ/day
13 – 15 years 2690 kcal/day or 11.25 MJ/day16 – 18 years 2840 kcal/day or 11.88 MJ/day
Girls 10 – 12 years 1990 kcal/day or 8.33 MJ/day13 – 15 years 2180 kcal/day or 9.12 MJ/day16 – 18 years 2050 kcal/day or 8.58 MJ/day
Adults and elderly
The FAO/WHO/UNU Expert Consultation (1985) adopted the principle of relyingon estimates of energy expenditure rather than energy intake from dietary surveys toestimate the energy requirements of adults. Since the largest component of total energy
19Energy
expenditure (TEE) is the BMR, which can be measured with accuracy under standardisedconditions, the 1985 Report adopted in principle for the sake of simplicity, allcomponents of TEE as multiples of BMR also known as PAL approach. Besides BMR,other components of energy expenditure such as occupational activities, discretionaryactivities and residual time have been identified and evaluated to derive total energyrequirements.
The FAO/WHO/UNU (2004) preserved the 1985 Expert Consultation’s principleof using estimates of energy expenditure to estimate the energy requirements of adults.The use of techniques such as DLW and HRM confirmed the large diversity of TEEamong adults, and hence of energy requirements, previously reported by time-motionstudies. Growth is no longer an energy-demanding factor in adulthood, and BMR isrelatively constant among population groups of a given age and gender. Consequently,habitual physical activity and body weight are the main determinants for the diversity inenergy requirements of adult populations with different lifestyles.
TEE was estimated though factorial estimation that combined the time allocated tohabitual activities, and the energy cost of those activities. To account for differences inbody size and composition, the energy cost of activities was calculated as a multiple ofBMR per minute, or physical activity ratio (PAR), and the 24-hour requirement wasexpressed as a multiple of BMR per 24 hours, by using the physical activity level (PAL)value. Energy requirements are calculated by multiplying the PAL value by the energyequivalent of the corresponding BMR.
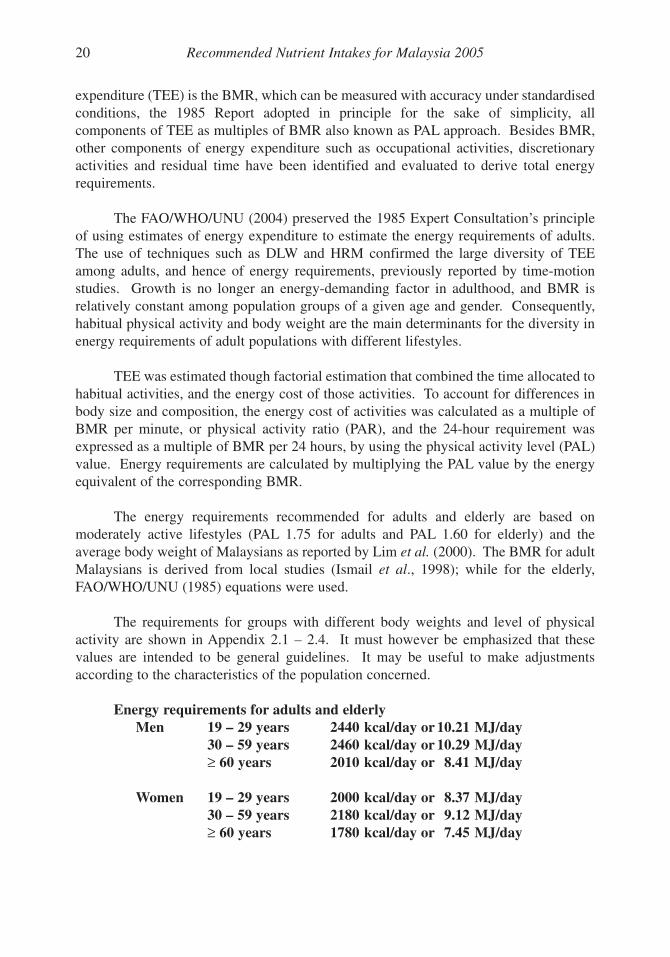
The energy requirements recommended for adults and elderly are based onmoderately active lifestyles (PAL 1.75 for adults and PAL 1.60 for elderly) and theaverage body weight of Malaysians as reported by Lim et al. (2000). The BMR for adultMalaysians is derived from local studies (Ismail et al., 1998); while for the elderly,FAO/WHO/UNU (1985) equations were used.
The requirements for groups with different body weights and level of physicalactivity are shown in Appendix 2.1 – 2.4. It must however be emphasized that thesevalues are intended to be general guidelines. It may be useful to make adjustmentsaccording to the characteristics of the population concerned.
Energy requirements for adults and elderly Men 19 – 29 years 2440 kcal/day or 10.21 MJ/day
30 – 59 years 2460 kcal/day or 10.29 MJ/day≥ 60 years 2010 kcal/day or 8.41 MJ/day
Women 19 – 29 years 2000 kcal/day or 8.37 MJ/day30 – 59 years 2180 kcal/day or 9.12 MJ/day≥ 60 years 1780 kcal/day or 7.45 MJ/day
20 Recommended Nutrient Intakes for Malaysia 2005
Pregnancy
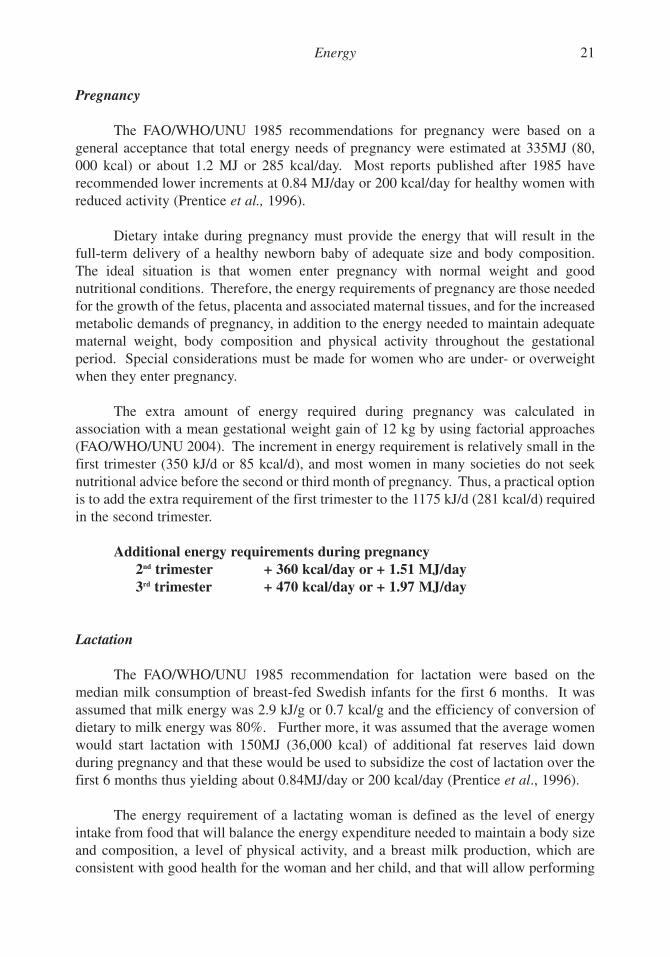
The FAO/WHO/UNU 1985 recommendations for pregnancy were based on ageneral acceptance that total energy needs of pregnancy were estimated at 335MJ (80,000 kcal) or about 1.2 MJ or 285 kcal/day. Most reports published after 1985 haverecommended lower increments at 0.84 MJ/day or 200 kcal/day for healthy women withreduced activity (Prentice et al., 1996).
Dietary intake during pregnancy must provide the energy that will result in thefull-term delivery of a healthy newborn baby of adequate size and body composition.The ideal situation is that women enter pregnancy with normal weight and goodnutritional conditions. Therefore, the energy requirements of pregnancy are those neededfor the growth of the fetus, placenta and associated maternal tissues, and for the increasedmetabolic demands of pregnancy, in addition to the energy needed to maintain adequatematernal weight, body composition and physical activity throughout the gestationalperiod. Special considerations must be made for women who are under- or overweightwhen they enter pregnancy.
The extra amount of energy required during pregnancy was calculated inassociation with a mean gestational weight gain of 12 kg by using factorial approaches(FAO/WHO/UNU 2004). The increment in energy requirement is relatively small in thefirst trimester (350 kJ/d or 85 kcal/d), and most women in many societies do not seeknutritional advice before the second or third month of pregnancy. Thus, a practical optionis to add the extra requirement of the first trimester to the 1175 kJ/d (281 kcal/d) requiredin the second trimester.
Additional energy requirements during pregnancy2nd trimester + 360 kcal/day or + 1.51 MJ/day3rd trimester + 470 kcal/day or + 1.97 MJ/day
Lactation
The FAO/WHO/UNU 1985 recommendation for lactation were based on themedian milk consumption of breast-fed Swedish infants for the first 6 months. It wasassumed that milk energy was 2.9 kJ/g or 0.7 kcal/g and the efficiency of conversion ofdietary to milk energy was 80%. Further more, it was assumed that the average womenwould start lactation with 150MJ (36,000 kcal) of additional fat reserves laid downduring pregnancy and that these would be used to subsidize the cost of lactation over thefirst 6 months thus yielding about 0.84MJ/day or 200 kcal/day (Prentice et al., 1996).
The energy requirement of a lactating woman is defined as the level of energyintake from food that will balance the energy expenditure needed to maintain a body sizeand composition, a level of physical activity, and a breast milk production, which areconsistent with good health for the woman and her child, and that will allow performing
21Energy
economically necessary and socially desirable activities. To operationalise thisdefinition, the energy needed to produce an appropriate volume of milk must be added tothe woman’s habitual energy requirement, assuming that she resumes her usual level ofphysical activity soon after giving birth. The energy cost of lactation is determined bythe amount of milk that is produced and secreted, its energy content, and the efficiencywith which dietary energy is converted to milk energy.
Postpartum loss of body weight is usually highest in the first three months, andgenerally greater among women who practice exclusive breastfeeding, but the extent towhich energy immobilized to support lactation depends on the gestational weight gainand the nutritional status of the mother. Thus, the recommendations for lactating womento a large part depend on the women’s nutritional status.
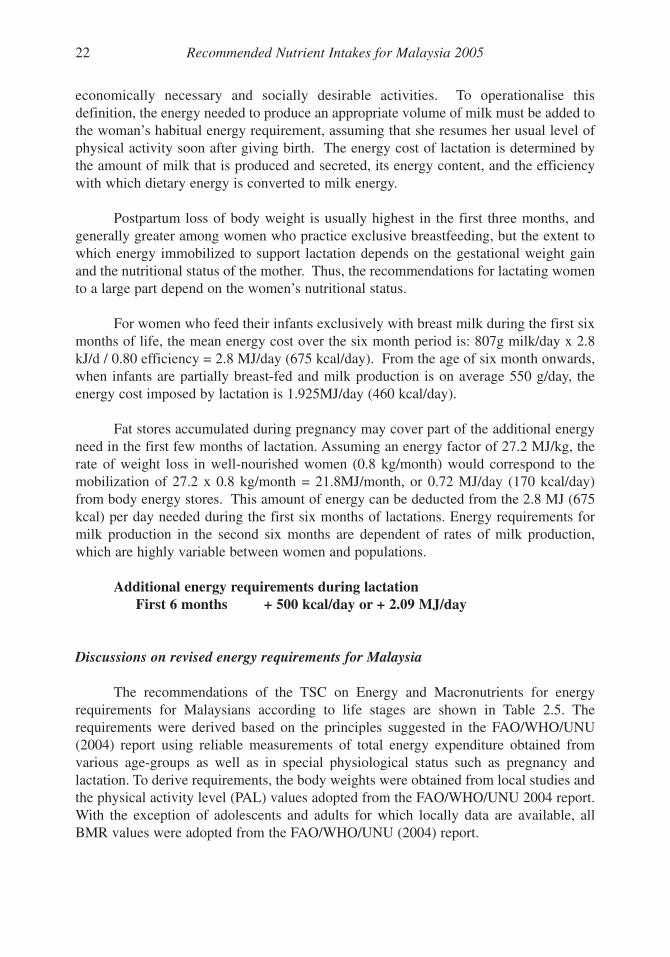
For women who feed their infants exclusively with breast milk during the first sixmonths of life, the mean energy cost over the six month period is: 807g milk/day x 2.8kJ/d / 0.80 efficiency = 2.8 MJ/day (675 kcal/day). From the age of six month onwards,when infants are partially breast-fed and milk production is on average 550 g/day, theenergy cost imposed by lactation is 1.925MJ/day (460 kcal/day).
Fat stores accumulated during pregnancy may cover part of the additional energyneed in the first few months of lactation. Assuming an energy factor of 27.2 MJ/kg, therate of weight loss in well-nourished women (0.8 kg/month) would correspond to themobilization of 27.2 x 0.8 kg/month = 21.8MJ/month, or 0.72 MJ/day (170 kcal/day)from body energy stores. This amount of energy can be deducted from the 2.8 MJ (675kcal) per day needed during the first six months of lactations. Energy requirements formilk production in the second six months are dependent of rates of milk production,which are highly variable between women and populations.
Additional energy requirements during lactationFirst 6 months + 500 kcal/day or + 2.09 MJ/day
Discussions on revised energy requirements for Malaysia
The recommendations of the TSC on Energy and Macronutrients for energyrequirements for Malaysians according to life stages are shown in Table 2.5. Therequirements were derived based on the principles suggested in the FAO/WHO/UNU(2004) report using reliable measurements of total energy expenditure obtained fromvarious age-groups as well as in special physiological status such as pregnancy andlactation. To derive requirements, the body weights were obtained from local studies andthe physical activity level (PAL) values adopted from the FAO/WHO/UNU 2004 report.With the exception of adolescents and adults for which locally data are available, allBMR values were adopted from the FAO/WHO/UNU (2004) report.
22 Recommended Nutrient Intakes for Malaysia 2005
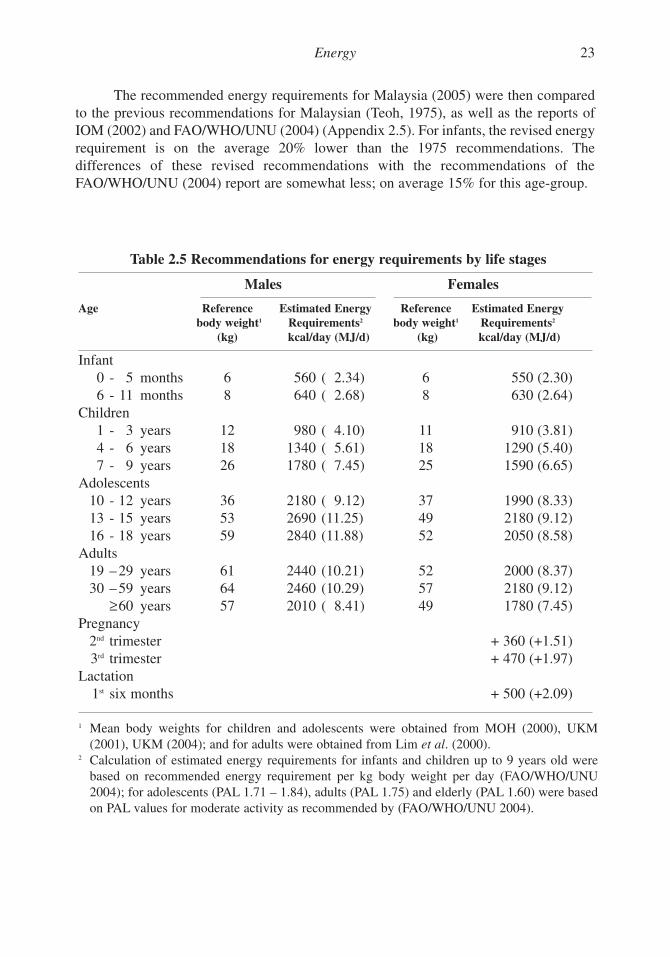
The recommended energy requirements for Malaysia (2005) were then comparedto the previous recommendations for Malaysian (Teoh, 1975), as well as the reports ofIOM (2002) and FAO/WHO/UNU (2004) (Appendix 2.5). For infants, the revised energyrequirement is on the average 20% lower than the 1975 recommendations. Thedifferences of these revised recommendations with the recommendations of theFAO/WHO/UNU (2004) report are somewhat less; on average 15% for this age-group.
23Energy
Table 2.5 Recommendations for energy requirements by life stages
Males Females
Age Reference Estimated Energy Reference Estimated Energybody weight1 Requirements2 body weight1 Requirements2
(kg) kcal/day (MJ/d) (kg) kcal/day (MJ/d)
Infant 0 - 5 months 6 560 ( 2.34) 6 550 (2.30)6 - 11 months 8 640 ( 2.68) 8 630 (2.64)
Children1 - 3 years 12 980 ( 4.10) 11 910 (3.81)4 - 6 years 18 1340 ( 5.61) 18 1290 (5.40)7 - 9 years 26 1780 ( 7.45) 25 1590 (6.65)
Adolescents10 - 12 years 36 2180 ( 9.12) 37 1990 (8.33)13 - 15 years 53 2690 (11.25) 49 2180 (9.12)16 - 18 years 59 2840 (11.88) 52 2050 (8.58)
Adults19 – 29 years 61 2440 (10.21) 52 2000 (8.37)30 – 59 years 64 2460 (10.29) 57 2180 (9.12)
≥60 years 57 2010 ( 8.41) 49 1780 (7.45)Pregnancy
2nd trimester + 360 (+1.51)3rd trimester + 470 (+1.97)
Lactation1st six months + 500 (+2.09)
1 Mean body weights for children and adolescents were obtained from MOH (2000), UKM(2001), UKM (2004); and for adults were obtained from Lim et al. (2000).
2 Calculation of estimated energy requirements for infants and children up to 9 years old werebased on recommended energy requirement per kg body weight per day (FAO/WHO/UNU2004); for adolescents (PAL 1.71 – 1.84), adults (PAL 1.75) and elderly (PAL 1.60) were basedon PAL values for moderate activity as recommended by (FAO/WHO/UNU 2004).
For children and adolescents, the revised energy requirements are on an average22% lower for boys and 26% lower for girls under 12 years old compared to Teoh (1975).From age 12 years onwards, the requirement for boys was on average 10% higher whilethe girls 2% lower. Among children, current recommendations was on average less than10% lower than the FAO/WHO/UNU (2004) report for both boys and girls. While foradolescents, the FAO/WHO/UNU (2004) report recommendations were 12% higher forboys and 14% higher for girls as compared to the current Malaysian recommendations.The differences observed may be expected since our requirements were based on bodyweights and BMRs of Malaysian children and adolescents.
For adults and the elderly, it is somewhat difficult to compare the values of the1975 and 2005 recommendations because age groups and body weights were different.Nevertheless, the current RNI generally recommends marginally lower requirements formen and the elderly.
As for pregnancy, in line with the FAO/WHO/UNU (2004) report, the revised RNIproposed no additional calories for the 1st trimester whereas the 1975 recommendationshad an additional energy requirement of 150 kcal. The additional energy requirement inthe revised RNI for the 2nd is only marginally higher than the Teoh (1975)recommendations. However for the 3rd trimester, the additional energy requirement in therevised RNI is 34% higher than the Teoh (1975) recommendations. For lactation up to 6months, the revised RNI proposed 9% less calories as compared to the 1975 report.
Several studies have revealed that most Malaysians maintained energy balance ona low intake while leading a sedentary lifestyle (Ismail et al., 2002). The increasing trendin over weight and obesity in urban and rural areas is a useful signal to revisit previousenergy recommendations. Adopting the revised RNI would mean that we need to doubleour efforts in encouraging all age groups to be physically active habitually, necessary tomatch the proposed requirements.
2.8 Research recommendations
The following priority areas of research are recommended:
• Critical re-assessment of all data available, particularly on the extent of intra andinter- individual variability.
• Studies to determine energy cost of different activities• Data on physical activity levels of different activities in all age groups.• More basal metabolic rate measurements using strict criteria in order to generate
predictive equations in all age groups, particularly in children under 10 years andin the above 60 years age groups.
• Use doubly-labelled water method to validate other conventional techniques inestimating energy expenditure particularly in children and adolescents.
24 Recommended Nutrient Intakes for Malaysia 2005
2.9 References
Butte NF (1996). Energy requirements of infants. Eur J Clin Nutr 50:S24-S36.
Butte NF, Wong WW, Hopkinson JM, Heinz CJ, Mehta NR & Smith EO (2000). Energyrequirements derived from total energy expenditure and energy deposition during thefirst 2 years of life. Am J Clin Nutr 72:1558-1569.
FAO (1996). The Sixth World Food Survey. Food and Agriculture Organisation, Rome.
FAO/WHO/UNU (1985). Expert Consultation on Energy and Protein Requirements.WHO Technical Report Series No. 724.
FAO/WHO/UNU (2004). Human Energy Requirements. Report of a JointFAO/WHO/UNU Expert Consultation. Food and Nutrition Technical Report Series,Food and Agriculture Organization, Rome.
Ferro-Luzzi A & Durnin JVGA (1981). The assessment of human energy intake andexpenditure: a critical review of the recent literature. Food and AgricultureOrganisation, Rome (Document ESN: FAO/WHO/UNU/EPR/81/9).
Henry CJK & Rees DG (1991). New predictive equations for the estimation of basalmetabolic rate in tropical people. Eur J Clin Nutr 45: 177-185.
IOM (2002). Dietary Reference Intakes for Energy, Carbohydrates, Fiber, Fat, Proteinand Amino Acids (Macronutrients). Food and Nutrition Board, Institute of Medicine.National Academy Press, Washington D.C. Chapter 5.
Ismail MN, Ng KK, Chee SS, Roslee R & Zawiah H (1998). Predictive equations for theestimation of basal metabolic rate in Malaysian adults. Mal J Nutr 4: 81-90.
Ismail MN, Chee SS, Nawawi H, Yussoff K, Lim TK & James WPT (2002). Obesity inMalaysia. Obesity Reviews 3(3):203-208.
James WPT & Schofield EC (1990). Human energy requirements. A manual for plannersand nutritionists. FAO and Oxford University Press; Oxford, UK.
Lim TO, Ding LM, Zaki M, Suleiman AB, Fatimah S, Siti S, Tahir A & Maimunah AH(2000). Distribution of body weight, height and body mass index in a national sampleof Malaysian adults. Med J Mal 55(1):108-128.
MOH. (2000). Nutritional status of children below six years in Malaysia. TechnicalReport for UNICEF sponsored Survey. Family Health Development Division,Ministry of Health Malaysia, Kuala Lumpur.
25Energy
26 Recommended Nutrient Intakes for Malaysia 2005
Poh BK, Ismail MN, Zawiah H & Henry CJK (1999). Predictive equations for theestimation of basal metabolic rate in Malaysian adolescents. Mal J Nutr 5: 1-14.
Poh BK, Ismail MN, Ong HF, Norimah AK & Safiah MY (2004). BMR predictiveequations for Malaysian adolescents aged 12 – 18 years. Final Report for IRPA 06-02-02-0096 Research Project. Department of Nutrition & Dietetics, Faculty of AlliedHealth Sciences, Universiti Kebangsaan Malaysia, Kuala Lumpur.
Prentice AM, Spaaij CJK, Goldberg GR, Poppitt SD, van Raaij JMA, Totton M, SwannD & Black AE (1996). Energy requirements of pregnant and lactating women. Eur JClin Nutr 50: S82-S111.
Schofield WN, Schofield C & James WPT (1985). Basal metabolic rate – review andprediction, together with an annotated bibliography of source materials. Hum Nutr:Clin Nutr 39C(Suppl. 1):5-96.
Teoh ST (1975). Recommended daily dietary intake for Peninsular Malaysia. Med J Mal30(1):38-42.
Torun B (2001). Energy requirements of children and adolescents. Background paperprepared for the joint FAO/WHO/UNU Expert Consultation on Energy in HumanNutrition.
Torun B, Davies PSW, Livingstone MBE, Paolisso M, Sackett R & Spurr GB (1996).Energy requirements and dietary energy recommendations for children andadolescents. 1 to 18 years old. Eur J Clin Nutr 50:S37-S81.
UKM (2001). Nutritional Status and Dietary Habits of Primary School Children inPeninsular Malaysia. Report for UKM-Nestle Research Project. Department ofNutrition & Dietetics, Faculty of Allied Health Sciences, Universiti KebangsaanMalaysia, Kuala Lumpur.
UKM (2004). Energy Requirements of Malaysian Adolescents. Final Report for IRPA 06-02-02-0096 Research Project. Department of Nutrition & Dietetics, Faculty of AlliedHealth Sciences, Universiti Kebangsaan Malaysia, Kuala Lumpur.
Whitehead RG, Paul AA & Cole TJ (1981). A critical analysis of measured food energyintakes during infancy and early childhood in comparison with current internationalrecommendations. J Hum Nutr 35:339-348.
27Energy
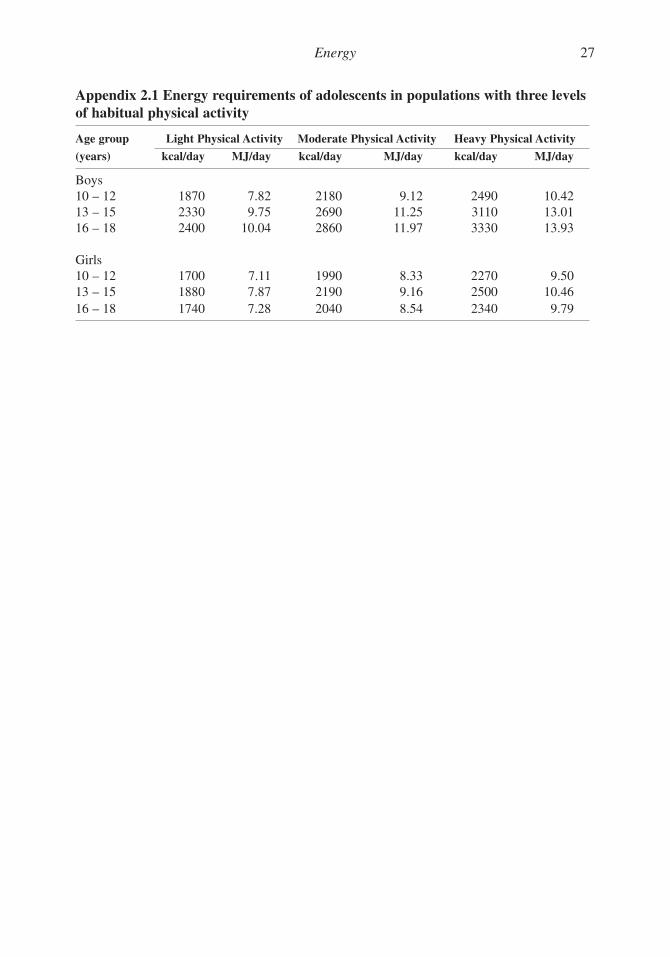
Appendix 2.1 Energy requirements of adolescents in populations with three levelsof habitual physical activity
Age group Light Physical Activity Moderate Physical Activity Heavy Physical Activity
(years) kcal/day MJ/day kcal/day MJ/day kcal/day MJ/day
Boys10 – 12 1870 7.82 2180 9.12 2490 10.4213 – 15 2330 9.75 2690 11.25 3110 13.0116 – 18 2400 10.04 2860 11.97 3330 13.93
Girls10 – 12 1700 7.11 1990 8.33 2270 9.5013 – 15 1880 7.87 2190 9.16 2500 10.4616 – 18 1740 7.28 2040 8.54 2340 9.79
28 Recommended Nutrient Intakes for Malaysia 2005
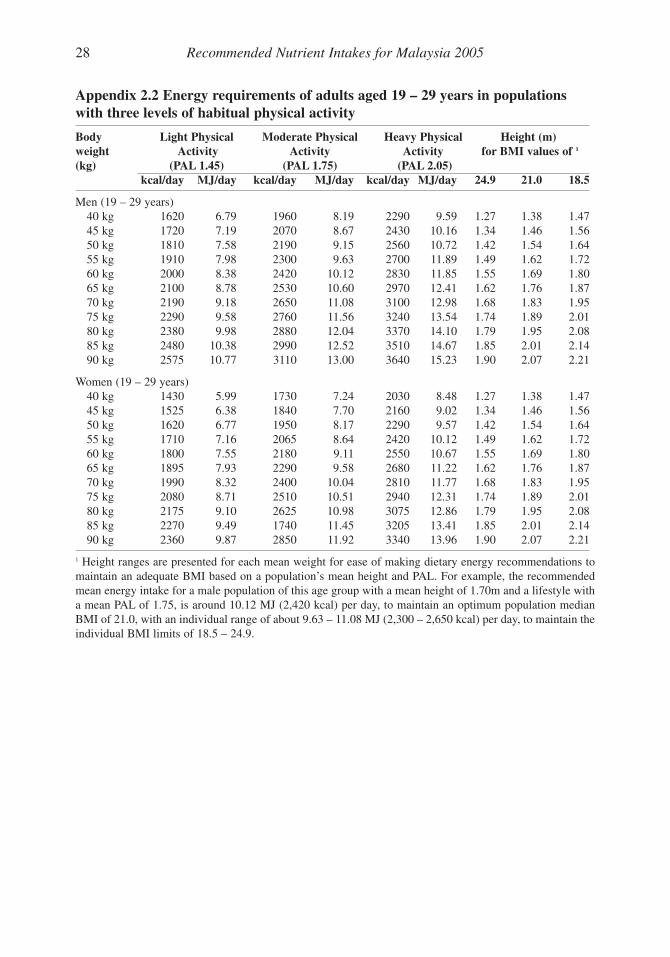
Appendix 2.2 Energy requirements of adults aged 19 – 29 years in populationswith three levels of habitual physical activity
Body Light Physical Moderate Physical Heavy Physical Height (m)weight Activity Activity Activity for BMI values of 1
(kg) (PAL 1.45) (PAL 1.75) (PAL 2.05)kcal/day MJ/day kcal/day MJ/day kcal/day MJ/day 24.9 21.0 18.5
Men (19 – 29 years)40 kg 1620 6.79 1960 8.19 2290 9.59 1.27 1.38 1.4745 kg 1720 7.19 2070 8.67 2430 10.16 1.34 1.46 1.5650 kg 1810 7.58 2190 9.15 2560 10.72 1.42 1.54 1.6455 kg 1910 7.98 2300 9.63 2700 11.89 1.49 1.62 1.7260 kg 2000 8.38 2420 10.12 2830 11.85 1.55 1.69 1.8065 kg 2100 8.78 2530 10.60 2970 12.41 1.62 1.76 1.8770 kg 2190 9.18 2650 11.08 3100 12.98 1.68 1.83 1.9575 kg 2290 9.58 2760 11.56 3240 13.54 1.74 1.89 2.0180 kg 2380 9.98 2880 12.04 3370 14.10 1.79 1.95 2.0885 kg 2480 10.38 2990 12.52 3510 14.67 1.85 2.01 2.1490 kg 2575 10.77 3110 13.00 3640 15.23 1.90 2.07 2.21
Women (19 – 29 years)40 kg 1430 5.99 1730 7.24 2030 8.48 1.27 1.38 1.4745 kg 1525 6.38 1840 7.70 2160 9.02 1.34 1.46 1.5650 kg 1620 6.77 1950 8.17 2290 9.57 1.42 1.54 1.6455 kg 1710 7.16 2065 8.64 2420 10.12 1.49 1.62 1.7260 kg 1800 7.55 2180 9.11 2550 10.67 1.55 1.69 1.8065 kg 1895 7.93 2290 9.58 2680 11.22 1.62 1.76 1.8770 kg 1990 8.32 2400 10.04 2810 11.77 1.68 1.83 1.9575 kg 2080 8.71 2510 10.51 2940 12.31 1.74 1.89 2.0180 kg 2175 9.10 2625 10.98 3075 12.86 1.79 1.95 2.0885 kg 2270 9.49 1740 11.45 3205 13.41 1.85 2.01 2.1490 kg 2360 9.87 2850 11.92 3340 13.96 1.90 2.07 2.21
1 Height ranges are presented for each mean weight for ease of making dietary energy recommendations tomaintain an adequate BMI based on a population’s mean height and PAL. For example, the recommendedmean energy intake for a male population of this age group with a mean height of 1.70m and a lifestyle witha mean PAL of 1.75, is around 10.12 MJ (2,420 kcal) per day, to maintain an optimum population medianBMI of 21.0, with an individual range of about 9.63 – 11.08 MJ (2,300 – 2,650 kcal) per day, to maintain theindividual BMI limits of 18.5 – 24.9.
29Energy
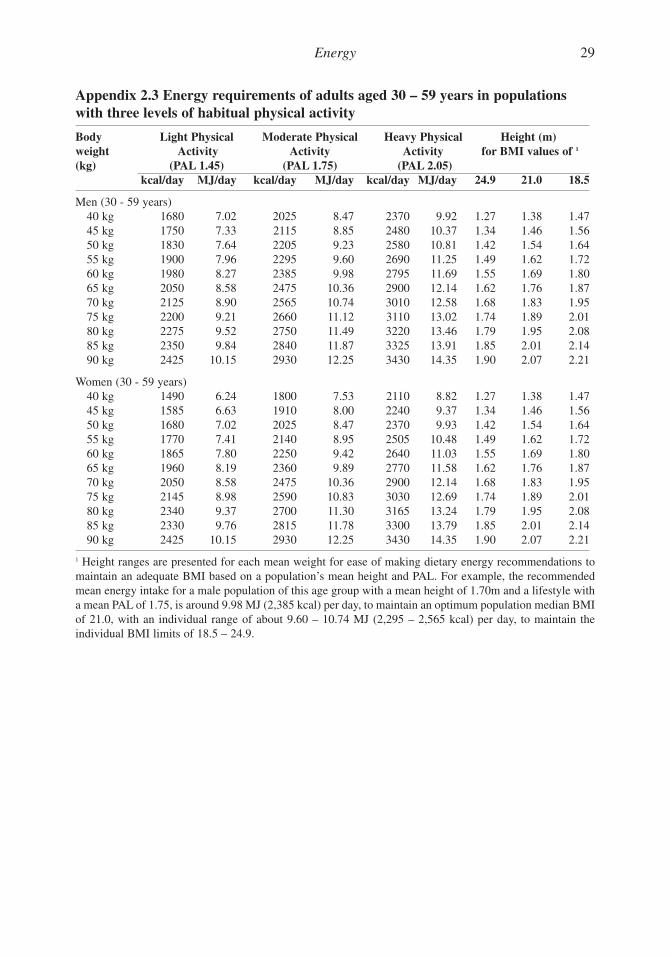
Appendix 2.3 Energy requirements of adults aged 30 – 59 years in populationswith three levels of habitual physical activity
Body Light Physical Moderate Physical Heavy Physical Height (m)weight Activity Activity Activity for BMI values of 1
(kg) (PAL 1.45) (PAL 1.75) (PAL 2.05)kcal/day MJ/day kcal/day MJ/day kcal/day MJ/day 24.9 21.0 18.5
Men (30 - 59 years)40 kg 1680 7.02 2025 8.47 2370 9.92 1.27 1.38 1.4745 kg 1750 7.33 2115 8.85 2480 10.37 1.34 1.46 1.5650 kg 1830 7.64 2205 9.23 2580 10.81 1.42 1.54 1.6455 kg 1900 7.96 2295 9.60 2690 11.25 1.49 1.62 1.7260 kg 1980 8.27 2385 9.98 2795 11.69 1.55 1.69 1.8065 kg 2050 8.58 2475 10.36 2900 12.14 1.62 1.76 1.8770 kg 2125 8.90 2565 10.74 3010 12.58 1.68 1.83 1.9575 kg 2200 9.21 2660 11.12 3110 13.02 1.74 1.89 2.0180 kg 2275 9.52 2750 11.49 3220 13.46 1.79 1.95 2.0885 kg 2350 9.84 2840 11.87 3325 13.91 1.85 2.01 2.1490 kg 2425 10.15 2930 12.25 3430 14.35 1.90 2.07 2.21
Women (30 - 59 years)40 kg 1490 6.24 1800 7.53 2110 8.82 1.27 1.38 1.4745 kg 1585 6.63 1910 8.00 2240 9.37 1.34 1.46 1.5650 kg 1680 7.02 2025 8.47 2370 9.93 1.42 1.54 1.6455 kg 1770 7.41 2140 8.95 2505 10.48 1.49 1.62 1.7260 kg 1865 7.80 2250 9.42 2640 11.03 1.55 1.69 1.8065 kg 1960 8.19 2360 9.89 2770 11.58 1.62 1.76 1.8770 kg 2050 8.58 2475 10.36 2900 12.14 1.68 1.83 1.9575 kg 2145 8.98 2590 10.83 3030 12.69 1.74 1.89 2.0180 kg 2340 9.37 2700 11.30 3165 13.24 1.79 1.95 2.0885 kg 2330 9.76 2815 11.78 3300 13.79 1.85 2.01 2.1490 kg 2425 10.15 2930 12.25 3430 14.35 1.90 2.07 2.21
1 Height ranges are presented for each mean weight for ease of making dietary energy recommendations tomaintain an adequate BMI based on a population’s mean height and PAL. For example, the recommendedmean energy intake for a male population of this age group with a mean height of 1.70m and a lifestyle witha mean PAL of 1.75, is around 9.98 MJ (2,385 kcal) per day, to maintain an optimum population median BMIof 21.0, with an individual range of about 9.60 – 10.74 MJ (2,295 – 2,565 kcal) per day, to maintain theindividual BMI limits of 18.5 – 24.9.
30Energy
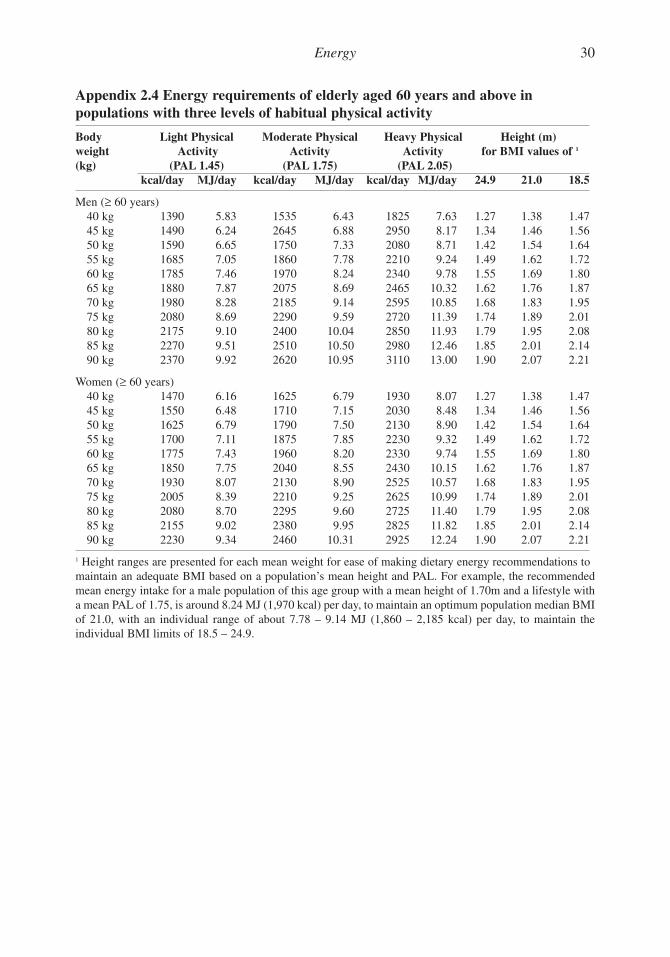
Appendix 2.4 Energy requirements of elderly aged 60 years and above inpopulations with three levels of habitual physical activity
Body Light Physical Moderate Physical Heavy Physical Height (m)weight Activity Activity Activity for BMI values of 1
(kg) (PAL 1.45) (PAL 1.75) (PAL 2.05)kcal/day MJ/day kcal/day MJ/day kcal/day MJ/day 24.9 21.0 18.5
Men (≥ 60 years)40 kg 1390 5.83 1535 6.43 1825 7.63 1.27 1.38 1.4745 kg 1490 6.24 2645 6.88 2950 8.17 1.34 1.46 1.5650 kg 1590 6.65 1750 7.33 2080 8.71 1.42 1.54 1.6455 kg 1685 7.05 1860 7.78 2210 9.24 1.49 1.62 1.7260 kg 1785 7.46 1970 8.24 2340 9.78 1.55 1.69 1.8065 kg 1880 7.87 2075 8.69 2465 10.32 1.62 1.76 1.8770 kg 1980 8.28 2185 9.14 2595 10.85 1.68 1.83 1.9575 kg 2080 8.69 2290 9.59 2720 11.39 1.74 1.89 2.0180 kg 2175 9.10 2400 10.04 2850 11.93 1.79 1.95 2.0885 kg 2270 9.51 2510 10.50 2980 12.46 1.85 2.01 2.1490 kg 2370 9.92 2620 10.95 3110 13.00 1.90 2.07 2.21
Women (≥ 60 years)40 kg 1470 6.16 1625 6.79 1930 8.07 1.27 1.38 1.4745 kg 1550 6.48 1710 7.15 2030 8.48 1.34 1.46 1.5650 kg 1625 6.79 1790 7.50 2130 8.90 1.42 1.54 1.6455 kg 1700 7.11 1875 7.85 2230 9.32 1.49 1.62 1.7260 kg 1775 7.43 1960 8.20 2330 9.74 1.55 1.69 1.8065 kg 1850 7.75 2040 8.55 2430 10.15 1.62 1.76 1.8770 kg 1930 8.07 2130 8.90 2525 10.57 1.68 1.83 1.9575 kg 2005 8.39 2210 9.25 2625 10.99 1.74 1.89 2.0180 kg 2080 8.70 2295 9.60 2725 11.40 1.79 1.95 2.0885 kg 2155 9.02 2380 9.95 2825 11.82 1.85 2.01 2.1490 kg 2230 9.34 2460 10.31 2925 12.24 1.90 2.07 2.21
1 Height ranges are presented for each mean weight for ease of making dietary energy recommendations tomaintain an adequate BMI based on a population’s mean height and PAL. For example, the recommendedmean energy intake for a male population of this age group with a mean height of 1.70m and a lifestyle witha mean PAL of 1.75, is around 8.24 MJ (1,970 kcal) per day, to maintain an optimum population median BMIof 21.0, with an individual range of about 7.78 – 9.14 MJ (1,860 – 2,185 kcal) per day, to maintain theindividual BMI limits of 18.5 – 24.9.
31Energy
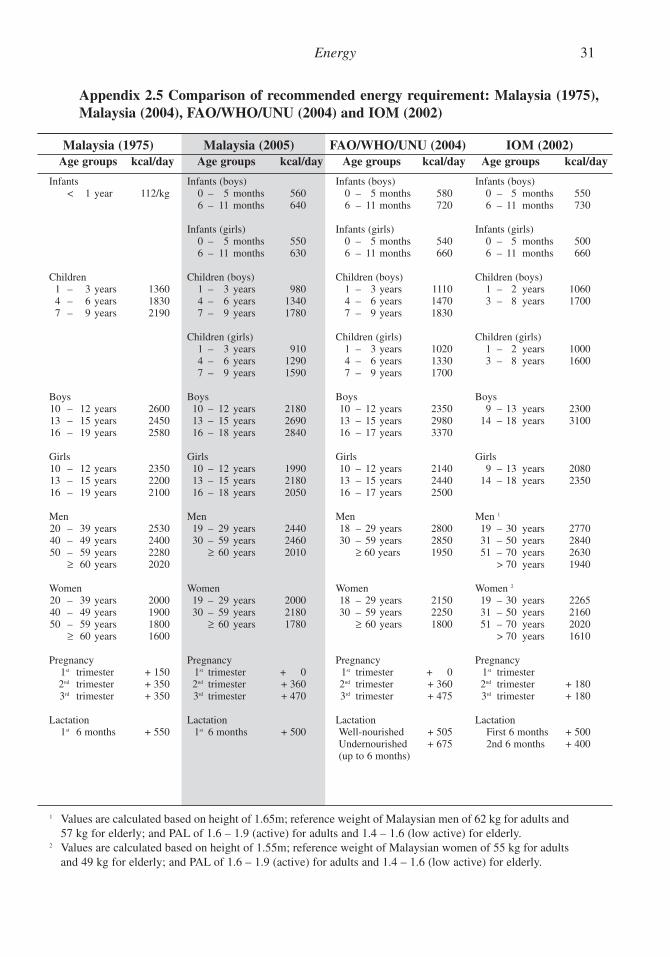
Appendix 2.5 Comparison of recommended energy requirement: Malaysia (1975),Malaysia (2004), FAO/WHO/UNU (2004) and IOM (2002)
Malaysia (1975) Malaysia (2005) FAO/WHO/UNU (2004) IOM (2002)Age groups kcal/day Age groups kcal/day Age groups kcal/day Age groups kcal/day
Infants Infants (boys) Infants (boys) Infants (boys)< 1 year 112/kg 0 – 5 months 560 0 – 5 months 580 0 – 5 months 550
6 – 11 months 640 6 – 11 months 720 6 – 11 months 730
Infants (girls) Infants (girls) Infants (girls)0 – 5 months 550 0 – 5 months 540 0 – 5 months 5006 – 11 months 630 6 – 11 months 660 6 – 11 months 660
Children Children (boys) Children (boys) Children (boys)1 – 3 years 1360 1 – 3 years 980 1 – 3 years 1110 1 – 2 years 10604 – 6 years 1830 4 – 6 years 1340 4 – 6 years 1470 3 – 8 years 17007 – 9 years 2190 7 – 9 years 1780 7 – 9 years 1830
Children (girls) Children (girls) Children (girls)1 – 3 years 910 1 – 3 years 1020 1 – 2 years 10004 – 6 years 1290 4 – 6 years 1330 3 – 8 years 16007 – 9 years 1590 7 – 9 years 1700
Boys Boys Boys Boys10 – 12 years 2600 10 – 12 years 2180 10 – 12 years 2350 9 – 13 years 230013 – 15 years 2450 13 – 15 years 2690 13 – 15 years 2980 14 – 18 years 310016 – 19 years 2580 16 – 18 years 2840 16 – 17 years 3370
Girls Girls Girls Girls10 – 12 years 2350 10 – 12 years 1990 10 – 12 years 2140 9 – 13 years 208013 – 15 years 2200 13 – 15 years 2180 13 – 15 years 2440 14 – 18 years 235016 – 19 years 2100 16 – 18 years 2050 16 – 17 years 2500
Men Men Men Men 1
20 – 39 years 2530 19 – 29 years 2440 18 – 29 years 2800 19 – 30 years 277040 – 49 years 2400 30 – 59 years 2460 30 – 59 years 2850 31 – 50 years 284050 – 59 years 2280 ≥ 60 years 2010 ≥ 60 years 1950 51 – 70 years 2630
≥ 60 years 2020 > 70 years 1940
Women Women Women Women 2
20 – 39 years 2000 19 – 29 years 2000 18 – 29 years 2150 19 – 30 years 226540 – 49 years 1900 30 – 59 years 2180 30 – 59 years 2250 31 – 50 years 216050 – 59 years 1800 ≥ 60 years 1780 ≥ 60 years 1800 51 – 70 years 2020
≥ 60 years 1600 > 70 years 1610
Pregnancy Pregnancy Pregnancy Pregnancy1st trimester + 150 1st trimester + 0 1st trimester + 0 1st trimester2nd trimester + 350 2nd trimester + 360 2nd trimester + 360 2nd trimester + 1803rd trimester + 350 3rd trimester + 470 3rd trimester + 475 3rd trimester + 180
Lactation Lactation Lactation Lactation1st 6 months + 550 1st 6 months + 500 Well-nourished + 505 First 6 months + 500
Undernourished + 675 2nd 6 months + 400(up to 6 months)
1 Values are calculated based on height of 1.65m; reference weight of Malaysian men of 62 kg for adults and57 kg for elderly; and PAL of 1.6 – 1.9 (active) for adults and 1.4 – 1.6 (low active) for elderly.
2 Values are calculated based on height of 1.55m; reference weight of Malaysian women of 55 kg for adultsand 49 kg for elderly; and PAL of 1.6 – 1.9 (active) for adults and 1.4 – 1.6 (low active) for elderly.