Embed Size (px)
Citation preview
2. Lecture WS 2003/04
Bioinformatics III 1
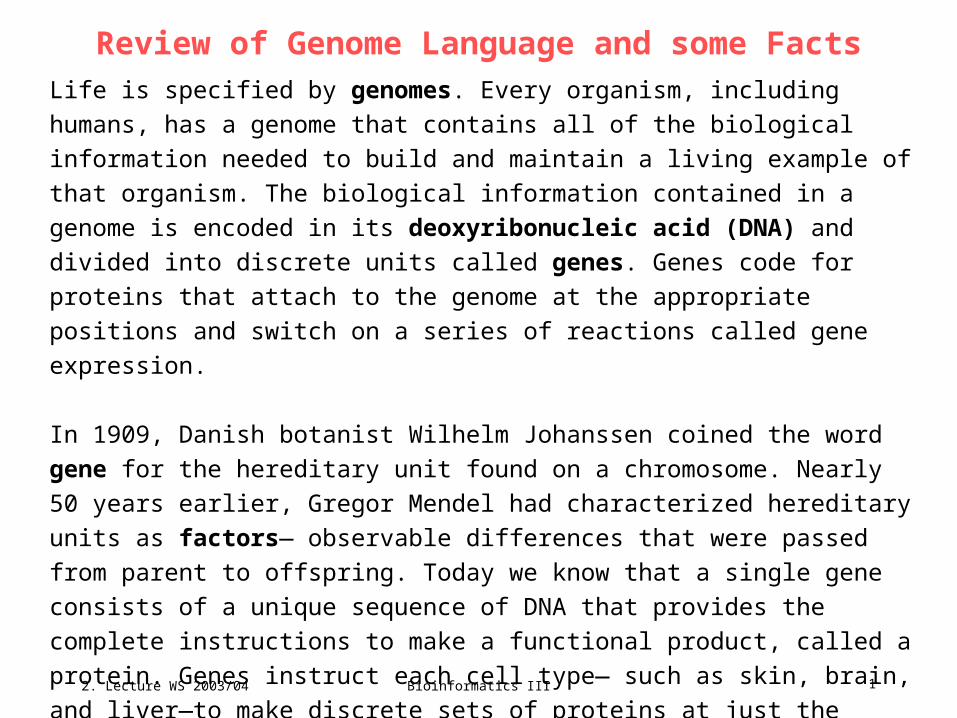
Review of Genome Language and some Facts
Life is specified by genomes. Every organism, including humans, has a genome
that contains all of the biological information needed to build and maintain a living
example of that organism. The biological information contained in a genome is
encoded in its deoxyribonucleic acid (DNA) and divided into discrete units
called genes. Genes code for proteins that attach to the genome at the
appropriate positions and switch on a series of reactions called gene expression.
In 1909, Danish botanist Wilhelm Johanssen coined the word gene for the
hereditary unit found on a chromosome. Nearly 50 years earlier, Gregor Mendel
had characterized hereditary units as factors— observable differences that were
passed from parent to offspring. Today we know that a single gene consists of a
unique sequence of DNA that provides the complete instructions to make a
functional product, called a protein. Genes instruct each cell type— such as skin,
brain, and liver—to make discrete sets of proteins at just the right times, and it is
through this specificity that unique organisms arise.

2. Lecture WS 2003/04
Bioinformatics III 2
The cell nucleus
http://www.nature.com/genomics/human/slide-show/1.html
2. Lecture WS 2003/04
Bioinformatics III 3
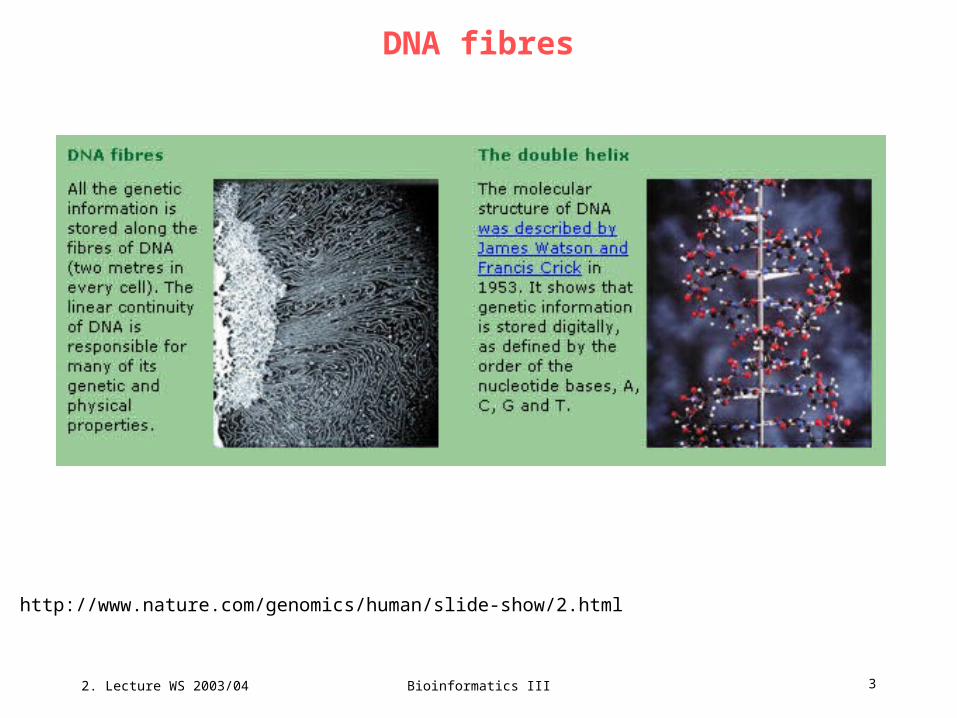
DNA fibres
http://www.nature.com/genomics/human/slide-show/2.html
2. Lecture WS 2003/04
Bioinformatics III 4
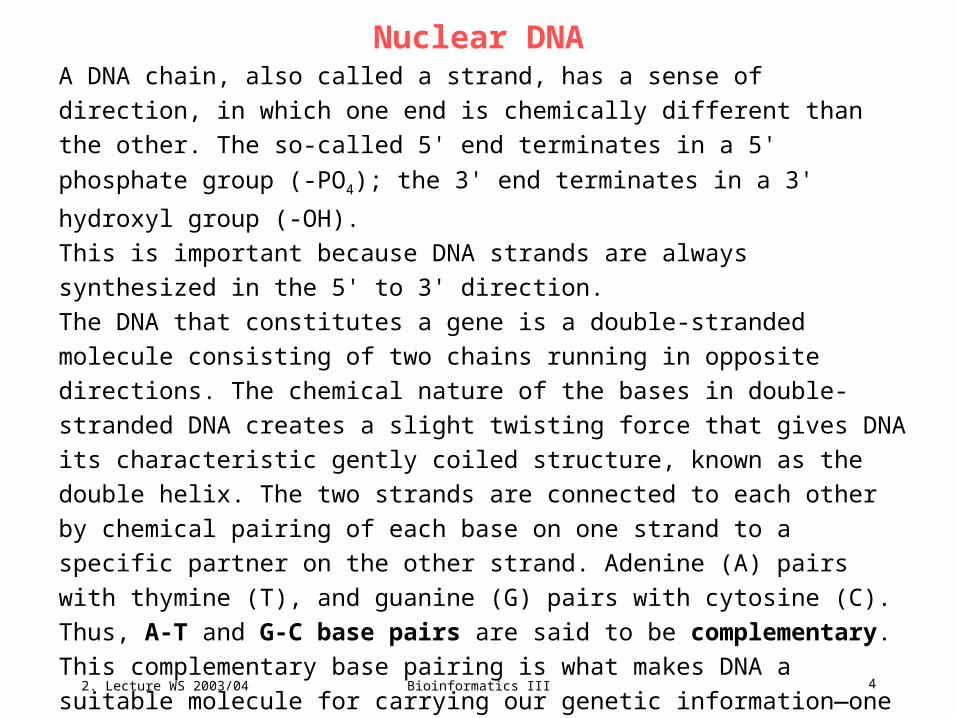
Nuclear DNA
A DNA chain, also called a strand, has a sense of direction, in which one end is
chemically different than the other. The so-called 5' end terminates in a 5'
phosphate group (-PO4); the 3' end terminates in a 3' hydroxyl group (-OH).
This is important because DNA strands are always synthesized in the 5' to 3'
direction.
The DNA that constitutes a gene is a double-stranded molecule consisting of
two chains running in opposite directions. The chemical nature of the bases in
double-stranded DNA creates a slight twisting force that gives DNA its
characteristic gently coiled structure, known as the double helix. The two
strands are connected to each other by chemical pairing of each base on one
strand to a specific partner on the other strand. Adenine (A) pairs with thymine
(T), and guanine (G) pairs with cytosine (C). Thus, A-T and G-C base pairs are
said to be complementary. This complementary base pairing is what makes
DNA a suitable molecule for carrying our genetic information—one strand of
DNA can act as a template to direct the synthesis of a complementary strand.
In this way, the information in a DNA sequence is readily copied and passed on
to the next generation of cells.

2. Lecture WS 2003/04
Bioinformatics III 5
Ribonucleic Acids
Just like DNA, ribonucleic acid (RNA) is a chain of nucleotides with the same
5' to 3' direction of its strands. The ribose sugar component of RNA is slightly
different than that of DNA: RNA has a 2' oxygen atom not present in DNA.
Other fundamental structural differences: - uracil (U) takes the place of the thymine (T) nucleotide found in DNA- RNA is, for the most part, a single-stranded molecule.
DNA directs the synthesis of a variety of RNA molecules, each with a unique
role in cellular function. E.g. all genes that code for proteins are first made into
an RNA strand in the nucleus called a messenger RNA (mRNA). The mRNA
carries the information encoded in DNA out of the nucleus to the protein
assembly machinery, the ribosome, in the cytoplasm. The ribosome complex
uses mRNA as a template to synthesize the exact protein coded for by the
gene.
In addition to mRNA, DNA codes for other forms of RNA, including ribosomal
RNAs (rRNAs), transfer RNAs (tRNAs), and small nuclear RNAs (snRNAs).
rRNAs and tRNAs participate in protein assembly whereas snRNAs aid in a
process called splicing —the process of editing of mRNA before it can be used
as a template for protein synthesis.
2. Lecture WS 2003/04
Bioinformatics III 6
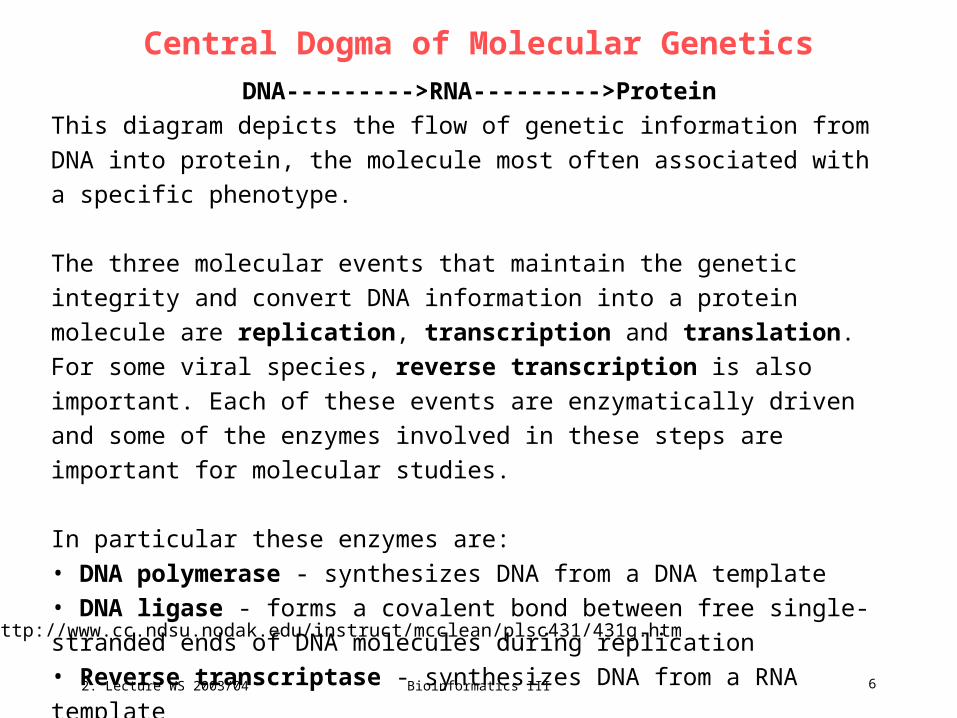
Central Dogma of Molecular Genetics
DNA--------->RNA--------->Protein
This diagram depicts the flow of genetic information from DNA into protein,
the molecule most often associated with a specific phenotype.
The three molecular events that maintain the genetic integrity and convert
DNA information into a protein molecule are replication, transcription and
translation. For some viral species, reverse transcription is also important.
Each of these events are enzymatically driven and some of the enzymes
involved in these steps are important for molecular studies.
In particular these enzymes are:• DNA polymerase - synthesizes DNA from a DNA template• DNA ligase - forms a covalent bond between free single-stranded ends of
DNA molecules during replication• Reverse transcriptase - synthesizes DNA from a RNA template
http://www.cc.ndsu.nodak.edu/instruct/mcclean/plsc431/431g.htm
2. Lecture WS 2003/04
Bioinformatics III 7
cloning
2. Lecture WS 2003/04
Bioinformatics III 8
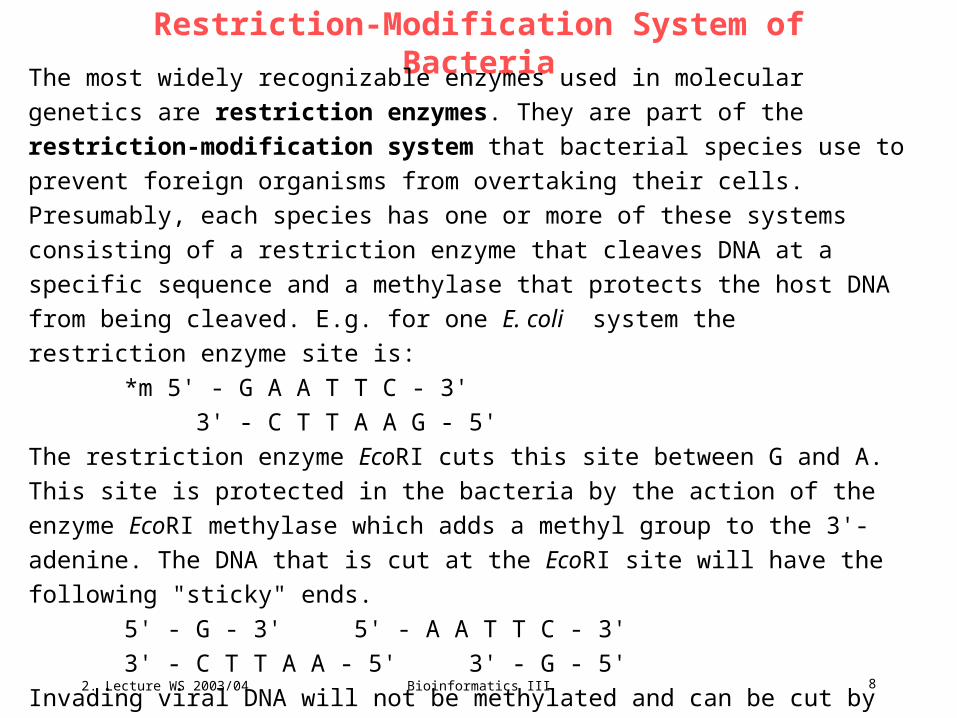
Restriction-Modification System of Bacteria
The most widely recognizable enzymes used in molecular genetics are restriction
enzymes. They are part of the restriction-modification system that bacterial
species use to prevent foreign organisms from overtaking their cells. Presumably,
each species has one or more of these systems consisting of a restriction enzyme
that cleaves DNA at a specific sequence and a methylase that protects the host
DNA from being cleaved. E.g. for one E. coli system the restriction enzyme site is:
*m 5' - G A A T T C - 3'
3' - C T T A A G - 5'
The restriction enzyme EcoRI cuts this site between G and A. This site is protected
in the bacteria by the action of the enzyme EcoRI methylase which adds a methyl
group to the 3'-adenine. The DNA that is cut at the EcoRI site will have the
following "sticky" ends.
5' - G - 3' 5' - A A T T C - 3'
3' - C T T A A - 5' 3' - G - 5'
Invading viral DNA will not be methylated and can be cut by the restriction enzyme.
Foreign DNA proliferation is therefore restricted in the cell by the restriction
enzyme, but bacterial DNA is modified by the methylase to prevent cleavage by
the restriction enzyme.
2. Lecture WS 2003/04
Bioinformatics III 9
Cloning Vectors
The molecular analysis of DNA has been made possible by the cloning of DNA.
The two molecules that are required for cloning are the DNA to be cloned and a
cloning vector.
Cloning vector - a DNA molecule that carries foreign DNA into a host cell,
replicates inside a bacterial (or yeast) cell and produces many copies of itself and
the foreign DNA
Three features of all cloning vectors
1. sequences that permit the propagation of itself in bacteria (or in yeast
for YACs)
2. a cloning site to insert foreign DNA; the most versatile vectors contain a
site that can be cut by many restriction enzymes
3. a method of selecting for bacteria (or yeast for YACs) containing a
vector with foreign DNA; usually accomplished by selectable markers for
drug resistance.
2. Lecture WS 2003/04
Bioinformatics III 10
Types of Cloning Vectors
• Plasmid - an extrachromosomal circular DNA molecule that autonomously
replicates inside the bacterial cell; cloning limit: 100 to 10,000 base pairs or
0.1-10 kilobases (kb) • Phage - derivatives of bacteriophage lambda; linear DNA molecules, whose
region can be replaced with foreign DNA without disrupting its life cycle;
cloning limit: 8-20 kb • Cosmids - an extrachromosomal circular DNA molecule that combines
features of plasmids and phage; cloning limit - 35-50 kb • Bacterial Artificial Chromosomes (BAC) - based on bacterial mini-F
plasmids. cloning limit: 75-300 kb • Yeast Artificial Chromosomes (YAC) - an artificial chromosome that
contains telomeres, origin of replication, a yeast centromere, and a
selectable marker for identification in yeast cells; cloning limit: 100-1000 kb
2. Lecture WS 2003/04
Bioinformatics III 11
cDNA cloning
The cloning described sofar will work for any random piece of DNA.
But since the goal of many cloning experiments is to obtain a sequence of
DNA that directs the production of a specific protein, any procedure that
optimizes cloning will be beneficial. One such technique is cDNA cloning.
The principle behind this technique is that an mRNA population isolated from
a specific developmental stage should contain mRNAs specific for any protein
expressed during that stage. Thus, if the mRNA can be isolated, the gene can
be studied. mRNA cannot be cloned directly, but a DNA copy of the mRNA
can be cloned. (The term cDNA is short for "copy DNA".) This conversion is
accomplished by the action of reverse transcriptase and DNA polymerase.
The reverse transcriptase makes a single-stranded DNA copy of the mRNA.
The second DNA strand is generated by DNA polymerase and the double-
stranded product is introduced into an appropriate plasmid or lambda vector.
2. Lecture WS 2003/04
Bioinformatics III 12
DNA Sequencing
These cloning techniques have been widely used to isolate many genes from
nearly all species. Once these genes have been isolated what can they be
used for?
1. The nucleic acid sequence of the gene can be derived. If a partial or
complete sequence of the protein that it encodes is available the gene can be
confirmed in this manner. If the protein product is not known then the
sequence of the gene can be compared with those of known genes to try to
derive a function for that gene.
2. The clone can then be used to study the sequences of the regulatory
region of the gene. This is possible only for genomic clones because cDNA
clones just contain coding sequences.
3. The clone can be used to isolate similar genes from other organisms.
Thus it can serve as a heterologous probe.
4. If the gene is of clinical importance, the clone can be used for diagnostic
purposes. E.g. one type of hemophilia.
2. Lecture WS 2003/04
Bioinformatics III 13
sequencing + physical mapping
2. Lecture WS 2003/04
Bioinformatics III 14
Goals of molecular genetics
A major goal is to correlate the sequence of a gene with its function. Thus
obtaining the sequence is of primary importance. DNA sequencing is nowadays
performed by the the dideoxy-chain-termination procedure that is a DNA
polymerase-based technique. This technique is based on the ability of a specific
nucleotide (dideoxy nucleotide) to terminate the DNA polymerase reaction.
These nucleotides do not have a free 3'-OH group, an absolute requirement for
DNA polymerase activity. Thus, any time this nucleotide is inserted into the
growing chain DNA synthesis stops.
Technically, four polymerase reactions are performed, each containing the four
nucleotides dATP, dTTP, dCTP and dGTP. In addition the reactions contain a
limited amount of one of the four dideoxybases so that all possible terminations
can occur.
After the reactions are finished, the products from the four reactions are
separated side-by-side on a polyacrylamide gel. Each of the fragments within a
lane ends with the base corresponding to the dideoxy nucleotide used in the
reaction. Thus by reading the four lanes from the bottom of the gel to the top, the
sequence of the DNA can be obtained.
2. Lecture WS 2003/04
Bioinformatics III 15
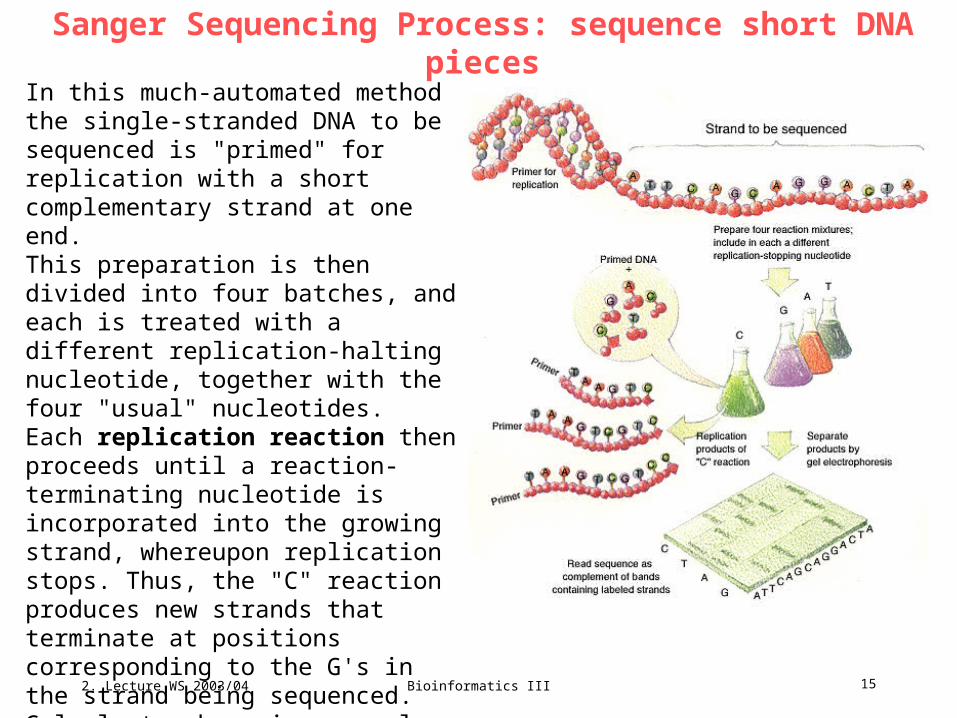
Sanger Sequencing Process: sequence short DNA pieces
In this much-automated method the single-stranded DNA to be sequenced is "primed" for replication with a short complementary strand at one end. This preparation is then divided into four batches, and each is treated with a different replication-halting nucleotide, together with the four "usual" nucleotides.Each replication reaction then proceeds until a reaction-terminating nucleotide is incorporated into the growing strand, whereupon replication stops. Thus, the "C" reaction produces new strands that terminate at positions corresponding to the G's in the strand being sequenced. Gel electrophoresis - one lane per reaction mixture - is then used to separate the replication products, from which the sequence of the original single strand can be inferred.
2. Lecture WS 2003/04
Bioinformatics III 16
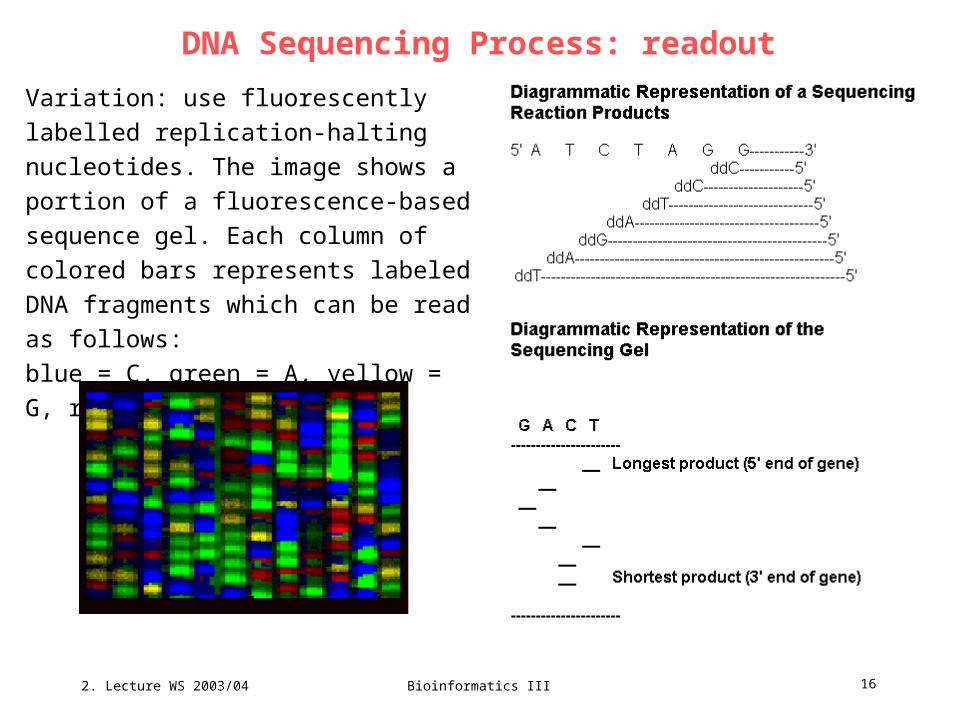
DNA Sequencing Process: readout
Variation: use fluorescently labelled
replication-halting nucleotides. The image
shows a portion of a fluorescence-based
sequence gel. Each column of colored
bars represents labeled DNA fragments
which can be read as follows:
blue = C, green = A, yellow = G, red = T.
2. Lecture WS 2003/04
Bioinformatics III 17
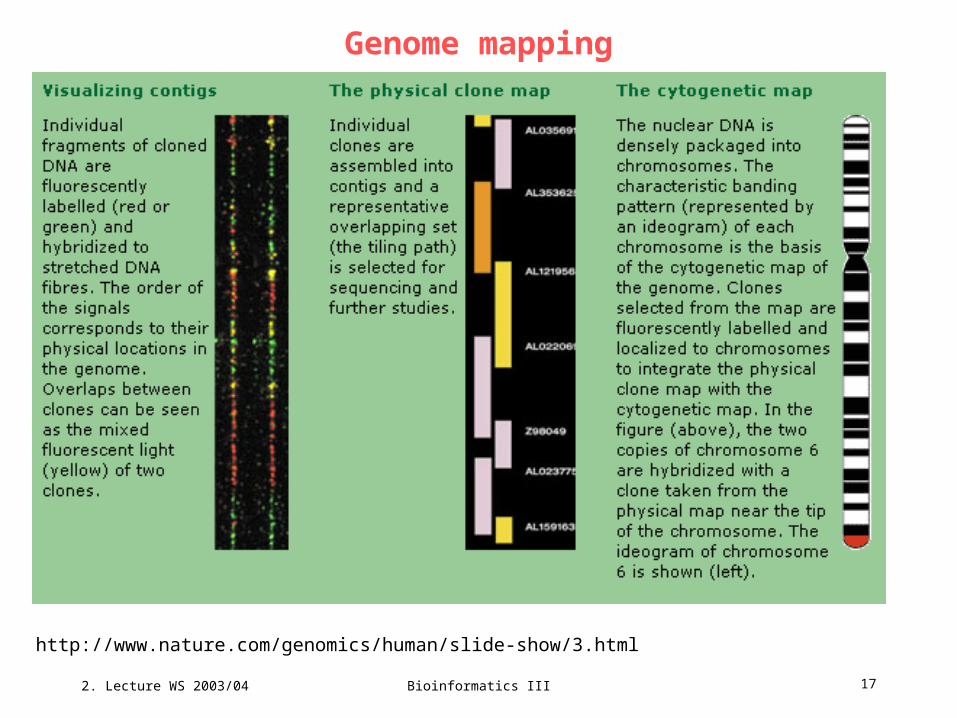
Genome mapping
http://www.nature.com/genomics/human/slide-show/3.html
2. Lecture WS 2003/04
Bioinformatics III 18
Physical mapping: the principle
Physical mapping of the genome recovers different levels.
Broad definition: position nucleotidic sequences with respect to longer nucleotidic
sequences (DNA matrix).
For instance, placing a gene responsible for a disease on the chromosome in
which it is contained.
The importance of this kind of information for genome projects is evident. The
biggest chunk of DNA which can nowaday be sequenced is at most 1000
nucleotides long (1 kb). As it is not possible to cut the human genome in bits of
neighboring pieces of 1 kb, it is necessary to first cut it in bigger pieces, which will
be themselves cut into smaller pieces, etc.
Cutting DNA is performed by restriction enzymes. The resulting fragments are
usually inserted into bacterias or other micro-organisms (or clones). This allows for
their conservation and mass production of DNA.
How are all these cloned fragments reorganized in the corresponding order on the
chromosomes they come from ? That is the role of physical mapping techniques.
http://www.pasteur.fr/recherche/unites/biophyadn/e-mapping.html
2. Lecture WS 2003/04
Bioinformatics III 19
Linear ordering of clones
None of today's techniques allows for a precise positioning of the probes down
to one nucleotidic base. It is thus necessary to use overlapping clones, that is,
clones with a common part. Covering of a region of the genome can then be
done by a set of partially overlaping clones, also called a contig (for contiguous
clones).
Building a contig of clones for a given region is thus the first step of physical
mapping. Basically, one picks up clones out of a clone library obtained by
systematic cloning of pieces resulting from the enzymatic digestion of the whole
genome. These clones are chosen when they are positive for markers specific
of the studied region, and have to be organised by physical mapping: one thus
obtains a minimal continuous string of overlapping clones which can eventually
be sequenced.
2. Lecture WS 2003/04
Bioinformatics III 20
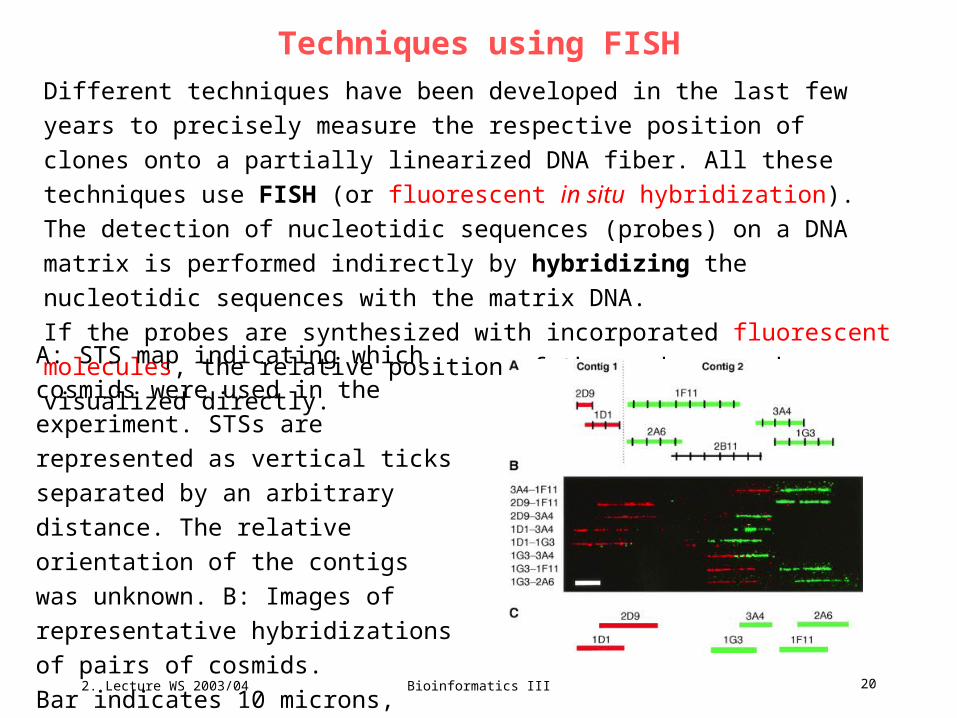
Techniques using FISH
Different techniques have been developed in the last few years to precisely
measure the respective position of clones onto a partially linearized DNA fiber.
All these techniques use FISH (or fluorescent in situ hybridization).
The detection of nucleotidic sequences (probes) on a DNA matrix is performed
indirectly by hybridizing the nucleotidic sequences with the matrix DNA.
If the probes are synthesized with incorporated fluorescent molecules, the
relative position of the probes can be visualized directly.
A: STS map indicating which cosmids
were used in the experiment. STSs are
represented as vertical ticks separated
by an arbitrary distance. The relative
orientation of the contigs was unknown.
B: Images of representative
hybridizations of pairs of cosmids.
Bar indicates 10 microns, i.e. 20 kb.
C: Final map.
2. Lecture WS 2003/04
Bioinformatics III 21
Fine Structure Mapping of Chromosomes
Molecular maps can be used to identify a marker for a specific gene. These markers
are quite useful for a specific gene that is difficult to score or is expressed late in the
life cycle. Maps can also be used as a starting point for cloning a gene. A fine
structure map of the species is quite useful for this purpose.
Yeast artifical chromosome (YAC) clones and bacterial artificial chromosome
(BAC) clones are key tools for developing a fine structure map.
In principle, a YAC or BAC clone library should contain a series of clones that
overlap each other. The key is to order each of these clones. The ordering of the
clones often relies upon sequence tagged sites (STS).
STS are short sequences of DNA that are sequenced. PCR primers are developed,
and if the same PCR product can be amplified from any two YAC or BAC clones,
the two clones must overlap.
In practise, a large number of clones are scored for different STS sites, and the data
is analyzed to order the different clones. The following table is an example of such
data. "+" means that the STS is product is obtained from that clone, and "-" means
the product is not amplified from the clone.
2. Lecture WS 2003/04
Bioinformatics III 22
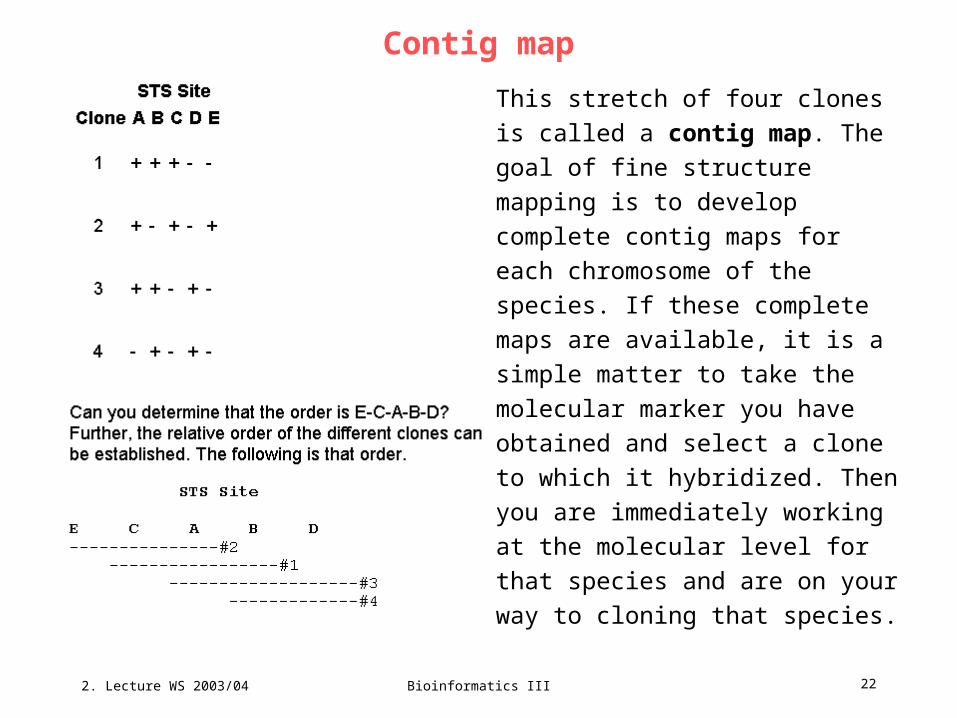
Contig map
This stretch of four clones is called a
contig map. The goal of fine
structure mapping is to develop
complete contig maps for each
chromosome of the species. If these
complete maps are available, it is a
simple matter to take the molecular
marker you have obtained and select
a clone to which it hybridized. Then
you are immediately working at the
molecular level for that species and
are on your way to cloning that
species.

2. Lecture WS 2003/04
Bioinformatics III 23
structural organisation of DNA

2. Lecture WS 2003/04
Bioinformatics III 24
Eukaryotic Chromosome Structure
The length of DNA in the nucleus is far greater than the size of the compartment in
which it is contained. Therefore, the DNA has to be condensed in some manner
expressed by its packing ratio - the length of DNA divided by the length into which
it is packaged. E.g. the shortest human chromosome contains 4.6 x 10⁷ bp. This is
equivalent to 14,000 µm of extended DNA. In its most condensed state during
mitosis, the chromosome is about 2 µm long. This gives a packing ratio of 7000
(14,000/2). To achieve the overall packing ratio, DNA is not packaged directly into
the final structure of chromatin but contains several hierarchies of organization:
(a) DNA is wound around a protein core to produce a "bead-like" structure called a
nucleosome. This gives a packing ratio of about 6 (2*πr). This structure is invariant
in both the euchromatin and heterochromatin of all chromosomes.
(b) The second level of packing is the coiling of beads in a helical structure called
the 30 nm fiber that is found in both interphase chromatin and mitotic
chromosomes. This structure increases the packing ratio to about 40.
(c) The final packaging occurs when the fiber is organized in loops, scaffolds and
domains that give a final packing ratio of about 1000 in interphase chromosomes
and about 10,000 in mitotic chromosomes.
2. Lecture WS 2003/04
Bioinformatics III 25
Nucleosome
The nucleosome consists of about 200 bp wrapped around a histone octamer that
contains two copies of histone proteins H2A, H2B, H3 and H4. These are known as
the core histones. Histones are basic proteins that have an affinity for DNA and are
the most abundant proteins associated with DNA. The amino acid sequence of
these four histones is conserved suggesting a similar function for all.
The length of DNA that is associated with the nucleosome unit varies between
species. But regardless of the size, two DNA components are involved.
Core DNA is the DNA that is actually associated with the histone octamer. This
value is invariant and is 146 base pairs. The core DNA forms two loops around the
octamer, and this permits two regions that are 80 bp apart to be brought into close
proximity. Thus, two sequences that are far apart can interact with the same
regulatory protein to control gene expression. The DNA that is between each
histone octamer is called the linker DNA and can vary in length from 8 to 114 base
pairs. This variation is species specific, but variation in linker DNA length has also
been associated with the developmental stage of the organism or specific regions
of the genome.
2. Lecture WS 2003/04
Bioinformatics III 26
30 nm and 700 nm fiber
The next level of organization of the chromatin is the 30 nm fiber. This is a
structure with about 6 nucleosomes per turn yielding a packing ratio of 40 (ca.
6*6). The stability of this structure requires the presence of the last member of
the histone gene family, histone H1.
The final level of packaging is characterized by the 700 nm structure seen in the
metaphase chromosome. The condensed piece of chromatin has a characteristic
scaffolding structure that can be detected in metaphase chromosomes. This
appears to be the result of extensive looping of the DNA in the chromosome.
When chromosomes are stained with dyes, they appear to have alternating
lightly and darkly stained regions. The lightly-stained regions are euchromatin
and contain single-copy, genetically-active DNA. The darkly-stained regions are
heterochromatin and contain repetitive sequences that are genetically inactive.
2. Lecture WS 2003/04
Bioinformatics III 27
Centromeres and Telomeres
Centromeres and telomeres are two essential features of all eukaryotic
chromosomes. Each provide a unique function that is absolutely necessary
for the stability of the chromosome. Centromeres are required for the
segregation of the centromere during meiosis and mitosis, and telomeres
provide terminal stability to the chromosome and ensure its survival.
Centromeres are those condensed regions within the chromosome that are
responsible for the accurate segregation of the replicated chromosome during
mitosis and meiosis. When chromosomes are stained they typically show a
dark-stained region that is the centromere. During mitosis, the centromere
that is shared by the sister chromatids must divide so that the chromatids can
migrate to opposite poles of the cell. On the other hand, during the first
meiotic division the centromere of sister chromatids must remain intact,
whereas during meiosis II they must act as they do during mitosis. Therefore
the centromere is an important component of chromosome structure and
segregation.
2. Lecture WS 2003/04
Bioinformatics III 28
Centromeres
Within the centromere region, most species have several locations where spindle
fibers attach, and these sites consist of DNA as well as protein. The actual
location where the attachment occurs is called the kinetochore and is
composed of both DNA and protein. The DNA sequence within these regions is
called CEN DNA. Because CEN DNA can be moved from one chromosome to
another and still provide the chromosome with the ability to segregate, these
sequences must not provide any other function.
Typically CEN DNA is about 120 base pairs long and consists of several sub-
domains, CDE-I, CDE-II and CDE-III . Mutations in the first two sub-domains
have no effect upon segregation, but a point mutation in the CDE-III sub-domain
completely eliminates the ability of the centromere to function during
chromosome segregation. Therefore CDE-III must be actively involved in the
binding of the spindle fibers to the centromere.
2. Lecture WS 2003/04
Bioinformatics III 29
Telomeres
Telomeres are the region of DNA at the end of the linear eukaryotic chromo-
some that are required for the replication and stability of the chromosome.
McClintock recognized their special features when she noticed, that if two
chromosomes were broken in a cell, the end of one could attach to the other
and vice versa. What she never observed was the attachment of the broken
end to the end of an unbroken chromosome. Thus the ends of broken
chromosomes are sticky, whereas the normal end is not sticky, suggesting
the ends of chromosomes have unique features.
Usually, but not always, the telomeric DNA is heterochromatic and contains
direct tandemly repeated sequences. The following table shows the repeat
sequences of several species. These are often of the form (T/A)xGy where x is
between 1 and 4 and y is greater than 1.

2. Lecture WS 2003/04
Bioinformatics III 30
Telomere Repeat Sequences
2. Lecture WS 2003/04
Bioinformatics III 31
repetitive sequences
2. Lecture WS 2003/04
Bioinformatics III 32
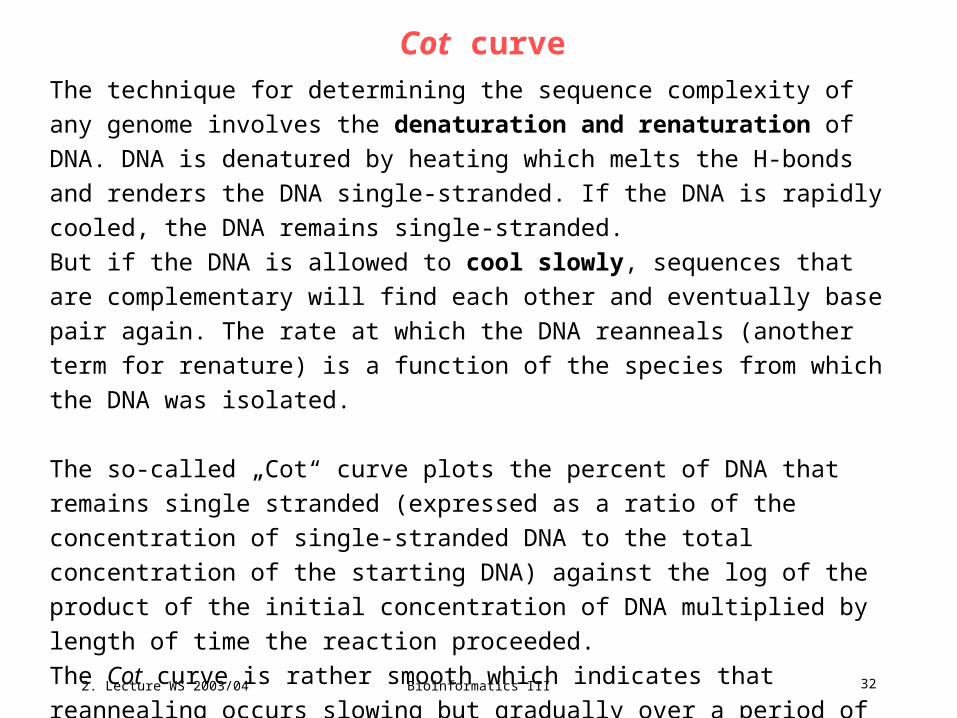
Cot curve
The technique for determining the sequence complexity of any genome involves
the denaturation and renaturation of DNA. DNA is denatured by heating which
melts the H-bonds and renders the DNA single-stranded. If the DNA is rapidly
cooled, the DNA remains single-stranded.
But if the DNA is allowed to cool slowly, sequences that are complementary will
find each other and eventually base pair again. The rate at which the DNA
reanneals (another term for renature) is a function of the species from which the
DNA was isolated.
The so-called „Cot“ curve plots the percent of DNA that remains single stranded
(expressed as a ratio of the concentration of single-stranded DNA to the total
concentration of the starting DNA) against the log of the product of the initial
concentration of DNA multiplied by length of time the reaction proceeded.
The Cot curve is rather smooth which indicates that reannealing occurs slowing
but gradually over a period of time. At Cot½ , half of the DNA has reannealed.
2. Lecture WS 2003/04
Bioinformatics III 33
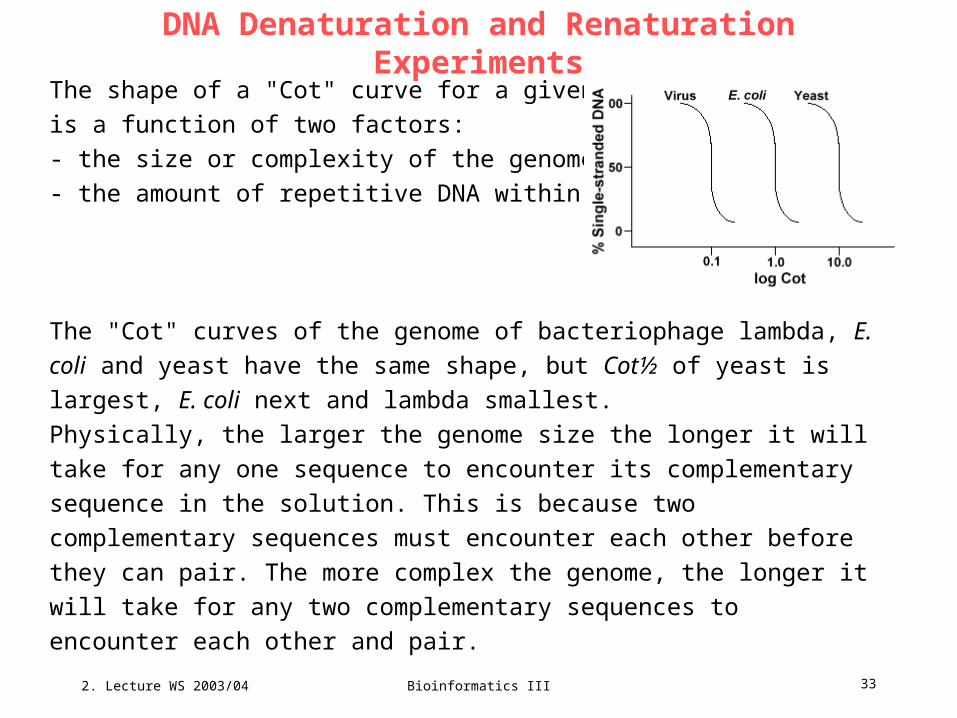
DNA Denaturation and Renaturation Experiments
The shape of a "Cot" curve for a given species
is a function of two factors:
- the size or complexity of the genome;
- the amount of repetitive DNA within the genome
The "Cot" curves of the genome of bacteriophage lambda, E. coli and yeast
have the same shape, but Cot½ of yeast is largest, E. coli next and lambda
smallest.
Physically, the larger the genome size the longer it will take for any one
sequence to encounter its complementary sequence in the solution. This is
because two complementary sequences must encounter each other before
they can pair. The more complex the genome, the longer it will take for any
two complementary sequences to encounter each other and pair.

2. Lecture WS 2003/04
Bioinformatics III 34
Repeated DNA sequences, DNA sequences that are found more than
once in the genome of the species, have distinctive effects on "Cot" curves.
If a specific sequence is represented twice in the genome it will have two
complementary sequences to pair with and as such will have a Cot value half
as large as a sequence represented only once in the genome.
2. Lecture WS 2003/04
Bioinformatics III 35
Repetitive DNA
Eukaryotic genomes actually have a wide array of sequences that are
represented at different levels of repetition.
Single copy sequences are found once or a few times in the genome. Many
of the sequences which encode functional genes fall into this class.
Middle repetitive DNA are found from 10s - 1000 times in the genome.
Examples of these would include rRNA and tRNA genes and storage proteins in
plants such as corn. Middle repetitive DNA can vary from 100-300 bp to 5000 bp
and can be dispersed throughout the genome.
The most abundant sequences are found in the highly repetitive DNA class.
These sequences are found from 100,000 to 1 million times in the genome and
can range in size from a few to several hundred bases in length. These
sequences are found in regions of the chromosome such as heterochromatin,
centromeres and telomeres and tend to be arranged as a tandem repeats. The
following is an example of a tandemly repeated sequence:
ATTATA ATTATA ATTATA // ATTATA
2. Lecture WS 2003/04
Bioinformatics III 36
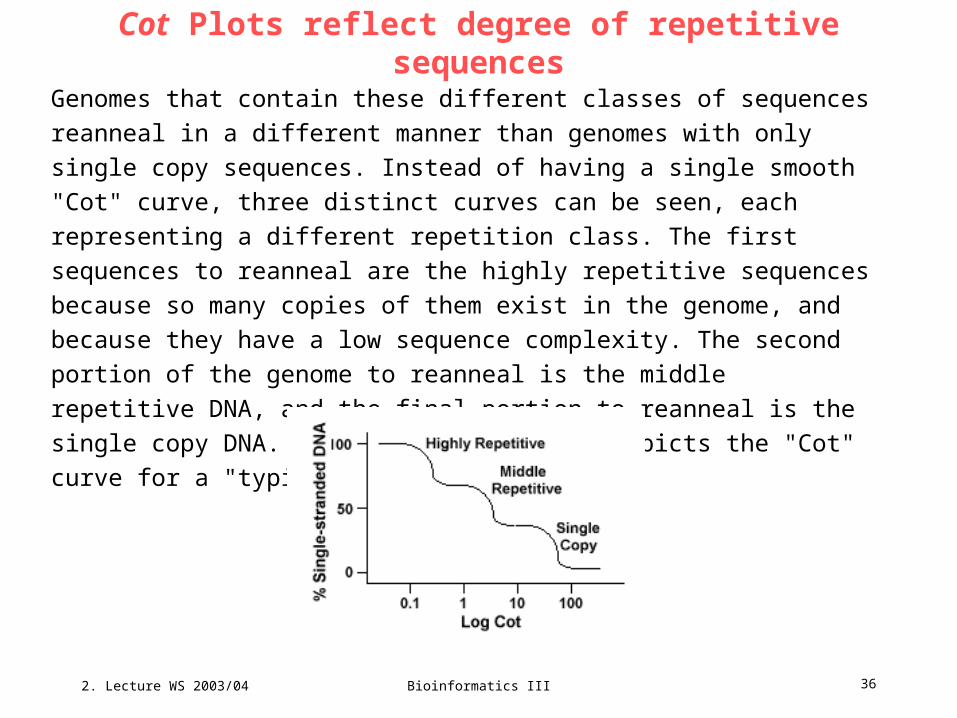
Cot Plots reflect degree of repetitive sequences
Genomes that contain these different classes of sequences reanneal in a
different manner than genomes with only single copy sequences. Instead of
having a single smooth "Cot" curve, three distinct curves can be seen, each
representing a different repetition class. The first sequences to reanneal are
the highly repetitive sequences because so many copies of them exist in the
genome, and because they have a low sequence complexity. The second
portion of the genome to reanneal is the middle repetitive DNA, and the final
portion to reanneal is the single copy DNA. The following diagram depicts the
"Cot" curve for a "typical" eukaryotic genome
2. Lecture WS 2003/04
Bioinformatics III 37
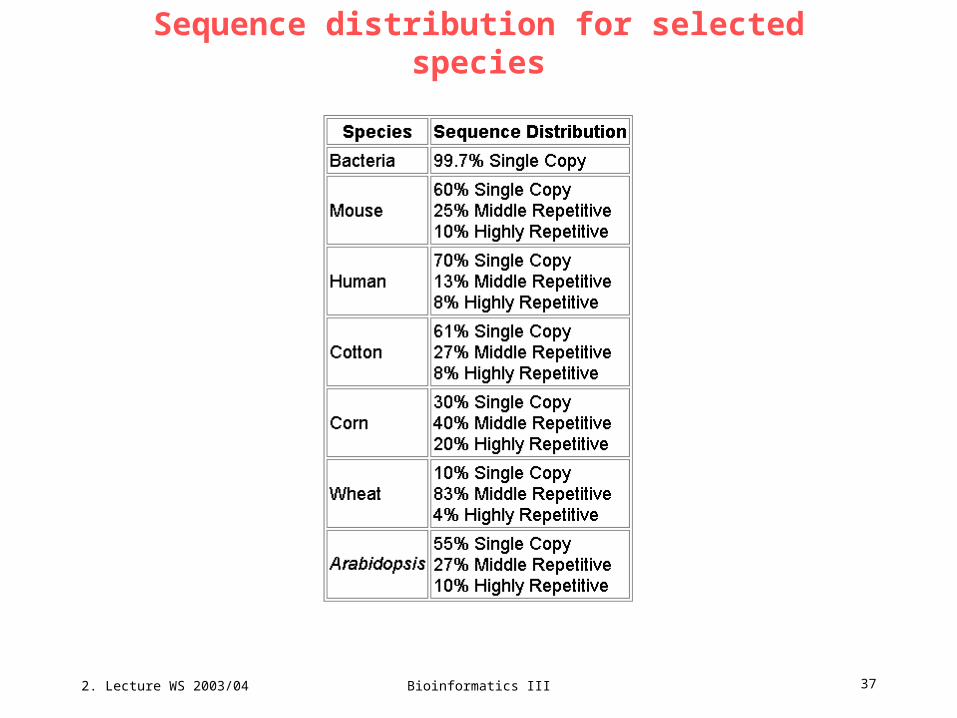
Sequence distribution for selected species
2. Lecture WS 2003/04
Bioinformatics III 38
Sequence Interspersion
Even though the genomes of higher organisms contain single copy, middle
repetitive and highly repetitive DNA sequences, these sequences are not
arranged similarly in all species.
The prominent arrangement is called short period interspersion. This
arrangement is characterized by repeated sequences 100-200 bp in length
interspersed among single copy sequences that are 1000-2000 bp in length.
This arrangement is found in animals, fungi and plants.
The second type of arrangement is long-period interspersion. This is
characterized by 5000 bp stretches of repeated sequences interspersed
within regions of 35,000 bp of single copy DNA. Drosophila is an example of a
species with this uncommon sequence arrangement. In both cases, the
repeated sequences are usually from the middle repetitive class.

2. Lecture WS 2003/04
Bioinformatics III 39
C-value paradox
In addition to describing the genome of an organism by its number of
chromosomes, it is also described by the amount of DNA in a haploid cell.
This is usually expressed as the amount of DNA per haploid cell and is called
the C value. One immediate feature of eukaryotic organisms highlights a
specific anomaly that was detected early in molecular research:
Even though eukaryotic organisms appear to have only 2-10 times as many
genes as prokaryotes, they have many orders of magnitude more DNA in the
cell. Furthermore, the amount of DNA per genome is not correlated with the
presumed evolutionary complexity of a species.
This is stated as the C value paradox: the amount of DNA in the haploid
cell of an organism is not related to its evolutionary complexity.
Another important point to keep in mind is that there is no relationship
between the number of chromosomes and the presumed evolutionary
complexity of an organism.

2. Lecture WS 2003/04
Bioinformatics III 40
C-Value paradox
A dramatic example of the range of C
values can be seen in the plant
kingdom where Arabidopsis
represents the low end and lily (1.0 x
108 kb/haploid genome) the high end
of complexity.
In weight terms this is 0.07
picograms per haploid Arabidopsis
genome and 100 picograms per
haploid lily genome.

2. Lecture WS 2003/04
Bioinformatics III 41
The genetic code
2. Lecture WS 2003/04
Bioinformatics III 42
The genetic code
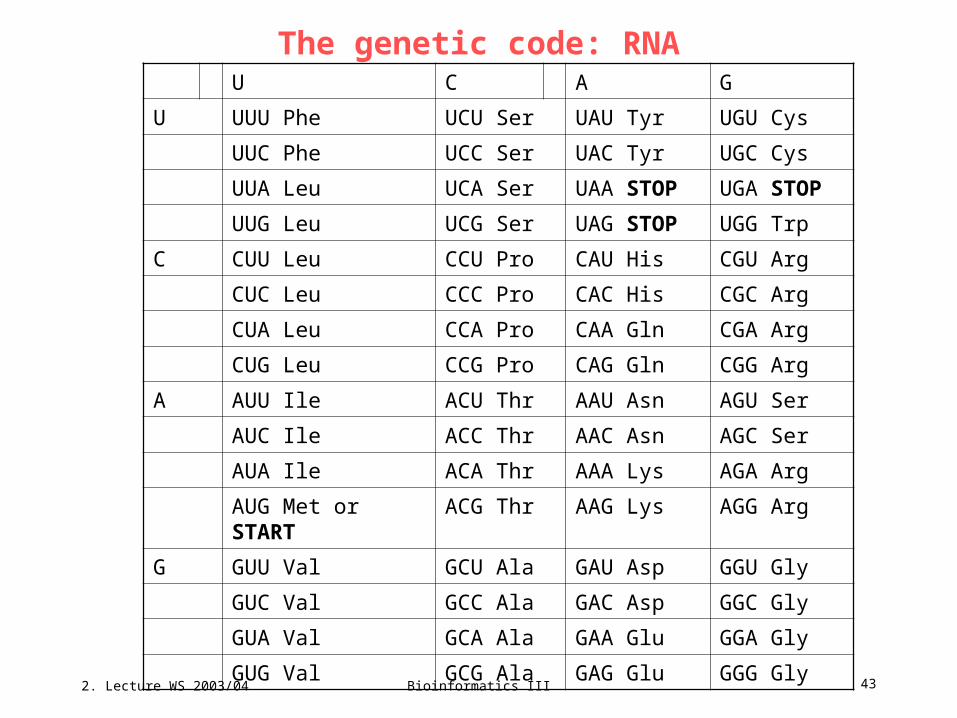
The genetic code consists of 64 triplets of nucleotides. These triplets are called
codons. With three exceptions, each codon encodes for one of the 20 amino
acids used in the synthesis of proteins. That produces some redundancy in the
code. One codon, AUG, serves two related functions:• it signals the start of translation• it codes for incorporating the amino acid Met into the growing polypeptide chain.
The genetic code can be expressed as either RNA codons or DNA codons.
RNA codons occur in messenger RNA (mRNA) and are the codons that are
actually "read" during the synthesis of polypeptides (the process called
translation). But each mRNA molecule acquires its sequence of nucleotides by
transcription from the corresponding gene. Because DNA sequencing has
become so rapid and because most genes are now being discovered at the level
of DNA before they are discovered as mRNA or as a protein product, it is
extremely useful to have a table of codons expressed as DNA.
There are also exceptions to the genetic code but we will not mention these here.
2. Lecture WS 2003/04
Bioinformatics III 43
The genetic code: RNA
U C A G
U UUU Phe UCU Ser UAU Tyr UGU Cys
UUC Phe UCC Ser UAC Tyr UGC Cys
UUA Leu UCA Ser UAA STOP UGA STOP
UUG Leu UCG Ser UAG STOP UGG Trp
C CUU Leu CCU Pro CAU His CGU Arg
CUC Leu CCC Pro CAC His CGC Arg
CUA Leu CCA Pro CAA Gln CGA Arg
CUG Leu CCG Pro CAG Gln CGG Arg
A AUU Ile ACU Thr AAU Asn AGU Ser
AUC Ile ACC Thr AAC Asn AGC Ser
AUA Ile ACA Thr AAA Lys AGA Arg
AUG Met or START ACG Thr AAG Lys AGG Arg
G GUU Val GCU Ala GAU Asp GGU Gly
GUC Val GCC Ala GAC Asp GGC Gly
GUA Val GCA Ala GAA Glu GGA Gly
GUG Val GCG Ala GAG Glu GGG Gly
2. Lecture WS 2003/04
Bioinformatics III 44
The genetic code: DNA
T C A G
T TTT Phe TCT Ser TAT Tyr TGT Cys
TTC Phe TCC Ser TAC Tyr TGC Cys
TTA Leu TCA Ser TAA STOP TGA STOP
TTG Leu TCG Ser TAG STOP TGG Trp
C CTT Leu CCT Pro CAT His CGT Arg
CTC Leu CCC Pro CAC His CGC Arg
CTA Leu CCA Pro CAA Gln CGA Arg
CTG Leu CCG Pro CAG Gln CGG Arg
A ATT Ile ACT Thr AAT Asn AGT Ser
ATC Ile ACC Thr AAC Asn AGC Ser
ATA Ile ACA Thr AAA Lys AGA Arg
ATG Met or START
ACG Thr AAG Lys AGG Arg
G GTT Val GCT Ala GAT Asp GGT Gly
GTC Val GCC Ala GAC Asp GGC Gly
GTA Val GCA Ala GAA Glu GGA Gly
GTG Val GCG Ala GAG Glu GGG Gly
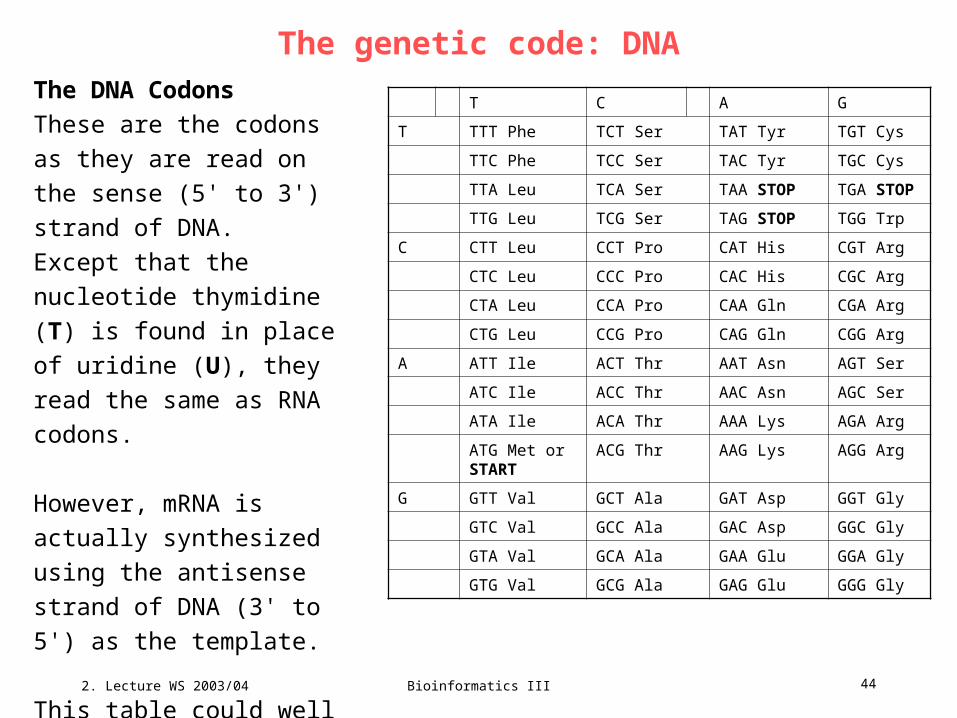
The DNA Codons
These are the codons as they
are read on the sense (5' to 3')
strand of DNA.
Except that the nucleotide
thymidine (T) is found in place
of uridine (U), they read the
same as RNA codons.
However, mRNA is actually
synthesized using the
antisense strand of DNA (3' to
5') as the template.
This table could well be called
the Rosetta Stone of life.

2. Lecture WS 2003/04
Bioinformatics III 45
Codon usage: Cytochrome P450
or how the genome affects protein composition
110 non-allelic cytochrome P450 genes from man (n=30), rat (n=38), rabbit
(n=24), and mouse (n=18) for which complete cDNA or gene sequences are
available were analyzed. Codon usage bias (the tendency to use a limited subset
of codons) was estimated by summing the usage of the preferred codon for each
of the 18 amino acids for which synonymous codons exist and expressing it as a
percentage of all the synonymous codons in that gene.
Thus, genes with a high codon usage bias tend to use a subset of all possible
codons (i.e., preferred codons) rather than the full range of codons available.
Porter, T.D., "Correlation between codon usage, regional genomic nucleotide composition, and amino
acid composition in the cytochrome P-450 gene superfamily", Biochim. Biophys. Acta 1261, 394-400,
1995.
borrowed from http://www.uky.edu/Pharmacy/ps/porter/CodonUsage/p450_codon_usage.htm
2. Lecture WS 2003/04
Bioinformatics III 46
Codon Usage Bias Not Correlated with Evolutionary Age
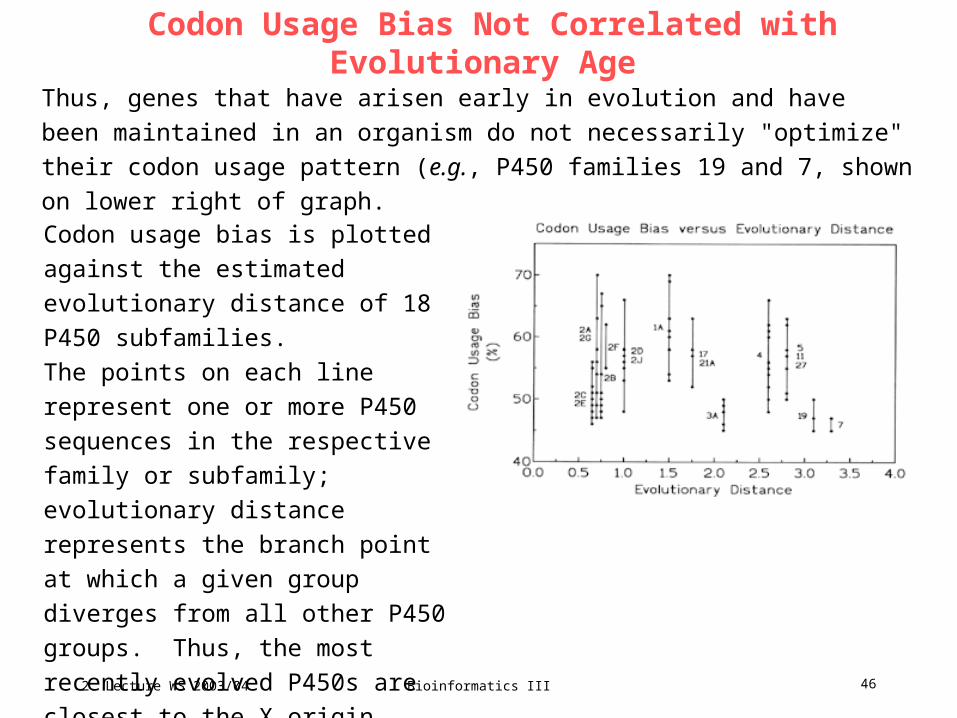
Thus, genes that have arisen early in evolution and have been maintained in an
organism do not necessarily "optimize" their codon usage pattern (e.g., P450
families 19 and 7, shown on lower right of graph.
Codon usage bias is plotted against the
estimated evolutionary distance of 18
P450 subfamilies.
The points on each line represent one or
more P450 sequences in the respective
family or subfamily; evolutionary
distance represents the branch point at
which a given group diverges from all
other P450 groups. Thus, the most
recently evolved P450s are closest to
the X origin.
2. Lecture WS 2003/04
Bioinformatics III 47
Codon Usage Bias Not Correlated with Evolutionary Conservation
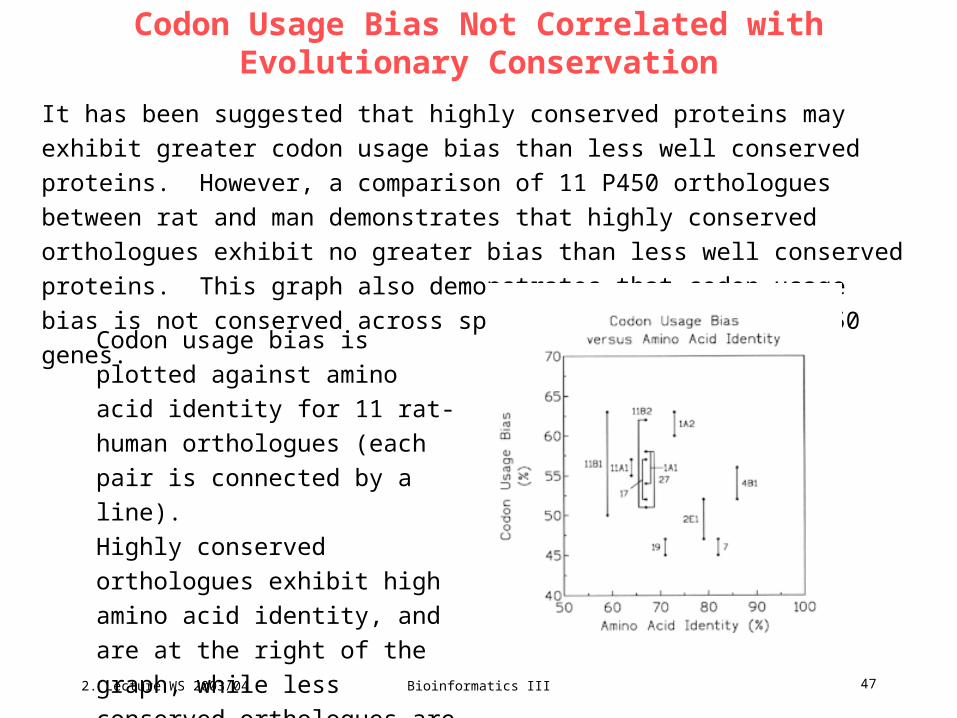
It has been suggested that highly conserved proteins may exhibit greater codon
usage bias than less well conserved proteins. However, a comparison of 11 P450
orthologues between rat and man demonstrates that highly conserved orthologues
exhibit no greater bias than less well conserved proteins. This graph also
demonstrates that codon usage bias is not conserved across species for
orthologous P450 genes.
Codon usage bias is plotted
against amino acid identity for 11
rat-human orthologues (each pair
is connected by a line).
Highly conserved orthologues
exhibit high amino acid identity,
and are at the right of the graph,
while less conserved orthologues
are at the left.
2. Lecture WS 2003/04
Bioinformatics III 48
Codon Usage Bias is not Tissue-Specific
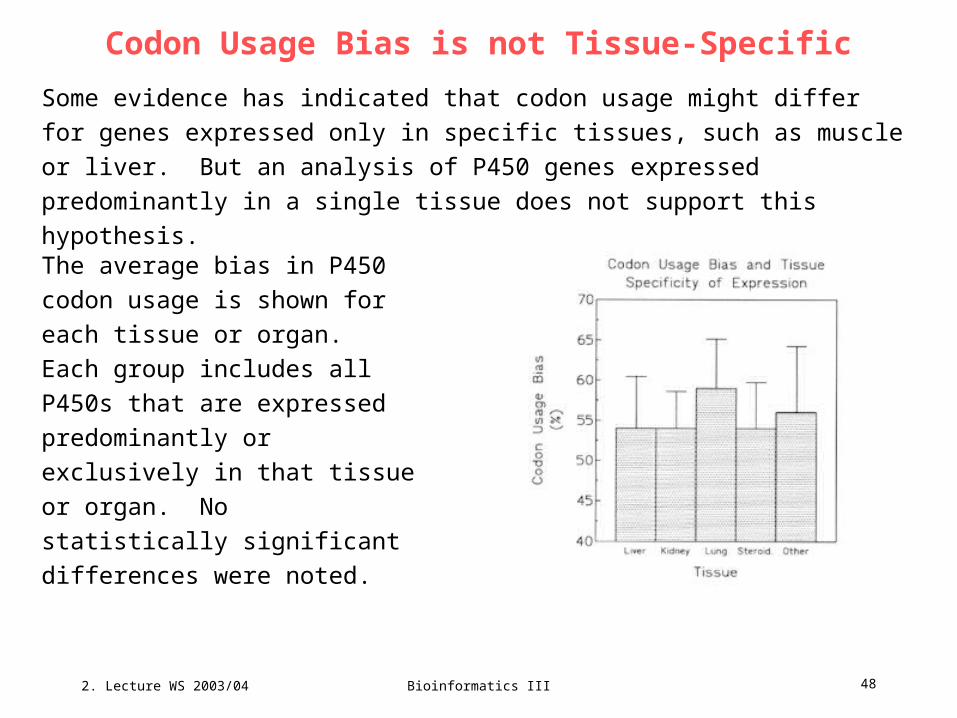
Some evidence has indicated that codon usage might differ for genes expressed
only in specific tissues, such as muscle or liver. But an analysis of P450 genes
expressed predominantly in a single tissue does not support this hypothesis.
The average bias in P450 codon
usage is shown for each tissue or
organ. Each group includes all
P450s that are expressed
predominantly or exclusively in that
tissue or organ. No statistically
significant differences were noted.

2. Lecture WS 2003/04
Bioinformatics III 49
Codon Usage Bias Correlates with 3rd Position C+G Content
The increasing C+G content at the codon 3rd position is the 'silent position' in
many codons because it often does not influence amino acid specificity.
This graph demonstrates that preferred P450 codons in these four mammals
usually end in C or G.
2. Lecture WS 2003/04
Bioinformatics III 50
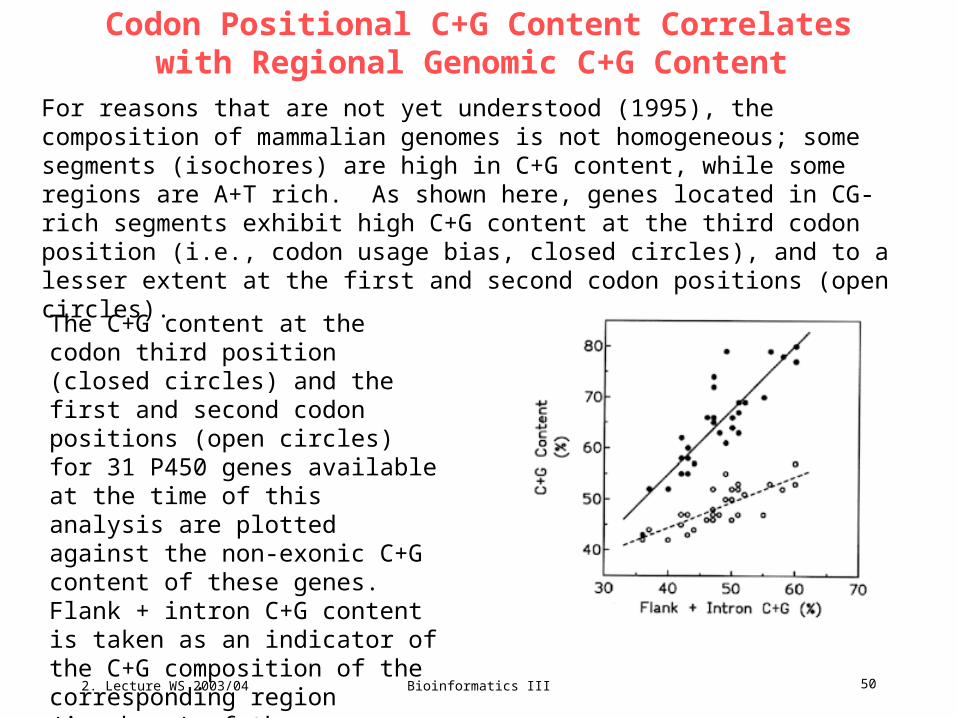
Codon Positional C+G Content Correlates with Regional Genomic C+G Content
For reasons that are not yet understood (1995), the composition of mammalian genomes is not homogeneous; some segments (isochores) are high in C+G content, while some regions are A+T rich. As shown here, genes located in CG-rich segments exhibit high C+G content at the third codon position (i.e., codon usage bias, closed circles), and to a lesser extent at the first and second codon positions (open circles).
The C+G content at the codon third position (closed circles) and the first and second codon positions (open circles) for 31 P450 genes available at the time of this analysis are plotted against the non-exonic C+G content of these genes. Flank + intron C+G content is taken as an indicator of the C+G composition of the corresponding region (isochore) of the genome.
2. Lecture WS 2003/04
Bioinformatics III 51
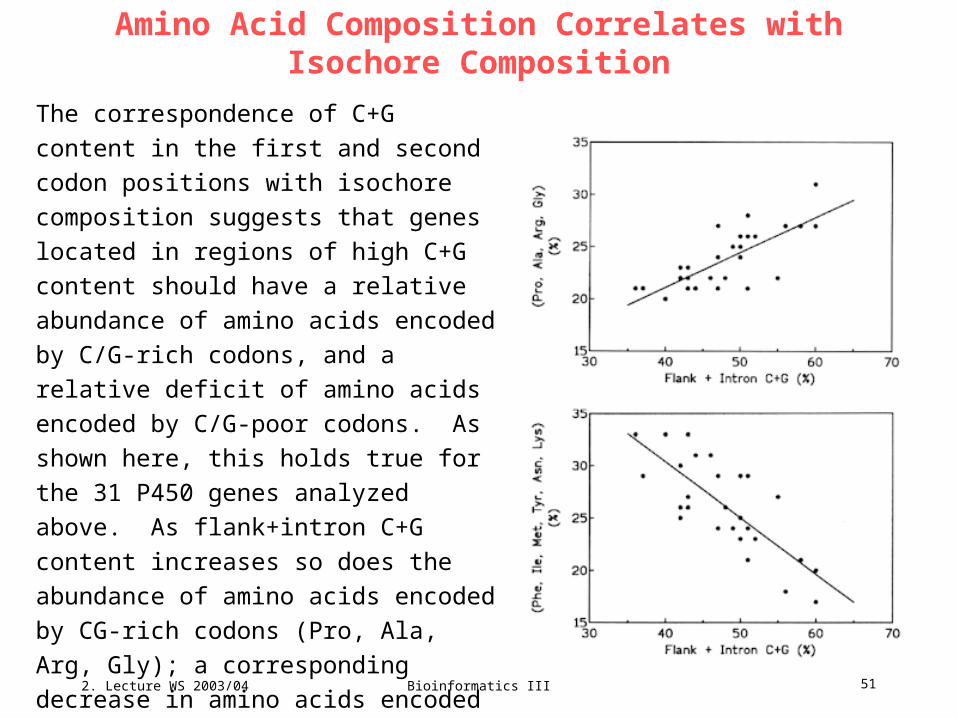
Amino Acid Composition Correlates with Isochore Composition
The correspondence of C+G content in the
first and second codon positions with
isochore composition suggests that genes
located in regions of high C+G content
should have a relative abundance of amino
acids encoded by C/G-rich codons, and a
relative deficit of amino acids encoded by
C/G-poor codons. As shown here, this
holds true for the 31 P450 genes analyzed
above. As flank+intron C+G content
increases so does the abundance of amino
acids encoded by CG-rich codons (Pro,
Ala, Arg, Gly); a corresponding decrease in
amino acids encoded by CG-poor codons is
also seen (Phe, Ile, Met, Tyr, Asn, Lys).

2. Lecture WS 2003/04
Bioinformatics III 52
Codon usage: Cytochrome P450
Amino Acid Composition Correlates with
Codon Usage Bias
As noted earlier, codon 3rd position C+G
content (or codon usage bias) correlates with
regional genomic nucleotide composition.
Thus codon usage bias can be taken as a proxy
for isochore composition. This is illustrated by
the figures to the right, where amino acid
content correlates with codon 3rd position C+G
content.
Thus, the regional genomic nucleotide
composition influences the composition of
genes and, surprisingly, their encoded
proteins.
2. Lecture WS 2003/04
Bioinformatics III 53
Codon usage: Conclusions
• Codon usage bias in mammals appears to reflect the composition of the
genome in which the gene lies; genes in GC-rich regions of the genome will
exhibit biased codon usage, in which a majority of the codons end in C or G.
• This genomic influence extends to the first and second codon positions,
where increased C+G content will increase those amino acids encoded by
CG-rich codons (Pro, Ala, Arg, Gly) and decrease those amino acids encoded
by CG-poor codons (Phe, Ile, Met, Tyr, Asn, Lys).
• The total variation in amino acid composition between genes with high and
low codon usage bias is approximately 20%, and the content of any one
amino acid changes from 2-6%. This is sufficient to alter the characteristics of
the encoded protein, and reveals an important and previously unrecognized
force that affects protein evolution.
2. Lecture WS 2003/04
Bioinformatics III 54
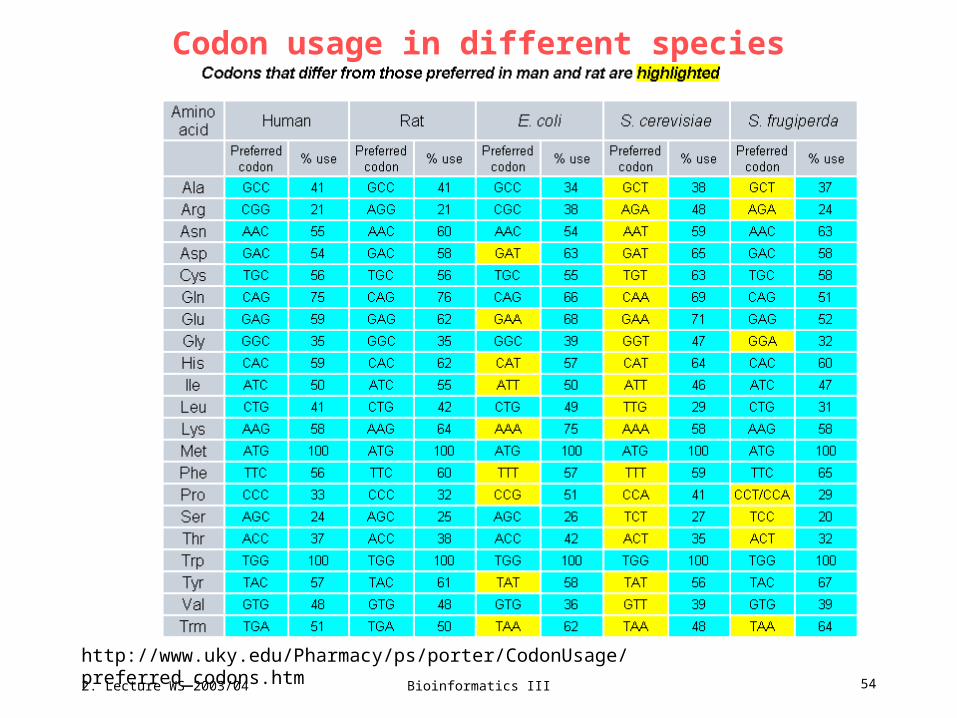
Codon usage in different species
http://www.uky.edu/Pharmacy/ps/porter/CodonUsage/preferred_codons.htm
2. Lecture WS 2003/04
Bioinformatics III 55
organelle DNA
2. Lecture WS 2003/04
Bioinformatics III 56
Organelle DNA
Not all genetic information is found in nuclear DNA. Both plants and animals have
an organelle—a "little organ" within the cell— called the mitochondrion. Each
mitochondrion has its own set of genes. (Plants also have a second organelle, the
chloroplast, which also has its own DNA.)
Cells often have multiple mitochondria, particularly cells requiring lots of energy,
such as active muscle cells. This is because mitochondria are responsible for
converting the energy stored in macromolecules into a form usable by the cell,
namely, the adenosine triphosphate (ATP) molecule. Thus, they are often
referred to as the power generators of the cell.
Unlike nuclear DNA (the DNA found within the nucleus of a cell), half of which
comes from our mother and half from our father, mitochondrial DNA is only
inherited from our mother. This is because mitochondria are only found in the
female gametes or "eggs" of sexually reproducing animals, not in the male gamete,
or sperm. Mitochondrial DNA also does not recombine; there is no shuffling of
genes from one generation to the other, as there is with nuclear genes.
2. Lecture WS 2003/04
Bioinformatics III 57
Why is there a separate mitochondrial genome?
The energy-conversion process that takes place in the mitochondria takes place
aerobically, in the presence of oxygen. Other energy conversion processes in
the cell take place anaerobically, or without oxygen. The independent aerobic
function of these organelles is thought to have evolved from bacteria that lived
inside of other simple organisms in a mutually beneficial, or symbiotic,
relationship, providing them with aerobic capacity.
Through the process of evolution, these tiny organisms became incorporated
into the cell, and their genetic systems and cellular functions became integrated
to form a single functioning cellular unit. Because mitochondria have their own
DNA, RNA, and ribosomes, this scenario is quite possible. This theory is also
supported by the existence of a eukaryotic organism, called the amoeba, which
lacks mitochondria. Therefore, amoeba must always have a symbiotic
relationship with an aerobic bacterium.
2. Lecture WS 2003/04
Bioinformatics III 58
Why study mitochondria
There are many diseases caused by mutations in mitochondrial DNA (mtDNA).
Because the mitochondria produce energy in cells, symptoms of mitochondrial
diseases often involve degeneration or functional failure of tissue. For example,
mtDNA mutations have been identified in some forms of diabetes, deafness, and
certain inherited heart diseases. In addition, mutations in mtDNA are able
accumulate throughout an individual's lifetime.
This is different from mutations in nuclear DNA, which has sophisticated repair
mechanisms to limit the accumulation of mutations. Mitochondrial DNA mutations
can also concentrate in the mitochondria of specific tissues. A variety of deadly
diseases are attributable to a large number of accumulated mutations in
mitochondria.
There is even a theory, the Mitochondrial Theory of Aging, that suggests that
accumulation of mutations in mitochondria contributes to, or drives, the aging
process.
2. Lecture WS 2003/04
Bioinformatics III 59
exons + introns, splicing
2. Lecture WS 2003/04
Bioinformatics III 60
Introns and Exons
Genes make up only about 1 percent of the total DNA in our genome. In the
human genome, the coding portions of a gene, called exons, are interrupted by
intervening sequences, called introns. In addition, a eukaryotic gene does not
code for a protein in one continuous stretch of DNA.
Both exons and introns are "transcribed" into mRNA, but before it is
transported to the ribosome, the primary mRNA transcript is edited. This editing
process removes the introns, joins the exons together, and adds unique
features to each end of the transcript to make a "mature" mRNA.
One might then ask what the purpose of an intron is if it is spliced out after it is
transcribed?
It is still unclear what all the functions of introns are, but scientists believe that
some serve as the site for recombination, the process by which progeny derive
a combination of genes different from that of either parent, resulting in novel
genes with new combinations of exons, the key to evolution.
2. Lecture WS 2003/04
Bioinformatics III 61
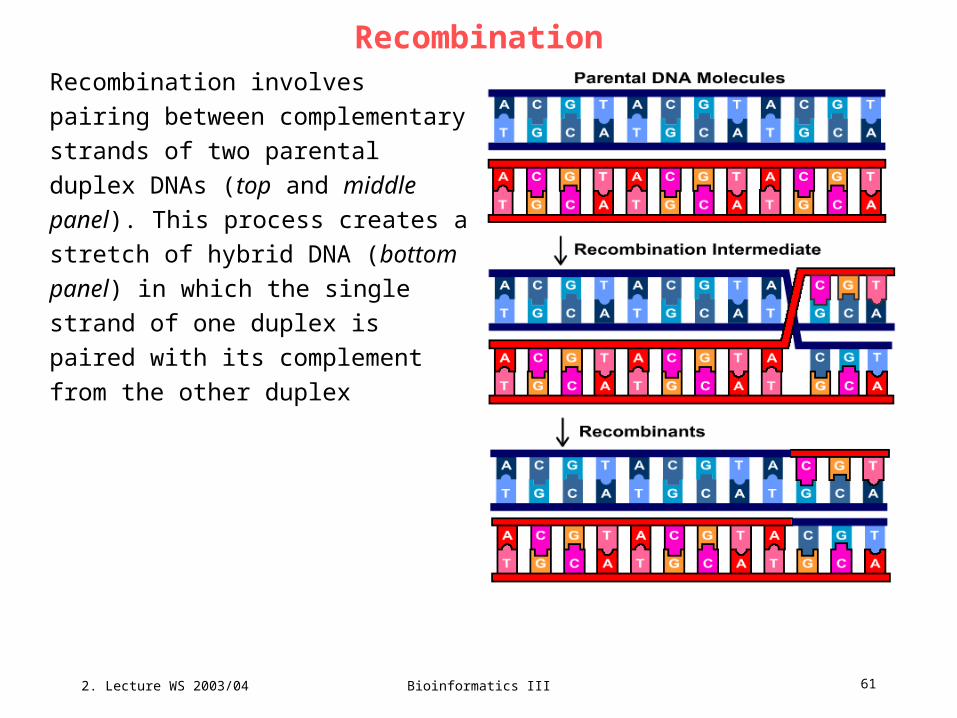
Recombination
Recombination involves pairing
between complementary strands of two
parental duplex DNAs (top and middle
panel). This process creates a stretch
of hybrid DNA (bottom panel) in which
the single strand of one duplex is
paired with its complement from the
other duplex
2. Lecture WS 2003/04
Bioinformatics III 62
Alternative Splicing
Since each exon in a eukaryotic gene encodes a portion of a protein it is
possible, by altering how the pre-mRNA is spliced, to produce different versions
of the mRNA and ultimately, different proteins. This has been demonstrated in a
number of cases and two such cases will be described here.
The first involves processing of mRNAs that will be translated into parts of
antibody molecules (immunoglobulins). On the next slide two possibilities are
shown for one such gene, the gene for the m heavy chain of the mouse IgM
immunoglobulin.
2. Lecture WS 2003/04
Bioinformatics III 63
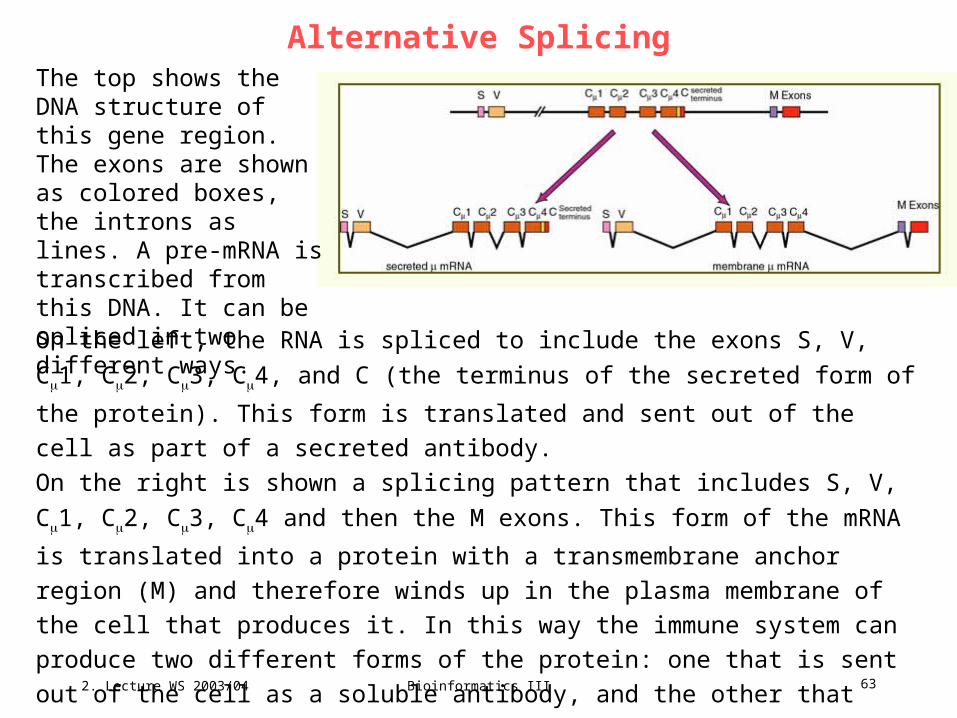
Alternative Splicing
On the left, the RNA is spliced to include the exons S, V, C1, C2, C3, C4, and C
(the terminus of the secreted form of the protein). This form is translated and sent
out of the cell as part of a secreted antibody.
On the right is shown a splicing pattern that includes S, V, C1, C2, C3, C4 and
then the M exons. This form of the mRNA is translated into a protein with a
transmembrane anchor region (M) and therefore winds up in the plasma membrane
of the cell that produces it. In this way the immune system can produce two
different forms of the protein: one that is sent out of the cell as a soluble antibody,
and the other that remains on the surface of the cell to help identify it to other cells
of the immune system.
The top shows the DNA structure of this gene region. The exons are shown as colored boxes, the introns as lines. A pre-mRNA is transcribed from this DNA. It can be spliced in two different ways.
2. Lecture WS 2003/04
Bioinformatics III 64
Alternative Splicing
Another example is the sex determination pattern of Drosophila.
There are three genes involved (the names are derived from the phenotype of
mutations):
Sxl (sex lethal)
tra (transformer)
dsx (double sex).
Each of these genes produces a pre-mRNA that has two possible splicing
patterns, depending upon whether the fly is male (XY) or female (XX).
2. Lecture WS 2003/04
Bioinformatics III 65
Alternative Splicing
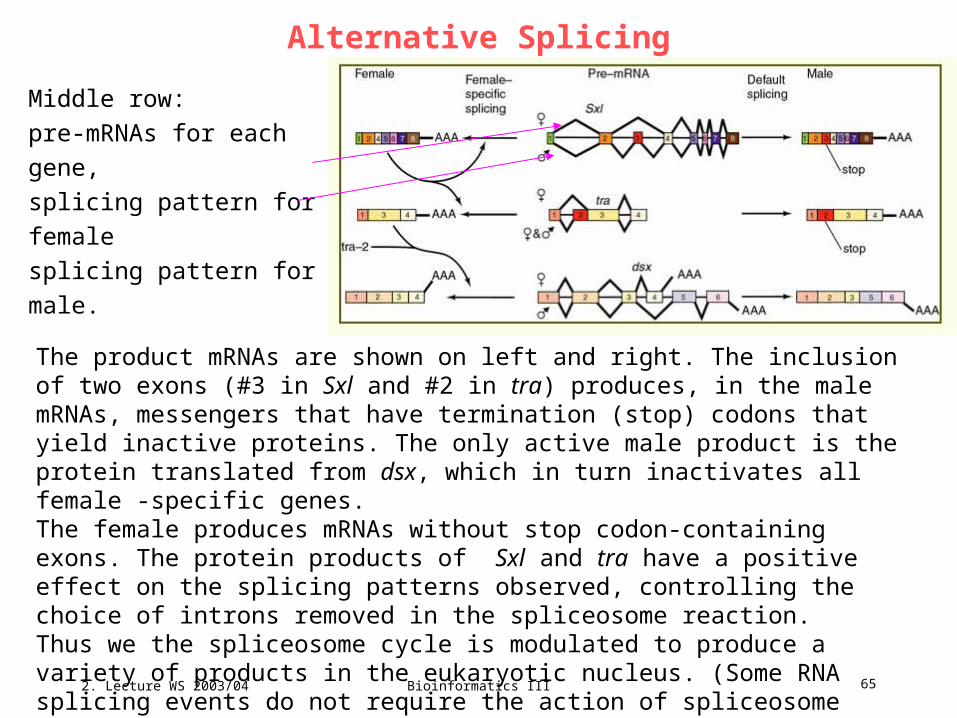
The product mRNAs are shown on left and right. The inclusion of two exons (#3 in Sxl and #2 in tra) produces, in the male mRNAs, messengers that have termination (stop) codons that yield inactive proteins. The only active male product is the protein translated from dsx, which in turn inactivates all female -specific genes.The female produces mRNAs without stop codon-containing exons. The protein products of Sxl and tra have a positive effect on the splicing patterns observed, controlling the choice of introns removed in the spliceosome reaction.Thus we the spliceosome cycle is modulated to produce a variety of products in the eukaryotic nucleus. (Some RNA splicing events do not require the action of spliceosome complexes).
Middle row:
pre-mRNAs for each gene,
splicing pattern for female
splicing pattern for male.

2. Lecture WS 2003/04
Bioinformatics III 66
knowledge about whole genomes:genome content and annotation
2. Lecture WS 2003/04
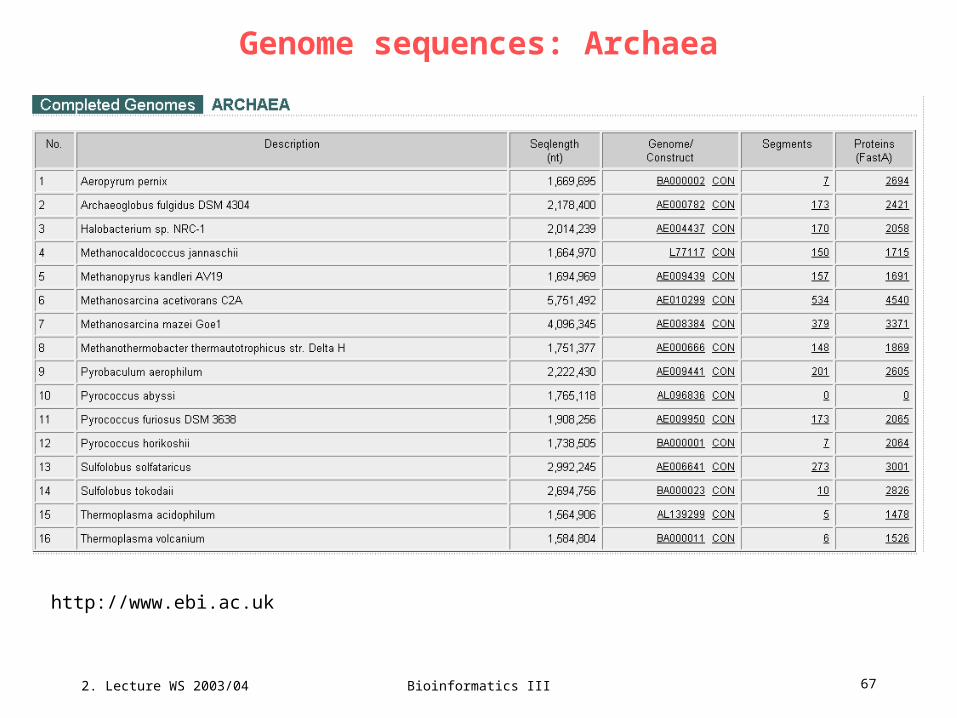
Bioinformatics III 67
Genome sequences: Archaea
http://www.ebi.ac.uk

2. Lecture WS 2003/04
Bioinformatics III 68
Protein length
http://www.ebi.ac.uk

2. Lecture WS 2003/04
Bioinformatics III 69
Amino acid composition
http://www.ebi.ac.uk
2. Lecture WS 2003/04
Bioinformatics III 70
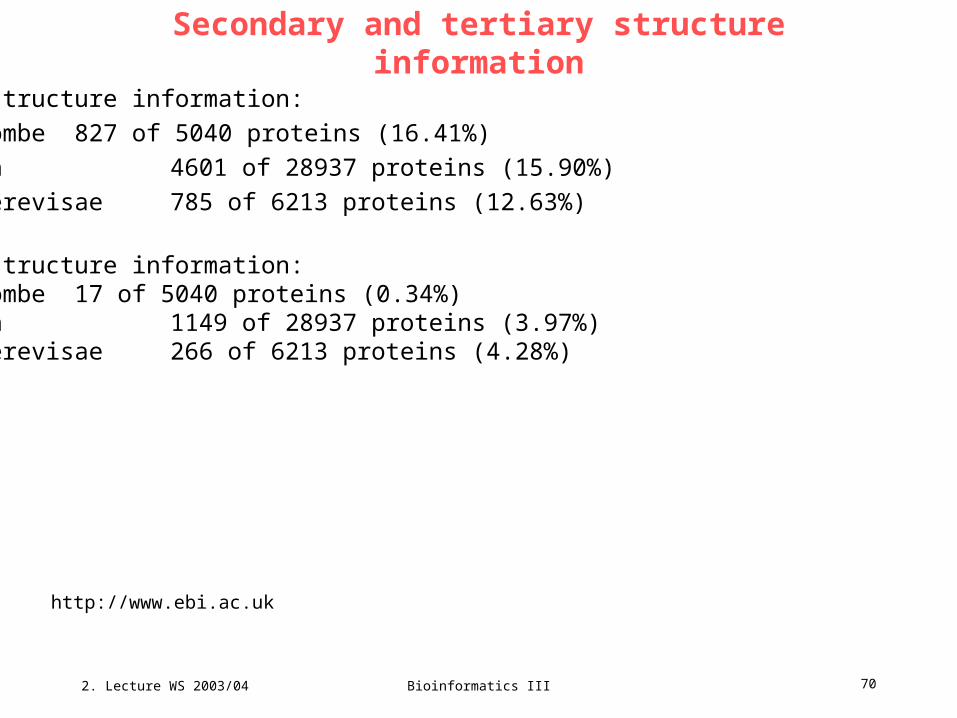
Secondary and tertiary structure information
2nd structure information:
S. pombe 827 of 5040 proteins (16.41%)
Human 4601 of 28937 proteins (15.90%)
S. cerevisae 785 of 6213 proteins (12.63%)
3rd structure information:S. pombe 17 of 5040 proteins (0.34%)human 1149 of 28937 proteins (3.97%)S. cerevisae 266 of 6213 proteins (4.28%)
http://www.ebi.ac.uk
2. Lecture WS 2003/04
Bioinformatics III 71
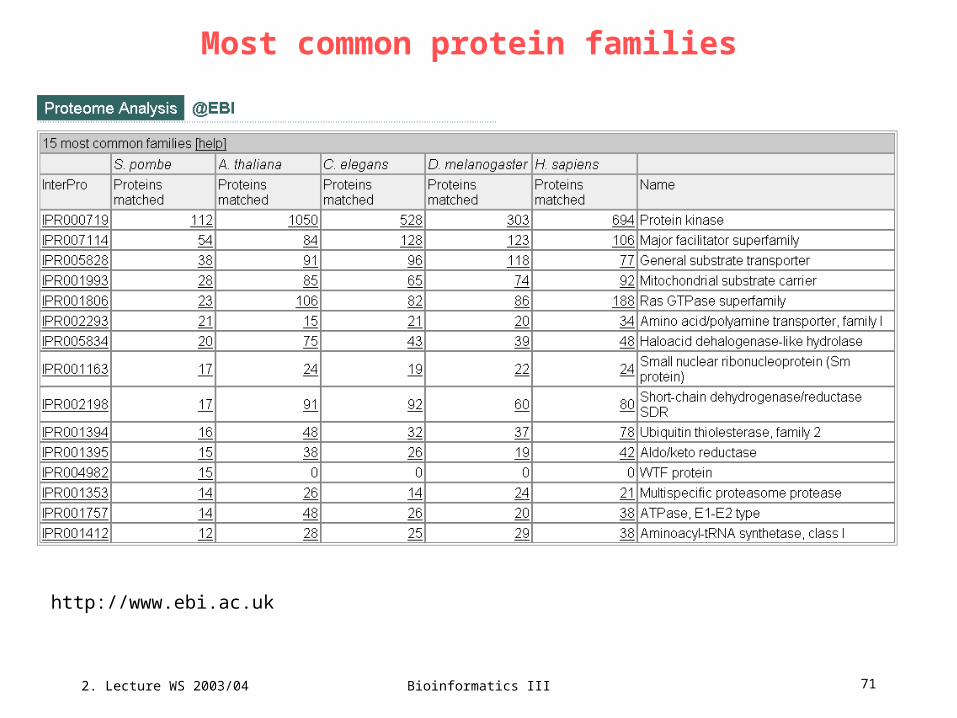
Most common protein families
http://www.ebi.ac.uk

2. Lecture WS 2003/04
Bioinformatics III 72
What comes after human genome sequence is completed?
The working draft DNA sequence and the more polished 2003 version represent
an enormous achievement. However, much work remains to realize the full
potential of the accomplishment.
Early explorations into the human genome, now joined by projects on the genomes
of a number of other organisms, are generating data whose volume and complex
analyses are unprecedented in biology.
Genomic-scale technologies will be needed to study and compare entire
genomes, sets of expressed RNAs or proteins, gene families from a large number
of species, variation among individuals, and the classes of gene regulatory
elements.
2. Lecture WS 2003/04
Bioinformatics III 73
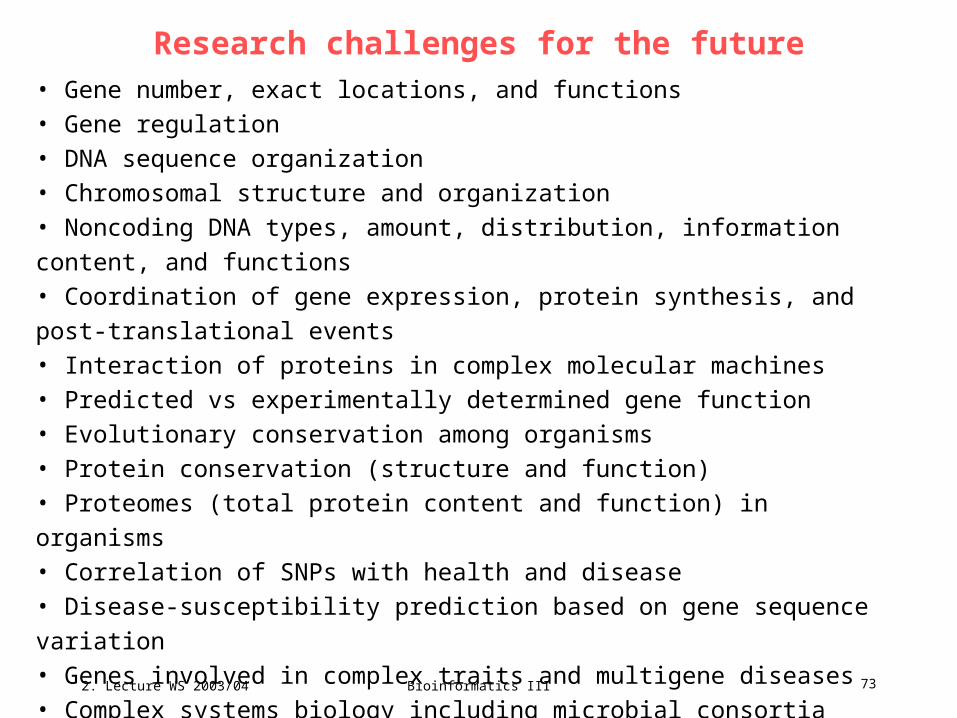
Research challenges for the future
• Gene number, exact locations, and functions • Gene regulation • DNA sequence organization • Chromosomal structure and organization • Noncoding DNA types, amount, distribution, information content, and functions • Coordination of gene expression, protein synthesis, and post-translational events • Interaction of proteins in complex molecular machines • Predicted vs experimentally determined gene function • Evolutionary conservation among organisms • Protein conservation (structure and function) • Proteomes (total protein content and function) in organisms • Correlation of SNPs with health and disease • Disease-susceptibility prediction based on gene sequence variation • Genes involved in complex traits and multigene diseases • Complex systems biology including microbial consortia useful for environmental
restoration • Developmental genetics, genomics