Embed Size (px)
Citation preview

2 March 2009 SR4D
Speech Recognition for Dummies
Bhiksha Raj
2 March 2009 SR4D
String Matching
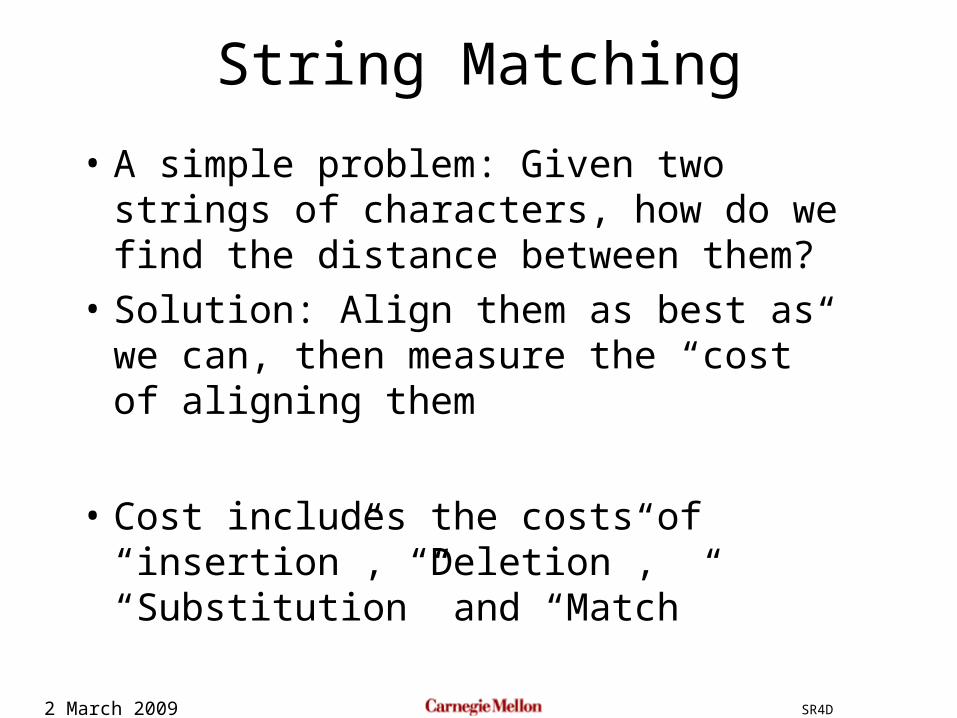
• A simple problem: Given two strings of characters, how do we find the distance between them?
• Solution: Align them as best as we can, then measure the “cost” of aligning them
• Cost includes the costs of “insertion”, “Deletion”, “Substitution” and “Match”
2 March 2009 SR4D
DDC CB
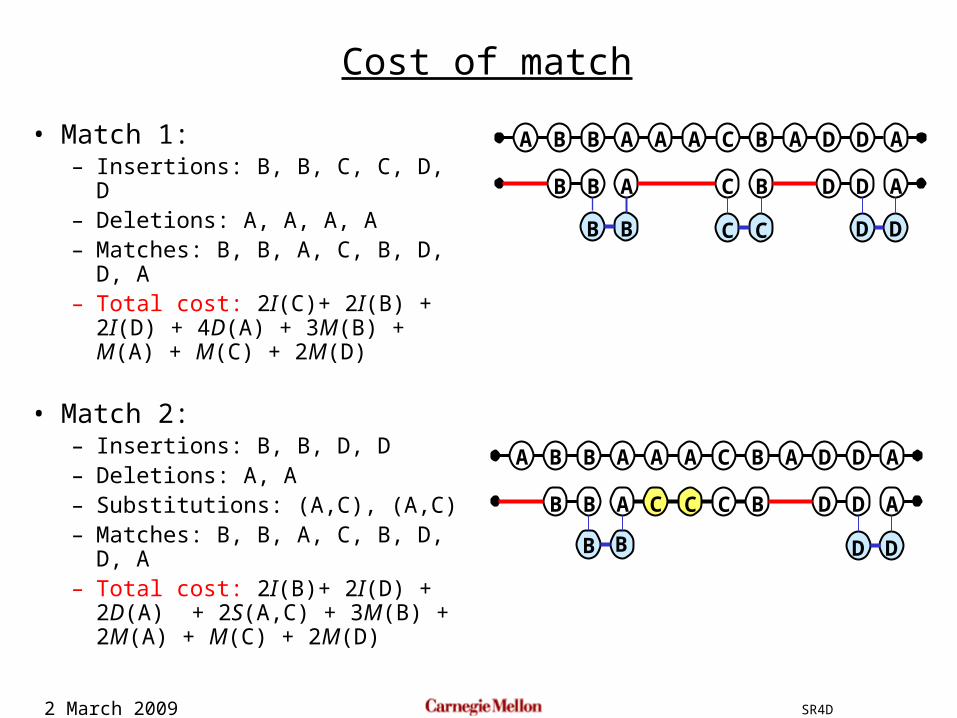
• Match 1: – Insertions: B, B, C, C, D, D– Deletions: A, A, A, A– Matches: B, B, A, C, B, D, D, A– Total cost: 2I(C)+ 2I(B) + 2I(D)
+ 4D(A) + 3M(B) + M(A) + M(C) + 2M(D)
• Match 2:– Insertions: B, B, D, D– Deletions: A, A– Substitutions: (A,C), (A,C)– Matches: B, B, A, C, B, D, D, A– Total cost: 2I(B)+ 2I(D) +
2D(A) + 2S(A,C) + 3M(B) + 2M(A) + M(C) + 2M(D)
DA B B A A A C B A D
B B
B
A C B D D
A
A
DD
C C
B
DA B B A A A C B A D
B B
B
A C B D D
A
A
Cost of match
2 March 2009 SR4D
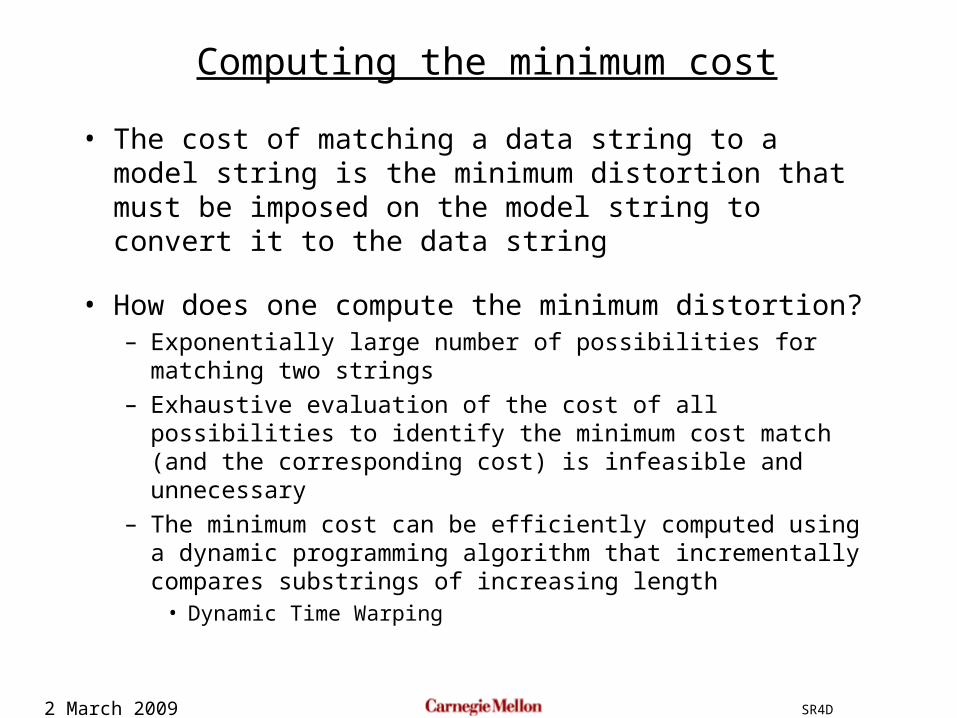
• The cost of matching a data string to a model string is the minimum distortion that must be imposed on the model string to convert it to the data string
• How does one compute the minimum distortion?– Exponentially large number of possibilities for matching two
strings
– Exhaustive evaluation of the cost of all possibilities to identify the minimum cost match (and the corresponding cost) is infeasible and unnecessary
– The minimum cost can be efficiently computed using a dynamic programming algorithm that incrementally compares substrings of increasing length
• Dynamic Time Warping
Computing the minimum cost
2 March 2009 SR4D
D
A
B
B
A
A
A
C
B
A
D
A
B B B B A
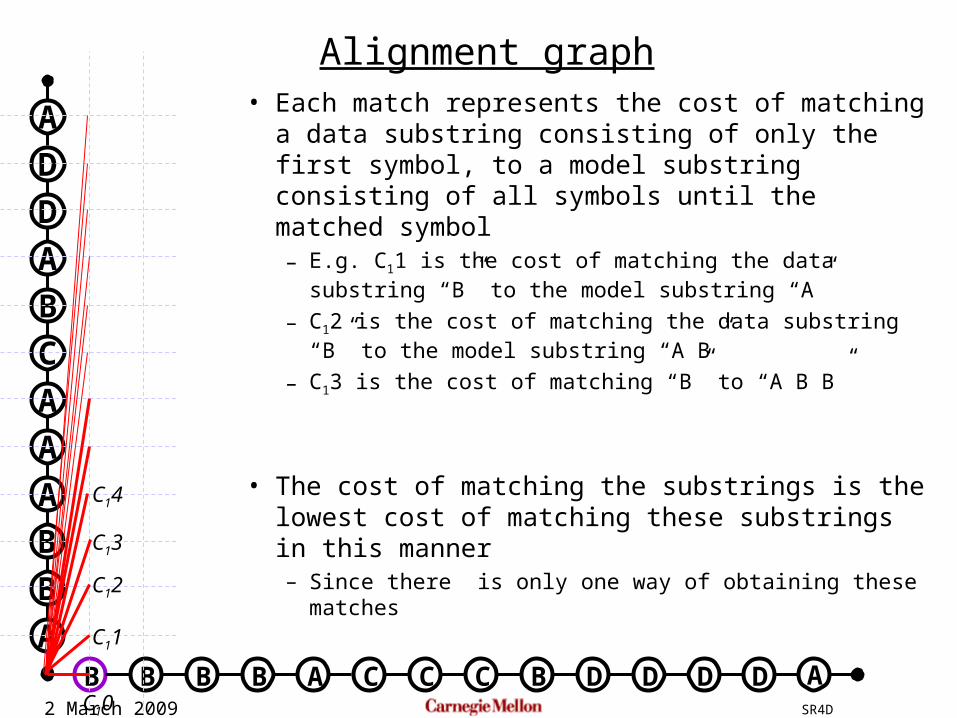
• Each match represents the cost of matching a data substring consisting of only the first symbol, to a model substring consisting of all symbols until the matched symbol– E.g. C11 is the cost of matching the data substring “B”
to the model substring “A”
– C12 is the cost of matching the data substring “B” to the model substring “A B”
– C13 is the cost of matching “B” to “A B B”
• The cost of matching the substrings is the lowest cost of matching these substrings in this manner– Since there is only one way of obtaining these matches
C11
C13
C12
C14
C10 DDC C C B D D A
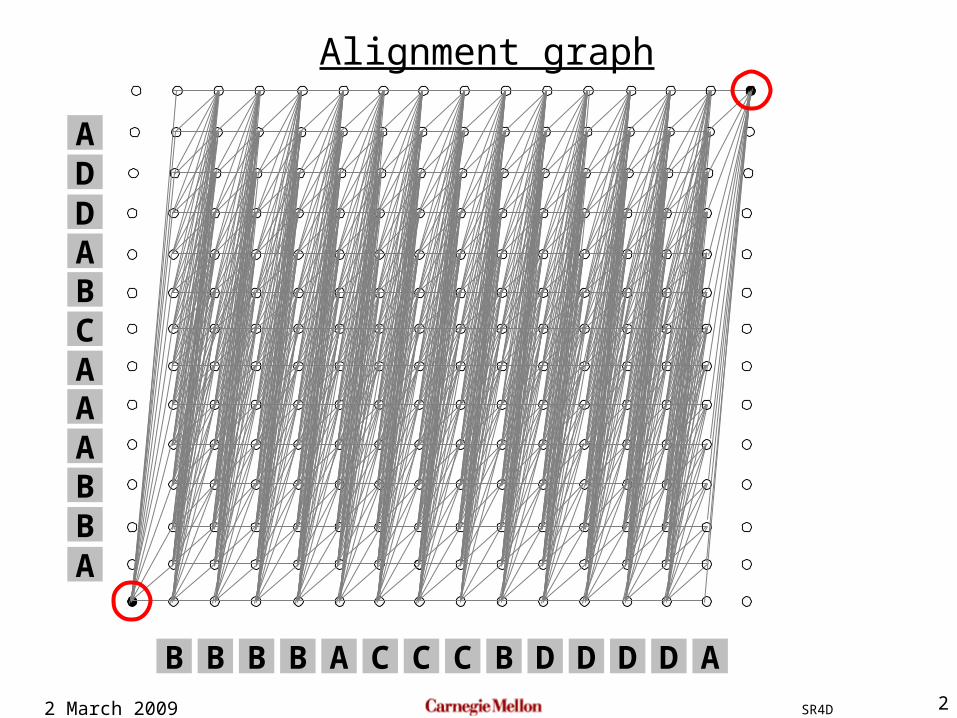
Alignment graph
2 March 2009 SR4D
D
A
B
B
A
A
A
C
B
A
D
A
B B B B A
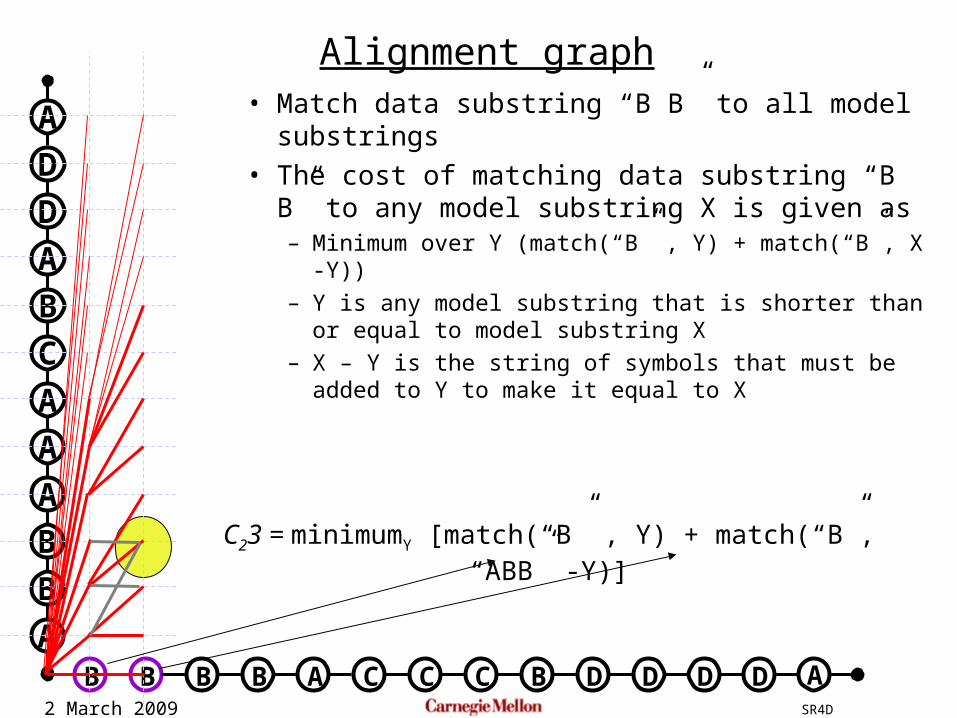
• Match data substring “B B” to all model substrings
• The cost of matching data substring “B B” to any model substring X is given as– Minimum over Y (match(“B” , Y) + match(“B”, X -Y))
– Y is any model substring that is shorter than or equal to model substring X
– X – Y is the string of symbols that must be added to Y to make it equal to X
C23 = minimumY [match(“B” , Y) + match(“B”, “ABB” -Y)]
DDC C C B D D A
Alignment graph
2 March 2009 SR4D
D
A
B
B
A
A
A
C
B
A
D
A
B B B B A
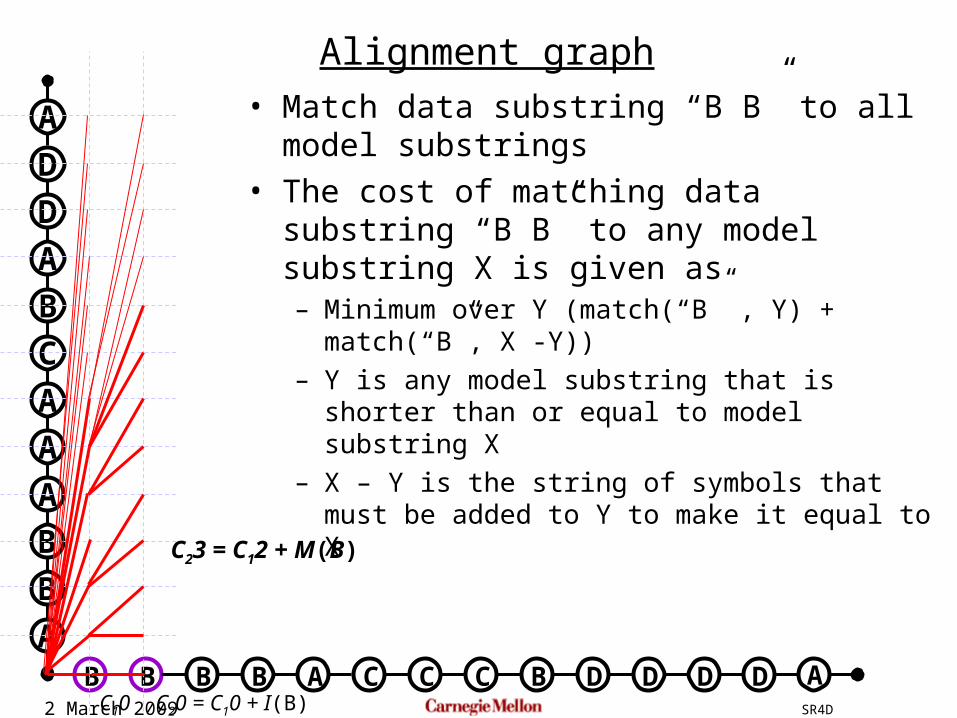
• Match data substring “B B” to all model substrings
• The cost of matching data substring “B B” to any model substring X is given as– Minimum over Y (match(“B” , Y) + match(“B”, X -Y))
– Y is any model substring that is shorter than or equal to model substring X
– X – Y is the string of symbols that must be added to Y to make it equal to X
C10 C20 = C10 + I(B)
C23 = C12 + M(B)
DDC C C B D D A
Alignment graph
2 March 2009 SR4D
D
A
B
B
A
A
A
C
B
A
D
A
B B B B A
C11
C13
C12
C14
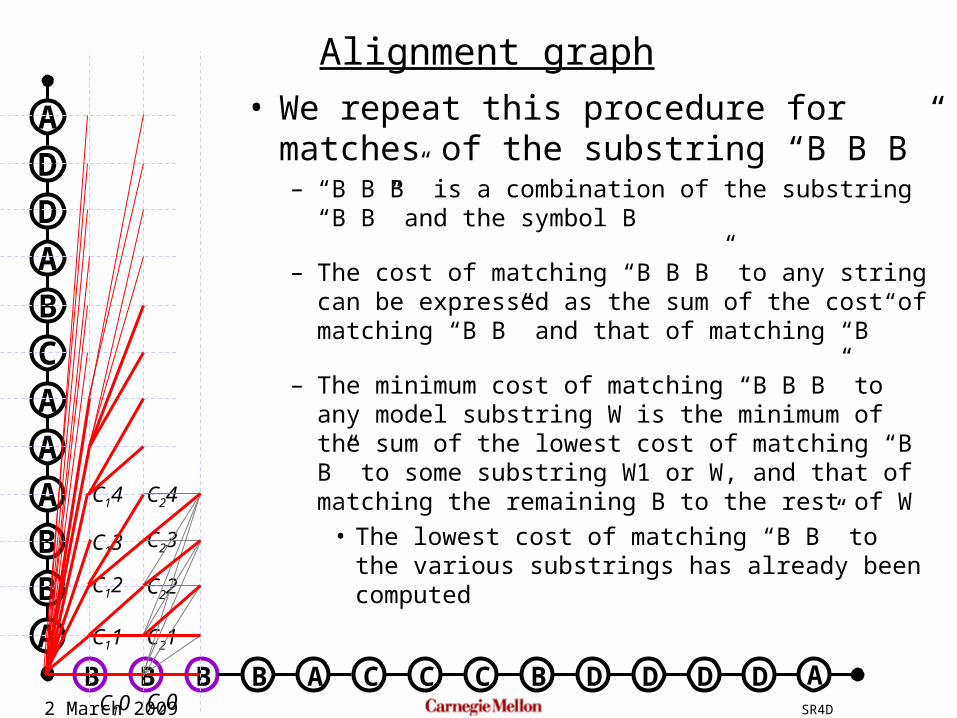
• We repeat this procedure for matches of the substring “B B B”– “B B B” is a combination of the substring
“B B” and the symbol B
– The cost of matching “B B B” to any string can be expressed as the sum of the cost of matching “B B” and that of matching “B”
– The minimum cost of matching “B B B” to any model substring W is the minimum of the sum of the lowest cost of matching “B B” to some substring W1 or W, and that of matching the remaining B to the rest of W
• The lowest cost of matching “B B” to the various substrings has already been computed
C10 C20
C21
C22
C23
C24
DDC C C B D D A
Alignment graph
2 March 2009 SR4D
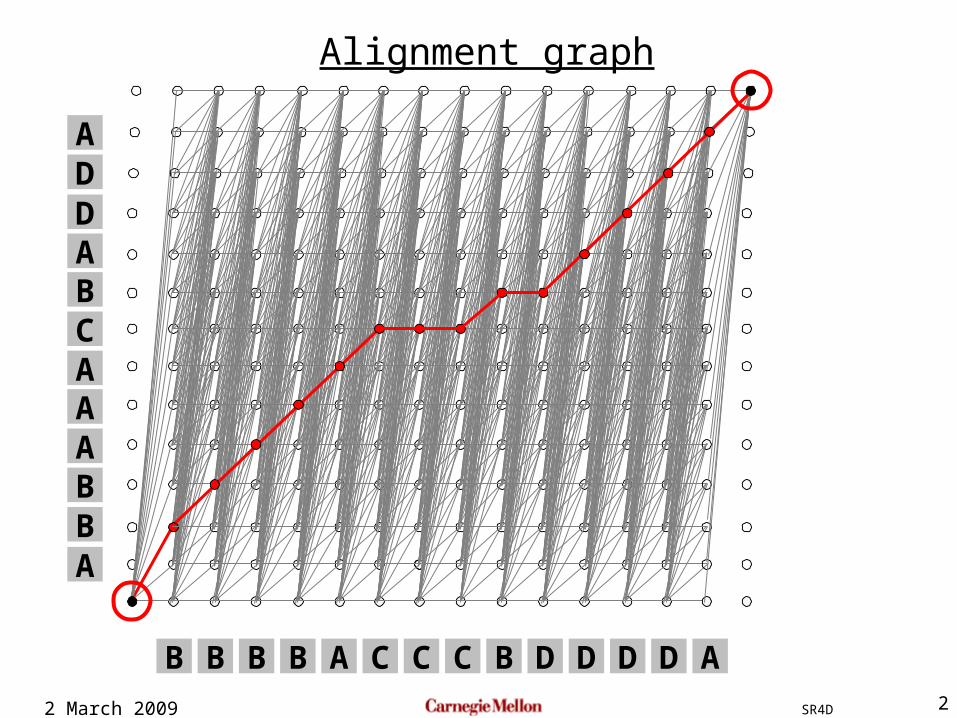
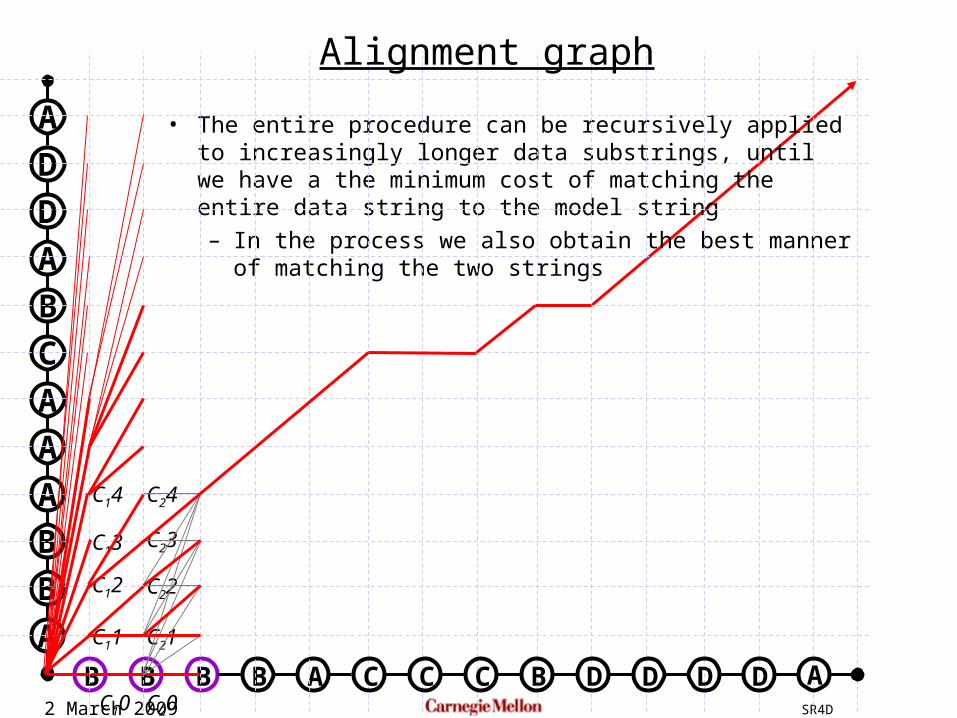
• The entire procedure can be recursively applied to increasingly longer data substrings, until we have a the minimum cost of matching the entire data string to the model string– In the process we also obtain the best manner of matching
the two strings
D
A
B
B
A
A
A
C
B
A
D
A
B B B B A
C11
C13
C12
C14
C10 C20
C21
C22
C23
C24
DDC C C B D D A
Alignment graph
2 March 2009 SR4D
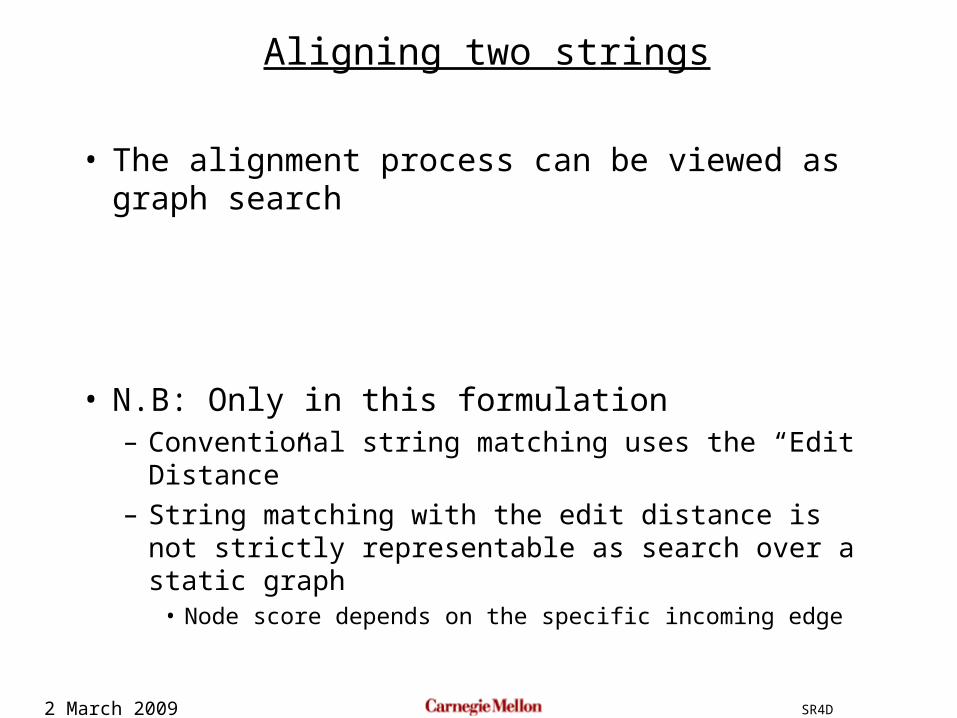
• The alignment process can be viewed as graph search
• N.B: Only in this formulation– Conventional string matching uses the “Edit Distance”
– String matching with the edit distance is not strictly representable as search over a static graph
• Node score depends on the specific incoming edge
Aligning two strings
2 March 2009 SR4D
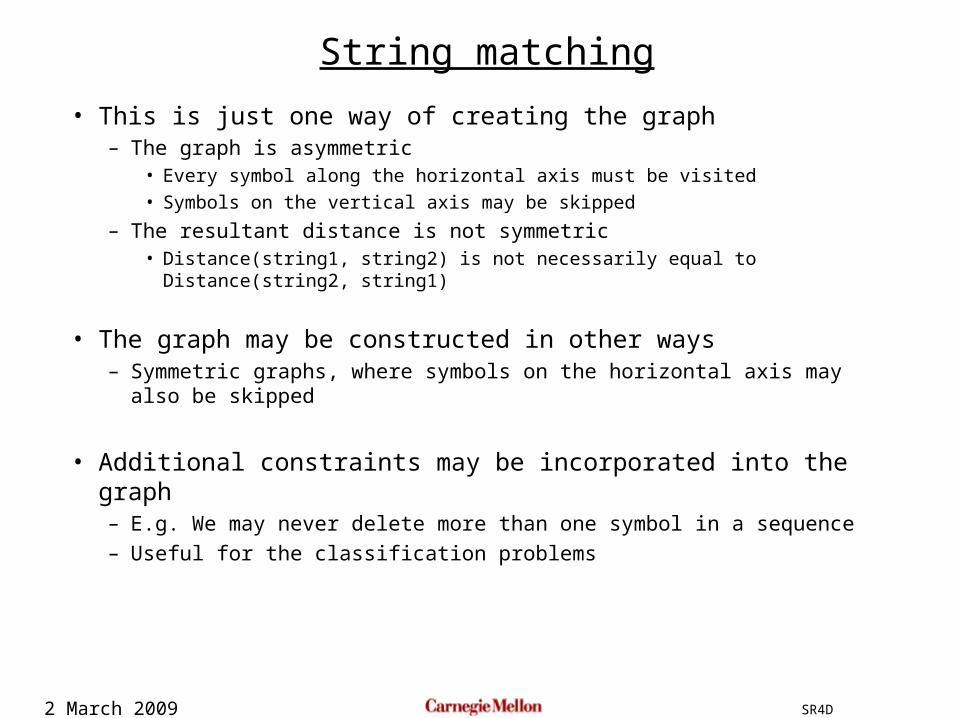
• This is just one way of creating the graph– The graph is asymmetric
• Every symbol along the horizontal axis must be visited• Symbols on the vertical axis may be skipped
– The resultant distance is not symmetric• Distance(string1, string2) is not necessarily equal to Distance(string2, string1)
• The graph may be constructed in other ways– Symmetric graphs, where symbols on the horizontal axis may also be
skipped
• Additional constraints may be incorporated into the graph– E.g. We may never delete more than one symbol in a sequence
– Useful for the classification problems
String matching
2 March 2009 SR4D
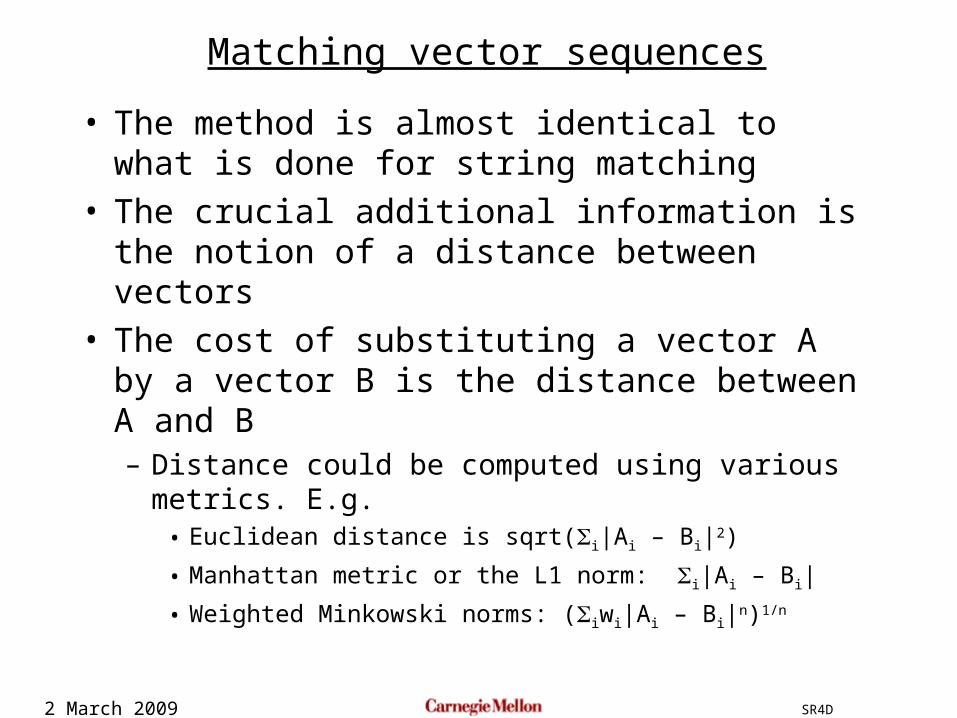
• The method is almost identical to what is done for string matching
• The crucial additional information is the notion of a distance between vectors
• The cost of substituting a vector A by a vector B is the distance between A and B– Distance could be computed using various metrics. E.g.
• Euclidean distance is sqrt(i|Ai – Bi|2)
• Manhattan metric or the L1 norm: i|Ai – Bi|
• Weighted Minkowski norms: (iwi|Ai – Bi|n)1/n
Matching vector sequences
2 March 2009 SR4D
DTW and speech recognition
• Simple speech recognition (e.g. we want to recognize names for voice dialling)
• Store one or more examples of the speaker uttering each of the words as templates
• Given a new word, match the new recording against each of the templates
• Select the template for which the final DTW matching cost is lowest
2 March 2009 SR4D
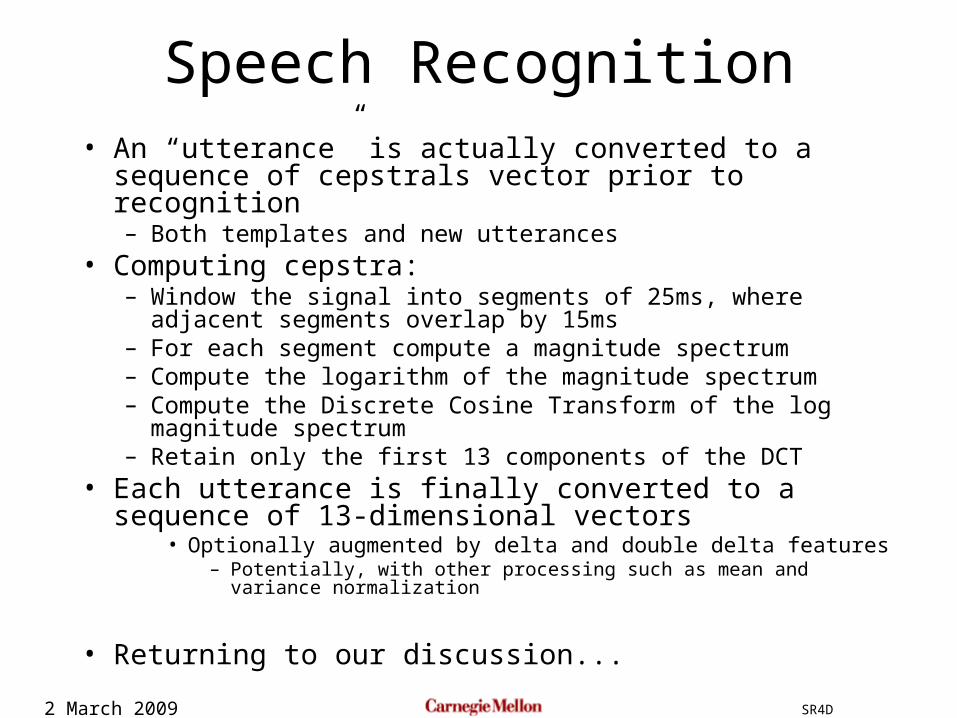
Speech Recognition• An “utterance” is actually converted to a sequence of
cepstrals vector prior to recognition– Both templates and new utterances
• Computing cepstra: – Window the signal into segments of 25ms, where adjacent segments
overlap by 15ms– For each segment compute a magnitude spectrum– Compute the logarithm of the magnitude spectrum– Compute the Discrete Cosine Transform of the log magnitude
spectrum– Retain only the first 13 components of the DCT
• Each utterance is finally converted to a sequence of 13-dimensional vectors
• Optionally augmented by delta and double delta features– Potentially, with other processing such as mean and variance normalization
• Returning to our discussion...
2 March 2009 SR4D
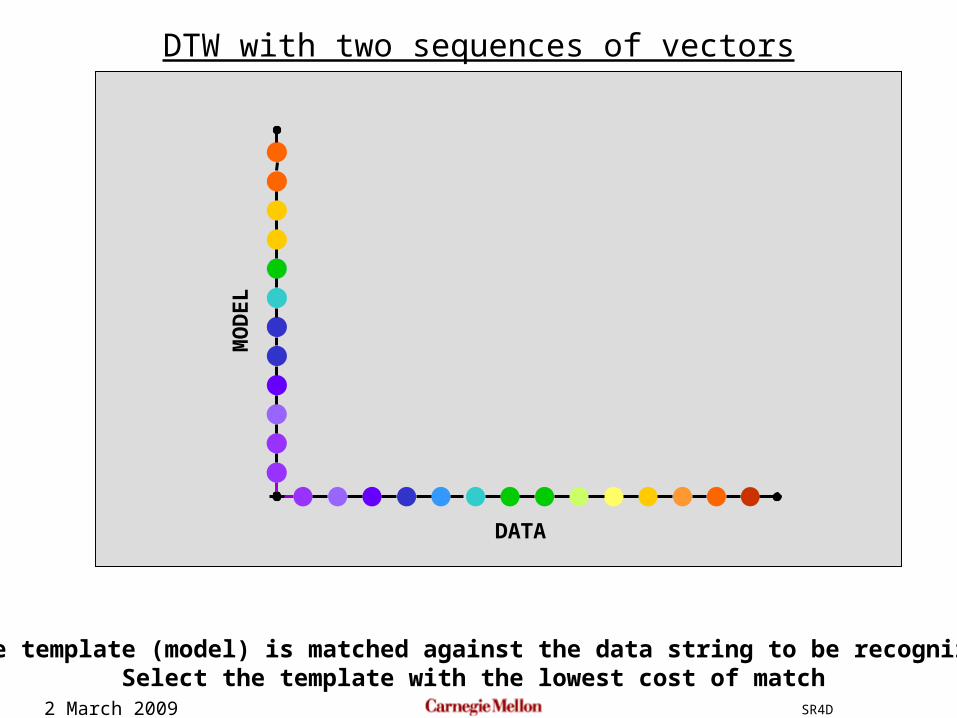
DTW with two sequences of vectors
MO
DE
L
DATA
The template (model) is matched against the data string to be recognizedSelect the template with the lowest cost of match
2 March 2009 SR4D
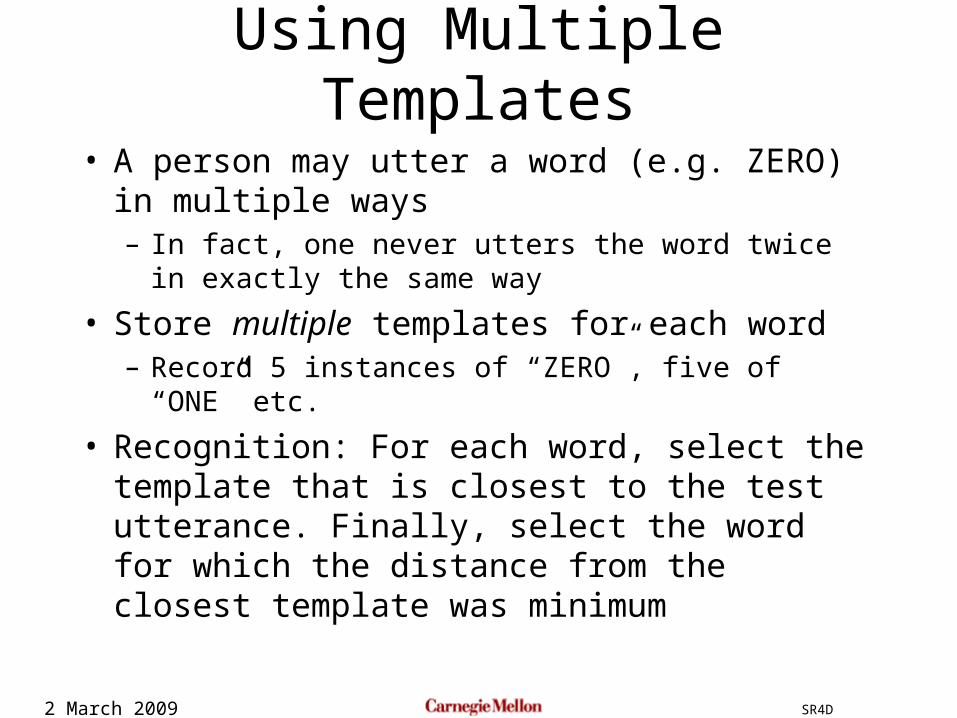
Using Multiple Templates
• A person may utter a word (e.g. ZERO) in multiple ways– In fact, one never utters the word twice in exactly the
same way
• Store multiple templates for each word– Record 5 instances of “ZERO”, five of “ONE” etc.
• Recognition: For each word, select the template that is closest to the test utterance. Finally, select the word for which the distance from the closest template was minimum
2 March 2009 SR4D
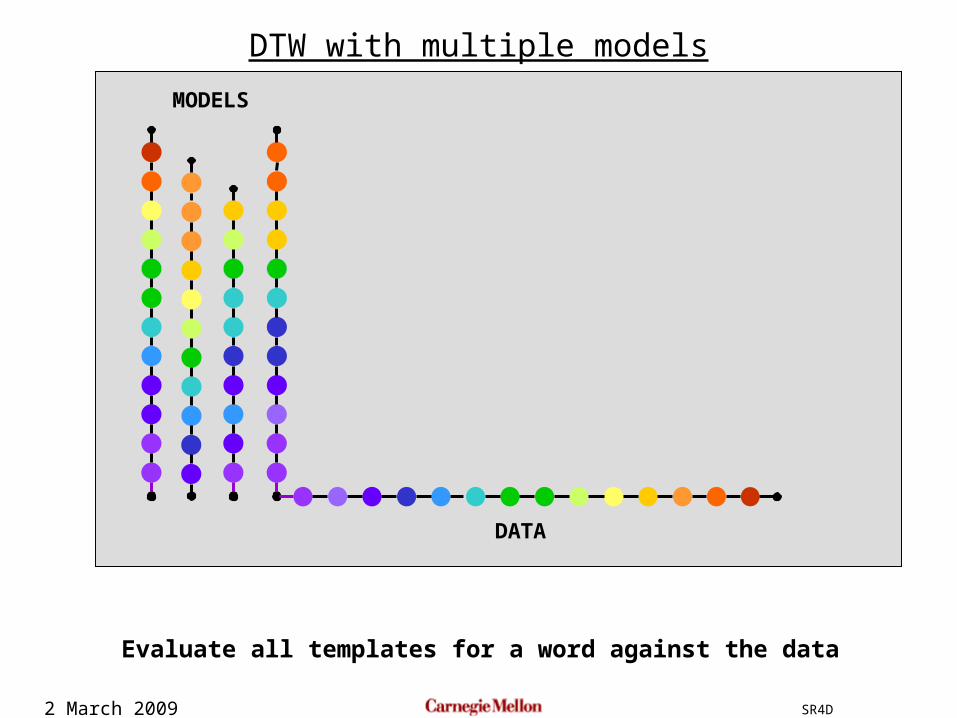
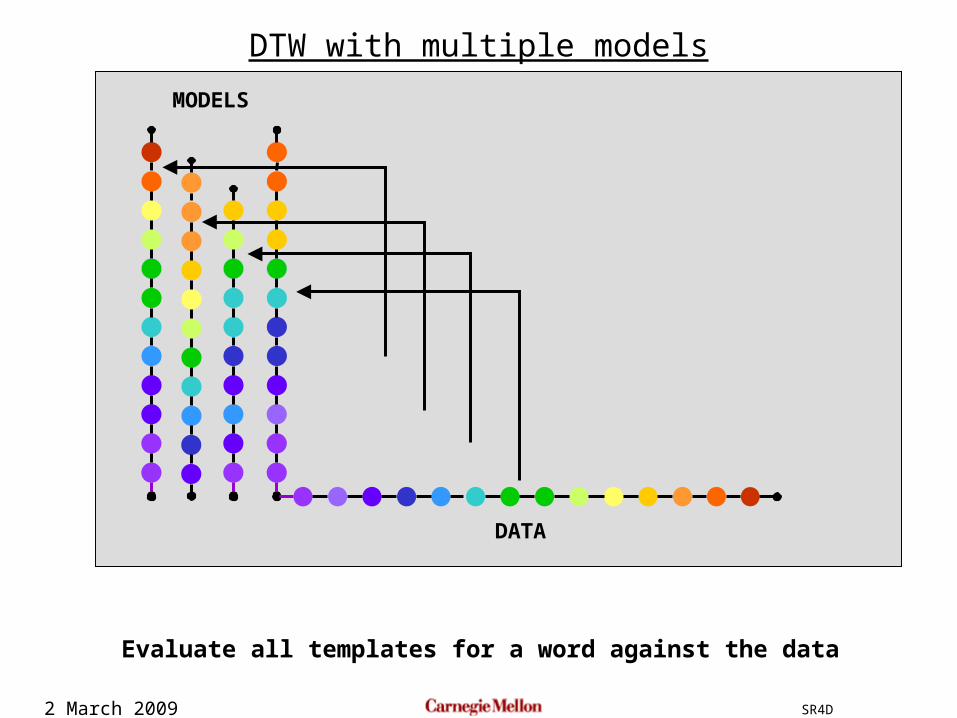
DTW with multiple models
DATA
MODELS
Evaluate all templates for a word against the data
2 March 2009 SR4D
DTW with multiple models
DATA
MODELS
Evaluate all templates for a word against the data
2 March 2009 SR4D
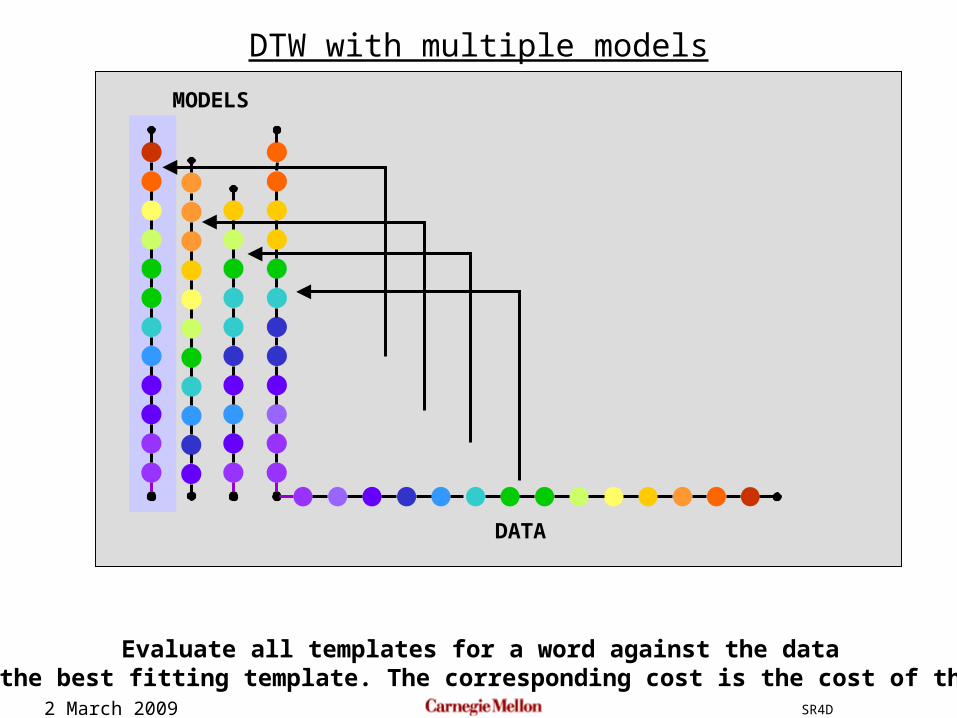
DTW with multiple models
DATA
MODELS
Evaluate all templates for a word against the dataSelect the best fitting template. The corresponding cost is the cost of the match
2 March 2009 SR4D
The Problem with Multiple Templates
• Finding the closest template to a test utterance requires evaluation of all test templates– This is expensive
• Additionally, the set of templates may not cover all possible variants of the words– We would like some mechanism whereby we can
generalize from the templates to something that represents even variants that have not hitherto been seen
• We do this by averaging the templates
2 March 2009 SR4D
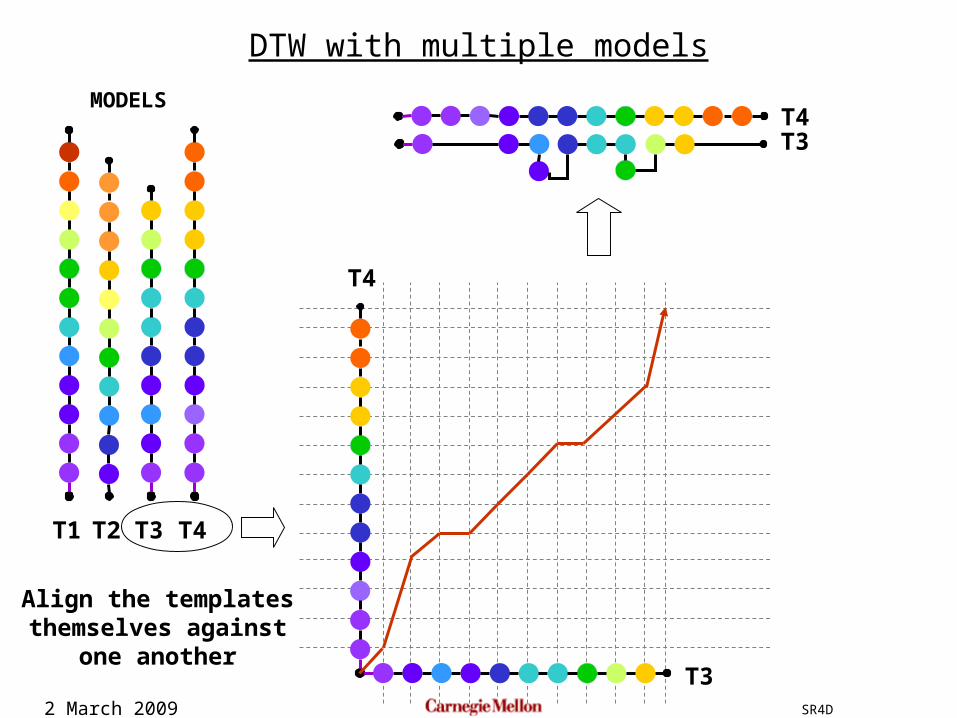
DTW with multiple models
MODELS
T1 T2 T3
T4
T4
T3
T4T3
Align the templatesthemselves against
one another
2 March 2009 SR4D
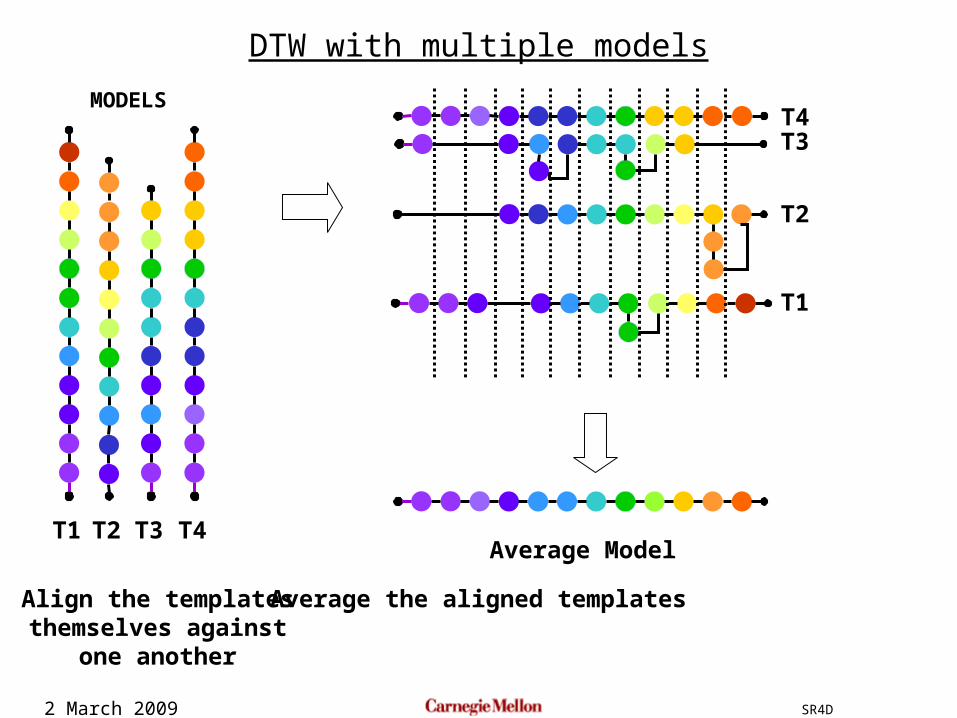
DTW with multiple models
MODELS
T1 T2 T3 T4
T4T3
T2
T1
Average Model
Align the templatesthemselves against
one another
Average the aligned templates
2 March 2009 SR4D
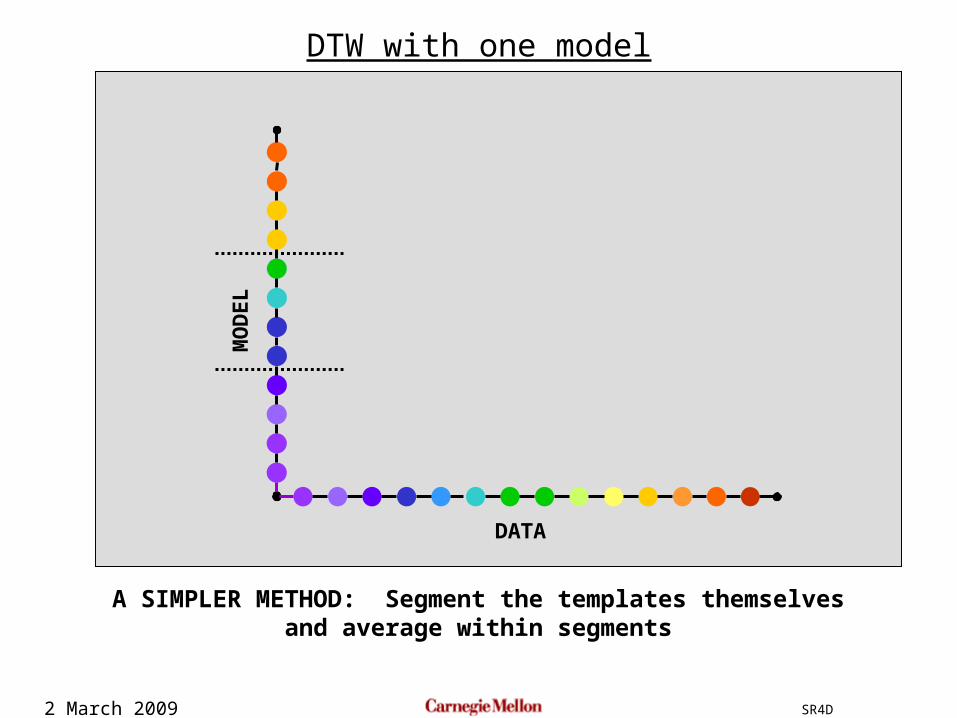
DTW with one model
MO
DE
L
DATA
A SIMPLER METHOD: Segment the templates themselvesand average within segments
2 March 2009 SR4D
MO
DE
L
DATA
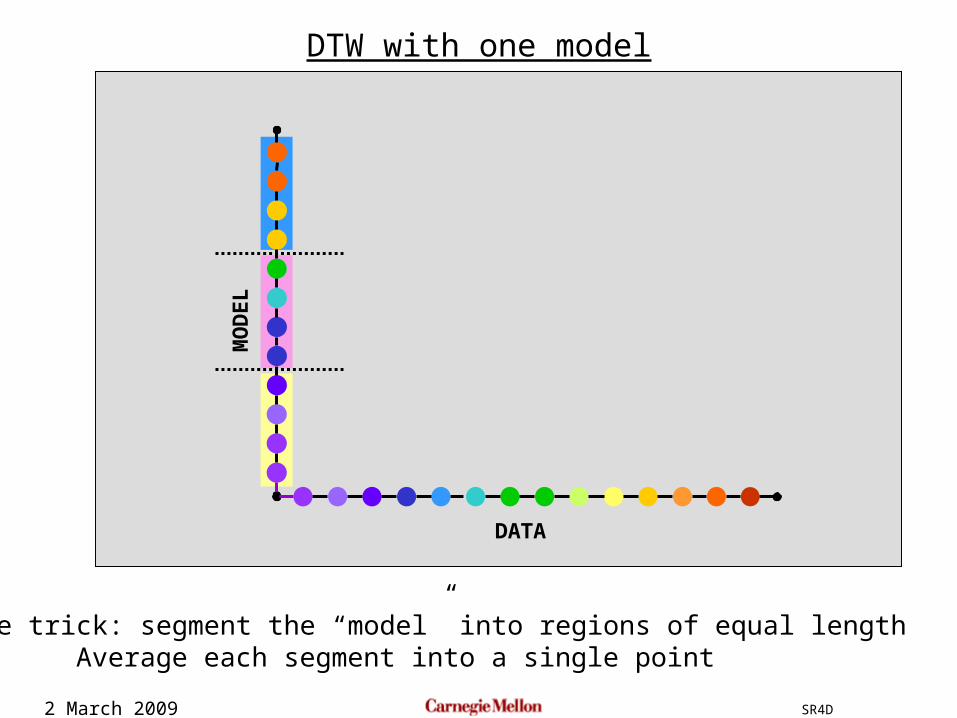
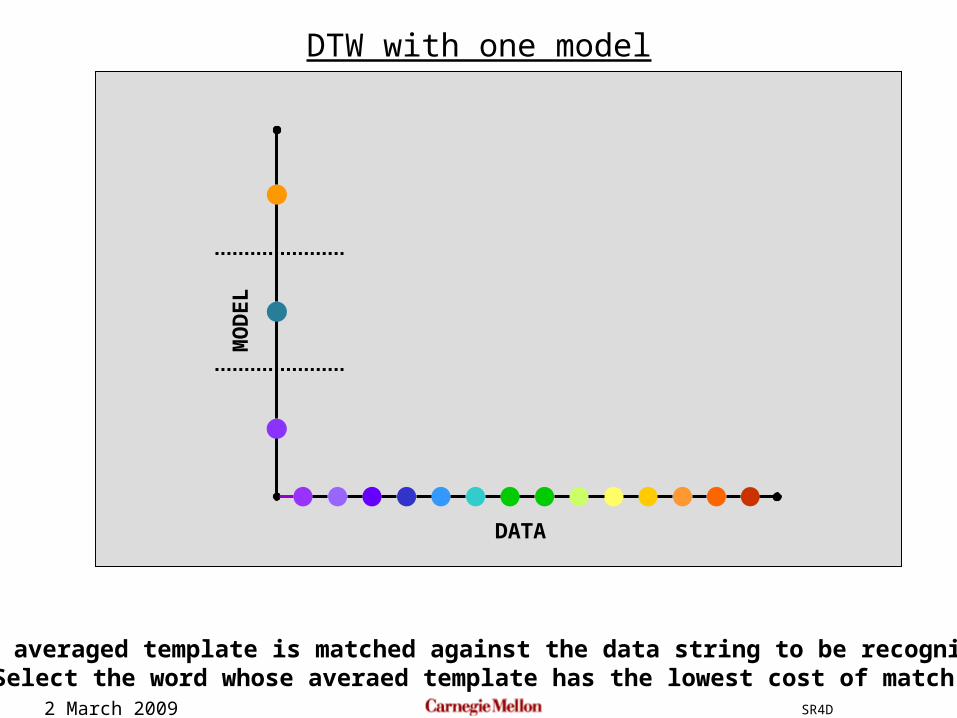
DTW with one model
A simple trick: segment the “model” into regions of equal lengthAverage each segment into a single point
2 March 2009 SR4D
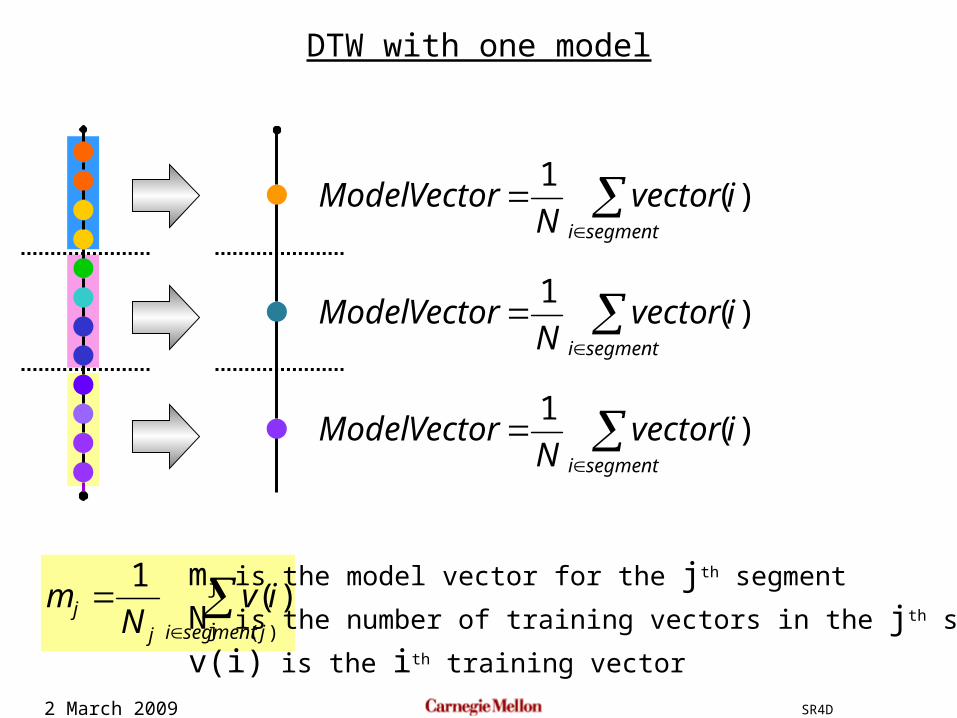
DTW with one model
segmenti
ivectorN
VectorModel )(1
segmenti
ivectorN
VectorModel )(1
segmenti
ivectorN
VectorModel )(1
)(
)(1
jsegmentijj iv
Nm
mj is the model vector for the jth segment
Nj is the number of training vectors in the jth segment
v(i) is the ith training vector
2 March 2009 SR4D
MO
DE
L
DATA
DTW with one model
The averaged template is matched against the data string to be recognizedSelect the word whose averaed template has the lowest cost of match
2 March 2009 SR4D
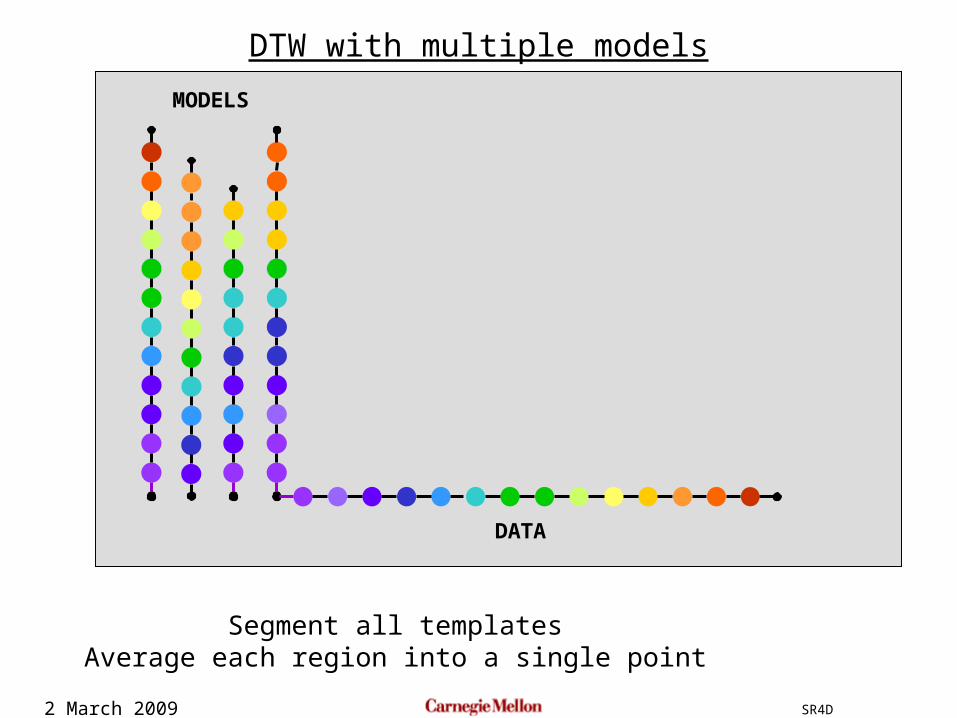
DTW with multiple models
MODELS
DATA
Segment all templatesAverage each region into a single point
2 March 2009 SR4D
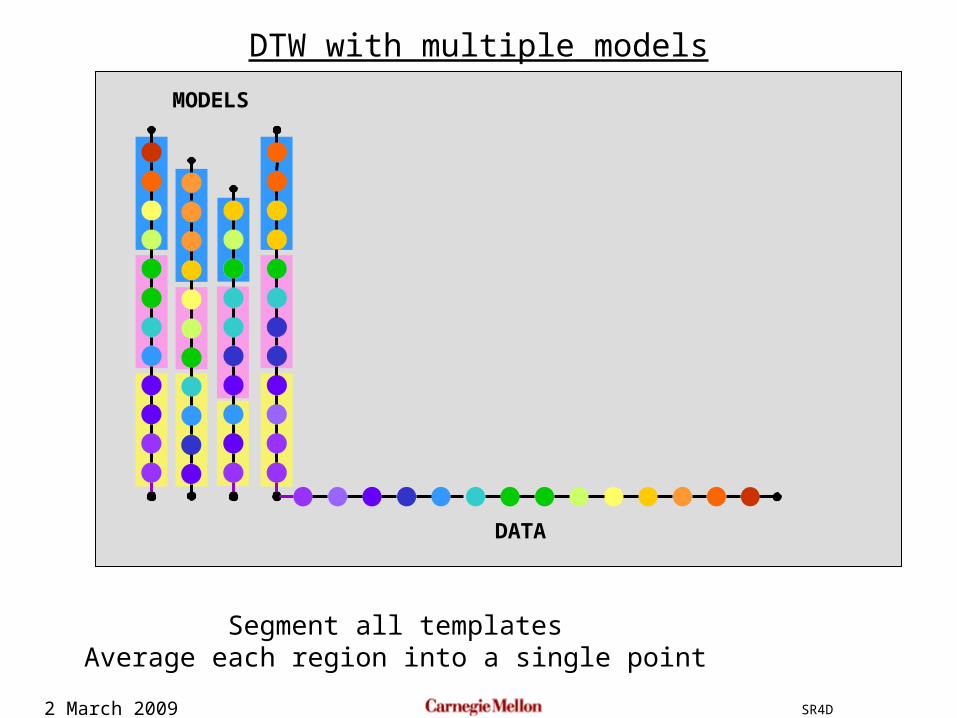
DTW with multiple models
MODELS
DATA
Segment all templatesAverage each region into a single point
2 March 2009 SR4D
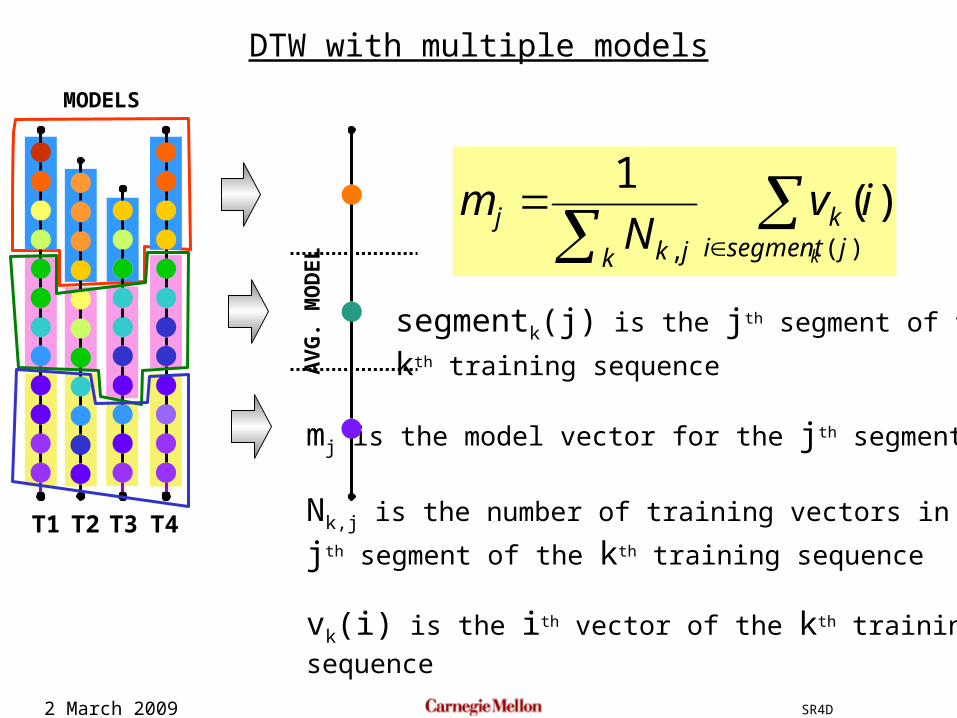
)(,
)(1
jsegmentik
k jkj
k
ivN
m
mj is the model vector for the jth segment
Nk,j is the number of training vectors in the
jth segment of the kth training sequence
vk(i) is the ith vector of the kth training
sequence
T1 T2 T3 T4
MODELS
AV
G. M
OD
EL
segmentk(j) is the jth segment of the
kth training sequence
DTW with multiple models
2 March 2009 SR4D
AV
G. M
OD
EL
DATA
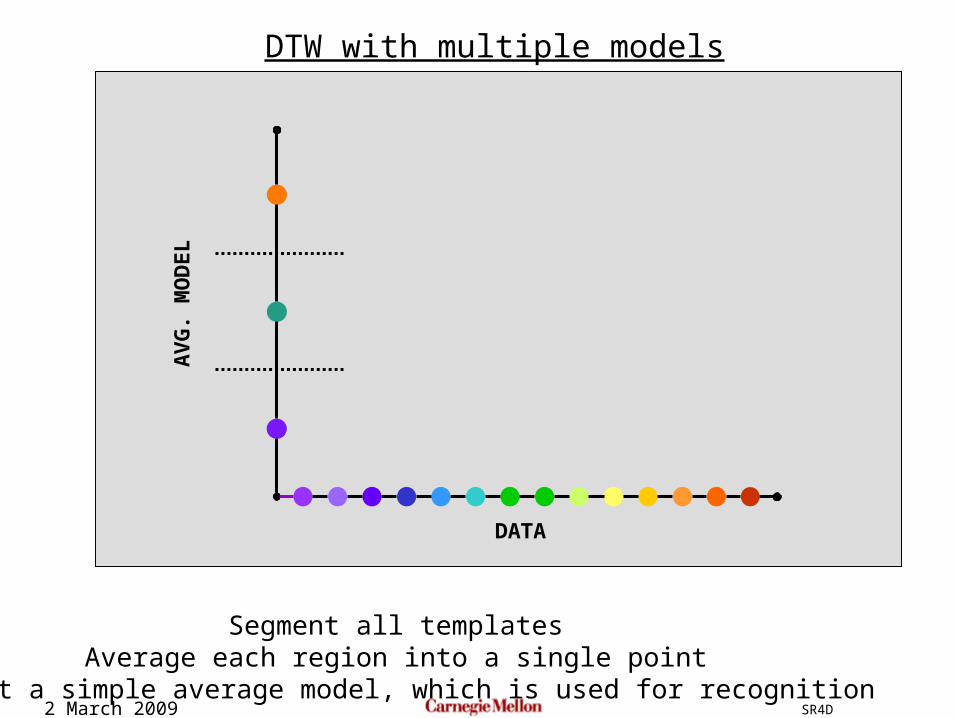
DTW with multiple models
Segment all templatesAverage each region into a single point
To get a simple average model, which is used for recognition
2 March 2009 SR4D
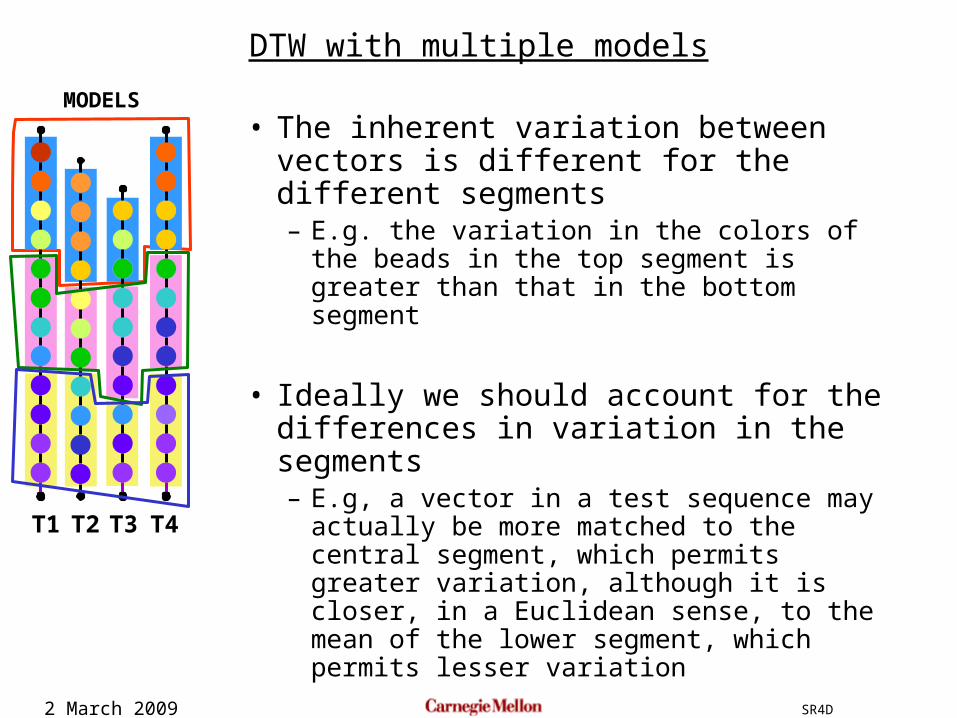
• The inherent variation between vectors is different for the different segments– E.g. the variation in the colors of the beads
in the top segment is greater than that in the bottom segment
• Ideally we should account for the differences in variation in the segments– E.g, a vector in a test sequence may actually
be more matched to the central segment, which permits greater variation, although it is closer, in a Euclidean sense, to the mean of the lower segment, which permits lesser variation
DTW with multiple models
T1 T2 T3 T4
MODELS
2 March 2009 SR4D
Tjkjsegmenti
jk
k jkj mivmiv
NC
k
)( )(1
)(,
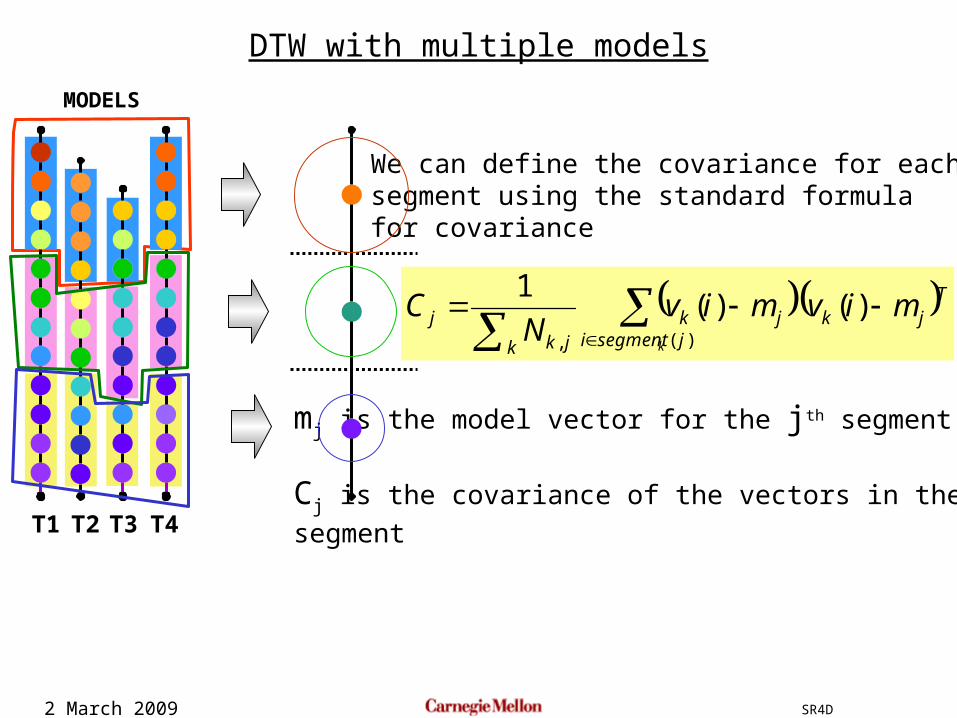
mj is the model vector for the jth segment
Cj is the covariance of the vectors in the jth
segmentT1 T2 T3 T4
MODELS
We can define the covariance for eachsegment using the standard formulafor covariance
DTW with multiple models
2 March 2009 SR4D
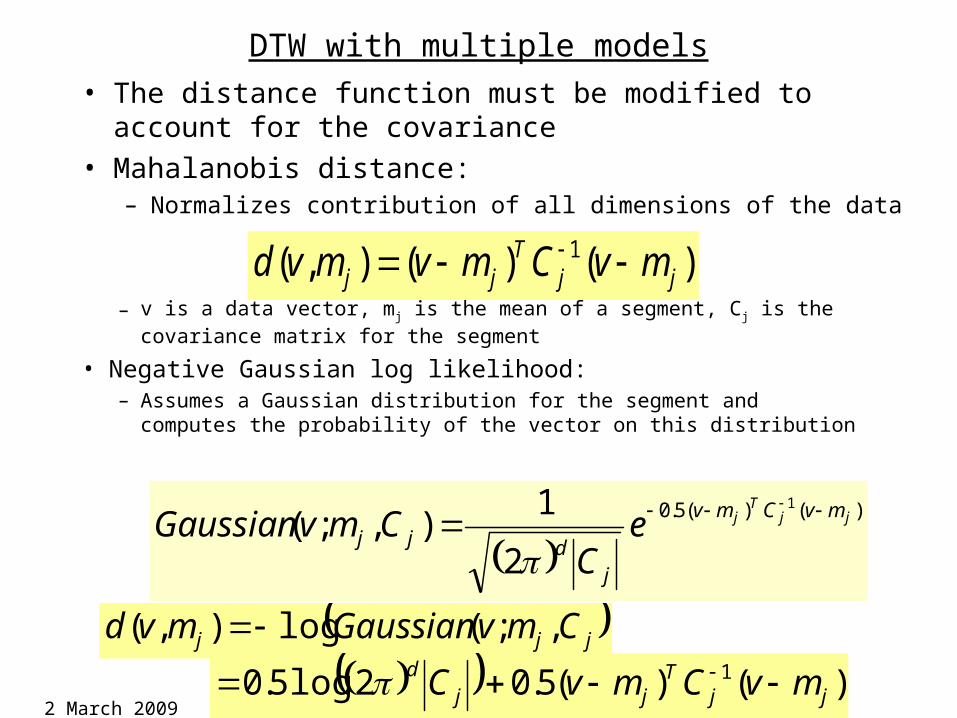
• The distance function must be modified to account for the covariance
• Mahalanobis distance:– Normalizes contribution of all dimensions of the data
DTW with multiple models
)()(),( 1jj
Tjj mvCmvmvd
– v is a data vector, mj is the mean of a segment, Cj is the covariance matrix for the segment
• Negative Gaussian log likelihood:– Assumes a Gaussian distribution for the segment and computes the probability of
the vector on this distribution
)()(5.0 1
2
1),;( jj
Tj mvCmv
jdjj e
CCmvGaussian
jjj CmvGaussianmvd ,;(log),(
)()(5.02log5.0 1jj
Tjj
d mvCmvC
2 March 2009 SR4D
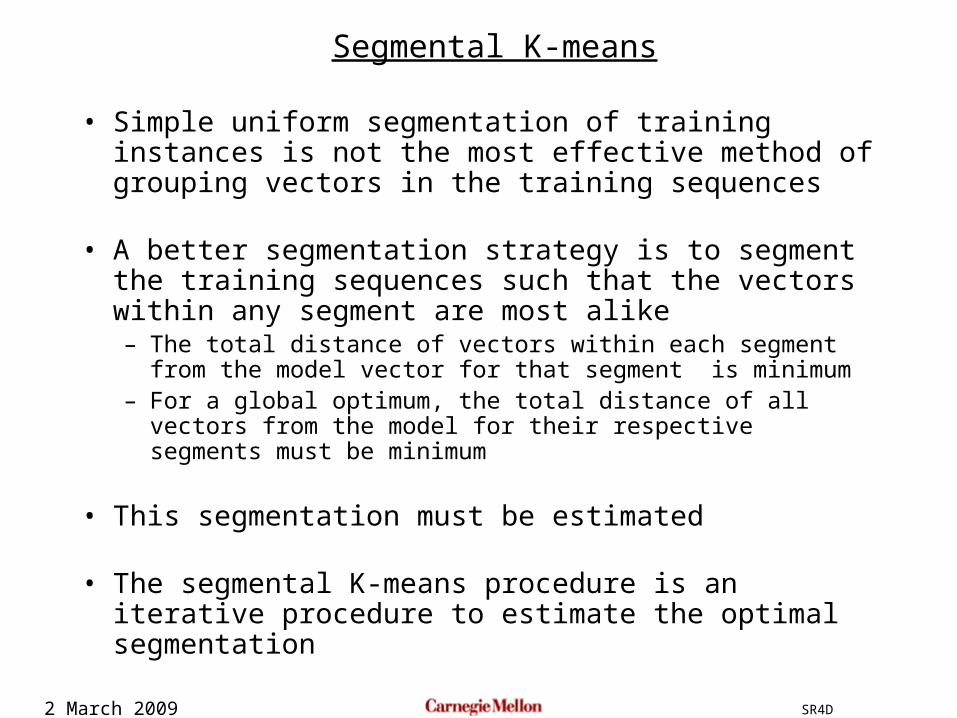
• Simple uniform segmentation of training instances is not the most effective method of grouping vectors in the training sequences
• A better segmentation strategy is to segment the training sequences such that the vectors within any segment are most alike– The total distance of vectors within each segment from the model
vector for that segment is minimum– For a global optimum, the total distance of all vectors from the
model for their respective segments must be minimum
• This segmentation must be estimated
• The segmental K-means procedure is an iterative procedure to estimate the optimal segmentation
Segmental K-means
2 March 2009 SR4D
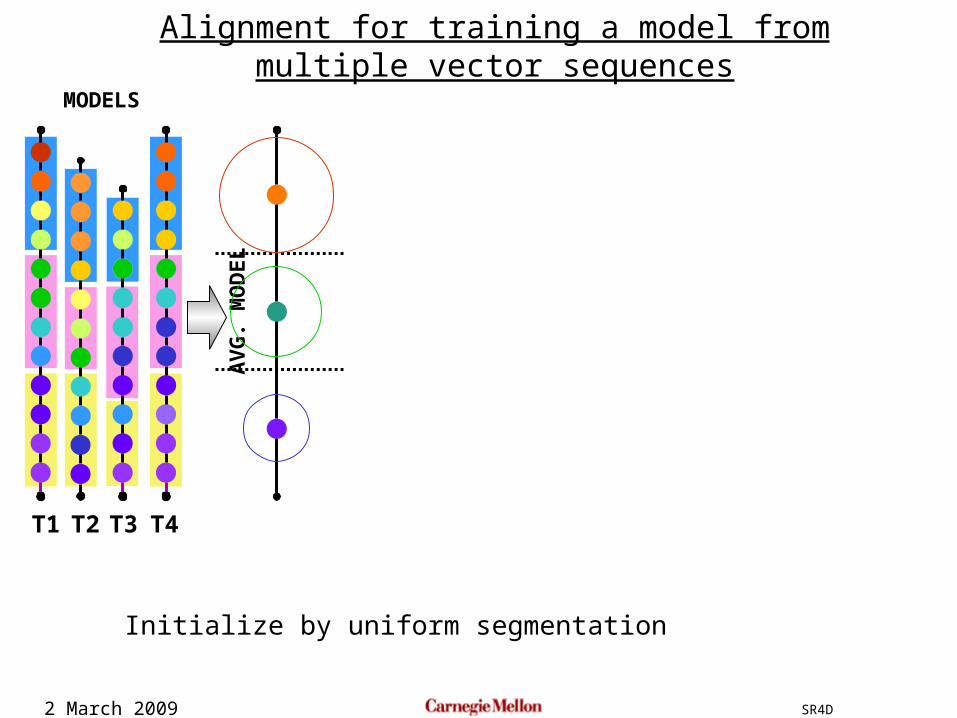
T1 T2 T3 T4
Alignment for training a model from multiple vector sequences
MODELS
AV
G. M
OD
EL
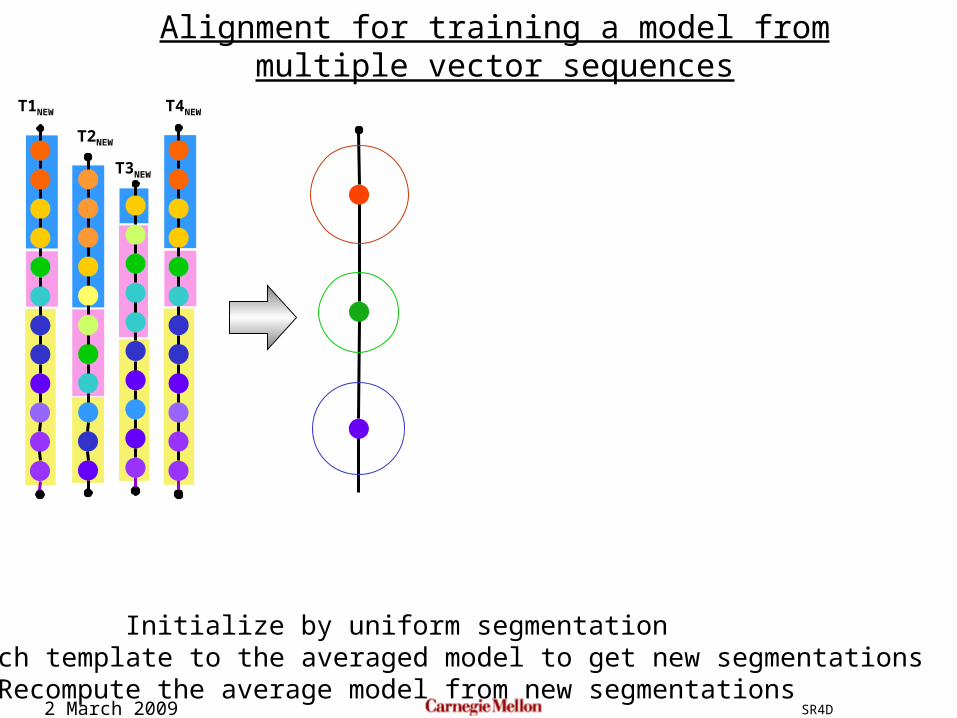
Initialize by uniform segmentation
2 March 2009 SR4D
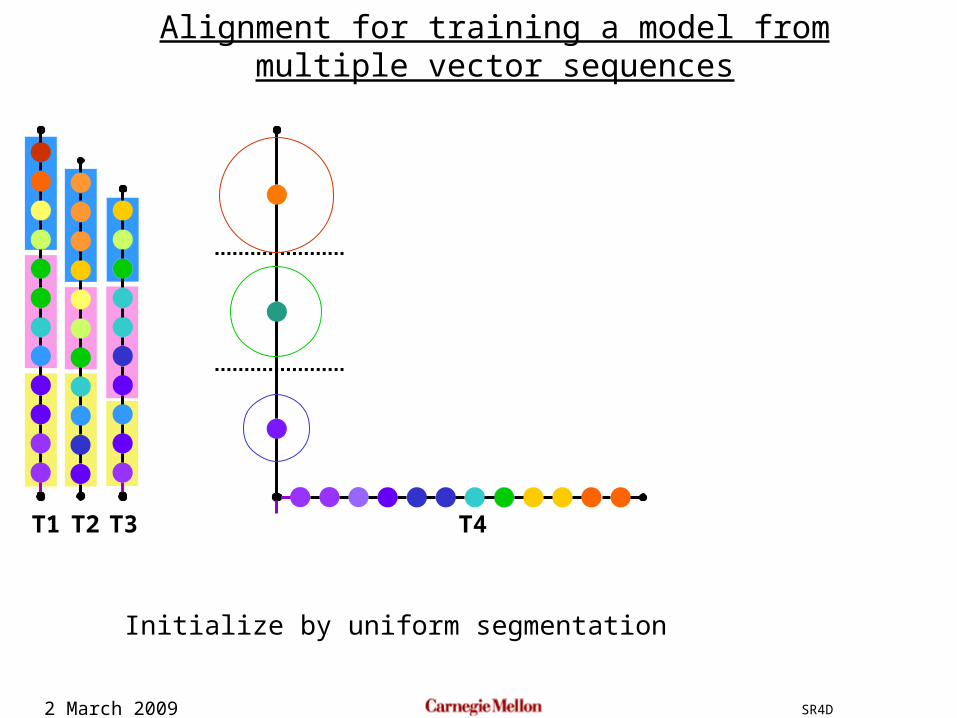
T4T1 T2 T3
Alignment for training a model from multiple vector sequences
Initialize by uniform segmentation
2 March 2009 SR4D
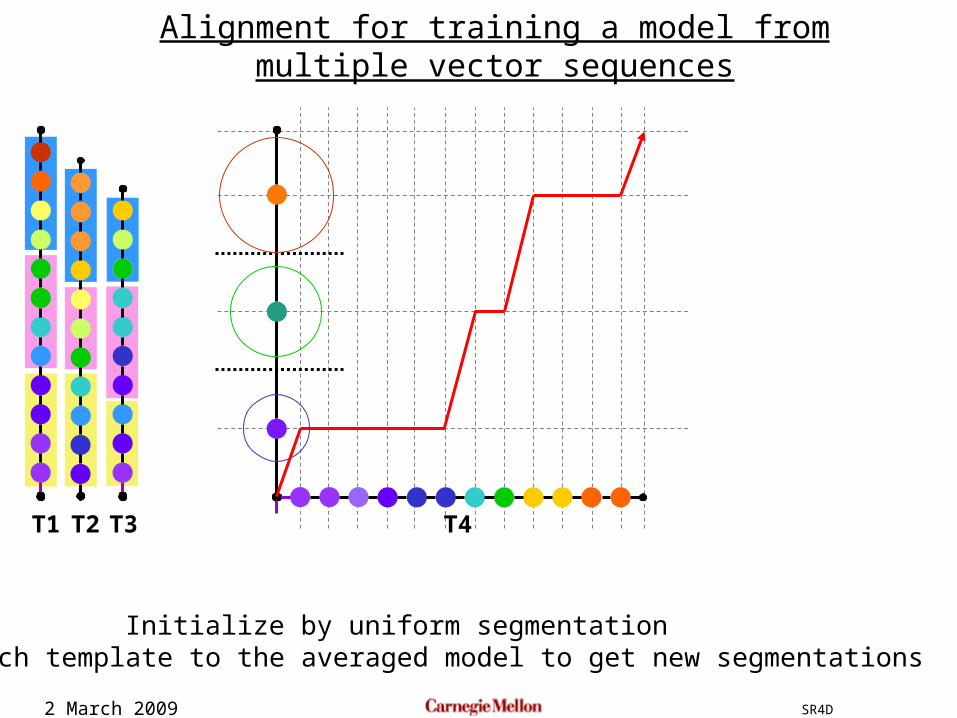
T4T1 T2 T3
Alignment for training a model from multiple vector sequences
Initialize by uniform segmentationAlign each template to the averaged model to get new segmentations
2 March 2009 SR4D
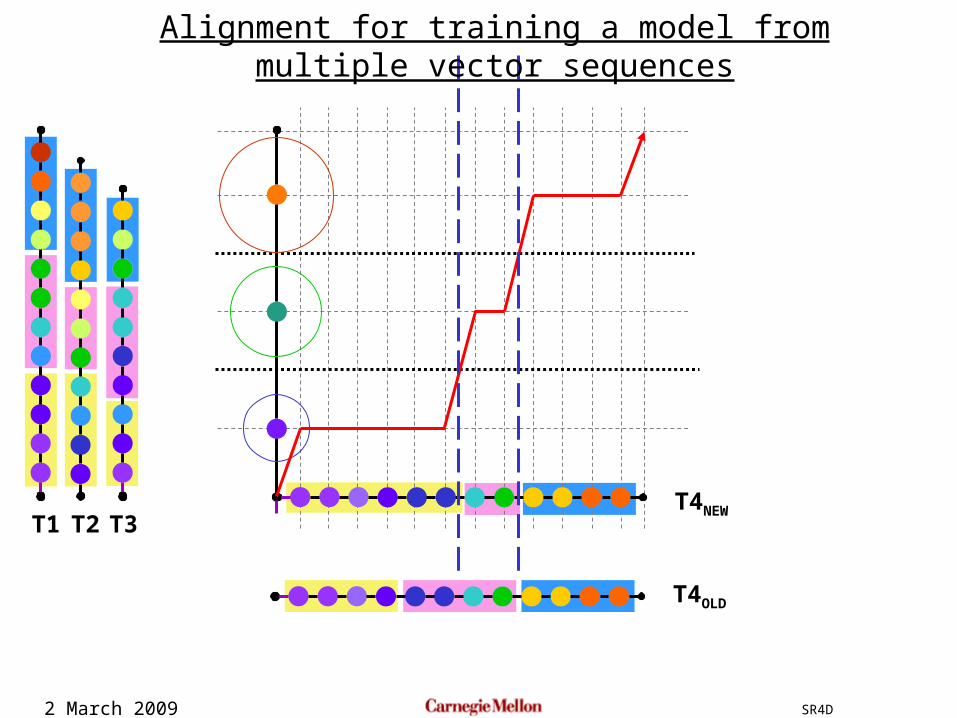
T1 T2 T3
T4OLD
T4NEW
Alignment for training a model from multiple vector sequences
2 March 2009 SR4D
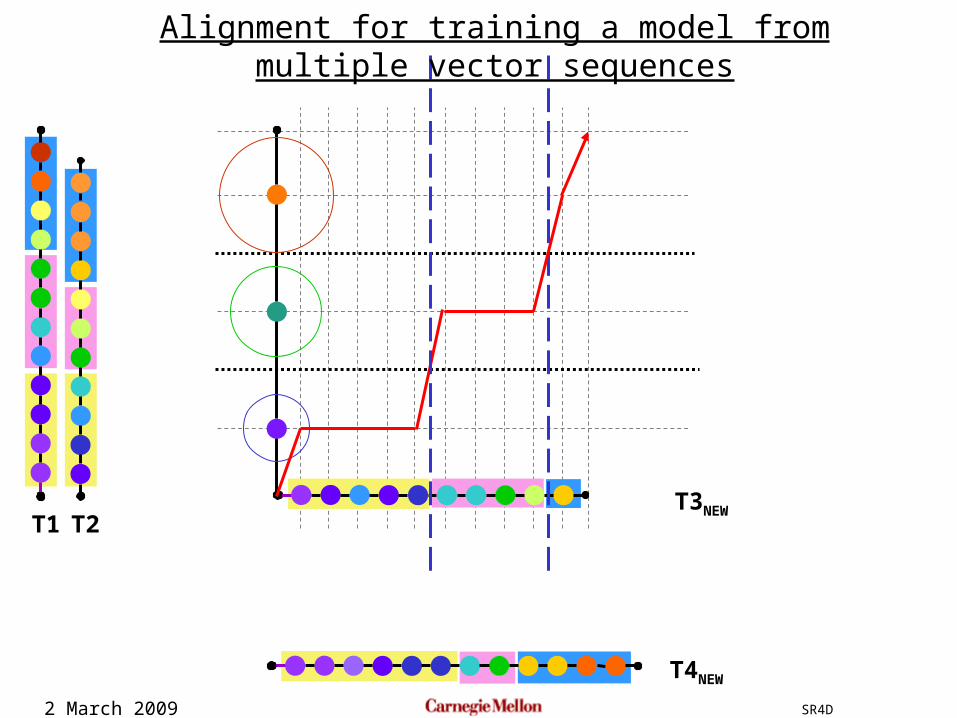
T1 T2T3NEW
T4NEW
Alignment for training a model from multiple vector sequences
2 March 2009 SR4D
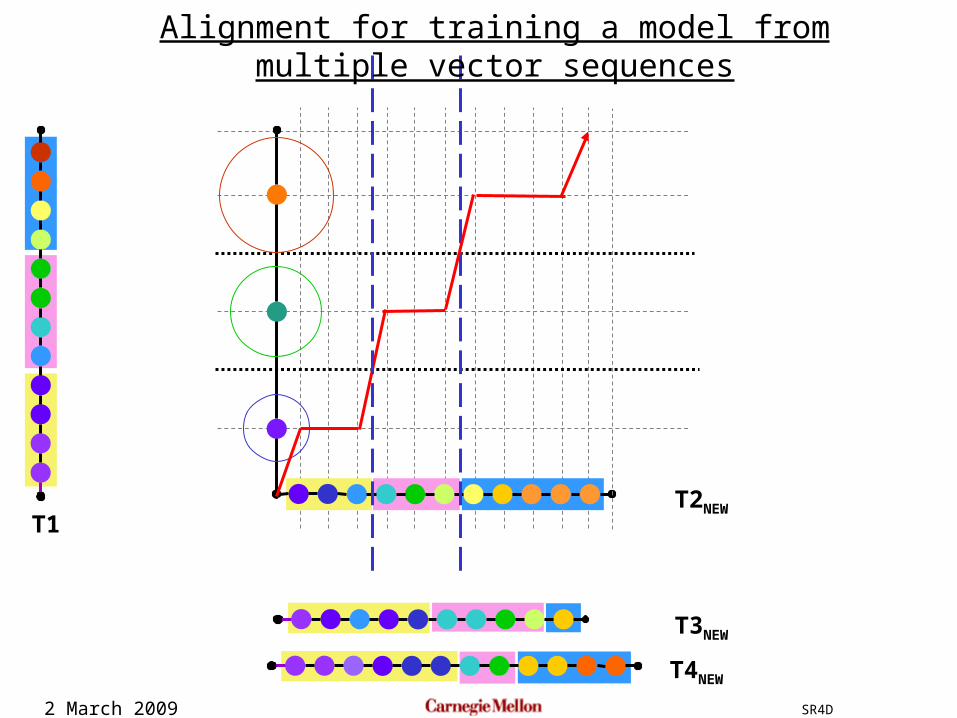
T1
T3NEW
T2NEW
Alignment for training a model from multiple vector sequences
T4NEW
2 March 2009 SR4D
T3NEW
T2NEW
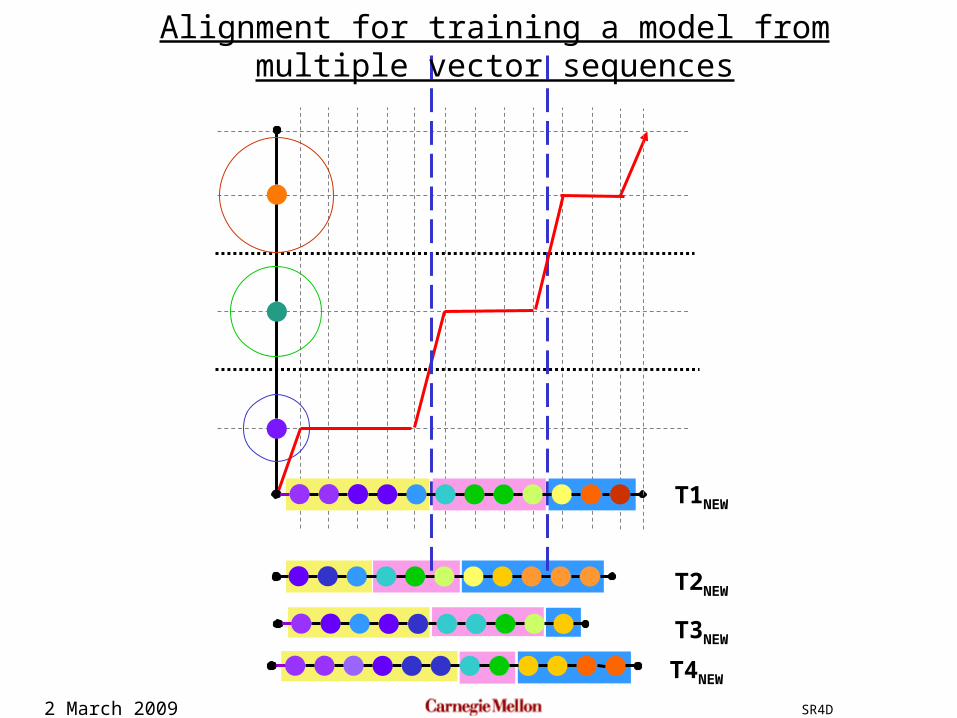
T1NEW
Alignment for training a model from multiple vector sequences
T4NEW
2 March 2009 SR4D
T4NEWT1NEW
T2NEW
T3NEW
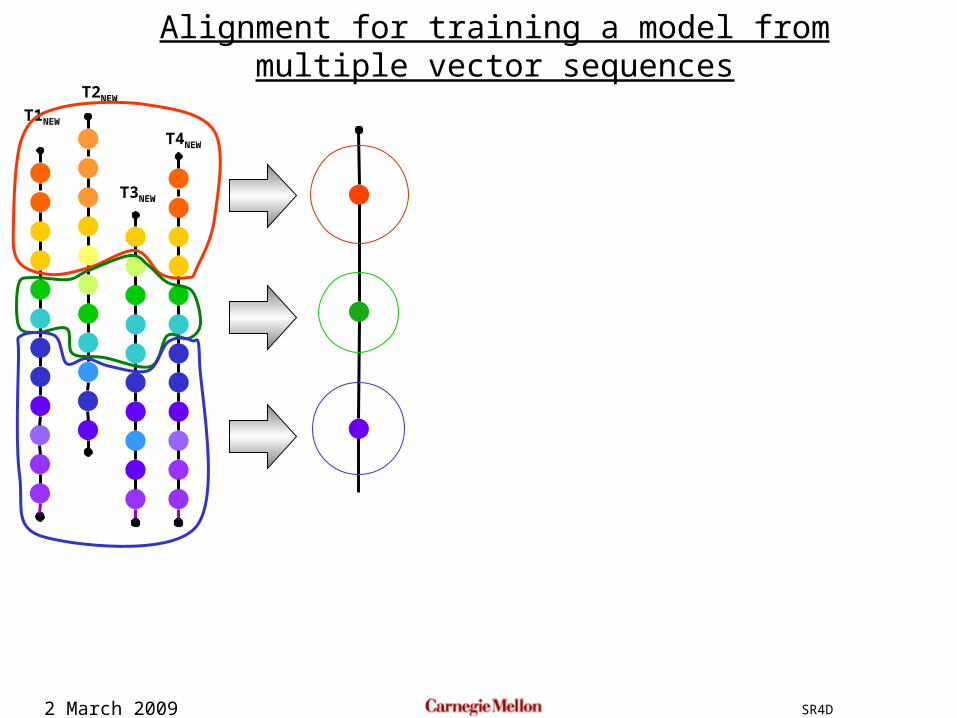
Alignment for training a model from multiple vector sequences
Initialize by uniform segmentationAlign each template to the averaged model to get new segmentations
Recompute the average model from new segmentations
2 March 2009 SR4D
T4NEW
T1NEW
T2NEW
T3NEW
Alignment for training a model from multiple vector sequences
2 March 2009 SR4D
T4NEWT1NEW
T2NEW
T3NEW
Alignment for training a model from multiple vector sequences
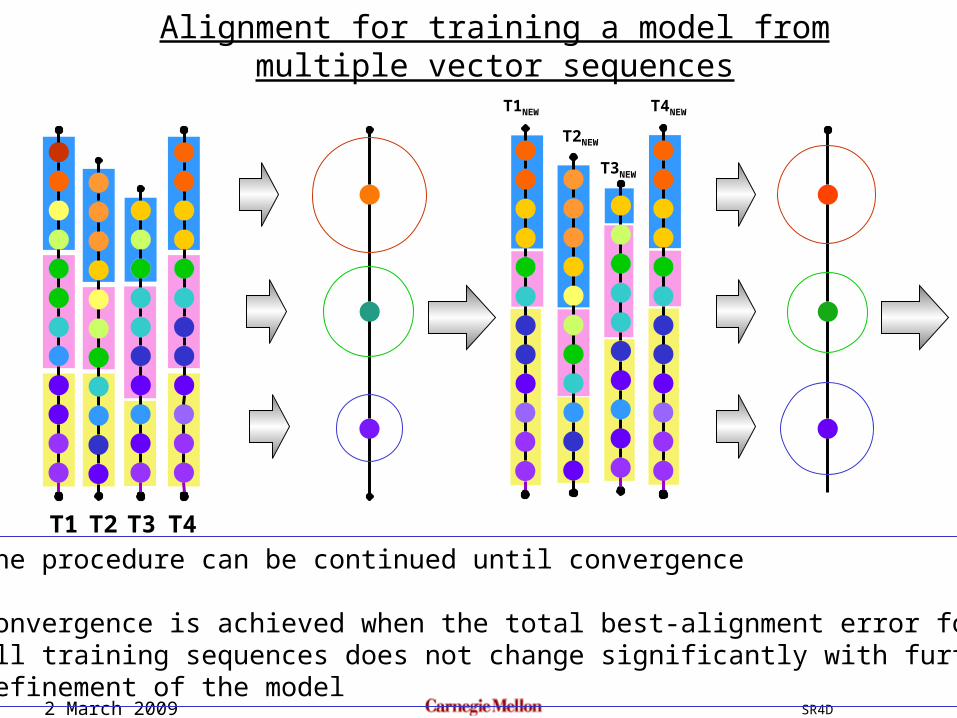
T1 T2 T3 T4
The procedure can be continued until convergence
Convergence is achieved when the total best-alignment error forall training sequences does not change significantly with furtherrefinement of the model
2 March 2009 SR4D
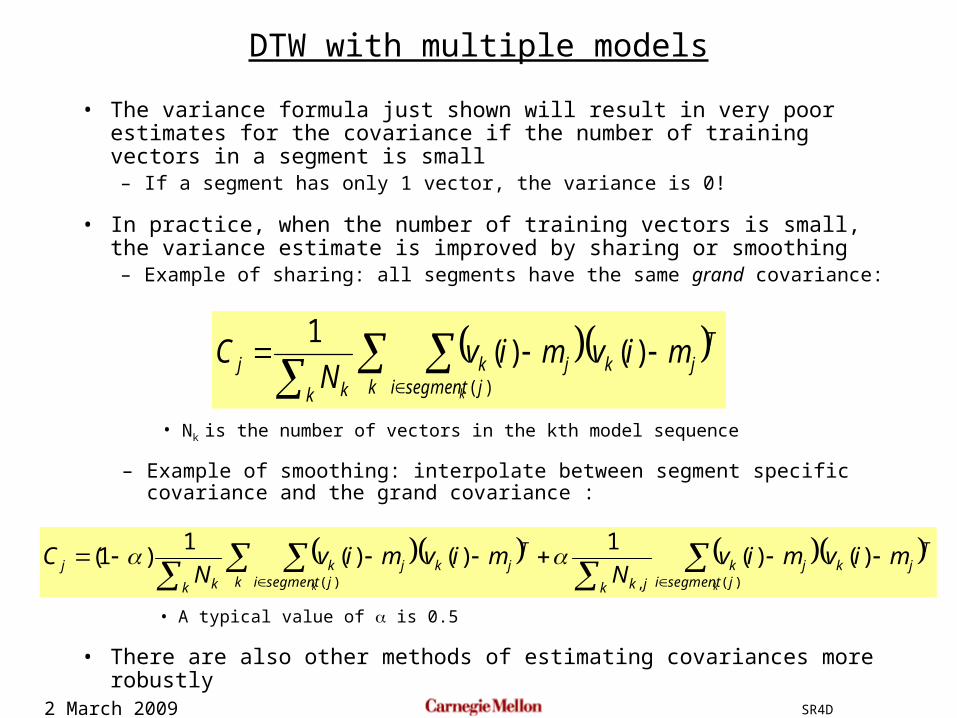
• The variance formula just shown will result in very poor estimates for the covariance if the number of training vectors in a segment is small– If a segment has only 1 vector, the variance is 0!
• In practice, when the number of training vectors is small, the variance estimate is improved by sharing or smoothing– Example of sharing: all segments have the same grand covariance:
DTW with multiple models
k
Tjk
jsegmentijk
k kj mivmiv
NC
k
)( )(1
)(
• Nk is the number of vectors in the kth model sequence
– Example of smoothing: interpolate between segment specific covariance and the grand covariance :
Tjkjsegmenti
jk
k jkk
Tjk
jsegmentijk
k kj mivmiv
Nmivmiv
NC
kk
)( )(1
)( )(1
)1()(,)(
• A typical value of is 0.5
• There are also other methods of estimating covariances more robustly
2 March 2009 SR4D
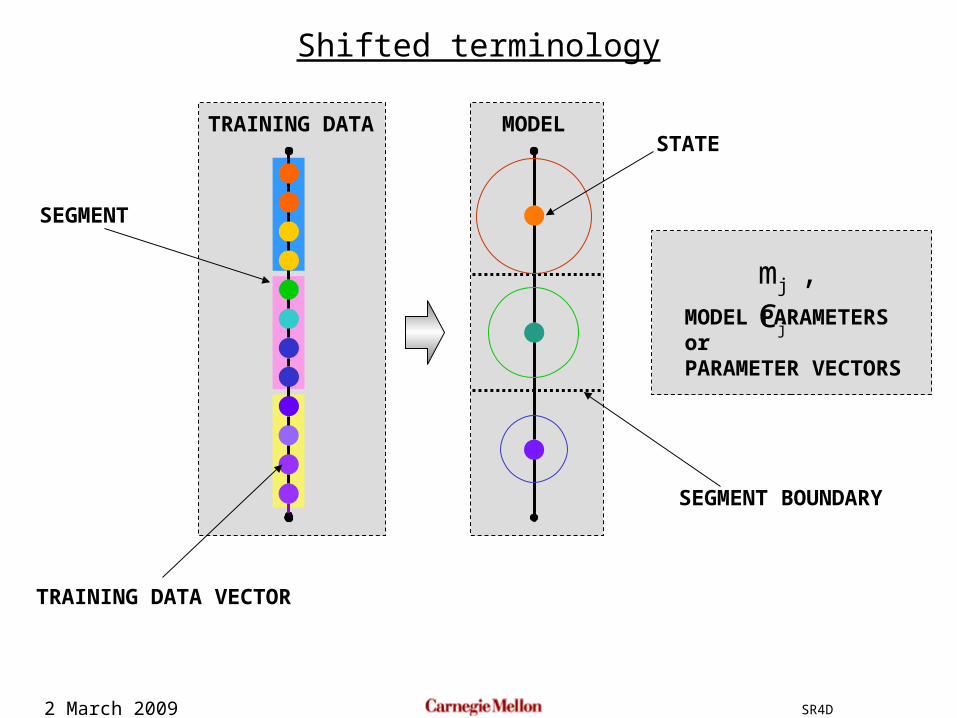
Shifted terminology
STATE
mj , Cj
SEGMENT
TRAINING DATA
TRAINING DATA VECTOR
SEGMENT BOUNDARY
MODEL PARAMETERSorPARAMETER VECTORS
MODEL
2 March 2009 SR4D
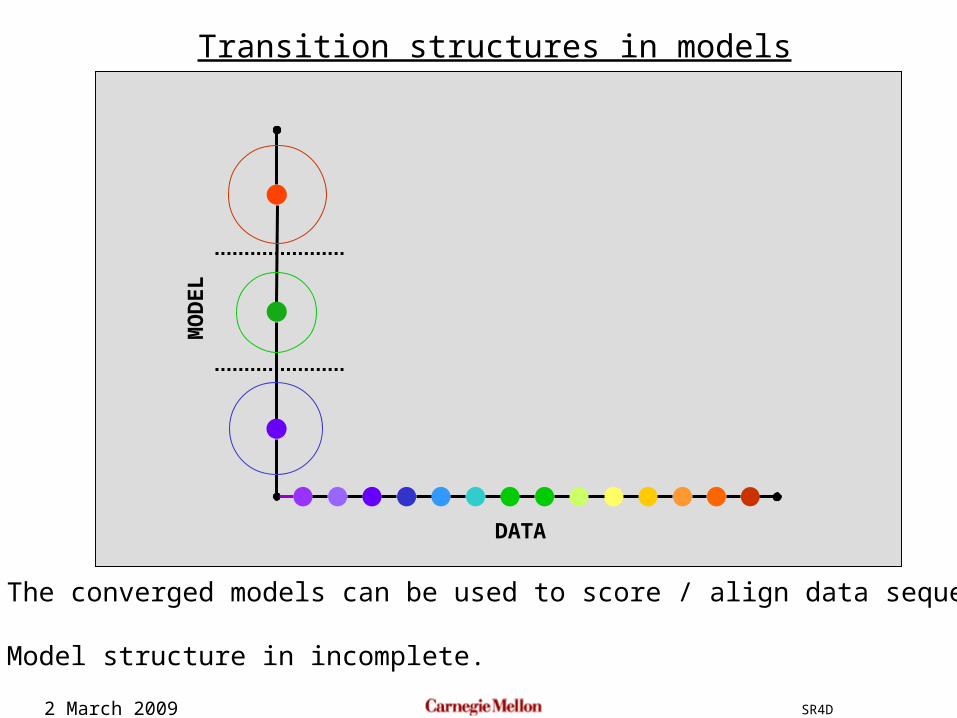
Transition structures in models
DATA
MO
DE
L
The converged models can be used to score / align data sequences
Model structure in incomplete.
2 March 2009 SR4D
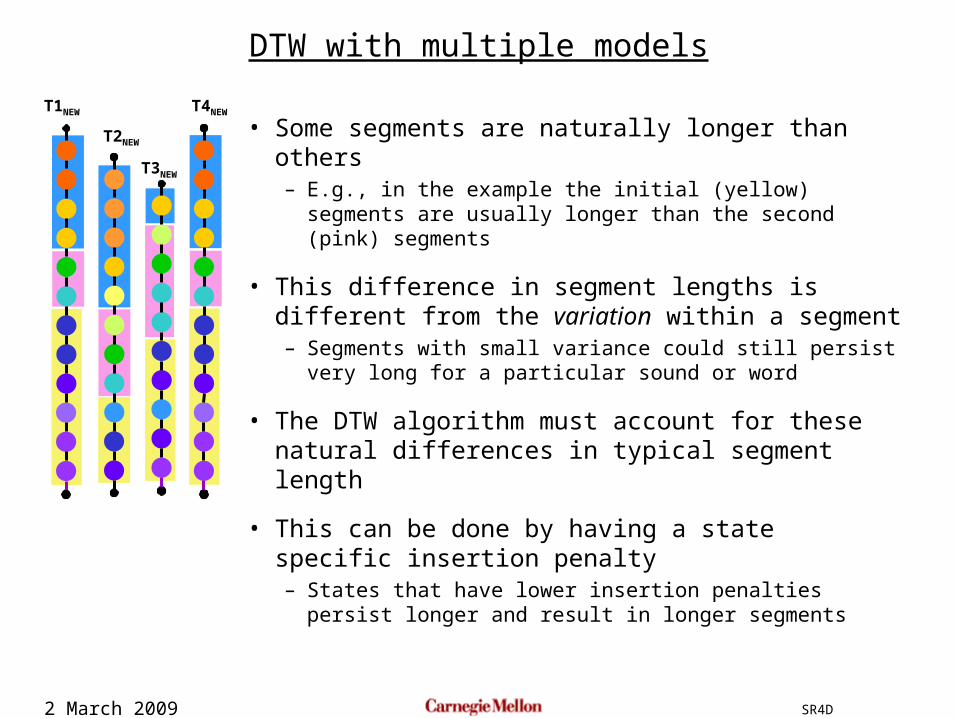
• Some segments are naturally longer than others– E.g., in the example the initial (yellow) segments are
usually longer than the second (pink) segments
• This difference in segment lengths is different from the variation within a segment– Segments with small variance could still persist very
long for a particular sound or word
• The DTW algorithm must account for these natural differences in typical segment length
• This can be done by having a state specific insertion penalty– States that have lower insertion penalties persist
longer and result in longer segments
DTW with multiple models
T4NEWT1NEW
T2NEW
T3NEW
2 March 2009 SR4D
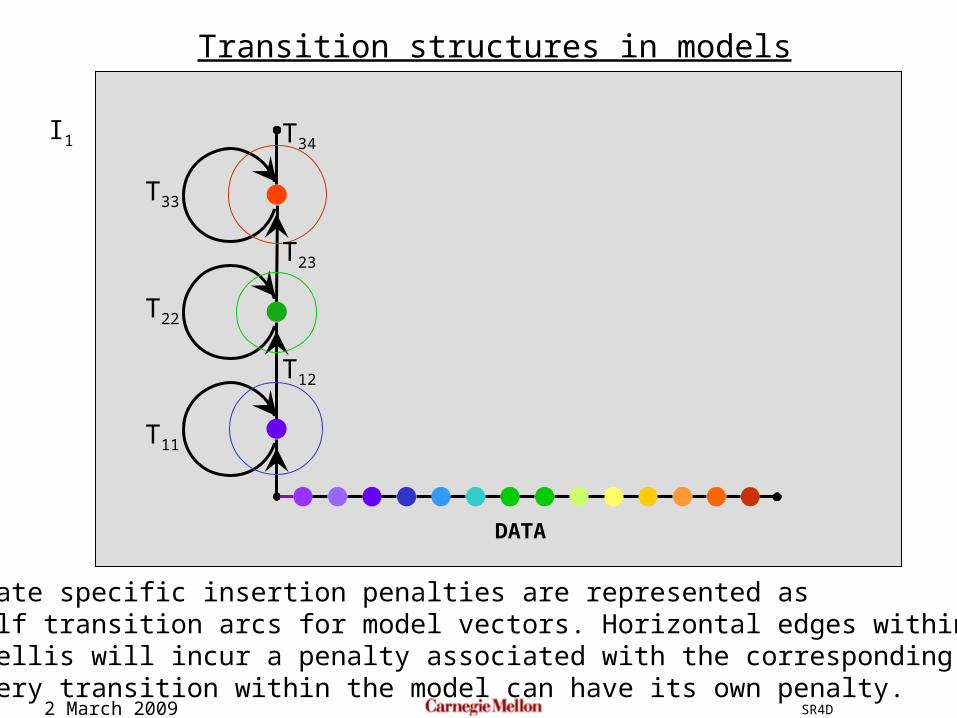
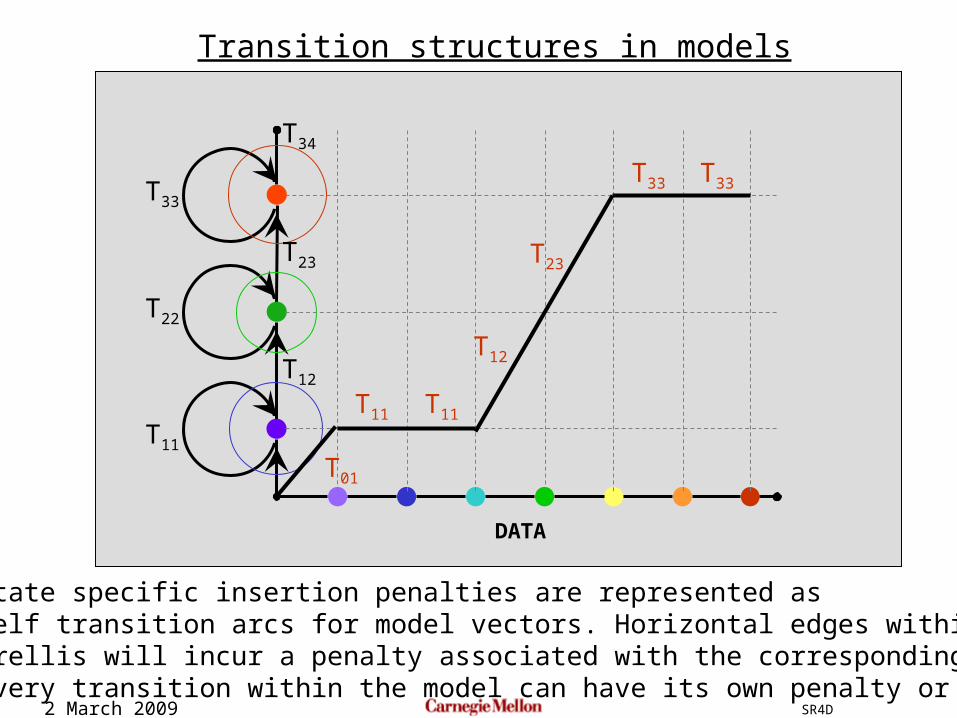
Transition structures in models
DATA
State specific insertion penalties are represented as self transition arcs for model vectors. Horizontal edges within thetrellis will incur a penalty associated with the corresponding arc.Every transition within the model can have its own penalty.
I1
T11
T22
T33
T12
T23
T34
2 March 2009 SR4D
Transition structures in models
DATA
State specific insertion penalties are represented as self transition arcs for model vectors. Horizontal edges within thetrellis will incur a penalty associated with the corresponding arc.Every transition within the model can have its own penalty or score
T11
T22
T33
T12
T23
T34
T01
T11 T11
T12
T23
T33 T33
2 March 2009 SR4D
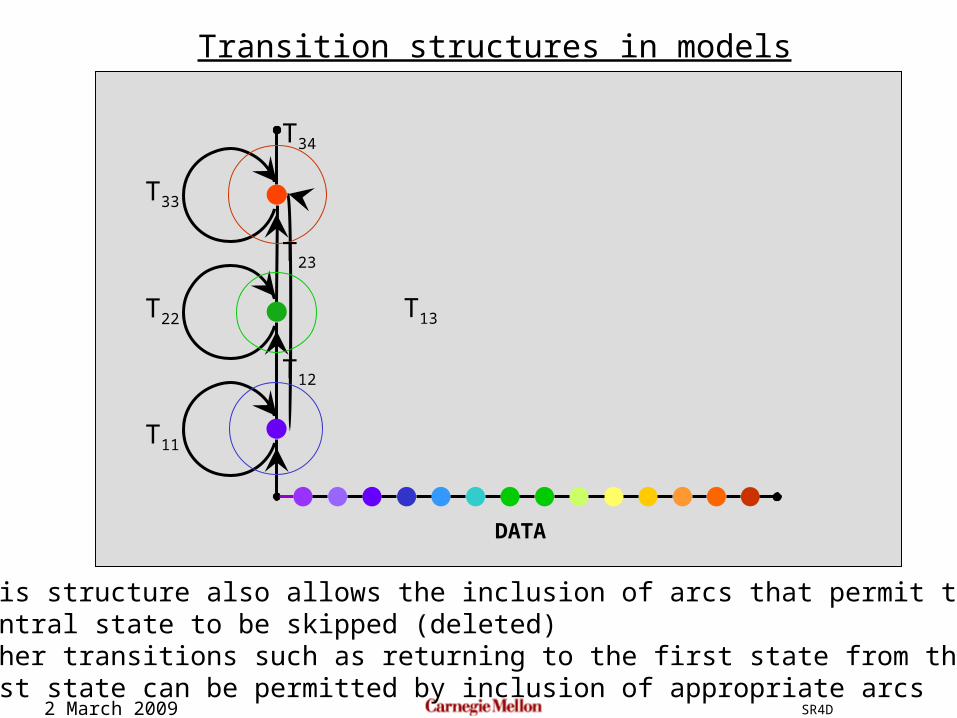
Transition structures in models
DATA
This structure also allows the inclusion of arcs that permit thecentral state to be skipped (deleted)Other transitions such as returning to the first state from thelast state can be permitted by inclusion of appropriate arcs
T11
T22
T33
T12
T23
T34
T13
2 March 2009 SR4D
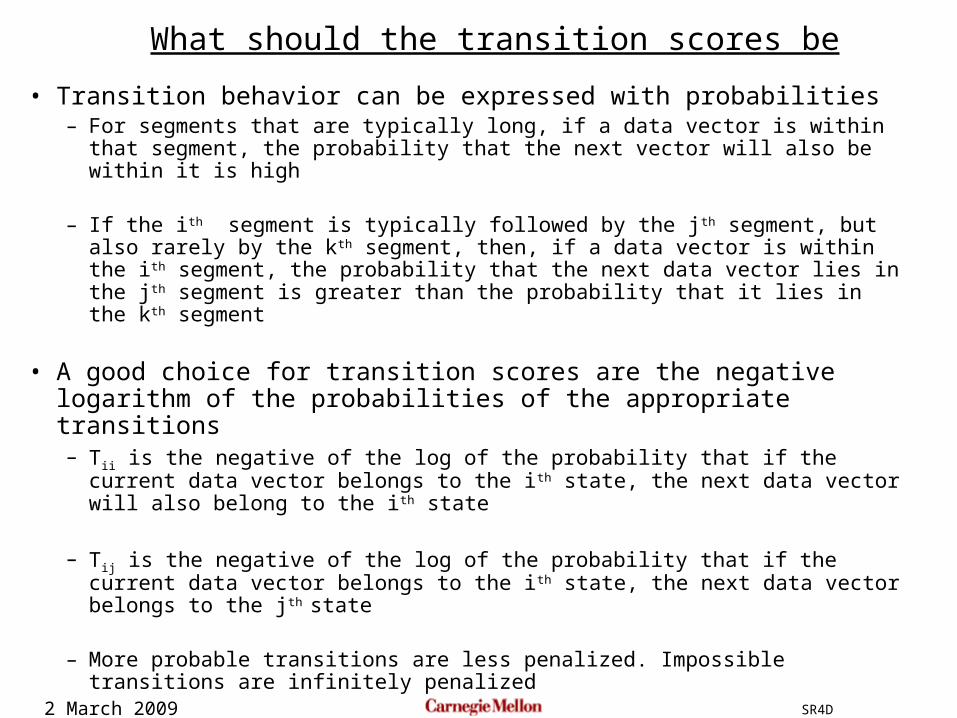
• Transition behavior can be expressed with probabilities– For segments that are typically long, if a data vector is within that
segment, the probability that the next vector will also be within it is high
– If the ith segment is typically followed by the jth segment, but also rarely by the kth segment, then, if a data vector is within the ith segment, the probability that the next data vector lies in the jth segment is greater than the probability that it lies in the kth segment
• A good choice for transition scores are the negative logarithm of the probabilities of the appropriate transitions– Tii is the negative of the log of the probability that if the current data
vector belongs to the ith state, the next data vector will also belong to the ith state
– Tij is the negative of the log of the probability that if the current data vector belongs to the ith state, the next data vector belongs to the jth state
– More probable transitions are less penalized. Impossible transitions are infinitely penalized
What should the transition scores be
2 March 2009 SR4D
Modified segmental K-means AKA Viterbi training
T4NEWT1NEW
T2NEW
T3NEW
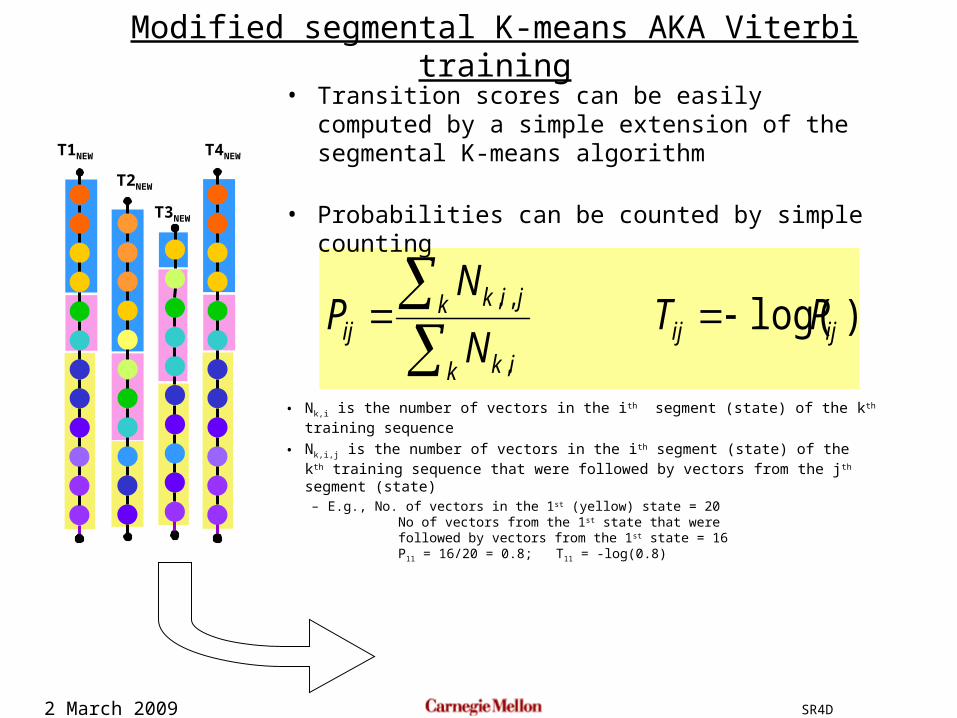
• Nk,i is the number of vectors in the ith segment (state) of the kth training sequence
• Nk,i,j is the number of vectors in the ith segment (state) of the kth training sequence that were followed by vectors from the jth segment (state)
– E.g., No. of vectors in the 1st (yellow) state = 20 No of vectors from the 1st state that were followed by vectors from the 1st state = 16 P11 = 16/20 = 0.8; T11 = -log(0.8)
)log( ,
,,ijij
k ik
k jikij PT
N
NP
• Transition scores can be easily computed by a simple extension of the segmental K-means algorithm
• Probabilities can be counted by simple counting
2 March 2009 SR4D
Modified segmental K-means AKA Viterbi training
T4NEWT1NEW
T2NEW
T3NEW
)log( 00
jjj
j PTN
NP
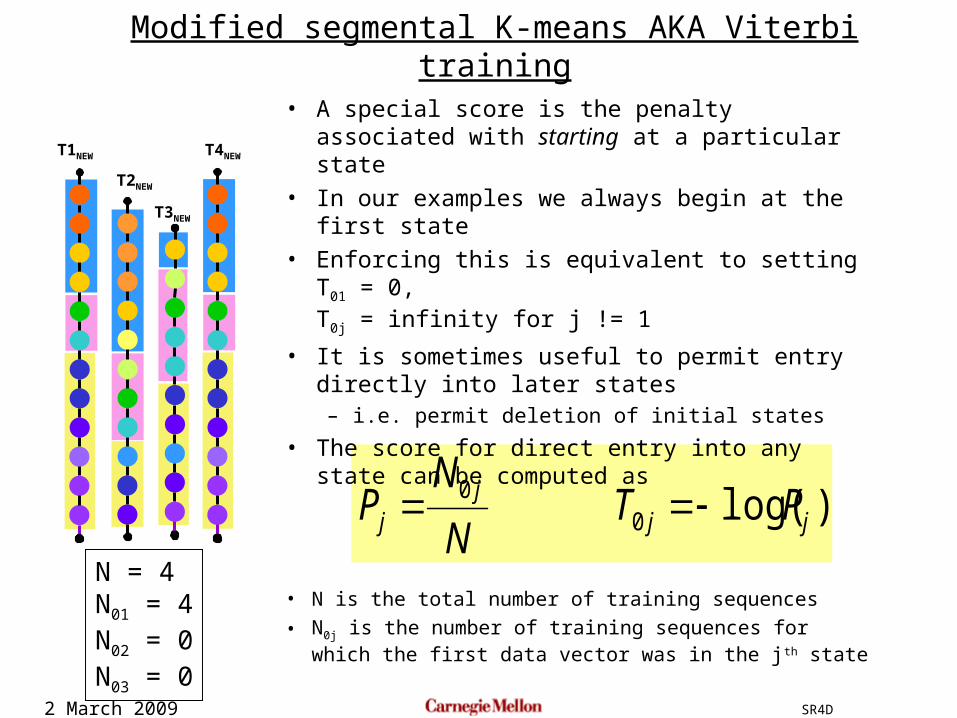
• A special score is the penalty associated with starting at a particular state
• In our examples we always begin at the first state
• Enforcing this is equivalent to setting T01 = 0,T0j = infinity for j != 1
• It is sometimes useful to permit entry directly into later states– i.e. permit deletion of initial states
• The score for direct entry into any state can be computed as
• N is the total number of training sequences
• N0j is the number of training sequences for which the first data vector was in the jth state
N = 4N01 = 4N02 = 0N03 = 0
2 March 2009 SR4D
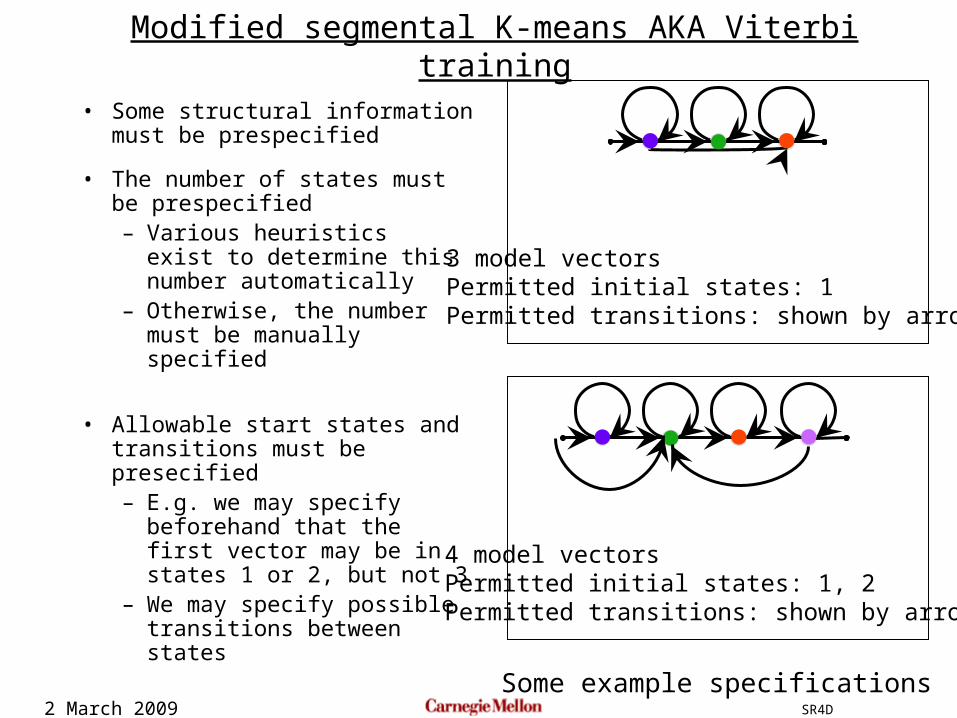
• Some structural information must be prespecified
• The number of states must be prespecified– Various heuristics exist to
determine this number automatically
– Otherwise, the number must be manually specified
• Allowable start states and transitions must be presecified– E.g. we may specify
beforehand that the first vector may be in states 1 or 2, but not 3
– We may specify possible transitions between states
Modified segmental K-means AKA Viterbi training
3 model vectorsPermitted initial states: 1Permitted transitions: shown by arrows
4 model vectorsPermitted initial states: 1, 2Permitted transitions: shown by arrows
Some example specifications
2 March 2009 SR4D
• Initializing state parameters– Segment all training instances uniformly, learn means and variances
• Initializing T0j scores– Count the number of permitted initial states
• Let this number be M0
– Set all permitted initial states to be equiprobable: Pj = 1/M0
– T0j = -log(Pj) = log(M0)
• Initializing Tij scores– For every state i, count the number of states that are permitted to follow
• i.e. the number of arcs out of the state, in the specification• Let this number be Mi
– Set all permitted transitions to be equiprobable: Pij = 1/Mi
– Initialize Tij = -log(Pij) = log(Mi)
• This is only one technique for initialization– You may choose to initialize parameters differently, e.g. by random
values
Modified segmental K-means AKA Viterbi training
2 March 2009 SR4D
• The entire segmental K-means algorithm:1. Initialize all parameters
• State means and covariances
• Transition scores
• Entry transition scores
2. Segment all training sequences
3. Reestimate parameters from segmented training sequences
4. If not converged, return to 2
Modified segmental K-means AKA Viterbi training
2 March 2009 SR4D
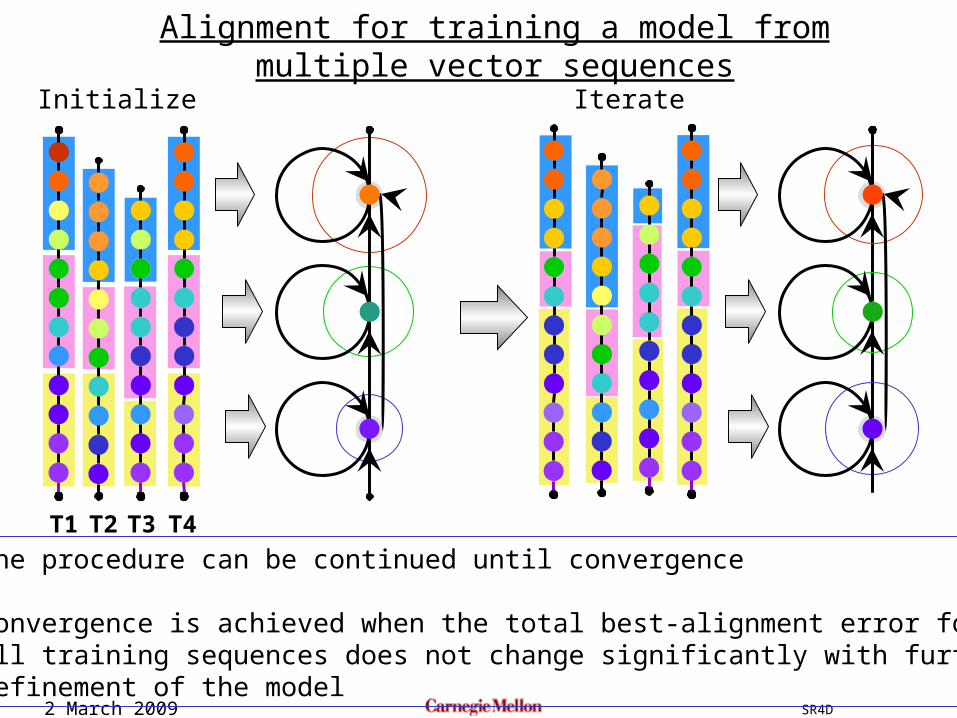
Alignment for training a model from multiple vector sequences
T1 T2 T3 T4
The procedure can be continued until convergence
Convergence is achieved when the total best-alignment error forall training sequences does not change significantly with furtherrefinement of the model
Initialize Iterate
2 March 2009 SR4D
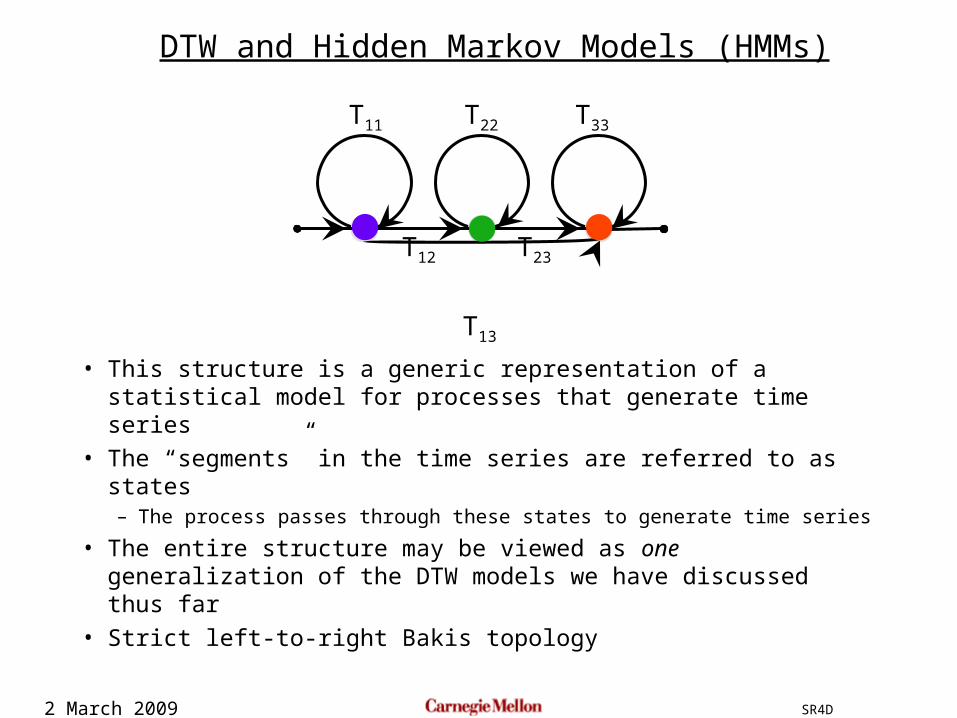
• This structure is a generic representation of a statistical model for processes that generate time series
• The “segments” in the time series are referred to as states– The process passes through these states to generate time series
• The entire structure may be viewed as one generalization of the DTW models we have discussed thus far
• Strict left-to-right Bakis topology
DTW and Hidden Markov Models (HMMs)
T11 T22 T33
T12 T23
T13
2 March 2009 SR4D
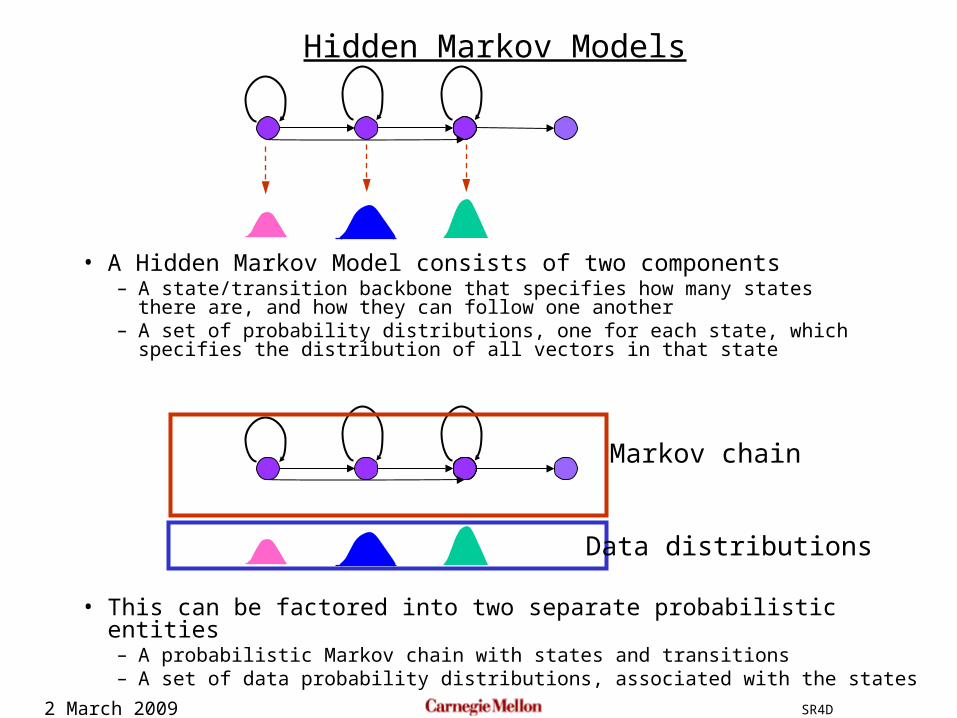
• A Hidden Markov Model consists of two components– A state/transition backbone that specifies how many states there are, and how
they can follow one another– A set of probability distributions, one for each state, which specifies the
distribution of all vectors in that state
Hidden Markov Models
• This can be factored into two separate probabilistic entities– A probabilistic Markov chain with states and transitions– A set of data probability distributions, associated with the states
Markov chain
Data distributions
2 March 2009 SR4D
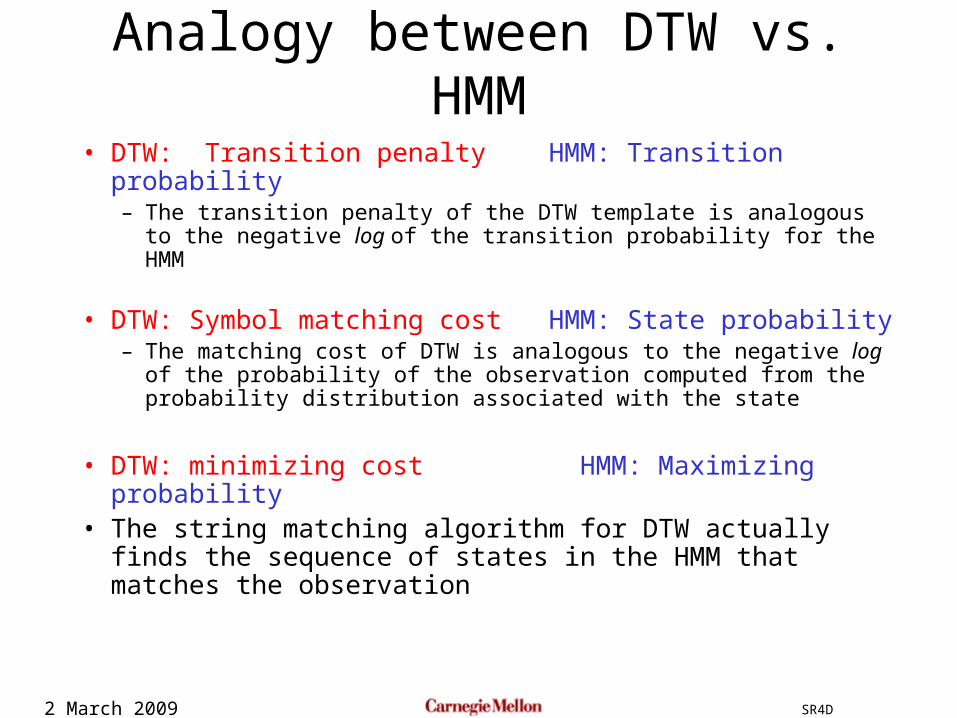
Analogy between DTW vs. HMM
• DTW: Transition penalty HMM: Transition probability– The transition penalty of the DTW template is analogous to the
negative log of the transition probability for the HMM
• DTW: Symbol matching cost HMM: State probability– The matching cost of DTW is analogous to the negative log of the
probability of the observation computed from the probability distribution associated with the state
• DTW: minimizing cost HMM: Maximizing probability• The string matching algorithm for DTW actually finds the
sequence of states in the HMM that matches the observation
2 March 2009 SR4D
• Thus far we have been talking about Costs, that are in fact Negative Log Probabilities
• Henceforth we will talk in terms of Probabilities and not Log probabilities– A matter of convenience– This does not change the basic procedures –
what used to be summation will now become multiplication
• Ie. We multiply the probabilities along the best path, rather than to add them
A change of notation