Embed Size (px)
DESCRIPTION
SANParks Vision and Mission Vision A Sustainable National Park System Connecting Society Mission To develop, expand, manage and promote a system of sustainable national parks that represents biodiversity and heritage assets, through innovation and best practice for the just and equitable benefit of current and future generations 3
Citation preview

2nd & 3rd Quarterly Performance Report, Audit Matters and Financial Position
Mr Fundisile Mketeni: Chief Executive Officer (SANParks)

Presentation Content
1. Vision and Mission
2. High Level Structure
3. 2015/16 SANParks Strategy Map
4. Amendment to indicators and targets
5. Performance Dashboard
6. 2nd Quarterly Performance Reporting
7. 2014/15 Financial Performance
8. AG Findings (including IT Governance Framework)
2

SANParks Vision and Mission
VisionA Sustainable National Park System Connecting Society
MissionTo develop, expand, manage and promote a system of sustainable national parks
that represents biodiversity and heritage assets, through innovation and best practice for the just and equitable benefit of current and future generations
3

Performance Reporting Framework
4
Chief Financial Offi cer:R Mahabeer
ME Parks (Acting)P Mokoena
ME Conservation Services(Acting) H Hendricks
HEAD: CEO Offi cceL Zepe
ME Kruger NPG Phillips
ME Toursim Development & Marketting
H SelloBoard Secretary:P Van Der Spuy
ME: CorporateW Makutshulwa
HOD Socio-Economic Development
P Daphne
Minister: Environmental AffairsHon E Molewa
Corporate Support Functions Parks Operations Core Functions CE & Board Support
Chief Executive OfficerF Mketeni
SANPARKS Board
Chief Operationx Offi cerL McCourt

2015/16 Strategy Map
5

2015/162015/1622ndnd & 3 & 3rdrd Quarters Quarters
PerformancPerformanc
6

LegendLegend
7
Target achieved or exceeded - Good Performance
Work in Progress - Caution
Target not achieved – Underperformance
No target planned for reporting period
Indicator / Target amended at mid-year
Information not provided

Amendment to Indicators – October 2015
SO Indicator Annual Quarterly Reason for amendmentFormer New Former New
1 Budget variance - Income 0%
1:1
0%
1:1
Amended to a break-even target, Income:Expend to meet PFMA requirements
1 Budget variance - expenditure
0% 0%
2METT Score
70% 70% 70% Milestones detailed
METT assessment only every 2nd year, not quarterly
2 Total Hectares of Land Rehabilitated / Restored (Initial) or New (ha)
50 086 33,368 22 038 25,026
Targets amended in response to DEA
approvals and budget – August 2015
2 2.2 Total Hectares of Land Rehabilitated / Restored (Follow-up) (ha)
212 678 202,694 163 762 152,021
2 2.2 Total of Land Rehabilitated / Restored (Wetlands) (m³)
16 128m³ (26 sites) 6,508
11 773 m³ (19 sites) 2,603
8

Amendment to Indicators – October 2015
SO Indicator Annual Quarterly Reason for amendment
Former New Former New
2 Total Number of Park Management Plans Reviewed and Submitted
2 2 2 Milestones Review and submission happens annually and not quarterly
2 Total Number of Species Protection Interventions Implemented
6 6 6 Milestones Interventions only fully implemented at year end
3 Total Number of Full-time Equivalent Jobs Created (EPWP) 6 254 7,942 4,691 4,691
Targets amended after approval by DEA of budget and projects Aug 2015
3 3.6 Total Number of SMMEs / Enterprises Supported 482 501 482 482
9

Amendment to Indicators – October 2015
SO Indicator Annual Quarterly Reason for amendment
Former New Former New
6Women as % of Management 36% 50.0% 36% 41.5%
Alignment with Government targets as per PCEA instruction
6People with Disabilities 1% 2.0% 1% 1.5%
10

BIRDS-EYE VIEW ON PERFORMANCE YTD
11

Performance Dashboard
12
Annual Target Q1 Q2 Q3
1.1 - Budget Variance - Income -7.3% -1.5%
1.1 - Budget Variance - Expenditure -7.8% -1.5%1.2 Gross / Operating Tourism Revenue (YoY) 10.5% 11% 7.9% 9.9% 9.2%1.3 Total Number of Revenue Generating Products Implemented
07
0 1 5
1.4 Fundraising Policy & Strategy Developed and Implemented
75.0%100%
37.5% 60.0% 75
1.5 Accommodation Occupancy 74.0% 72.50% 71.4% 75.8% 75.9%1.6 Customer Satisfaction Index 82.0% 82% 81.8% 82.1% 82.2%1.7 Total Number of Visitors to National Parks 3,349,584 5,600,000 1,067,094 2,405,279 4207320
1;11,12:1
SO1: Optimised Economic Contribution Through Tourism and Associated Activities
Break Even
Corporate Strategic Objectives Performance Indicators 3rd Quarterly TargetActual Performance

Performance Dashboard
13
Corporate Strategic Objectives Performance Indicators 3rd Q Target
Actual PerformanceAnnual Target Q1 Q2 Q3
SO2: Enhanced Conservation and Ecological Integrity of National Parks System
2.1 METT Score
Implementation of the corrective actions per park
70.0% 74.0% 74.0%Implementation on
target
2.2 Total Hectares of Land Rehabilitated / Restored (Initial) or New (ha)
25,026 33,368 14,737 24,611 35,301
2.2 Total Hectares of Land Rehabilitated / Restored (Follow-up) (ha)
152,021 202,694 38,433 93,609 177,301
2.2 Total of Land Rehabilitated / Restored (Wetlands) (m³)
2,603 6,508 0 0 4,417
2.3 Total Area Added to National Parks (Terrestrial) (ha)
03715
0 0 0
2.3 Total Area Added to National Parks (Marine) (km2)
00
0 0 0

Performance Dashboard
14
Corporate Strategic Objectives Performance Indicators 3rd Quarterly
Target
Actual PerformanceAnnual Target Q1 Q2 Q3
SO2: Enhanced Conservation and Ecological Integrity of National Parks System
2.4 Total Number of Park Management Plans Reviewed and Submitted
Completion of Lower
Level Plans for MZ NP and KG NP
2 0 0
Completed draft lower level
plans for both
parks.
2.5 Total Number of Species Protection Interventions Implemented
(5) - Compulsory
interventions to protect
rhinos:6 1 3
5 Interventions all on
target
2.6 Total Number of Cultural Heritage Interventions Implemented
4 5 1 2 4
2.7 % of new research projects relevant to SANParks key issues
72.5% 73.0% 77.5% 76.0% 75.6%
2.8 Total Number of Peer Reviewed Research Publications
15 20 18 23 31

Performance Dashboard
15
Corporate Strategic Objectives Performance Indicators 3rd Quarterly Target
Actual Performance
Annual Target Q1 Q2 Q3
SO3: Optimised Socio-economic Beneficiation
3.1 Total Number of Free Access Entrants 18,200 18,200 0 53,028 53,028
(cum) 3.2 Total Number of Environmental Education Impact Assessment Tools Developed.
2 2 0 1 2 (cum)
3.3 Total Number of Participants in Environmental Education Programme
139,200 185,600 41,656 89,601 133,453 (cum)
3.4 Total Number of Full-time Equivalent Jobs Created (EPWP) 4,691 7,942 1,200 2,627 4,422
3.4 Total Number of Full-time Equivalent Jobs Created (Other) 150 196 27 105 144
3.5 Total Number of temporary Jobs Created through Socio-economic initiatives
40 50 0 40 44
3.6 Total Number of SMMEs / Enterprises Supported 482 501 455 615 780
3.7 Number Community Contractual Agreements in Place 1 5 0 0 0

Performance Dashboard
16
Corporate Strategic Objectives Performance Indicators 3rd Quarterly Target
Actual Performance
Annual Target Q1 Q2 Q3
SO4: Enhanced Stakeholder Engagement
4.1 Total Number of Proactive Media Engagements (Articles) 15 25 16 50 69
4.1 Total Number of Proactive Media Engagements (Media Events)
9 10 4 8 12
4.2 Media Reputation Rating 95% 95% 97.0% 99.0% 99%
SO5: Effective and Efficient Corporate Governance
5.1 Auditor General Audit Report
unqualified with no other matters
unqualified with no other matters
Unqualified with no
other matters
Unqualified with no
other matters
Unqualified with no
other matters
5.2 % progress against Risk Response Plan
4590
25.0% 45.0% 45.0%
4070
20.0% 40.0% 40.0%
3020
15.0% 30.0% 30.0%
5.3 % Compliance with Governance Requirements 80.00%
100%100.0% 100.0% 100.0%
5.4 Total Number of ICT Strategy Initiatives Implemented per Schedule
11
0 1 1

Performance Dashboard
17
Corporate Strategic Objectives Performance Indicators 3rd Quarterly
Target
Actual PerformanceAnnual Target Q1 Q2 Q3
SO6: Strengthened Human Capital and Management
6.1 Black as % of Management 56,5% 57% 55.2% 54.9% 54.9%
6.1 Women as % of Management 41.5% 50.0% 34.5% 41.4% 35.1%
6.1 People with Disabilities 1.5% 2.0% 1.2% 1.3% 1.3%
6.1 Total Male: Female Ratio 1,8:1 1,8:1 1.8% 1.79:1 1.79:1
6.2 % of Employees Meeting Minimum Educational Requirements (C and Upper)
94.0% 94.0% 97.3% 95.0% 95.0%
6.3 % of Performance Appraisals Completed (C and Upper)
80.0% 100.0% 60.0% 46.0% 46.0%
6.4 % Success Rate at CCMA 83.8% 85.0% 100.0% 100.0% 100.0%
6.5 % progress against implementation of Skills Development Programme
80.0% 85.0% 20.0% 65.0% 65.0%

DETAILED PERFORMANCE (CUMULATIVE TO END QUARTER 3)
18

SANParks Cumulative Quarter 3
SO 1: Optimised Economic Contribution Through Tourism and Associated Activities
Performance indicator
Baseline Annual target
2015/16
Achievements
(cumulative to end Q3)
Challenges Corrective measures Overall performance
1.1 Revenue : Expenditure 1:1
1:1 (break even)
1,12:1 None N/a
1.2 Gross / Operating Tourism Revenue (YoY)
7.5% 11% 9.2% (slightly off target)
• Target might have been over ambitious given economic climate;
• Declining visitor numbers to national parks resulted in a 0.63% (equivalent to R1.665 million) less income realised from conservation fees than budget, most of which is generated from international market.
• Easter weekend fall within financial year
• New revenue generating projects coming on line shortly
• SANParks is cautiously optimistic that annual target will be achieved
19

SANParks Cumulative Quarter 3
SO 1: Optimised Economic Contribution Through Tourism and Associated Activities
Performance indicator
Baseline Annual target 2015/16
Achievements (cumulative to
end Q3)
Challenges Corrective measures
Overall performance
1.3 Total Number of Revenue Generating Products Implemented
5 7 5 None N/a
1.4 Fundraising Policy & Strategy Developed and Implemented
New 100% 75% None N/a
20
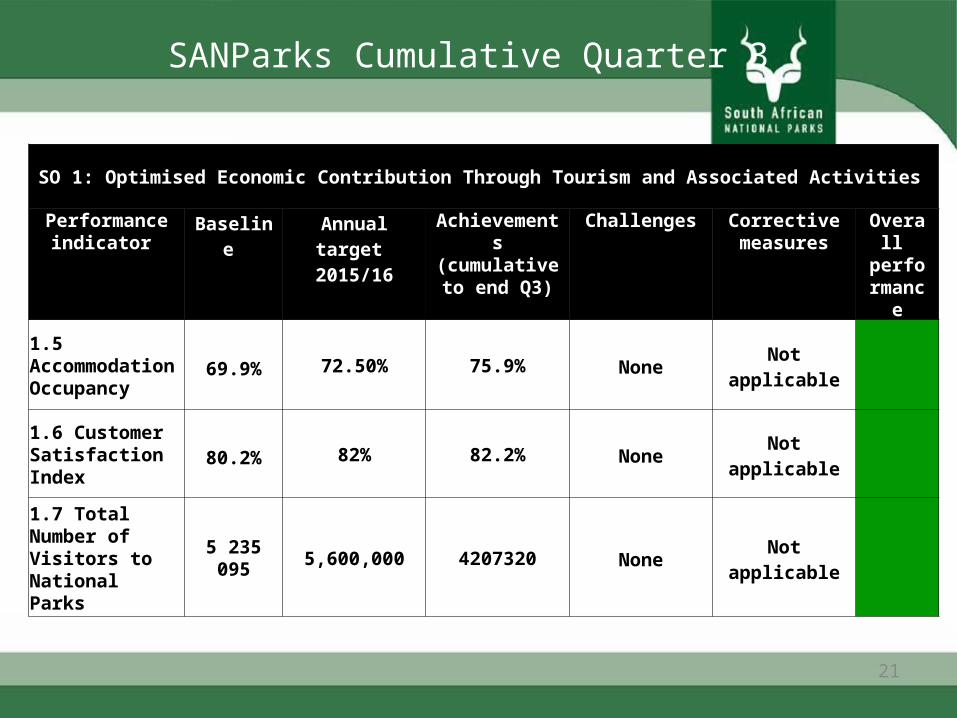
SANParks Cumulative Quarter 3
SO 1: Optimised Economic Contribution Through Tourism and Associated Activities
Performance indicator
Baseline Annual target 2015/16
Achievements (cumulative to
end Q3)
Challenges Corrective measures
Overall perform
ance
1.5 Accommodation Occupancy
69.9% 72.50% 75.9% None Not applicable
1.6 Customer Satisfaction Index 80.2% 82% 82.2% None Not applicable
1.7 Total Number of Visitors to National Parks
5 235 095 5,600,000 4207320 None Not applicable
21

SANParks Cumulative Quarter 3
SO2: Enhanced Conservation and Ecological Integrity of South Africa’s National Parks
Performance indicator
Baseline Annual target 2015/16
Achievements (cumulative to
end Q3)
Challenges Corrective measures
Overall perform
ance
2.1 METT Score 69.0% 70.0%Implementation of
the corrective actions per park
None Not applicable
2.2 Total Hectares of Land Rehabilitated / Restored (Initial) or New (ha)
50 836 ha 33,368 35,301 None Not applicable
2.2 (Follow-up) (ha) 206 299 ha 202,694 177,301 None Not applicable
2.2 (Wetlands) (m³)
16 823 m³
(29 sites) 6,508 4,417 None Not applicable
22

SANParks Cumulative Quarter 3
SO2: Enhanced Conservation and Ecological Integrity of South Africa’s National ParksPerformance
indicator Baseline Annual target
2015/16Achievemen
ts (cumulative to end Q3)
Challenges Corrective measures
Overall performan
ce
2.3 Total Area Added to National Parks (Terrestrial) (ha)
3 715 ha 3715 0 None Not applicable
2.3 (Marine) (km2) 0 0 0 None Not applicable2.4 Total Number of Park Management Plans Reviewed and Submitted
2 2
Completed draft lower
level plans for both parks.
None Not applicable
2.5 Total Number of Species Protection Interventions Implemented
New 65
Interventions all on target
None Not applicable
23

SANParks Cumulative Quarter 3
SO2: Enhanced Conservation and Ecological Integrity of South Africa’s National Parks
Performance indicator
Baseline Annual target 2015/16
Achievements
(cumulative to end Q3)
Challenges Corrective measures
Overall performan
ce
2.6 Total Number of Cultural Heritage Interventions Implemented
5 4 4 None Not applicable
2.7 % of new research projects relevant to SANParks key issues
72.0% 72.5% 75.6% None Not applicable
2.8 Total Number of Peer Reviewed Research Publications
15 15 31 None Not applicable
24

SANParks Cumulative Quarter 3
SO 3: Optimised Socio-Economic Beneficiation
Performance indicator
Baseline Annual target
2015/16
Achievements (cumulative to end
Q3)
Challenges Corrective measures
Overall perform
ance
3.1 Total Number of Free Access Entrants 18 100 18,200 53,028 None Not applicable
3.2 Total No of Env. Education Impact Assessment Tools Developed.
3 2 2 None Not applicable
3.3 Total Number of Participants in Environmental Education Programme
180 600 185,600
133,453 participants as opposed to the Q-ly target of 139,200. Target marginally missed
DBE Policy restricting Extra-curicular activities outside school grounds during schooling hours contributes to reducing learners' numbers.
Engagement with DBE re school tour policies and expanding holiday programmes
25

SANParks Cumulative Quarter 3
SO 3: Optimised Socio-Economic Beneficiation
Performance indicator
Baseline Annual target 2015/16
Achievements
(cumulative to end Q3)
Challenges Corrective measures Overall perform
ance
3.4 Total Number of Full-time Equivalent Jobs Created (EPWP)
5, 686 7,942 4,422
• Delays in approval of Business Plans
• Budget cuts• Management
capacity in Garden Route EPWP
• Interventions in Management system to improve efficiency
• Management positions in GNP prioritised
3.4 Total Number of Full-time Equivalent Jobs Created (Other)
New 196 144
• This is Groen Sebenza and SANParks Interms
• Number of interns left programme due to full time employment
• Full time employment is encouraged; - numbers to stabilise toward end of year instead of increase 26

SANParks Cumulative Quarter 3
SO 3: Optimised Socio-Economic Beneficiation
Performance indicator
Baseline Annual target 2015/16
Achievements
(cumulative to end Q3)
Challenges Corrective measures
Overall performan
ce
3.5 Total Number of temporary Jobs Created through Socio-economic initiatives
New 50 44 None Not applicable
3.6 Total Number of SMMEs / Enterprises Supported
665 501 780 None Not applicable
27

SANParks Cumulative Quarter 3
SO 3: Optimised Socio-Economic Beneficiation
Performance indicator
Baseline
Annual target
2015/16
Achievements (cumulative to end
Q3)
Challenges Corrective measures Overall performan
ce
3.7 Number Community Contractual Agreements in Place
4 5 0 • (See next) (see next)
28

SANParks Cumulative Quarter 3
Indicator Achievements ( Challenges Corrective measures
3.7 Number Community Contractual Agreements in Place
• No community contractual agreements were concluded.
• Contractual Park Agreement with Richtersveld Community, agreed in principle..
• Bevhula/ Gidjani : Ecological assessment done; Community Trust establishment commenced; EPWP funded rehabilitation under way.
• Mjejane: Several conflict resolution interventions beneficiary list is developed . The Community Trust is to be established,.
• Nkambeni: Ecological assessment concluded. Community Trust establishment commenced. EPWP funded land rehabilitation commenced.
• Mdluli: litigations have been resolved. Benefit products identified .
• Khomani San: Game donations finalised
• Time consuming negotiations
• Legal process to establish Community Trsusts
• Litigation (Mdluli)• Conflict resolution
(Mjejane)
•Leverage goodwill created towards SANParks to expedite concluding community agreements
29

SANParks Cumulative Quarter 3
SO 4: Enhanced Stakeholder Engagement
Performance indicator Baseline Annual target 2015/16
Achievements (cumulative
to end Q3)
Challenges Corrective measures
Overall performa
nce
4.1 Total Number of Proactive Media Engagements (Articles)
10 25 69 None Not applicable
4.1 Total Number of Proactive Media Engagements (Media Events)
14 10 12 None Not applicable
4.2 Media Reputation Rating New 95% 99% None Not applicable
30

SANParks Cumulative Quarter 3
SO 5: Effective and Efficient Corporate Governance
Performance indicator
Baseline Annual target 2015/16
Achievements (cumulative to
end Q3)
Challenges Corrective measures
Overall performance
5.1 Auditor General Audit Report
Unqualified with no other
matters
Unqualified with no other matters
Unqualified with other matters None Not applicable
5.2 % progress against Risk Response Plan
New High: 90% 45.0% None Not applicable
New Medium: 70% 40.0% None Not applicable
New Low: 20% 30.0% None Not applicable
31

SANParks Cumulative Quarter 3
SO 5: Effective and Efficient Corporate Governance
Performance indicator
Baseline Annual target 2015/16
Achievements (cumulative to
end Q3)
Challenges Corrective measures
Overall performance
5.3 % Compliance with Governance Requirements
75.0% 100% 100% None Not applicable
5.4 Total Number of ICT Strategy Initiatives Implemented per Schedule
1 1 1 None Not applicable
32

SANParks Cumulative Quarter 3
SO 6: Strengthened Human Capital
indicator Baseline Annual Q3 Challenges Corrective measures
6.1 Black as % of Management 55% 57% 54.9%
• Resignation of black managers;
• Recruitment policy amended;
• EE and succession plan to be reviewed
6.1 Women as % of Management 34% 50.0% 35.1%
• Original target met and exceeded; target increased upwards to be aligned with National Targets;
• Insufficient vacancies to meet target
• Recruitment policy and procedure amended;
• Women Forum launch – making SANParks attractive for professional woman
6.1 People with Disabilities 0.9% 2.0% 1.3%
• As above• Nature of work limit
categories of disabilities• Universal access standards
in work place not yet achieved
• Continue with declaration drive
• Identify and ring fence posts• Engage organised structures
6.1 Total Male: Female Ratio 1,8:1 1,8:1 1.79:1 None Not applicable
33

SANParks Cumulative Quarter 3
SO 6: Strengthened Human Capital
Indicator Baseline Annual Achieved Challenges Corrective measures
6.2 % of Employees Meeting Minimum Educational Requirements (C and Upper)
93% 94.0% 95.0% None Not applicable
6.3 % of Performance Appraisals Completed (C and Upper)
80% 100.0% 46.0%Delay in roll out of new performance system – include CMC
PM training; individual follow-up
6.4 % Success Rate at CCMA 80% 85.0% 100.0% None Not applicable
6.5 % progress against implementation of Skills Development Programme
82% 85.0% 65.0%
Internal processes (training committee functioning)
Skills Development Plan approval prior to commencement of financial year
34

35
Summary of YTD Performance

Financial or Trading Financial or Trading PositionPosition
36

37
Statement of Financial Performance

Statement of Financial Position

39
SANParks Operating Surplus / (Deficit)
Quarterly performance is based on management accounts incremental per month
IndicatorIndicator BudgetBudgetR ‘000R ‘000
ActualActualR ‘000R ‘000
VarianceVariance
%% R ‘000R ‘000
Total Income R 1 521 021 R 1 839 702 20.95% R 318 681
Total Expenses R 1 355 851 R 1 657 184 22.22% R 301 333
Bottom Line surplus R 165 170 R 182 518 10.50% R 17 348

40
Update on IT Governance Model
• A Governance improvement programme was developed.
• Relevant COBIT processes were grouped together into five (5) Programme Objectives as follows:
41
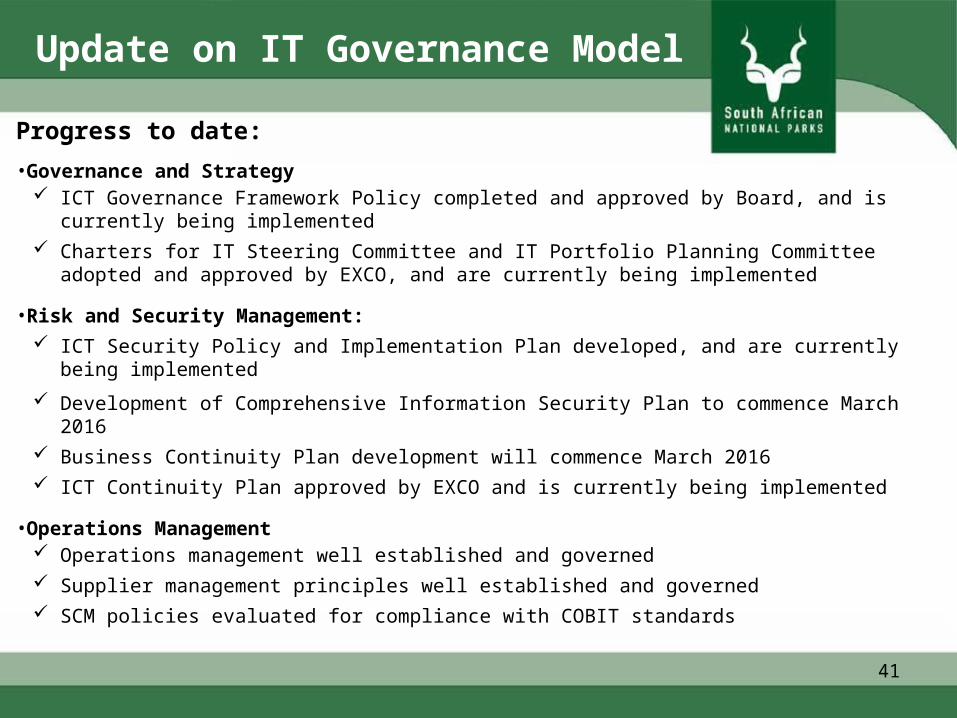
Update on IT Governance Model
Progress to date: •Governance and Strategy
ICT Governance Framework Policy completed and approved by Board, and is currently being implemented
Charters for IT Steering Committee and IT Portfolio Planning Committee adopted and approved by EXCO, and are currently being implemented
•Risk and Security Management: ICT Security Policy and Implementation Plan developed, and are currently being implemented
Development of Comprehensive Information Security Plan to commence March 2016 Business Continuity Plan development will commence March 2016 ICT Continuity Plan approved by EXCO and is currently being implemented
•Operations Management Operations management well established and governed Supplier management principles well established and governed SCM policies evaluated for compliance with COBIT standards

42
Update on IT Governance Model
Progress to date:
•Portfolio, Programme and Project Management IT Project Management Office (PMO) re-established, to be operational by March 2016 Value Management office being considered, initially part of PMO
•Change enablement All encompassing practice addressing all areas of business of which IT is only one element To mature in SANParks in 2016/17 financial year In the interim, any new IT system implementation is done together with business and
appropriate training for staff members

Audit MattersAudit Matters
43
`
44
• SANParks obtained an unqualified audit opinion on its AFS for the 2014/15 financial year.
• Two of the strategic objectives as presented in the 2014/15 Annual Performance Plan were qualified.

45
The AGSA raised the following compliance matters relating to the AFS;
1.Irregular expenditure of R126 000.2.Fruitless and wasteful expenditure of R2.951m.
Audit Matters - Finance

46
Finding: Irregular expenditure
Action Plan•SANParks SCM division has implemented a management review process to check suppliers on the NT database.
Audit Matters - Finance

47
Finding: Irregular expenditure cont’dProgress•SCM has successfully cleared the supplier database of all suppliers who were on the NT database of prohibited suppliers.•Furthermore, suppliers are checked against the NT database of prohibited suppliers, prior to processing each purchase order.•Internal Audit performed two SCM audits and no findings of this nature were noted.
Audit Matters - Finance

48
Finding: Fruitless and wasteful expenditureAction plan•Interest on overdue accounts - SANParks staff was trained to follow up suppliers for outstanding invoices.•Penalties by SARS – SANParks undertook to verify tax amendments directly with SARS•Cash embezzlement – SANParks to enhance fraud detection internal controls.•Stock losses – improve general controls over warehouse and fuel station management.
Audit Matters - Finance
49
Finding: Fruitless and wasteful expenditure cont’dProgress - Interest on overdue accounts•SCM has implemented an invoice tracking register as a control measure to ensure adherence to 30 days payment to suppliers, thus avoiding interest charges.•Internal audit conducted two SCM audits and no findings relating to this matter were noted.
Audit Matters - Finance

50
Finding: Fruitless and wasteful expenditure cont’dProgress – Cash embezzlement•Investigations were finalised and proper disciplinary measures, in adherence to the PFMA and SANParks policies, were taken against affected parties. •Existing internal controls were reviewed, root causes identified and additional controls designed to enhance fraud detection controls.
Audit Matters - Finance

51
Finding: Fruitless and wasteful expenditure cont’dProgress - Stock losses•The inventory procedure manual was drafted and approved.•Internal Audit conducted the half yearly stock counts and communicated recommendations.•SANParks is in the process of automating the inventory and fuel systems to improve stock control.
Audit Matters - Finance

52
Finding: Performance against Predetermined Objectives (AOPO)
There were two findings on predetermined objectives, relating to;•non-verifiability of the Black Visitor and; •non measurability of the Rhino Poaching performance indicators.
Audit Matters - AOPO

53
Finding: Performance against Predetermined Objectives (AOPO)Progress•Management took the decision to review both performance indicators in the current the APP
The Black Visitors indicator was removed from the current APP. However, due to its importance, management will report statistical trends relating to this indicator in another section of the Annual Report. Also, for the 2016/17 year this is reintroduced in the AOPO and concerns raised by AG addressed through amendments to the Indicator Profile / description
Audit Matters - AOPO

54
Finding: Performance against Predetermined Objectives (AOPO)
Progress•Management took the decision to review both performance indicators in the current the APP
A more suitable performance indicator has been adopted to report on Rhino Poaching incidents.
Audit Matters - AOPO

55
Finding: Information Technology Governance
Progress•ICT Strategy – An ICT Steering Committee was established and its terms of reference were approved by EXCO. The ICT Strategy was approved by the Board in January 2016.
Audit Matters - Compliance

56
Finding: Non-compliance with regulations
ProgressInformation Security Policy – IT Steering Committee has requested an Information Security Policy to be developed and submitted for approval to EXCO, the Audit & Risk Committee and the Board. Target date for completion is March 2016.
Audit Matters - Compliance

57
Finding: Non-compliance with regulations
ProgressBusiness Continuity and Disaster Recovery Plan – The ICT Service Continuity Plan and the ICT Disaster Recovery Plan was approved at EXCO in July 2015. The Corporate Business Continuity Plan, incorporating the ICT Service Continuity and Disaster Recovery plans, is being developed for submission to EXCO in March 2016. Thereafter it will be submitted to the Audit & Risk Committee and the Board for its consideration.
Audit Matters - Compliance

58
Finding: Non-compliance with regulations
ProgressUser Account Management Process – User access on the VIP HR Management System was reviewed and the appropriate changes were implemented, limiting access and keeping an audit trail. Ongoing monitoring is in place and any deviations are dealt with immediately.
Audit Matters - Compliance

Thank YouThank You
59