Embed Size (px)
Citation preview
�
� Michael Kaschke, Karl-Heinz Donnerhacke, and Michael Stefan Rill: Optical Devices in Ophthalmology andOptometry — Chap. c02 — 2013/11/11 — page 15 — le-tex
�
�
�
�
�
�
15
2Optics of the Human Eye
In all ophthalmic and optometric devices to be presented, the eye is an essential part ofthe entire optical system. Because of this, the functional principles of these devices cannotbe fully understood without an understanding of basic optics of the human eye. In thischapter, we will see that the eye can be described in a similar way as other optical systems.This finding is very important for further discussions in this book, so that this chapterserves as a basic reference.
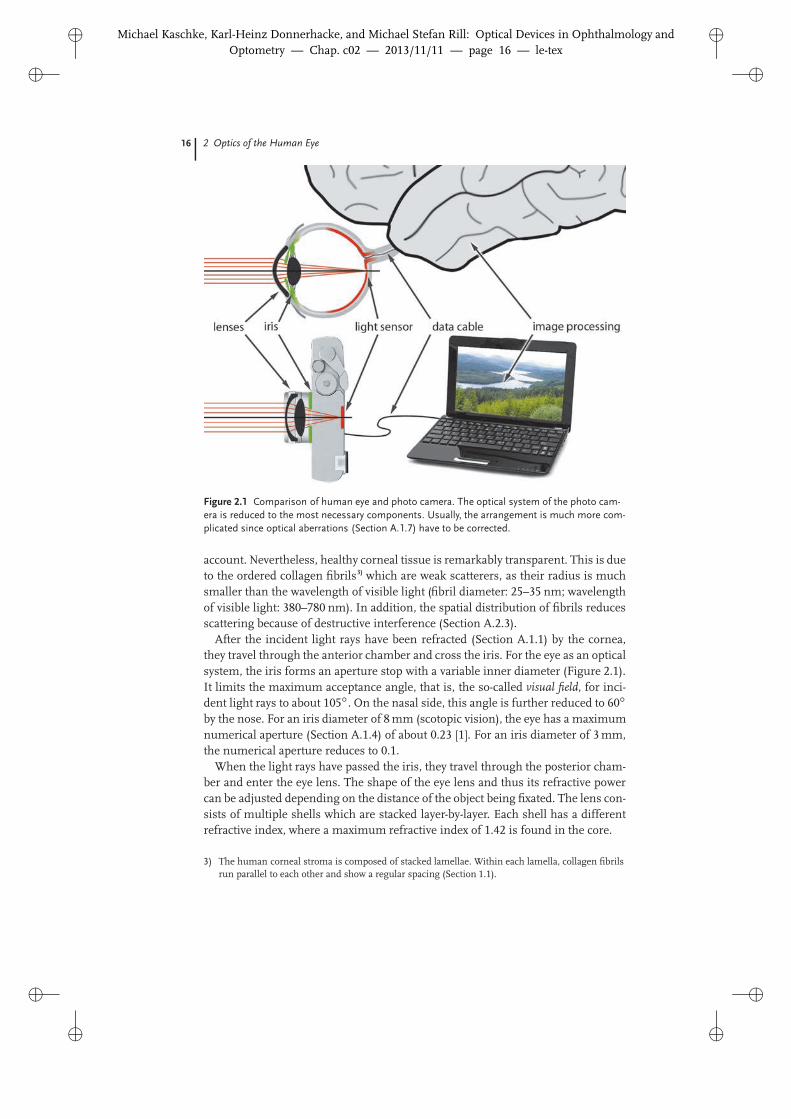
The anatomy of the human eye is readily comparable to the design of a photo cam-era (Figure 2.1). We can thus identify the iris as an aperture stop (Section 2.1.1),that the cornea and eye lens form the objective lens (Section 2.1.4), that the retinais a photo sensor, and that the brain acts as a very sophisticated image processingcomputer with intelligent algorithms. In contrast to a photo camera, the eye is nota centered optical system as its refractive components and aperture stop are notcentered at a common optical axis (Section 2.1.3). The performance of the “lightsensors” are also different for the photo camera and the human eye. The resolu-tion of the photo camera’s detector is equal for the whole area, whereas the retinalresolution is inhomogeneous (Section 2.1.5). In the central part of the retina, theresolution is high and decreases at the margins.
2.1Optical Imaging
When light is incident to the eye, first of all it enters the cornea. As our eyes areusually surrounded by air, the refractive power (Section A.1.2.1) at the air–corneainterface1) is as high as 42 diopters (D). According to the Fresnel2) equation (A5),the transmittance of the air–cornea interface is 98%. However, this value does nottake scattering (Section 9.2) and absorption (Section 9.1) of the ocular media into
1) Strictly speaking, we have to consider the interface between air and the tear film (Section 1.1).However, the refractive indices of the tear film and the corneal layers are very similar. Thus, forthe following discussions, we will regard the tear film as being a part of the cornea.
2) Augustin Fresnel (1788–1827).
Optical Devices in Ophthalmology and Optometry, First Edition. Michael Kaschke, Karl-Heinz Donnerhacke, andMichael Stefan Rill.©2014 WILEY-VCH Verlag GmbH & Co. KGaA. Published 2014 by WILEY-VCH Verlag GmbH & Co. KGaA.
�
� Michael Kaschke, Karl-Heinz Donnerhacke, and Michael Stefan Rill: Optical Devices in Ophthalmology andOptometry — Chap. c02 — 2013/11/11 — page 16 — le-tex
�
�
�
�
�
�
16 2 Optics of the Human Eye
Figure 2.1 Comparison of human eye and photo camera. The optical system of the photo cam-era is reduced to the most necessary components. Usually, the arrangement is much more com-plicated since optical aberrations (Section A.1.7) have to be corrected.
account. Nevertheless, healthy corneal tissue is remarkably transparent. This is dueto the ordered collagen fibrils3) which are weak scatterers, as their radius is muchsmaller than the wavelength of visible light (fibril diameter: 25–35 nm; wavelengthof visible light: 380–780 nm). In addition, the spatial distribution of fibrils reducesscattering because of destructive interference (Section A.2.3).
After the incident light rays have been refracted (Section A.1.1) by the cornea,they travel through the anterior chamber and cross the iris. For the eye as an opticalsystem, the iris forms an aperture stop with a variable inner diameter (Figure 2.1).It limits the maximum acceptance angle, that is, the so-called visual field, for inci-dent light rays to about 105ı . On the nasal side, this angle is further reduced to 60ı
by the nose. For an iris diameter of 8 mm (scotopic vision), the eye has a maximumnumerical aperture (Section A.1.4) of about 0.23 [1]. For an iris diameter of 3 mm,the numerical aperture reduces to 0.1.
When the light rays have passed the iris, they travel through the posterior cham-ber and enter the eye lens. The shape of the eye lens and thus its refractive powercan be adjusted depending on the distance of the object being fixated. The lens con-sists of multiple shells which are stacked layer-by-layer. Each shell has a differentrefractive index, where a maximum refractive index of 1.42 is found in the core.
3) The human corneal stroma is composed of stacked lamellae. Within each lamella, collagen fibrilsrun parallel to each other and show a regular spacing (Section 1.1).
�
� Michael Kaschke, Karl-Heinz Donnerhacke, and Michael Stefan Rill: Optical Devices in Ophthalmology andOptometry — Chap. c02 — 2013/11/11 — page 17 — le-tex
�
�
�
�
�
�
2.1 Optical Imaging 17
Behind the lens, light passes through the vitreous and is eventually “detected”by the retina. The image formed on the retina is inverted, that is, upside down,which is analogous to the imaging of a single lens (Figure A.6). Another inversionprocess happens in the brain, which results in the correct visual perception of ourenvironment.
2.1.1Entrance and Exit Pupils
In ophthalmology and optometry, the term “pupil” is often referred to as the holeof the iris (iris aperture). But technically, the iris is actually an aperture stop (Sec-tion A.1.4).4) The cornea forms an image of this aperture stop which is in opticalterms the entrance pupil of the eye. The exit pupil of the eye is the image of thesame aperture stop formed by the eye lens.
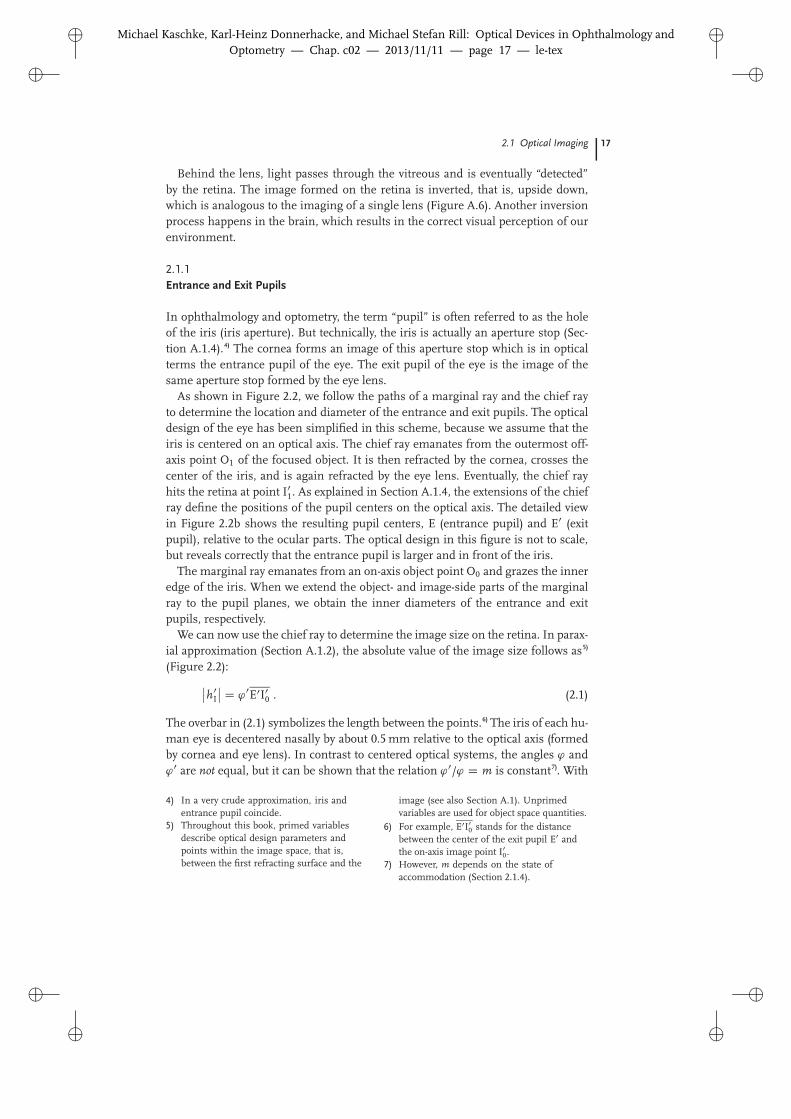
As shown in Figure 2.2, we follow the paths of a marginal ray and the chief rayto determine the location and diameter of the entrance and exit pupils. The opticaldesign of the eye has been simplified in this scheme, because we assume that theiris is centered on an optical axis. The chief ray emanates from the outermost off-axis point O1 of the focused object. It is then refracted by the cornea, crosses thecenter of the iris, and is again refracted by the eye lens. Eventually, the chief rayhits the retina at point I0
1. As explained in Section A.1.4, the extensions of the chiefray define the positions of the pupil centers on the optical axis. The detailed viewin Figure 2.2b shows the resulting pupil centers, E (entrance pupil) and E0 (exitpupil), relative to the ocular parts. The optical design in this figure is not to scale,but reveals correctly that the entrance pupil is larger and in front of the iris.
The marginal ray emanates from an on-axis object point O0 and grazes the inneredge of the iris. When we extend the object- and image-side parts of the marginalray to the pupil planes, we obtain the inner diameters of the entrance and exitpupils, respectively.
We can now use the chief ray to determine the image size on the retina. In parax-ial approximation (Section A.1.2), the absolute value of the image size follows as5)
(Figure 2.2):ˇ̌h0
I
ˇ̌ D '0E0I00 . (2.1)
The overbar in (2.1) symbolizes the length between the points.6) The iris of each hu-man eye is decentered nasally by about 0.5 mm relative to the optical axis (formedby cornea and eye lens). In contrast to centered optical systems, the angles ' and'0 are not equal, but it can be shown that the relation '0/' D m is constant7). With
4) In a very crude approximation, iris andentrance pupil coincide.
5) Throughout this book, primed variablesdescribe optical design parameters andpoints within the image space, that is,between the first refracting surface and the
image (see also Section A.1). Unprimedvariables are used for object space quantities.
6) For example, E0I00 stands for the distance
between the center of the exit pupil E0 andthe on-axis image point I0
0.7) However, m depends on the state of
accommodation (Section 2.1.4).
�
� Michael Kaschke, Karl-Heinz Donnerhacke, and Michael Stefan Rill: Optical Devices in Ophthalmology andOptometry — Chap. c02 — 2013/11/11 — page 18 — le-tex
�
�
�
�
�
�
18 2 Optics of the Human Eye
hO
O1
O0
φ
α α'φ'
entrance pupil exit pupil
marginal ray
chief ray
iris
E E‘
eye lenscornea
(a)
(b)
entrance pupil exit pupil
EE‘
marginal ray
chief ray
optical axis
cornea eye lens
iris
h'I
I'1
I'0
Figure 2.2 Location of entrance and exitpupils of the human eye. The indication ofparameters is comparable to Figure A.13.(a) Path of the chief ray which starts at theoutermost point O1 of the object and passesthrough the center of the iris. The extensionsof the chief ray on the object and image sidedefine the centers of the entrance and exitpupils, respectively. E is the center of the en-
trance pupil and E0 the center of the exit pupil.' and '0 denote the included angles betweenoptical axis and chief ray on the object andimage side, respectively. The correspondingangles between marginal ray and optical axisare α and α0. (b) Detailed view (dashed boxof (a)) of the optical design in the anteriorsegment. Adapted from [2].
the object height hO and ' D jhOj/O0E, we may thus rewrite (2.1) as
ˇ̌h0
I
ˇ̌ D m jhOj E0I00
O0E. (2.2)
�
� Michael Kaschke, Karl-Heinz Donnerhacke, and Michael Stefan Rill: Optical Devices in Ophthalmology andOptometry — Chap. c02 — 2013/11/11 — page 19 — le-tex
�
�
�
�
�
�
2.1 Optical Imaging 19
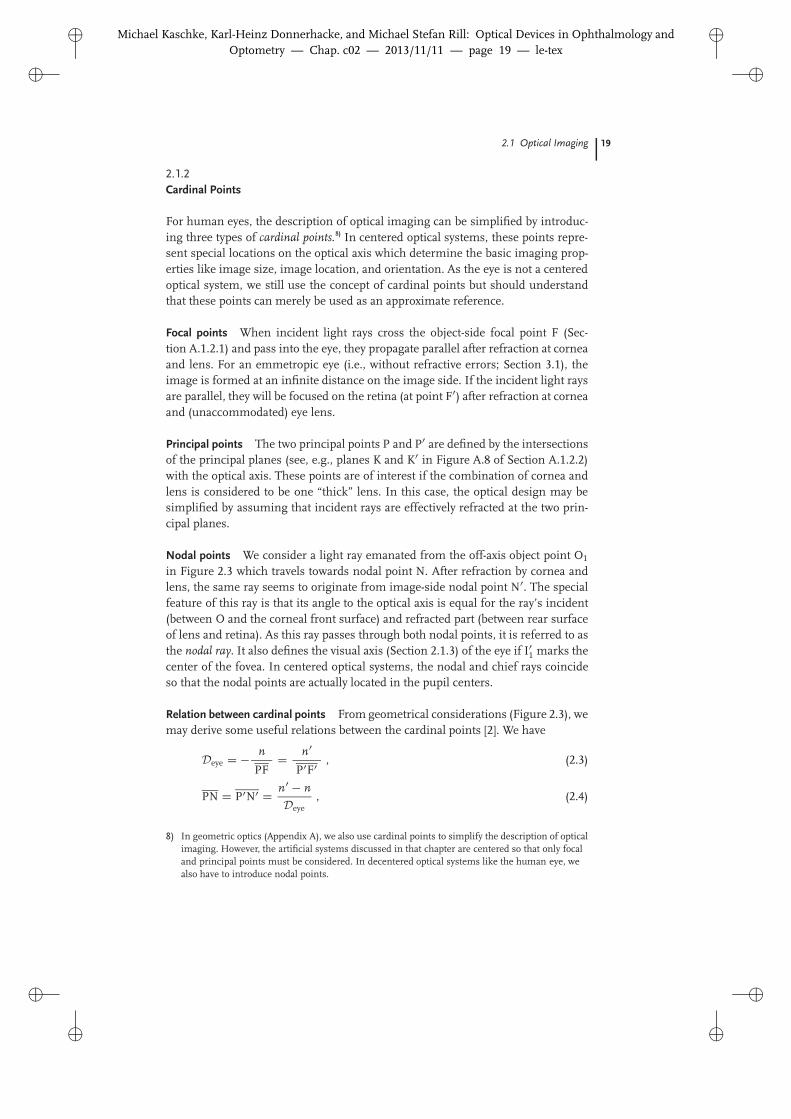
2.1.2Cardinal Points
For human eyes, the description of optical imaging can be simplified by introduc-ing three types of cardinal points.8) In centered optical systems, these points repre-sent special locations on the optical axis which determine the basic imaging prop-erties like image size, image location, and orientation. As the eye is not a centeredoptical system, we still use the concept of cardinal points but should understandthat these points can merely be used as an approximate reference.
Focal points When incident light rays cross the object-side focal point F (Sec-tion A.1.2.1) and pass into the eye, they propagate parallel after refraction at corneaand lens. For an emmetropic eye (i.e., without refractive errors; Section 3.1), theimage is formed at an infinite distance on the image side. If the incident light raysare parallel, they will be focused on the retina (at point F0) after refraction at corneaand (unaccommodated) eye lens.
Principal points The two principal points P and P0 are defined by the intersectionsof the principal planes (see, e.g., planes K and K0 in Figure A.8 of Section A.1.2.2)with the optical axis. These points are of interest if the combination of cornea andlens is considered to be one “thick” lens. In this case, the optical design may besimplified by assuming that incident rays are effectively refracted at the two prin-cipal planes.
Nodal points We consider a light ray emanated from the off-axis object point O1
in Figure 2.3 which travels towards nodal point N. After refraction by cornea andlens, the same ray seems to originate from image-side nodal point N0. The specialfeature of this ray is that its angle to the optical axis is equal for the ray’s incident(between O and the corneal front surface) and refracted part (between rear surfaceof lens and retina). As this ray passes through both nodal points, it is referred to asthe nodal ray. It also defines the visual axis (Section 2.1.3) of the eye if I0
1 marks thecenter of the fovea. In centered optical systems, the nodal and chief rays coincideso that the nodal points are actually located in the pupil centers.
Relation between cardinal points From geometrical considerations (Figure 2.3), wemay derive some useful relations between the cardinal points [2]. We have
Deye D � n
PFD n0
P0F0, (2.3)
PN D P0N0 D n0 � nDeye
, (2.4)
8) In geometric optics (Appendix A), we also use cardinal points to simplify the description of opticalimaging. However, the artificial systems discussed in that chapter are centered so that only focaland principal points must be considered. In decentered optical systems like the human eye, wealso have to introduce nodal points.
�
� Michael Kaschke, Karl-Heinz Donnerhacke, and Michael Stefan Rill: Optical Devices in Ophthalmology andOptometry — Chap. c02 — 2013/11/11 — page 20 — le-tex
�
�
�
�
�
�
20 2 Optics of the Human Eye
hO
O1
F,O0
entrance pupil
EPP‘V N N‘C F‘
E‘
fixationaxis
visual axis
line of sight
pupillary axis
opticalaxis
κ
eye lens
iris
cornea
fovea
n n‘
h'I
I'1
I'0
Figure 2.3 Axes and cardinal points of the eyewith corresponding inclination angles. V is thepoint of intersection of the optical axis withthe cornea (corneal vertex). E and E0 representthe centers of the entrance and exit pupils.N and N0 denote the nodal points of the eye,
and C is the rotation center of the eye. P andP0 are the principal points of the eye. n and n0
represent the refractive indices outside and in-side the eye, and � is the angle between visualaxis and optical axis. Adapted from [2].
FN D P0F0 , (2.5)
FP D N0F0 . (2.6)
Deye denotes the total refractive power of the human eye, n is the refractive indexof the object space (usually air), and n0 the refractive index of the image space(i.e., the refractive index of the vitreous). Values for Deye and n0 will be specified inSection 2.2.
2.1.3Eye Axes
In centered optical systems, the optical axis is usually determined by the line whichintersects with the centers of curvature of all refracting and reflecting surfaces.Since the ocular parts are decentered, it is useful to “redefine” the optical axis ofan eye as the best-fit line between the centers of curvature of all refracting surfaces(black line in Figure 2.3). In addition, we introduce some other axes that help us todescribe the eye’s optical geometry (see also [2]).
Visual axis The line between the fixated point O1 and fovea by way of nodal pointsN and N0 is referred to as the visual axis. The visual axis thus consists of the twoline segments O1N and N0I0
1 (red line in Figure 2.3) and forms the actual imagingaxis of the eye. On average, the optical axis and the visual axis enclose an angle of� � 5ı on the object side.
With the visual axis, we can once again determine the retinal image size (com-pare with Section 2.1.1). In the case of paraxial optics, the absolute value of the
�
� Michael Kaschke, Karl-Heinz Donnerhacke, and Michael Stefan Rill: Optical Devices in Ophthalmology andOptometry — Chap. c02 — 2013/11/11 — page 21 — le-tex
�
�
�
�
�
�
2.1 Optical Imaging 21
retinal image size is given byˇ̌h0
I
ˇ̌ D �N0I00 (2.7)
D jhOj N0I00
O0N, (2.8)
where � D �hO/O0N.
Line of sight The line of sight is given by the line between a fixated object point O1
and the center of entrance pupil E (green line in Figure 2.3). On average, the anglebetween the line of sight and the pupillary axis is approximately 2.5ı . The positionat which the line of sight crosses the cornea is referred to as the corneal sight center.
Pupillary axis The pupillary axis passes through the center of entrance pupil E andis perpendicular to the corneal surface (orange line in Figure 2.3). It is used as anobjective measure to judge the amount of eccentric fixation. As the eye is not acentered optical system, the entrance pupil is often not concentric to the cornea.The cornea may also have an irregular shape. Both factors cause the pupillary axisto be different from the optical axis. However, for the following discussions, weassume the center of the entrance pupil to lie on the optical axis.
Fixation axis The fixation axis is the reference axis for eye movements. It is deter-mined by the line between object point O1 and center of eye rotation C (blue linein Figure 2.3).
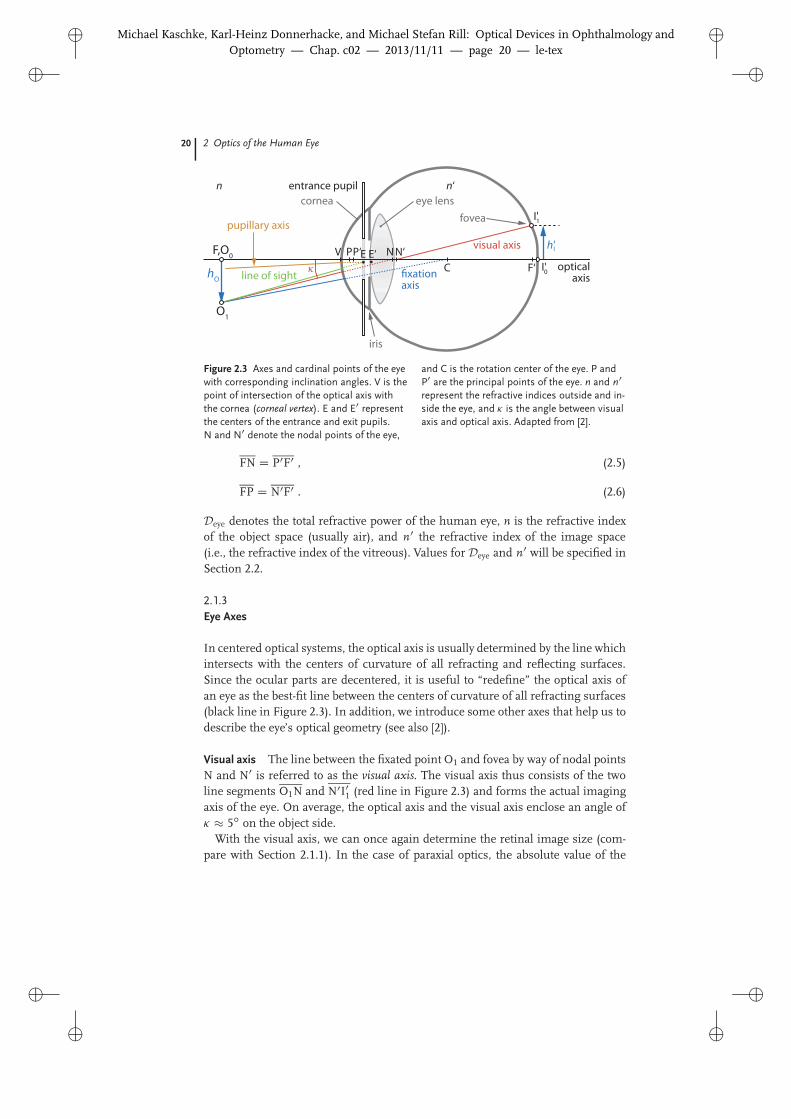
2.1.4Accommodation
In healthy eyes, the refractive power of the eye lens is at maximum Dl D 20 Dand thus contributes only � 30% to the total eye refraction.9) However, within acertain limit, the lens is able to change the refractive power so that nearby as wellas distant objects can be sharply imaged on the retina. This process is referred to asaccommodation. The range over which the refractive power can be changed dependson age.
Mechanism of accommodation If the eye focuses on nearby objects, the ciliarymuscle is contracted and the zonular fibers are relaxed (accommodated eye). Whenthe tension on the lens is decreased, the elasticity of the lens capsule keeps it in amore spherical shape (upper part of Figure 2.4). As the lens becomes more stronglycurved in this case,10) the eye’s total refractive power increases (near vision). To focusobjects which are located far away from the eye (far vision), the deformable, elastic
9) The lower refractive power of the eye lens results from the smaller difference of refractive indicesat the aqueous humor–lens and lens–vitreous interfaces.
10) This corresponds to a reduced radius of curvature.
�
� Michael Kaschke, Karl-Heinz Donnerhacke, and Michael Stefan Rill: Optical Devices in Ophthalmology andOptometry — Chap. c02 — 2013/11/11 — page 22 — le-tex
�
�
�
�
�
�
22 2 Optics of the Human Eye
sfar
snear
Qfar
accommodated(near vision)
relaxed(far vision)
ciliary musclezonular fiber
iris
Qnear P
Figure 2.4 Physiology of accommodation.Upper half of figure: If the ciliary muscle iscontracted, the zonular fibers are relaxed andthe elasticity of the lens capsule keeps the lensin a more spherical shape. In this case, therefractive power of the lens is higher so thatnearby objects can be imaged (near vision).Lower half of figure: To fixate objects which
are located far away from the eye (far vision),the deformable eye lens is brought to an el-liptical shape by pulling on the lens capsule.The pulling force which acts on the zonularfibers is generated by a relaxed ciliary muscle.For reference, the near point Qnear, far pointQfar, principal point P, and the correspondingdistances (snear and sfar) are shown.
lens is brought to a more elliptical shape by pulling on the lens capsule. The pullingforce acting on the zonular fibers is generated by a relaxed ciliary muscle (relaxedeye). This situation is illustrated in the lower part of Figure 2.4.
Accommodation is an unconscious process that is not yet fully understood. Butit is a common belief that chromatic aberrations (Section A.1.9) may deliver therequired optical stimulus [3, 4].
Range of accommodation The refractive power of the eye lens can be changedonly within certain limits. The upper and lower limits of attainable refractive powerdetermine the range of accommodation within which sharp vision is possible. Theendpoints of the range of accommodation are called far and near point, respectively.The far point Qfar is the object point imaged by the eye when the total refractivepower is minimal. The near point Qnear is the object point imaged by the eye whenthe total refractive power is maximal. The corresponding distances of Qfar and Qnear
from the object-side principal point P (Section 2.1.2) of the eye are referred to asthe far point distance sfar and near point distance snear, respectively. If sfar or snear aresituated in front of the eye, the distances are negative. If they lie (virtually) behindthe eye, the distances are set positive. The inverse distances are called the far pointrefraction A far D 1/sfar and near point refraction A near D 1/snear ([A far] D [A near] DD).
The difference between far and near point refraction is referred to as the ampli-tude of accommodation
ΔA max D A far � A near . (2.9)
�
� Michael Kaschke, Karl-Heinz Donnerhacke, and Michael Stefan Rill: Optical Devices in Ophthalmology andOptometry — Chap. c02 — 2013/11/11 — page 23 — le-tex
�
�
�
�
�
�
2.1 Optical Imaging 23
ampl
itude
of a
ccom
mod
atio
n Δ
A max
(D)
age (years)
10
6
4
2
0
8
168 40 4824 32 56 64 72
12
14
16
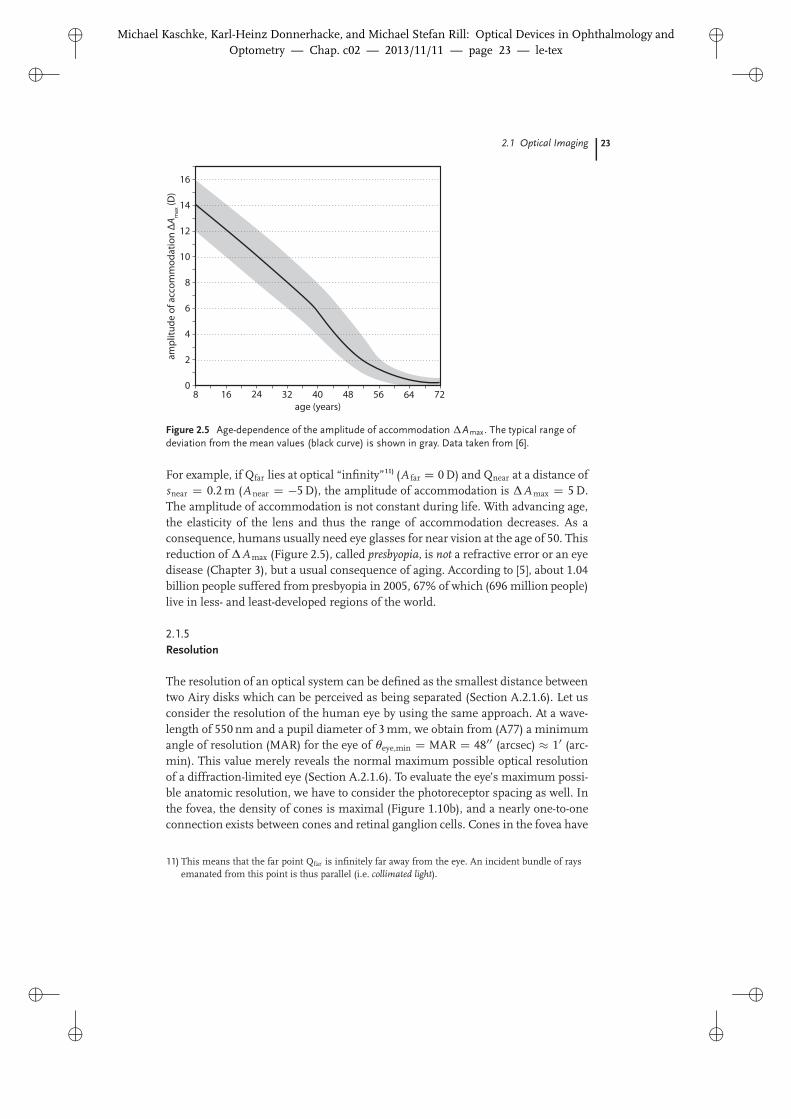
Figure 2.5 Age-dependence of the amplitude of accommodation ΔAmax. The typical range ofdeviation from the mean values (black curve) is shown in gray. Data taken from [6].
For example, if Qfar lies at optical “infinity”11) (A far D 0 D) and Qnear at a distance ofsnear D 0.2 m (A near D �5 D), the amplitude of accommodation is ΔA max D 5 D.The amplitude of accommodation is not constant during life. With advancing age,the elasticity of the lens and thus the range of accommodation decreases. As aconsequence, humans usually need eye glasses for near vision at the age of 50. Thisreduction of ΔA max (Figure 2.5), called presbyopia, is not a refractive error or an eyedisease (Chapter 3), but a usual consequence of aging. According to [5], about 1.04billion people suffered from presbyopia in 2005, 67% of which (696 million people)live in less- and least-developed regions of the world.
2.1.5Resolution
The resolution of an optical system can be defined as the smallest distance betweentwo Airy disks which can be perceived as being separated (Section A.2.1.6). Let usconsider the resolution of the human eye by using the same approach. At a wave-length of 550 nm and a pupil diameter of 3 mm, we obtain from (A77) a minimumangle of resolution (MAR) for the eye of θeye,min D MAR D 4800 (arcsec) � 10 (arc-min). This value merely reveals the normal maximum possible optical resolutionof a diffraction-limited eye (Section A.2.1.6). To evaluate the eye’s maximum possi-ble anatomic resolution, we have to consider the photoreceptor spacing as well. Inthe fovea, the density of cones is maximal (Figure 1.10b), and a nearly one-to-oneconnection exists between cones and retinal ganglion cells. Cones in the fovea have
11) This means that the far point Qfar is infinitely far away from the eye. An incident bundle of raysemanated from this point is thus parallel (i.e. collimated light).
�
� Michael Kaschke, Karl-Heinz Donnerhacke, and Michael Stefan Rill: Optical Devices in Ophthalmology andOptometry — Chap. c02 — 2013/11/11 — page 24 — le-tex
�
�
�
�
�
�
24 2 Optics of the Human Eye
a center-to-center distance of about 2 µm. When the images of two adjacent pointsources stimulate two adjacent cones, they are perceived as being only one pointsource. If, however, there is one cone unstimulated in between those stimulated bythe point sources, then their images are perceived as being separated. As a conse-quence, a minimum separation of � 4 μm between image points is required. Thisvalue corresponds well to the angle of 4800 at the nodal point, taking into accountthat the image-side nodal point lies about 17 mm in front of the retina (Figure 2.13).The angular limit of photoreceptor resolution is thus in agreement with the mini-mum angle of resolution of a diffraction-limited eye. In the case of scotopic vision(Section 1.2.1) however, the eye’s resolution is much lower (θeye > 100). As the out-put signal of about 100 rods is combined into one ganglion cell, the effective sizeof one “detector pixel” is much larger and sensitivity is much higher, too.
2.1.5.1 Visual PerformanceThe values we have calculated for MAR can only be achieved with healthy eyes un-der ideal ambient light conditions. Normal vision may be impaired by refractive er-rors (Section 3.1), higher-order aberrations (Section 5.4), eye diseases (Sections 3.2–3.7), and/or problems with the processing of visual signals.
To quantify the visual performance of a patient, we could directly determine theminimum angle of resolution (MAR). In practice, however, this quantity could bea bit confusing, since a large angle means low vision and vice versa. Thus, thevisual performance is usually expressed by the inverse of the minimum angle ofresolution
V D 1MAR
, (2.10)
where V is the so-called visual acuity, which we will preferably use in this book. Apatient with V D 1 ([V ] D 1/0 D (arcmin)�1) is considered to have normal vision.By definition, the visual acuity scale is divided into intervals such that the quotientof two adjacent values of V is constant12) (e.g., 1/10, 1/1.30 , 1/1.60 , 1/2.00 , 1/2.50). Asa consequence, the visual acuity scale has 22 divisions ranging from V D 0.020 toV D 2.5. After three scale divisions the visual acuity has doubled.
Another common measure for the visual performance is specified by the com-mon logarithm of the minimum angle of resolution (log10 MAR). This so-calledlogMAR scale is particularly used in scientific publications. The visual acuity scaleis related to the logMAR scale via
V D 10�logMAR (2.11)
and can also be defined via distances. As a reference parameter, a distance is chosenat which two object points or lines can be clearly distinguished under an angle of10. For example, two points separated by 1.75 mm are placed at a distance of 6 m sothat they appear at an angle of 10. If a test person can perceive these as two pointsonly from a distance of 3 m, then his or her visual acuity is consequently V D 0.5(which corresponds to 0.3 logMAR).
12) This actually corresponds to a decibel (dB) scale.
�
� Michael Kaschke, Karl-Heinz Donnerhacke, and Michael Stefan Rill: Optical Devices in Ophthalmology andOptometry — Chap. c02 — 2013/11/11 — page 25 — le-tex
�
�
�
�
�
�
2.1 Optical Imaging 25
5‘5‘
1‘
1‘
(a) (b)
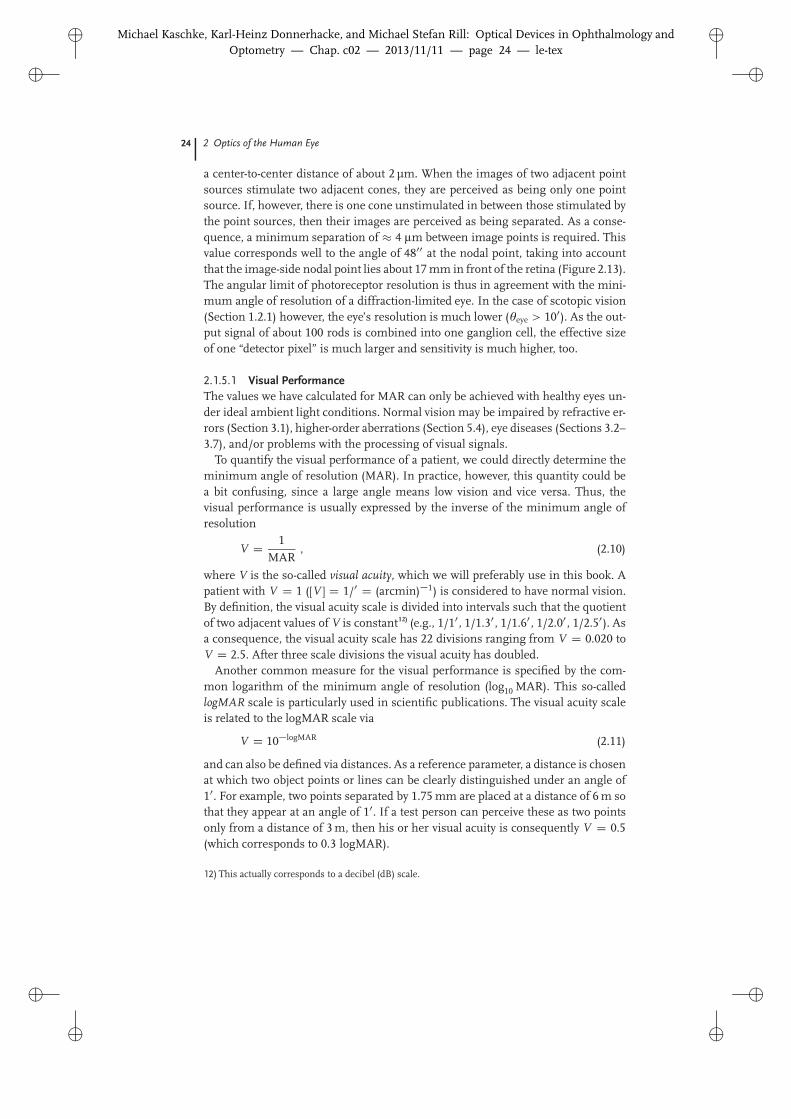
Figure 2.6 Two typical symbols which areused to determine the visual acuity. For sub-jective measurements, the symbols are dis-played in different sizes and in various statesof rotation. The patient then has to state inwhich direction the respective feature of in-
terest shows. This type of chart can thus alsobe used for patients who are illiterate or tooyoung to read. (a) Landolt ring. The feature ofinterest is the gap of the “C”-shaped symbol.(b) Snellen E. The feature of interest is thelimb.
2.1.5.2 Determination of the Visual PerformanceVisual acuity is measured by subjective methods. The smallest feature size whichcan be clearly resolved by the patient determines the visual acuity. For this purpose,a wall chart with Landolt rings13) (Figure 2.6a) is used as a test target. The symbolsare displayed in different sizes and orientations at a defined distance from the pa-tient. The patient is now asked to state in which direction the corresponding featureof interest shows. The smallest feature which can be clearly recognized by the pa-tient determines the visual acuity. For example, if a patient is able to recognize theorientation of Landolt ring gaps (top, right, bottom, left) with a gap size of 1.75 mmat a distance of 6 m, he or she has a visual acuity of 1. Patients with a lower visualacuity see a blurred image (e.g., the Landolt ring is perceived as a closed ring ordot) and thus cannot find the right feature orientation.
In clinical practice, the so-called Snellen chart is used as an alternative measurefor the visual acuity. It consist of letters of the alphabet (see e.g. the “Snellen E”in Figure 2.6b) which are arranged in rows. In each row, the size of the letters isdifferent so that each row can be used to test a different level of acuity. The ratingof the acuity relates to the distance at which an emmetropic test person (“normal”visual acuity) is able to recognize the letters in that line. The (Snellen) visual acuityis defined by
VS D testing distance (in m)distance (in m) at which test line letters subtend an angle of 50
.
(2.12)
The 6/6 acuity line represents the “normal” line and contains letters that subtendan angle of 50 (with a minimum feature size of 10) at a distance of 6 m.
Subjective methods do not only check the performance of the pure optical sys-tem, but also determine the image processing capability of the sensory organ onthe whole (i.e., the combined eye–brain imaging system).
13) Edmund Landolt (1846–1926).
�
� Michael Kaschke, Karl-Heinz Donnerhacke, and Michael Stefan Rill: Optical Devices in Ophthalmology andOptometry — Chap. c02 — 2013/11/11 — page 26 — le-tex
�
�
�
�
�
�
26 2 Optics of the Human Eye
0 1 2 3 4
visu
al a
cuity
V
diameter of entrance pupil dpupil (mm)
2.5
2.0
1.5
1.0
0.5
05 6 7 8
limited bydiffraction
limited byaberrations
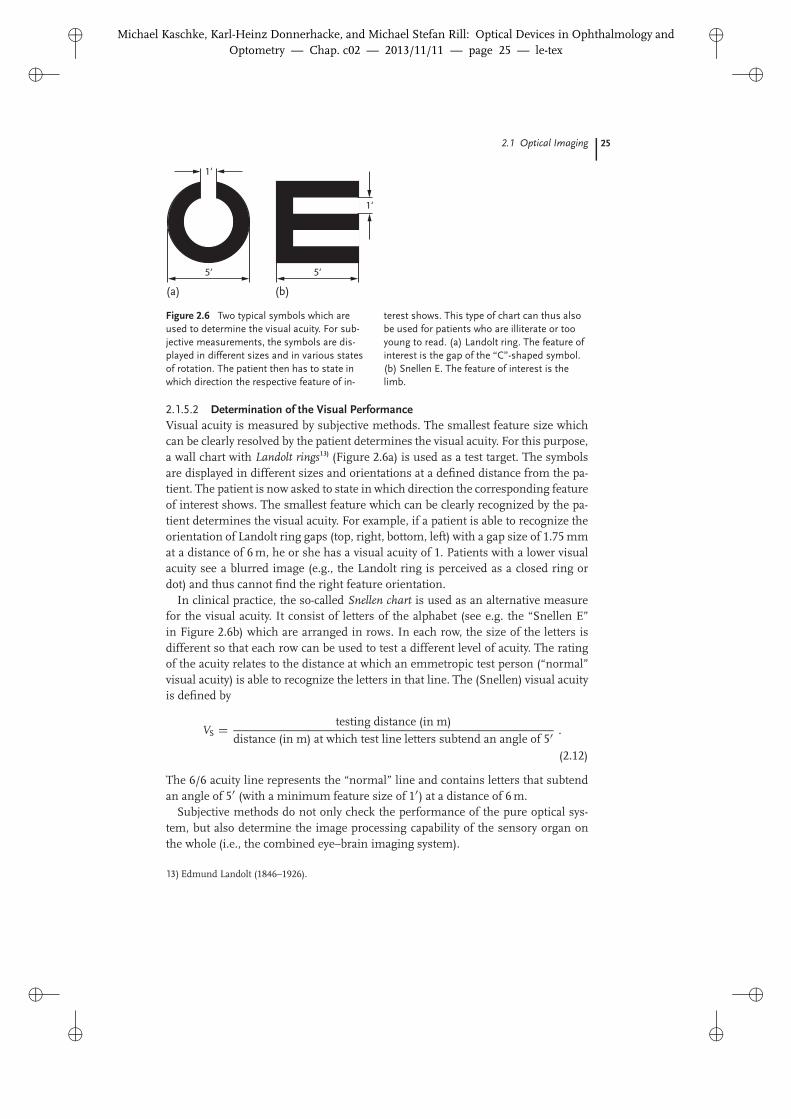
Figure 2.7 Diameter of the eye’s entrancepupil versus visual acuity. A maximum visualacuity is attained for a pupil diameter of about2.5 mm. Below 2.5 mm (gray area), the opticalperformance is limited by diffraction. Above
2.5 mm, aberrations deteriorate the opticalresolution of the eye. Data points are takenfrom [7]. The dashed line is a best-fit curvethrough the data points and meant as a guid-ance.
2.1.5.3 Influence Factors on the Visual PerformanceAs already mentioned, refractive errors and insufficient ambient light conditionsdecrease the visual acuity of human eyes. In addition, a number of other factorsmay influence vision, such as the diameter of the eye’s entrance pupil (Figure 2.7).For photopic vision (Section 2.1.6), the best resolution is given for a pupil diameterof about dpupil � 2.5 mm. A smaller pupil diameter deteriorates the resolution asdiffraction (Section A.2.1.6) comes into play. If the pupil diameter is larger, opticalaberrations (Section A.1.6) reduce the resolution so that the visual acuity eventually“saturates”.
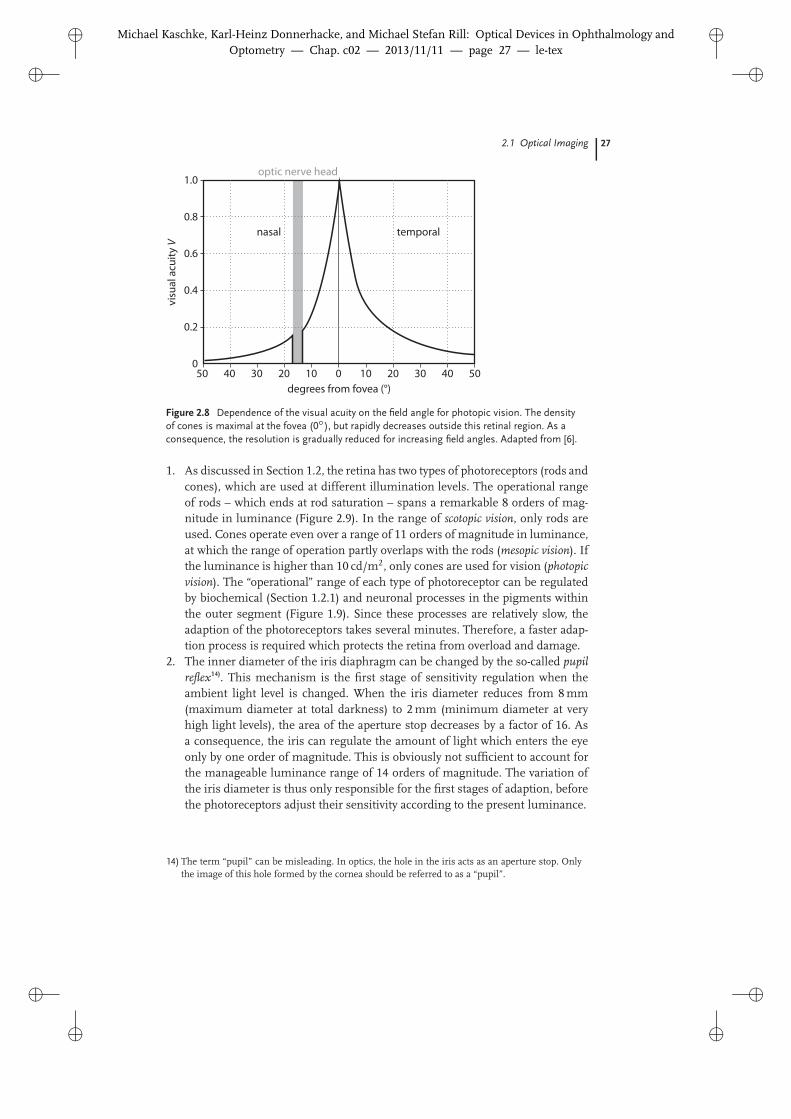
As the density of cones and ganglion cells rapidly decreases outside the fovea,the visual performance for photopic vision also depends on the field angle at whichthe image is projected on the retina (Figure 2.8). At the optic nerve head, no pho-toreceptors exist at all so that the visual acuity equals to zero in this area (the so-called blind spot). Other influence factors for the visual performance are the shape,brightness, and color of considered objects as well as the degree of attention (psy-chological influence factors).
2.1.6Adaption
The eye is able to maintain a high sensitivity to small changes in light intensityacross a broad range of ambient light levels. Full operation of human vision ispossible for a luminance between 10�6 and 108 cd/m2 [8]. For this purpose, the eyeuses the following mechanisms to adapt to the given ambient light conditions:
�
� Michael Kaschke, Karl-Heinz Donnerhacke, and Michael Stefan Rill: Optical Devices in Ophthalmology andOptometry — Chap. c02 — 2013/11/11 — page 27 — le-tex
�
�
�
�
�
�
2.1 Optical Imaging 27
50
visu
al a
cuity
V
degrees from fovea (°)
1.0
0.6
0.4
0.2
0
0.8
40 20 0 20 4030 10 10 30 50
optic nerve head
nasal temporal
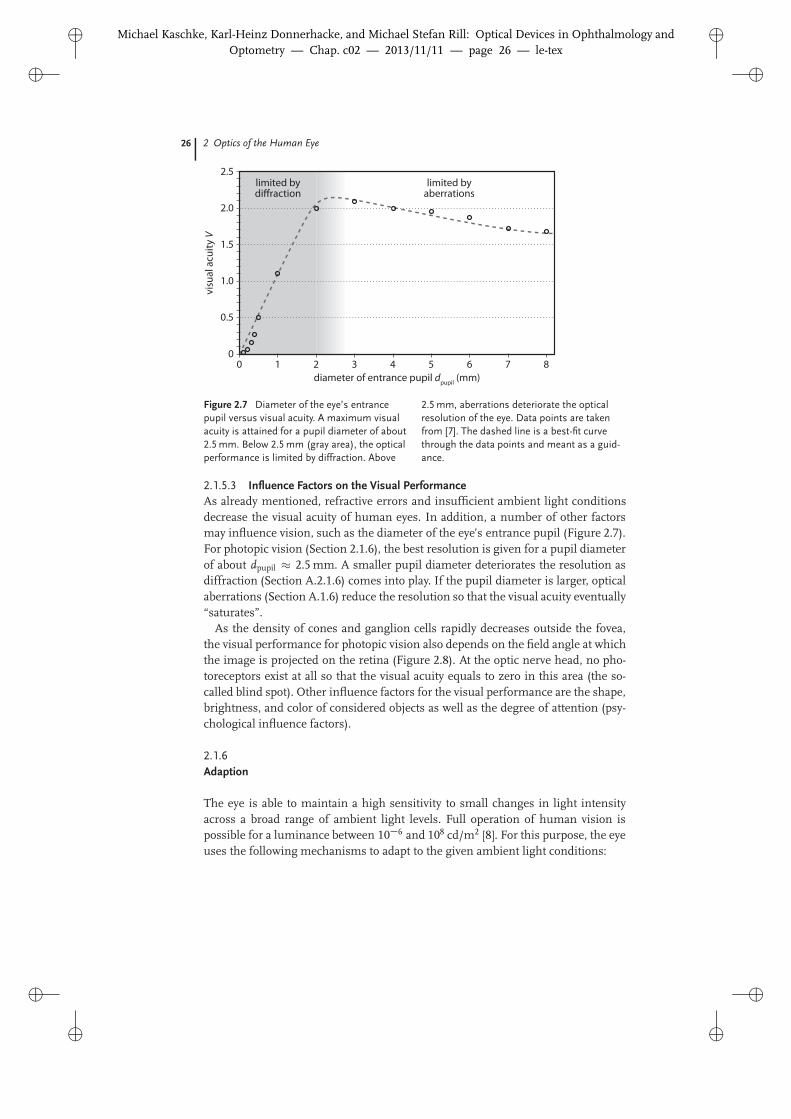
Figure 2.8 Dependence of the visual acuity on the field angle for photopic vision. The densityof cones is maximal at the fovea (0ı), but rapidly decreases outside this retinal region. As aconsequence, the resolution is gradually reduced for increasing field angles. Adapted from [6].
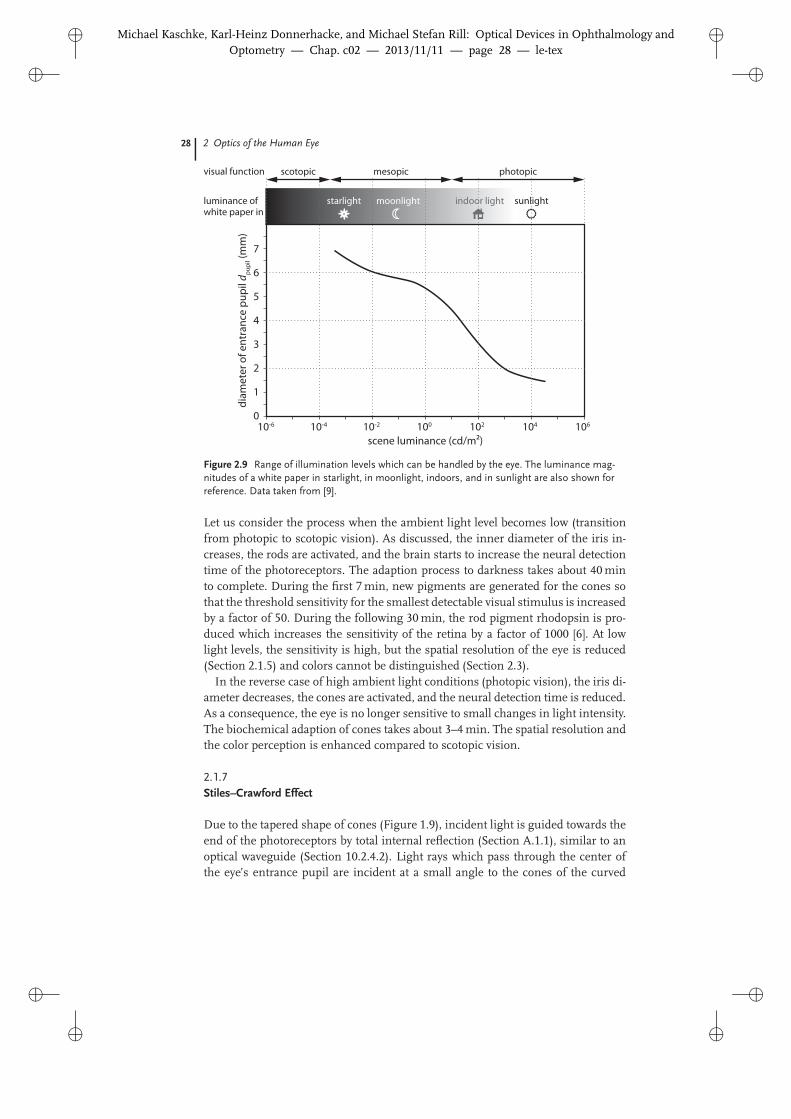
1. As discussed in Section 1.2, the retina has two types of photoreceptors (rods andcones), which are used at different illumination levels. The operational rangeof rods – which ends at rod saturation – spans a remarkable 8 orders of mag-nitude in luminance (Figure 2.9). In the range of scotopic vision, only rods areused. Cones operate even over a range of 11 orders of magnitude in luminance,at which the range of operation partly overlaps with the rods (mesopic vision). Ifthe luminance is higher than 10 cd/m2, only cones are used for vision (photopicvision). The “operational” range of each type of photoreceptor can be regulatedby biochemical (Section 1.2.1) and neuronal processes in the pigments withinthe outer segment (Figure 1.9). Since these processes are relatively slow, theadaption of the photoreceptors takes several minutes. Therefore, a faster adap-tion process is required which protects the retina from overload and damage.
2. The inner diameter of the iris diaphragm can be changed by the so-called pupilreflex14). This mechanism is the first stage of sensitivity regulation when theambient light level is changed. When the iris diameter reduces from 8 mm(maximum diameter at total darkness) to 2 mm (minimum diameter at veryhigh light levels), the area of the aperture stop decreases by a factor of 16. Asa consequence, the iris can regulate the amount of light which enters the eyeonly by one order of magnitude. This is obviously not sufficient to account forthe manageable luminance range of 14 orders of magnitude. The variation ofthe iris diameter is thus only responsible for the first stages of adaption, beforethe photoreceptors adjust their sensitivity according to the present luminance.
14) The term “pupil” can be misleading. In optics, the hole in the iris acts as an aperture stop. Onlythe image of this hole formed by the cornea should be referred to as a “pupil”.
�
� Michael Kaschke, Karl-Heinz Donnerhacke, and Michael Stefan Rill: Optical Devices in Ophthalmology andOptometry — Chap. c02 — 2013/11/11 — page 28 — le-tex
�
�
�
�
�
�
28 2 Optics of the Human Eye
10-6 10-4 10-2 100
diam
eter
of e
ntra
nce
pupi
l dpu
pil (m
m)
scene luminance (cd/m²)
0102 106104
1
2
3
4
5
6
7
luminance of white paper in
starlight moonlight indoor light sunlight
scotopicvisual function mesopic photopic
Figure 2.9 Range of illumination levels which can be handled by the eye. The luminance mag-nitudes of a white paper in starlight, in moonlight, indoors, and in sunlight are also shown forreference. Data taken from [9].
Let us consider the process when the ambient light level becomes low (transitionfrom photopic to scotopic vision). As discussed, the inner diameter of the iris in-creases, the rods are activated, and the brain starts to increase the neural detectiontime of the photoreceptors. The adaption process to darkness takes about 40 minto complete. During the first 7 min, new pigments are generated for the cones sothat the threshold sensitivity for the smallest detectable visual stimulus is increasedby a factor of 50. During the following 30 min, the rod pigment rhodopsin is pro-duced which increases the sensitivity of the retina by a factor of 1000 [6]. At lowlight levels, the sensitivity is high, but the spatial resolution of the eye is reduced(Section 2.1.5) and colors cannot be distinguished (Section 2.3).
In the reverse case of high ambient light conditions (photopic vision), the iris di-ameter decreases, the cones are activated, and the neural detection time is reduced.As a consequence, the eye is no longer sensitive to small changes in light intensity.The biochemical adaption of cones takes about 3–4 min. The spatial resolution andthe color perception is enhanced compared to scotopic vision.
2.1.7Stiles–Crawford Effect
Due to the tapered shape of cones (Figure 1.9), incident light is guided towards theend of the photoreceptors by total internal reflection (Section A.1.1), similar to anoptical waveguide (Section 10.2.4.2). Light rays which pass through the center ofthe eye’s entrance pupil are incident at a small angle to the cones of the curved
�
� Michael Kaschke, Karl-Heinz Donnerhacke, and Michael Stefan Rill: Optical Devices in Ophthalmology andOptometry — Chap. c02 — 2013/11/11 — page 29 — le-tex
�
�
�
�
�
�
2.1 Optical Imaging 29
5
rela
tive
lum
inou
s effi
cien
cy
entry point of light ray (mm from pupil center)
1.0
0.6
0.4
0.2
0
0.8
4 2 0 2 43 1 1 3 5
nasal temporal
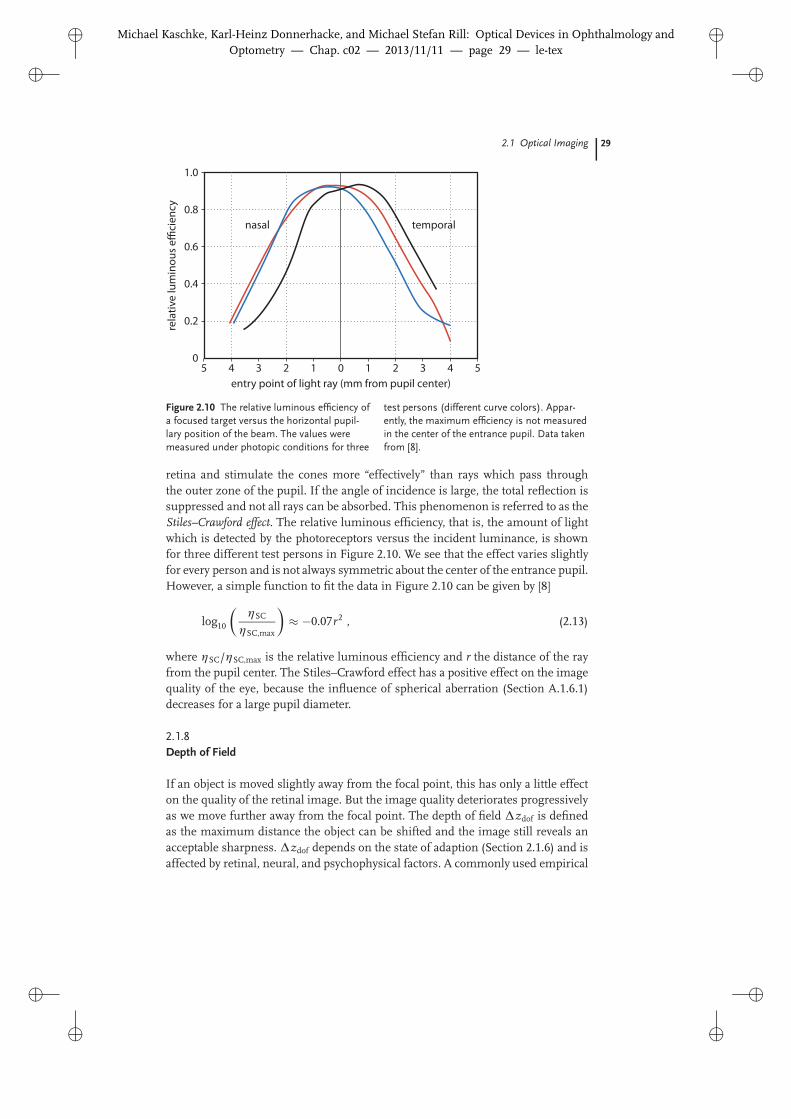
Figure 2.10 The relative luminous efficiency ofa focused target versus the horizontal pupil-lary position of the beam. The values weremeasured under photopic conditions for three
test persons (different curve colors). Appar-ently, the maximum efficiency is not measuredin the center of the entrance pupil. Data takenfrom [8].
retina and stimulate the cones more “effectively” than rays which pass throughthe outer zone of the pupil. If the angle of incidence is large, the total reflection issuppressed and not all rays can be absorbed. This phenomenon is referred to as theStiles–Crawford effect. The relative luminous efficiency, that is, the amount of lightwhich is detected by the photoreceptors versus the incident luminance, is shownfor three different test persons in Figure 2.10. We see that the effect varies slightlyfor every person and is not always symmetric about the center of the entrance pupil.However, a simple function to fit the data in Figure 2.10 can be given by [8]
log10
�ηSC
ηSC,max
�� �0.07r2 , (2.13)
where ηSC/ηSC,max is the relative luminous efficiency and r the distance of the rayfrom the pupil center. The Stiles–Crawford effect has a positive effect on the imagequality of the eye, because the influence of spherical aberration (Section A.1.6.1)decreases for a large pupil diameter.
2.1.8Depth of Field
If an object is moved slightly away from the focal point, this has only a little effecton the quality of the retinal image. But the image quality deteriorates progressivelyas we move further away from the focal point. The depth of field Δzdof is definedas the maximum distance the object can be shifted and the image still reveals anacceptable sharpness. Δzdof depends on the state of adaption (Section 2.1.6) and isaffected by retinal, neural, and psychophysical factors. A commonly used empirical
�
� Michael Kaschke, Karl-Heinz Donnerhacke, and Michael Stefan Rill: Optical Devices in Ophthalmology andOptometry — Chap. c02 — 2013/11/11 — page 30 — le-tex
�
�
�
�
�
�
30 2 Optics of the Human Eye
formula to determine the depth of field for the human eye is given by [10]
Δzdof D λ2NA2 C 1
7NA�, (2.14)
where λ denotes the wavelength of the incident light and NA the numerical aper-ture (Section A.1.4) of the eye. � is the magnification (Section A.1.2.1) of the eyethat depends on the state of accommodation. Similar to camera systems, a largediameter of the aperture stop – which corresponds to a high NA – thus means asmall depth of field. In (2.14), accommodation was taken into account by ways of �.
2.1.9Binocular Vision
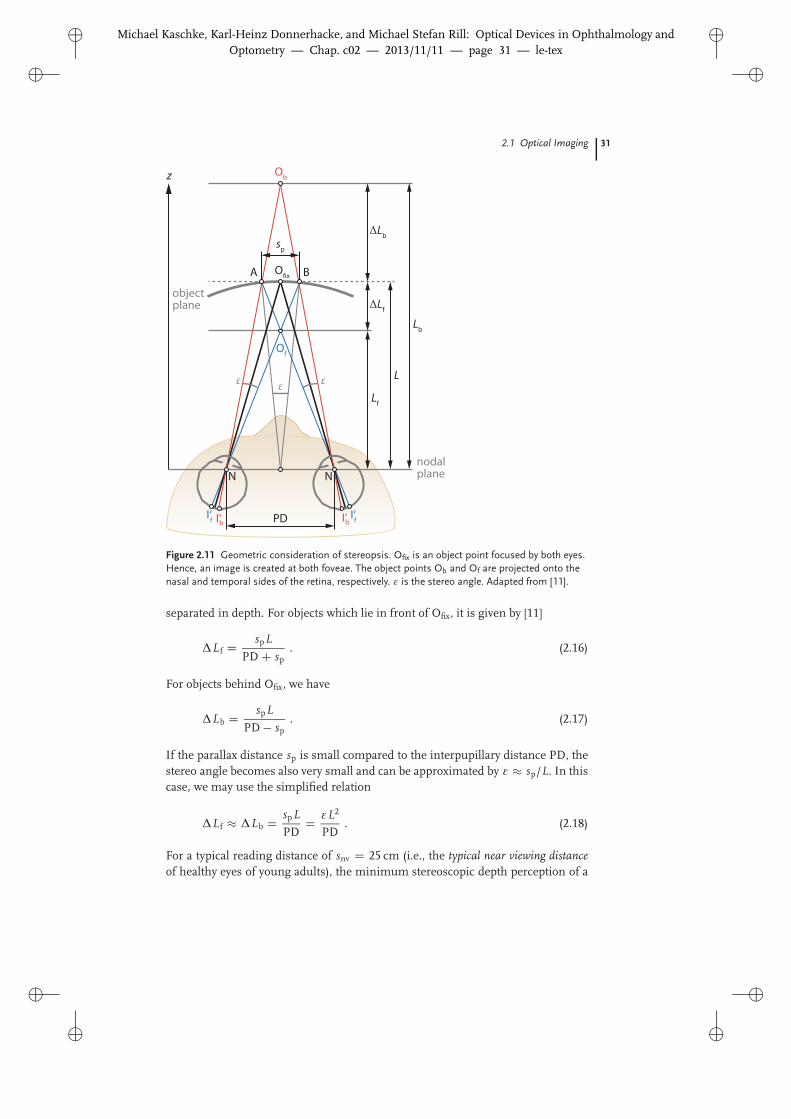
Both eyes are arranged in a common plane and separated by an interpupillary dis-tance PD (i.e., the distance between both pupil centers) of 50–75 mm. This specialarrangement allows humans to get a three-dimensional impression of the environ-ment. For example, we can estimate depth and distance of objects which are placedin a row. This property of binocular vision is referred to as stereopsis. It is based onthe comparison of two slightly different retinal images by the brain. In more con-crete terms, both images received by the eyes are two-dimensional but horizontallyshifted. The brain is now able to combine this information to “generate” a three-dimensional image and can distinguish between any objects which are located indifferent planes along the viewing direction (i.e., the z direction in Figure 2.11).
Figure 2.11 shows a top-view scene of two eyes of a person who fixates objectpoint Ofix. Ofix is located at a distance L from the nodal plane15) of the eyes (Sec-tion 2.1.3) and is sharply imaged onto each fovea. Object point Of, which lies infront of Ofix, is imaged onto the temporal sides of both eyes (image point I0
f). Ob-ject point Ob, which lies behind Ofix, is imaged onto the nasal sides of the eyes(image point I0
b). The retinal images of Ob are closer together than the images ofOf which is “translated” to a different position in depth.
In Figure 2.11, the temporal ray of the right eye crosses the nasal ray of the lefteye at point A. Similarly, the temporal ray of the left eye crosses the nasal ray ofthe right eye at point B. Points A and B are both located on the object plane andseparated by the parallax distance sp with which we can write the stereo angle as
ε D 2 arctan� sp
2L
�. (2.15)
The minimum stereo angle determines the smallest angle that can be resolved bythe eye and still allows stereoscopic perception. Under appropriate conditions, thehuman eye has a minimum stereo angle of εmin D 1000 [6].
A related quantity is the stereoscopic depth perception ΔL [12]. This quantityspecifies the distance between two objects in a row which can be perceived as being
15) At the nodal point (Section 2.1.3), the incident light rays are crossing the optical axis of an eye.The nodal points of both eyes lie on one common nodal plane.
�
� Michael Kaschke, Karl-Heinz Donnerhacke, and Michael Stefan Rill: Optical Devices in Ophthalmology andOptometry — Chap. c02 — 2013/11/11 — page 31 — le-tex
�
�
�
�
�
�
2.1 Optical Imaging 31
object plane
nodalplane
ε
OfixA B
Ob
Of
Lf
ΔLf
ΔLb
L
Lb
I‘ I‘ PD
z
N N
f bI‘I‘ fb
sp
ε ε
Figure 2.11 Geometric consideration of stereopsis. Ofix is an object point focused by both eyes.Hence, an image is created at both foveae. The object points Ob and Of are projected onto thenasal and temporal sides of the retina, respectively. ε is the stereo angle. Adapted from [11].
separated in depth. For objects which lie in front of Ofix, it is given by [11]
ΔL f D spLPD C sp
. (2.16)
For objects behind Ofix, we have
ΔLb D spLPD � sp
. (2.17)
If the parallax distance sp is small compared to the interpupillary distance PD, thestereo angle becomes also very small and can be approximated by ε � sp/L. In thiscase, we may use the simplified relation
ΔL f � ΔLb D spLPD
D εL2
PD. (2.18)
For a typical reading distance of snv D 25 cm (i.e., the typical near viewing distanceof healthy eyes of young adults), the minimum stereoscopic depth perception of a
�
� Michael Kaschke, Karl-Heinz Donnerhacke, and Michael Stefan Rill: Optical Devices in Ophthalmology andOptometry — Chap. c02 — 2013/11/11 — page 32 — le-tex
�
�
�
�
�
�
32 2 Optics of the Human Eye
human eye can be calculated as
ΔLmin D εmin s2nv
PDD 45 μm . (2.19)
With adequate visual aids (e.g., surgical microscopes; Section 6.2), ΔLmin can befurther reduced. For this purpose, we can either enlarge the stereo base (i.e., theeffective interpupillary distance), e.g., by mirrors or prisms, or increase the mag-nification of the image so that the three-dimensional image impression is consid-erably enhanced. Without visual aids, stereopsis breaks down at object distances> 500 m.
Besides stereopsis, limited depth perception of distant objects can be attainedwith just one eye as well. In this case, the distinction in depth is based on recogni-tion patterns and experience. Some typical determining factors are:
� recognition of perspective, that is, smaller objects appear to be further away thanlarger objects,
� partial overlap of objects,� distribution of light and shadows, and� parallax of motion, that is, a moving object appears to be slower if it is further
away.
2.1.10Spectral Properties
Since water is the major substance of the eye’s optical components, the spectralproperties (Figure 9.3) such as absorption and scattering are determined by thoseof water.16) In particular for wavelengths λ > 600 nm, the absorption of water dom-inates the spectral properties of ocular media. For wavelengths λ < 600 nm, how-ever, proteins and chromophores become important.
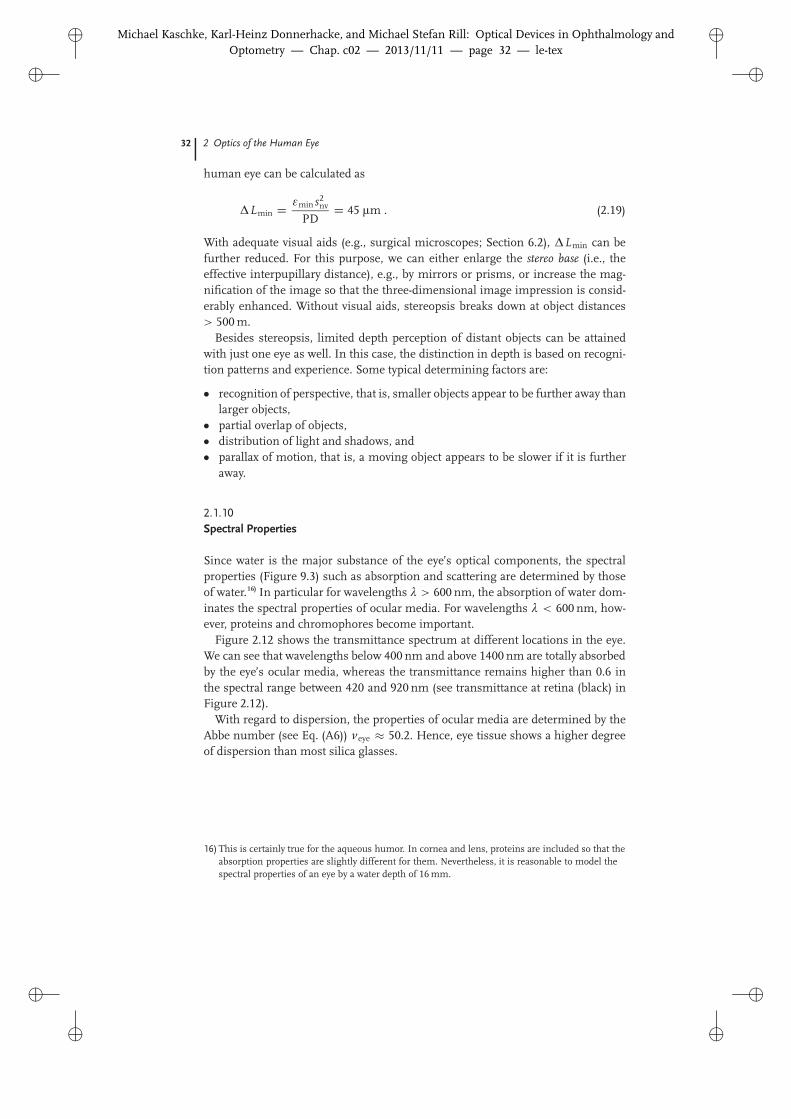
Figure 2.12 shows the transmittance spectrum at different locations in the eye.We can see that wavelengths below 400 nm and above 1400 nm are totally absorbedby the eye’s ocular media, whereas the transmittance remains higher than 0.6 inthe spectral range between 420 and 920 nm (see transmittance at retina (black) inFigure 2.12).
With regard to dispersion, the properties of ocular media are determined by theAbbe number (see Eq. (A6)) νeye � 50.2. Hence, eye tissue shows a higher degreeof dispersion than most silica glasses.
16) This is certainly true for the aqueous humor. In cornea and lens, proteins are included so that theabsorption properties are slightly different for them. Nevertheless, it is reasonable to model thespectral properties of an eye by a water depth of 16 mm.
�
� Michael Kaschke, Karl-Heinz Donnerhacke, and Michael Stefan Rill: Optical Devices in Ophthalmology andOptometry — Chap. c02 — 2013/11/11 — page 33 — le-tex
�
�
�
�
�
�
2.2 Schematic Eye Models 33
0.3 0.4 0.5 0.6 0.7 0.8 1.0 2.0wavelength λ (μm)
tran
smitt
ance
1.0
0.8
0.6
0.4
0.2
01.4
after corneabefore lensafter lensat retina
visible spectral range
Figure 2.12 Spectral transmittance insidethe eye after the incident light has passed thecornea (red), the aqueous humor (blue), thelens (green), and the vitreous (black). The
wavelength scale is not linear. For reference, acolor bar is added at the top of the diagram.Data taken from [6].
2.2Schematic Eye Models
Both the optical properties and the geometry of eyes that we have discussed sofar vary between human beings. This obviously makes it difficult to design andsimulate optical devices where the eye is part of the whole system – regardless ofwhether the eye acts as a detector or as the examined object. To deal with this issuein a somewhat more rigorous manner, schematic eye models [2] have been developedwhich emulate real eyes under certain boundary conditions as closely as possible.The eye parameters included in the eye models are basically average values thathave been determined from measurements on many test eyes. Depending on theintended applicative situation (relaxed eye, accommodated eye; Section 2.1.4), wecan utilize more or less accurate and complicated eye models17). In this context,we distinguish between paraxial models (Section 2.2.1), which are only valid in thecase of paraxial approximation, and finite wide-angle models (Section 2.2.2), whichare also able to describe aberrations (Sections A.1.6–A.1.9) quantitatively.
17) An eye model is called exact if it includes at least four refracting surfaces, i.e., two corneal and twolenticular surfaces.
�
� Michael Kaschke, Karl-Heinz Donnerhacke, and Michael Stefan Rill: Optical Devices in Ophthalmology andOptometry — Chap. c02 — 2013/11/11 — page 34 — le-tex
�
�
�
�
�
�
34 2 Optics of the Human Eye
2.2.1Paraxial Model: The Gullstrand Eye
In optometry, the most common paraxial eye model is the Exact Gullstrand18) Eye#1, which is based on measured data from accommodated and relaxed eyes19). Con-sequently, two versions of this model exist for different states of accommodation ofthe eye lens:20) 0 D and 10.878 D.
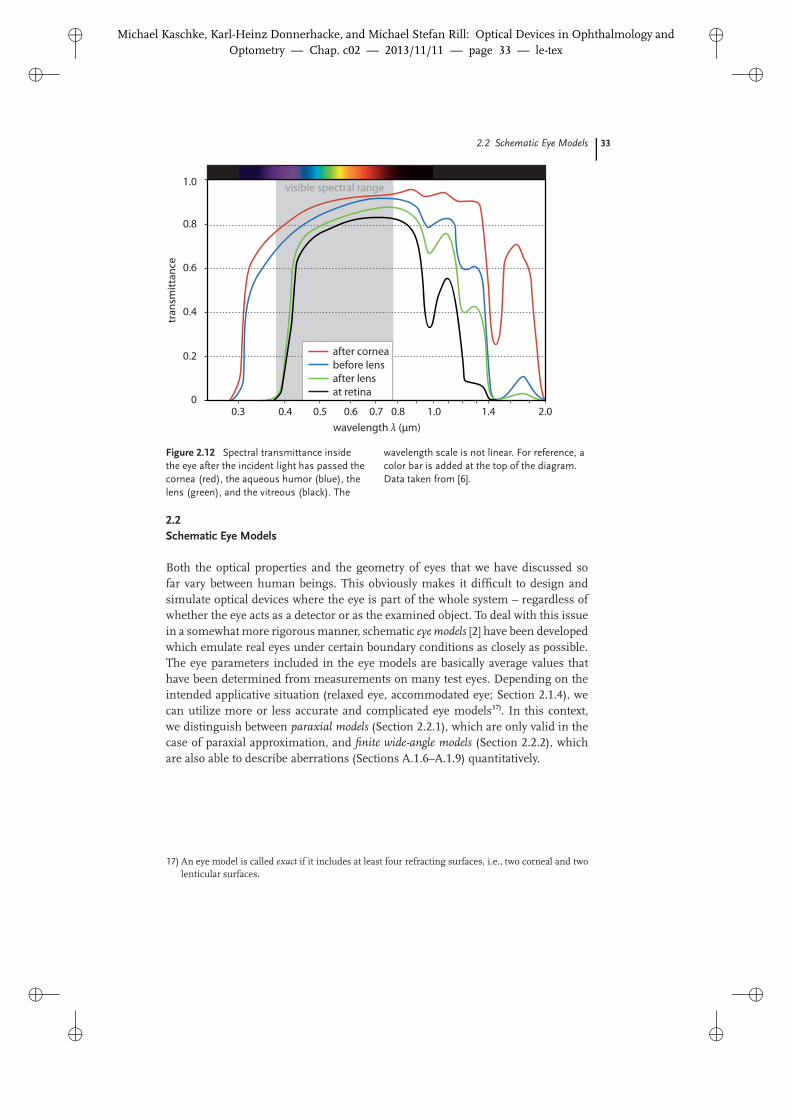
2.2.1.1 Optical PropertiesIn the Exact Gullstrand Eye, we assume the refracting surfaces to be spherical andcentered at a common optical axis. Since all ocular media of the model have a con-stant refractive index, the refractive power of the lens is varied by implementinga lens core (central nucleus) of high refractive index which is surrounded by anouter shell (cortex) with lower refractive index. All in all, the Exact Gullstrand Eyethus consists of six (i.e., two corneal and four lenticular) refracting surfaces (Fig-ure 2.13). The geometric and optical parameters for the relaxed and accommodatedstate are listed in Table 2.1.
In the Exact Gullstrand Eye, the total refractive power of the cornea D0c can be
calculated with the Gullstrand formula (or thick lens formula)
D0c D D0
a C D0p � Lc
ncD0
aD0p . (2.20)
24.385
17.1853.63.6
rC = 7.70rC = 6.80 rC = -6.00
rC = -5.76
rC = 10.00rC = 7.91
n = 1.376
n = 1.336
n = 1.386
n = 1.406
n = 1.336
F‘F
N‘NE
E‘PP‘
-15.706
opticalaxis
Figure 2.13 Scheme (2 : 1 scale) of the Exact Gullstrand Eye #1 for relaxed vision based on datafrom Table 2.1. The radii of curvature and lengths are given in millimeters.
18) Alvar Gullstrand (1862–1930).19) Other paraxial eye models are discussed in-depth in [2, 6].20) The original version of the Exact Gullstrand Eye cannot be used to model variable accommodation.
However, with some modifications, continuous accommodation may be included [2].

�
� Michael Kaschke, Karl-Heinz Donnerhacke, and Michael Stefan Rill: Optical Devices in Ophthalmology andOptometry — Chap. c02 — 2013/11/11 — page 35 — le-tex
�
�
�
�
�
�
2.2 Schematic Eye Models 35
Table 2.1 Parameters of the Exact GullstrandEye #1 for relaxed (0 D accommodation) andaccommodated vision (10.878 D accommoda-tion). The locations refer to the vertex of the
cornea (point V in Figure 2.3). rC denotes theradius of curvature, L is the thickness, and nthe refractive index of the respective eye com-ponent. Data taken from [2, 13].
Parameter Relaxed vision Accommodated vision
Location of object-side focal point F (mm) �15.706 �12.397Location of image-side focal point F0 (mm) 24.385 21.016
Location of object-side nodal point N (mm) 7.078 6.533
Location of image-side nodal point N0 (mm) 7.331 6.847Location of object-side principal point P (mm) 1.348 1.772
Location of image-side principal point P0 (mm) 1.601 2.086Location of entrance pupil E (mm) 3.047 2.668
Diameter of entrance pupil (mm) 8.000 8.000
Location of exit pupil E0 (mm) 3.665 3.212Diameter of exit pupil (mm) 7.276 7.524
Refractive power of cornea (D) 43.053 43.053
Refractive power of lens (D) 19.111 33.057Refractive power of eye (D) 58.636 70.576
Total eye length (mm) 24.385 24.385
Relaxed vision Accommodated vision
rC (mm) L (mm) n rC (mm) L (mm) n
Corneal front surface 7.700 – – 7.700 – –Cornea – 0.500 1.376 – 0.500 1.376
Corneal back surface 6.800 – – 6.800 – –Anterior chamber – 3.100 1.336 – 2.700 1.336
Front surface of lens cortex 10.000 – – 5.333 – –
Anterior lens cortex – 0.546 1.386 – 0.673 1.386Front surface of lens core 7.911 – – 2.655 – –
Lens core – 2.419 1.406 – 2.655 1.406
Back surface of lens core �5.760 – – �2.655 – –Posterior lens cortex – 0.635 1.386 – 0.673 1.386
Back surface of lens cortex �6.000 – – �5.333 – –
Vitreous – 17.185 1.336 – 17.185 1.336
D0a denotes the refractive power of the corneal front surface (air–cornea interface)
and D0p the refractive power of the corneal back surface (interface between cornea
and anterior chamber). nc and Lc are the refractive index and the thickness of thecornea, respectively. In optometry, one often uses the corneal back vertex power D0
cvinstead of D0
c. D0cv represents the inverse distance from the corneal back vertex to
�
� Michael Kaschke, Karl-Heinz Donnerhacke, and Michael Stefan Rill: Optical Devices in Ophthalmology andOptometry — Chap. c02 — 2013/11/11 — page 36 — le-tex
�
�
�
�
�
�
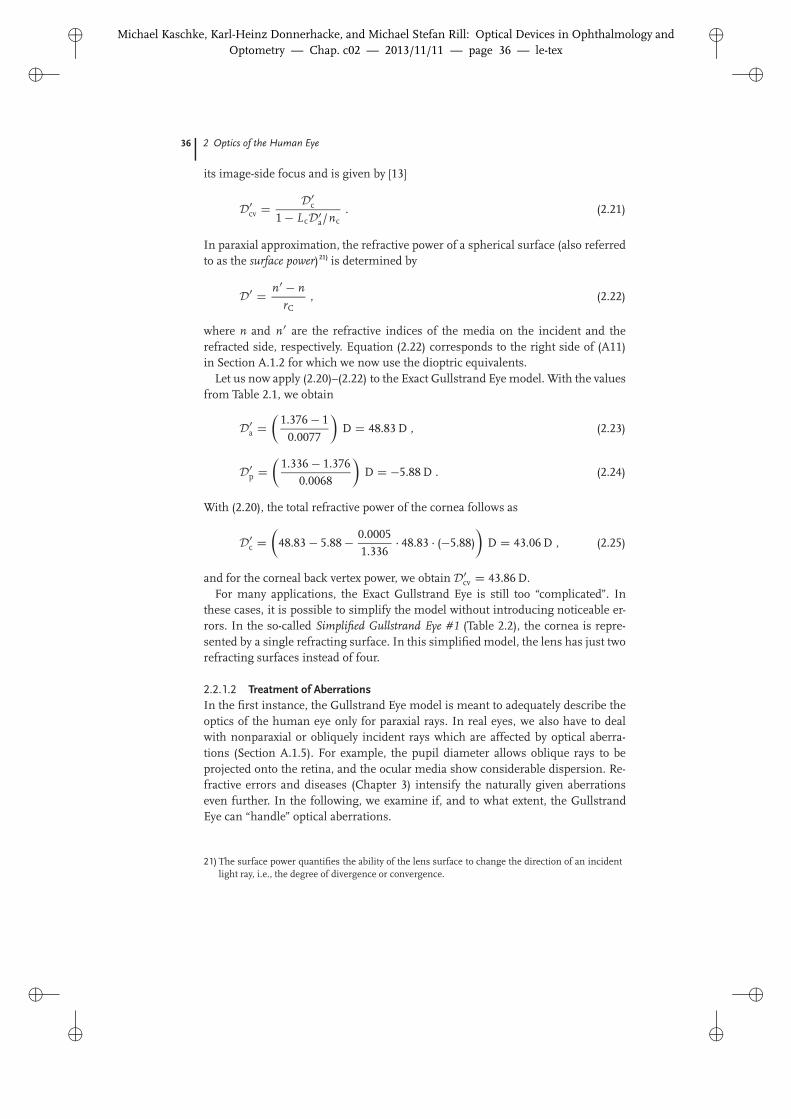
36 2 Optics of the Human Eye
its image-side focus and is given by [13]
D0cv D D0
c
1 � LcD0a/nc
. (2.21)
In paraxial approximation, the refractive power of a spherical surface (also referredto as the surface power)21) is determined by
D0 D n0 � nrC
, (2.22)
where n and n0 are the refractive indices of the media on the incident and therefracted side, respectively. Equation (2.22) corresponds to the right side of (A11)in Section A.1.2 for which we now use the dioptric equivalents.
Let us now apply (2.20)–(2.22) to the Exact Gullstrand Eye model. With the valuesfrom Table 2.1, we obtain
D0a D
�1.376 � 1
0.0077
�D D 48.83 D , (2.23)
D0p D
�1.336 � 1.376
0.0068
�D D �5.88 D . (2.24)
With (2.20), the total refractive power of the cornea follows as
D0c D
�48.83 � 5.88 � 0.0005
1.336� 48.83 � (�5.88)
�D D 43.06 D , (2.25)
and for the corneal back vertex power, we obtain D0cv D 43.86 D.
For many applications, the Exact Gullstrand Eye is still too “complicated”. Inthese cases, it is possible to simplify the model without introducing noticeable er-rors. In the so-called Simplified Gullstrand Eye #1 (Table 2.2), the cornea is repre-sented by a single refracting surface. In this simplified model, the lens has just tworefracting surfaces instead of four.
2.2.1.2 Treatment of AberrationsIn the first instance, the Gullstrand Eye model is meant to adequately describe theoptics of the human eye only for paraxial rays. In real eyes, we also have to dealwith nonparaxial or obliquely incident rays which are affected by optical aberra-tions (Section A.1.5). For example, the pupil diameter allows oblique rays to beprojected onto the retina, and the ocular media show considerable dispersion. Re-fractive errors and diseases (Chapter 3) intensify the naturally given aberrationseven further. In the following, we examine if, and to what extent, the GullstrandEye can “handle” optical aberrations.
21) The surface power quantifies the ability of the lens surface to change the direction of an incidentlight ray, i.e., the degree of divergence or convergence.
�
� Michael Kaschke, Karl-Heinz Donnerhacke, and Michael Stefan Rill: Optical Devices in Ophthalmology andOptometry — Chap. c02 — 2013/11/11 — page 37 — le-tex
�
�
�
�
�
�
2.2 Schematic Eye Models 37
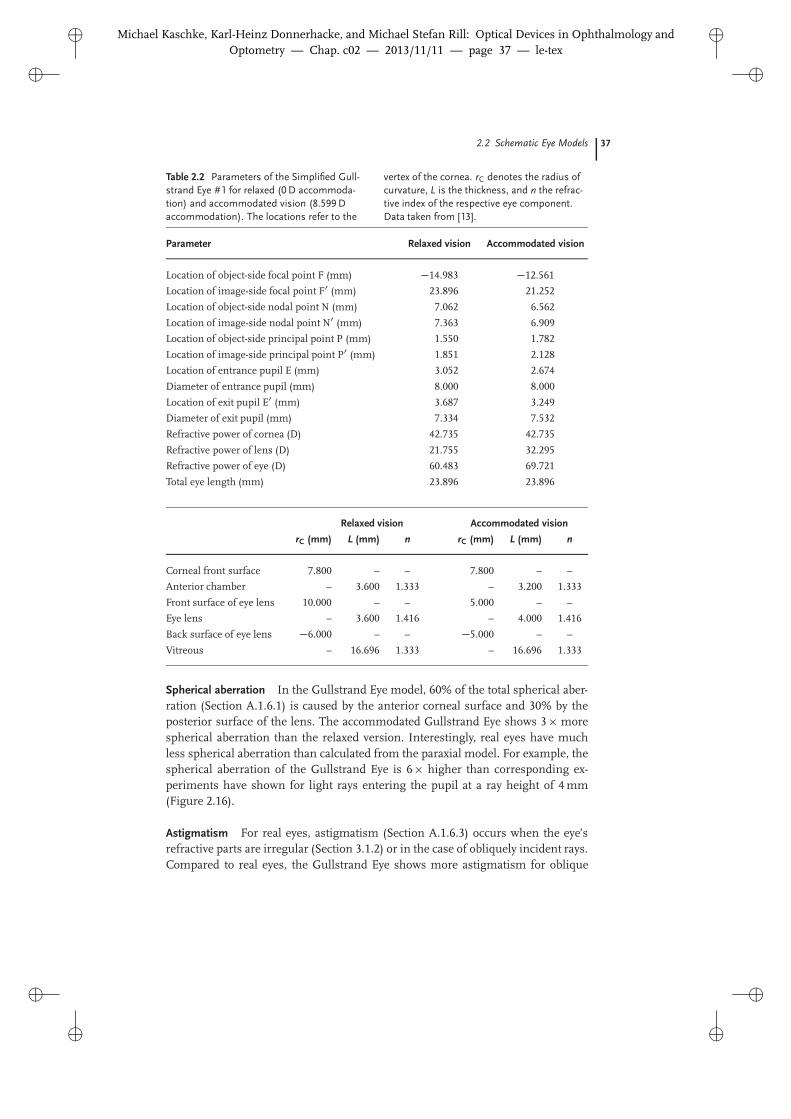
Table 2.2 Parameters of the Simplified Gull-strand Eye #1 for relaxed (0 D accommoda-tion) and accommodated vision (8.599 Daccommodation). The locations refer to the
vertex of the cornea. rC denotes the radius ofcurvature, L is the thickness, and n the refrac-tive index of the respective eye component.Data taken from [13].
Parameter Relaxed vision Accommodated vision
Location of object-side focal point F (mm) �14.983 �12.561Location of image-side focal point F0 (mm) 23.896 21.252
Location of object-side nodal point N (mm) 7.062 6.562
Location of image-side nodal point N0 (mm) 7.363 6.909Location of object-side principal point P (mm) 1.550 1.782
Location of image-side principal point P0 (mm) 1.851 2.128Location of entrance pupil E (mm) 3.052 2.674
Diameter of entrance pupil (mm) 8.000 8.000
Location of exit pupil E0 (mm) 3.687 3.249Diameter of exit pupil (mm) 7.334 7.532
Refractive power of cornea (D) 42.735 42.735
Refractive power of lens (D) 21.755 32.295Refractive power of eye (D) 60.483 69.721
Total eye length (mm) 23.896 23.896
Relaxed vision Accommodated vision
rC (mm) L (mm) n rC (mm) L (mm) n
Corneal front surface 7.800 – – 7.800 – –Anterior chamber – 3.600 1.333 – 3.200 1.333
Front surface of eye lens 10.000 – – 5.000 – –Eye lens – 3.600 1.416 – 4.000 1.416
Back surface of eye lens �6.000 – – �5.000 – –
Vitreous – 16.696 1.333 – 16.696 1.333
Spherical aberration In the Gullstrand Eye model, 60% of the total spherical aber-ration (Section A.1.6.1) is caused by the anterior corneal surface and 30% by theposterior surface of the lens. The accommodated Gullstrand Eye shows 3 � morespherical aberration than the relaxed version. Interestingly, real eyes have muchless spherical aberration than calculated from the paraxial model. For example, thespherical aberration of the Gullstrand Eye is 6 � higher than corresponding ex-periments have shown for light rays entering the pupil at a ray height of 4 mm(Figure 2.16).
Astigmatism For real eyes, astigmatism (Section A.1.6.3) occurs when the eye’srefractive parts are irregular (Section 3.1.2) or in the case of obliquely incident rays.Compared to real eyes, the Gullstrand Eye shows more astigmatism for oblique
�
� Michael Kaschke, Karl-Heinz Donnerhacke, and Michael Stefan Rill: Optical Devices in Ophthalmology andOptometry — Chap. c02 — 2013/11/11 — page 38 — le-tex
�
�
�
�
�
�
38 2 Optics of the Human Eye
rays. For example, we have a deviation by a factor of 2 when the light rays areincident at angles < 50ı.
Field curvature Because of the curved shape of the retina, the field curvature (Sec-tion A.1.6.4) has nearly no influence on imaging. We can understand this by look-ing at Figure A.19 in Section A.1.6.4. In the eye, the image surface is curved sothat the incident off-axis rays are focused on the retina. Up to an angle of incidenceof 30ı, this behavior is well reproduced by the Gullstrand Eye. For angles > 30ı,field curvature is still irrelevant for real eyes, whereas it becomes important for theGullstrand Eye.
Distortion Distortion (Section A.1.6.5) mainly depends on both position and di-ameter of the entrance pupil. With regard to distortion, the Gullstrand model pre-dicts the imaging behavior of real eyes quite well.
Chromatic aberration As dispersion (Section A.1.1) is not included to the Gull-strand model, chromatic aberration (Section A.1.9) cannot be modeled. Neverthe-less, chromatic effects play an important role for the imaging with real eyes.
In summary, the Gullstrand Eye model is not able to describe aberrations causedby nonparaxial rays with sufficient accuracy. In addition, chromatic aberrations arenot considered at all. It is thus useful to develop more sophisticated schematic eyemodels which are able to describe nonparaxial optics and dispersion as well.
2.2.2Finite Wide-Angle Models
Paraxial eye models can be further improved when we try to reproduce the opticaland geometric parameters of real eyes as exactly as possible. For example, we mayinclude the facts that the surfaces of cornea and lens are not spherical (asphericlenses) and that the refracting surfaces are not centered at a common axis. Wecan also add dispersion to the models and/or describe the lens with a gradientrefractive index, instead of the shell approach used for the Exact Gullstrand Eye.But we have to bear in mind that every generalization increases the complexity ofthe model, which makes calculations even more challenging. In the following, wepresent two prominent examples for so-called finite wide-angle models which allowthe description of the imaging of human eyes for nonparaxial rays and off-axisobject points quite well.
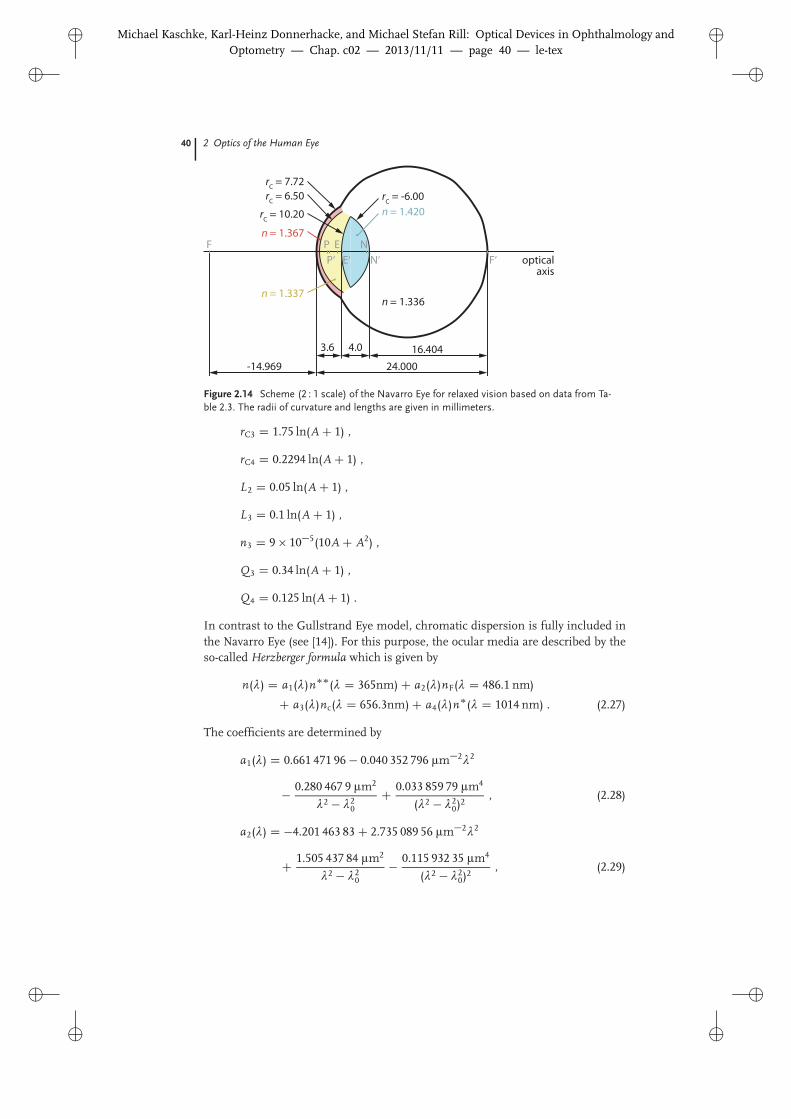
2.2.2.1 Navarro Eye ModelIn the Navarro Eye model (Figure 2.14), the refractive parts of the eye are repre-sented by four aspheric surfaces (so-called conicoids) which are centered to a com-mon optical axis. Each surface is determined by the condition
x2 C y 2 C (1 C Q)z2 � rCz D 0 , (2.26)
�
� Michael Kaschke, Karl-Heinz Donnerhacke, and Michael Stefan Rill: Optical Devices in Ophthalmology andOptometry — Chap. c02 — 2013/11/11 — page 39 — le-tex
�
�
�
�
�
�
2.2 Schematic Eye Models 39
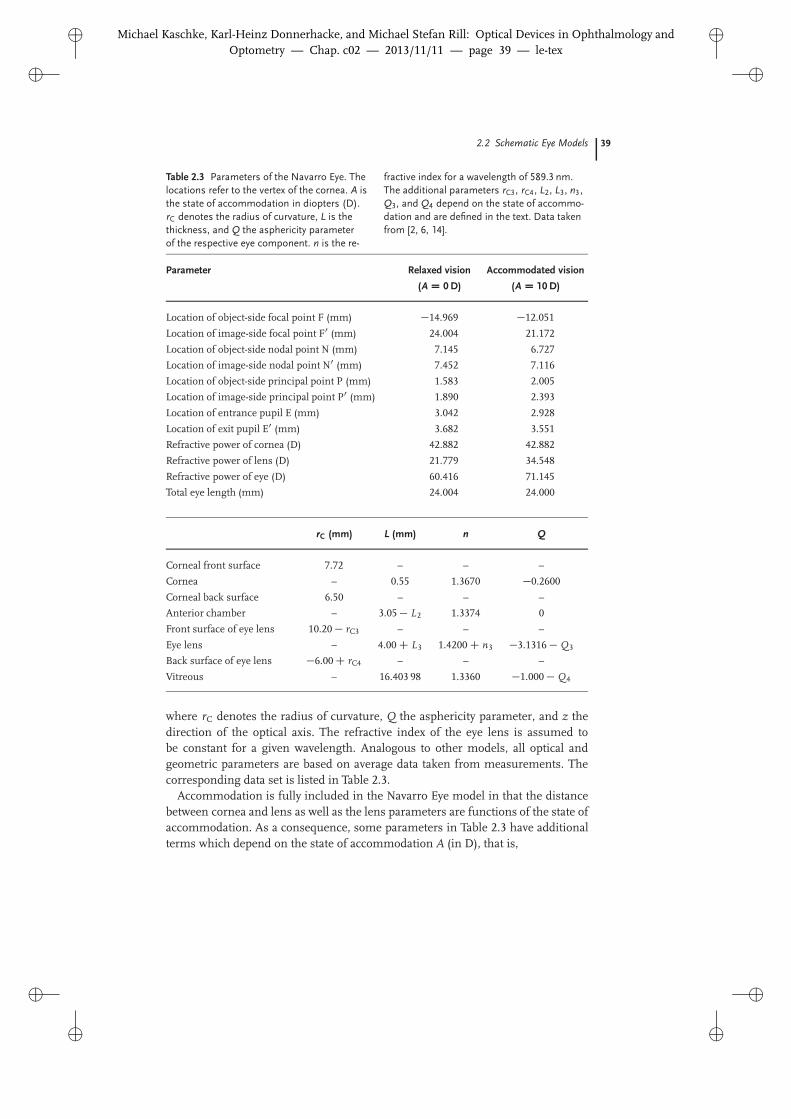
Table 2.3 Parameters of the Navarro Eye. Thelocations refer to the vertex of the cornea. A isthe state of accommodation in diopters (D).rC denotes the radius of curvature, L is thethickness, and Q the asphericity parameterof the respective eye component. n is the re-
fractive index for a wavelength of 589.3 nm.The additional parameters rC3, rC4, L2, L3, n3,Q3, and Q4 depend on the state of accommo-dation and are defined in the text. Data takenfrom [2, 6, 14].
Parameter Relaxed vision Accommodated vision
(A D 0 D) (A D 10 D)
Location of object-side focal point F (mm) �14.969 �12.051
Location of image-side focal point F0 (mm) 24.004 21.172
Location of object-side nodal point N (mm) 7.145 6.727Location of image-side nodal point N0 (mm) 7.452 7.116
Location of object-side principal point P (mm) 1.583 2.005Location of image-side principal point P0 (mm) 1.890 2.393
Location of entrance pupil E (mm) 3.042 2.928
Location of exit pupil E0 (mm) 3.682 3.551Refractive power of cornea (D) 42.882 42.882
Refractive power of lens (D) 21.779 34.548
Refractive power of eye (D) 60.416 71.145Total eye length (mm) 24.004 24.000
rC (mm) L (mm) n Q
Corneal front surface 7.72 – – –
Cornea – 0.55 1.3670 �0.2600
Corneal back surface 6.50 – – –Anterior chamber – 3.05 � L2 1.3374 0
Front surface of eye lens 10.20 � rC3 – – –
Eye lens – 4.00 C L3 1.4200 C n3 �3.1316 � Q3
Back surface of eye lens �6.00 C rC4 – – –
Vitreous – 16.403 98 1.3360 �1.000 � Q4
where rC denotes the radius of curvature, Q the asphericity parameter, and z thedirection of the optical axis. The refractive index of the eye lens is assumed tobe constant for a given wavelength. Analogous to other models, all optical andgeometric parameters are based on average data taken from measurements. Thecorresponding data set is listed in Table 2.3.
Accommodation is fully included in the Navarro Eye model in that the distancebetween cornea and lens as well as the lens parameters are functions of the state ofaccommodation. As a consequence, some parameters in Table 2.3 have additionalterms which depend on the state of accommodation A (in D), that is,
�
� Michael Kaschke, Karl-Heinz Donnerhacke, and Michael Stefan Rill: Optical Devices in Ophthalmology andOptometry — Chap. c02 — 2013/11/11 — page 40 — le-tex
�
�
�
�
�
�
40 2 Optics of the Human Eye
24.000
16.4044.03.6
rC = 10.20
rC = -6.00rC = 6.50rC = 7.72
n = 1.367
n = 1.337
n = 1.420
n = 1.336
F‘F
N‘NE
E‘PP‘
-14.969
opticalaxis
Figure 2.14 Scheme (2 : 1 scale) of the Navarro Eye for relaxed vision based on data from Ta-ble 2.3. The radii of curvature and lengths are given in millimeters.
rC3 D 1.75 ln(A C 1) ,
rC4 D 0.2294 ln(A C 1) ,
L2 D 0.05 ln(A C 1) ,
L3 D 0.1 ln(A C 1) ,
n3 D 9 � 10�5(10A C A2) ,
Q3 D 0.34 ln(A C 1) ,
Q4 D 0.125 ln(A C 1) .
In contrast to the Gullstrand Eye model, chromatic dispersion is fully included inthe Navarro Eye (see [14]). For this purpose, the ocular media are described by theso-called Herzberger formula which is given by
n(λ) D a1(λ)n��(λ D 365nm) C a2(λ)nF(λ D 486.1 nm)
C a3(λ)nc(λ D 656.3nm) C a4(λ)n�(λ D 1014 nm) . (2.27)
The coefficients are determined by
a1(λ) D 0.661 471 96 � 0.040 352 796 μm�2λ2
� 0.280 467 9 μm2
λ2 � λ20
C 0.033 859 79 μm4
(λ2 � λ20)2
, (2.28)
a2(λ) D �4.201 463 83 C 2.735 089 56 μm�2λ2
C 1.505 437 84 μm2
λ2 � λ20
� 0.115 932 35 μm4
(λ2 � λ20)2
, (2.29)
�
� Michael Kaschke, Karl-Heinz Donnerhacke, and Michael Stefan Rill: Optical Devices in Ophthalmology andOptometry — Chap. c02 — 2013/11/11 — page 41 — le-tex
�
�
�
�
�
�
2.2 Schematic Eye Models 41
Table 2.4 Refractive indices of ocular media used in the Herzberger formula (2.27). Data takenfrom [14].
Ocular Medium n�� nF nc n�
(λ D 365 nm) (λ D 486.1 nm) (λ D 656.3 nm) (λ D 1014 nm)
Cornea 1.3975 1.3807 1.37405 1.3668
Aqueous humor 1.3593 1.3422 1.3354 1.3278Lens 1.4492 1.42625 1.4175 1.4097
Vitreous 1.3565 1.3407 1.3341 1.3273
a3(λ) D 6.298 342 37 � 4.694 099 35 μm�2λ2
� 1.575 086 5 μm2
λ2 � λ20
C 0.102 930 38 μm4
(λ2 � λ20)2
, (2.30)
a4(λ) D 1.758 350 59 C 2.362 537 94 μm�2λ2
C 0.350 116 57 μm2
λ2 � λ20
� 0.020 857 82 μm4
(λ2 � λ20)2
, (2.31)
with λ20 D 0.028 μm2 and [λ] D μm. The refractive indices of the ocular media
used in Eq. (2.27) for the various optical components are listed in Table 2.4.
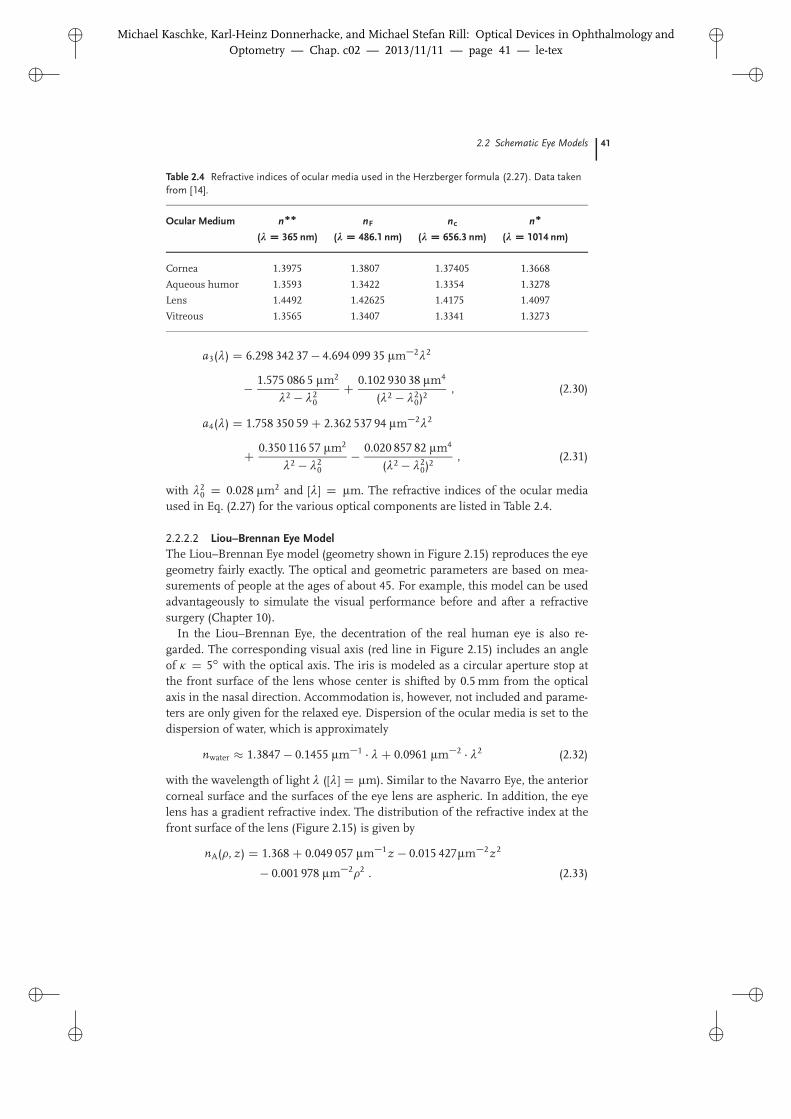
2.2.2.2 Liou–Brennan Eye ModelThe Liou–Brennan Eye model (geometry shown in Figure 2.15) reproduces the eyegeometry fairly exactly. The optical and geometric parameters are based on mea-surements of people at the ages of about 45. For example, this model can be usedadvantageously to simulate the visual performance before and after a refractivesurgery (Chapter 10).
In the Liou–Brennan Eye, the decentration of the real human eye is also re-garded. The corresponding visual axis (red line in Figure 2.15) includes an angleof � D 5ı with the optical axis. The iris is modeled as a circular aperture stop atthe front surface of the lens whose center is shifted by 0.5 mm from the opticalaxis in the nasal direction. Accommodation is, however, not included and parame-ters are only given for the relaxed eye. Dispersion of the ocular media is set to thedispersion of water, which is approximately
nwater � 1.3847 � 0.1455 μm�1 � λ C 0.0961 μm�2 � λ2 (2.32)
with the wavelength of light λ ([λ] D μm). Similar to the Navarro Eye, the anteriorcorneal surface and the surfaces of the eye lens are aspheric. In addition, the eyelens has a gradient refractive index. The distribution of the refractive index at thefront surface of the lens (Figure 2.15) is given by
nA(�, z) D 1.368 C 0.049 057 μm�1z � 0.015 427μm�2z2
� 0.001 978 μm�2�2 . (2.33)
�
� Michael Kaschke, Karl-Heinz Donnerhacke, and Michael Stefan Rill: Optical Devices in Ophthalmology andOptometry — Chap. c02 — 2013/11/11 — page 42 — le-tex
�
�
�
�
�
�
42 2 Optics of the Human Eye
23.95
16.274.023.66
rC = 12.40
rC = -8.10
rC = 6.40rC = 7.77
n = 1.376
n = 1.336
nA
n = 1.336
F‘F NE
E‘PP‘
-15.04
opticalaxisvisual axis
κN‘
decenteredentrance pupil
fovea
Figure 2.15 Scheme (2:1 scale) of the relaxedLiou–Brennan Eye model. The radii of curva-ture and lengths are given in millimeters. Thegeometry, the visual axis, and the decentrationof the entrance pupil (by 0.5 mm nasally) are
shown. The blue dashed line represents thelens center, which is an imaginary plane sepa-rating the eye lens into anterior and posteriorsegments.
� D px2 C y 2 ([�] D μm) is the coordinate normal to the traveling direction z of
the incident light rays. At the central lens surface (dashed blue line in Figure 2.15),the distribution of the refractive index is determined by
nP(�, z) D 1.407 � 0.006 605 μm�2z2 � 0.001 978 μm�2�2 (2.34)
with [z] D [�] D μm.
2.2.2.3 Aberrations in Finite Wide-Angle ModelsFinite wide-angle models are more realistic than paraxial models. Thus, we expectthat the aberrations calculated by finite wide-angle models come closer to experi-mental data.
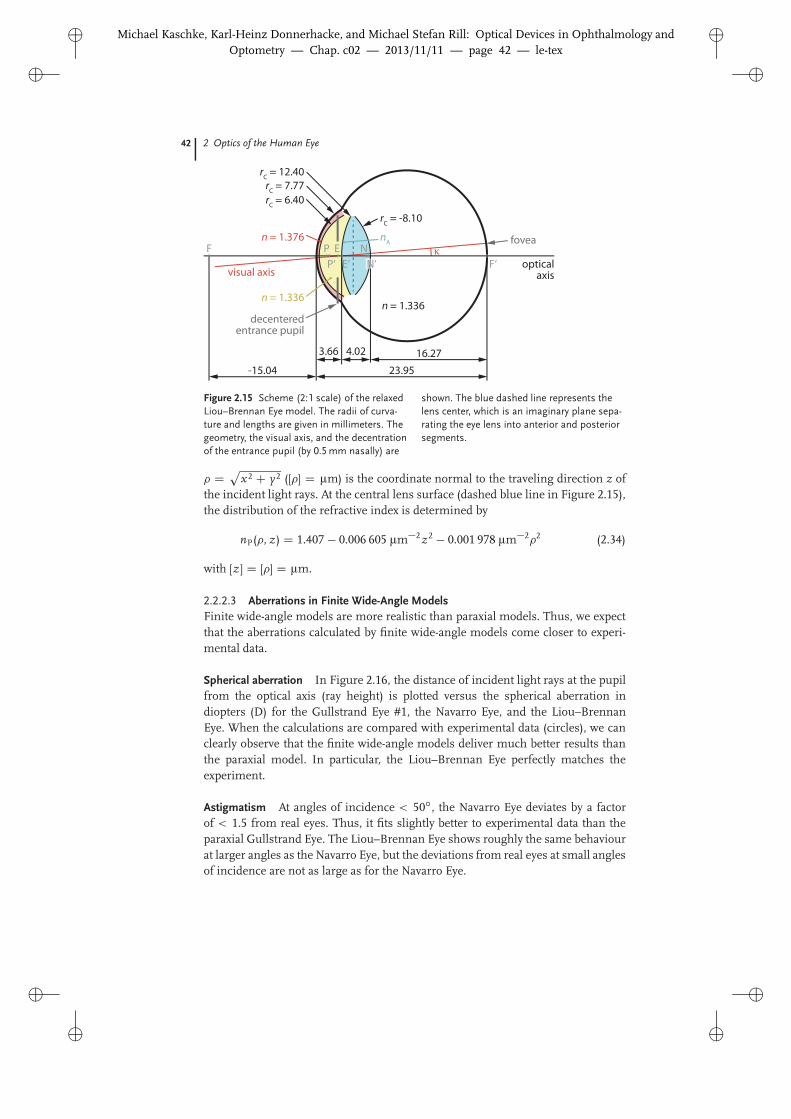
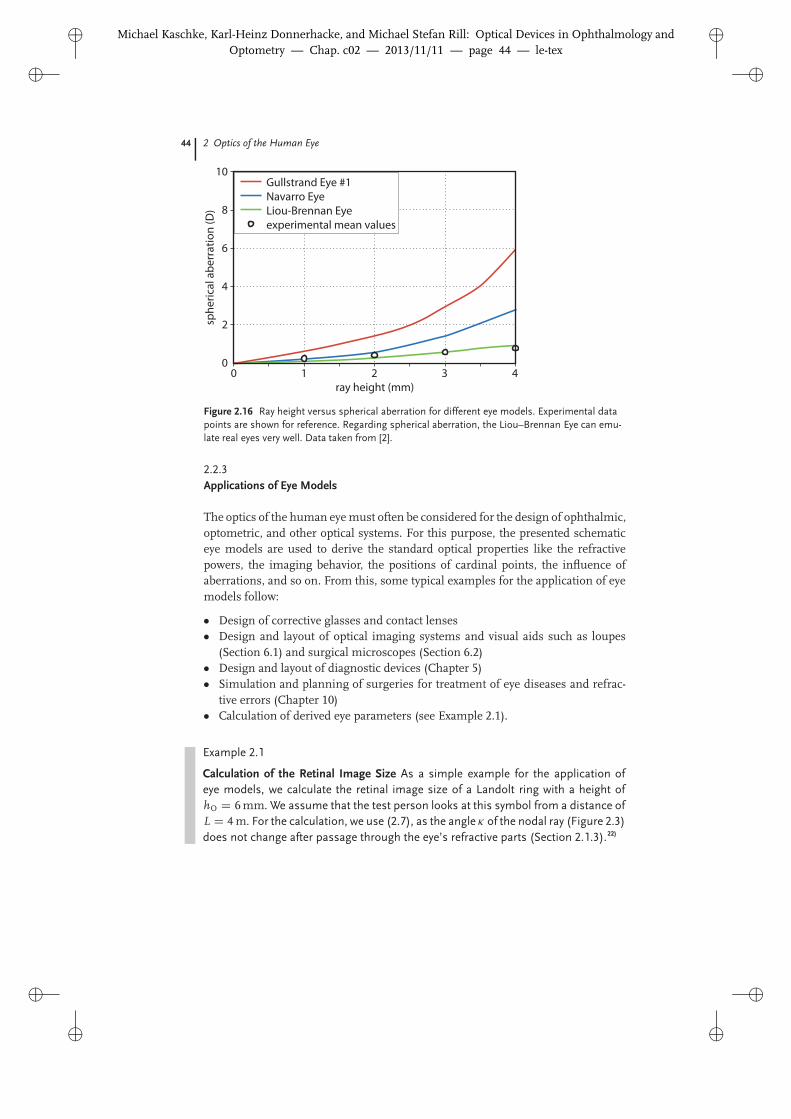
Spherical aberration In Figure 2.16, the distance of incident light rays at the pupilfrom the optical axis (ray height) is plotted versus the spherical aberration indiopters (D) for the Gullstrand Eye #1, the Navarro Eye, and the Liou–BrennanEye. When the calculations are compared with experimental data (circles), we canclearly observe that the finite wide-angle models deliver much better results thanthe paraxial model. In particular, the Liou–Brennan Eye perfectly matches theexperiment.
Astigmatism At angles of incidence < 50ı, the Navarro Eye deviates by a factorof < 1.5 from real eyes. Thus, it fits slightly better to experimental data than theparaxial Gullstrand Eye. The Liou–Brennan Eye shows roughly the same behaviourat larger angles as the Navarro Eye, but the deviations from real eyes at small anglesof incidence are not as large as for the Navarro Eye.

�
� Michael Kaschke, Karl-Heinz Donnerhacke, and Michael Stefan Rill: Optical Devices in Ophthalmology andOptometry — Chap. c02 — 2013/11/11 — page 43 — le-tex
�
�
�
�
�
�
2.2 Schematic Eye Models 43
Table 2.5 Parameters of the Liou–BrennanEye. The locations refer to the vertex of thecornea. rC denotes the radius of curvature,L is the thickness, and Q the asphericity pa-rameter of the respective eye component. n is
the refractive index at a wavelength of 555 nm.nA and nP are gradient-index distributions ofthe unaccommodated lens (see Eqs. (2.33)and (2.34)). Data taken from [2, 15].
Parameter Relaxed Vision
Location of object-side focal point F (mm) �15.040Location of image-side focal point F0 (mm) 23.950
Location of object-side nodal point N (mm) 7.100
Location of image-side nodal point N0 (mm) 7.378Location of object-side principal point P (mm) 1.532
Location of image-side principal point P0 (mm) 1.890Location of entrance pupil E (mm) 3.098
Location of exit pupil E0 (mm) 3.720
Refractive power of cornea (D) 42.262Refractive power of lens (D) 22.134
Refractive power of eye (D) 60.314
Total eye length (mm) 23.950
rC (mm) L (mm) n Q
Corneal front surface 7.77 – – –Cornea – 0.50 1.376 �0.18
Corneal back surface 6.40 – – –
Anterior chamber – 3.16 1.336 �0.60Front surface of eye lens 12.40 – – –
Eye lens (front segment) – 1.59 nA �0.94
Lens center (dashed line Figure 2.15) 1 2.43 nP –Back surface of eye lens �8.10 – – –
Vitreous – 16.27 1.336 0.96
Field curvature Like for the paraxial Gullstrand Eye, the discussed finite wide-angle models fit exactly to experimental data for small angles (< 30ı). The finitewide-angle models tend to emulate the field curvature of real eyes better for angles> 30ı.
Chromatic aberration Since dispersion is included in both finite wide-angle mod-els, chromatic aberrations can be described by these models quantitatively. Thedispersion model of the Navarro Eye was chosen especially with the objective toreproduce experimental data as accurately as possible.
�
� Michael Kaschke, Karl-Heinz Donnerhacke, and Michael Stefan Rill: Optical Devices in Ophthalmology andOptometry — Chap. c02 — 2013/11/11 — page 44 — le-tex
�
�
�
�
�
�
44 2 Optics of the Human Eye
0
sphe
rical
abe
rrat
ion
(D)
ray height (mm)
10
6
4
2
0
8
21 3 4
Gullstrand Eye #1Navarro EyeLiou-Brennan Eyeexperimental mean values
Figure 2.16 Ray height versus spherical aberration for different eye models. Experimental datapoints are shown for reference. Regarding spherical aberration, the Liou–Brennan Eye can emu-late real eyes very well. Data taken from [2].
2.2.3Applications of Eye Models
The optics of the human eye must often be considered for the design of ophthalmic,optometric, and other optical systems. For this purpose, the presented schematiceye models are used to derive the standard optical properties like the refractivepowers, the imaging behavior, the positions of cardinal points, the influence ofaberrations, and so on. From this, some typical examples for the application of eyemodels follow:
� Design of corrective glasses and contact lenses� Design and layout of optical imaging systems and visual aids such as loupes
(Section 6.1) and surgical microscopes (Section 6.2)� Design and layout of diagnostic devices (Chapter 5)� Simulation and planning of surgeries for treatment of eye diseases and refrac-
tive errors (Chapter 10)� Calculation of derived eye parameters (see Example 2.1).
Example 2.1
Calculation of the Retinal Image Size As a simple example for the application ofeye models, we calculate the retinal image size of a Landolt ring with a height ofhO D 6 mm. We assume that the test person looks at this symbol from a distance ofL D 4 m. For the calculation, we use (2.7), as the angle � of the nodal ray (Figure 2.3)does not change after passage through the eye’s refractive parts (Section 2.1.3).22)
�
� Michael Kaschke, Karl-Heinz Donnerhacke, and Michael Stefan Rill: Optical Devices in Ophthalmology andOptometry — Chap. c02 — 2013/11/11 — page 45 — le-tex
�
�
�
�
�
�
2.3 Color Vision 45
The angle at which the Landolt ring appears to the test person is given by
� D arctan�
hO
L
�D 5.1570 D 0.0015 rad . (2.35)
The distance between the image-side nodal point N0 and the retinal image surface(represented by image point I0
0) can, for example, be taken from the Exact Gull-strand Eye (Table 2.1) for which N0I0
0 D 17.054 mm. As a consequence, we obtainfor the retinal image size
h0I D �N0I0
0 D 25.6 μm . (2.36)
Note that we inserted the value of angle � in radiant units. The gap feature of theLandolt ring is 5 � smaller than the whole Landolt ring symbol. On the retina, thegap thus forms an image height of 5.1 μm.
When we use the parameters of the Navarro Eye (Table 2.3) instead of the ExactGullstrand Eye model, the distance between image-side nodal point and retinal im-age changes to N0I0
0 D 16.548 mm. Hence, in this case, we obtain a retinal imagesize of h0
I D 24.8 μm.
2.3Color Vision
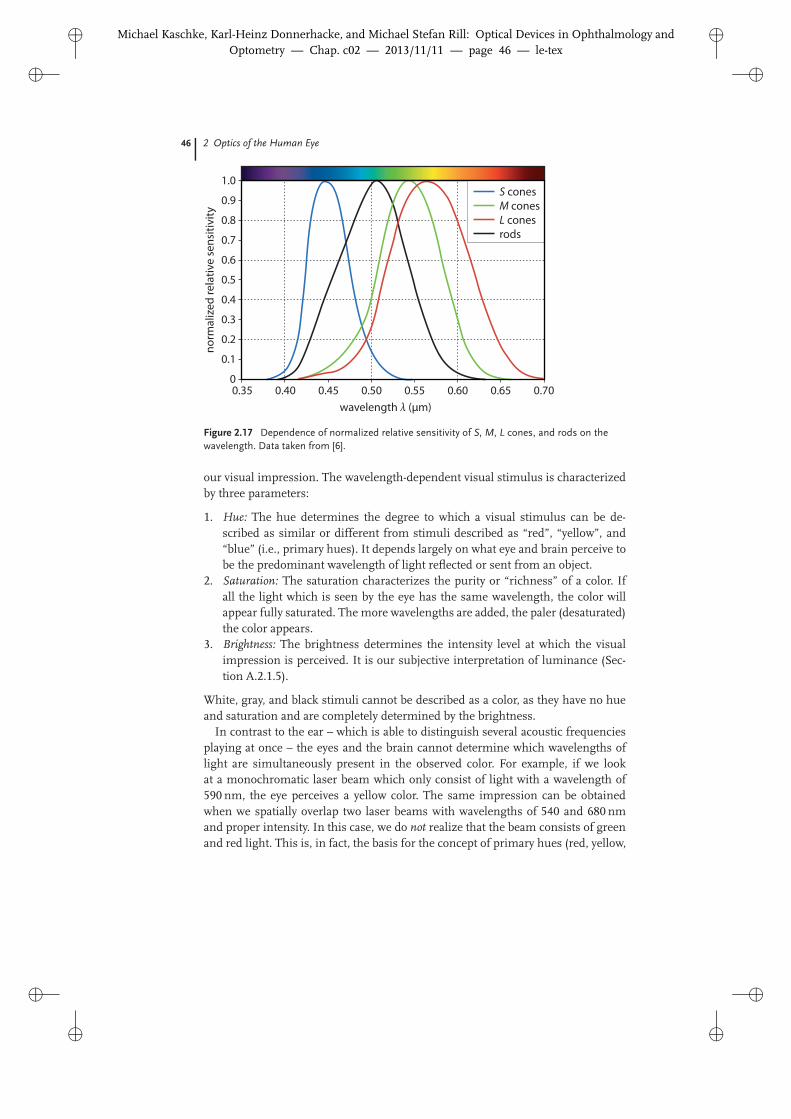
As mentioned in Section 1.2.1, the color perception of eyes mainly depends onthe ambient light conditions. For scotopic vision, only rods are used. Rods have amaximum sensitivity at a wavelength of 507 nm (black curve in Figure 2.17). Thisis the reason why we cannot distinguish colors at night.
For photopic vision, the human eye uses three types of cones (S, M, L cones)with different spectral sensitivity (Figure 2.17). The three detector types allow usto have trichromatic vision. Light with wavelengths between 380 and 780 nm canbe processed by the retina, which actually determines the visible spectrum. Fromthe mean value of the sensitivity curves of all cones in Figure 2.17, we obtain amaximum sensitivity at a wavelength of 555 nm under photopic conditions.
For vision, the signals of S, M, and L cones are combined in the brain, resultingin a visual stimulus interpreted as a color.23) Hence, the color at which an objectappears to us is not an inherent property of the object itself, but rather depends on
22) In principle, we could also use relation (2.1)to calculate the retinal image size. However,the angle ' of the chief ray is modified bycornea and eye lens (Figure 2.2), and '0
cannot be measured in practice.
23) An unknown number of women mayperceive millions of colors invisible to therest of human beings. It is supposed thatthey possess 4 (instead of 3) different types ofcones which expand the perceivable spectralrange [16].
�
� Michael Kaschke, Karl-Heinz Donnerhacke, and Michael Stefan Rill: Optical Devices in Ophthalmology andOptometry — Chap. c02 — 2013/11/11 — page 46 — le-tex
�
�
�
�
�
�
46 2 Optics of the Human Eye
1.0
0.9
0.8
0.7
0.6
0.5
0.4
0.3
0.2
0.1
00.35 0.40 0.45 0.50 0.55 0.60 0.65 0.70
wavelength λ (μm)
norm
aliz
ed re
lativ
e se
nsiti
vity
S conesM conesL conesrods
Figure 2.17 Dependence of normalized relative sensitivity of S, M, L cones, and rods on thewavelength. Data taken from [6].
our visual impression. The wavelength-dependent visual stimulus is characterizedby three parameters:
1. Hue: The hue determines the degree to which a visual stimulus can be de-scribed as similar or different from stimuli described as “red”, “yellow”, and“blue” (i.e., primary hues). It depends largely on what eye and brain perceive tobe the predominant wavelength of light reflected or sent from an object.
2. Saturation: The saturation characterizes the purity or “richness” of a color. Ifall the light which is seen by the eye has the same wavelength, the color willappear fully saturated. The more wavelengths are added, the paler (desaturated)the color appears.
3. Brightness: The brightness determines the intensity level at which the visualimpression is perceived. It is our subjective interpretation of luminance (Sec-tion A.2.1.5).
White, gray, and black stimuli cannot be described as a color, as they have no hueand saturation and are completely determined by the brightness.
In contrast to the ear – which is able to distinguish several acoustic frequenciesplaying at once – the eyes and the brain cannot determine which wavelengths oflight are simultaneously present in the observed color. For example, if we lookat a monochromatic laser beam which only consist of light with a wavelength of590 nm, the eye perceives a yellow color. The same impression can be obtainedwhen we spatially overlap two laser beams with wavelengths of 540 and 680 nmand proper intensity. In this case, we do not realize that the beam consists of greenand red light. This is, in fact, the basis for the concept of primary hues (red, yellow,
�
� Michael Kaschke, Karl-Heinz Donnerhacke, and Michael Stefan Rill: Optical Devices in Ophthalmology andOptometry — Chap. c02 — 2013/11/11 — page 47 — le-tex
�
�
�
�
�
�
2.4 Recommended Reading 47
blue). With these hues, we can “mix” any other color of the visible spectrum24), forexample, cyan is a combination of blue and green.
The full theory of color vision and color formation is beyond the scope of thisbook. Please refer to references [17–19] for further details about this topic.
2.4Recommended Reading
Further information about the optics of the human eye can be found in standardophthalmology textbooks, for example, [2, 6, 11, 13].
References
1 Porter, J., Queener, H., Lin, J., Thorn, K.,and Awwal, A.A.S. (eds) (2006) AdaptiveOptics for Vision Science: Principles, Prac-tices, Design and Applications, John Wiley& Sons, Inc, Hoboken.
2 Atchison, D.A. and Smith, G. (2006)Optics of the Human Eye, Butterworth–Heinemann.
3 Aggarwala, K.R., Nowbotsing, S., andKruger, P.B. (1995) Accommodation tomonochromatic and white-light targets.Invest. Ophthalmol. Vis. Sci., 36, 2695–2705.
4 Graef, K. and Schaeffel, F. (2012) Con-trol of accommodation by longitudinalchromatic aberration and blue cones. J.Vis., 12, 1–12.
5 Holden, B.A., Fricke, T.R., Ho, S.M.,Wong, R., Schlenther, G., Cronjé, S.,Burnett, A., Papas, E., Naidoo, K.S., andFrick, K.D. (2008) Global vision impair-ment due to uncorrected presbyopia.Arch. Ophthalmol., 126, 1731–1739.
6 Gross, H., Blechinger, F., and Achtner,B. (2008) Handbook of Optical Systems– Survey of Optical Instruments, vol. 4,Wiley-VCH Verlag GmbH, Weinheim.
7 Holladay, J.T., Lynn, M.J., Waring, G.O.,Gemmill, M., Keehn, G.C., and Fielding,B. (1991) The relationship of visual acu-
ity, refractive error, and pupil size afterradial keratotomy. Arch. Ophthalmol.,109, 70–76.
8 Optical Society of America (ed.) (1994)Handbook of Optics: Fundamentals, Tech-niques, and Design, vol. 1, McGraw–HillProfessional.
9 Tasman, W. (ed.) (1992) Duane’s Foun-dations of Clinical Ophthalmology, vol. 2,Lippincott Williams & Wilkins.
10 Gross, H., Zügge, H., Peschka, M., andBlechinger, F. (2007) Handbook of OpticalSystems – Correction of Optical Systems,vol. 3, Wiley-VCH Verlag GmbH, Wein-heim.
11 Diepes, H. (2004) Refraktionsbestim-mung, DOZ Verlag Optische Fachveröf-fentlichungen GmbH, 3rd edn.
12 Schober, H. (1964) Das Sehen, vol. 1,VEB Fachbuchverlag Leipzig.
13 Smith, G. and Atchison, D.A. (1997)The Eye and Visual Optical Instruments,Cambridge University Press.
14 Navarro, R., Santamaría, J., and Bescós,J. (1985) Accommodation-dependentmodel of the human eye with aspherics.J. Opt. Soc. Am. A, 2, 1273–1281.
15 Liou, H.L. and Brennan, N.A. (1997)Anatomically accurate, finite model eye
24) As the optical resolution of human eyes is limited, colors can also be generated by additivecolor composition. This means that the color impression is generated by superposition of smallareas (e.g., tiny dots) with primary hues. The hue we perceive is then determined by the relativeintensity of each color component. This principle of “composite” colors is, e.g., used for digitalimage projection and color raster prints.

�
� Michael Kaschke, Karl-Heinz Donnerhacke, and Michael Stefan Rill: Optical Devices in Ophthalmology andOptometry — 2013/11/11 — page 48 — le-tex
�
�
�
�
�
�
48 2 Optics of the Human Eye
for optical modeling. J. Opt. Soc. Am. A,14, 1684–1695.
16 Greenwood, V. (2012) The humanswith super human vision. http://discovermagazine.com/2012/jul-aug/06-humans-with-super-human-vision(accessed 24 August 2013).
17 Gross, H. (2005) Handbook of OpticalSystems – Fundamentals of Technical Op-
tics, vol. 1, Wiley-VCH Verlag GmbH,Weinheim.
18 Still, D., Fletcher, R. (eds) (1998) EyeExamination and Refraction, Wiley-VCHVerlag GmbH, Weinheim.
19 Valberg, A. (2005) Light Vision Color,Wiley-VCH Verlag GmbH, Weinheim.