Embed Size (px)
Citation preview

1
1
PROCESSO FAPESP 2014/24921-0 2
3
Relatório Final 4
5
Seleção de habitat e padrões de movimento de onçapintada (Pantheraonca): 6
novosdesafiosnasanálises de informaçõesobtidasportelemetria GPS-Satélite 7
8
Outorgado: 9
Ronaldo Gonçalves Morato 10
Centro Nacional de Pesquisa e Conservação de Mamíferos Carnívoros-ICMBio 11
12
Supervisores: 13
Peter Leimgruber 14
Justin M. Calabrese 15
ConservationEcology Center- SmithsonianConservationBiologyInstitute 16
17
18
19
20
21
22
23
24
25
ATIBAIA 26
Setembro/ 2016 27
28

2
Capítulo 1 29
30
Artigo publicado no periódico PlosOne 31
Morato RG, Stabach JA, Fleming CH, Calabrese JM, De Paula RC, Ferraz KMPM, et 32
al. (2016) Space Use and Movement of a Neotropical Top Predator: The Endangered 33
Jaguar. PLoS ONE 11(12): e0168176. doi:10.1371/journal. pone.0168176 34
35
Full Title: Space use and movement behavior of a Neotropical top predator: the 36
endangered jaguar 37
38
Short Title: Jaguar movement ecology 39
40
Morato RG1, 2, 3*, Stabach JA2, Fleming CH2, Calabrese JM2, De Paula RC1, 3, Ferraz 41
KMPM3, 4, Kantek DLZ5, Miyazaki SS5, Pereira TDC5, Araujo GR6, Paviolo A7, De 42
Angelo C7, Di Bitetti MS7, Cruz P7, Lima F8, 9, Cullen L8, Sana DA3, 10, Ramalho EE3, 43
11, Carvalho MM12, Soares, FHS12, Zimbres B13,Xavier MS14, Moraes, MDF14, 44
VogliottiA3,15, May Jr JA16, Haberfeld M16, Rampim L16, Sartorello L16, Ribeiro MC9, 45
Leimgruber P2 46
47
1 Centro Nacional de Pesquisa e Conservação de Mamíferos Carnívoros, Instituto 48
Chico Mendes de Conservação da Biodiversidade, Atibaia, SP, Brazil. 49
2Conservation Ecology Center, Smithsonian Conservation Biology Institute, National 50
Zoological Park, Front Royal, VA, USA. 51
3 Instituto Pró-Carnívoros, Atibaia, SP, Brazil. 52

3
4 Escola Superior de Agricultura “Luiz de Queiroz”, Universidade de São Paulo, 53
Piracicaba, Brazil. 54
5 Estação Ecológica Taiamã, Instituto Chico Mendes de Conservação da 55
Biodiversidade, Cáceres, MT, Brazil. 56
6Departamento de Medicina Veterinária, Universidade Federal de Viçosa, Viçosa, 57
MG, Brazil. 58
7Instituto de Biología Subtropical, Universidad Nacional de Misiones and CONICET, 59
Puerto Iguazú, Argentina. 60
8 IPÊ – Instituto de Pesquisas Ecológicas, Nazaré Paulista, SP, Brazil. 61
9 Laboratório de Ecologia Espacial e Conservação, Instituto de Biociências, 62
Univesidade Estadual de São Paulo, Rio Claro, SP, Brazil. 63
10 Programa de Pós-graduação em Ecologia, Universidade Federal do Rio Grande 64
do Sul, Porto Alegre, RS, Brazil. 65
11Instituto de DesenvolvimentoSustentávelMamirauá,Tefé, AM,Brazil. 66
12Instituto de Defesa e Preservação dos Felídeos Brasileiros, Corumbá de Goiás, 67
Go, Brazil. 68
13 Programa de Pós Graduação em Zoologia, Instituto de Ciências Biológicas, 69
Universidade de Brasília, DF, Brazil. 70
14Projeto Carnívoros do Iguaçu, Parque Nacional do Iguaçu, Instituto Chico Mendes 71
de Conservação da Biodiversidade, Foz do Iguaçu, PR, Brazil. 72
15 Universidade Federal da Integração Latino-Americana, Foz do Iguaçu, PR, Brazil. 73
16 Projeto Onçafari, Miranda, MS, Brazil. 74

4
*Corresponding author: 75
Abstract 77
Accurately estimating home range and understanding movement behavior 78
can provide important information on ecological processes. Advances in data 79
collection and analysis have improved our ability to estimate home range and 80
movement parameters, both of which have the potential to impact species 81
conservation. Fitting continuous-time movement model to data and incorporating the 82
autocorrelated kernel density estimator (AKDE), we investigated range residency of 83
forty-four jaguars fit with GPS collars across five biomes in Brazil and Argentina. We 84
assessed home rangeand movement parameters of range resident animals and 85
compared AKDE estimates with kernel density estimates (KDE). We accounted for 86
differential space use and movement among individuals, sex, region, and habitat 87
quality. Thirty-three (80%) of collared jaguars were range resident. Home range 88
estimates using AKDE were 1.02 to 4.80 times larger than KDE estimates that did 89
not consider autocorrelation. Males exhibited larger home ranges, more directional 90
movement paths, and a trend towards larger distances traveled per day. Jaguars 91
with the largest home ranges occupied the Atlantic Forest, a biome with high levels 92
of deforestation and high human population density. Our results fill a gap in the 93
knowledge of the species’ ecologywith an aim towards better conservation of this 94
endangered/critically endangered carnivore – the top predator in the Neotropics. 95
96
97
Keywords: top predator conservation, home range, movement, Pantheraonca, ctmm 98

5
99
Introduction 100
Top predator as a model 101
In terrestrial environments, predators tend to restrict their movements within 102
defined areas to meet daily requirements. These animals are often considered range 103
residents [1]. Top predators, such as large-sized cats, are known to require large 104
areas [2]. Space use is likely to increase as habitat quality decreases, making this 105
group particularly vulnerable to habitat loss and fragmentation [3–5]. In addition, 106
movement parameters such as the total distance traveled per day and the tortuosity 107
of the movement path can increase in response to habitat fragmentation [6]. 108
Understanding animal movement and space use across dynamic landscapes is 109
critical for the establishment of effective conservation strategies [7], 110
includingthecreation/maintenanceofecologicalcorridorsdesignedtoguaranteethemove111
mentof focal species, improvingtheconnectivityof habitat patches 112
withinfragmentedlandscapes[8], andidentifyingpriorityareas for conservation[9]. 113
Accurately estimating home ranges and understanding animal movement behavior 114
provide information on ecological processes that can impact species conservation 115
[10,11]. 116
The jaguar (Pantheraonca) is widely distributed across a broad range of 117
habitats in the Americas [12]. Loss of habitat is the greatest threat for the species’ 118
long-term survival. The classification of the species as “near threatened” by the IUCN 119
[13]and endangered or critically endangered in Brazil and Argentina [14,15] reflects 120
that over 50% of the species’ natural habitat has been lost and converted to 121
anthropogenic land-uses in the past century [12]. 122
6
Jaguars are known to be range resident with young dispersing from their 123
natal area after becoming independent [16]. Several studies have estimated jaguar 124
home range across the species’ distributional range [17–20]. Nevertheless, no study 125
has accounted for the inherent autocorrelation structure of the movement data when 126
calculating jaguar home range estimates. Resulting home ranges are likely 127
underestimated [11]. Moreover, former studies lacked an empirical way to 128
characterize range residency. Thus, published results could include estimates of 129
“home range” for individuals that are not actually range resident but may be 130
dispersing or transient. It remains unclear if study-specific differences in jaguar home 131
range estimates are ecologically-based or the result of methodological artifacts [18]. 132
Surprisingly few studies have investigated jaguar movement to date[16,21–23], due 133
in part to the difficulty in locating and fitting individuals with monitoring devices. 134
Differential movement strategies have been reported between sexes, with males 135
moving greater distances and females being more restricted to home range center 136
points [21,24]. However, more detailed analyses, utilizing quickly evolving and 137
advanced analytical tools from movement ecology, are urgently needed on the 138
movements of jaguar across differing habitats, particularly across differing degrees of 139
habitat disturbance and fragmentation. 140
141
New perspectives on movement data analysis 142
The minimum convex polygon (MCP) and kernel density estimators (KDE) 143
are the most commonly used tools to estimate animal home ranges [11]. Both tools 144
have limitations that are often not acknowledged. MCPs, for example, lack any 145
underlying probabilistic model while KDEs are derived under the assumption of 146
independent and identically distributed data (IID), a process that assumes 147
uncorrelated positions and velocities and which cannot be recognized as a 148
7
movement model [11,25]. Incorporating autocorrelated data in conventional KDE 149
frameworks has the potential to underestimate the size of animal home ranges, 150
especially as the temporal frequency of positions collected increases [11] - a 151
situation common with modern GPS tracking devices. 152
New approaches such as fitting continuous-time stochastic movement models 153
to animal tracking data can account for inherent serial autocorrelation [26]. 154
Movement analyses using this method have a number of desirable properties, 155
including the ability to handle irregular sampling schedules (including gaps in the 156
data) and complex autocorrelation structures [25,27–29]. This approach includes 157
variogram analysis [27] and non-Markovian maximum likelihood estimation [28]. The 158
formerfacilitatesidentifyingimportantfeatures in the data (e.g., range residency), 159
whilethelatterallowsmodelsincorporatingthesefeaturestoberigorouslyfittothe data. 160
Once an appropriate continuous-time model has been selected and fit, 161
Autocorrelated Kernel Density Estimation (AKDE) then conditions on the fitted model 162
to allow accurate home range estimation even when data are strongly 163
autocorrelated[11]. Calabrese et al.(2016) [25] give a detailed account of using the 164
continuous-time movement modeling (ctmm) R package to perform this sequence of 165
analyses. 166
167
Jaguar motion in focus 168
We used the AKDE method to estimate home range, to evaluate path tortuosity, and 169
to quantify average distance traveled by jaguar across different regions of Brazil and 170
Argentina. Our first step involved characterizing the underlying movement behavior. 171
We expected adult jaguars to be range resident. Second, we expected larger home 172
range estimates than previously reported for the species, due to appropriately 173
accounting for the autocorrelation structure of the data [17,20,30–33]. We calculated 174
estimates of home range using both KDE and AKDE methods, demonstrating 175
8
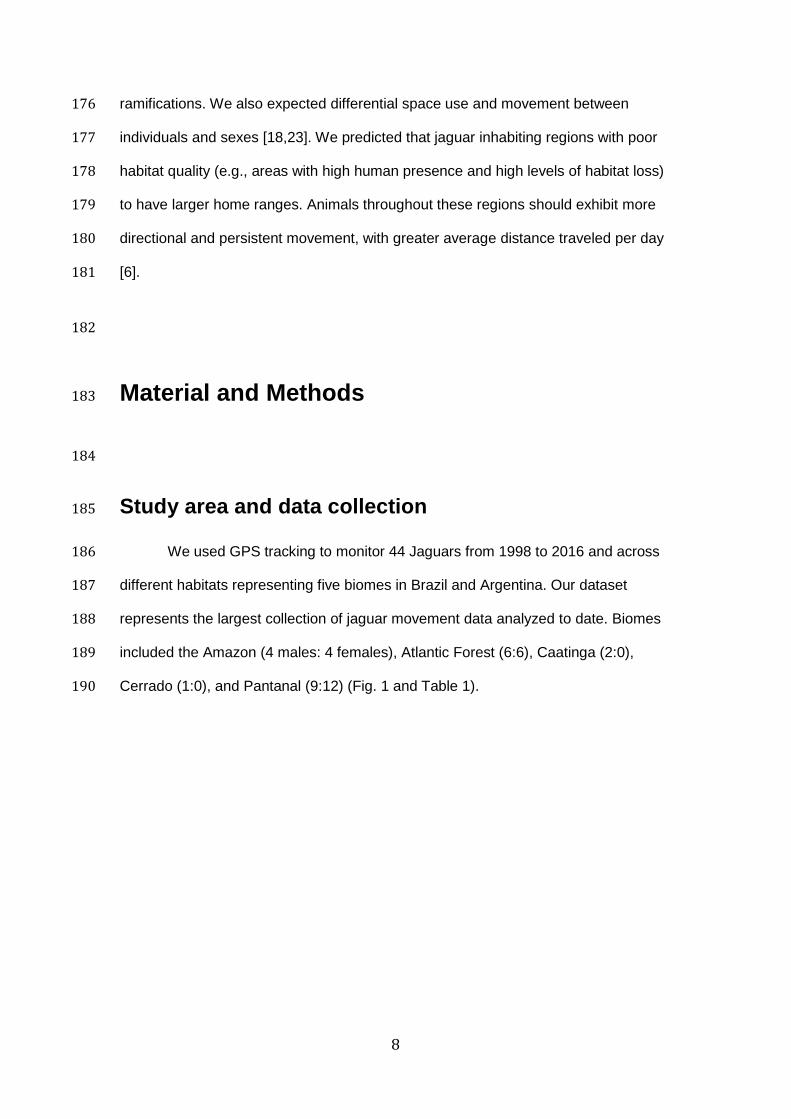
ramifications. We also expected differential space use and movement between 176
individuals and sexes [18,23]. We predicted that jaguar inhabiting regions with poor 177
habitat quality (e.g., areas with high human presence and high levels of habitat loss) 178
to have larger home ranges. Animals throughout these regions should exhibit more 179
directional and persistent movement, with greater average distance traveled per day 180
[6]. 181
182
Material and Methods 183
184
Study area and data collection 185
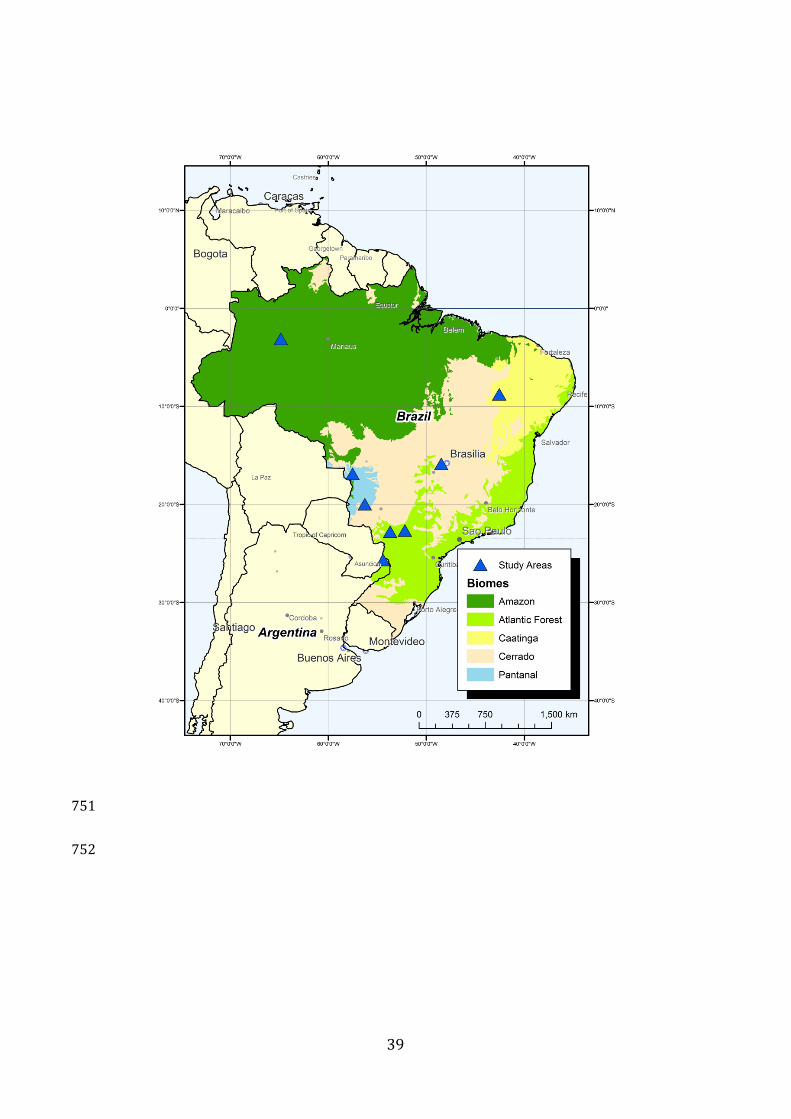
We used GPS tracking to monitor 44 Jaguars from 1998 to 2016 and across 186
different habitats representing five biomes in Brazil and Argentina. Our dataset 187
represents the largest collection of jaguar movement data analyzed to date. Biomes 188
included the Amazon (4 males: 4 females), Atlantic Forest (6:6), Caatinga (2:0), 189
Cerrado (1:0), and Pantanal (9:12) (Fig. 1 and Table 1).190

9
Fig 1.Map of study areas in Brazil and on the borde r of Brazil and Argentina. 191
Source: mma.gov.br and wwf.org 192

10
Table 1 Extent and conservation status of remaining habitat in Brazil’s major biomes and a portion of Atlantic Forest in Argentina. Jaguars are 193
considered vulnerable in the Amazon and Pantanal, endangered in the Cerrado and critically endangered in the Atlantic Forest and 194
Caatinga[14,15]. 195
Amazon Atlantic Forest Caatinga Cerrado Pantanal
Biome area (km2)
4,196,943 1,110,182 844,453 2,036,448 150,355
Percentage of Brazil (%)
49.3 13.0 9.9 23.9 1.8
Biome remaining (%)
82.3 12.0 52.5 51.6 84.7
Protected Areas (%)
49.1 9.6 7.7 12.3 4.6
Mean habitant density per Km2
3 77 13 5 3
Mean livestock density per Km2
0.15 21.8 8.0 48 32.2
Jaguar Density (individuals per 100km2)
10.0 0.45-2.2 2.67 2.0 10.3
Source:http://siscom.ibama.gov.br/monitorabiomas/, [18,34–37] 196

11
197
The GPS collection schedules and time periods each animal was monitored 198
ranged from one position every half hour to one position every 24 hours. Estimated 199
ages of jaguars ranged from 18 months to 10 years, with the majority of jaguar (n = 200
41) being adults (> 3 years old). Two individuals (Esperança and Xango) were 201
monitored for two different periods. Monitoring periods ranged from 11 to 1,749 days 202
(mean = 183 days), while the number of recorded locations ranged from 53 to 10,989 203
(mean = 2,264). The total dataset consisted of 80,553 locations. Further details on fix 204
schedules, the number of days each animal was monitored, and the devices used to 205
monitor movement, are provided in S1 Table. All animals were captured following 206
standard protocols approved by the Instituto Chico Mendes de Conservação da 207
Biodiversidade - Ministério do MeioAmbiente - Brazil (ICMBio-SISBIO license 208
numbers: 30896-3, 46031-4, 36740-1, 44677-1,14202-4, 38006-1, 30053-1, 37867-209
1), the National Park Administration (NPA license 03/09), and Misiones Province 210
Government (ME license 119/2012) fromArgentina. 211
Collar fitting involved using trained dogs [38], box traps [30] and/or foot 212
snares [39] to facilitate animal capture. All individuals were anaesthetized with a 213
combination of tiletamine and zolazepam (10 mg kg-1), administered via an aluminum 214
dart fired from an air-powered rifle [38]. We examined each immobilized animal for 215
general body condition, determined its sex and age, collected its weight, and fit each 216
jaguar with a global positioning system collar. Animals were released at the site of 217
capture. All procedures followed guidelines approved by the American Society of 218
Mammologists[40]. 219
220
Home range and movement 221
12
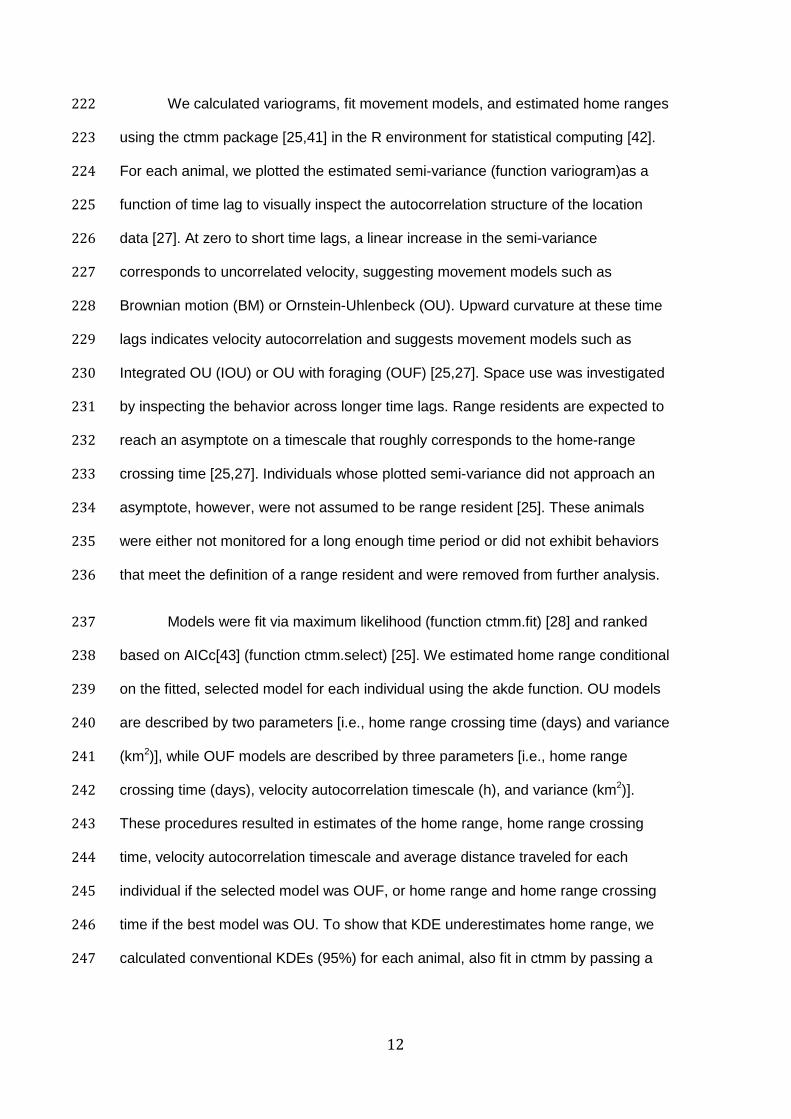
We calculated variograms, fit movement models, and estimated home ranges 222
using the ctmm package [25,41] in the R environment for statistical computing [42]. 223
For each animal, we plotted the estimated semi-variance (function variogram)as a 224
function of time lag to visually inspect the autocorrelation structure of the location 225
data [27]. At zero to short time lags, a linear increase in the semi-variance 226
corresponds to uncorrelated velocity, suggesting movement models such as 227
Brownian motion (BM) or Ornstein-Uhlenbeck (OU). Upward curvature at these time 228
lags indicates velocity autocorrelation and suggests movement models such as 229
Integrated OU (IOU) or OU with foraging (OUF) [25,27]. Space use was investigated 230
by inspecting the behavior across longer time lags. Range residents are expected to 231
reach an asymptote on a timescale that roughly corresponds to the home-range 232
crossing time [25,27]. Individuals whose plotted semi-variance did not approach an 233
asymptote, however, were not assumed to be range resident [25]. These animals 234
were either not monitored for a long enough time period or did not exhibit behaviors 235
that meet the definition of a range resident and were removed from further analysis. 236
Models were fit via maximum likelihood (function ctmm.fit) [28] and ranked 237
based on AICc[43] (function ctmm.select) [25]. We estimated home range conditional 238
on the fitted, selected model for each individual using the akde function. OU models 239
are described by two parameters [i.e., home range crossing time (days) and variance 240
(km2)], while OUF models are described by three parameters [i.e., home range 241
crossing time (days), velocity autocorrelation timescale (h), and variance (km2)]. 242
These procedures resulted in estimates of the home range, home range crossing 243
time, velocity autocorrelation timescale and average distance traveled for each 244
individual if the selected model was OUF, or home range and home range crossing 245
time if the best model was OU. To show that KDE underestimates home range, we 246
calculated conventional KDEs (95%) for each animal, also fit in ctmm by passing a 247

13
fitted Independent Identically Distributed (IID) model (i.e., a model that, by definition, 248
ignores autocorrelation in the data) to the akde function [25]. 249
250
Statistical Analyses 251
To test our predictions that animal space use and movement (i.e., home 252
range, home range crossing time, velocity timescale and average distance traveled) 253
varied with gender and biome (i.e., Atlantic rainforest vs. Pantanal vs. Amazon), we 254
compared results using hierarchical Bayesian fixed-effect one-way ANOVAs [44,45]. 255
We tested for normality using Shapiro-Wilk tests [46] and by visually inspecting Q-Q 256
plots. Data were log transformed if dataset distributions did not meet model 257
assumptions. We estimated marginal posterior distributions of parameters using 258
Markov chain Monte Carlo (MCMC) methods. We fit a MCMC algorithm with 100,000 259
iterations and a 20% burn-in period (i.e., 20,000 iterations). We assessed 260
convergence by visually inspecting trace plots to ensure a reasonable exploration of 261
the parameter space and by confirming that the potential scale reduction factor was 262
<1.02 for each variable [47]. We calculated the probability (P) that the mean of one 263
group was greater than the other by sampling from each of the resulting posterior 264
distributions (10,000 iterations) [48]. We implemented all analyses in program R 265
using the rjags package [49], JAGS version 4.2.0. 266
We used human population (LandScan[50]) as a corollary of habitat quality 267
assuming that as human population density increases, habitat quality decreases 268
[51,52]. To assess the effect of human population (square root transformed) on home 269
range estimates, we fit linear regression models in a Bayesian framework. Models 270
were implemented in JAGS 4.2.0 [52] in the R programming language following 271
methods previously described [44,53]. We assessed model fit by calculating the 272
14
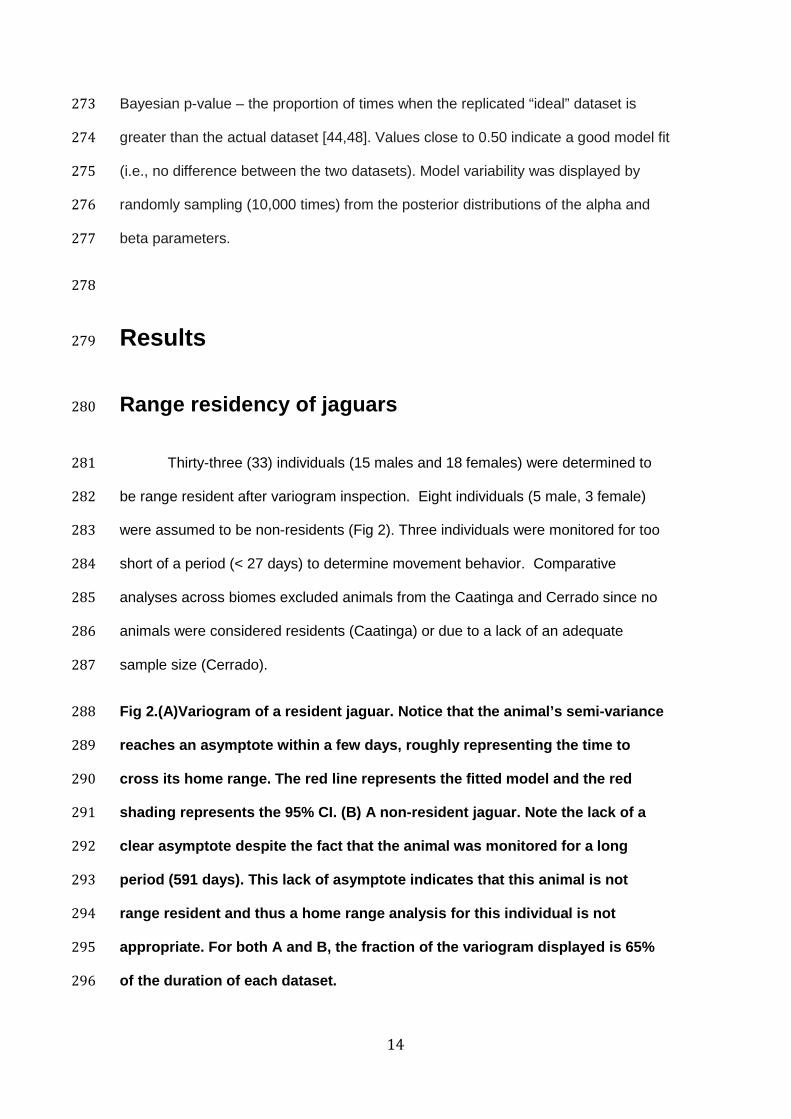
Bayesian p-value – the proportion of times when the replicated “ideal” dataset is 273
greater than the actual dataset [44,48]. Values close to 0.50 indicate a good model fit 274
(i.e., no difference between the two datasets). Model variability was displayed by 275
randomly sampling (10,000 times) from the posterior distributions of the alpha and 276
beta parameters. 277
278
Results 279
Range residency of jaguars 280
Thirty-three (33) individuals (15 males and 18 females) were determined to 281
be range resident after variogram inspection. Eight individuals (5 male, 3 female) 282
were assumed to be non-residents (Fig 2). Three individuals were monitored for too 283
short of a period (< 27 days) to determine movement behavior. Comparative 284
analyses across biomes excluded animals from the Caatinga and Cerrado since no 285
animals were considered residents (Caatinga) or due to a lack of an adequate 286
sample size (Cerrado). 287
Fig 2.(A)Variogram of a resident jaguar. Notice tha t the animal’s semi-variance 288
reaches an asymptote within a few days, roughly rep resenting the time to 289
cross its home range. The red line represents the f itted model and the red 290
shading represents the 95% CI. (B) A non-resident j aguar. Note the lack of a 291
clear asymptote despite the fact that the animal wa s monitored for a long 292
period (591 days). This lack of asymptote indicates that this animal is not 293
range resident and thus a home range analysis for t his individual is not 294
appropriate. For both A and B, the fraction of the variogram displayed is 65% 295
of the duration of each dataset. 296

15
297
Individual home range and movement of jaguar. 298
Comparison between AKDE and KDE 299
Home range and movement (home range crossing time, velocity timescale, 300
and average distance traveled) estimates varied between individuals (Table 2). 301
Home range estimates using AKDE were 1.0 to 4.8 times larger than estimates 302
obtained using KDE. Other than a few exceptions, AKDE 303
estimateswerelargerthanestimatespreviouslyreported (Table 3). 304
305

16
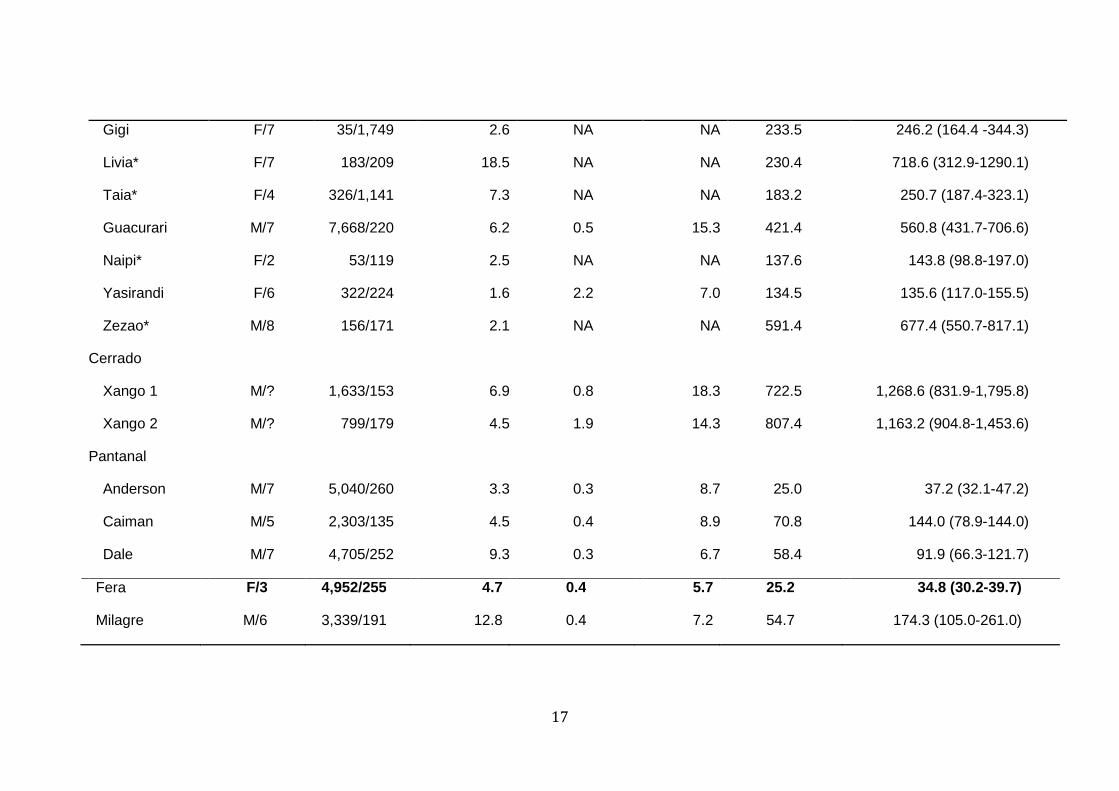
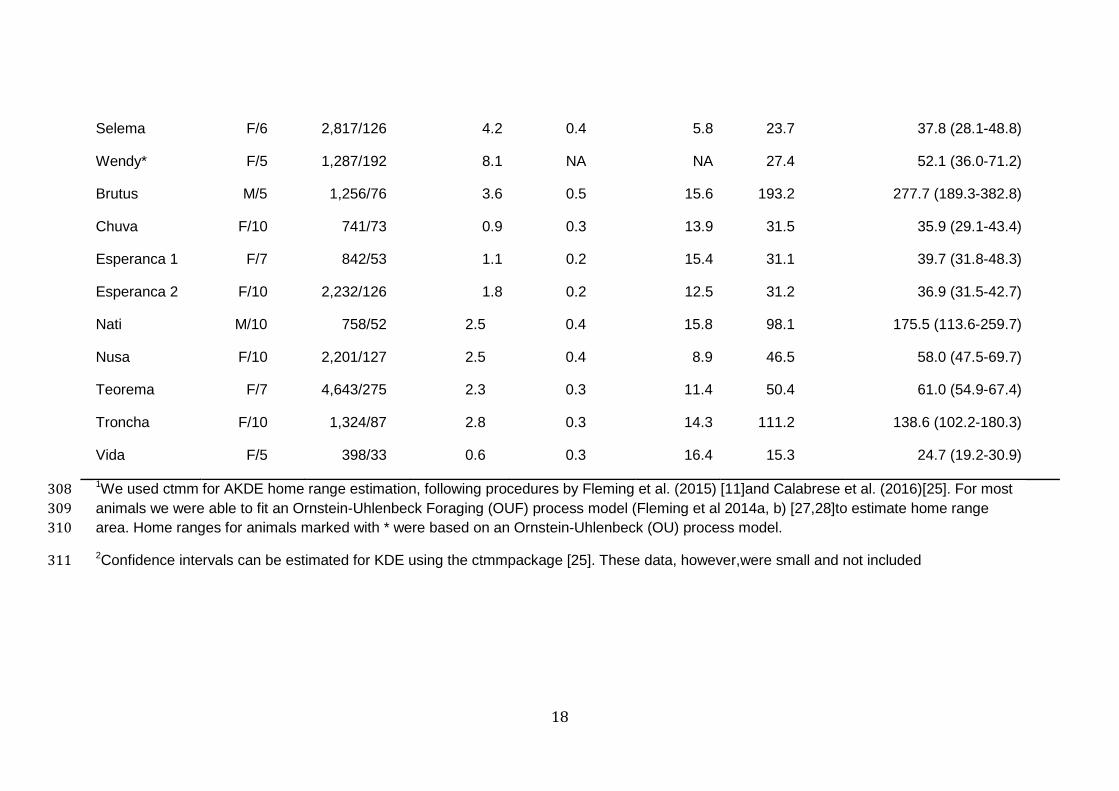
Table 2. Movement parameters and home range sizes for GPS-collared jaguar across Brazil and Argentina biomes. Home ranges were 306
estimated via 95% Kernel Density Estimates (KDE) and Autocorrelated Kernel Density Estimates (AKDE)1. 307
ID Sex/age (years)
Number of fixes/days
Home range crossing
time (day)
Velocity autocorrelation timescale (h)
Average distance traveled (km/day)
95%KDE (km2)2 AKDE (km2) (95% CI)
Amazon
Baden M/9 1,024/507 6.8 2.6 4.4 169.5 207.0 (168.8-249.3)
Caculao M/7 516/190 5.9 3.3 4.6 180.3 253.7 (187.7-329.6)
Confuso M/9 61/251 3.4 1.9 4.3 67.6 75.9 (39.3-124.5)
Coto F/7 501/154 9.7 2.5 2.3 53.0 85.5 (52.9-125.9)
Mamad* M/7 295/383 20.4 NA NA 174.3 309.7 (167.2-495.3)
Mamae F/11 784/333 4.8 0.9 4.2 43.7 49.4 (41.3-58.2)
Mudinha F/5 3,700/429 7.7 1.0 3.9 53.6 70.2 (58.1-83.4)
Atlantic Forest
Cassio M/6 159/159 1.5 NA NA 108.5 110.9 (92.1-131.4)
Denis M/5 797/370 4.5 0.9 15.4 414.9 502.1 (435.9-572.9)
Femea* F/5 211/139 4.3 NA NA 85.6 113.1 (85.2-145.0)
17
Gigi F/7 35/1,749 2.6 NA NA 233.5 246.2 (164.4 -344.3)
Livia* F/7 183/209 18.5 NA NA 230.4 718.6 (312.9-1290.1)
Taia* F/4 326/1,141 7.3 NA NA 183.2 250.7 (187.4-323.1)
Guacurari M/7 7,668/220 6.2 0.5 15.3 421.4 560.8 (431.7-706.6)
Naipi* F/2 53/119 2.5 NA NA 137.6 143.8 (98.8-197.0)
Yasirandi F/6 322/224 1.6 2.2 7.0 134.5 135.6 (117.0-155.5)
Zezao* M/8 156/171 2.1 NA NA 591.4 677.4 (550.7-817.1)
Cerrado
Xango 1 M/? 1,633/153 6.9 0.8 18.3 722.5 1,268.6 (831.9-1,795.8)
Xango 2 M/? 799/179 4.5 1.9 14.3 807.4 1,163.2 (904.8-1,453.6)
Pantanal
Anderson M/7 5,040/260 3.3 0.3 8.7 25.0 37.2 (32.1-47.2)
Caiman M/5 2,303/135 4.5 0.4 8.9 70.8 144.0 (78.9-144.0)
Dale M/7 4,705/252 9.3 0.3 6.7 58.4 91.9 (66.3-121.7)
Fera F/3 4,952/255 4.7 0.4 5.7 25.2 34.8 (30.2-39.7)
Milagre M/6 3,339/191 12.8 0.4 7.2 54.7 174.3 (105.0-261.0)
18
Selema F/6 2,817/126 4.2 0.4 5.8 23.7 37.8 (28.1-48.8)
Wendy* F/5 1,287/192 8.1 NA NA 27.4 52.1 (36.0-71.2)
Brutus M/5 1,256/76 3.6 0.5 15.6 193.2 277.7 (189.3-382.8)
Chuva F/10 741/73 0.9 0.3 13.9 31.5 35.9 (29.1-43.4)
Esperanca 1 F/7 842/53 1.1 0.2 15.4 31.1 39.7 (31.8-48.3)
Esperanca 2 F/10 2,232/126 1.8 0.2 12.5 31.2 36.9 (31.5-42.7)
Nati M/10 758/52 2.5 0.4 15.8 98.1 175.5 (113.6-259.7)
Nusa F/10 2,201/127 2.5 0.4 8.9 46.5 58.0 (47.5-69.7)
Teorema F/7 4,643/275 2.3 0.3 11.4 50.4 61.0 (54.9-67.4)
Troncha F/10 1,324/87 2.8 0.3 14.3 111.2 138.6 (102.2-180.3)
Vida F/5 398/33 0.6 0.3 16.4 15.3 24.7 (19.2-30.9)
1We used ctmm for AKDE home range estimation, following procedures by Fleming et al. (2015) [11]and Calabrese et al. (2016)[25]. For most 308
animals we were able to fit an Ornstein-Uhlenbeck Foraging (OUF) process model (Fleming et al 2014a, b) [27,28]to estimate home range 309
area. Home ranges for animals marked with * were based on an Ornstein-Uhlenbeck (OU) process model. 310
2Confidence intervals can be estimated for KDE using the ctmmpackage [25]. These data, however,were small and not included311

19
312
Table 3 Jaguar home range estimatesfromtheAmazon, Atlantic Forest, Cerrado,and Pantanal usingtheautocorrelationkerneldensityestimator 313
(AKDE), minimumconvexpolygon (MCP),orkerneldensityestimator (KDE). For AKDE, MCP,and KDE wedisplay themean, 314
minimum,andmaximumhome range values. For AKDE,wealsodisplay 95% confidenceintervals. 315
316
Biome Method Home range (km2) Mean home range (km2) Reference
Female Male
Amazon AKDE 49.4-309.7 68.4 (23.3-113.4) (n=3)
211.6 (52.9-370.2) (n=4)
Thisstudy
Atlantic Forest
AKDE 110.9-718.6 268.0 (223.1- 702.4) (n=5)
462.8 (71.9-853.7) (n=4)
Thisstudy
Atlantic Forest
MCP 100%
8.8-138 39.4 (n=2) 88.7 (n=4) [30]
Atlantic Forest
MCP 100%
43.8-177.7 87.3 (n=5) 102 (n=2) [31]
Atlantic Forest
KDE 85% 87-173 130 (n=2) 147 (n=1) [38]
Cerrado AKDE NA NA 1,268.6 (831.9-1,795.8) (n=1)
Thisstudy
Cerrado MCP 228-265 228 (n=1) 265.2 (n=2) [33]

20
80%
Pantanal AKDE 24.7-277.7 52.0 (28.7-75.2) (n=10)
144.3 (56.3-232.2) (n=6)
Thisstudy
Pantanal MCP 100%
25-90 32.3 (n=3) 90 (n=1) [16]
Pantanal MCP 100%
97.1-168.4 139.6 (n=4) 152.4 (n=1) [54]
Pantanal Kernel 95%
NA 38.2 (n=5) 67.4 (n=3) [19]
AdaptedfromAstete et al. (2007) [18]. 317

21
Sex differences on home range and movement paramete rs of 318
jaguars 319
Movement and home range size varied widely between male and female 320
jaguar. The probability that the home range size of males (range: 37.2 to 1,268.6 321
km2) was greater than females (range: 24.7 to 718.6 km2) was 0.97 (Fig 3A and 3B). 322
Males, almost exclusively, took longer to cross their home ranges (P= 0.99; Fig 3C 323
and 3D). Male movement paths, represented by velocity autocorrelation timescale, 324
were proportionally more directional (P= 0.94; Fig 3E and 3F), with a greater distance 325
traveled per day (P = 0.84; Fig 3G and 3H) when compared with female jaguar. All 326
data are summarized in Table 2. 327
Fig 3. Boxplot and Posterior Density Estimates for male and female home 328
range (log km 2) [A and B], home range crossing time (log days) [C and D], 329
velocity autocorrelation timescale (h) [E and F], a nd average distance traveled 330
(Km/day) [G and H]. Black line represents the diffe rence between the posterior 331
distribution of males and females, red represents t he posterior distribution of 332
females and blue represents the posterior distribut ion of males. 333
334
Differences in home range and movement across areas with 335
differing degrees of habitat loss and human populat ion 336
density 337
We observed differences in home range size between biomes (Fig. 4). The 338
probability that the home ranges of Atlantic Forest male jaguar were greater than 339
individuals from the Amazon or Pantanal was 0.87 and 0.98, respectively. Similarly, 340
the probability that the home range of Atlantic Forest female jaguar were greater than 341

22
individuals from the Amazon or Pantanal was 0.99 and 1.0, respectively. 342
Fig 4.Boxplot of home range (km 2) for males and female jaguar by biome. 343
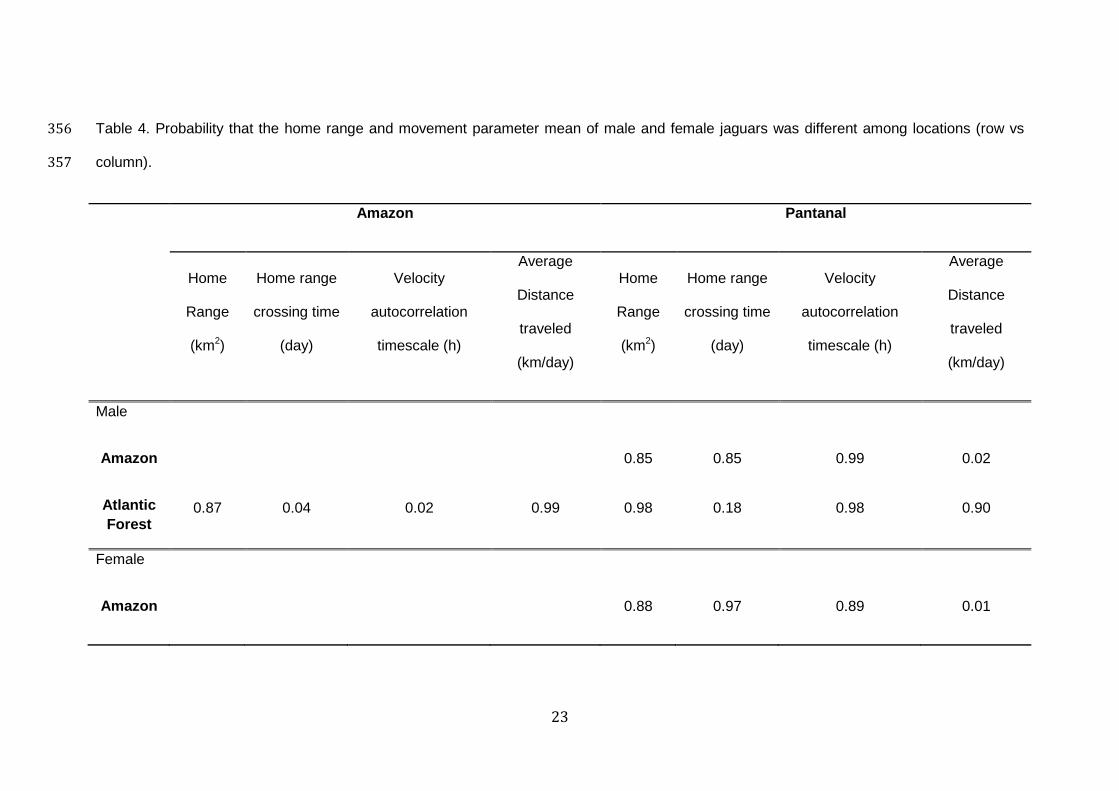
Differential movements were observed across biomes. Female jaguar took 344
9.0 days (95% CI: 4.7-13.4), 7.4 days (95% CI: 1.3-9.4) and 2.3 days (95% CI: 0.1-345
6.4) to cross their home range in the Atlantic Forest, Amazon and Pantanal, 346
respectively. The probability that the velocity autocorrelation timescale of female 347
Amazon jaguar was greater than female Pantanal jaguar was 0.89. The inverse, 348
however, was observed in relation to daily distance traveled (Pantanal> Amazon). 349
The home range crossing time for male Amazon jaguar was greater than male jaguar 350
from the Pantanal or Atlantic Forest, although male jaguar from Pantanal took more 351
days to cross their home range than animals from the Atlantic Forest (Amazon 352
>Pantanal> Atlantic Forest). A similar result was found for the velocity autocorrelation 353
timescale. Average distance traveled was highest for jaguar inhabiting the Atlantic 354
Forest (Atlantic Forest >Pantanal> Amazon) (Table 4). 355
23
Table 4. Probability that the home range and movement parameter mean of male and female jaguars was different among locations (row vs 356
column). 357
Amazon Pantanal
Home
Range
(km2)
Home range
crossing time
(day)
Velocity
autocorrelation
timescale (h)
Average
Distance
traveled
(km/day)
Home
Range
(km2)
Home range
crossing time
(day)
Velocity
autocorrelation
timescale (h)
Average
Distance
traveled
(km/day)
Male
Amazon 0.85 0.85 0.99 0.02
Atlantic Forest
0.87 0.04 0.02 0.99 0.98 0.18 0.98 0.90
Female
Amazon 0.88 0.97 0.89 0.01

24
Atlantic Forest
0.99 0.66 NA NA 1.0 0.98 NA NA
NA- Not applicable, insufficient data358

25
Jaguar home ranges also increased in size with increasing human population 359
(Fig. 5). Bayesian p-value (0.495) indicates an adequate fit of the regression model 360
to the data. Males were most affected by human population size, represented by 361
increases in space use. The response of female jaguar was more restricted, with few 362
home ranges showing increases in relation to increases in human population. 363
Largest home ranges for male and female jaguar were observed across the Atlantic 364
Forest and Cerrado. 365
Fig 5 Jaguars’ home range estimates in relation to human population size 366
(square root transformed) across four study areas i n Brazil and Argentina. 367
Regression line is the species estimate from a line ar regression model 368
formulated in a Bayesian framework (Bayesian p-valu e=0.495). Error lines are 369
95% CI. 370
371
372
Discussion 373
The Autocorrelated Kernel Density Estimator isa recent analytical 374
development in movement ecology that removes the negative bias in home range 375
estimation by incorporating the autocorrelation structure inherent in most movement 376
datasets. This method yields better home range estimates, allowing movement 377
models to be fit to data with different temporal structures (e.g., irregular sampling 378
intervals, gaps, and short periods of data collection) [11]. Using this flexible 379
approach, we revealed important ecological processes in jaguar, including 380
heterogeneity in space use and movement owing to differences in individual, gender, 381
region, and habitat quality. 382
Our results provide support for differential movement behavior and space use 383

26
between individuals and sex. Additional differences were observed between regions 384
with differing degrees of human disturbance (i.e., population density), revealing 385
important aspects of jaguar ecology. Most large felids are broadly distributed and 386
inhabit different habitat types [2]. Habitat loss and increased human disturbance 387
have posed several threats to these species [2]. Our approach can help in providing 388
better information on the movement ecology of these species, resulting in an 389
important contribution to long-term conservation and management. 390
391
Jaguar residency 392
Several jaguars we tracked never established a home range. For juvenile 393
jaguars (< 3 years old), this may not be surprising [16]. But, we also discovered non-394
resident movement behavior in five adult jaguars (> 4 years old). Azevedo and 395
Murray (2007) [32] considered an animal ‘resident’ when it was observedtostay in 396
thesamearea for atleast 2 years. Such arbitrary classification may not be accurate. In 397
our study, we found a non-resident adult individual that had been monitored for 591 398
days (S1 Table). Consequently, time spent in an area is not adequate to estimate 399
home range and cannot explain how and why an individualuses space [55]. In 400
contrast, observing a clear asymptote in the variogram of an animal’s observed 401
movement track provides objective evidence of range residency [25,28]. 402
Recent research in movement ecology demonstrates that individuals of the 403
same species may exhibit different movement strategies under different 404
environmental conditions [56]. This seems to be well established for herbivores, such 405
as wildebeest, that can be migratory, nomadic or range resident [57,58]. Similar 406
behavioral and environmental plasticity have also been reported for carnivore 407
species such as lion [59], polar bear [60], wolverine [61], andwolf [62]. In our study, 408
we did not identify the underlying movement behavior of non-resident jaguars, 409

27
observed in jaguar collared in the Pantanal and the Caatinga biome. Non-resident 410
jaguar inhabiting the Pantanal exhibited a more directed linear movement path with 411
“short stops”. Non-resident jaguar inhabiting the Caatinga remained stationary for 412
long periods (2-3 months) before dispersing long distances (> 50 km) and returning 413
to their original location (data not shown). These movements could be described as 414
nomadic (as has been described for lions [59]) or potential migratory behavior. 415
Further investigation is required. 416
417
AKDE vs KDE 418
Our home range estimates using AKDE are larger than those reported in the 419
past and when compared with KDE estimates calculated on the same data (see 420
Tables 2 and 3). Although one might expect some variation in home range size when 421
monitoring different individuals [17,19,20,54], differences observed between previous 422
estimates are consistent and most likely represent the difference in how the 423
autocorrelation structure of the data was incorporated. Both MCP and KDE methods 424
ignore autocorrelation and have been proven to underestimate home range area 425
when used on autocorrelated tracking data [11,27]. AKDE accounts for 426
autocorrelation in the data and adjusts home range estimates accordingly (and with 427
appropriate confidence intervals) [32]. An accurate estimate of the home range can 428
result in vital insight into ecological processes[10]and provides a promising avenue 429
for further investigation. Most importantly, our estimates highlight that management 430
plans based on previouspublished results could severely underestimate the amount 431
of area required to adequately protect the species. 432
433

28
Males vsFemales 434
Ourfindingsthat male jaguar havelarger home ranges 435
thanfemalesisconsistentwithresultsfrompreviousstudiesof jaguar space 436
use[18,20,23]. A larger home range in terrestrial male carnivores has been 437
suggested to be bounded by the distribution of females and the need to increase 438
mating/reproductive opportunities [63]. Female home range size is known to be 439
shaped by the distribution of food availability, which is particularly important for 440
successful reproduction, including gestation and care of offspring [65]. Our findings 441
reinforce these observations, with female jaguar movement paths being 442
proportionally more tortuous (represented by smaller velocity autocorrelation 443
timescale)with smaller average distances traveled per day when compared with 444
males that are likely to take greater risks. 445
446
Differences in home range and movement across 447
areas with differing degrees of habitat loss and 448
human population density 449
450
Although differences in space use and movement have been reported for species 451
inhabiting different regions [56], this is the first study to report differential space use 452
and movement of jaguar across areas with different degrees of habitat loss and 453
human population density. Jaguars inhabiting the most disturbed biome, the Atlantic 454
Forest - with only 12% of habitat remaining and with high human population density, 455
resulted in large home range sizes and an increased average distance traveled. 456

29
Similarly, one jaguar inhabiting the Cerrado, a biome that has lost 50% of its natural 457
area [36], had the largest home range observed (1,268.6 km2). 458
We provide a broad overview of factors that can influence jaguar movement 459
decisions. At finer scales, several human activities such as livestock production, 460
poaching, and roads [52,64] influence jaguar space use and movement. Colchero et 461
al. (2011) [22] observed that human population density and roads have strong effects 462
on female jaguar movement decisions. Male jaguar, however, were less affected. In 463
our study, jaguar space use increased in areas with higher human population 464
presence and higher levels of habitat loss. While jaguar have been frequently 465
reported to prey on livestock [65], it is unclear if high livestock densities affect jaguar 466
movement decisions. Kanda (2015) [24], for example, observed that livestock did not 467
influence jaguar movement decisions. Instead, social interactions were reported to 468
be the main factor impacting jaguar movements. In our study, we were limited by the 469
resolution of the livestock density dataset (10km2) and therefore, did not evaluate the 470
response of jaguar to livestock. Incorporating a finer resolution dataset of livestock 471
density (< 1km2) combined with resource selection or step selection function analysis 472
[24] could be applied in future investigations (if available). 473
Movement distance is predicted to vary with spatial habitat pattern, increasing 474
across disturbed landscapes where risks increase [6]. As the Atlantic Forest and 475
Cerrado biomes continue to fragment, jaguars will likely have to travel longer 476
distances to locate mates and obtain resources. Increased home range size across 477
this lower quality habitat will most likely increase animals’ exposure to risk, including 478
increased vehicle collisions and poaching, and result in a situation often described as 479
an ecological trap [6]. 480
481
Conclusions 482

30
We compared home range size and movement behavior of jaguars monitored via 483
GPS collars across different temporal periods, unequal sampling intervals, and 484
varying autocorrelation structures. Two factors were critical for this achievement: 1) 485
the joint efforts of researchers working with the species across different sites in Brazil 486
and Argentina, resulting in the largest existing jaguar dataset with over 81,000 487
locations from 44 tracked individuals; and 2) the use of new analytical methods for 488
movement data.As hypothesized, we observed individual variability on space use 489
and movement, with male jaguars exhibiting larger home ranges, more directional 490
movements, and a higher probability of moving longer daily distances than females. 491
Jaguars inhabiting areas with higher human population size and higher levels of 492
habitat loss were also observed to have larger home rangesOur results fill a gap in 493
the knowledge of the species’ ecology and can contribute to long-term species 494
management and conservation. 495
496
Supporting Information 497
S1 TableList of the GPS collared jaguars with information on Biome, animal ID, sex 498
and estimated age (years), equipment used (tag brand and satellite system), 499
sampling protocol (time interval between locations), period of data collection, 500
coordinator and institution 501
502
Data Accessibility 503
Jaguars are listed as endangered or critically endangered in Brazil and Argentina. 504
They suffer high level of retaliation from ranchers, illegal hunting and tourism activity 505
31
across its distribution range [14]. Data, therefore, are highly sensitive. Raw data used 506
in analyses are available from the movebank database (https://www.movebank.org/) 507
for specific use and upon request to Ronaldo Gonçalves Morato 508
([email protected]), Agustin Paviolo ([email protected]), 509
EmilianoEsterciRamalho ([email protected]),Marina Motta Carvalho 510
([email protected]), Mario Haberfeld ([email protected]) and Fernando 511
Lima ([email protected]). Contact the lead author for information. 512
513
Acknowledgements 514
We thank Antonio Carlos Csermak Junior, Apolonio N. S. Rodrigues, Cristina Gianni, 515
Dale Anderson, Jorge LuizPegoraro, Ivan Carlos Baptiston, Leanes Silva, Paulo 516
Roberto Amaral, Paulo Baptista,PollyanaMotinha, Rafael Garay, Raphael Xavier, 517
Rogério Silva de Jesus,Silvano Gianni, Tarcizio Paula, ThiagoLuczinski, 518
ValdomiroLemos,Wendy Debbas and the members and volunteers of 519
ProyectoYaguaretefor supporting on animal capture and monitoring. 520
Studies were funded by FAPESP (2013-10029-6), Cat Heaven Endangered 521
Species-Project Survival, Dallas World Aquarium,Orient Express Hotels do Brasil, 522
WWF Switzerland-Fundacion Vida Silvestre Argentina, Panthera Foundation and 523
Rufford Small Grant Foundation. RGM fellowship was funded by FAPESP (2014-524
24921-0). JMC and CHF were supported by a US National Science Foundation 525
Grant (ABI 1458748 to JMC). CNPq (Brazilian Government Research Council) 526
provided a research grant for MiltonCezarRibeiro (312045/2013-1), who also thanks 527
FAPESP (process 2013/50421-2) for their financial support. 528
529

32
Author Contributions 530
Conceptualization: RGM, JAS, PL. 531
Formal Analysis: RGM, JAS, PL, CHF, JMC. 532
Data Curation: RGM, AP, EER, MMC, MH, FL 533
Funding Acquisition: RGM, AP, CA, MSB, FL, LC, DAS, EER, MMC, MXS, MH, PL, 534
JMC 535
Investigation: RGM, RCP, KMPMF, DLZK, SSM, TDCP, GRA, AP, CA, MSB, PC, FL, 536
LC, DAS, EER, MMC, FHSS, BZ, MXS, MDFM, AV, JAM, MH, LR, LS, MCR. 537
Methodology: RGM, JAS, PL, CHF, JMC 538
Project Administration: RGM 539
Supervision: PL 540
Writing- Original Draft Preparation: RGM, JAS, CHF, JMC, RCP, KMPMF, DLZK, 541
SSM, TDCP, GRA, AP, CA, MSB, PC, FL, LC, DAS, EER, MMC, FHSS, BZ, MXS, 542
MDFM, AV, JAM, MH, LR, LS, MCR and PL 543
Writing- Review & Editing: RGM, JAS, MCR, PL 544
545
References 546
1. Chapman B, Hulthen K, Wellenreuther M, Hansson L-A, Nilsson JÅ, Bronmark 547
C. Patterns of animal migration. In: Hansson L-A, Akesson S, editors. Animal 548
movement across scales. 1st ed. Oxford: Oxford University Press; 2014. pp. 549
11–30. 550
2. Nowell K, Jackson P. Wild cats. Status Survey and Conservation Action Plan. 551
IUCN, Gland Switzerland. 1996; 110–113. doi:10.1023/A:1008907403806 552

33
3. Macdonald DW. The ecology of carnivore social behaviour. Nature. 1983;301: 553
379–384. 554
4. Crooks KR. Relative sensitivities of mammalian carnivores to habitat 555
fragmentation. Conserv Biol. 2002;16: 488–502. 556
5. Cardillo M, Purvis A, Sechrest W, Gittleman JL, Bielby J, Mace GM. Human 557
population density and extinction risk in the world’s carnivores. PLoS Biol. 558
2004; doi:10.1371/journal.pbio.0020197 559
6. Fahrig L. Non-optimal animal movement in human-altered landscapes. Funct 560
Ecol. 2007;21: 1003–1015. doi:10.1111/j.1365-2435.2007.01326.x 561
7. Nathan R. An emerging movement ecology paradigm. Proc Natl Acad Sci U S 562
A. 2008;105: 19050–19051. doi:10.1073/pnas.0808918105 563
8. Chetkiewicz C-LB, Boyce MS. Use of resource selection functions to identify 564
conservation corridors. J Appl Ecol. 2009;46: 1036–1047. doi:10.1111/j.1365-565
2664.2009.01686.x 566
9. Rodríguez-Soto C, Monroy-Vilchis O, Maiorano L, Boitani L, Faller JC, Briones 567
MÁ, et al. Predicting potential distribution of the jaguar (Panthera onca) in 568
Mexico: Identification of priority areas for conservation. Divers Distrib. 569
2011;17: 350–361. doi:10.1111/j.1472-4642.2010.00740.x 570
10. Horne JS, Garton EO. Selecting the best home range model: An information-571
theoretic approach. Ecology. 2006;87: 1146–1152. 572
11. Fleming CH, Fagan WF, Mueller T, Olson KA, Leimgruber P, Calabrese JM. 573
Rigorous home range estimation with movement data: a new autocorrelated 574
kernel density estimator. Ecology. 2015;96: 1182–1188. doi:10.1890/14-575
2010.1 576
12. Sanderson EW, Redford KH, Chetkiewicz C-LB, Medellin RA, Rabinowitz AR, 577
Robinson JG, et al. Planning to Save a Species: the Jaguar as a Model. 578
Conserv Biol. 2002;16: 1–15. 579
13. Caso A, Lopez-Gonzalez C, Payan E, Eizirik E, de Oliveira T, Leite-Pitman R, 580
et al. Panthera onca. In: The IUCN Red List of Threatened Species [Internet]. 581
2008 [cited 8 Dec 2015] p. e.T15953A5327466. Available: 582
http://dx.doi.org/10.2305/IUCN.UK.2008.RLTS.T15953A5327466.en. 583
14. Morato RG, Beisiegel BDM, Ramalho EE, Boulhosa LRP. Avaliação do risco 584
de extinção da onça-pintada Panthera onca (Linnaeus, 1758) no Brasil. 585
Biodiversidade Bras. 2013;3: 122–132. 586
15. G A, E C, De Angelo C, Di Bitetti MS, Lucherini M, Muzzachiodi N, et al. 587
Familia: Felidae. In: Ojeda R., Chillo V, Isenrath G, editors. Libro Rojo de 588
Mamiferos Amenazados de la Argentina. 1st ed. Mendoza: SAREM; 2012. pp. 589
92–101. 590
16. Schaller GB, Crawshaw PGJ. Movement Patterns of Jaguar. Biotropica. 591

34
1978;12: 161–168. doi:10.2307/2387967 592
17. Rabinowitz AR, Nottingham, Jr. BG. Ecology and behaviour of the Jaguar 593
(Panthera onca) in Belize, Central America. Journal of Zoology. 1986. pp. 594
149–159. 595
18. Astete S, Sollmann R, Silveira L. Comparative Ecology of Jaguars in Brazil. 596
CAT News. 2007; 9–14. 597
19. de Azevedo FCC, Murray DL. Spatial organization and food habits of jaguars 598
(Panthera onca) in a floodplain forest. Biol Conserv. 2007;137: 391–402. 599
doi:10.1016/j.biocon.2007.02.022 600
20. Cavalcanti SMC, Gese EM. Spatial ecology and social interactions of jaguars 601
(Panthera onca) in the southern Pantanal, Brazil. J Mammal. 2009;90: 935–602
945. doi:10.1644/08-MAMM-A-188.1 603
21. Conde DA, Colchero F, Zarza H, Christensen NL, Sexton JO, Manterola C, et 604
al. Sex matters: Modeling male and female habitat differences for jaguar 605
conservation. Biol Conserv. 2010;143: 1980–1988. 606
doi:10.1016/j.biocon.2010.04.049 607
22. Colchero F, Conde D a., Manterola C, Chávez C, Rivera a., Ceballos G. 608
Jaguars on the move: Modeling movement to mitigate fragmentation from road 609
expansion in the Mayan Forest. Anim Conserv. 2011;14: 158–166. 610
doi:10.1111/j.1469-1795.2010.00406.x 611
23. Sollmann R, Furtado MM, Gardner B, Hofer H, Jácomo ATA, Tôrres NM, et al. 612
Improving density estimates for elusive carnivores: Accounting for sex-specific 613
detection and movements using spatial capture–recapture models for 614
jaguars in central Brazil. Biol Conserv. 2011;144: 1017–1024. 615
doi:10.1016/j.biocon.2010.12.011 616
24. Kanda Z. Ecologia do movimento e dinâmica espaço-temporal da onça 617
pintada no Pantanal sul do Brasil. Universidade Estadual de São Paulo. 2015. 618
25. Calabrese JM, Fleming CH, Gurarie E. Ctmm : an R Package for Analyzing 619
Animal Relocation Data As a Continuous-Time Stochastic Process. Methods 620
Ecol Evol. 2016; doi:10.1111/2041-210X.12559 621
26. Fleming CH, SubaşI Y, Calabrese JM. Maximum-entropy description of animal 622
movement. Phys Rev E - Stat Nonlinear, Soft Matter Phys. 2015;91: 1–6. 623
doi:10.1103/PhysRevE.91.032107 624
27. Fleming CH, Calabrese JM, Mueller T, Olson K a, Leimgruber P, Fagan WF. 625
From fine-scale foraging to home ranges: a semivariance approach to 626
identifying movement modes across spatiotemporal scales. Am Nat. 2014;183: 627
E154-67. doi:10.1086/675504 628
28. Fleming CH, Calabrese JM, Mueller T, Olson KA, Leimgruber P, Fagan WF. 629
Non-Markovian maximum likelihood estimation of autocorrelated movement 630

35
processes. Methods Ecol Evol. 2014;5: 462–472. doi:10.1111/2041-631
210X.12176 632
29. Blackwell PG, Niu M, Lambert MS, Lapoint SD. Exact Bayesian inference for 633
animal movement in continuous time. Methods Ecol Evol. British Ecological 634
Society; 2016;7: 184–195. 635
30. Crawshaw Jr. PG. Comparative ecology of ocelot (Felis pardalis) and jaguar 636
(Panthera onca) in a protected subtropical forest in Brazil and Argentina. 637
University of Florida. 1995. 638
31. Cullen Jr. L, Abreu KC De, Sana D, Nava AFD. As onças-pintadas como 639
detetives da paisagem no corredor do Alto Paraná, Brasil. Nat e Conserv. 640
2005;3: 43–58. 641
32. de Azevedo FCC, Murray DL. Spatial organization and food habits of jaguars 642
(Panthera onca) in a floodplain forest. Biol Conserv. 2007;137: 391–402. 643
doi:10.1016/j.biocon.2007.02.022 644
33. Silveira L. Ecologia comparada e conservação da onça-pintada (Panthera 645
onca) e onça-parda (Puma concolor), no Cerrado e Pantanal [Internet]. 646
Universidade de Brasília. University of Brasilia. 2004. Available: 647
http://scholar.google.com/scholar?hl=en&btnG=Search&q=intitle:Ecologia+co648
mparada+e+conserva??o+da+on?a-pintada+(Panthera+onca)+e+on?a-649
parda+(Puma+concolor),+no+Cerrado+e+Pantanal#0 650
34. Ribeiro MC, Metzger JP, Martensen AC, Ponzoni FJ, Hirota MM. The Brazilian 651
Atlantic Forest: How much is left, and how is the remaining forest distributed? 652
Implications for conservation. Biol Conserv. Elsevier Ltd; 2009;142: 1141–653
1153. doi:10.1016/j.biocon.2009.02.021 654
35. Leal I, Silva J, Tabarelli M, Lacre Jr. T. Mudando o curso da conservação da 655
biodiversidade na Caatinga do Nordeste do Brasil. Megadiversidade. 2005;1: 656
139–146. 657
36. Machado RB, Neto MGP, Caldas EF, Gonçalves D a., Santos N a., Tabor K, 658
et al. Estimativas de perda da área do Cerrado brasileiro. … Int do Bras …. 659
2004; 1–23. doi:10.1590/S0104-42302007000600013 660
37. Robinson TP, William Wint GR, Conchedda G, Van Boeckel TP, Ercoli V, 661
Palamara E, et al. Mapping the global distribution of livestock. PLoS One. 662
2014;9. doi:10.1371/journal.pone.0096084 663
38. Morato RG, Conforti V a., Azevedo FC, Jacomo a. T a, Silveira L, Sana D, et 664
al. Comparative analyses of semen and endocrine characteristics of free-living 665
versus captive jaguars (Panthera onca). Reproduction. 2001;122: 745–751. 666
doi:10.1530/reprod/122.5.745 667
39. Balme GA, Slotow R, Hunter LTB. Impact of conservation interventions on the 668
dynamics and persistence of a persecuted leopard (Panthera pardus) 669
population. Biol Conserv. Elsevier Ltd; 2009;142: 2681–2690. 670

36
doi:10.1016/j.biocon.2009.06.020 671
40. Sikes R, Gannon W, Mammalogists TAC and UC of the AS of. Guidelines of 672
the American Society of Mammalogist for the use of wild mammals in 673
research. J Mammal. 2011;1: 235–253. 674
41. Fleming CH, Calabrese JM. ctmm: Continuous-Time Movement Modeling. R 675
package version 0.2.8. [Internet]. CRAN; 2015. Available: 676
http://cran.jellyfish.lol/web/packages/ctmm/index.html 677
42. R Development Core Team R. R: A Language and Environment for Statistical 678
Computing [Internet]. Team RDC, editor. R Foundation for Statistical 679
Computing. R Foundation for Statistical Computing; 2011. p. 409. 680
doi:10.1007/978-3-540-74686-7 681
43. Akaike H. A new look at the statistical model identification. IEEE Trans Autom 682
Control. 1974;19: 716–723. doi:10.1109/TAC.1974.1100705 683
44. Kéry M. Introduction to WinBUGS for Ecologists: A Bayesian approach to 684
regression, ANOVA, mixed models and related analyses. First Edit. Academic 685
Press; 2010. 686
45. McCarthy MA. Bayesian Methods for Ecology. Cambridge, New York, 687
Melbourne, Madrid, Cape Town, Singapore, Sau Paulo: Cambridge University 688
Press; 2007. 689
46. Royston P. The W test for normality. Appl Stat. 1982; 176–180. 690
47. Gelman A, Rubin D. Inference from iterative simulation using multiple 691
sequences. Stat Sci. 1992;7: 457–511. 692
48. Gelman a, Hill J. Data analysis using regression and multilevel/hierarchical 693
models. Policy Anal. 2007; 1–651. doi:10.2277/0521867061 694
49. Plummer M, Best N, Cowles K, Vines K. Coda: Output analysis and 695
diagnostics for MCMC. 2010. 696
50. Bright EA, Coleman PR, Rose AN, Urban ML. LandScan 2011. Digit dataset, 697
Oakridge Natl Lab Oakridge, TN, USA, web ornl gov/sci/landscan/index shtml. 698
2012; 699
51. Liu J, Taylor WW, Ouyang Z, Groop R, Tan Y, Zhang H. A framework for 700
evaluating the effects of human factors on wildlife habitat: The case of giant 701
pandas. Conserv Biol. 1999;13: 1360–1370. doi:10.1046/j.1523-702
1739.1999.98418.x 703
52. De Angelo C, Paviolo A, Wiegand T, Kanagaraj R, Di Bitetti MS. 704
Understanding species persistence for defining conservation actions: A 705
management landscape for jaguars in the Atlantic Forest. Biol Conserv. 706
2013;159: 422–433. doi:10.1016/j.biocon.2012.12.021 707
53. McCarthy M. Bayesian methods for ecology [Internet]. 1st ed. McCarthy MA, 708

37
editor. Chemistry & biodiversity. New York: Cambridge University Press; 2007. 709
doi:10.1017/CBO9780511802454 710
54. Crawshaw PG, Quigley HB. Jaguar spacing, activity and habitat use in a 711
seasonally flooded environment in Brazil. J Zool. 1991;223: 357–370. 712
Available: http://doi.wiley.com/10.1111/j.1469-7998.1991.tb04770.x 713
55. Powell RA, Mitchell MS. What is a home range? J Mammal. 2012;93: 948–714
958. doi:10.1644/11-MAMM-S-177.1 715
56. Singh NJNNJ, Börger L, Dettki H, Bunnefeld N, Ericsson G, Borger L, et al. 716
From migration to nomadism: Movement variability in a northern ungulate 717
across its latitudinal range. Ecol Appl. 2012;22: 2007–2020. doi:10.1890/12-718
0245.1 719
57. Boone RB, Thirgood SJ, Hopcraft JGC. Serengeti wildebeest migratory 720
patterns modeled from rainfall and new vegetation growth. Ecology. 2006;87: 721
1987–1994. 722
58. Stabach JA, Wittemyer G, Boone RB, Reid RS, J.S. Worden. Variation in 723
habitat selection by white-bearded wildebeest across different degrees of 724
human disturbance. Ecosphere. 2016; 725
59. Schaller GB. The Serengeti lion: A study of predator-prey relations [Internet]. 726
University of Chicago, Chicago, Illinois, USA. University of Chicago Press; 727
1976. doi:10.2307/1296618 728
60. Mauritzen M, Derocher AE, Oysten W. Space-use strategies of female polar 729
bears in a dynamic sea ice habitat. Can J Zool. 2001;79: 1704–1713. 730
61. May R, van Dijk J, Landa A, Andersen R, Andersen R. Spatio-temporal 731
ranging behaviour and its relevance to foraging strategies in wide-ranging 732
wolverines. Ecol Modell. 2010;221: 936–943. 733
doi:10.1016/j.ecolmodel.2009.12.024 734
62. Kittle AM, Anderson M, Avgar T, Baker JA, Brown GS, Hagens J, et al. Wolves 735
adapt territory size, not pack size to local habitat quality. J Anim Ecol. 2015;84: 736
1177–1186. doi:10.1111/1365-2656.12366 737
63. Mikael S. The mating tactics and spacing patterns of solitary carnivores. In: 738
Gittleman JL, editor. Carnivore behavior, ecology, and evolution. 1st ed. New 739
York: Cornell University Press; 1989. pp. 164–182. doi:10.1007/978-1-4757-740
4716-4_7 741
64. De Angelo C, Paviolo A, Di Bitetti M. Differential impact of landscape 742
transformation on pumas (Puma concolor) and jaguars (Panthera onca) in the 743
Upper Paraná Atlantic Forest. Divers Distrib. 2011;17: 422–436. 744
doi:10.1111/j.1472-4642.2011.00746.x 745
65. Carvalho E a. R, Zarco-González MM, Monroy-Vilchis O, Morato RG. 746
Modelling the risk of livestock depredation by jaguar in the Transamazon 747

38
Highway, Brazil. Basic Appl Ecol. Elsevier GmbH; 2015;16: 413–419. 748
doi:10.1016/j.baae.2015.03.005 749
750
39
751
752

40
7
53
75
4
01
23
4
0 2 4 6 8
A
Tim
e−lag (m
onths)
Semi−variance (square kilometers)
02
46
810
0 20 40 60 80
B
Tim
e−lag (m
onths)
Semi−variance (square kilometers)

755
756
41

757
758
42

43
759
760

44
Capítulo 2 761
762
Artigo em preparação para submissão ao periódico Ecography 763
764
Functional response and limiting factors in habitat selection by a top predator: the 765
jaguar as a model 766
767
Morato RG1, 2, 3*§, Stabach JA2*, Connette G2, Wittemyer G4, Calabrese JM2, De 768
Paula RC1, 3, Ferraz KMPM3, 5, Kantek DLZ6, Miyazaki SS6, Pereira TDC6, Araujo 769
GR7, Paviolo A8, De Angelo C8, Di Bitetti MS8, Cruz P8, Lima F9, 10, Cullen L9, Sana 770
DA3, Ramalho EE3, 11, Carvalho MM12, Soares, FHS12, Zimbres B13,Xavier MS14, 771
Moraes, MDF14, VogliottiA3,15, May Jr JA16, Haberfeld M16, Rampim L16, Sartorello L16, 772
Abade, LR17, Ribeiro MC10, Leimgruber P2 773
774
1 Centro Nacional de Pesquisa e Conservação de Mamíferos Carnívoros, Instituto 775
Chico Mendes de Conservação da Biodiversidade, Atibaia, SP, Brazil. 776
2Conservation Ecology Center, Smithsonian Conservation Biology Institute, National 777
Zoological Park, Front Royal, VA, USA. 778
3 Instituto Pró-Carnívoros, Atibaia, SP, Brazil. 779
4 Department of Fish, Wildlife and Conservation Biology, Colorado State University, 780
CO, USA. 781
5 Escola Superior de Agricultura “Luiz de Queiroz”, Universidade de São Paulo, 782
Piracicaba, Brazil. 783
45
6 Estação Ecológica Taiamã, Instituto Chico Mendes de Conservação da 784
Biodiversidade, Cáceres, MT, Brazil 785
7Departamento de Medicina Veterinária, Universidade Federal de Viçosa, Viçosa, 786
MG, Brazil 787
8Instituto de Biología Subtropical, Universidad Nacional de Misiones and CONICET, 788
Puerto Iguazú, Argentina. 789
9 IPÊ – Instituto de Pesquisas Ecológicas, Nazaré Paulista, SP, Brazil 790
10 Laboratório de Ecologia Espacial e Conservação, Instituto de Biociências, 791
Univesidade Estadual de São Paulo, Rio Claro, SP, Brazil. 792
11Instituto de DesenvolvimentoSustentávelMamirauá, Tefé, AM,Brazil. 793
12Instituto de Defesa e Preservação dos Felídeos Brasileiros, Corumbá de Goiás, 794
Go, Brazil. 795
13 Programa de Pós Graduação em Zoologia, Instituto de Ciências Biológicas, 796
Universidade de Brasília, DF, Brazil. 797
14Projeto Carnívoros do Iguaçu, Parque Nacional do Iguaçu, Instituto Chico Mendes 798
de Conservação da Biodiversidade, Foz do Iguaçu, PR, Brazil. 799
15 Universidade Federal da Integração Latino-Americana, Foz do Iguaçu, PR, Brazil. 800
16 Projeto Onçafari, Miranda, MS, Brazil 801
17University of Oxford, Oxford, UK 802
* These authors contributed equally to this work 803
§ Corresponding author: [email protected] 804
805

46
1 Briefing 806
In this study, wefirst developed habitat selection models at the scale of the 807
home range (second order selection) that include factors jaguars are known or 808
suspected to respond to: 1) human presence(Conde et al. 2010, De Angelo et al. 809
2011); 2) livestock presence(Zarco-González et al. 2013, Carvalho et al. 2015); 810
3)forest coverage(De Angelo et al. 2011, Morato et al. 2014); 4)water(De Angelo et 811
al. 2011), and; 5) roads (Colchero et al. 2011, De Angelo et al. 2013). Second, we 812
developed habitat selection models within the home range (third and fourth order 813
selection)using the same habitat covariates. We had two main objectives: 1) to 814
quantify the spatial functional response, and; 2) to identify limiting factors at home 815
range and foraging scales. In both cases, we used a full model with individual and 816
study site as random effect to examine how the habitat selection coefficients 817
changed as a function of resource availability either at coarse or fine scale. Due to 818
limited data available we did not account for seasonal variation in the resource 819
availability or space use (Cavalcanti and Gese 2009). 820
Specifically, at home range scale; we expect a negative functional response 821
to human presence with jaguars avoiding contact with humans in areas with high 822
human population density, while showing indifference in areas with low human 823
population density. We also expect a negative functional response to water and 824
forest coverage for jaguars inhabiting arid areas, e.g., resource selection will 825
increase despite the low availability of these resources. Road is expected to exert a 826
negative response on jaguars. Finally, we expect a positive functional response to 827
livestock presence with higher encounter rates as a function of high livestock density. 828
At home range scale we expect human population density to be the limiting 829
factor for jaguars’ selection, while at fine scale (foraging) we expect jaguars’ 830
selection of forest coverage to be the most important. 831

47
2 Preliminary results 832
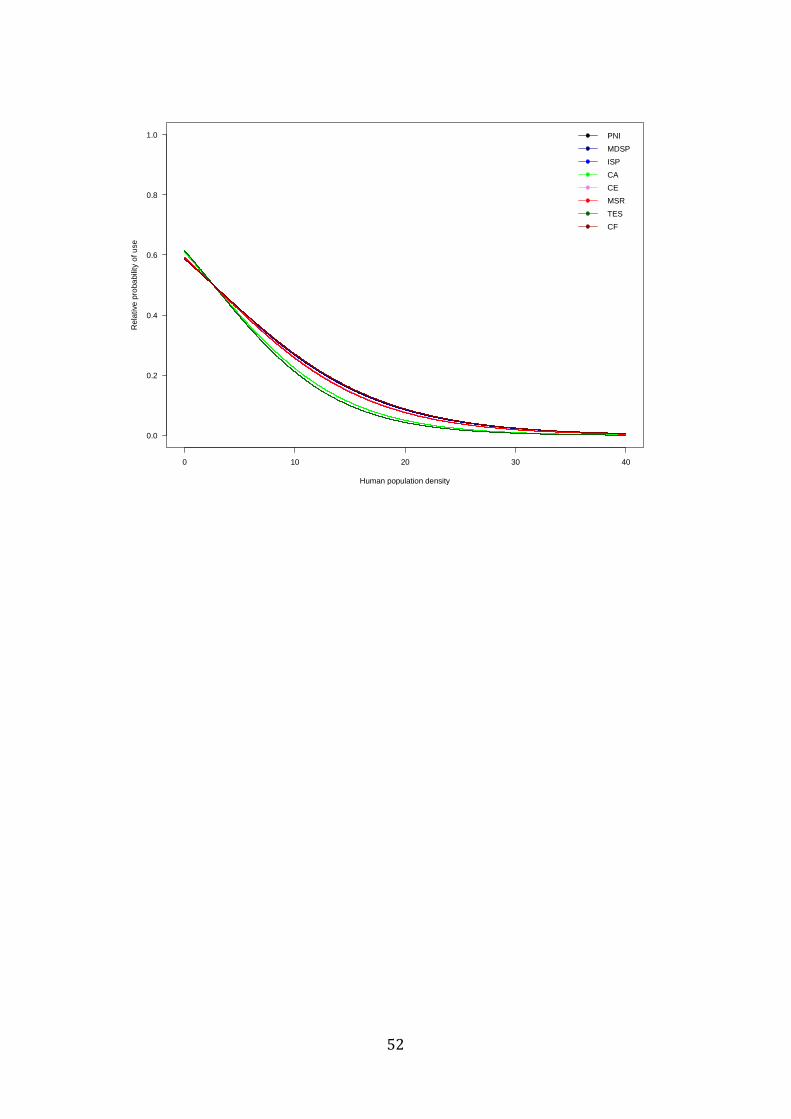
We confirmed that jaguars negatively respond to human presence while the 833
species, in general, selected areas with high percentage of forest coverage (Figure 1 834
and 2), however it is important to mention that response varied between individuals 835
and study site. We did not find any trend of species’ response to livestock density, 836
distance to roads and distance to rivers(Figure 3). In general, we observed a 837
functional response since changes in the landscape structure resultedin changes in 838
the use of specific habitat by the species. Also we observed differences between 839
individuals at the same study site. 840
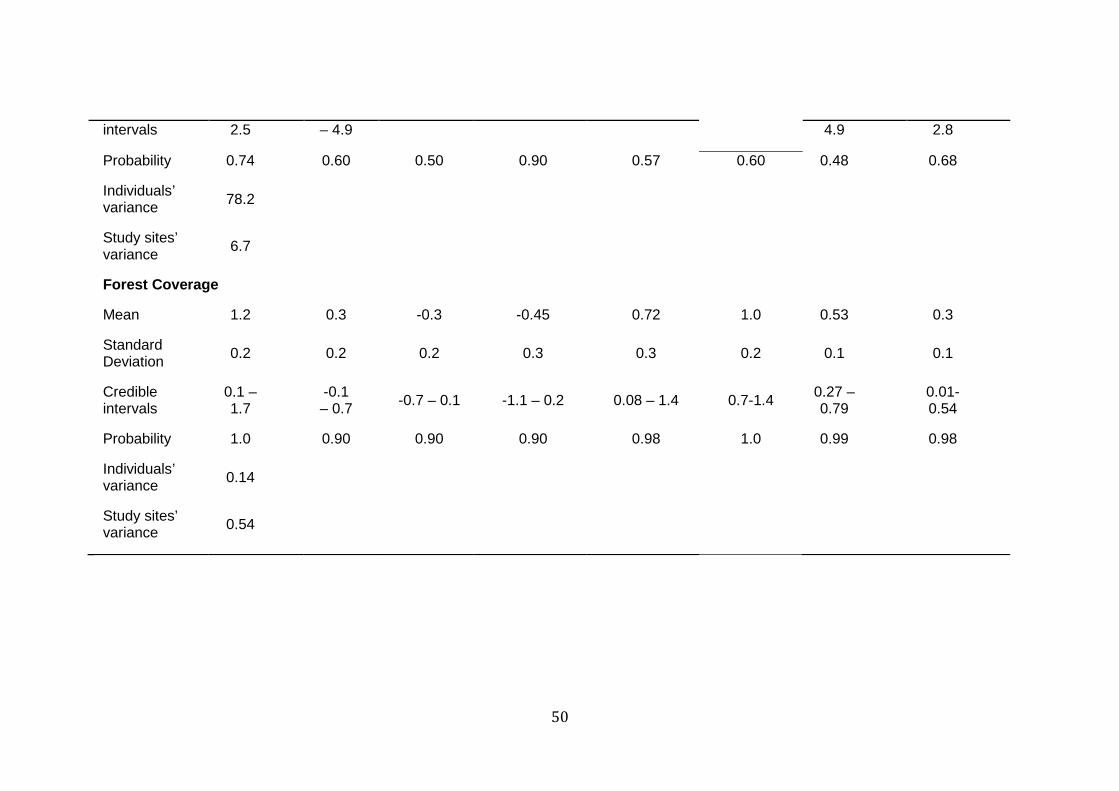
At home range scale human population density is the main limiting factor for 841
the species’ habitat selection followed by forest coverage (Table 1). At foraging scale 842
forest coverage was identified as the main limiting factor (Figure 4). This result 843
reinforces the ideia that the hierarchy of a habitat selection for an individual of any 844
species should reflect the hierarchy of factors limiting an individual’s fitness 845

48
Table 1 Parameter coefficients of the variables analyzed for each study site at home range scale. Mean, standard deviation, 95% credible intervals, proportion of the posterior that has the same signal of the mean (probability), individuals’ variance and study sites’ variance.
Parameters Iguacu/
Iguazu
Morro do Diabo Invinhema Caatinga Cerrado Amazonia Taiama Caiman
Population density
Mean -8.4 -8.4 -8.7 -10.4 -8.7 -8.8 -11.0 -8.2
Standard Deviation 4.4 4.5 5.0 8.3 5.3 4.2 11.0 4.4
Credible intervals
-17.1 -0.5
-17 - -0.2 -20 - -0.5 -32 - -1.3 -20 - -0.1 -17.8 - -1.2 -42.8 -
-1.5 -17.1 –
0.01
Probability 0.98 0.97 0.98 0.98 0.98 0.99 0.99 0.98
Individuals’ variance 295.3
Study sites’ variance 33.5
Livestock density
Mean 0.91 0.98 0.90 0.86 0.90 3.3 1.0 1.1
Standard Deviation 5.1 5.2 5.3 5.2 5.4 6.1 5.0 5.1
Credible intervals
-10 – 12
-9.9 – 12 -9.9 – 12.2 -11 – 12 -10 – 12 -9.2 – 15.9 -9.7 –
12.1 -9.5 – 11.9

49
Probability 0.50 0.50 0.45 0.60 0.51 0.73 0.48 0.61
Individuals’ variance 913.4
Study sites’ variance 13.9
Distance to Rivers
Mean -1.2 -1.1 -0.6 -0.8 -0.18 -0.23 -7.4 -1.1
Standard Deviation 0.8 0.9 1.0 1.2 1.6 0.7 0.7 0.6
Credible intervals
-3 – 0.5
-2.9 – 0.7 -2.6 – 1.5 -3.2 – 1.7 -3.3 – 3.0 -1.6 – 1.1 -8.8 - -
6.0 -2.3 –
0.2
Probability 0.93 0.88 0.71 0.73 0.55 0.63 1.0 0.95
Individuals’ variance 3.6
Study sites’ variance 0.14
Distance to Roads
Mean -1.9 -0.2 0.50 -0.50 -0.02 0.37 0.15 -0.93
Standard Deviation 3.1 2.2 2.8 2.5 2.8 3.2 2.0 2.0
Credible -10 – -4.4 -3.9 – 7.9 -5.7 – 0.2 4.9 – 6.7 -6.7 – 6.0 -3.5 – -5.5 –
50
intervals 2.5 – 4.9 4.9 2.8
Probability 0.74 0.60 0.50 0.90 0.57 0.60 0.48 0.68
Individuals’ variance 78.2
Study sites’ variance 6.7
Forest Coverage
Mean 1.2 0.3 -0.3 -0.45 0.72 1.0 0.53 0.3
Standard Deviation 0.2 0.2 0.2 0.3 0.3 0.2 0.1 0.1
Credible intervals
0.1 – 1.7
-0.1 – 0.7 -0.7 – 0.1 -1.1 – 0.2 0.08 – 1.4 0.7-1.4 0.27 –
0.79 0.01-0.54
Probability 1.0 0.90 0.90 0.90 0.98 1.0 0.99 0.98
Individuals’ variance 0.14
Study sites’ variance 0.54

51
Figure 1 Relative probability of use in relation to human population density at each study site. Iguaçu National Park (PNI), Morro do Diabo State Park (MDSP), Invinhema State Park (ISP), Caatinga (CA), Cerrado (CE), Mamirauá Sustainable Reserve (MSR), Taiama Ecological Station (TES) and Caiman Farm (CF).
Figure 2 Relative probability of use in relation to forest coverage at each study site. Iguaçu National Park (PNI), Morro do Diabo State Park (MDSP), Invinhema State Park (ISP), Caatinga (CA), Cerrado (CE), Mamirauá Sustainable Reserve (MSR), Taiama Ecological Station (TES) and Caiman Farm (CF).
Figure 3 Functional responses in habitat selection (home range scale) for jaguars. Selection coefficients were estimated for each individual using a discrete choice analysis with individual and study site as random effect. Iguaçu National Park (PNI), Morro do Diabo State Park (MDSP), Invinhema State Park (ISP), Caatinga (CA), Cerrado (CE), Mamirauá Sustainable Reserve (MSR), Taiama Ecological Station (TES) and Caiman Farm (CF).
Figue 4 Response in habitat selection for jaguars at foraging scale. Selection coefficients were estimated for each individual using a discrete choice analysis with individual and study site as random effect. Iguaçu National Park (PNI), Morro do Diabo State Park (MDSP), Invinhema State Park (ISP), Caatinga (CA), Cerrado (CE), Mamirauá Sustainable Reserve (MSR), Taiama Ecological Station (TES) and Caiman Farm (CF).
52
0 10 20 30 40
0.0
0.2
0.4
0.6
0.8
1.0
Human population density
Rel
ativ
e pr
obab
ility
of u
sePNI
MDSP
ISP
CA
CE
MSR
TES
CF

53
0 20 40 60 80 100
0.0
0.2
0.4
0.6
0.8
1.0
Forest Coverage
Rel
ativ
e pr
obab
ility
of u
se
PNI
MDSP
ISP
CA
CE
MSR
TES
CF

54
0 10 20 30 40
−100
−50
0
50
PNI MDSP ISP CA CE MSR TES CF
Human Population Density
0 10 20 30 40
−200
−100
0
100
200
PNI MDSP ISP CA CE MSR TES CF
Livestock Density
0 10 20 30 40
−30
−20
−10
0
10
PNI MDSP ISP CA CE MSR TES CF
Distance to Rivers
0 10 20 30 40
−40
−20
0
20
PNI MDSP ISP CA CE MSR TES CF
Distance to Roads
0 10 20 30 40
−4
−2
0
2
4
6
PNI MDSP ISP CA CE MSR TES CF
Forest Coverage
Individual Jaguars_Home Range_Random Effects

55
0 10 20 30 40
−0.4
−0.2
0.0
0.2
0.4
PNI MDSP ISP CA CE MSR TES CF
Human Population Density
0 10 20 30 40
−1.0
−0.5
0.0
0.5
1.0
PNI MDSP ISP CA CE MSR TES CF
Livestock Density
0 10 20 30 40
−3
−2
−1
0
1
PNI MDSP ISP CA CE MSR TES CF
Distance to Rivers
0 10 20 30 40
−2
−1
0
1
2
PNI MDSP ISP CA CE MSR TES CF
Distance to Roads
0 10 20 30 40
−1
0
1
2
PNI MDSP ISP CA CE MSR TES CF
Forest Coverage
Individual Jaguars_Foraging_Random Effects
56
Capítulo 3
Resumos de Congresso:
VII Seminário de Pesquisa e VII Encontro de Iniciação Científica do ICMBio
12-15 de setembro de 2016
Apresentação de Poster:
1) Ela é grande o suficiente? Importância da amplia ção da Estação Ecológica Taiamã e efetivação de corredores de dispersão para a manutenção de uma população mínima viável de onças pintadas ( Pantheraonca).
Ronaldo Gonçalves Morato1 ([email protected]), Daniel Luiz Zanela Kantek2 ([email protected]), Rogerio Cunha de Paula1 ([email protected]), Selma S Myizaki2 ([email protected]), ThadeuDeLuque Pereira2 ([email protected]), Gediendeson Riberio Araújo3 ([email protected]).
1-Centro Nacional de Pesquisa e Conservação de Mamíferos Carnívoros(ICMBio), Estrada Municipal HisaichiTakebayashi, 8600 - Bairro da Usina, CEP: 12.952-011, Atibaia, SP, 2-Estação Ecológica Taiamã, Cáceres-MT, 3- Departamento de Medicina Veterinária, Universidade Federal de Viçosa, Viçosa-MG.
2) Padrões de Movimentação da Onça Pintada ( Patheraonca) no Parque Nacional da Serra da Capivara - PI.
Danieli Ribeiro, Julia Emi de Faria Oshima1, Milton Cezar Ribeiro1, Gediendson Ribeiro de Araujo2, Silvia Neri Godoy3, Rogerio Cunha de Paula3, Ronaldo Gonçalves Morato3
1-Laboratório de Ecologia Espacial e Conservação, Departamento de Ecologia, Instituto de Biociências, Universidade Estadual Paulista “Júlio de Mesquita Filho” (UNESP), Campus Rio Claro, Av. 24-A, 1515, CEP 13506-900, Rio Claro, SP.2-Departamento de Medicina Veterinária, Universidade Federal de Viçosa, Viçosa, MG. 3-Centro Nacional de Pesquisa e Conservação de Mamíferos Carnívoros(ICMBio), Estrada Municipal HisaichiTakebayashi, 8600 - Bairro da Usina, CEP: 12.952-011, Atibaia, SP.
Apresentação de Oral: 1o colocado: melhor trabalho de iniciação científica
3) Seleção de habitat de Pantheraonca (Linnaeus, 1758) em uma paisagem heterogênea no Pantanal sul matogrossense

57
Patrícia Kalaf Alves dos Santos1, Julia Emi de Faria Oshima1, Milton Cezar Ribeiro1, Claudia Zukeran Kanda1, Mario Haberfeld2, Lilian Rampin2, Leonardo Sartorello2, Rogerio Cunha de Paula3, Silvia Neri Godoy3,Ronaldo Gonçalves Morato3
1-Laboratório de Ecologia Espacial e Conservação, Departamento de Ecologia, Instituto de Biociências, Universidade Estadual Paulista “Júlio de Mesquita Filho” (UNESP), Campus Rio Claro, Av. 24-A, 1515, CEP 13506-900, Rio Claro, SP. 2-Projeto Onçafari, Refúgio Ecológico Caiman. 3-Centro Nacional De Pesquisa e Conservação De Mamíferos Carnívoros (ICMBio), Estrada Municipal HisaichiTakebayashi, 8600 - Bairro da Usina, CEP: 12.952-011, Atibaia, SP.
Resumo de Congresso:
23rd The WildlifeSocietyConference
October 17-20 2016
Oral presentation:
1) Differences in Jaguar Movementand Home Range SizeAccrossVariedLandscapes in Braziland Argentina.
Morato RG1, 2, 3*, Stabach JA2, Leimgruber P2, Fleming CH2, Calabrese JM2, De Paula RC1, 3, Kantek D4, Onuma S4, De Luque T4, Araujo G5, Paviolo A6, De Angelo C6, Di Bitetti M6, Cruz P6, Ramalho EE3, 7, Carvalho MM8, Xavier MS9, May Jr J10, Haberfeld M10, Rampim L10, Sartorello L10, Sana DA3, Lima F11, Cullen L11, Ferraz, KMPM12
1CENAP-ICMBio, 2CEC-SCBI, 3Instituto Pró-Carnívoros, 4Estação EcológicaTaiamã-ICMBio, 5UFV, 6IBS-CONICET, 7Instituto Mamirauá, 8NEX, 9Parque Nacional do Iguaçu-ICMBio, 10Projeto Onçafari, 11IPE, 12ESALQ-USP.