Embed Size (px)
Citation preview

rsc.li/jaas
As featured in:
See Matthias Friebel et al., J. Anal. At. Spectrom., 2020, 35, 273.
Showcasing research from Professor Schönbächler’s laboratory, Department of Earth Sciences, ETH Zurich, Switzerland.
Effi cient separation and high-precision analyses of tin and cadmium isotopes in geological materials
We developed a new method for high-precision Cd and Sn isotope analyses including the low abundance isotopes. The method employs ion exchange and extraction chromatography together with multi-collector ICP-MS. The new technique is of specifi c interest for the detection of small mass-independent nucleosynthetic or cosmogenic isotope variations in meteorites and other planetary materials. We also report a new precise estimate for Sn isotope abundances.
Registered charity number: 207890

JAAS
PAPER
Ope
n A
cces
s A
rtic
le. P
ublis
hed
on 1
9 D
ecem
ber
2019
. Dow
nloa
ded
on 2
/1/2
022
10:4
8:33
AM
. T
his
artic
le is
lice
nsed
und
er a
Cre
ativ
e C
omm
ons
Attr
ibut
ion-
Non
Com
mer
cial
3.0
Unp
orte
d L
icen
ce.
View Article OnlineView Journal | View Issue
Efficient separati
Institute of Geochemistry and Petrology, ETH
Switzerland. E-mail: [email protected]
† Electronic supplementary informa10.1039/c9ja00289h
Cite this: J. Anal. At. Spectrom., 2020,35, 273
Received 21st August 2019Accepted 25th November 2019
DOI: 10.1039/c9ja00289h
rsc.li/jaas
This journal is © The Royal Society of C
on and high-precision analyses oftin and cadmium isotopes in geological materials†
Matthias Friebel, Eniko R. Toth, Manuela A. Fehr and Maria Schonbachler *
This paper presents a new method for the separation of Sn and Cd from geological matrices followed by
high-precision isotope analyses that include low abundance isotopes (<1.25%). The new technique is of
specific interest for the detection of small mass-independent nucleosynthetic or cosmogenic isotope
variations in meteorites and other planetary materials. We also report a new precise estimate for Sn
isotope abundances. The method employs a combination of ion exchange and extraction
chromatography together with multi-collector inductively coupled plasma mass spectrometry (MC-ICP-
MS). Tin is separated from the sample matrix using an anion-exchange resin, followed by removal of
remaining matrix elements and organics using the TRU and Pre-filter resins, respectively. The matrix
fraction from the TRU resin step is further purified to isolate Cd using a two-stage anion exchange
procedure. Analyses of Sn and Cd standard solutions doped with interfering elements were employed to
define thresholds for tolerable amounts of interference producing elements. Our data demonstrate that
our new procedure produces purified Sn and Cd solutions with sufficiently low levels of contaminants
for high precision Sn and Cd isotope analyses. Removal of U is important for Sn isotope data because of
doubly charged U ions. The internally normalised Sn isotope data of the two standard solution (NIST SRM
3161a and SPEX CLSN2-2Y) are in excellent agreement with previous data. Based on repeated analysis of
independently processed lake sediment aliquots, an external reproducibility (intermediate precision)
(2SD) is achieved of �110 ppm for 112Sn/120Sn, �170 ppm for 114Sn/120Sn, �160 ppm for 115Sn/120Sn,
�21 ppm for 117Sn/120Sn, �13 ppm for 118Sn/120Sn, �20 ppm for 119Sn/120Sn, �22 ppm for 122Sn/120Sn
and �24 ppm for 124Sn/120Sn. Replicate Sn analyses of the carbonaceous chondrite Allende are in
excellent agreement with those of the lake sediments. For Cd isotope analyses, the lake sediment yields
an external reproducibility (2SD) of �170 ppm for 106Cd/111Cd, �200 ppm for 108Cd/111Cd, �34 ppm for110Cd/111Cd, �18 ppm for 112Cd/111Cd, �24 ppm for 113Cd/111Cd and �15 ppm for 114Cd/111Cd.
1. Introduction
The Sn isotope composition has been studied in detail since themid 1960s. Most work was carried out by thermal ionisationmass spectrometry (TIMS) and focused on improving theanalytical techniques to precisely determine the Sn isotopeabundances and atomic weights.1–4 Another goal was the searchfor isotopic anomalies in meteorites.5,6 With the introduction ofMC-ICP-MS and its capability for measuring elements with highionisation potentials at high precision (e.g. ref. 7), researchshied to the investigation of mass-dependent Sn isotopefractionation associated with the formation of cassiterite forprovenance analysis.8–14 Other studies used Sn to identify mass-independent nuclear eld shi effects during chemicalexchange reaction using crown ether15 and during methylation
Zurich, Clausiusstrasse 25, 8092 Zurich,
tion (ESI) available. See DOI:
hemistry 2020
and demethylation.16 Most recent research focused on mass-dependent Sn isotope fractionation during igneous differenti-ation and on the Sn isotope composition of the bulk silicateEarth (BSE) using a double-spike approach.17,18
Tin isotopes are of special interest for geochemical andcosmochemical studies due to various reasons. With a 50%condensation temperature of 704 K for a gas of solar composi-tion at a total pressure of 10�4 bar, Sn is cosmochemicallyclassied as a moderately volatile element.19,20 Moreover, theprimitive mantle of the Earth is depleted in Sn by a factor of 33� 3 relative to the CI chondrites.21 Therefore, mass-dependentSn isotope fractionation is a promising tool to betterconstrain the mechanism of volatile depletion in the solarsystem. Geochemically, Sn is moderately siderophile to chal-cophile, and incompatible during silicate differentiation.21 Thebehaviour of Sn during differentiation depends on its oxidationstate, coordination in the crystal lattice and melt composi-tion.22,23 Based on this, Sn isotope fractionation likely occursduring igneous processes and published Sn isotope datasupport this conclusion.17,18
J. Anal. At. Spectrom., 2020, 35, 273–292 | 273

JAAS Paper
Ope
n A
cces
s A
rtic
le. P
ublis
hed
on 1
9 D
ecem
ber
2019
. Dow
nloa
ded
on 2
/1/2
022
10:4
8:33
AM
. T
his
artic
le is
lice
nsed
und
er a
Cre
ativ
e C
omm
ons
Attr
ibut
ion-
Non
Com
mer
cial
3.0
Unp
orte
d L
icen
ce.
View Article Online
Similarly, Cd is another moderately volatile element witha 50% condensation temperature of 652 K 20 that has beenstudied for its mass-dependent isotope composition to addressthe origin of volatile depletion in rocky planets (e.g. ref. 24–27).More recently, it has also been shown that Cd isotopes not onlyfractionate due to volatility related processes e.g. in chon-drites,26 but also during magmatic differentiation, with thecrust displaying a slightly heavier Cd isotope composition.28
In recent years, nucleosynthetic isotope variations havebecome a powerful tool in cosmochemistry. These are mass-independent isotope variations identied in meteorites andterrestrial planets. They are caused by the heterogeneousdistribution of presolar dust that survived the formation of thesolar system and kept the extreme isotopic compositions oftheir stellar sources (e.g. AGB-star or supernovae).29 The distinctnucleosynthetic compositions of planetary materials can beused to investigate important processes in the early solarsystem, such as mixing or the physical conditions (e.g.temperatures) that prevailed in the protoplanetary disk, andinuenced the composition of solar system material (e.g. ref. 30and 31). Tin is the element with the highest number of stableisotopes with ten stable isotopes, formed by the p-process (112Snand 114Sn), s-process (116Sn), the r-process (124Sn), or mixturesthereof (115Sn, 117Sn, 118Sn, 119Sn, 120Sn and 122Sn), and there-fore an ideal candidate to study nucleosynthetic isotope varia-tions in the solar system. Cadmium provides an excellentcompanion with its eight stable isotopes also produced bya variety of nucleosynthetic processes: 106Cd and 108Cd by the p-process, 110Cd by the s-process, and 111Cd to 116Cd by a combi-nation of the s- and the r-process in different proportions.32,33
Cadmium has a mainly chalcophile affinity as opposed to themore siderophile nature of Sn, indicating that Cd and Sn mayreside in different carrier phases within meteorites. Therefore,the combined study of Sn and Cdmay provide a powerful tool toassess the origin of the current lack of resolvable nucleosyn-thetic isotope variations of moderately volatile elements at thebulk meteorite scale. However, since these mass-independentnucleosynthetic variations are generally small, mostly lessthan 0.1 per mil (e.g. for Zr,30 Mo34 and Ru35), an improvedanalytical procedure for mass-independent Sn and Cd isotopeanalyses is required.
In addition to nucleosynthetic variations, meteorites andlunar samples can experience mass-independent modication oftheir isotopes through exposure to galactic cosmic rays in space.Such modications are, for example, reported for Cd isotopes inlunar samples.26,36 This is important to note, because the inves-tigation of the mass-dependent Sn and Cd isotope compositionsin meteorites and lunar samples using the double-spike methodalso depends on their mass-independent isotope composition.This is because the double spike method assumes a constantnatural isotope composition that is only altered by mass-dependent isotope fractionation. In order to obtain precise andaccurate data using the double-spike approach, onemust identifywhether the Sn or Cd isotope composition was subject to mass-independent processes, i.e. has a different mass-independentcomposition and if so, the double spike calculation needsadaption (e.g. ref. 37).
274 | J. Anal. At. Spectrom., 2020, 35, 273–292
Available analytical methods for Sn or Cd isotope analyses(e.g. ref. 14 and 27) were not designed to obtain such mass-independent isotope data at sufficiently high precision toaddress these issues. Therefore, we developed a new analyticalprocedure to obtain high precision Sn and Cd isotope data fromthe same sample aliquot. The method includes a three-stagechromatographic procedure to efficiently separate Sn fromcomplex rock matrices, followed by anion-exchange chroma-tography to purify Cd. The resulting Sn and Cd sample solutionsare analysed on a Nu Plasma II MC-ICP-MS, thereby deter-mining all Sn and Cd isotopes at high precision. Spectralinterferences and matrix effects from traces of elementsremaining aer sample purication can hamper data qualityduring MC-ICP-MS analyses. This is in particular an issue whenimproving the analytical precision, because effects, which wereunproblematic at lower precision, can be resolved at highprecision. For this reason, we performed extensive test with Cdand Sn standard solutions doped with critical elements. Theaccuracy and precision of the new procedure was also veriedusing two geological samples processed through the chro-matographic procedure: a lake sediment and the carbonaceouschondrite Allende. The new technique is powerful because itcan be applied for the search of nucleosynthetic or cosmogenicSn and Cd isotope variations in extraterrestrial materials. Sinceextraterrestrial materials are in general rare and thereforeanalyses are sample limited, the combined Sn and Cd isotopeanalyses on the same sample aliquot constitute a signicantadvantage. Here, the method is also used for a new accurateestimate of Sn isotope abundances.
2. Samples and analytical procedures2.1 Samples and standard materials
Two Sn standard solutions were employed: the NIST SRM 3161a(Lot 070330) bought in 5% HNO3–1% HF and the SPEX CLSN2-2Y (Lot CL6-83SNY) in 1% HNO3–1% HF. These standards werechosen because no certied Sn isotope reference standardcurrently exists, and they were already used in previousstudies.13,14,18 For Cd, an Alfa Aesar Cd standard in 5% HNO3
was employed and on two measurement days the NIST SRM3108 Cd standard (Lot 060531) was analysed for comparison. Asample of a sediment core from Lake Zurich (ZH 09-05 23.3)referred to here as Lake Zurich I, as well as, the basaltic USGSstandard rock (BHVO-2) and the CV3 chondrite Allende wereused to test the developed separation procedure.
2.2 Materials and reagents
Mineral acids of reagent grade were puried once (HF, 1TD) ortwice (HCl, HNO3, 2TD) by sub-boiling distillation in Savillex™Teon stills. Millipore Super-Q (SQ) water with a resistivity of 18MU was used for mixing reagents.
2.3 Sample digestion
Powdered aliquots of Lake Zurich I and BHVO-2 in sizes of 0.1 to1 g were digested on a hotplate using 60 ml Savillex beakermade from peruoroalkoxy alkanes (PFA). First, the samples
This journal is © The Royal Society of Chemistry 2020
Paper JAAS
Ope
n A
cces
s A
rtic
le. P
ublis
hed
on 1
9 D
ecem
ber
2019
. Dow
nloa
ded
on 2
/1/2
022
10:4
8:33
AM
. T
his
artic
le is
lice
nsed
und
er a
Cre
ativ
e C
omm
ons
Attr
ibut
ion-
Non
Com
mer
cial
3.0
Unp
orte
d L
icen
ce.
View Article Online
were digested in 1.5 ml concentrated HNO3 and 12 mlconcentrated HF at 140 �C for one day. Aer dry down, thesamples were re-dissolved in 30 ml 7 M HNO3 at 110 �C over-night and taken to dryness again. Samples with high organiccontents (lake sediments) were additionally treated with 7.5 ml10 M HCl and 2.5 ml 14 M HNO3 for 3 days at 80 �C and taken todryness. In the nal digestion step, each sample was re-dissolved in 20 ml 6 M HCl and evaporated at low tempera-tures (80–90 �C) to prevent the Sn loss in the form of SnCl4,14,38
which becomes volatile at 114 �C.39 An aliquot (0.1 g) of LakeZurich I (referred to as Lake Zurich I bomb) and two 1 g powderaliquots of the CV3 carbonaceous chondrite Allende (split eachover 5 vials) were digested in precleaned PFA vials in a Parr©bomb using for each vial 0.7 ml concentrated HNO3 and 3 mlconcentrated HF for 4.5 days at 170 �C, followed by dry-downand dissolution with 5 ml 6 M HCl at 90–100 �C.
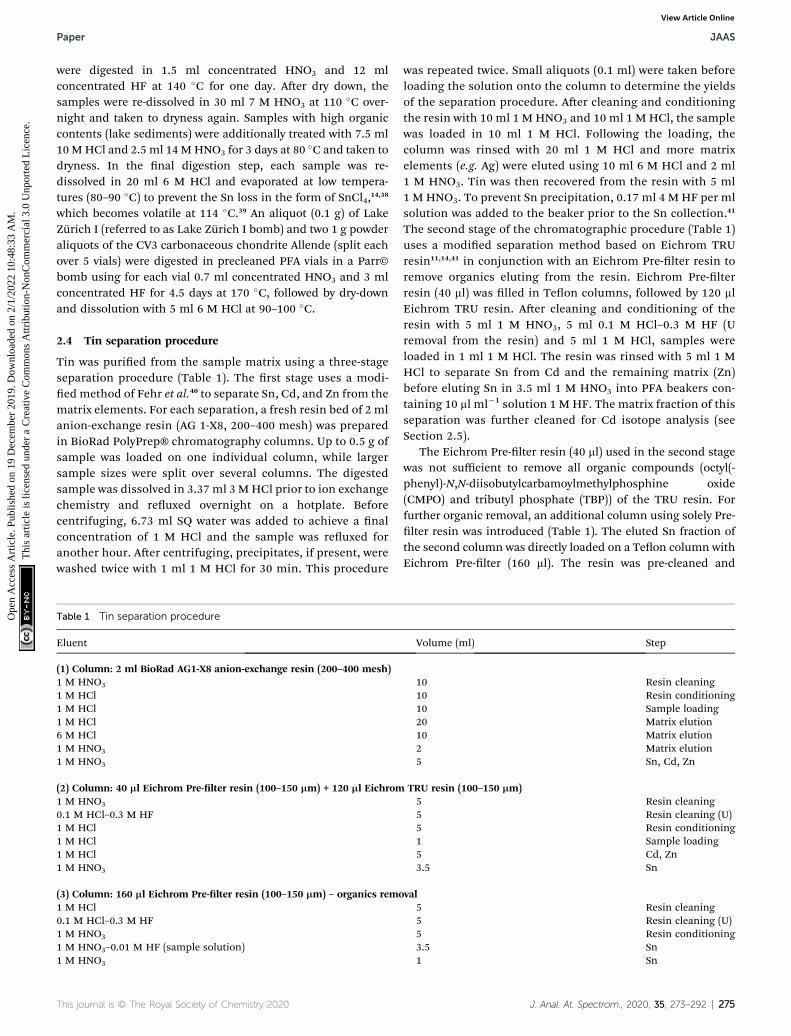
2.4 Tin separation procedure
Tin was puried from the sample matrix using a three-stageseparation procedure (Table 1). The rst stage uses a modi-ed method of Fehr et al.40 to separate Sn, Cd, and Zn from thematrix elements. For each separation, a fresh resin bed of 2 mlanion-exchange resin (AG 1-X8, 200–400 mesh) was preparedin BioRad PolyPrep® chromatography columns. Up to 0.5 g ofsample was loaded on one individual column, while largersample sizes were split over several columns. The digestedsample was dissolved in 3.37 ml 3 M HCl prior to ion exchangechemistry and reuxed overnight on a hotplate. Beforecentrifuging, 6.73 ml SQ water was added to achieve a nalconcentration of 1 M HCl and the sample was reuxed foranother hour. Aer centrifuging, precipitates, if present, werewashed twice with 1 ml 1 M HCl for 30 min. This procedure
Table 1 Tin separation procedure
Eluent
(1) Column: 2 ml BioRad AG1-X8 anion-exchange resin (200–400 mesh)1 M HNO3
1 M HCl1 M HCl1 M HCl6 M HCl1 M HNO3
1 M HNO3
(2) Column: 40 ml Eichrom Pre-lter resin (100–150 mm) + 120 ml Eichrom1 M HNO3
0.1 M HCl–0.3 M HF1 M HCl1 M HCl1 M HCl1 M HNO3
(3) Column: 160 ml Eichrom Pre-lter resin (100–150 mm) – organics remo1 M HCl0.1 M HCl–0.3 M HF1 M HNO3
1 M HNO3–0.01 M HF (sample solution)1 M HNO3
This journal is © The Royal Society of Chemistry 2020
was repeated twice. Small aliquots (0.1 ml) were taken beforeloading the solution onto the column to determine the yieldsof the separation procedure. Aer cleaning and conditioningthe resin with 10 ml 1 M HNO3 and 10 ml 1 M HCl, the samplewas loaded in 10 ml 1 M HCl. Following the loading, thecolumn was rinsed with 20 ml 1 M HCl and more matrixelements (e.g. Ag) were eluted using 10 ml 6 M HCl and 2 ml1 M HNO3. Tin was then recovered from the resin with 5 ml1 M HNO3. To prevent Sn precipitation, 0.17 ml 4 M HF per mlsolution was added to the beaker prior to the Sn collection.41
The second stage of the chromatographic procedure (Table 1)uses a modied separation method based on Eichrom TRUresin11,14,41 in conjunction with an Eichrom Pre-lter resin toremove organics eluting from the resin. Eichrom Pre-lterresin (40 ml) was lled in Teon columns, followed by 120 mlEichrom TRU resin. Aer cleaning and conditioning of theresin with 5 ml 1 M HNO3, 5 ml 0.1 M HCl–0.3 M HF (Uremoval from the resin) and 5 ml 1 M HCl, samples wereloaded in 1 ml 1 M HCl. The resin was rinsed with 5 ml 1 MHCl to separate Sn from Cd and the remaining matrix (Zn)before eluting Sn in 3.5 ml 1 M HNO3 into PFA beakers con-taining 10 ml ml�1 solution 1 M HF. The matrix fraction of thisseparation was further cleaned for Cd isotope analysis (seeSection 2.5).
The Eichrom Pre-lter resin (40 ml) used in the second stagewas not sufficient to remove all organic compounds (octyl(-phenyl)-N,N-diisobutylcarbamoylmethylphosphine oxide(CMPO) and tributyl phosphate (TBP)) of the TRU resin. Forfurther organic removal, an additional column using solely Pre-lter resin was introduced (Table 1). The eluted Sn fraction ofthe second column was directly loaded on a Teon column withEichrom Pre-lter (160 ml). The resin was pre-cleaned and
Volume (ml) Step
10 Resin cleaning10 Resin conditioning10 Sample loading20 Matrix elution10 Matrix elution2 Matrix elution5 Sn, Cd, Zn
TRU resin (100–150 mm)5 Resin cleaning5 Resin cleaning (U)5 Resin conditioning1 Sample loading5 Cd, Zn3.5 Sn
val5 Resin cleaning5 Resin cleaning (U)5 Resin conditioning3.5 Sn1 Sn
J. Anal. At. Spectrom., 2020, 35, 273–292 | 275
JAAS Paper
Ope
n A
cces
s A
rtic
le. P
ublis
hed
on 1
9 D
ecem
ber
2019
. Dow
nloa
ded
on 2
/1/2
022
10:4
8:33
AM
. T
his
artic
le is
lice
nsed
und
er a
Cre
ativ
e C
omm
ons
Attr
ibut
ion-
Non
Com
mer
cial
3.0
Unp
orte
d L
icen
ce.
View Article Online
conditioned with 5 ml 1 M HCl, 5 ml 0.1 M HCl–0.3 M HF and5 ml 1 M HNO3. Tin was directly collected upon loading and inan additional 1 ml 1 M HNO3.
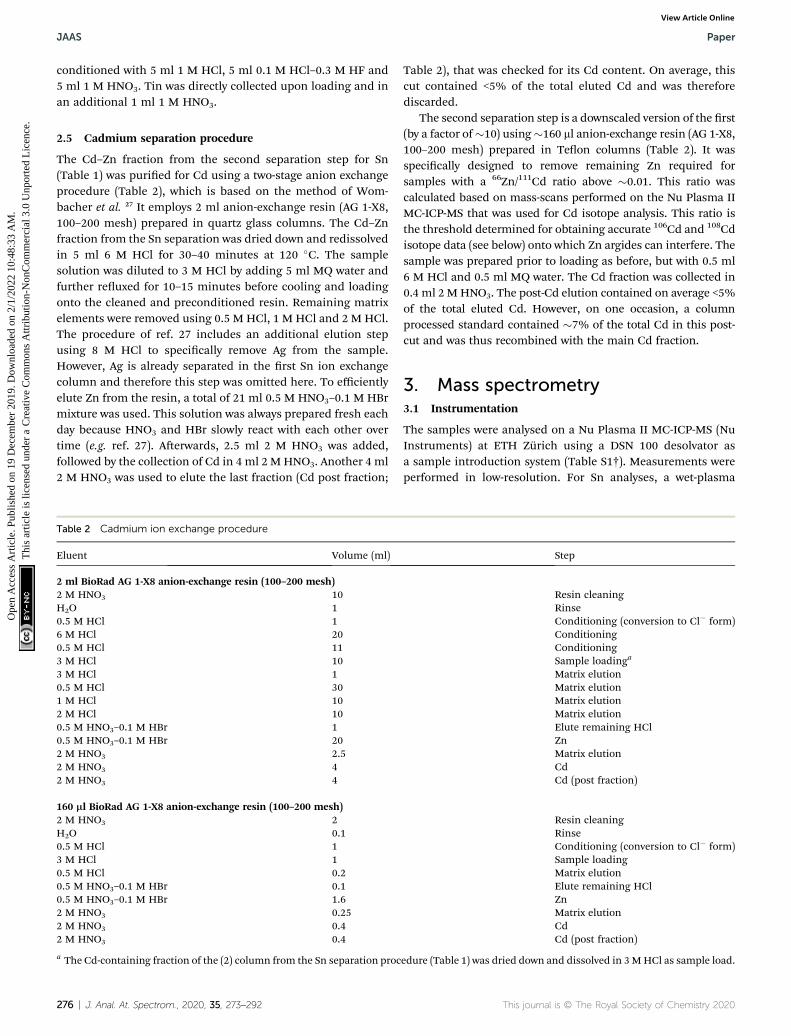
2.5 Cadmium separation procedure
The Cd–Zn fraction from the second separation step for Sn(Table 1) was puried for Cd using a two-stage anion exchangeprocedure (Table 2), which is based on the method of Wom-bacher et al. 27 It employs 2 ml anion-exchange resin (AG 1-X8,100–200 mesh) prepared in quartz glass columns. The Cd–Znfraction from the Sn separation was dried down and redissolvedin 5 ml 6 M HCl for 30–40 minutes at 120 �C. The samplesolution was diluted to 3 M HCl by adding 5 ml MQ water andfurther reuxed for 10–15 minutes before cooling and loadingonto the cleaned and preconditioned resin. Remaining matrixelements were removed using 0.5 M HCl, 1 M HCl and 2 M HCl.The procedure of ref. 27 includes an additional elution stepusing 8 M HCl to specically remove Ag from the sample.However, Ag is already separated in the rst Sn ion exchangecolumn and therefore this step was omitted here. To efficientlyelute Zn from the resin, a total of 21 ml 0.5 M HNO3–0.1 M HBrmixture was used. This solution was always prepared fresh eachday because HNO3 and HBr slowly react with each other overtime (e.g. ref. 27). Aerwards, 2.5 ml 2 M HNO3 was added,followed by the collection of Cd in 4 ml 2 M HNO3. Another 4 ml2 M HNO3 was used to elute the last fraction (Cd post fraction;
Table 2 Cadmium ion exchange procedure
Eluent Volume (ml)
2 ml BioRad AG 1-X8 anion-exchange resin (100–200 mesh)2 M HNO3 10H2O 10.5 M HCl 16 M HCl 200.5 M HCl 113 M HCl 103 M HCl 10.5 M HCl 301 M HCl 102 M HCl 100.5 M HNO3–0.1 M HBr 10.5 M HNO3–0.1 M HBr 202 M HNO3 2.52 M HNO3 42 M HNO3 4
160 ml BioRad AG 1-X8 anion-exchange resin (100–200 mesh)2 M HNO3 2H2O 0.10.5 M HCl 13 M HCl 10.5 M HCl 0.20.5 M HNO3–0.1 M HBr 0.10.5 M HNO3–0.1 M HBr 1.62 M HNO3 0.252 M HNO3 0.42 M HNO3 0.4
a The Cd-containing fraction of the (2) column from the Sn separation proc
276 | J. Anal. At. Spectrom., 2020, 35, 273–292
Table 2), that was checked for its Cd content. On average, thiscut contained <5% of the total eluted Cd and was thereforediscarded.
The second separation step is a downscaled version of the rst(by a factor of�10) using�160 ml anion-exchange resin (AG 1-X8,100–200 mesh) prepared in Teon columns (Table 2). It wasspecically designed to remove remaining Zn required forsamples with a 66Zn/111Cd ratio above �0.01. This ratio wascalculated based on mass-scans performed on the Nu Plasma IIMC-ICP-MS that was used for Cd isotope analysis. This ratio isthe threshold determined for obtaining accurate 106Cd and 108Cdisotope data (see below) onto which Zn argides can interfere. Thesample was prepared prior to loading as before, but with 0.5 ml6 M HCl and 0.5 ml MQ water. The Cd fraction was collected in0.4 ml 2 M HNO3. The post-Cd elution contained on average <5%of the total eluted Cd. However, on one occasion, a columnprocessed standard contained �7% of the total Cd in this post-cut and was thus recombined with the main Cd fraction.
3. Mass spectrometry3.1 Instrumentation
The samples were analysed on a Nu Plasma II MC-ICP-MS (NuInstruments) at ETH Zurich using a DSN 100 desolvator asa sample introduction system (Table S1†). Measurements wereperformed in low-resolution. For Sn analyses, a wet-plasma
Step
Resin cleaningRinseConditioning (conversion to Cl� form)ConditioningConditioningSample loadinga
Matrix elutionMatrix elutionMatrix elutionMatrix elutionElute remaining HClZnMatrix elutionCdCd (post fraction)
Resin cleaningRinseConditioning (conversion to Cl� form)Sample loadingMatrix elutionElute remaining HClZnMatrix elutionCdCd (post fraction)
edure (Table 1) was dried down and dissolved in 3MHCl as sample load.
This journal is © The Royal Society of Chemistry 2020

Table 3 Cup configuration for Sn isotope analysis and interference elements
111Cd 112Sn 113Cd 114Sn 115Sn 116Sn 117Sn 118Sn 119Sn 120Sn 122Sn 124Sn 125Te 126Te 129Xe
Collector congurationLine1
L3 L2 L1 Ax H1 H2 H3 H4 H5 H6 H7 H8
Line2
L4 L3 L2 L1 H1 H3 H4 H5 H7
Isotope abundances of Sn and isobaric interferencesCd 12.8 24.1 12.2 28.7 7.5Sn 0.97 0.66 0.34 14.5 7.7 24.2 8.6 32.6 4.6 5.8In 4.3 95.7Te 0.10 2.6 4.8 7.1 19.0Xe 0.09 0.09 26.4
Major molecular interferencesM1H 110Pd
(11.7)110Cd(12.5)
111Cd(12.8)
112Cd(24.1)
113Cd(12.2)
114Cd(28.7)
115In(95.7)
121Sb(57.2)
123Sb(42.8)
124Sn(5.8)
128Te(31.7)
M14N 97Mo(9.5)
98Mo(24.1)
100Mo(9.6)
99Ru(12.7)
100Ru(12.6)
101Ru(17.0)
102Ru(31.5)
104Ru(18.6)
103Rh(100)
104Pd(11.1)
105Pd(22.3)
106Pd (27.3) 108Pd(26.4)
110Pd(11.7)110Cd(12.5)
111Cd(12.8)
112Cd(24.0)
115In(95.7)
M16O 95Mo(15.9)
96Mo(16.6)
97Mo(9.5)
98Mo(24.1)
100Mo(9.6)
99Ru(12.7)
100Ru(12.6)
101Ru(17.0)
102Ru(31.5)
104Ru (18.6)
103Rh(100)
104Pd (11.1) 106Pd(27.3)
108Pd(26.4)
110Pd(11.7)110Cd(12.5)
113Cd(12.2)
109Ag(48.1)
M40Ar 71Ga(39.7)
72Ge(27.6)
73Ge(7.7)
74Ge(35.8)
76Se(9.3)
77Se(7.6)
78Se(23.7)
80Se (49.4) 82Se(8.7)
75As(100)
79Br(50.5)
40Ar–40Ar–40Ar(99.6)
This journal is © The Royal Society of Chemistry 2020 J. Anal. At. Spectrom., 2020, 35, 273–292 | 277
Paper JAAS
Ope
n A
cces
s A
rtic
le. P
ublis
hed
on 1
9 D
ecem
ber
2019
. Dow
nloa
ded
on 2
/1/2
022
10:4
8:33
AM
. T
his
artic
le is
lice
nsed
und
er a
Cre
ativ
e C
omm
ons
Attr
ibut
ion-
Non
Com
mer
cial
3.0
Unp
orte
d L
icen
ce.
View Article Online

Table 3 (Contd. )
111Cd 112Sn 113Cd 114Sn 115Sn 116Sn 117Sn 118Sn 119Sn 120Sn 122Sn 124Sn 125Te 126Te 129Xe
82Kr(11.5)
84Kr(56.8)
86Kr(17.2)
85Rb(71.9)
86Sr(9.8)
89Y(100)
M++ 232Th(100)
238U(99.3)
JAAS Paper
Ope
n A
cces
s A
rtic
le. P
ublis
hed
on 1
9 D
ecem
ber
2019
. Dow
nloa
ded
on 2
/1/2
022
10:4
8:33
AM
. T
his
artic
le is
lice
nsed
und
er a
Cre
ativ
e C
omm
ons
Attr
ibut
ion-
Non
Com
mer
cial
3.0
Unp
orte
d L
icen
ce.
View Article Online
sampler cone and a dry-plasma skimmer cone were used. ForCd, another set of dry-plasma sampler and skimmer cones wereused. The nebuliser uptake rate was about 50–60 ml min�1 andprior to each analysis a peak centre routine was performed.
3.2 Tin data collection and reduction
In order to analyse all ten Sn isotopes and to monitor allisobaric interferences, the measurements were performed indynamic mode (Table 3). In the rst measurement line, all Snisotopes and 111Cd were analysed, while the second line wasmainly used for correction of isobaric interferences (125Te,126Te, 129Xe) (Table 3). One analysis consisted of 20 cycles with10 s integration time for the rst measurement line and 5 s inthe second, and 3 s of magnet settle time aer the magnetjumped. At the beginning of each analysis an electronic base-line was measured via electrostatic analyser deection lasting30 s. A 0.5 M HNO3–0.005 M HF solution was used to rinse thenebuliser for 240 s aer each analysis. Interspersed between thesamples, a second 0.5 M HNO3–0.005 M HF solution was ana-lysed with the same measurement routine as the samples asbackground monitor. The recorded signals were used for thebackground correction and in particular to account for the Ar3interference on mass 120 (Table 3). The sample measurementswere bracketed to a NIST 3161a SRM Sn standard solution atconcentrations within �20% of the sample. A single measure-ment took about 10 minutes and used around 100–120 ng Sn.The total ion beam sensitivity ranged from 2.7 � 10�12 to 4.8 �10�12 A ppb�1 using 1011 U resistors. Before analysis, eachsample was checked for potential remaining impurities of Cd,Mo, Pd, Ru, Rh, Te, U and Zr by scanning through their massrange and comparing to a multi-element standard. All collecteddata were rst corrected for the electronic baseline, followed bythe subtraction of background measurement. The data wereinternally normalised to a 116Sn/120Sn ratio of 0.4460 (ref. 2)using the exponential law to correct for instrumental mass bias(in addition data was also tested for normalisations to122Sn/118Sn ¼ 0.19125 and 118Sn/120Sn ¼ 0.742935 calculatedbased on the 116Sn/120Sn ratio of 0.4460 (ref. 2)). The normal-isation ratio of 116Sn/120Sn was chosen to ease the comparisonto earlier studies, which already used it. Moreover, this ratiooffers a wide range of advantages such as the relatively large
278 | J. Anal. At. Spectrom., 2020, 35, 273–292
spread of isotope masses, the minor effects of interferingisotopes from neighbouring elements, the relatively smalluncertainties of the data compared to when other ratios areemployed and the use of even isotope masses only. The latterascertains that the normalisation ratio is not affected by non-mass-dependent effects such as nuclear eld shi or magneticisotope effects.
Isobaric interferences (Table 3) were corrected using 111Cd,125Te and 129Xe signals as monitors as follows. First a Cdcorrection was performed on 116Sn by subtracting 116Cd (using116Cd/111Cd ¼ 0.563754 (ref. 6)) without mass bias correction.For the mass bias correction, the corrected 116Sn signal wasthen used to determine the fractionation factor (b) of theexponential law:
Rtrue ¼ Rmeas � (m1/m2)b (1.1)
where Rtrue is thexSn/ySn (x¼ 116, 118, 122; y¼ 118 or 120, ratio
identical to that used for internal normalisation of the Snisotope data) corrected for mass bias, Rmeas the measuredxSn/ySn ratio, m1 and m2 refer to the masses of nominator anddenominator isotopes xSn and ySn, respectively. Aerwardsb was iteratively rened until convergence using the newlydetermined b for interference correction of Cd on 116Sn in thesubsequent loop. For Te/Sn ratios >3 � 10�3 an additional Tecorrection on 120Sn is necessary to correctly determine b. Here,a 117Sn/119Sn ratio of 0.893266 (based on 117Sn/120Sn¼ 0.235313and 119Sn/120Sn ¼ 0.26343 (ref. 7)) was used to determine themass bias before performing the Cd and Te correction on 116Snand 120Sn. Again, the nal fractionation factor b was obtainedby iteratively solving for it. This nal fractionation factor wasthen used for mass-bias correction and interference correctionon all ratios. The results are reported in epsilon notation rela-tive to 120Sn:
3xSn ¼ ((xSn/120Snsample/xSn/120SnNIST 3161a) � 1) � 10 000 (1.2)
where xSn/120Snsample is the isotopic ratio of the samplemeasured relative to the isotopic ratio xSn/120SnNIST 3161a of theSn standard solution NIST 3161a. Reported uncertainties are 2standard deviation (SD) of repeat analyses, whereas for singleanalyses, the 2SD of the daily bracketing standard is displayed.
This journal is © The Royal Society of Chemistry 2020
Paper JAAS
Ope
n A
cces
s A
rtic
le. P
ublis
hed
on 1
9 D
ecem
ber
2019
. Dow
nloa
ded
on 2
/1/2
022
10:4
8:33
AM
. T
his
artic
le is
lice
nsed
und
er a
Cre
ativ
e C
omm
ons
Attr
ibut
ion-
Non
Com
mer
cial
3.0
Unp
orte
d L
icen
ce.
View Article Online
Solutions for yield and blank determination were analysedon an Element XR. The blanks from digestion and those fromthe chemical separation procedure were dried down and takenup in 0.5 M HNO3–0.005 M HF for analysis. To estimate theyields of the separation procedure, small aliquots (5% of samplematerial) of the Sn fraction collected in the rst and third stagewere compared to a small aliquot (1% of sample material) takenbefore the chromatographic procedure. These aliquots werealso analysed in a 0.5 M HNO3–0.005 M HF media.
3.3 Cadmium data collection and reduction
Similar to Sn, Cd isotope analyses were performed in dynamicmode to allow measurements of all Cd isotopes and Pd, In andSn isotopes for direct isobaric interference corrections. In therst line, all Cd isotopes, 115In and 118Sn were measured. Inthe second, 105Pd, 108Cd and 111Cd were collected. Each anal-ysis comprised of 30 dynamic isotope measurements, using10 s (rst line) and 5 s (second line) integrations, and a 2 smagnet delay time. Before each measurement, an electronicbaseline was measured for 30 s. Aer each analysis, the neb-uliser was rinsed with 0.5 M HNO3 for 150 s. On-peak back-grounds were measured in 0.5 M HNO3 before and aer threestandard and/or sample analyses. Background correctionswere applied to sample and standard measurements using theaverage of background analyses before and aer thesemeasurement blocks. Samples were bracketed to an Alfa AesarCd standard with a matching concentration to within �20%on average. Each measurement lasted �12 minutesconsuming between �120–150 ng Cd. The total ion beamintensity ranged from 1.5 � 10�12 to 3.3 � 10�12 A ppb�1 using1011 U resistors. The column processed samples were checkedfor purity using 2–5% aliquots on the Nu Plasma II by scan-ning them for potentially interfering elements including Zn,Zr, Mo, Ge, Ru, Ga, Pd, In and Sn. These aliquots were alsoscanned for their Cd content, which was used to calculate thenal yields following the full separation procedure bycomparison with the 1% aliquot taken prior to the rst Sncolumn chemistry (Section 2.4).
Aer baseline and background correction, the Cd isotopedata were internally normalised to a 116Cd/111Cd ratio of0.578505 42 with the exponential law. This ratio was chosen toascertain a large spread, which improves precision, but also tominimize the effects of interferences from neighbouringelements (i.e. Pd) and to avoid isotopes affected by neutroncapture (113Cd, 114Cd) during galactic cosmic ray irradiation inspace.43
Interferences from Pd, In and Sn were corrected for usinga similar iterative approach as described for the Sn datareduction (see Section 3.2). Results are reported in the epsilonnotation relative to 111Cd:
3xCd ¼ ((xCd/111Cdsample/xCd/111CdAlfa Aesar) � 1) � 10 000 (1.3)
where x denotes the mass of the isotope of interest, withxCd/111Cdsample giving the isotopic ratio of the sample relative tothe ratio of the Cd Alfa Aesar standard.
This journal is © The Royal Society of Chemistry 2020
4. Results and discussion4.1 Yields and blanks
The Sn yields of the rst and the combined yields of the secondand third column are around 90–100% and 80–100%, respec-tively. The yield of the total Sn separation procedure wasgenerally >80%. The total yield for the separation of Cd was onaverage >70%.
The total Sn procedural blank ranged typically between 1.4and 2.2 ng for samples of 0.5–1 g. The Sn blanks of the reagentsdiffered, concentrated HCl (twice Teon distilled) contained16–30 pg ml�1, while concentrated HNO3 (twice Teon distilled)and SQ water contained less than 2 pg ml�1 Sn. The totalprocedural blank was therefore strongly dependent on thedigestion procedure. While the complete separation procedureusually yielded a blank of 0.4 ng Sn, the digestion of the samplealone resulted in blank values from 0.27 ng per beaker in a Parrbomb digestion, up to 2 ng blank for the digestion of 0.5–1 gsample material in 60 ml vials on the hotplate. Generally, the Sncontent of the analysed lake sediment and basalt aliquots wasabove 500 ng resulting in a blank contribution of <1%, which istherefore negligible.
The Cd blanks aer the Sn column chemistry in the Cd–Zncut were #14 pg, and including the subsequent Cd ionexchange chemistry #87 pg, on average. The sample digestionand the complete separation procedure together yielded blanksof <90 pg Cd. Considering that the Cd contents of all lakesediments and column processed standards were �150 ng orhigher, this results in a negligible blank contribution of <0.1%.
4.2 Eluted organics from TRU resin
It has been shown that organics eluted from the TRU resinduring extraction chromatography can affect the instrumentalmass bias of Cd (ref. 44 and 45) and therefore compromise thequality of isotopic analysis. Several other studies also reportedthat these organic compounds elute from the TRU resin intosample fractions.14,46 High contents of organics, furthermore,inuence the nebuliser uptake rate and the sensitivity of theinstrument, and may affect the dissolution of the sample aerdry-down. The Sn fractions aer the second separation stage,consisting of TRU Spec resin and Pre-lter resin, contained upto 250 mg P, most likely bound to the organic extractants (CMPOand TBP) of the TRU resin, because both compounds arephosphor bound organic species. Aer the additional clean-upcolumn (third stage) containing the Pre-lter resin, the phos-phorous content of the Sn fractions was reduced to <20 ng.Phosphorus is efficiently separated from Cd by the employed Cdanion-exchange chemistry (Table 2). The nal puried Cdsolutions contained on average <12 ng P.
4.3 Interferences
Isobaric interferences. The Sn NIST SRM 3161a standardsolution (100–200 ppb Sn) was doped with various amounts ofCd (0.005–0.075 ppb), In (0.005 ppb), Te (0.05–4 ppb) and U(0.005–0.015 ppb) to evaluate the robustness of the interferencecorrection. Ratios for Cd/Sn of up to 2 � 10�4 can be adequately
J. Anal. At. Spectrom., 2020, 35, 273–292 | 279
JAAS Paper
Ope
n A
cces
s A
rtic
le. P
ublis
hed
on 1
9 D
ecem
ber
2019
. Dow
nloa
ded
on 2
/1/2
022
10:4
8:33
AM
. T
his
artic
le is
lice
nsed
und
er a
Cre
ativ
e C
omm
ons
Attr
ibut
ion-
Non
Com
mer
cial
3.0
Unp
orte
d L
icen
ce.
View Article Online
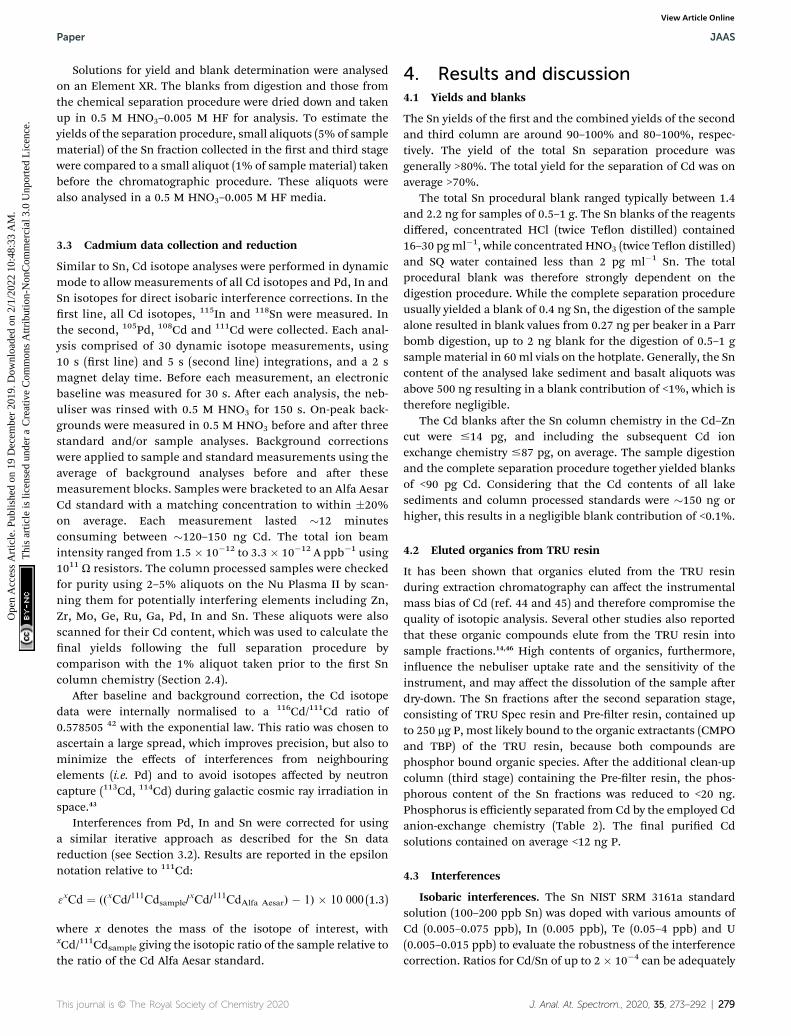
corrected to yield accurate Sn isotope data (Fig. 1a and b). Aercolumn chemistry, the Sn fractions had generally Cd/Sn ratiosbelow these limits (<1 � 10�4). The isotope 115Sn is very sensi-tive to small In contaminations due to the large difference inabundances of 115In (95.7%) and 115Sn (0.34%). Without Ininterference correction, In/Sn of 5 � 10�6 already resulted in anoffset of 3115Sn¼ +17.7. Moreover, 113In, the monitor isotope for
Fig. 1 Tin isotope ratios for a 100 and 200 ppb NIST SRM 3161a standarindividual analyses and the dotted line marks the tolerance level for eacsymbols data without interference correction. Uncertainties are 2SD of reU/Sn ¼ 1.5 � 10�4) only one measurement was performed and the unrepresents the reproducibility (2SD) of NIST SRM 3161a at 200 ppb. (d–f
280 | J. Anal. At. Spectrom., 2020, 35, 273–292
In correction, is also the low abundance isotope (4.29%) of Inand subject to Cd interferences. Taken together this leads tolarge uncertainties on 3115Sn due to error magnication (Incorrection results in an uncertainty on 3115Sn of �40 (2SD). Theuncertainty on 3115Sn without In correction is only �1.6 (2SD),see ESI Fig. S1†). Although most analysed aliquots of LakeZurich I, BHVO-2 and Allende tend to lower (negative) 3115Sn
d solution doped with Cd, U and Te. Data points show the average ofh element. Closed symbols indicate interference corrected data, openpeat analyses. For three standards (Cd/Sn¼ 0.5� 10�4 and 3.5� 10�4,certainty is the 2SD of the daily bracketing standard. The grey band) No Te correction on 120Sn. (g–i) Te correction on 120Sn.
This journal is © The Royal Society of Chemistry 2020
Tab
le4
Snisotoperatiosofco
lumnproce
ssedsamples
Sample
Sn(ppb
)fCd/Sn
Te/Sn
N31
12Sn
3114Sn
3115 Sn
3117Sn
3118 Sn
3119Sn
3122 Sn
3124 Sn
Snstan
dardsolution
sNISTSR
M31
61a
200
1.4�
10�5
3.6�
10�5
200.0�
0.9
0.0�
1.3
0.0�
1.2
0.00
�0.16
0.00
�0.11
0.00
�0.17
0.00
�0.21
0.00
�0.31
100
110.0�
1.4
0.0�
2.3
0.0�
2.0
0.00
�0.22
0.00
�0.13
0.00
�0.21
0.00
�0.25
0.00
�0.39
4029
a0.0�
2.6
0.2�
4.9
0.1�
5.4
0.00
�0.20
0.00
�0.21
0.01
�0.39
0.00
�0.35
0.01
�0.40
2525
a0.0�
5.0
0�
110.1�
6.7
0.01
�0.50
0.01
�0.26
0.02
�0.71
0.00
�0.91
0.00
�0.75
919
a�1
�11
0�
231�
21�0
.1�
1.4
0.04
�0.61
0.1�
1.9
0.1�
1.9
0.2�
1.7
5.5
21a
0�
281�
490�
420.0�
1.6
�0.02�
0.91
0.0�
1.6
0.0�
2.6
0.0�
2.5
SPEXCLS
N2-2Y
100
2.4�
10�5
6.2�
10�5
20a
0.0�
1.2
0.1�
1.8
7.3�
2.2
�0.05�
0.18
0.01
�0.11
�0.03�
0.19
�0.05�
0.27
�0.13�
0.44
ColumnprocessedSn
stan
dardsolution
sNIST+Cd
200
1.6�
10�5
3.3�
10�5
1�0
.4�
1.0
�0.3
�1.7
�0.6
�1.1
0.18
�0.18
0.01
�0.13
0.11
�0.18
�0.14�
0.16
�0.16�
0.27
NIST+Cd
100
2.8�
10�5
2.6�
10�5
10.6�
1.7
1.3�
2.3
0.1b
�1.7
0.02
�0.23
0.10
�0.20
0.04
�0.15
�0.03�
0.14
�0.17�
0.27
SPEX
100
8.6�
10�6
2.8�
10�5
1�0
.6�
1.6
�1.6
�2.1
�1.1
b�
1.5
�0.09�
0.25
�0.04�
0.10
�0.15�
0.10
�0.18�
0.27
�0.48�
0.36
SPEXAg1
x810
07.3�
10�6
1.8�
10�5
1�0
.1�
1.6
�0.1
�2.1
�0.5
b�
1.5
0.05
�0.25
0.08
�0.10
0.18
�0.10
0.00
�0.27
0.15
�0.36
SPEXTRU
100
1.3�
10�5
1.2�
10�4
1�1
.2�
1.6
�1.0
�2.1
�1.0
b�
1.5
0.08
�0.25
�0.03�
0.10
0.10
�0.10
�0.06�
0.27
�0.09�
0.36
Allen
de(CV3)
Alle
ndebo
mb1a
200
4.3�
10�5
3.6�
10�5
10.4�
1.0
1.9�
1.7
�2.8
�1.1
0.05
�0.18
0.04
�0.13
0.10
�0.18
�0.07�
0.16
�0.13�
0.27
Alle
nde
bomb1a
200
4.4�
10�5
6.8�
10�5
10.27
�0.83
0.9�
1.1
�2.6
�1.1
0.16
�0.23
0.10
�0.12
0.04
�0.21
0.02
�0.24
�0.06�
0.41
Alle
nde
bomb1b
200
1.2�
10�4
3.3�
10�5
1�0
.11�
0.92
1.9�
1.4
�0.09�
0.94
0.08
�0.22
0.02
�0.11
0.09
�0.14
0.17
�0.24
0.03
�0.24
Alle
nde
bomb1b
200
2.3�
10�5
5.1�
10�5
10.33
�0.57
�0.13�
0.82
�2.38�
0.81
0.20
�0.12
�0.03�
0.10
0.00
�0.15
�0.23�
0.19
�0.21�
0.23
Withad
dition
alPre-lter
cleanup
Alle
nde
bomb2a
200
5.8�
10�5
4.0�
10�5
1�0
.17�
0.84
0.90
�1.15
�2.5
�1.4
0.07
�0.16
0.10
�0.12
0.12
�0.16
�0.02�
0.20
0.00
�0.38
Alle
nde
bomb2b
200
4.5�
10�5
4.5�
10�5
1�0
.26�
0.84
0.64
�0.93
�2.20�
0.92
0.21
�0.12
0.10
�0.08
0.17
�0.23
0.09
�0.12
�0.14�
0.25
Alle
nde
bomb2a
+2b
c20
04.9�
10�5
3.0�
10�5
1�0
.9�
1.1
�0.22�
1.62
�0.3
b�
1.7
0.26
�0.18
0.03
�0.10
0.07
�0.21
�0.04�
0.25
�0.16�
0.37
Allend
ebo
mb1mean
200
40.23
�0.46
1.1�
2.0
�2.0
�2.5
0.12
�0.14
0.03
�0.11
0.06
�0.09
�0.03�
0.34
�0.09�
0.21
4d0.23
�0.36
1.1�
1.6
�2.0
�2.0
0.12
�0.11
0.03
�0.09
0.06
�0.08
�0.03�
0.27
�0.09�
0.16
Allend
ebo
mb2mean
200
3�0
.44�
0.85
0.4�
1.3
�1.7
�2.4
0.18
�0.19
0.07
�0.11
0.12
�0.17
0.01
�0.21
�0.10�
0.31
Basalts
BHVO-2
1a10
01.2�
10�5
3.0�
10�5
1�1
.1�
1.7
�2.4
�2.3
0.3b
�1.7
�0.08�
0.23
�0.17�
0.20
0.13
�0.15
0.20
�0.14
0.06
�0.27
BHVO-2
1b10
02.3�
10�5
2.7�
10�5
10.4�
1.7
1.9�
2.3
�0.2
b�
1.7
0.08
�0.23
�0.03�
0.20
�0.01�
0.15
0.10
�0.14
0.08
�0.27
BHVO-2
210
01.4�
10�5
3.2�
10�5
1�0
.3�
1.7
�1.0
�2.3
0.3b
�1.7
�0.06�
0.23
�0.14�
0.20
0.03
�0.15
0.07
�0.14
0.16
�0.27
Lake
sedim
ente
Lake
Zurich
Ia20
03.5�
10�5
3.6�
10�5
11.1�
1.0
1.3�
1.7
�1.5
�1.1
0.13
�0.18
0.03
�0.13
�0.04�
0.18
�0.16�
0.16
�0.17�
0.27
Lake
Zurich
Ia20
03.3�
10�5
2.8�
10�5
1�0
.45�
0.92
0.6�
1.4
�1.86�
0.94
�0.10�
0.22
�0.09�
0.11
0.20
�0.14
0.24
�0.24
�0.07�
0.24
Lake
Zurich
Ib20
01.5�
10�5
3.2�
10�5
10.1�
1.0
0.0�
1.7
�1.7
�1.1
0.09
�0.18
0.04
�0.13
0.02
�0.18
0.00
�0.16
�0.05�
0.27
Lake
Zurich
Ib20
01.3�
10�5
3.0�
10�5
1�0
.31�
0.92
�1.1
�1.4
�1.96�
0.94
�0.10�
0.22
�0.08�
0.11
0.06
�0.14
�0.06�
0.24
0.05
�0.24
Lake
Zurich
Ib20
01.5�
10�5
4.0�
10�5
10.0�
1.2
0.4�
2.0
�2.0
�1.4
0.13
�0.19
0.08
�0.12
�0.16�
0.11
�0.08�
0.21
�0.14�
0.29
Lake
Zurich
Ic20
01.8�
10�5
2.8�
10�5
10.09
�0.92
0.8�
1.4
�1.64�
0.94
0.05
�0.22
0.15
�0.11
0.01
�0.14
�0.16�
0.24
�0.33�
0.24
Lake
Zurich
Ic20
02.2�
10�5
2.8�
10�5
1�0
.68�
0.92
�0.5
�1.4
�1.86�
0.94
�0.18�
0.22
�0.02�
0.11
0.01
�0.14
�0.17�
0.24
�0.21�
0.24
Lake
Zurich
Ic20
08.8�
10�6
4.0�
10�5
10.3�
1.2
�0.7
�2.0
�2.7
�1.4
0.04
�0.19
0.03
�0.12
�0.06�
0.11
�0.02�
0.21
�0.10�
0.29
Withad
dition
alPre-lter
cleanup
Lake
Zurich
Id20
08.0�
10�5
3.4�
10�5
1�0
.25�
0.94
�0.5
�1.4
�0.9
�1.1
�0.10�
0.12
0.03
�0.11
�0.11�
0.17
�0.07�
0.22
�0.16�
0.38
Lake
Zurich
Ie20
05.1�
10�5
3.3�
10�5
1�0
.8�
1.1
�0.3
�1.6
0.0�
1.7
�0.10�
0.18
0.02
�0.10
�0.10�
0.21
�0.03�
0.25
�0.10�
0.37
This journal is © The Royal Society of Chemistry 2020 J. Anal. At. Spectrom., 2020, 35, 273–292 | 281
Paper JAAS
Ope
n A
cces
s A
rtic
le. P
ublis
hed
on 1
9 D
ecem
ber
2019
. Dow
nloa
ded
on 2
/1/2
022
10:4
8:33
AM
. T
his
artic
le is
lice
nsed
und
er a
Cre
ativ
e C
omm
ons
Attr
ibut
ion-
Non
Com
mer
cial
3.0
Unp
orte
d L
icen
ce.
View Article Online
Tab
le4
(Contd.)
Sample
Sn(ppb
)fCd/Sn
Te/Sn
N31
12Sn
3114Sn
3115 Sn
3117Sn
3118 Sn
3119Sn
3122 Sn
3124 Sn
Lake
Zurich
Ibo
mba
200
1.1�
10�4
3.7�
10�5
10.14
�0.84
1.4�
1.2
�0.5
�1.4
�0.13�
0.16
�0.01�
0.12
�0.03�
0.16
�0.01�
0.20
�0.03�
0.38
Lake
Zurich
Ibo
mbb
200
2.9�
10�5
3.3�
10�5
10.24
�0.94
0.2�
1.4
�0.6
�1.1
0.00
�0.12
0.11
�0.11
�0.21�
0.17
�0.14�
0.22
�0.19�
0.38
Lake
Zurich
Ibo
mbb
200
2.4�
10�5
2.8�
10�5
1�0
.6�
1.1
0.5�
1.6
�0.9
�1.7
�0.12�
0.18
�0.01�
0.10
0.03
�0.21
0.06
�0.25
0.10
�0.37
Lake
Zurich
Ibo
mbc
200
8.1�
10�5
3.7�
10�5
10.38
�0.78
1.20
�0.97
�0.6
�1.0
�0.08�
0.14
�0.04�
0.10
�0.18�
0.16
�0.13�
0.18
�0.20�
0.21
Lake
Zurich
Ibo
mbc
200
8.1�
10�5
2.2�
10�5
1�0
.59�
0.73
�0.56�
0.97
�0.3
�1.2
�0.01�
0.12
�0.07�
0.11
�0.02�
0.14
0.11
�0.20
0.03
�0.27
Lake
Zurich
Ibo
mbc
200
8.5�
10�5
1.5�
10�5
1�0
.80�
0.91
�0.8
�1.3
�0.4
�1.4
0.06
�0.18
�0.04�
0.13
�0.22�
0.16
�0.22�
0.22
�0.33�
0.35
Lake
Zurich
Ibo
mbc
200
8.4�
10�5
1.5�
10�5
10.38
�0.91
1.1�
1.3
0.1�
1.4
0.07
�0.18
0.07
�0.13
�0.10�
0.16
0.01
�0.22
�0.12�
0.35
Lake
Zurich
Ibo
mbcc
200
8.4�
10�5
2.7�
10�5
1�1
.2�
1.1
0.4�
1.6
�1.9
b�
1.7
�0.19�
0.18
�0.04�
0.10
�0.07�
0.21
�0.07�
0.25
0.00
�0.37
Lake
Zurich
Ibo
mbc
200
9.4�
10�5
2.7�
10�5
10.29
�0.91
1.5�
1.3
�0.7
�1.4
�0.16�
0.18
�0.01�
0.13
0.00
�0.16
0.09
�0.22
�0.04�
0.35
Lake
Zurich
Ibo
mbc
200
8.1�
10�5
2.7�
10�5
10.2�
1.1
1.5�
1.2
�0.9
�1.0
�0.07�
0.12
�0.07�
0.07
�0.09�
0.11
�0.05�
0.19
0.06
�0.25
MeasuredwithAridus
IIon
NU3
Lake
Zurich
Ib10
02.8�
10�5
3.9�
10�5
10.1�
1.3
0.7�
2.7
�1.0
�2.0
�0.13�
0.14
0.04
�0.16
�0.05�
0.21
�0.15�
0.22
�0.31�
0.33
Lake
Zurich
Id10
02.3�
10�5
2.3�
10�5
10.0�
1.2
0.3�
2.9
�2.1
�1.7
�0.07�
0.13
�0.07�
0.09
�0.18�
0.22
�0.01�
0.25
0.07
�0.53
Lake
Zurich
Ie10
06.5�
10�5
2.2�
10�5
1�0
.2�
1.2
0.4�
2.3
0.3�
2.7
0.01
�0.27
0.00
�0.18
�0.14�
0.27
0.09
�0.31
�0.18�
0.57
Lake
Zurich
Ibo
mbb
100
3.2�
10�5
1.8�
10�5
10.0�
1.2
0.4�
2.9
�0.8
�1.7
�0.02�
0.13
�0.06�
0.09
�0.33�
0.22
0.15
�0.25
0.00
�0.53
Lake
Zurich
Ibo
mbc
408.0�
10�5
1.3�
10�5
1�3
.3�
2.6
�3.9
�4.9
3.2�
5.4
�0.13�
0.20
0.12
�0.21
�0.17�
0.39
0.15
�0.34
�0.14�
0.40
Lake
Zurich
Ibo
mbc
91.0�
10�4
�5.7
�10
�5
1�1
�11
�10�
23�7
�21
0.8�
1.4
0.16
�0.61
�0.8
�1.9
�1.1
�1.9
�0.3
�1.7
Lake
Zurich
Ibo
mbc
5.5
�3.8
�10
�5
1.9�
10�4
10�
2825
�49
3�
42�0
.4�
1.6
0.13
�0.91
�0.5
�1.6
�0.7
�2.6
�1.4
�2.5
Lake
Zurich
Imean
200
20�0
.1�
1.1
0.3�
1.7
�1.1
�1.6
�0.04�
0.21
0.00
�0.13
�0.05�
0.20
�0.04�
0.22
�0.10�
0.24
100
40.0�
0.2
0.4�
0.3
�0.9
�2.0
�0.05�
0.12
�0.02�
0.10
�0.18�
0.23
0.02
�0.27
�0.11�
0.35
401
�3.3
�2.6
�3.9
�4.9
3.2�
5.4
�0.13�
0.20
0.12
�0.21
�0.17�
0.39
0.15
�0.34
�0.14�
0.40
91
�1�
11�1
0�
23�7
�21
0.8�
1.4
0.16
�0.61
�0.8
�1.9
�1.1
�1.9
�0.3
�1.7
5.5
10�
2825
�49
3�
42�0
.4�
1.6
0.13
�0.91
�0.5
�1.6
�0.7
�2.6
�1.4
�2.5
aIndicatesthenum
berof
analysed
stan
dards
within
onean
alytical
session,insteadof
thenum
ber(N)of
analytical
sessionsforstan
dard
solution
sor
individu
almeasu
remen
tsfortheother
samples.bDen
otes
3115Sn
measu
redrelative
toSP
EX
CLS
N2-2Y
andcorrectedfordifferen
cebe
tween
SPEX
CLS
N2-2Y
andNISTSR
M31
61a.
cMeasu
redwith
Aridu
sII
onaNuPlasmaII.
dUncertainty
refers
to95
%conden
ceinterval
t 0.95,n�1�
SD/On).eFo
rthelake
sedimen
t,tw
oaliquo
tsweredigested
.“b
omb”
refers
tothePa
rrbo
mbdigestion,thesecondaliquo
twas
digested
onthehotplate.
NIST:N
ISTSR
M31
61a;
SPEX:S
PEXCLS
N2-2Y
;Lak
eZu
rich
Ix:x
refers
tosepa
rate
columnch
emistry.
fSn
(ppb
)concentrationrefers
tomeasu
remen
tsolution
.
282 | J. Anal. At. Spectrom., 2020, 35, 273–292 This journal is © The Royal Society of Chemistry 2020
JAAS Paper
Ope
n A
cces
s A
rtic
le. P
ublis
hed
on 1
9 D
ecem
ber
2019
. Dow
nloa
ded
on 2
/1/2
022
10:4
8:33
AM
. T
his
artic
le is
lice
nsed
und
er a
Cre
ativ
e C
omm
ons
Attr
ibut
ion-
Non
Com
mer
cial
3.0
Unp
orte
d L
icen
ce.
View Article Online

Paper JAAS
Ope
n A
cces
s A
rtic
le. P
ublis
hed
on 1
9 D
ecem
ber
2019
. Dow
nloa
ded
on 2
/1/2
022
10:4
8:33
AM
. T
his
artic
le is
lice
nsed
und
er a
Cre
ativ
e C
omm
ons
Attr
ibut
ion-
Non
Com
mer
cial
3.0
Unp
orte
d L
icen
ce.
View Article Online
values compared to the NIST 3161a Sn standard, their 3115Snvalues are indistinguishable from each other considering theiranalytical uncertainty (Table 4). The 3115Sn data for the columnprocessed Sn standard solutions (NIST 3161a, SPEX CLSN2-2Y)show similar negative offsets. First and most importantly, thisshows that samples processed through the new analyticalprocedure yield accurate data relative to each other. Therefore,no In interference correction was applied to our data. Second,these observations also indicate that the consistent negativeoffsets are caused by small In impurities in the NIST SRM 3161astandard solution, while In is virtually quantitatively removedduring our chromatographic separation procedure. This leadsto an articially induced higher 3115Sn value for the NIST SRM3161a standard analyses, while the sample data is not affectedby this problem. Ideally, the NIST SRM 3161a standard shouldalso be further puried for In.
Because of the high abundances of 120Sn, 122Sn and 124Sn,the Te interference correction can tolerate larger amounts of Tecompared to Cd or In. Without Te correction on the denomi-nator isotope 120Sn, Te/Sn ratios of up to 3 � 10�3 can betolerated (Fig. 1d–f). If an additional Te interference correctionon 120Sn is applied, a Te/Sn ratio of up to 1.2 � 10�2 still yieldsaccurate Sn isotope results (Fig. 1g–i). The Te/Sn ratios of theanalysed samples aer the chemical separation procedure were
Fig. 2 Cadmium isotope ratios measured for a 200 ppb Alfa Aesar Cd stacorrection. Symbols represent different measurement sessions, with eaclines the derived tolerance thresholds. The grey bands show the averag(2SD). The individual error bars denote the reproducibility (2SD) of the br115In/111Cd values were determined from the measured signal intensitiesfrom mass-scans performed prior to analysis.
This journal is © The Royal Society of Chemistry 2020
generally below 8.0 � 10�5. The Te interferences were moni-tored using 125Te and 126Te and the results aer interferencecorrection with each isotope were compared. Our data showthat interference correction using 125Te results in a slightlybetter reproducibility, because 126Te needs an additionalcorrection for 126Xe and this increases the uncertainty of thecorrection (Table S2†). A proportionally higher background wasobserved for 125Te compared to 126Te, and this elevated 125Tebackground correlated with the signal intensity of Sn. Thisincreased background signal was likely caused by 124Sn-hydrides. Therefore, the correction with 125Te results inslightly lower 122Sn/120Sn and 124Sn/120Sn ratios when comparedto the 126Te corrected data (Table S2†). However, this differenceis smaller than the uncertainties of the analyses.
Uranium (238U) can interfere on 119Sn as double-chargedions. Tests show that the production rate of U++ is ca. 4% andthat U/Sn ratios of up to 5 � 10�5 leave the results unaffected(Fig. 1c). This demonstrates that relatively small blank amountsof U can already affect the data and thus U requires a cleanseparation from the Sn fraction. The U content of samples aerour chemical separation procedure were generally below thisthreshold.
The limits for adequate and reliable isobaric interferencecorrections for Cd isotope analyses were also assessed. To this
ndard solution doped with Sn (a, b), In (c) and Zn (d–f) after interferenceh data point showing the result of one analysis and the dotted verticale daily reproducibility of the 200 ppb Alfa Aesar Cd standard solutionacketing standard on the day of measurement. The 118Sn/111Cd and theof these isotopes during analysis. The 66Zn/111Cd ratios were obtained
J. Anal. At. Spectrom., 2020, 35, 273–292 | 283
JAAS Paper
Ope
n A
cces
s A
rtic
le. P
ublis
hed
on 1
9 D
ecem
ber
2019
. Dow
nloa
ded
on 2
/1/2
022
10:4
8:33
AM
. T
his
artic
le is
lice
nsed
und
er a
Cre
ativ
e C
omm
ons
Attr
ibut
ion-
Non
Com
mer
cial
3.0
Unp
orte
d L
icen
ce.
View Article Online
end, the 200 ppb Alfa Aesar Cd standard solution was dopedwith different amounts of Sn (0.050–0.200 ppb), In (0.005–0.200ppb) and Pd (0.005–0.075 ppb) (Fig. 2 and ESI Fig. S2†). Thetolerance levels were dened as the relative signal ratios of theisotopes used for interference correction (118Sn, 115In and 105Pd)against 111Cd. This allows a direct comparison with samplesscanned for purity before analysis. Standards with a 105Pd/111Cdratio of up to �5.5 � 10�4 (0.075 ppb Pd, Pd/Cd ¼ 3.8 � 10�4)and a 115In/111Cd ratio of up to�1.2� 10�2 (0.200 ppb In, In/Cd¼ 1.0 � 10�3) can still be accurately corrected for (Fig. S2a–c†and 2c). For Sn, the tolerance threshold was determined at118Sn/111Cd of �2.4 � 10�3 (0.150 ppb Sn, Sn/Cd ¼ 7.5 � 10�4)(Fig. 2a and b). Column processed standards and samples ingeneral yielded ratios below these limits (Table S3†).
Molecular interferences. Aer the chromatographic separa-tion procedure, Sn and Cd sample solutions were analysed forremaining elements that form molecular interferences. Theinuence of elements (Mo, Rh, Zr), generating molecularinterferences on Sn isotopes were tested with doped standardsup to the level identied in the sample solutions or above. Forthe following elemental ratios, no effect on the 3xSn values ofthe affected isotope were observed: Mo/Sn ¼ 1 � 10�2, Pd/Sn ¼1.25 � 10�3, Ru/Sn ¼ 1.5 � 10�3, Rh/Sn ¼ 7.5 � 10�4, Zr/Sn ¼ 5� 10�4, Ca/Sn ¼ 1.5 � 10�1, Cr/Sn ¼ 3.3 � 10�1.
For Cd analyses, major molecular interferences originatefrom Zn, Zr and Mo, that in particular inuence the two leastabundant Cd isotopes, 106Cd and 108Cd.27 Standard solutionsdoped with up to 0.400 ppb Mo (Mo/Cd ¼ 2 � 10�3, 95Mo/111Cd� 1.3 � 10�3 from mass-scans) and 0.030 ppb Zr (Zr/Cd ¼ 1.5 �10�4, 90Zr/111Cd � 3.0 � 10�4) yield accurate Cd isotope dataand thus these levels can be tolerated in the nal samplesolutions (ESI Fig. S2d–f†). For Zn, a tolerance threshold on66Zn/111Cd of �1 � 10�2 was estimated (�1 ppb Zn, Zn/Cd � 5� 10�3) (Fig. 2d–f). These limits were in general achieved forCd–Zn standards and samples passed through both Cd ionexchange columns (Table S3†). However, the Zn blank of sample
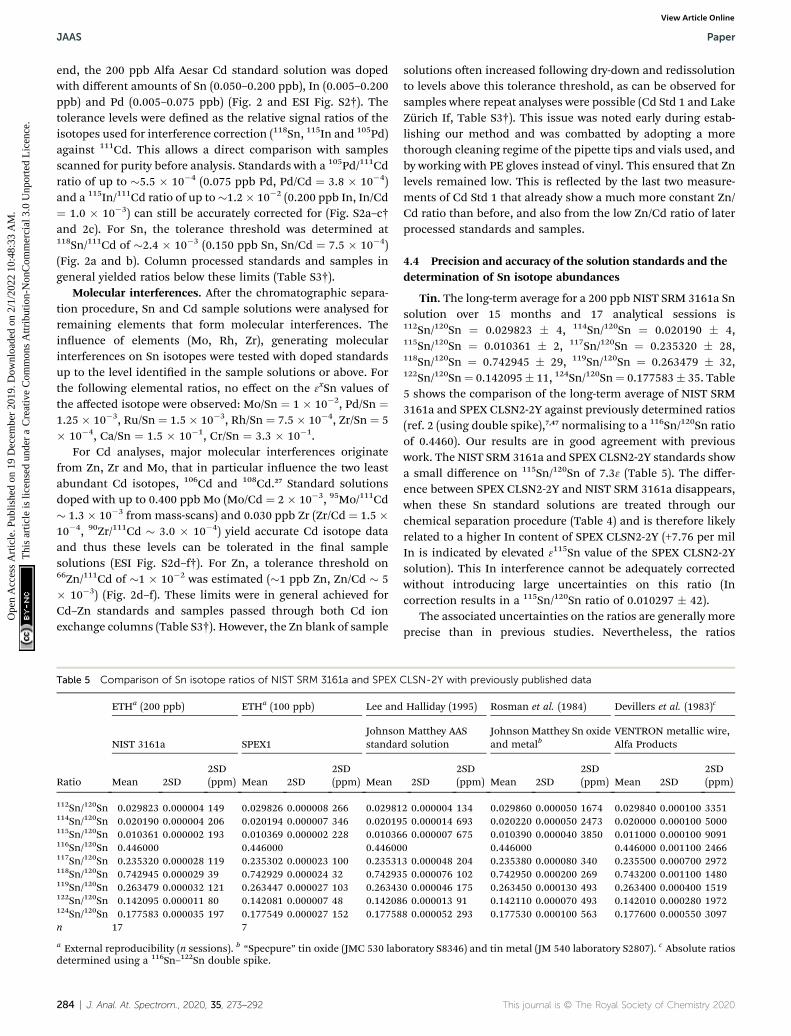
Table 5 Comparison of Sn isotope ratios of NIST SRM 3161a and SPEX
Ratio
ETHa (200 ppb) ETHa (100 ppb) Lee and
NIST 3161a SPEX1Johnsonstandar
Mean 2SD2SD(ppm) Mean 2SD
2SD(ppm) Mean
112Sn/120Sn 0.029823 0.000004 149 0.029826 0.000008 266 0.02981114Sn/120Sn 0.020190 0.000004 206 0.020194 0.000007 346 0.02019115Sn/120Sn 0.010361 0.000002 193 0.010369 0.000002 228 0.01036116Sn/120Sn 0.446000 0.446000 0.44600117Sn/120Sn 0.235320 0.000028 119 0.235302 0.000023 100 0.23531118Sn/120Sn 0.742945 0.000029 39 0.742929 0.000024 32 0.74293119Sn/120Sn 0.263479 0.000032 121 0.263447 0.000027 103 0.26343122Sn/120Sn 0.142095 0.000011 80 0.142081 0.000007 48 0.14208124Sn/120Sn 0.177583 0.000035 197 0.177549 0.000027 152 0.17758n 17 7
a External reproducibility (n sessions). b “Specpure” tin oxide (JMC 530 labdetermined using a 116Sn–122Sn double spike.
284 | J. Anal. At. Spectrom., 2020, 35, 273–292
solutions oen increased following dry-down and redissolutionto levels above this tolerance threshold, as can be observed forsamples where repeat analyses were possible (Cd Std 1 and LakeZurich If, Table S3†). This issue was noted early during estab-lishing our method and was combatted by adopting a morethorough cleaning regime of the pipette tips and vials used, andby working with PE gloves instead of vinyl. This ensured that Znlevels remained low. This is reected by the last two measure-ments of Cd Std 1 that already show a much more constant Zn/Cd ratio than before, and also from the low Zn/Cd ratio of laterprocessed standards and samples.
4.4 Precision and accuracy of the solution standards and thedetermination of Sn isotope abundances
Tin. The long-term average for a 200 ppb NIST SRM 3161a Snsolution over 15 months and 17 analytical sessions is112Sn/120Sn ¼ 0.029823 � 4, 114Sn/120Sn ¼ 0.020190 � 4,115Sn/120Sn ¼ 0.010361 � 2, 117Sn/120Sn ¼ 0.235320 � 28,118Sn/120Sn ¼ 0.742945 � 29, 119Sn/120Sn ¼ 0.263479 � 32,122Sn/120Sn¼ 0.142095� 11, 124Sn/120Sn¼ 0.177583� 35. Table5 shows the comparison of the long-term average of NIST SRM3161a and SPEX CLSN2-2Y against previously determined ratios(ref. 2 (using double spike),7,47 normalising to a 116Sn/120Sn ratioof 0.4460). Our results are in good agreement with previouswork. The NIST SRM 3161a and SPEX CLSN2-2Y standards showa small difference on 115Sn/120Sn of 7.33 (Table 5). The differ-ence between SPEX CLSN2-2Y and NIST SRM 3161a disappears,when these Sn standard solutions are treated through ourchemical separation procedure (Table 4) and is therefore likelyrelated to a higher In content of SPEX CLSN2-2Y (+7.76 per milIn is indicated by elevated 3115Sn value of the SPEX CLSN2-2Ysolution). This In interference cannot be adequately correctedwithout introducing large uncertainties on this ratio (Incorrection results in a 115Sn/120Sn ratio of 0.010297 � 42).
The associated uncertainties on the ratios are generally moreprecise than in previous studies. Nevertheless, the ratios
CLSN-2Y with previously published data
Halliday (1995) Rosman et al. (1984) Devillers et al. (1983)c
Matthey AASd solution
Johnson Matthey Sn oxideand metalb
VENTRON metallic wire,Alfa Products
2SD2SD(ppm) Mean 2SD
2SD(ppm) Mean 2SD
2SD(ppm)
2 0.000004 134 0.029860 0.000050 1674 0.029840 0.000100 33515 0.000014 693 0.020220 0.000050 2473 0.020000 0.000100 50006 0.000007 675 0.010390 0.000040 3850 0.011000 0.000100 90910 0.446000 0.446000 0.001100 24663 0.000048 204 0.235380 0.000080 340 0.235500 0.000700 29725 0.000076 102 0.742950 0.000200 269 0.743200 0.001100 14800 0.000046 175 0.263450 0.000130 493 0.263400 0.000400 15196 0.000013 91 0.142110 0.000070 493 0.142010 0.000280 19728 0.000052 293 0.177530 0.000100 563 0.177600 0.000550 3097
oratory S8346) and tin metal (JM 540 laboratory S2807). c Absolute ratios
This journal is © The Royal Society of Chemistry 2020
Paper JAAS
Ope
n A
cces
s A
rtic
le. P
ublis
hed
on 1
9 D
ecem
ber
2019
. Dow
nloa
ded
on 2
/1/2
022
10:4
8:33
AM
. T
his
artic
le is
lice
nsed
und
er a
Cre
ativ
e C
omm
ons
Attr
ibut
ion-
Non
Com
mer
cial
3.0
Unp
orte
d L
icen
ce.
View Article Online
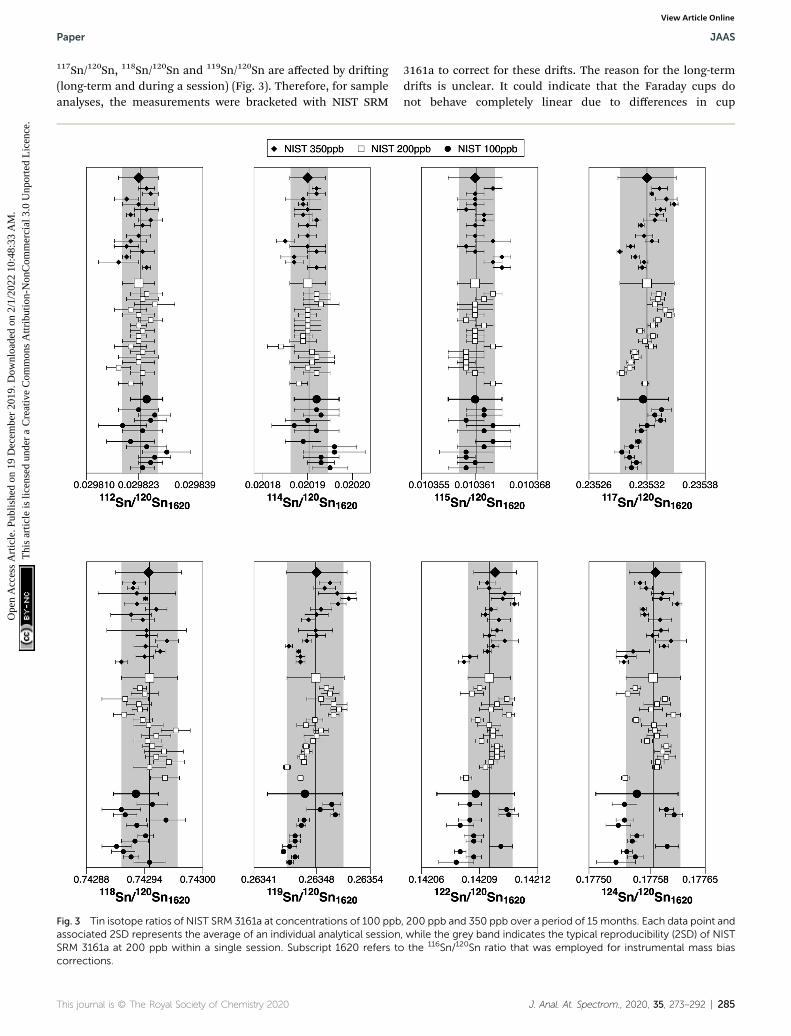
117Sn/120Sn, 118Sn/120Sn and 119Sn/120Sn are affected by driing(long-term and during a session) (Fig. 3). Therefore, for sampleanalyses, the measurements were bracketed with NIST SRM
Fig. 3 Tin isotope ratios of NIST SRM 3161a at concentrations of 100 ppbassociated 2SD represents the average of an individual analytical sessionSRM 3161a at 200 ppb within a single session. Subscript 1620 refers tocorrections.
This journal is © The Royal Society of Chemistry 2020
3161a to correct for these dris. The reason for the long-termdris is unclear. It could indicate that the Faraday cups donot behave completely linear due to differences in cup
, 200 ppb and 350 ppb over a period of 15 months. Each data point and, while the grey band indicates the typical reproducibility (2SD) of NISTthe 116Sn/120Sn ratio that was employed for instrumental mass bias
J. Anal. At. Spectrom., 2020, 35, 273–292 | 285

JAAS Paper
Ope
n A
cces
s A
rtic
le. P
ublis
hed
on 1
9 D
ecem
ber
2019
. Dow
nloa
ded
on 2
/1/2
022
10:4
8:33
AM
. T
his
artic
le is
lice
nsed
und
er a
Cre
ativ
e C
omm
ons
Attr
ibut
ion-
Non
Com
mer
cial
3.0
Unp
orte
d L
icen
ce.
View Article Online
efficiencies, however, the relatively prominent dris on the odd/even isotope ratios 117Sn/120Sn and 119Sn/120Sn may also suggestnuclear eld shi effect48 or the magnetic isotope effect49 asa potential source (Fig. 3). The typical reproducibility (2SD) ofthe NIST SRM 3161 200 ppb solution (dri corrected) withina single session was 0.9 for 3112Sn, 1.3 for 3114Sn, 1.2 for 3115Sn,0.16 for 3117Sn, 0.11 for 3118Sn, 0.17 for 3119Sn, 0.21 for 3122Snand 0.31 for 3124Sn.
Based on the long-term average for a 200 ppb NIST SRM3161a Sn solution (Table 5), new Sn isotope abundances werecalculated. The new Sn isotope abundances are more preciseand in good agreement with the previous recommendation ofIUPAC 2001 (ref. 50) (Table 6).
Cadmium. The long-term average for a 200 ppb Alfa Aesar Cdstandard solution measured over 17 months (corresponding to 40measurement days) is 106Cd/111Cd¼ 0.098544� 24, 108Cd/111Cd¼0.069914 � 12, 110Cd/111Cd ¼ 0.977034 � 69, 112Cd/111Cd ¼1.878560 � 60, 113Cd/111Cd ¼ 0.950066 � 72 and 114Cd/111Cd ¼2.227640� 107. For comparison with literature,42,51,52 our data wasinternally normalised to 110Cd/114Cd ¼ 0.438564 aer Rosman etal.52 (Table S4†). The ratios obtained in this study show a goodagreement with previously published results. Small variations arepresent between the newly obtained Cd isotope data and literaturefor the most and least abundant isotopes and may stem frominterferences or mass bias that was not fully corrected for.Importantly, the Cd isotope data obtained in this study for the AlfaAesar Cd standard represents a long-term average of a total of 1061individual analyses, whereas previous studies reported signi-cantly fewer measurements (Table S4†). The average daily repro-ducibility (2SD) achieved over this period was 1.2 for 3106Cd, 1.1 for3108Cd, 0.30 for 3110Cd, 0.19 for 3112Cd, 0.26 for 3113Cd and 0.27 for3114Cd. Some of the Cd ratios, in particular 110Cd/111Cd and113Cd/111Cd, also showed dris during and betweenmeasurementsessions. When using 110Cd/114Cd for internal normalisation, theratios involving the odd isotopes of Cd (113Cd/114Cd and the111Cd/114Cd) showed the most pronounced dris betweenmeasurement sessions. Within a measurement session, however,the 116Cd/114Cd ratio showed the most dri. The reason for suchdris is unclear, but may be related to the same effects as
Table 6 Sn isotope abundances in mole fractiona
ETHb 2SD Bohlke (2005)c
112 0.0097220 (15) 0.0097(1)114 0.0065822 (14) 0.0066(1)115 0.0033775 (7) 0.0034(1)116 0.1453838 (45) 0.1454(9)117 0.0767065 (94) 0.0768(7)118 0.242175 (12) 0.2422(9)119 0.085883 (11) 0.0859(4)120 0.325973 (23) 0.3258(9)122 0.0463168 (40) 0.0463(3)124 0.057880 (12) 0.0579(5)
a The 2SD uncertainties in parenthesis refer to last digits. b Abundancesand associated uncertainties were calculated based on data for NISTSRM 3161a 200 ppb (Table 5). c Representative Sn isotopecomposition from Bohlke.50
286 | J. Anal. At. Spectrom., 2020, 35, 273–292
described for Sn (differences in Faraday cup efficiencies and/ornuclear eld shis). Overall, this highlights the importance tobracket the sample measurements to the Alfa Aesar Cd standard,as done in this study. By applying a dri correction to the standarddata, a slightly improved average daily reproducibility of 1.0 for3106Cd, 1.1 for 3108Cd, 0.28 for 3110Cd, 0.16 for 3112Cd, 0.20 for3113Cd and 0.17 for 3114Cd was achieved.
4.5 Precision and accuracy of the sample measurements
Tin. The lake sediment (Lake Zurich I) with a high Snconcentration (67 ppm) and the CV3 meteorite Allende (0.63ppm) were used to determine the reproducibility (termedintermediate precision by ISO) and accuracy of the method.Eight aliquots of two individual digestions of Lake Zurich I wereprocessed independently through the newly established proce-dure. The reproducibility (2SD, n¼ 20) obtained for Lake ZurichI is slightly larger than the reproducibility of the NIST SRM3161a Sn standard: �0.1 � 1.1 for 3112Sn, 0.3 � 1.7 for 3114Sn,�1.1 � 1.6 for 3115Sn, �0.04 � 0.21 for 3117Sn, 0.00 � 0.13 for3118Sn, �0.05 � 0.20 for 3119Sn, �0.04 � 0.22 for 3122Sn and�0.10 � 0.24 for 3124Sn (Table 4, Fig. 4). Most Sn data of theanalysed lake sediments overlap with the composition of the200 ppb NIST SRM 3161a Sn standard solution within uncer-tainties. Similarly, the analysed aliquots of Allende overlap intheir Sn isotope composition with the NIST SRM 3161a Snstandard and Lake Zurich I considering the analytical uncer-tainty (Table 4 and Fig. 5). Exceptions are observed for 3115Sn.The different aliquots of Lake Zurich I and Allende consistentlytend to negative 3115Sn values, which implies the presence ofsmall In impurities in the NIST SRM 3161a Sn standard aspreviously discussed (Table 4).
To verify the method and to check for analytical artifactsassociated with organics released by the TRU Spec resin,aliquots of lake sediments were analysed using different intro-duction systems (Aridus II versus DSN). The isotopic composi-tion of the lake sediment Lake Zurich I measured with twodifferent desolvating systems, DSN 100 and Aridus II, are ingood agreement (Table 4). In addition, aliquots of samplesprepared by using the two-stage chromatographic separationprocedure only were measured and compared to samples withthe additional Pre-lter stage. Similar results are obtained whencomparing samples before and aer additional treating withPre-lter resin (Table 4 and Fig. 4). The exception are the lakesediments with additional Pre-lter treatment, which showa tendency to higher 3115Sn values and therefore are closer tothe values obtained for the NIST SRM 3161a Sn standard solu-tion. The reason behind this is unclear, but may indicate thatthese samples pick up a small additional In blank during Pre-lter treatment. Alternatively, organics may be partly respon-sible for the observed negative shi in 3115Sn. However,considering the analytical uncertainty, all isotopic ratiosmeasured with or without the third stage column (Pre-lterresin) are identical.
Cadmium. The same lake sediment (Lake Zurich I) with a Cdconcentration of �14 ppm, as well as column processedaliquots of the Alfa Aesar Cd standard with (Cd–Zn Std 1 to 4:
This journal is © The Royal Society of Chemistry 2020
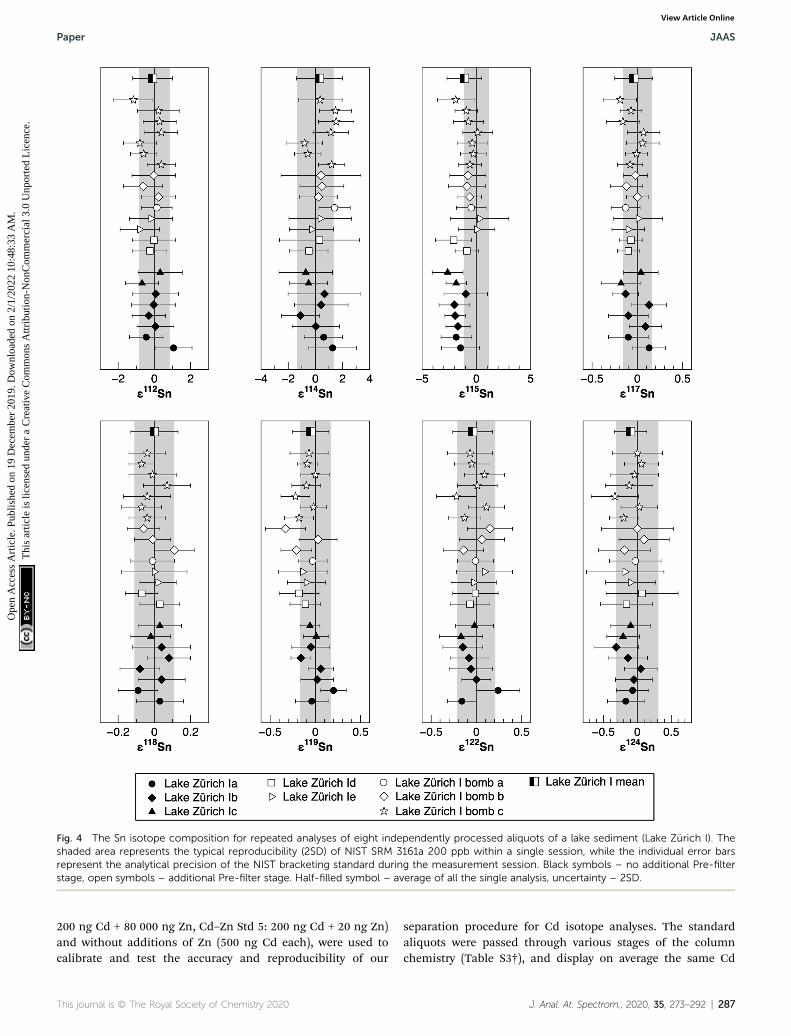
Fig. 4 The Sn isotope composition for repeated analyses of eight independently processed aliquots of a lake sediment (Lake Zurich I). Theshaded area represents the typical reproducibility (2SD) of NIST SRM 3161a 200 ppb within a single session, while the individual error barsrepresent the analytical precision of the NIST bracketing standard during the measurement session. Black symbols – no additional Pre-filterstage, open symbols – additional Pre-filter stage. Half-filled symbol – average of all the single analysis, uncertainty – 2SD.
Paper JAAS
Ope
n A
cces
s A
rtic
le. P
ublis
hed
on 1
9 D
ecem
ber
2019
. Dow
nloa
ded
on 2
/1/2
022
10:4
8:33
AM
. T
his
artic
le is
lice
nsed
und
er a
Cre
ativ
e C
omm
ons
Attr
ibut
ion-
Non
Com
mer
cial
3.0
Unp
orte
d L
icen
ce.
View Article Online
200 ng Cd + 80 000 ng Zn, Cd–Zn Std 5: 200 ng Cd + 20 ng Zn)and without additions of Zn (500 ng Cd each), were used tocalibrate and test the accuracy and reproducibility of our
This journal is © The Royal Society of Chemistry 2020
separation procedure for Cd isotope analyses. The standardaliquots were passed through various stages of the columnchemistry (Table S3†), and display on average the same Cd
J. Anal. At. Spectrom., 2020, 35, 273–292 | 287
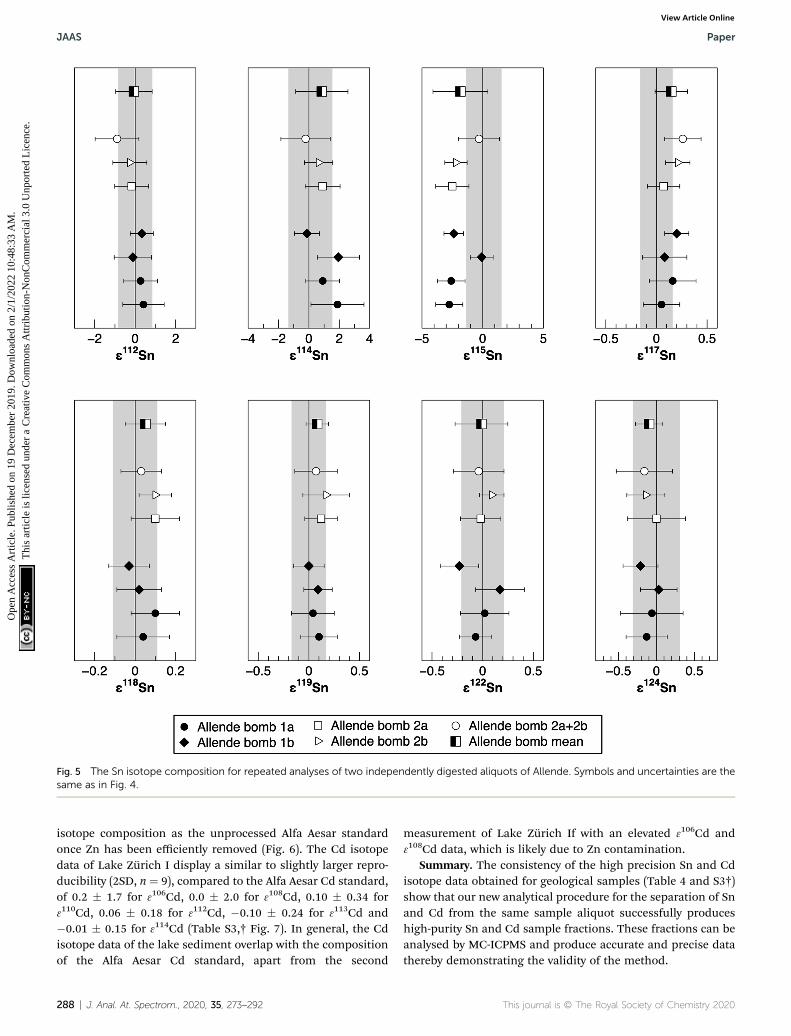
Fig. 5 The Sn isotope composition for repeated analyses of two independently digested aliquots of Allende. Symbols and uncertainties are thesame as in Fig. 4.
JAAS Paper
Ope
n A
cces
s A
rtic
le. P
ublis
hed
on 1
9 D
ecem
ber
2019
. Dow
nloa
ded
on 2
/1/2
022
10:4
8:33
AM
. T
his
artic
le is
lice
nsed
und
er a
Cre
ativ
e C
omm
ons
Attr
ibut
ion-
Non
Com
mer
cial
3.0
Unp
orte
d L
icen
ce.
View Article Online
isotope composition as the unprocessed Alfa Aesar standardonce Zn has been efficiently removed (Fig. 6). The Cd isotopedata of Lake Zurich I display a similar to slightly larger repro-ducibility (2SD, n ¼ 9), compared to the Alfa Aesar Cd standard,of 0.2 � 1.7 for 3106Cd, 0.0 � 2.0 for 3108Cd, 0.10 � 0.34 for3110Cd, 0.06 � 0.18 for 3112Cd, �0.10 � 0.24 for 3113Cd and�0.01 � 0.15 for 3114Cd (Table S3,† Fig. 7). In general, the Cdisotope data of the lake sediment overlap with the compositionof the Alfa Aesar Cd standard, apart from the second
288 | J. Anal. At. Spectrom., 2020, 35, 273–292
measurement of Lake Zurich If with an elevated 3106Cd and3108Cd data, which is likely due to Zn contamination.
Summary. The consistency of the high precision Sn and Cdisotope data obtained for geological samples (Table 4 and S3†)show that our new analytical procedure for the separation of Snand Cd from the same sample aliquot successfully produceshigh-purity Sn and Cd sample fractions. These fractions can beanalysed by MC-ICPMS and produce accurate and precise datathereby demonstrating the validity of the method.
This journal is © The Royal Society of Chemistry 2020
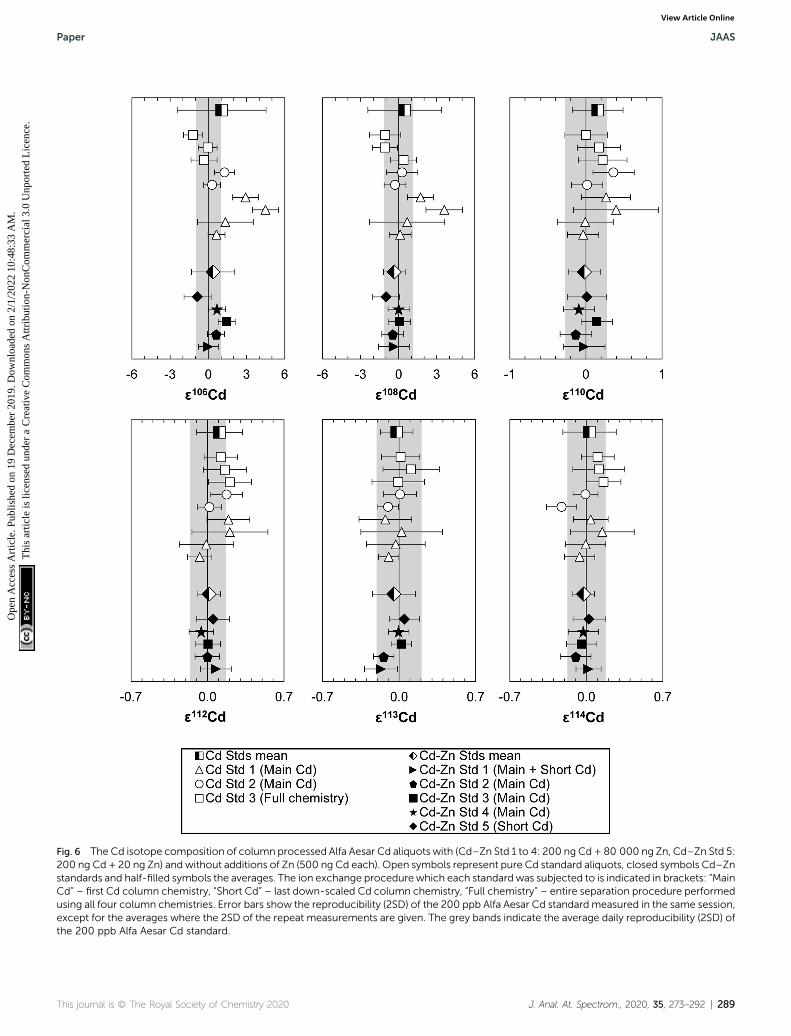
Fig. 6 The Cd isotope composition of column processed Alfa Aesar Cd aliquots with (Cd–Zn Std 1 to 4: 200 ng Cd + 80 000 ng Zn, Cd–Zn Std 5:200 ng Cd + 20 ng Zn) and without additions of Zn (500 ng Cd each). Open symbols represent pure Cd standard aliquots, closed symbols Cd–Znstandards and half-filled symbols the averages. The ion exchange procedurewhich each standard was subjected to is indicated in brackets: “MainCd” – first Cd column chemistry, “Short Cd” – last down-scaled Cd column chemistry, “Full chemistry” – entire separation procedure performedusing all four column chemistries. Error bars show the reproducibility (2SD) of the 200 ppb Alfa Aesar Cd standardmeasured in the same session,except for the averages where the 2SD of the repeat measurements are given. The grey bands indicate the average daily reproducibility (2SD) ofthe 200 ppb Alfa Aesar Cd standard.
This journal is © The Royal Society of Chemistry 2020 J. Anal. At. Spectrom., 2020, 35, 273–292 | 289
Paper JAAS
Ope
n A
cces
s A
rtic
le. P
ublis
hed
on 1
9 D
ecem
ber
2019
. Dow
nloa
ded
on 2
/1/2
022
10:4
8:33
AM
. T
his
artic
le is
lice
nsed
und
er a
Cre
ativ
e C
omm
ons
Attr
ibut
ion-
Non
Com
mer
cial
3.0
Unp
orte
d L
icen
ce.
View Article Online

Fig. 7 The Cd isotope composition of the measured lake sediment (Lake Zurich I) aliquots. Symbols are the same as in Fig. 4. Uncertainties arethe same as in Fig. 6.
JAAS Paper
Ope
n A
cces
s A
rtic
le. P
ublis
hed
on 1
9 D
ecem
ber
2019
. Dow
nloa
ded
on 2
/1/2
022
10:4
8:33
AM
. T
his
artic
le is
lice
nsed
und
er a
Cre
ativ
e C
omm
ons
Attr
ibut
ion-
Non
Com
mer
cial
3.0
Unp
orte
d L
icen
ce.
View Article Online
5. Conclusion
We developed and validated a new analytical method to sepa-rate Sn and Cd from geological samples for isotope analysis byMC-ICPMS at high precision. The new separation techniqueyields puried Sn fractions withminimal amounts of Cd, Te andother interfering elements and high Sn recoveries (>80%).
290 | J. Anal. At. Spectrom., 2020, 35, 273–292
Interference tests with doped Sn solutions show that besidesCd, In and Te, in particular the removal of U is critical becauseof the relatively high U++ production rates that can reach 4%depending on instrument conditions. Solutions require U/Snratios of less than 5 � 10�5 for accurate data. Tellurium inter-ference correction on Sn isotopes yields better precision whenusing 125Te (instead of 126Te) for correction. Moreover, our data
This journal is © The Royal Society of Chemistry 2020
Paper JAAS
Ope
n A
cces
s A
rtic
le. P
ublis
hed
on 1
9 D
ecem
ber
2019
. Dow
nloa
ded
on 2
/1/2
022
10:4
8:33
AM
. T
his
artic
le is
lice
nsed
und
er a
Cre
ativ
e C
omm
ons
Attr
ibut
ion-
Non
Com
mer
cial
3.0
Unp
orte
d L
icen
ce.
View Article Online
indicate that both the NIST SRM 3161a and SPEX CLSN-2Y Snstandard solution contain small traces of In that affect the 115Sndata. The differences in 3115Sn between the two standardssuggests that the SPEX solution contains 0.76 per mil more Inthan NIST SRM 3161a.
For Cd isotope analyses, the puried Cd fractions containPd, Sn and In below their determined tolerance limits and Zn isefficiently separated to enable accurate 106Cd and 108Cd isotopedata. Inference tests demonstrate that notably high Zn levels(66Zn/111Cd > 1 � 10�2) yield inaccurate 106Cd and 108Cd datadue to interfering Zn-argides formed in the plasma. Such levelscan be easily generated as blank contribution during theanalytical procedure and therefore need careful monitoring, ifthe low abundance Cd isotopes are targeted.
Our new analytical procedure allows for the simultaneousdetection of all ten Sn isotopes and the correction of directisobaric interferences. Similarly, it also includes the simulta-neous measurement of all eight Cd isotopes including Pd, Inand Sn isotopes for isobaric interference correction. The newdata obtained for the NIST SRM 3161a Sn standard is in excel-lent agreement with those previously determined.2,7,47 Based onour data, more precise absolute abundances of natural Sn weredetermined. The precisions for Sn and Cd isotope data achievedusing our new procedure are sufficient to identify potentialsmall nucleosynthetic or cosmogenic effects in meteorites. Ourndings also illustrate the challenges related to extending ananalytical method to low abundance isotopes or improving themeasurement precision through increased counting statisticsand improved instrumentation available. It requires carefulattention to potential interferences. Molecular interferences(e.g., argides or oxides) as well as double charged ions formed inthe plasma, or contamination of single standard solutions,previously unproblematic, can hamper the data quality whenmoving to higher precision.
Conflicts of interest
There are no conicts to declare.
Acknowledgements
We would like to thank Adrian Gilli for the provision of thesample from Lake Zurich. The research leading to these resultshas received funding from the Swiss National Science Founda-tion (Project 200021_149282). Parts of this work have beencarried out within the framework of the National Centre forCompetence in Research PlanetS supported by the SwissNational Science Foundation. We would also like to thank TimConway and Matthias Sieber for their helpful input regardingthe early Zn blank issue and Maria Kirchenbaur, MortenAndersen and Tim Elliot for helpful discussion.
References
1 J. R. De Laeter and P. M. Jeffery, J. Geophys. Res., 1965, 70,2895–2903.
This journal is © The Royal Society of Chemistry 2020
2 C. Devillers, T. Lecomte and R. Hagemann, Int. J. MassSpectrom. Ion Phys., 1983, 50, 205–217.
3 N. J. McNaughton and K. J. R. Rosman, Geochim. Cosmochim.Acta, 1991, 55, 499–504.
4 K. J. R. Rosman and N. J. McNaughton, Int. J. Mass Spectrom.Ion Processes, 1987, 75, 91–98.
5 J. R. De Laeter and P. M. Jeffery, Geochim. Cosmochim. Acta,1967, 31, 969–985.
6 R. D. Loss, K. J. R. Rosman and J. R. de Laeter, Geochim.Cosmochim. Acta, 1990, 54, 3525–3536.
7 D.-C. Lee and A. N. Halliday, Int. J. Mass Spectrom. IonProcesses, 1995, 146–147, 35–46.
8 D. Berger, E. Figueiredo, G. Brugmann and E. Pernicka, J.Archaeol. Sci., 2018, 92, 73–86.
9 G. Brugmann, D. Berger and E. Pernicka, Geostand. Geoanal.Res., 2017, 41, 437–448.
10 R. Clayton, P. Andersson, N. H. Gale, C. Gillis andM. J. Whitehouse, J. Anal. At. Spectrom., 2002, 17, 1248–1256.
11 M. Haustein, C. Gillis and E. Pernicka, Archaeometry, 2010,52, 816–832.
12 A. H. Mason, W. G. Powell, H. A. Bankoff, R. Mathur,A. Bulatovic, V. Filipovic and J. Ruiz, J. Archaeol. Sci., 2016,69, 110–117.
13 E. Yamazaki, S. Nakai, Y. Sahoo, T. Yokoyama, H. Mifune,T. Saito, J. Chen, N. Takagi, N. Hokanishi and A. Yasuda, J.Archaeol. Sci., 2014, 52, 458–467.
14 E. Yamazaki, S. i. Nakai, T. Yokoyama, S. Ishihara andH. Tang, Geochem. J., 2013, 47, 21–35.
15 F. Moynier, T. Fujii and P. Telouk, Anal. Chim. Acta, 2009,632, 234–239.
16 D. Malinovskiy, L. Moens and F. Vanhaecke, Environ. Sci.Technol., 2009, 43, 4399–4404.
17 N. Badullovich, F. Moynier, J. Creech, F. Z. Teng andP. A. Sossi, Geochem. Perspect. Lett., 2017, 24–28, DOI:10.7185/geochemlet.1741.
18 X. Wang, Q. Amet, C. Fitoussi and B. Bourdon, Geochim.Cosmochim. Acta, 2018, 228, 320–335.
19 A. M. Davis, inMeteorites and the Early Solar System II, ed. D.S. Lauretta and H. Y. McSween, University of Arizona Press,2006, vol. 1, pp. 295–307.
20 K. Lodders, Astrophys. J., 2003, 591, 1220.21 K. P. Jochum, A. W. Hofmann and H. M. Seufert, Geochim.
Cosmochim. Acta, 1993, 57, 3585–3595.22 F. Farges, R. L. Linnen and G. E. Brown, Can. Mineral., 2006,
44, 795–810.23 R. L. Linnen, M. Pichavant, F. Holtz and S. Burgess, Geochim.
Cosmochim. Acta, 1995, 59, 1579–1588.24 K. J. R. Rosman and J. R. De Laeter, Geochim. Cosmochim.
Acta, 1974, 38, 1665–1677.25 K. J. R. Rosman and J. R. De Laeter, Earth Planet. Sci. Lett.,
1988, 89, 163–169.26 F. Wombacher, M. Rehkamper, K. Mezger, A. Bischoff and
C. Munker, Geochim. Cosmochim. Acta, 2008, 72, 646–667.27 F. Wombacher, M. Rehkamper, K. Mezger and C. Munker,
Geochim. Cosmochim. Acta, 2003, 67, 4639–4654.28 C. S. Palk, M. Schonbachler, M. Rehkamper and B. J. Wood,
Lunar Planet. Sci., 2015, 46, 2822.
J. Anal. At. Spectrom., 2020, 35, 273–292 | 291
JAAS Paper
Ope
n A
cces
s A
rtic
le. P
ublis
hed
on 1
9 D
ecem
ber
2019
. Dow
nloa
ded
on 2
/1/2
022
10:4
8:33
AM
. T
his
artic
le is
lice
nsed
und
er a
Cre
ativ
e C
omm
ons
Attr
ibut
ion-
Non
Com
mer
cial
3.0
Unp
orte
d L
icen
ce.
View Article Online
29 E. Zinner, in Treatise on Geochemistry, ed. H. D. Holland andK. K. Turekian, Elsevier, Oxford, 2nd edn, 2014, pp. 181–213.
30 W. Akram, M. Schonbachler, S. Bisterzo and R. Gallino,Geochim. Cosmochim. Acta, 2015, 165, 484–500.
31 A. Trinquier, J.-L. Birck and C. J. Allegre, Astrophys. J., 2007,655, 1179–1185.
32 C. Arlandini, F. Kappeler, K. Wisshak, R. Gallino, M. Lugaro,M. Busso and O. Straniero, Astrophys. J., 1999, 525, 886–900.
33 S. Bisterzo, R. Gallino, O. Straniero, S. Cristallo andF. Kappeler, Mon. Not. R. Astron. Soc., 2011, 418, 284–319.
34 C. Burkhardt, T. Kleine, F. Oberli, A. Pack, B. Bourdon andR. Wieler, Earth Planet. Sci. Lett., 2011, 312, 390–400.
35 M. Fischer-Godde and T. Kleine, Nature, 2017, 541, 525–527.36 D. G. Sands, J. R. De Laeter and K. J. R. Rosman, Earth Planet.
Sci. Lett., 2001, 186, 335–346.37 J. Y. Hu and N. Dauphas, J. Anal. At. Spectrom., 2017, 32,
2024–2033.38 M. Kirchenbaur, A. Heuser, A. Bragagni and F. Wombacher,
Geostand. Geoanal. Res., 2018, 42, 361–377.39 A. F. Holleman, E. Wiberg and N. Wiberg, Lehrbuch der
Anorganischen Chemie, Walter de Gruyter, 2007.40 M. A. Fehr, M. Rehkamper and A. N. Halliday, Int. J. Mass
Spectrom., 2004, 232, 83–94.
292 | J. Anal. At. Spectrom., 2020, 35, 273–292
41 W. Yi, A. N. Halliday, D.-C. Lee and J. N. Christensen,Geochim. Cosmochim. Acta, 1995, 59, 5081–5090.
42 F. Wombacher, M. Rehkamper and K. Mezger, Geochim.Cosmochim. Acta, 2004, 68, 2349–2357.
43 E. R. Toth, M. Schonbachler, M. Friebel and M. A. Fehr,Meteorit. Planet. Sci., 2017, 52, A353.
44 M. Gault-Ringold and C. H. Stirling, J. Anal. At. Spectrom.,2012, 27, 449.
45 K. Murphy, M. Rehkamper, K. Kreissig, B. Coles and T. vande Flierdt, J. Anal. At. Spectrom., 2016, 31, 319–327.
46 C. Pin and J. Rodriguez, in Treatise on Geochemistry, ed. K. K.Turekian, Elsevier, Oxford, 2nd edn, 2014, pp. 147–170.
47 K. J. R. Rosman, R. D. Loss and J. R. De Laeter, Int. J. MassSpectrom. Ion Processes, 1984, 56, 281–291.
48 J. Bigeleisen, J. Am. Chem. Soc., 1996, 118, 3676–3680.49 A. L. Buchachenko, J. Phys. Chem. B, 2013, 117, 2231–2238.50 J. K. Bohlke, J. Phys. Chem. Ref. Data, 2005, 34, 57.51 S. Ripperger and M. Rehkamper, Geochim. Cosmochim. Acta,
2007, 71, 631–642.52 K. J. R. Rosman, I. L. Barnes, L. J. Moore and J. W. Gramlich,
Geochem. J., 1980, 14, 269–277.
This journal is © The Royal Society of Chemistry 2020