Embed Size (px)
Citation preview

1
Protein crystallization as a process step in a novel meso oscillatory flow reactor:
study of lysozyme phase behavior
Filipa Castro1, 2
, António Ferreira1, José A. Teixeira
2 and Fernando Rocha
1
1. LEPABE - Laboratory for Process Engineering, Environment, Biotechnology and
Energy, Faculty of Engineering of the University of Porto, Rua Roberto Frias, s/n,
4200-465 Porto, Portugal.
2. CEB - Centre for Biological Engineering, University of Minho, Campus de Gualtar,
4710-057 Braga, Portugal.
Mailing addresses:
Faculty of Engineering of the University of Porto, Rua do Dr. Roberto Frias, s/n, 4200-
465 Porto, PORTUGAL
Tel.: +351 22 508 16 87
E-mail: [email protected]
Abstract
In the present work, it is reported for the first time the study of the applicability of a
novel meso oscillatory flow reactor (meso-OFR) for protein crystallization as a process
step. Crystallization assays carried out in the designed device enabled to derive a two-
dimensional lysozyme phase diagram (lysozyme concentration against sodium chloride
concentration). Results evidence the formation of several types of crystals (different size
and shape), with a strong influence of salt concentration on crystal shape. Results also
show that lysozyme remains active at the end of the experiments. Furthermore, it was
possible to verify the reduction of the metastability zone when compared to lysozyme
crystallization conducted under quiescent conditions. Induction times were also
measured by online monitoring of the turbidity of the crystallization solution, obtained
Page 1 of 34
ACS Paragon Plus Environment
Crystal Growth & Design
123456789101112131415161718192021222324252627282930313233343536373839404142434445464748495051525354555657585960
This article was published in Crystal Growth and Design, 16(7), 3748-3755, 2016 http://dx.doi.org/10.1021/acs.cgd.6b00262

2
values being between 41 and 900 minutes. Beyond providing improved understanding
of protein phase behavior under oscillatory flow mixing, the results are very promising
regarding the feasibility of the designed methodology for protein crystallization as a
process step.
Page 2 of 34
ACS Paragon Plus Environment
Crystal Growth & Design
123456789101112131415161718192021222324252627282930313233343536373839404142434445464748495051525354555657585960
3
Introduction
Protein crystallization has been focused on the production of diffraction-quality single
crystals for protein structure determination by crystallography1–3
. Research conducted
during the last years has led to improved methodologies for the production of high-
quality protein crystals allowing obtaining high-quality X-ray diffraction patterns, and
leading thus to information on structure biology3. However, protein crystallization also
offers many advantages as a means of protein purification at the industrial scale.
Compared to conventional purification techniques, such as chromatography,
crystallization is a cost-effective alternative since high-purity proteins can be obtained
from a single-step operation2,4–8
. Further, protein crystals have a longer storage life and
greater purity than the dissolved form, which opens up the number of potential
applications for the pharmaceutical industry, from formulation and storage of proteins
to drug delivery1,4,9
.
Unlike protein structure determination, where single, large, stable and well-diffracting
crystals are required and usually obtained by slow-growing processes, rapid and
quantitative crystallization is needed for large-scale protein purification processes. As
most of the industrial processes, recovery yield as well as purity must be high and the
crystallization time low, so that growth kinetics should be fast (hours)2,4,10,11
. Moreover,
reagents must be inexpensive, compounds should be of pharmaceutical grade and
proteins must not lose their potency after crystals are redissolved1,11
. In contrast to
structural analysis, large single crystal shape is not as important, but crystals with a
certain size, shape and mechanical strength are desirable, in order to be easily separated
from their mother liquor, namely by filtration or centrifugation1,2,10–12
.
Identification of crystallization conditions of a protein is still difficult, particularly for
purification purposes where the crystallization step has to meet specific
Page 3 of 34
ACS Paragon Plus Environment
Crystal Growth & Design
123456789101112131415161718192021222324252627282930313233343536373839404142434445464748495051525354555657585960

4
requirements4,11,13
. It requires knowledge about the thermodynamic properties of the
protein solution, concentration of the protein, temperature and characteristics of the
solvent (e.g., pH, ionic strength, buffer concentration and identity, and any
additives)3,14
. The traditional method to study protein solubility, in response to different
operating conditions, is to construct a phase diagram, commonly protein concentration
against precipitant agent concentration. A phase diagram is divided by the solubility
curve into two areas corresponding to undersaturated and supersaturated state of a
protein solution. The supersaturated area comprises of the metastable, nucleation and
precipitation zones3,10,11,13,14
. In the nucleation and precipitation zones the protein is
either crystalline or precipitated, whereas in the metastable zone the probability of
nucleation occurrence is very low but already existing crystals could grow3. However,
complete phase diagrams for prediction of protein crystallization are rarely available
and crystallization conditions are usually found by a trial-and-error approach. The few
reports published include the work of Hekmat12
and Smejkal5 on the crystallization of
lysozyme, the works of Smejkal9 and Hebel
15 both on the crystallization of therapeutic
antibodies and more recently the study conducted by Huettmann11
on the crystallization
of interferon gamma.
While protein crystallization is usually performed under quiescent conditions, protein
crystallization as a process step requires a minimum of agitation. Otherwise crystals
sink to the bottom, grow into each other and the crystal growth is diffusion limited
leading to long process durations and/or low yields9,16
. Studies concerning the influence
of the type and degree of agitation on protein crystallization can be found in the
literature. A reduced nucleation time was observed in an unbaffled stirred vessel17
, in a
wave shaker18
and under oscillatory flow16
. Smejkal et al.5 observed a significantly
faster onset of the crystallization of lysozyme and Fab-fragment of the therapeutic
Page 4 of 34
ACS Paragon Plus Environment
Crystal Growth & Design
123456789101112131415161718192021222324252627282930313233343536373839404142434445464748495051525354555657585960

5
antibody Canakinumab in stirred vessels when compared to non-agitated systems.
Besides, authors verified that further increase of the agitation rate resulted in the
decrease of lysozyme crystallization onset. In contrast, a prolonged nucleation time was
verified in a rotary shaker19
and under mechanical vibration20
. Vekilov and
Rosenberger21
suggested that lysozyme growth cessation and deceleration were due to
convection-enhanced supply of impurities to the interface. Shear forces were also
related to limit the attachment of lysozyme growth units22
.
Another key issue concerns the scalability of the process1,11
. Protein crystallization on
process scale is usually performed in stirred tank crystallizers. Commonly suggested
scale-up criteria such as minimum agitation rate to keep the crystals in suspension or
impeller tip speed are not always successful and sometimes the scale-up criterion has to
be based on experimental data9,23
. Moreover, large stirred tanks are usually
characterized by low mixing efficiency that give rise to excess local concentrations4,
and in its turn leads to spontaneous nucleation. Besides, shear stresses exerted by the
impellers can lead to protein denaturation and damaged crystals4,7
. Another important
concern is the fact that often limited amounts of protein are available, making difficult
the implementation of experiments on a large scale.
So far, only a few reports have been published on protein crystallization as a process
step. The most prominent example is the industrial implementation of the crystallization
process of insulin23
. Other examples include studies on the crystallization of lysozyme
5,12,15,24–26, ovalbumin
17, L-methionine γ-lyase
27, fungal lipases
10,28 and urate oxidase
29.
Studies have also been reported on more complex proteins like monoclonal
antibodies9,11,30
, more difficult to crystallize due to their large size and structural
flexibility15
. More recently, Neugebauer and Kinast7 reported the development of a
tubular-plug flow crystallizer for the continuous lysozyme crystallization. Although the
Page 5 of 34
ACS Paragon Plus Environment
Crystal Growth & Design
123456789101112131415161718192021222324252627282930313233343536373839404142434445464748495051525354555657585960

6
studies published show the feasibility of protein crystallization as a means of
purification, further work is required in order to establish the latter as an alternative to
the existing downstream processing techniques. A limited number of works were
performed under well-defined and scalable operating conditions7. In addition, some of
the reports lack information about protein phase behavior, crystallization kinetics and
yield31
, and flow conditions29
. Furthermore, rather long process durations and/or low
yields were observed in most cases9,16,29–31
.
In order to overcome some of the gaps observed in common crystallizers, a novel meso
oscillatory flow reactor (meso- OFR) was developed by members of the present
research team32
. The device is operated under oscillatory flow mixing that has been
proved to result into significant enhancement in processes such as mass transfer and
particle mixing33,34
, particularly relevant for crystallization processes. Indeed,
significant enhancement in crystal characteristics and reduction of operation time have
been reported for the crystallization of hydroxyapatite35,36
. In addition, the reactor can
be easily scaled up by the addition in series of other identical meso-OFR unities. In this
context, the present work aims to study, for the first time, the applicability of the meso-
OFR on protein crystallization for purification purposes. Lysozyme was used as a
protein crystallization model. Like any industrial process it is intended to obtain
maximum yield and purification, and to achieve this rapidly. Control of crystal size is as
well important. Optimization with respect to all these criteria has to be based on a
fundamental understanding of the process, that is, knowledge of the phase diagram and
kinetics. For this, different experimental conditions were screened by varying protein
and precipitating agent concentration in order to derive a sufficiently quantitative
crystallization phase diagram of the protein under study. Induction times were measured
by online monitoring of the turbidity of the crystallization solution. The obtained
Page 6 of 34
ACS Paragon Plus Environment
Crystal Growth & Design
123456789101112131415161718192021222324252627282930313233343536373839404142434445464748495051525354555657585960

7
crystals were characterized by optical microscopy and their activity was measured.
Additionally, crystal yield was estimated.
Materials and Methods
Proteins and chemicals
Chicken egg-white lysozyme was purchased from Sigma-Aldrich (Fluka-62971,
Germany, lot #BCBJ2814V) and was used without further purification. One stock
solution of 0.2 M sodium acetate buffer at pH 4.7 was prepared using sodium acetate
trihydrate from Sigma-Aldrich (99,5 %, Germany) and glacial acetic acid from Merck
(100 %, Germany) to adjust the pH. Sodium chloride was obtained from Panreac
AppliChem (99,5%, Germany). Several lysozyme (5 to 50 mg.mL-1
) and sodium
chloride (2.5 to 6 %(w/v)) solutions were prepared in the sodium acetate buffer solution,
pH of the sodium chloride solution being posteriorly adjusted with a 1 M hydroxide
sodium (Pronolab, Portugal) solution. All the solutions were prepared in ultra-pure
water (Milli Q water, resistivity of 18.2 MΩ.cm-1
at 25 °C) and filtered through a 0.2
µm cut-off membrane (Sigma-Aldrich, Whatman, Germany). Lysozyme concentrations
were measured by UV spectroscopy (ScanSpec UV-VIS, Sarspec, Portugal) at 280 nm
using a known extinction coefficient (2.5 L.g-1
.cm-1
)9.
Experimental installation
Lysozyme crystallization trials were carried out in the experimental set-up represented
in Figure 1. It involves the meso-OFR placed vertically, a mixing chamber and a
measuring cell connected to a spectrophotometer for turbidity measurement. The device
consists of a 35 cm long and 3 mm internal diameter glass jacketed tube provided with
smooth periodic constrictions (SPC) and has an approximate volume of 4 mL (Figure
1). The crystallization solution was oscillated using a piston moved by a stirring motor
(CAT R100C, United States of America). The oscillating device was custom-built. The
Page 7 of 34
ACS Paragon Plus Environment
Crystal Growth & Design
123456789101112131415161718192021222324252627282930313233343536373839404142434445464748495051525354555657585960

8
reactor is operated under oscillatory flow mixing, controlled by the oscillation
frequency (f) and amplitude (x0) that were fixed at 1.83 Hz and 4 mm, respectively. The
value of the amplitude corresponds to the center-to-peak amplitude, and the
measurements were performed in the tube without constrictions. Reactants were fed into
the set-up by means of a syringe pump (NE-4000, New Era, United States of America).
Temperature of the reactants and temperature inside the meso-OFR was regulated by a
thermostatic bath (Huber, Ministat 125, Germany) maintained at 20 °C.
Figure 1.
Determination of phase diagram
Batch crystallization experiments with different lysozyme and sodium chloride
concentrations were carried out at pH 4.7 and 20 ºC. As the conventional microbatch
methodology, the solution is undersaturated, saturated or supersaturated at the
beginning of each experiment. This allows a more accurate description of phase states
with known operating conditions3,14
. Experiments were started by the simultaneous
injection in the experimental set-up of equal volumes of both lysozyme and sodium
chloride solutions. After 24h of incubation, samples were investigated for crystals,
precipitates or other structures by optical microscopy (Standard 20, Zeiss, Germany).
The supernatant was filtered and diluted with ultra-pure water for lysozyme
concentration determination by UV absorbance (λ= 280 nm). This procedure was
carried out at least three times for each initial supersaturation (Si = 𝐶𝑙𝑦𝑠𝑜𝑧𝑦𝑚𝑒 𝑖𝑛𝑖𝑡𝑖𝑎𝑙
𝑆𝑜𝑙𝑢𝑏𝑖𝑙𝑖𝑡𝑦𝑙𝑦𝑠𝑜𝑧𝑦𝑚𝑒).
Then, a phase diagram was assembled (Figure 2).
Figure 2.
Induction time
Induction time (tind) is known as the period between the establishment of supersaturation
and the detection of a new phase37,38
. Increase of the crystals number in solution can be
Page 8 of 34
ACS Paragon Plus Environment
Crystal Growth & Design
123456789101112131415161718192021222324252627282930313233343536373839404142434445464748495051525354555657585960
9
detected by measuring the turbidity of the crystallization solution, once the formation of
a crystal suspension is expected to decrease light transmission. The induction time can
thus be determined by using the change in the transmission of light. In this way, on-line
measurement of the turbidity of the crystallization solution was carried out with a
spectrometer (ScanSpec UV-VIS, Sarspec, Portugal) at 400 nm in order to monitor the
crystallization process:
𝜏 = 2.303
𝑑× 𝐴 (1)
where τ = turbidity;
d = scattering path length (path length of the measuring cell being 0.4 cm);
A = absorbance.
Absorbance measurements of the crystallization solution allowed to build the turbidity
profile curves, using Equation (1), for each experimental condition studied. Figure 3
shows a typical turbidity profile curve. During the induction time that precedes the
formation of stable nuclei, turbidity is almost constant, while nucleation and growth of
lysozyme crystals resulted in an abrupt increase in the turbidity. In this way, induction
times were derived by the intersect values, on the axis time, of the tangent to the first
rapid increase in the turbidity profile curve as illustrated in Figure 3:
Figure 3.
Lysozyme activity
Enzymatic activity of the lysozyme crystals obtained was determined by
spectrophotometry and compared to the enzymatic activity of the initial lysozyme
solution. The rate of lysis of Micrococcus lysodeikticus was determined, one unit being
equal to a decrease in turbidity of 0.001 per minute at 450 nm at pH 6.25 and 25°C.
Results and Discussion
Lysozyme phase behavior
Page 9 of 34
ACS Paragon Plus Environment
Crystal Growth & Design
123456789101112131415161718192021222324252627282930313233343536373839404142434445464748495051525354555657585960
10
Batch crystallization experiments carried out in the meso-OFR enabled to derive
lysozyme phase behavior under oscillatory flow mixing at 20 ºC and pH 4.7 (Figure 4).
The solubility39,40
and the metastability41
curves were drawn based on the data available
in the literature at quiescent conditions. Clear solutions above the solubility curve were
indicative of the metastable region, once in spite of being supersaturated these solutions
were not able to produce crystals. As expected, increasing concentrations of both
lysozyme and sodium chloride above the metastability curve led to crystallization and
further increase to simultaneous crystallization and precipitation. Several types of
crystals were observed, from tetragonal, orthorhombic and needle-shaped crystals to
microcrystals and precipitate, depending on both reactants concentration but mostly on
salt concentration (Figure 5). For sodium chloride concentrations below and equal to
3% (w/v), essentially tetragonal crystals were observed. One can also verify that crystals
with different sizes (about 5 to 15 μm) and aggregated crystals were obtained. For
sodium chloride concentration of 4% (w/v) and lysozyme concentration between 15 and
25 mg.mL-1
, samples were constituted by well-defined tetragonal and orthorhombic
crystals with typical size around 10 μm and needle-shaped crystals. Images also
demonstrate the generation of aggregated microcrystals (with typical size about 3 μm)
for higher lysozyme concentration. For high concentrations of sodium chloride (≥ 5%
(w/v)) and low concentration of lysozyme (10 to 15 mg.mL-1
) mainly needles with
regular structure and shape were formed, while increasing lysozyme concentration led
to precipitation.
Figure 4.
Figure 5.
As known, crystallization of a protein involves reduction of the solubility of the protein,
namely by the addition of precipitant agents3. In the case of sodium chloride, the
solvation layer around protein molecules is reduced, giving thus rise to solubility
Page 10 of 34
ACS Paragon Plus Environment
Crystal Growth & Design
123456789101112131415161718192021222324252627282930313233343536373839404142434445464748495051525354555657585960
11
decrease. In this way, a direct relationship was verified between salt concentration and
the appearance of lysozyme crystals. Results obtained also demonstrated a strong
influence of salt concentration on the shape of lysozyme crystals. Under quiescent
conditions, experimental conditions studied should only lead to the formation of
tetragonal lysozyme crystals39–41
. However, for concentrations of sodium chloride equal
and superior to 4% (w/v) samples contain needle-shaped crystals. Bhamidi et al.42
suggested that needles were an unstable polymorph of lysozyme that slowly would
convert to the tetragonal form. However, observations done on the collect suspensions
kept during several months did not prove this hypothesis for all the cases.
In the present work lysozyme crystals are subjected to fluid shear forces induced by
oscillatory flow mixing and solid-liquid interfaces. Lysozyme crystals collide with parts
of the glass walls of the meso-OFR and with each other. In this way, crystalline
fragments could be created by attrition leading to secondary nucleation that gives rise to
excess nucleation and suppresses growth, and in its turn lead to small size crystals43
.
Indeed, protein crystals are generally more fragile than crystals of inorganic and small
organic molecules because of their high solvent content44
, so that they are highly likely
to fracture during collision with each other or the crystallization equipment.
Experimental results suggest the occurrence of a strong nucleation, since most of the
experimental conditions studied led to the formation of a high number of small crystals
and crystals with different sizes (Figure 5).
As shown on Figure 5, some aggregation could be observed. In what concerns protein
crystals aggregation, literature reports many factors that can induce particle aggregation.
Kusters et al.45
suggested that aggregation for lysozyme crystals with a diameter
approximately in the range 1-100 μm is mainly induced by shear forces according to its
Kolmogorov microscale. Other studies46
demonstrated that shear alone do not cause
Page 11 of 34
ACS Paragon Plus Environment
Crystal Growth & Design
123456789101112131415161718192021222324252627282930313233343536373839404142434445464748495051525354555657585960

12
aggregation although prolonged exposure resulted in some minor, reversible
aggregation. In the present work, besides the fact that the lysozyme crystals have an
average size in the order of 10 µm (see Table 2), they are also subjected to shear stress,
which may explain their aggregation.
Lysozyme activity
Regarding the activity of the crystals collected, the results revealed that the protein
collected is still active, since most of the samples exhibited at least 80% of activity
when compared to the initial lysozyme solution.
It is commonly believed that denaturation is a prerequisite for aggregation, once small
perturbations in protein structure may expose hydrophobic surfaces, causing self-
interactions and consequential aggregation46
. According to the literature47
, long
exposure time at solid-liquid interfaces48
and a moving gas-liquid interface46,49–52
can
cause damage to proteins. It has also been reported that this phenomenon is mainly due
to the hydrophobic character of such interfaces46
. In the meso-OFR, lysozyme crystals
are subjected to fluid shear forces and solid-liquid interfaces. Furthermore, they are
exposed to air-liquid interfaces, although there have been attempts to minimize them,
once reactants were carefully injected in the system to avoid bubbles and the reactor
was almost completely full. Given the little loss of activity, the aggregation observed
may be mainly explained by exposure to shear stress as already suggested above.
Metastability curve determination
Based on lysozyme phase behavior (Figure 4), it was possible to determine the
metastability curve based on the minimum sodium chloride concentration needed for
nucleation at different lysozyme concentrations. Given the uncertainty associated to the
experimental results and the stochastic nature of nucleation, a potential range for the
metastability curve was represented (error bars). These results, as well as the solubility
Page 12 of 34
ACS Paragon Plus Environment
Crystal Growth & Design
123456789101112131415161718192021222324252627282930313233343536373839404142434445464748495051525354555657585960

13
and metastability curves reported in the literature for microbatch experiments39,40
were
linearized (see Figure 6) according to Martins et al.40
equation:
𝐶𝑙𝑦𝑠𝑜𝑧𝑦𝑚𝑒 = 𝐴 exp (𝐵
𝐶𝑁𝑎𝐶𝑙) (2)
where Clysozyme is the lysozyme concentration in mg.mL-1
and CNaCl is the concentration
of sodium chloride in percentage units (w/v). The values of the constants A and B that
best fit the experimental results are given in Table 1.
Figure 6.
Table 1. Values of A and B constants from the linearization of both experimental metastability and
theoretical solubility and metastability curves of lysozyme at 20 °C and pH 4.7.
Linearized curve A B r2
Solubility39,40
0.354 8.45 0.973
Metastability41
3.744 6.19 0.983
Metastability – meso-OFR 1.887 7.52 0.970
According to Figure 6 and Table 1, metastability data can be described by the
exponential relationship proposed by Martins et al 40
, used for the description of
lysozyme solubility curve with sodium chloride as the precipitant agent.
Reduction of the metastability zone
From the experimental and literature results (Figures 4 and 6), it was possible to
illustrate the undersaturation, metastable, crystallization and precipitation zone (Figure
7), hence giving information about the relevant range of precipitant and protein
concentration for lysozyme crystallization in the meso-OFR at 20 °C and pH 4.7.
Figure 7.
Graphical representation of the experimental metastability curve and both theoretical
solubility and metastability curves clearly illustrates the reduction of the metastability
zone when performing lysozyme crystallization under oscillatory flow mixing (Figure
7). For instance, for a lysozyme concentration of 15 mg.mL-1
, crystals were observed at
Si = 5.4 with oscillatory flow mixing, while under quiescent conditions appearance of
crystals is only expected for Si values superior or equal to 6.3 (metastability data).
Page 13 of 34
ACS Paragon Plus Environment
Crystal Growth & Design
123456789101112131415161718192021222324252627282930313233343536373839404142434445464748495051525354555657585960
14
Under agitation, collision between protein molecules is increased, increasing thus
nucleation probability. As a result, metastability region is reduced leading to the
occurrence of nucleation at lower supersaturation levels. Hence, crystallization
conditions that normally do not produce crystals may become successful using
oscillatory flow mixing. This could be particularly interesting for proteins with a limited
range of crystallization conditions, since the probability of crystals appearance can be
increased under oscillatory flow mixing.
Induction time
Measured induction time was plotted as a function of the initial supersaturation, Si, for
the experimental conditions studied (Figure 8).
Figure 8.
Nucleation is time-critical during protein crystallization processes as it determines the
onset of crystallization. Further, nucleation controls crystal product quality aspects such
as the kind of solid state and crystal size distribution37
. In this study, crystallization
onset was evaluated through induction time measurements. According to Figure 8,
typical values for induction time are between 41 to 900 minutes depending on the initial
supersaturation Si. It further refers that tetragonal crystals were essentially obtained at
low Si, i.e. at large induction times, while needles and precipitates were preferentially
formed at high Si, i.e. at low induction times. One can also verify that for sodium
chloride concentrations of 4 and 5% (w/v), induction time decreases as Si increases,
while no direct relationship between Si and induction time was evidenced for a sodium
chloride concentration of 3% (w/v). It is important to mention that the value of the
induction time depends strongly on the methodology employed to detect the formation
of new nuclei. In this study, measurement of the induction time is based on the detection
of an abrupt increase in the turbidity of the crystallization solution, thereby a
Page 14 of 34
ACS Paragon Plus Environment
Crystal Growth & Design
123456789101112131415161718192021222324252627282930313233343536373839404142434445464748495051525354555657585960

15
considerable number of crystals have to be formed to detect a significant increase in the
turbidity of the solution. For the highest sodium chloride concentrations, experiments
were characterized by a strong nucleation giving rise to a high number of crystals in
solution, and in turn an important increase in the turbidity of the solution. In contrast,
lower sodium chloride concentration experiments did not lead to a noteworthy change
in the turbidity of the solution, in particular when only tetragonal crystals were
observed. For those cases, crystallization solutions kept relatively clear throughout the
experiment despite the presence of crystals in solution. This partly explains the large
variation in the induction time values (error bars - standard deviations from at least three
independent experiments), which can also be explained by the stochastic nature of
nucleation and the low probability that nuclei form at low supersaturations. From Figure
8, one can verify that for the same sodium chloride concentrations (4% (w/v)) and lower
Si, induction times are shorter than the values reported in the literature5. Indeed, Smejkal
et al.5 related crystallization onsets from 350 to 570 minutes (stirrer speeds from 400 to
200 rpm, respectively) in a 6 mL-scale stirred tank for Si = 9.7, while we observed
values of 80 and 338 minutes for Si of 8.9 and 7.1, respectively. As already mentioned,
the efficient oscillatory mixing mechanism developed in the meso-OFR leads to
enhanced mass transfer, minimizing thus diffusion limitations that were reported to be
the main bottleneck in the lysozyme crystallization process in non-agitated systems5.
Summary of experimental conditions
Table 2 summarizes the experimental crystallization conditions studied as well as the
respective crystals characteristics.
Page 15 of 34
ACS Paragon Plus Environment
Crystal Growth & Design
123456789101112131415161718192021222324252627282930313233343536373839404142434445464748495051525354555657585960
16
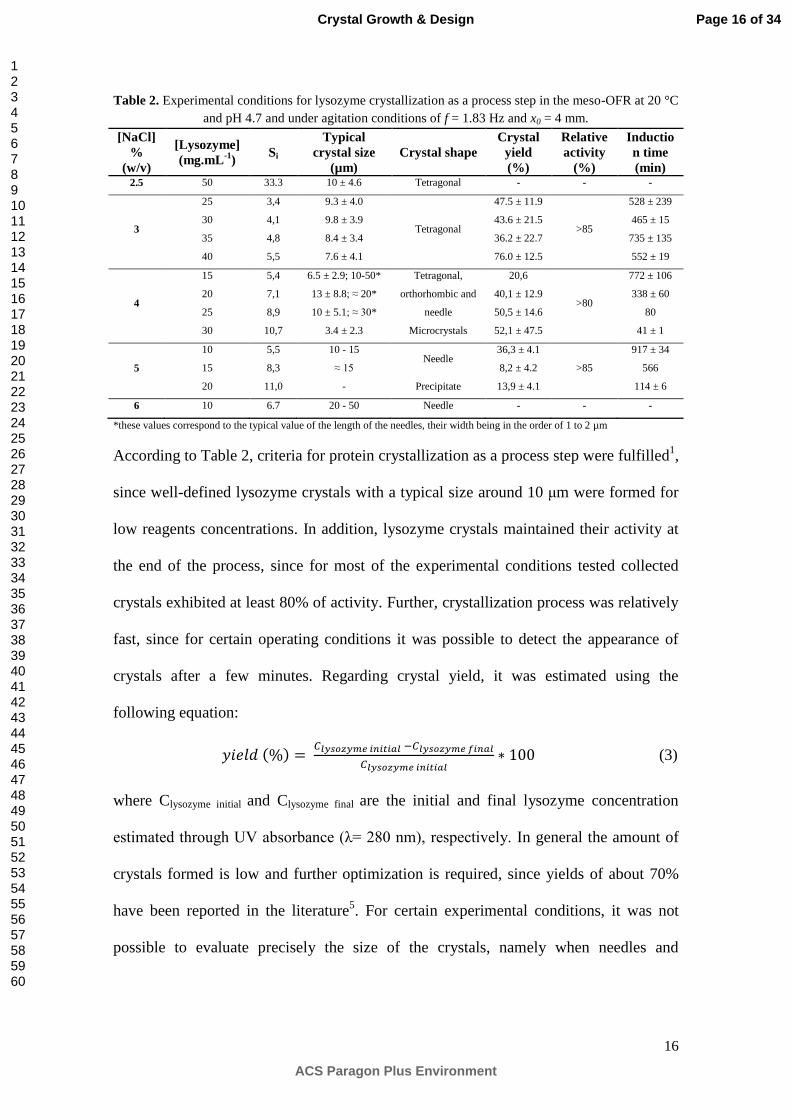
Table 2. Experimental conditions for lysozyme crystallization as a process step in the meso-OFR at 20 °C
and pH 4.7 and under agitation conditions of f = 1.83 Hz and x0 = 4 mm.
[NaCl]
%
(w/v)
[Lysozyme]
(mg.mL-1
) Si
Typical
crystal size
(µm)
Crystal shape
Crystal
yield
(%)
Relative
activity
(%)
Inductio
n time
(min) 2.5 50 33.3 10 ± 4.6 Tetragonal - - -
3
25 3,4 9.3 ± 4.0
Tetragonal
47.5 ± 11.9
>85
528 ± 239
30 4,1 9.8 ± 3.9 43.6 ± 21.5 465 ± 15
35 4,8 8.4 ± 3.4 36.2 ± 22.7 735 ± 135
40 5,5 7.6 ± 4.1 76.0 ± 12.5 552 ± 19
4
15 5,4 6.5 ± 2.9; 10-50* Tetragonal,
orthorhombic and
needle
20,6
>80
772 ± 106
20 7,1 13 ± 8.8; ≈ 20* 40,1 ± 12.9 338 ± 60
25 8,9 10 ± 5.1; ≈ 30* 50,5 ± 14.6 80
30 10,7 3.4 ± 2.3 Microcrystals 52,1 ± 47.5 41 ± 1
5
10 5,5 10 - 15 Needle
36,3 ± 4.1
>85
917 ± 34
15 8,3 ≈ 15 8,2 ± 4.2 566
20 11,0 - Precipitate 13,9 ± 4.1 114 ± 6
6 10 6.7 20 - 50 Needle - - -
*these values correspond to the typical value of the length of the needles, their width being in the order of 1 to 2 µm
According to Table 2, criteria for protein crystallization as a process step were fulfilled1,
since well-defined lysozyme crystals with a typical size around 10 μm were formed for
low reagents concentrations. In addition, lysozyme crystals maintained their activity at
the end of the process, since for most of the experimental conditions tested collected
crystals exhibited at least 80% of activity. Further, crystallization process was relatively
fast, since for certain operating conditions it was possible to detect the appearance of
crystals after a few minutes. Regarding crystal yield, it was estimated using the
following equation:
𝑦𝑖𝑒𝑙𝑑 (%) = 𝐶𝑙𝑦𝑠𝑜𝑧𝑦𝑚𝑒 𝑖𝑛𝑖𝑡𝑖𝑎𝑙 −𝐶𝑙𝑦𝑠𝑜𝑧𝑦𝑚𝑒 𝑓𝑖𝑛𝑎𝑙
𝐶𝑙𝑦𝑠𝑜𝑧𝑦𝑚𝑒 𝑖𝑛𝑖𝑡𝑖𝑎𝑙∗ 100 (3)
where Clysozyme initial and Clysozyme final are the initial and final lysozyme concentration
estimated through UV absorbance (λ= 280 nm), respectively. In general the amount of
crystals formed is low and further optimization is required, since yields of about 70%
have been reported in the literature5. For certain experimental conditions, it was not
possible to evaluate precisely the size of the crystals, namely when needles and
Page 16 of 34
ACS Paragon Plus Environment
Crystal Growth & Design
123456789101112131415161718192021222324252627282930313233343536373839404142434445464748495051525354555657585960
17
precipitates were formed. Overlapping of the needles and small size and amorphous
nature of precipitates prevented a proper assessment of their size.
Conclusion
The present work reports for the first time the study of lysozyme phase behavior in a
novel meso oscillatory flow reactor (meso-OFR). For this, various experimental
conditions were screened by varying lysozyme and sodium chloride concentration at pH
4.7 and T = 20 ºC and under fixed agitations conditions (f = 1.83 Hz and x0 = 4 mm).
The results obtained enabled the elaboration of a two-dimensional (lysozyme
concentration against sodium chloride concentration) phase diagram of lysozyme. It was
possible to observe several types of crystals, from tetragonal, orthorhombic and needle-
shaped crystals, to microcrystals and precipitates. Results further suggest a strong
influence of salt concentration on the shape of lysozyme crystals. Furthermore,
lysozyme crystals formed remain active at the end of the experiments. It was also shown
that oscillatory flow mixing promotes nucleation at low supersaturation, since results
evidenced the reduction of the metastable zone and low induction times.
This study may thus provide improved understanding of protein phase behavior under
agitation, in particular under oscillatory flow mixing. Although further optimization is
still required, especially regarding yield and control of crystals’ characteristics (size and
morphology), results are very promising regarding the applicability of the designed
meso-OFR for protein crystallization as a process scale. Indeed, oscillatory flow mixing
can induce nucleation in conditions where nucleation normally (quiescent conditions)
does not occur, which can be particularly interesting from an industrial point of view.
Acknowledgements
Page 17 of 34
ACS Paragon Plus Environment
Crystal Growth & Design
123456789101112131415161718192021222324252627282930313233343536373839404142434445464748495051525354555657585960

18
This work was financially supported by the European Regional Development Fund
(FEDER) through COMPETE 2020 - Operational Programme Competitiveness and
Internationalization (POCI) (UID/EQU/00511/2013-LEPABE - Laboratory for Process
Engineering, Environment, Biotechnology and Energy – EQU/00511; POCI-01-0145-
FEDER-006684) and by national funds through FCT –Portuguese Foundation for
Science and Technology - under the projects: UID/BIO/04469/2013; IF exploratory
project [IF/01087/2014]; Postdoctoral Fellowship [SFRH/BPD/96132/2013]. A.
Ferreira is an Investigator FCT (IF/01087/2014).
Page 18 of 34
ACS Paragon Plus Environment
Crystal Growth & Design
123456789101112131415161718192021222324252627282930313233343536373839404142434445464748495051525354555657585960
19
Figure Captions
Figure 1. Schematic representation of the experimental set-up for lysozyme
crystallization experiments with: OFR-SPC – oscillatory flow reactor provided with
periodic constrictions; D - internal tube diameter; do - internal diameter in the
constrictions; L1 - convergent-divergent section length; L2 - straight section length; Rc -
radius of the curvature of the sidewall of the convergent section and Rd - radius of the
curvature of the sidewall of the divergent section.
Figure 2. Schematic representation of the procedure employed for the generation of
lysozyme phase diagram in the meso-OFR at 20 °C and pH 4.7 and under agitation
conditions of f = 1.83 Hz and x0 = 4 mm.
Figure 3. Typical turbidity profile obtained during crystallization experiments
(lysozyme 30 mg.mL-1
, NaCl 4% (w/v), pH 4.7 and T = 20 ºC and under agitation
conditions of f = 1.83 Hz and x0 = 4 mm).
Figure 4. Lysozyme phase behavior in the meso-OFR at pH 4.7 and 20 ºC under
agitation conditions of f = 1.83 Hz and x0 = 4 mm.
Figure 5. Lysozyme crystals obtained in the meso-OFR at pH 4.7 and 20 ºC under
agitation conditions of f = 1.83 Hz and x0 = 4 mm. Lysozyme concentrations used are
mentioned in each picture.
Figure 6. Linearized metastability and solubility curves at 20 ºC and pH 4.7 and under
agitation conditions of f = 1.83 Hz and x0 = 4 mm. Solubility and metastability curves
were obtained by curve fitting from data reported in the literature39–41
.
Figure 7. Lysozyme phase diagram in the meso-OFR at pH 4.7 and 20 ºC under
agitation conditions of f = 1.83 Hz and x0 = 4 mm.
Page 19 of 34
ACS Paragon Plus Environment
Crystal Growth & Design
123456789101112131415161718192021222324252627282930313233343536373839404142434445464748495051525354555657585960

20
Figure 8. Induction time as a function of the initial supersaturation Si for different
sodium chloride concentrations: 3% (w/v), 4% (w/v) and 5% (w/v). The error bars are
standard deviations from at least three independent experiments. Smejkal et al. (2013)
data was obtained in a stirred tank reactor of 6 mL for different stirrer speeds from 200
to 400 rpm with sodium chloride concentration of 4% (w/v) and lysozyme concentration
of 50 mg.mL-1
.
Table Captions
Table 1. Values of A and B constants from the linearization of both experimental
metastability and theoretical solubility and metastability curves of lysozyme at 20 °C
and pH 4.7.
Table 2. Experimental conditions for lysozyme crystallization as a process step in the
meso-OFR at 20 °C and pH 4.7 and under agitation conditions of f = 1.83 Hz and x0 = 4
mm.
Page 20 of 34
ACS Paragon Plus Environment
Crystal Growth & Design
123456789101112131415161718192021222324252627282930313233343536373839404142434445464748495051525354555657585960

21
References
(1) Etzel, M. R. In Process Scale Bioseparations for the Biopharmaceutical Industry;
Taylor & Francis Group, LLC, 2007; pp 159–178.
(2) Lee, E. K.; Kim, W. Protein Crystallization for Large-Scale Bioseparation;
Marcel Dekker, 2003.
(3) McPherson, A.; Gavira, J. a. Acta Crystallogr. Sect. F, Struct. Biol. Commun.
2014, F 70, 2–20.
(4) Schmidt, S.; Havekost, D.; Kaiser, K.; Kauling, J.; Henzler, H.-J. Eng. Life Sci.
2005, 5 (3), 273–276.
(5) Smejkal, B.; Helk, B.; Rondeau, J.-M.; Anton, S.; Wilke, A.; Scheyerer, P.; Fries,
J.; Hekmat, D.; Weuster-Botz, D. Biotechnol. Bioeng. 2013, 110 (7), 1956–1963.
(6) Thommes, J.; Etzel, M. Biotechnol. Prog. 2007, 23, 42–45.
(7) Neugebauer, P.; Khinast, J. G. Cryst. Growth Des. 2015, 15, 1089–1095.
(8) Shenoy, B.; Wang, Y.; Shan, W.; Margolin, A. L. Biotechnol. Bioeng. 2001, 73,
358–369.
(9) Smejkal, B.; Agrawal, N. J.; Helk, B.; Schulz, H.; Giffard, M.; Mechelke, M.;
Ortner, F.; Heckmeier, P.; Trout, B. L.; Hekmat, D. Biotechnol. Bioeng. 2013,
110 (9), 2452–2461.
(10) Jacobsen, C.; Garside, J.; Hoare, M. Biotechnol. Bioeng. 1998, 57, 667–675.
(11) Huettmann, H.; Zich, S.; Berkemeyer, M.; Buchinger, W.; Jungbauer, A. Chem.
Eng. Sci. 2015, 126, 341–348.
(12) Hekmat, D.; Hebel, D.; Schmid, H.; Weuster-Botz, D. Process Biochem. 2007,
42 (12), 1649–1654.
(13) Anderson, M. J.; Hansen, C. L.; Quake, S. R. PNAS 2006, 103 (45), 16746–
16751.
Page 21 of 34
ACS Paragon Plus Environment
Crystal Growth & Design
123456789101112131415161718192021222324252627282930313233343536373839404142434445464748495051525354555657585960

22
(14) Asherie, N. Methods 2004, 34 (3), 266–272.
(15) Hebel, D.; Huber, S.; Stanislawski, B.; Hekmat, D. J. Biotechnol. 2013, 166 (4),
206–211.
(16) Parambil, J. V.; Schaepertoens, M.; Williams, D. R.; Heng, J. Y. Y. Cryst.
Growth Des. 2011, 11 (10), 4353–4359.
(17) Russell A. Judge, Michael R. Johns, E. T. W. Biotechnol. Bioeng. 1995, 48 (4),
316–323.
(18) Yaoi, M.; Adachi, H.; Takano, K.; Matsumura, H.; Inoue, T.; Mori, Y.; Sasaki, T.
Jpn. J. Appl. Phys. 2004, 43 (10A), 1318.
(19) Murai, R.; Yoshikawa, H. Y.; Kawahara, H.; Maki, S.; Sugiyama, S.; Kitatani,
T.; Adachi, H.; Takano, K.; Matsumura, H.; Murakami, S.; Inoue, T.; Sasaki, T.;
Mori, Y. J. Cryst. Growth 2008, 310 (7-9), 2168–2172.
(20) Lu, Q.-Q.; Yin, D. C.; Liu, Y. M.; Wang, X. K.; Yang, P. F.; Liu, Z. T.; Shang, P.
J. Appl. Crystallogr. 2010, 43, 473–482.
(21) Vekilov, P. G.; Rosenberger, F. J. Cryst. Growth 1998, 186 (1-2), 251–261.
(22) Marc Pusey; Witherow, W.; Naumann, R. J. Cryst. Growth 1988, 90 (1-3), 105–
111.
(23) Harrison, R.; Todd, P.; Rudge, S.; Petrides, D. Bioseparation Science and
Engineering; Press, O. U., Ed.; New York, 2015.
(24) Carbone, M. N.; Etzel, M. R. Biotechnol. Bioeng. 2006, 93 (6), 1221–1224.
(25) Lorber, B.; Skouria, M.; Munch, J.-P.; Giegé, R. J. Cryst. Growth 1993, 128 (1-
4), 1203–1211.
(26) Judge, R. a.; Forsythe, E. L.; Pusey, M. L. Biotechnology and Bioengineering.
1998, pp 776–785.
(27) Takakura, T.; Ito, T.; Yagi, S.; Notsu, Y.; Itakura, T.; Nakamura, T.; Inagaki, K.;
Page 22 of 34
ACS Paragon Plus Environment
Crystal Growth & Design
123456789101112131415161718192021222324252627282930313233343536373839404142434445464748495051525354555657585960

23
Esaki, N.; Hoffman, R. M.; Takimoto, A. Appl. Microbiol. Biotechnol. 2006, 70
(2), 183–192.
(28) Lee, T.; Vaghjiani, J.; Lye, G.; Turner, M. Enzyme Microb. Technol. 2000, 26
(8), 582–592.
(29) Giffard, M.; Ferté, N.; Ragot, F.; El Hajji, M.; Castro, B.; Bonneté, F. PLoS One
2011, 6 (5), e19013.
(30) Zang, Y.; Kammerer, B.; Eisenkolb, M.; Lohr, K.; Kiefer, H. PLoS One 2011, 6
(9), e25282.
(31) Trilisky, E.; Gillespie, R.; Osslund, T. D.; Vunnum, S. Biotechnology Progress.
2011, pp 1054–1067.
(32) Ferreira, A; Rocha, F.; Teixeira, J.A.; Vicente, A. Apparatus for mixing
improvement based on oscillatory flow reactors provided with smooth periodic
constrictions. WO/2015/056156, 2014.
(33) Harvey, A.; Mackley, M. R.; Reis, N.; Teixeira, J. A.; Vicente, A. A. In 30th
Conference SSCHE, Tatranské Matliare (SK), 26 – 30 May; 2003; pp 26–30.
(34) Ferreira, A.; Teixeira, J. A.; Rocha, F. Chem. Eng. J. 2015, 262, 499–508.
(35) Castro, F.; Ferreira, A.; Rocha, F.; Vicente, A.; Teixeira, J. A. AIChE J. 2013, 59
(12), 4483–4493.
(36) Castro, F.; Ferreira, A.; Rocha, F.; Vicente, A.; Anto, J. Ind. Eng. Chem. Res.
2013, 52, 9816–9821.
(37) Jiang, S.; Ter Horst, J. H. Cryst. Growth Des. 2011, 11, 256–261.
(38) Di Profio, G. Di; Curcio, E.; Cassetta, A.; Lamba, D.; Drioli, E. J. Cryst. Growth
2003, 257, 359–369.
(39) Forsythe, E. L.; Judge, R. a.; Pusey, M. L. J. Chem. Eng. Data 1999, 44 (3), 637–
640.
Page 23 of 34
ACS Paragon Plus Environment
Crystal Growth & Design
123456789101112131415161718192021222324252627282930313233343536373839404142434445464748495051525354555657585960

24
(40) Martins, P. M.; Rocha, F.; Damas, A. M. PLoS One 2008, 3 (4), e1998.
(41) Crespo, R.; Martins, P. M.; Gales, L.; Rocha, F.; Damas, A. M. J. Appl.
Crystallogr. 2010, 43 (6), 1419–1425.
(42) Bhamidi, V.; Skrzypczak-Jankun, E.; Schall, C. a. Journal of Crystal Growth.
2001, pp 77–85.
(43) Tait, S.; White, E. T.; Litster, J. D. Cryst. Growth Des. 2009, 9 (5), 2198–2206.
(44) McPherson, A. Crystallization of Biological Macromolecules. Cold Spring.
Harbor, Ed. New York, 1999.
(45) Kusters, K. A.; Wijers, J. G.; Thoenes, D. Chem. Eng. Sci. 1997, 52 (1), 107–
121.
(46) Thomas, C. R.; Geer, D. Biotechnol. Lett. 2010, 33 (3), 443–456.
(47) Bee, J. S.; Stevenson, J. L.; Mehta, B.; Svitel, J.; Pollastrini, J.; Platz, R.; Freund,
E.; Carpenter, J. F.; Randolph, T. W. Biotechnol. Bioeng. 2009, 103 (5), 936–
943.
(48) Sandwick, R. K.; Schray, K. J. J. Colloid Interface Sci. 1987, 115 (1), 130–138.
(49) Caussette, M.; Gaunand, A.; Planche, H.; Colombié, S.; Monsan, P.; Lindet, B.
Enzyme Microb. Technol. 1999, 24 (7), 412–418.
(50) Caussette, M.; Gaunand, A.; Planche, H.; Monsan, P.; Lindet, B. Ann. New York
Acad. Sci. 1997, 864, 228–233.
(51) Colombié, S.; Gaunand, A.; Lindet, B. Enzyme Microb. Technol. 2001, 28 (9-10),
820–826.
(52) Postel, C.; Abillon, O.; Desbat, B. J. Colloid Interface Sci. 2003, 266 (1), 74–81.
Page 24 of 34
ACS Paragon Plus Environment
Crystal Growth & Design
123456789101112131415161718192021222324252627282930313233343536373839404142434445464748495051525354555657585960

25
For Table of Contents Use only:
Table of Contents Graphic:
Synopsis
The applicability of a novel meso oscillatory flow reactor for protein crystallization as a
process step was evaluated. A lysozyme phase diagram was derived and induction times
were measured. Reduction of the metastability zone and fast crystallization onsets were
verified, which may be particularly relevant for proteins with a limited range of
crystallization conditions and for industrial processes.
Page 25 of 34
ACS Paragon Plus Environment
Crystal Growth & Design
123456789101112131415161718192021222324252627282930313233343536373839404142434445464748495051525354555657585960

Figure 1. Schematic representation of the experimental set-up for lysozyme crystallization experiments with D - internal tube diameter; d0 - internal diameter in the constrictions; L1 - convergent-divergent section
length; L2 - straight section length; Rc - radius of the curvature of the sidewall of the convergent section and
Rd - radius of the curvature of the sidewall of the divergent section. 65x124mm (300 x 300 DPI)
Page 26 of 34
ACS Paragon Plus Environment
Crystal Growth & Design
123456789101112131415161718192021222324252627282930313233343536373839404142434445464748495051525354555657585960

Figure 2. Schematic representation of the procedure employed for the generation of lysozyme phase diagram in the meso-OFR at 20 °C and pH 4.7 and under agitation conditions of f = 1.83 Hz and x0 = 4 mm.
121x55mm (300 x 300 DPI)
Page 27 of 34
ACS Paragon Plus Environment
Crystal Growth & Design
123456789101112131415161718192021222324252627282930313233343536373839404142434445464748495051525354555657585960

Figure 3. Typical turbidity profile obtained during crystallization experiments (lysozyme 30 mg.mL-1, NaCl 4% (w/v), pH 4.7 and T = 20 ºC and under agitation conditions of f = 1.83 Hz and x0 = 4 mm).
43x38mm (300 x 300 DPI)
Page 28 of 34
ACS Paragon Plus Environment
Crystal Growth & Design
123456789101112131415161718192021222324252627282930313233343536373839404142434445464748495051525354555657585960

Figure 4. Lysozyme phase behavior in the meso-OFR at pH 4.7 and 20 ºC under agitation conditions of f = 1.83 Hz and x0 = 4 mm. 39x25mm (300 x 300 DPI)
Page 29 of 34
ACS Paragon Plus Environment
Crystal Growth & Design
123456789101112131415161718192021222324252627282930313233343536373839404142434445464748495051525354555657585960
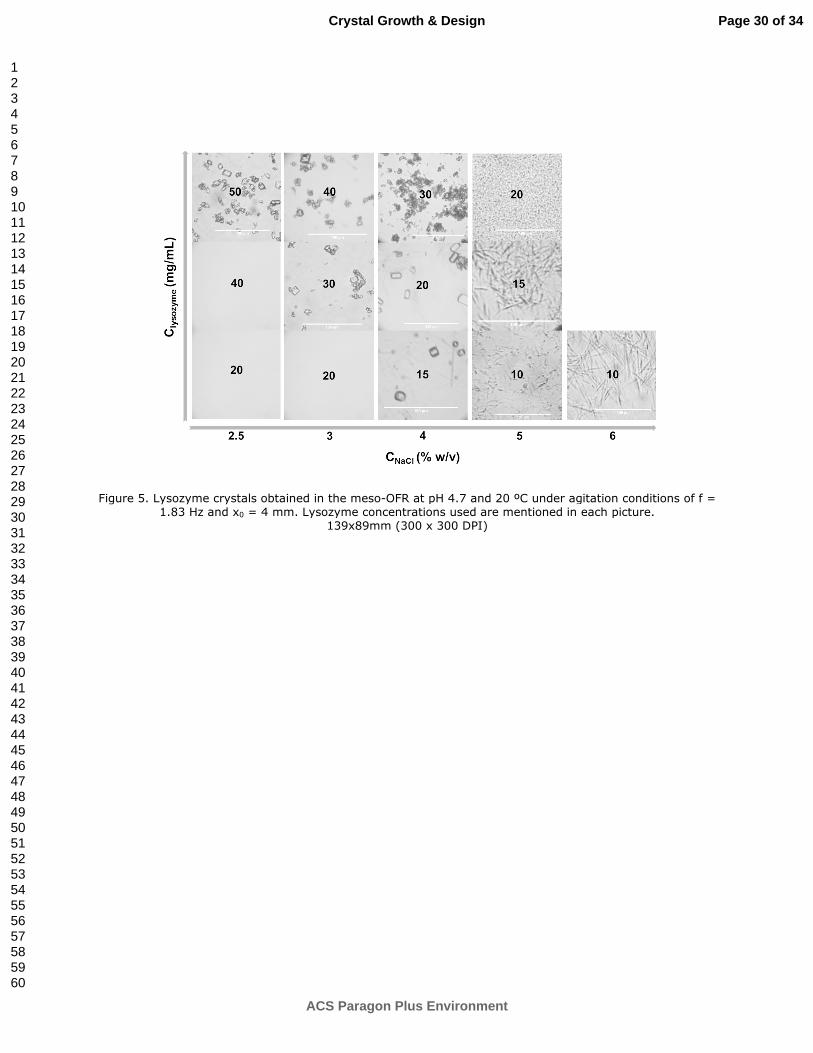
Figure 5. Lysozyme crystals obtained in the meso-OFR at pH 4.7 and 20 ºC under agitation conditions of f = 1.83 Hz and x0 = 4 mm. Lysozyme concentrations used are mentioned in each picture.
139x89mm (300 x 300 DPI)
Page 30 of 34
ACS Paragon Plus Environment
Crystal Growth & Design
123456789101112131415161718192021222324252627282930313233343536373839404142434445464748495051525354555657585960
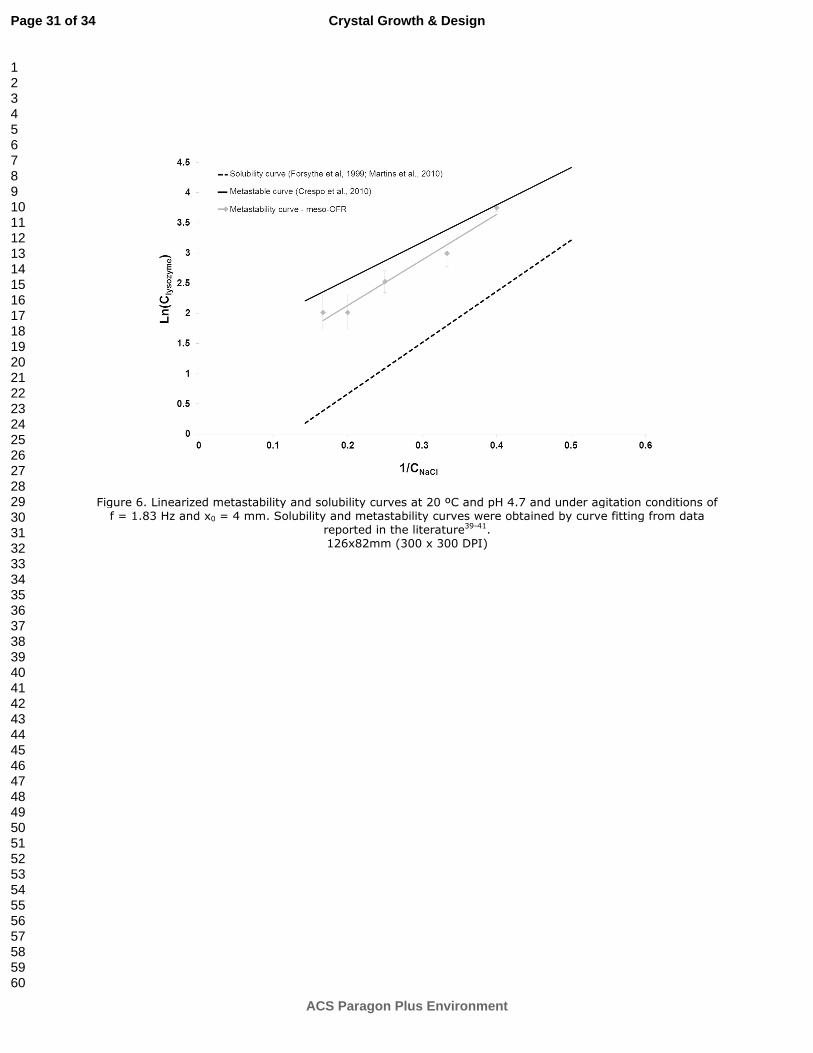
Figure 6. Linearized metastability and solubility curves at 20 ºC and pH 4.7 and under agitation conditions of f = 1.83 Hz and x0 = 4 mm. Solubility and metastability curves were obtained by curve fitting from data
reported in the literature39-41. 126x82mm (300 x 300 DPI)
Page 31 of 34
ACS Paragon Plus Environment
Crystal Growth & Design
123456789101112131415161718192021222324252627282930313233343536373839404142434445464748495051525354555657585960

Figure 7. Lysozyme phase diagram in the meso-OFR at pH 4.7 and 20 ºC under agitation conditions of f = 1.83 Hz and x0 = 4 mm.
129x84mm (300 x 300 DPI)
Page 32 of 34
ACS Paragon Plus Environment
Crystal Growth & Design
123456789101112131415161718192021222324252627282930313233343536373839404142434445464748495051525354555657585960
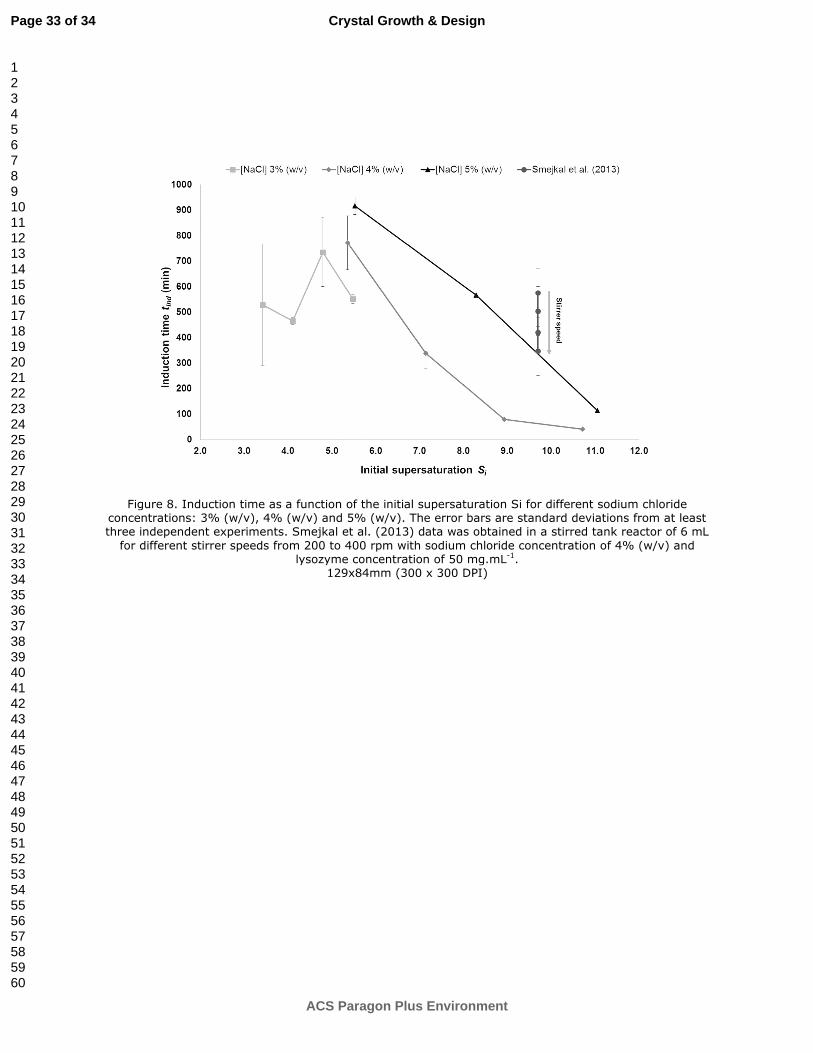
Figure 8. Induction time as a function of the initial supersaturation Si for different sodium chloride concentrations: 3% (w/v), 4% (w/v) and 5% (w/v). The error bars are standard deviations from at least three independent experiments. Smejkal et al. (2013) data was obtained in a stirred tank reactor of 6 mL
for different stirrer speeds from 200 to 400 rpm with sodium chloride concentration of 4% (w/v) and lysozyme concentration of 50 mg.mL-1.
129x84mm (300 x 300 DPI)
Page 33 of 34
ACS Paragon Plus Environment
Crystal Growth & Design
123456789101112131415161718192021222324252627282930313233343536373839404142434445464748495051525354555657585960
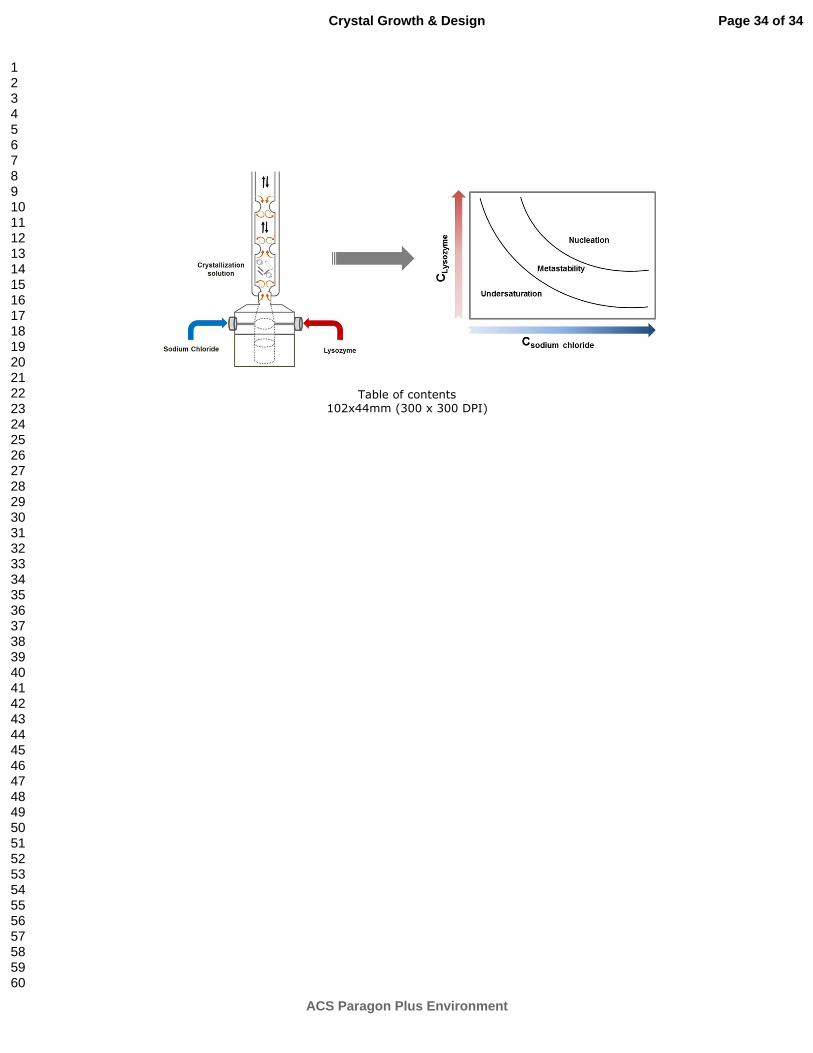
Table of contents
102x44mm (300 x 300 DPI)
Page 34 of 34
ACS Paragon Plus Environment
Crystal Growth & Design
123456789101112131415161718192021222324252627282930313233343536373839404142434445464748495051525354555657585960