Embed Size (px)
Citation preview

1
1 Title: Risk factors for childhood myopia: findings from the NICER study 2
3
Authors: 4
Lisa O’Donoghue, PhD1, Venediktos V Kapetanankis, PhD2; Julie F McClelland, 5
PhD,1 Nicola S Logan, PhD3, Christopher G Owen, PhD2, Kathryn J Saunders, PhD1, 6
Alicja R Rudnicka, PhD2 7
8
9
1 School of Biomedical Sciences, University of Ulster, Coleraine, N Ireland, UK 10
2 Population Health Research Institute, St George’s University of London, London 11
UK 12
3 School of Life and Health Sciences, Aston University, Birmingham, UK 13
14
15
16
Grant Information: 17
College of Optometrists, London. The sponsor or funding organization had no role in 18
the design or conduct of this research. 19
20
21
Word Count:2836 22 23
2
Abstract 24
Purpose: 25
To explore risk factors for myopia in 12-13-year-old children in Northern Ireland (NI). 26
27
Methods: 28
Stratified random sampling was performed to obtain representation of schools and 29
children. 30
Cycloplegia was achieved using cyclopentolate hydrochloride 1%. Distance 31
autorefraction was measured using the Shin-Nippon SRW-5000. Height and weight 32
were measured. Parents and children completed a questionnaire including 33
questions on parental history of myopia, sociodemographic factors, childhood levels 34
of near vision and physical activity to identify potential risk factors for myopia. 35
Myopia was defined as spherical equivalent ≤-0.50D in either eye. 36
37
Results: 38
Data from 661 white children aged 12-13-years showed that regular physical activity 39
was associated with a lower estimated prevalence of myopia as compared with 40
sedentary lifestyles (odds ratio (OR) =0.46 adjusted for age, sex, deprivation score, 41
family size, school type, urbanicity, 95%CI 0.23 to 0.90, p for trend = 0.027). The 42
odds of myopia were more than 2.5 times higher amongst children attending 43
academically-selective-schools (adjusted OR=2.66, 95%CI 1.48 to 4.78) compared 44
to non- academically-selective-schools. There was no evidence of an effect of urban 45
versus non-urban environment on the odds of myopia. Compared to children with no 46
myopic parents, children with one or both parents being myopic were 2.91 times 47
(95%CI 1.54 to 5.52) and 7.79 times (95%CI 2.93 to 20.67) more likely to have 48
myopia, respectively. 49
50
Conclusions: 51
In NI children parental history of myopia and type of schooling, are important 52
determinants of myopia. The association between myopia and an environmental 53
factor such as physical activity levels may provide insight into preventive strategies. 54

3
Risk factors for childhood myopia: findings from the NICER study 55
Introduction 56
Although myopia can be corrected with spectacles, contact lenses or refractive 57
surgery the costs of treating myopia and its associated co-morbidities including 58
glaucoma, rhegmatogenous retinal detachment and chorio-retinal atrophy can be 59
considerable and is conservatively estimated to be in excess of $4.6 billion dollars in 60
the United States.1, 2 In the UK alone there are approximately 200,000 people with 61
pathological myopia. [National Institute for Health and Care Excellence 62
http://www.nice.org.uk/guidance/ta298/resources/choroidal-neovascularisation-63
pathological-myopia-ranibizumab-draft-scope-pre-referral2, date accessed 9th July 64
2014] There is therefore considerable interest in the identification of risk factors for 65
myopia3 as modifying these risk factors may lessen the prevalence and impact of 66
myopia. Many genetic and environmental factors have been shown to be associated 67
with the prevalence of myopia including higher educational attainment,4 greater 68
amounts of near work,4, 5 socio-economic status,6, 7 body stature,8 degree of 69
urbanisation,9 level of physical activity,10 level of outdoor activity,3 low birth weight,11 70
parental smoking status,12 parental education and birth order13 and lack of 71
breastfeeding.14 Family history of myopia15-18 and ethnicity15, 16, 19, 20 are also 72
recognized risk factors for myopia and associations with age and gender have also 73
been described.21 Numerous narrative reviews describe these risk factors in some 74
detail.22-25 75
76
Despite the extensive list of environmental factors that may influence the 77
development of myopia they can only explain a small proportion of the variability 78
found in myopia prevalence and conflicting evidence exists for the association of 79
many of the risk factors including increased near work15 and breast-feeding.13 Some 80

4
individuals may also have a genetic predisposition resulting in greater susceptibility 81
to the environmental influences associated with myopia,26 which may partly explain 82
worldwide variation in myopia prevalence.23 83
84
The Northern Ireland Childhood Errors of Refraction (NICER) study, an 85
epidemiological survey of childhood refractive status has shown that there is a high 86
prevalence of myopia in white children in Northern Ireland (NI) compared with 87
similarly aged white children in Australia.27 Reasons for this difference are unclear. 88
This paper explores the NICER study data and aims to describe the association 89
between some of the putative risk factors, including family history and environmental 90
factors, and myopia in 12-13-year-old children in Northern Ireland. 91
92
Methods 93
Approval for the study was obtained from the University of Ulster’s Research Ethics 94
Committee. The research adhered to the principles of the Declaration of Helsinki. 95
96
The methodology of the NICER study has previously been described in detail.28 In 97
summary, data on population density and economic deprivation (Multiple Deprivation 98
Measure) (http://www.nisra.gov.uk/) were used to broadly classify schools into four 99
strata of urban/rural and deprived/not deprived. Stratified random sampling of 100
schools was performed to obtain representation of schools and children across these 101
four strata from four local government districts in the North and West of Northern 102
Ireland. Informed consent was obtained from a parent or other responsible adult and 103
the child themselves before the child’s participation in the study. 104
105
5
Two or more classes of 12-13-year old children from fifteen schools were invited to 106
participate in the study. The children were tested within school premises during the 107
school day. Children completed a questionnaire designed to identify risk factors for 108
myopia, including amount of time spent on near work and level of physical activity. 109
The protocol for data collection included cycloplegia of both eyes using one drop of 110
cyclopentolate hydrochloride 1% (Minims single dose, Chauvin Pharmaceuticals, 111
Romford, UK) after instillation of one drop of proxymetacaine hydrochloride 0.5% 112
(Minims single dose, Chauvin Pharmaceuticals). Distance autorefraction was 113
measured using the binocular openfield autorefractor, the Shin-Nippon SRW-5000 114
(Shin-Nippon, Tokyo, Japan), at least 20 minutes after the instillation of the eye 115
drops. The representative value as determined by the instrument was used in 116
subsequent analyses. Height (in centimetres) was measured using the Leicester 117
Height Measure (SECA, Hamburg, Germany) and weight (in kilograms) was 118
assessed using Tanita digital scales, model HD-327 (Tanita, Middlesex, UK). After 119
the examination the child’s parents/guardians were asked to complete a detailed 120
questionnaire, including sociodemographic characteristics, parental factors and birth 121
history. 122
123
Definitions 124
All children with spherical equivalent of less or equal to -0.50D in either eye were 125
classified as myopic. 126
127
Childhood risk factors 128
Age (in months), sex and body size were recorded. Children were categorised as 129
normal weight, overweight or obese by applying the body mass index (BMI) cut-offs 130

6
at half yearly intervals for boys and girls as recommended by the Childhood Obesity 131
Working Group of the International Obesity Taskforce (Table 4 as published by Cole 132
et al in 2000).29 Self reported levels of physical activity, time spent doing near visual 133
tasks (including homework, screen-time), number of child siblings and older siblings 134
(and hence younger siblings) were obtained from child and parental questionnaires. 135
Data from child questionnaires were used in preference. Attendance at a grammar or 136
other school was also noted; in NI entrance to grammar school is at age 11 years 137
and is determined by performance in an academic examination. This is a 138
competitive academic process and proximity to the school is not used as a criterion 139
for entrance. Approximately 42% of children attend a grammar school 140
(http://www.deni.gov.uk/). Non-grammar schools do not use academic criteria for 141
entrance. 142
143
Parental risk factors 144
Parental education was classified as low (no post-secondary education, Ordinary 145
levels (General Certificate of Secondary Education)/Business and Technology 146
Education Council, BTec), medium (General Certificate of Education Advanced 147
Levels/Higher National Certificate (HNC), National Vocational Qualifications (NVQ), 148
City and Guilds, Diploma/Higher National Diploma (HND), Ordinary National Diploma 149
(OND), Royal Society of the Arts (RSA), Ordinary National Certificate (ONC) or high 150
(Degree/Post Graduate Certificate in Education (PGCE), higher degree). The highest 151
maternal or paternal education (low, medium, high) reported in the household was 152
used. 153
154
7
Parental myopia was classified depending on the number of parents who self-155
reported being myopic as (i) none, (ii) one parent myopic and (iii) both parents 156
myopic 157
158
Sociodemographic characteristics 159
Assessment of socio-economic status was made using the deprivation rank of the 160
child’s place of residence. Each child’s home address postcode was used to place 161
the child’s home into a small scale census Output Area, allowing a Northern Ireland 162
multiple deprivation measure (NIMDM) to be applied to each child. The Output Area 163
Level is based on three weighted domains of deprivation: income (47%), 164
employment (41.7%) and proximity to services (16.6%). This continuous variable for 165
socio-economic status (SES) was converted into a categorical variable with five 166
categories using quintiles of SES. 167
168
Children were classified as living in urban or rural areas depending on the population 169
density of the area in which they resided. Wards with a population density of less 170
than 10 persons per hectare (equivalent to 1000 persons per km2) were classified as 171
rural and those with a population density of at least 10 persons or more per hectare 172
were classified as urban. This cut was used to ensure that we sampled children 173
living in rural (on average 1 person per hectare) as well as urban areas (on average 174
23 persons per hectare). 175
176
Statistical methods 177
All statistical analyses were performed using Stata (StataCorp, Texas, USA). 178
Continuous variables were summarised by means and standard deviations, whilst 179

8
categorical variables were summarized by frequencies along with the percentage of 180
myopes in each group. All statistical tests were performed using 5% as the level of 181
statistical significance. 182
183
Multilevel mixed-effects logistic regression was used to investigate associations 184
between the odds of myopia in either eye and potential risk factors, including age 185
(per year increase in age), gender, birth weight (per Kg increase in birth weight), 186
current obesity level (measured by BMI or BMI group according to the IOTF 187
classification in children), economic deprivation score (in quintiles; 1: most deprived, 188
5: least deprived), self-reported physical activity levels, self-reported levels of 189
carrying out near visual tasks (including screen-time and time spent on homework), 190
family size of the child (by including the number of younger and number of older 191
siblings in the same model captures the combined effects family size (number of 192
younger siblings + number of older siblings) and birth order (number of older 193
siblings) using two variables that are independent of each other), parental reported 194
myopia and education, child’s place of birth (NI or elsewhere), whether the child lived 195
in an urban or rural environment, and type of school attended (grammar, non-196
grammar). All analyses included school as a random effect to take account of 197
clustering of children within schools. 198
199
All risk factors associated with myopia in univariate analyses were included in the 200
final model, along with established risk factors for myopia (age, gender, urban/rural 201
living environment). An exception was made for variables with a considerable 202
amount of missing values (i .e. more than 30% missing). Missing values occurred 203
9
due to non-completion of the questionnaire or missing information on place of 204
residence of the child. 205
206
Results 207
Of the children invited to participate in the study, parental consent was obtained from 208
65%. Indicative of the Northern Irish population, 98.7% were white and this report 209
presents data from 661 white children aged 12-13-years, 117 (17.7%) of whom were 210
myopic. 211
212
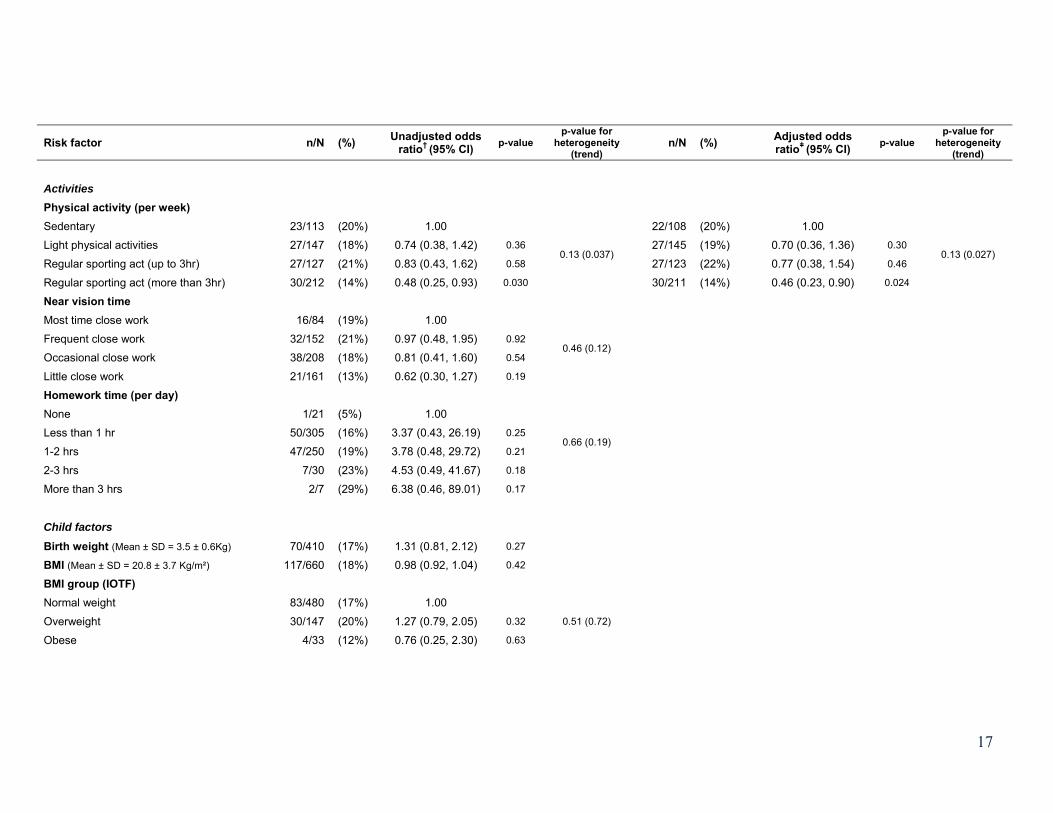
Table 1 provides a summary of the available data along with the odds ratios 213
associated with each risk factor of myopia obtained by analysing each factor 214
separately. Birth weight, place of birth, parental myopia and parental education were 215
subject to a large proportion of missing data ranging between 34% and 62%. For the 216
other variables in Table 1 the degree of data completeness exceeded 90%. With the 217
narrow age range in this study no association between odds of myopia and age was 218
found. There were no significant differences in the proportion of girls and boys who 219
were myopic. Number of younger siblings and physical activity were inversely 220
associated with myopia, whereas attendance at a grammar school, and history of 221
parental myopia were strongly positively associated with myopia. Although the 222
univariate analyses showed a gradually increasing positive effect of the time spent 223
on near vision activities and homework and the risk of myopia, this trend was not 224
statistically significant. 225
226
In multiple variable adjusted regression analysis (Table 1) there is a significant trend 227
between the levels of physical activity and the odds of myopia (p for trend = 0.027), 228
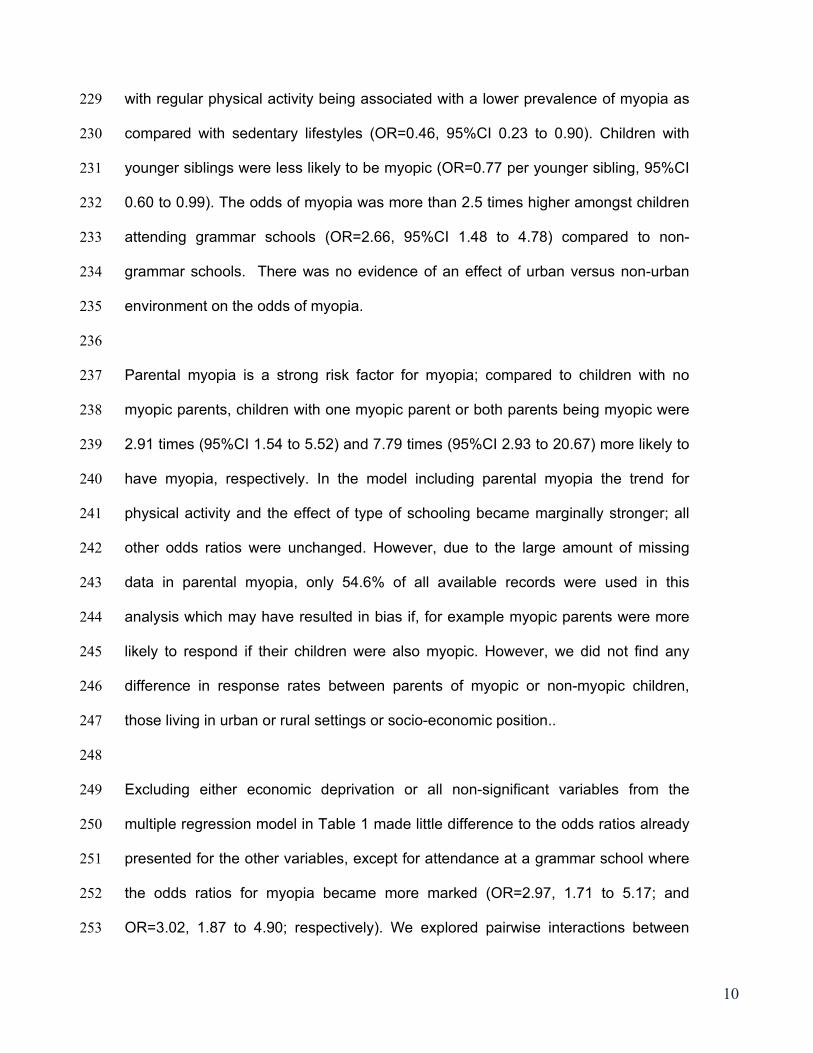
10
with regular physical activity being associated with a lower prevalence of myopia as 229
compared with sedentary lifestyles (OR=0.46, 95%CI 0.23 to 0.90). Children with 230
younger siblings were less likely to be myopic (OR=0.77 per younger sibling, 95%CI 231
0.60 to 0.99). The odds of myopia was more than 2.5 times higher amongst children 232
attending grammar schools (OR=2.66, 95%CI 1.48 to 4.78) compared to non-233
grammar schools. There was no evidence of an effect of urban versus non-urban 234
environment on the odds of myopia. 235
236
Parental myopia is a strong risk factor for myopia; compared to children with no 237
myopic parents, children with one myopic parent or both parents being myopic were 238
2.91 times (95%CI 1.54 to 5.52) and 7.79 times (95%CI 2.93 to 20.67) more likely to 239
have myopia, respectively. In the model including parental myopia the trend for 240
physical activity and the effect of type of schooling became marginally stronger; all 241
other odds ratios were unchanged. However, due to the large amount of missing 242
data in parental myopia, only 54.6% of all available records were used in this 243
analysis which may have resulted in bias if, for example myopic parents were more 244
likely to respond if their children were also myopic. However, we did not find any 245
difference in response rates between parents of myopic or non-myopic children, 246
those living in urban or rural settings or socio-economic position.. 247
248
Excluding either economic deprivation or all non-significant variables from the 249
multiple regression model in Table 1 made little difference to the odds ratios already 250
presented for the other variables, except for attendance at a grammar school where 251
the odds ratios for myopia became more marked (OR=2.97, 1.71 to 5.17; and 252
OR=3.02, 1.87 to 4.90; respectively). We explored pairwise interactions between 253

11
physical activity, number of younger siblings, type of schooling and parental myopia 254
and did not find any statistically significant interactions (in all instances p>0.1) 255
256
Discussion 257
In this study based on school children of predominantly white European ancestry we 258
have shown a strong relationship between estimated prevalence of myopia in 259
children and history of parental myopia; a trend of decreasing prevalence of myopia 260
with increasing levels of physical activity. However the cross sectional design of the 261
study does not allow for causality to be determined and lower time spent in physical 262
activity may reflect other issues related to poor distance vision. An increasing 263
number of younger siblings seemed protective and grammar school attendance 264
increased the risk of myopia. We did not find strong evidence of an association with 265
age, sex, area level of deprivation, urbanicity, birth place, birth weight, childhood 266
body size, intensity of near vision activities or level of parental education. Although 267
associations with gender, and economic deprivation were not statistically significant, 268
their effect on prevalence of myopia was in the expected direction,6, 30 with girls 269
being more likely to be myopic,13, 15, 31-33 and those coming from less deprived 270
economic backgrounds being at an increasingly higher risk.13, 31, 32 271
272
The lack of an association between urbanisation and myopia which has been 273
reported in other studies9 may be due to the current study’s reliance on population 274
density to assess urban/rural environments. Even in urban areas of Northern 275
Ireland, population density remains lower than in many East Asian cities 276
(http://www.metro.tokyo.jp/ENGLISH/PROFILE/overview03.htm, accessed 17th July 277
2014). Furthermore area measurements used to calculate population density 278

12
figures for Northern Ireland are based on the official local government boundaries 279
and include areas of inland water and estuaries. Population densities may therefore 280
be artificially low in areas of close proximity to large bodies of water (Northern 281
Ireland Statistics & Research Agency, 2005 Statistical classification and delineation 282
of settlements, 283
www.nisra.gov.uk/archive/demography/publications/urban_rural/ur_main.pdf, 284
accessed 5th November 2008). Future analysis of the effect of urbanisation on 285
myopia prevalence should use more detailed assessment of the level of urbanisation 286
and include data on the type of housing and housing density.9 287
288
Greater time spent in near work activities showed some evidence of an increased 289
risk of myopia but this relation was not statistically significant. Although other studies 290
have shown near work is a risk factor for myopia the association is often weak34 or 291
inverse35 and a consistent relationship has not been demonstrated.35 Previous 292
studies have also evaluated near work in a variety of ways including the use of 293
diaries, child’s performance on standardised reading scores,36 calculation of dioptre 294
hours (based on the reported number of hours spent on various near vision activities 295
including reading, studying, computer use, video games),3, 37 and the number of 296
books read per week.5 The method used can influence whether an association 297
between near work and myopia is found; Saw et al. (2002) found no statistically 298
significant association with myopia using the number of hours spent reading per 299
week, but using the number of books read per week did show a statistically 300
significant association despite the lack of information on the number of pages and 301
the print size of the books read.5 It is possible that the questionnaire-based method 302
of establishing levels of near work used in the current study provided a relatively 303

13
crude assessment of near work activity and perhaps not be sensitive enough, or the 304
study may lack power, to fully establish any association between near work and 305
myopia. Time outdoors, which was not assessed in the current study, has also been 306
shown to reduce myopia in children who spend large amounts of time engaged in 307
near work.38 Furthermore recall bias is a potential problem and respondents may 308
also inadvertently bias the results as many children and adults are aware of a 309
possible link between near work and myopia which may influence their responses. 310
311
Mutti et al. (2002) suggested that it may be the inverse of near work (i.e. time spent 312
in distance and outdoor activities) that may have a protective effect on the 313
development of myopia.4 Although outdoor activities were not assessed in the 314
current study, the results do suggest that increased physical activity (implying more 315
time spent outdoors) reduces the odds of myopia. Parental responses to questions 316
regarding a child’s sporting activity may be more accurate than those assessing near 317
vision activity as many parents transport their children to and from sporting 318
activities.3 Further support for the association between myopia prevalence and 319
lower levels of physical activity comes from studies that measured physical activity 320
objectively using an accelerometer to avoid the inherent bias of subjective 321
measures.39-41 A recent systematic review suggested that increased time spent 322
outdoors reduces the risk of myopia.42 323
324
The current study confirms previously reported associations between a parental 325
history of myopia and myopia in childhood4, 16, 43 and illustrates that the impact of 326
parental myopia is dose-dependent. Although the reliability of self-reporting of 327
refractive status history has been queried,44 the questions used in the current study 328

14
have been shown to be valid for assessing the presence of myopia.45 The effect of 329
parental myopia remained after adjustment for the other factors and points towards a 330
genetic association. However, it is still possible that the association with parental 331
myopia is, at least in part, due to shared environmental influence and that perhaps 332
the tool we used to assess near vision was not sensitive Despite considerable 333
missing data for this variable our estimates of effect for one or both parents being 334
myopic agree very well with previous studies.18, 46-48 335
336
Grammar schooling appears to be a strong risk factor for myopia but this association 337
is unlikely to be causal. Entrance to grammar schools in NI is a competitive 338
academic process at age 11 years by which stage the children may have already 339
developed myopia. Grammar schooling may be acting as a marker for increased 340
level of education which has been shown to have an effect on the prevalence of 341
myopia.31, 49 Previous studies have suggested an association between intelligence 342
and myopia.26, 50, 51 Often these studies have relied on the use of IQ tests to 343
determine intelligence and results are therefore dependent on the method used to 344
assess IQ. In the current study IQ was not assessed directly hence it is not possible 345
to evaluate whether the association between myopia and grammar school education 346
is confounded by this marker of intelligence. 347
348
As with previous studies,52 children from bigger families were less likely to be 349
myopic. It may reflect the fact that in NI large family size is associated with poverty 350
[Office of the First Minister and Deputy First Minister; 351
http://www.ofmdfmni.gov.uk/childandfamilypoverty2006.pdf; date accessed 9th July 352
15
2014] and in the current study there was a trend for increasing deprivation to be 353
associated with less myopia, although this was not statistically significant. 354
355
This study has examined the association between potential risk factors and presence 356
of myopia at age 12-13-years and many of the reported associations support 357
previous findings, notwithstanding that some lacked power to reach statistical 358
significance. The children in this study are being reassessed at three yearly intervals 359
and further review will help confirm whether these environmental influences are 360
indeed prospective risk factors for myopia. 361
362
Conclusion 363
In Northern Ireland children parental history of myopia and type of schooling, are 364
important determinants of myopia. at age 12-13-years. Further work is underway to 365
assess whether this remains the most significant indicator of refractive outcome or 366
whether environmental factors become more influential on the likelihood of being 367
myopic with increasing age. 368
369
Acknowledgements 370
The authors would like to thank the College of Optometrists, UK for their ongoing 371
support for the NICER study. We are also very grateful to the participants in the 372
NICER study for their ongoing commitment to this research and to the schools where 373
the research is conducted. 374
375
376

16
Table 1: Unadjusted† and adjustedǂ odds ratios of myopia for socio-demographic and life style risk factors
Risk factor n/N (%) Unadjusted odds ratio† (95% CI) p-value
p-value for heterogeneity
(trend) n/N (%) Adjusted odds
ratioǂ (95% CI) p-value p-value for
heterogeneity (trend)
Demographics Age per year (Mean ± SD = 13.1 ± 0.4) 117/661 (18%) 1.71 (0.89, 3.27) 0.11 106/587 (18%) 1.09 (0.55, 2.15) 0.80
Gender Boys 52/334 (16%) 1.00 49/303 (16%) 1.00 Girls 65/327 (20%) 1.44 (0.93, 2.25) 0.11 57/284 (20%) 1.32 (0.83, 2.09) 0.24
Family size (mutually adjusted) Per younger siblings 106/610 (17%) 0.75 (0.59, 0.95) 0.020
0.065 106/587 (18%) 0.77 (0.60, 0.99) 0.038
0.11 Per older siblings 106/610 (17%) 0.92 (0.76, 1.11) 0.38 106/587 (18%) 0.95 (0.79, 1.16) 0.64
Type of Schooling Non-grammar school 45/374 (12%) 1.00 34/303 (11%) 1.00 Grammar school 72/287 (25%) 2.45 (1.62, 3.69) <0.001 72/284 (25%) 2.66 (1.48, 4.78) 0.001
Deprivation score 1st quintile (most deprived) 15/130 (12%) 1.00
0.055 (0.17)
14/130 (11%) 1.00
0.72 (0.70)
2nd quintile 16/130 (12%) 1.06 (0.49, 2.27) 0.89 15/130 (12%) 1.01 (0.44, 2.32) 0.98
3rd quintile 34/130 (26%) 2.52 (1.24, 5.11) 0.010 30/130 (23%) 1.57 (0.72, 3.43) 0.26
4th quintile 24/130 (18%) 1.61 (0.77, 3.38) 0.21 23/130 (18%) 1.13 (0.50, 2.55) 0.77
5th quintile (least deprived) 26/130 (20%) 1.74 (0.82, 3.70) 0.15 24/130 (18%) 1.22 (0.55, 2.70) 0.62
Living environment Not urban 71/367 (19%) 1.00 66/337 (20%) 1.00 Urban 45/287 (16%) 0.83 (0.54, 1.29) 0.41 40/250 (16%) 0.91 (0.55, 1.48) 0.70
Birth place Not NI 7/31 (23%) 1.00 NI 68/403 (17%) 0.66 (0.27, 1.63) 0.37
17
Risk factor n/N (%) Unadjusted odds ratio† (95% CI) p-value
p-value for heterogeneity
(trend) n/N (%) Adjusted odds
ratioǂ (95% CI) p-value p-value for
heterogeneity (trend)
Activities Physical activity (per week) Sedentary 23/113 (20%) 1.00
0.13 (0.037)
22/108 (20%) 1.00
0.13 (0.027) Light physical activities 27/147 (18%) 0.74 (0.38, 1.42) 0.36 27/145 (19%) 0.70 (0.36, 1.36) 0.30
Regular sporting act (up to 3hr) 27/127 (21%) 0.83 (0.43, 1.62) 0.58 27/123 (22%) 0.77 (0.38, 1.54) 0.46
Regular sporting act (more than 3hr) 30/212 (14%) 0.48 (0.25, 0.93) 0.030 30/211 (14%) 0.46 (0.23, 0.90) 0.024
Near vision time Most time close work 16/84 (19%) 1.00
0.46 (0.12) Frequent close work 32/152 (21%) 0.97 (0.48, 1.95) 0.92
Occasional close work 38/208 (18%) 0.81 (0.41, 1.60) 0.54
Little close work 21/161 (13%) 0.62 (0.30, 1.27) 0.19
Homework time (per day) None 1/21 (5%) 1.00
0.66 (0.19) Less than 1 hr 50/305 (16%) 3.37 (0.43, 26.19) 0.25
1-2 hrs 47/250 (19%) 3.78 (0.48, 29.72) 0.21
2-3 hrs 7/30 (23%) 4.53 (0.49, 41.67) 0.18
More than 3 hrs 2/7 (29%) 6.38 (0.46, 89.01) 0.17
Child factors Birth weight (Mean ± SD = 3.5 ± 0.6Kg) 70/410 (17%) 1.31 (0.81, 2.12) 0.27
BMI (Mean ± SD = 20.8 ± 3.7 Kg/m²) 117/660 (18%) 0.98 (0.92, 1.04) 0.42
BMI group (IOTF) Normal weight 83/480 (17%) 1.00
0.51 (0.72) Overweight 30/147 (20%) 1.27 (0.79, 2.05) 0.32
Obese 4/33 (12%) 0.76 (0.25, 2.30) 0.63

18
Risk factor n/N (%) Unadjusted odds ratio† (95% CI) p-value
p-value for heterogeneity
(trend) n/N (%) Adjusted odds
ratioǂ (95% CI) p-value p-value for
heterogeneity (trend)
Parental factors Parental myopia None 25/227 (11%) 1.00
<0.001 (<0.001)
25/225 (11%) 1.00 <0.001 (<0.001) One parent 28/109 (26%) 2.79 (1.54, 5.08) 0.001 28/109 (26%) 2.91 (1.54, 5.52)# 0.001
Both parents 12/27 (44%) 6.46 (2.72, 15.36) <0.001 12/27 (44%) 7.79 (2.93, 20.67)# <0.001
Parental education Low 17/113 (15%) 1.00
0.83 (0.56) Medium 17/98 (17%) 1.19 (0.57, 2.47) 0.65
High 22/123 (18%) 1.23 (0.62, 2.46) 0.56
n = number of cases of myopia per number of children with available data (N).
† Odds ratios are not mutually adjusted but take into account the clustering of children within schools
ǂ Odds ratios are mutually adjusted for all factors listed in the column of adjusted odds ratios except for parental myopia, and adjusted for the
clustering of children within schools.
# Odds ratios are obtained from a separate model fitted to a subset of the data, adjusting for age, gender, family size, school, deprivation score,
living environment, physical activity and for the clustering of children within schools.
19
References
1. Vitale S, Cotch MF, Sperduto R, Ellwein L. Costs of refractive correction of distance vision impairment in the United States, 1999-2002. Ophthalmology 2006;113:2163-2170.
2. Verhoeven VJ, Wong KT, Buitendijk GH, Hofman A, Vingerling JR, Klaver CC. Visual consequences of refractive errors in the general population. Ophthalmology 2014.[Epub ahead of print].
3. Jones LA, Sinnott LT, Mutti DO, Mitchell GL, Moeschberger ML, Zadnik K. Parental history of myopia, sports and outdoor activities, and future myopia. Invest Ophthalmol Vis Sci. 2007;48:3524-3532.
4. Mutti DO, Mitchell GL, Moeschberger ML, Jones LA, Zadnik K. Parental myopia, near work, school achievement, and children's refractive error. Invest Ophthalmol Vis Sci. 2002;43:3633-3640.
5. Saw SM, Chua WH, Hong CY, et al. Nearwork in early-onset myopia. Invest Ophthalmol Vis Sci. 2002;43:332-339.
6. Rahi JS, Cumberland PM, Peckham CS. Myopia over the lifecourse: Prevalence and early life influences in the 1958 British birth cohort. Ophthalmology 2011;118:797-804.
7. Ojaimi E, Morgan IG, Robaei D, et al. Effect of stature and other anthropometric parameters on eye size and refraction in a population-based study of Australian children. Invest Ophthalmol Vis Sci. 2005;46:4424-4429.
8. Dirani M, Islam A, Baird PN. Body stature and myopia-the genes in myopia (GEM) twin study. Ophthalmic Epidemiol. 2008;15:135-139.
9. Ip JM, Rose K, Morgan I, Burlutsky G, Mitchell P. Myopia and the urban environment: Findings for a sample of 12-year old Australian school children. Invest Ophthalmol Vis Sci. 2008.
10. Jacobsen N, Jensen H, Goldschmidt E. Does the level of physical activity in university students influence development and progression of myopia?--a 2-year prospective cohort study. Invest Ophthalmol Vis Sci. 2008;49:1322-1327.
11. O'Connor AR, Stephenson TJ, Johnson A, Tobin MJ, Ratib S, Fielder AR. Change of refractive state and eye size in children of birth weight less than 1701 g. Br J Ophthalmol. 2006;90:456-460.
12. Stone RA, Wilson LB, Ying GS, et al. Associations between childhood refraction and parental smoking. Invest Ophthalmol Vis Sci. 2006;47:4277-4287.

20
13. Rudnicka AR, Owen CG, Richards M, Wadsworth ME, Strachan DP. Effect of breastfeeding and sociodemographic factors on visual outcome in childhood and adolescence. Am J Clin Nutr. 2008;87:1392-1399.
14. Chong YS, Liang Y, Tan D, Gazzard G, Stone RA, Saw SM. Association between breastfeeding and likelihood of myopia in children. JAMA 2005;293:3001-3002.
15. Ip JM, Huynh SC, Robaei D, et al. Ethnic differences in refraction and ocular biometry in a population-based sample of 11-15-year-old Australian children. Eye 2008;22:649-656.
16. Williams C, Saw S, Miller L, Gazzard, G. and ALSPAC Study Group. Major risk factors for myopia compared in English and Singaporean cohorts of 7-year old children. Invest Ophthal Vis Sci. 2005;46.
17. Zadnik K, Satariano WA, Mutti DO, Sholtz RI, Adams AJ. The effect of parental history of myopia on children's eye size. JAMA. 1994;271:1323-1327.
18. Ip JM, Huynh SC, Robaei D, et al. Ethnic differences in the impact of parental myopia: Findings from a population-based study of 12-year-old Australian children. Invest Ophthalmol Vis Sci. 2007;48:2520-2528.
19. Rudnicka AR, Owen CG, Nightingale CM, Cook DG, Whincup PH. Ethnic differences in the prevalence of myopia and ocular biometry in 10-11 year old children: The child heart and health study in England (CHASE). Invest Ophthalmol Vis Sci. 2010;51:6270-6276.
20. Logan NS, Shah P, Rudnicka AR, Gilmartin B, Owen CG. Childhood ethnic differences in ametropia and ocular biometry: The Aston eye study. Ophthalmic Physiol Opt. 2011;31:550-558.
21. Ip JM, Huynh SC, Kifley A, et al. Variation of the contribution from axial length and other oculometric parameters to refraction by age and ethnicity. Invest Ophthalmol Vis Sci. 2007;48:4846-4853.
22. Morgan IG, Ohno-Matsui K, Saw SM. Myopia. Lancet 2012;379:1739-1748.
23. Pan CW, Ramamurthy D, Saw SM. Worldwide prevalence and risk factors for myopia. Ophthalmic Physiol Opt. 2012;32:3-16.
24. Wojciechowski R. Nature and nurture: The complex genetics of myopia and refractive error. Clin Genet. 2011;79:301-320.
25. Flitcroft DI. The complex interactions of retinal, optical and environmental factors in myopia aetiology. Prog Retin Eye Res. 2012;31:622-660.
26. Saw SM, Katz J, Schein OD, Chew SJ, Chan TK. Epidemiology of myopia. Epidemiol.Rev. 1996;18:175-187.

21
27. French AN, O'Donoghue L, Morgan IG, Saunders KJ, Mitchell P, Rose KA. Comparison of refraction and ocular biometry inEuropean Caucasian children living in Northern Ireland and Sydney, Australia. Invest Ophthalmol Vis Sci. 2012;53:4021-4031.
28. O'Donoghue L, Saunders KJ, McClelland JF, et al. Sampling and measurement methods for a study of childhood refractive error in a UK population. Br J Ophthalmol. 2010;94:1150-1154.
29. Cole TJ, Bellizzi MC, Flegal KM, Dietz WH. Establishing a standard definition for child overweight and obesity worldwide: International survey. Br Med J 2000;320:1240-1243.
30. Vitale S, Sperduto RD, Ferris FL,3rd. Increased prevalence of myopia in the United States between 1971-1972 and 1999-2004. Arch Ophthalmol. 2009;127:1632-1639.
31. Sperduto RD, Seigel D, Roberts J, Rowland M. Prevalence of myopia in the United States. Arch Ophthalmol. 1983;101:405-407.
32. Quek TP, Chua CG, Chong CS, et al. Prevalence of refractive errors in teenage high school students in Singapore. Ophthalmic Physiol.Opt. 2004;24:47-55.
33. Midelfart A, Kinge B, Midelfart S, Lydersen S. Prevalence of refractive errors in young and middle-aged adults in Norway. Acta Ophthalmol Scand. 2002;80:501-505.
34. Morgan I, Rose K. How genetic is school myopia? Prog Retin Eye Res. 2005;24:1-38.
35. Saw SM. A synopsis of the prevalence rates and environmental risk factors for myopia. Clin Exp Optom. 2003;86:289-294.
36. Williams C, Miller LL, Gazzard G, Saw SM. A comparison of measures of reading and intelligence as risk factors for the development of myopia in a UK cohort of children. Br J Ophthalmol. 2008;92:1117-1121.
37. Saw SM, Carkeet A, Chia KS, Stone RA, Tan DT. Component dependent risk factors for ocular parameters in Singapore Chinese children. Ophthalmology. 2002;109:2065-2071.
38. Rose KA, Morgan IG, Ip J, et al. Outdoor activity reduces the prevalence of myopia in children. Ophthalmology. 2008.
39. Williams C, Deere K, Leary S, et al. Myopia in children and objectively measured physical activity. Invest Ophthalmol Vis Sci. 2007;E-abstract 1026.
22
40. Reilly JJ, Penpraze V, Hislop J, Davies G, Grant S, Paton JY. Objective measurement of physical activity and sedentary behaviour: Review with new data. Arch Dis .Child. 2008;93:614-619.
41. Deere K, Williams C, Leary S, et al. Myopia and later physical activity in adolescence: A prospective study. Br J Sports Med. 2009;43:542-544.
42. Sherwin JC, Hewitt AW, Coroneo MT, Kearns LS, Griffiths LR, Mackey DA. The association between time spent outdoors and myopia using a novel biomarker of outdoor light exposure. Invest Ophthalmol Vis Sci. 2012.
43. Zadnik K. The Glenn A. Fry award lecture (1995). Myopia development in childhood. Optom Vis Sci. 1997;74:603-608.
44. Cumberland PM, Peckham CS, Rahi JS. Capturing myopia and hypermetropia 'phenotypes' without formal refraction. Eye 2008;22:939-943.
45. Breslin KM, O'Donoghue L, Saunders KJ. An investigation into the validity of self-reported classification of refractive error. Ophthalmic Physiol Opt. 2014;34:346-352.
46. Pacella R, McLellan J, Grice K, Del Bono EA, Wiggs JL, Gwiazda JE. Role of genetic factors in the etiology of juvenile-onset myopia based on a longitudinal study of refractive error. Optom Vis Sci. 1999;76:381-386.
47. Xiang F, He M, Morgan IG. The impact of parental myopia on myopia in Chinese children: Population-based evidence. Optom Vis Sci. 2012;89:1487-1496.
48. Wu MM, Edwards MH. The effect of having myopic parents: An analysis of myopia in three generations. Optom Vis Sci. 1999;76:387-392.
49. Katz J, Tielsch JM, Sommer A. Prevalence and risk factors for refractive errors in an adult inner city population. Invest Ophthalmol Vis Sci. 1997;38:334-340.
50. Rosner M, Belkin M. Intelligence, education, and myopia in males. Arch Ophthalmol. 1987;105:1508-1511.
51. Saw SM, Tan SB, Fung D, et al. IQ and the association with myopia in children. Invest Ophthalmol Vis Sci. 2004;45:2943-2948.
52. Peckham CS, Gardiner PA, Goldstein H. Acquired myopia in 11-year-old children. Br Med J. 1977;1:542-545.