Embed Size (px)
Citation preview
1
What’s a SNP between friends: the influence of single nucleotide polymorphisms on 1
virulence and phenotypes of Clostridium difficile strain 630 and derivatives 2
3
Running Title: What’s a SNP between Friends? 4
5
Mark M Collery a,1,†, Sarah A Kuehnea,b,2,†, Shonna M McBridec, Michelle L Kellya, Marc 6
Monotd, Alan Cockaynea, Bruno Dupuyd, and Nigel P Mintona,b,* 7
8
a Clostridia Research Group, BBSRC/EPSRC Synthetic Biology Research Centre (SBRC), School 9
of Life Sciences, University of Nottingham, Nottingham, UK; bNIHR Biomedical Research 10
Unit in Gastrointestinal and Liver Diseases at Nottingham University Hospitals NHS Trust, 11
University of Nottingham, Nottingham, UK; c Department of Microbiology and 12
Immunology, Emory Antibiotic Resistance Center, Emory University, Atlanta, USA, and; d 13
Laboratoire Pathogenèse des Bactéries Anaérobies, Institut Pasteur, Paris, France. 14
15
*Corresponding to: Nigel P Minton; Email: [email protected] 16
Current address: 1Micropathology Ltd., University of Warwick Science Park, Venture Centre, 17
Sir William Lyons Road, Coventry, UK and 2 current address: Dr Sarah A. Kuehne, School of 18
Dentistry, Institute of Clinical Sciences, College of Medical & Dental Sciences, The University 19
of Birmingham, Birmingham, UK. 20
21
† These authors contributed equally to the work. 22
2
Keywords: single nucleotide polymorphism; sporulation; motility; toxin expression; 23
mutation; ClosTron; virulence 24
25
Abstract 26
Clostridium difficile is a major cause of antibiotic induced diarrhoea worldwide, 27
responsible for significant annual mortalities and represents a considerable economic 28
burden on healthcare systems. The two main C. difficile virulence factors are toxins A and B. 29
Isogenic toxin B mutants of two independently isolated erythromycin-sensitive derivatives 30
(630E and 630Δerm) of strain 630 were previously shown to exhibit substantively different 31
phenotypes. Compared to 630, strain 630E and its progeny grow slower, achieve lower final 32
cell densities, exhibit a reduced capacity for spore-formation, produce lower levels of toxin 33
and are less virulent in the hamster infection model. By the same measures, strain 630Δerm 34
and its derivatives more closely mirror the behaviour of 630. Genome sequencing revealed 35
that 630Δerm had acquired seven unique Single Nucleotide Polymorphisms (SNPs) 36
compared to 630 and 630E, while 630E had nine SNPs and a DNA inversion not found in the 37
other two strains. The relatively large number of mutations meant that the identification of 38
those responsible for the altered properties of 630E was not possible, despite the 39
restoration of three mutations to wildtype by allelic exchange and comparative RNAseq 40
analysis of all three strains. The latter analysis revealed large differences in gene expression 41
between the three strains, explaining in part why no single SNP could restore the phenotypic 42
differences. Our findings suggest that strain 630∆erm should be favoured over 630E as a 43
surrogate for 630 in genetic-based studies. They also underline the importance of effective 44
strain curation and the need to genome re-sequence master seed banks wherever possible. 45
3
Introduction 46
47
Clostridium difficile is a Gram-positive, anaerobic spore-forming bacterium capable of 48
causing a range of diseases from mild diarrhoea to potentially fatal toxic 49
pseudomembranous colitis. The toxigenic effects of C. difficile are caused by the activities of 50
two large, glucosylating toxins. The two toxins are 308kDa (toxin A) and 270kDa (toxin B) in 51
size 1-3 and are encoded by the chromosomally located genes tcdA and tcdB, respectively. 52
Both are cytopathic to cultured cells due to disruption of the cytoskeleton, although TcdB is 53
thought to be up to 1000-times more potent.1 Historically, toxin A was regarded as the main 54
causative agent of the symptoms of C. difficile infection (CDI). Pivotal data was provided by 55
Lyerly et al.4 who were only able to detect disease when hamsters were subject to 56
intragastric challenge with purified TcdA alone and not with TcdB. The latter could, however, 57
cause disease symptoms if prior damage to the mucosa had been inflicted by co-58
administration of sub-lethal concentrations of toxin A. Furthermore, co-administration of 59
both toxins led to more severe disease symptoms. To accommodate these data, it was 60
generally accepted that both toxins acted in concert to bring about disease symptoms, with 61
toxin A leading to the initial damage to the colon allowing the subsequent access of the more 62
potent toxin B. 63
During the 1990’s C. difficile strains were isolated from symptomatic patients that only 64
produced toxin B (A-B+)5, 6. These findings suggested that toxin B, at least in certain strains, 65
is capable of causing disease without the help of toxin A. It has been reported since that 66
toxin B, in A-B+ strains, is modified and seems to be an evolutionary hybrid of C. difficile 67
toxin B and Clostridium sordellii lethal toxin.7 68
4
With the development of genetic systems, assumptions of the relative importance of 69
the two toxins could be tested through the creation, and in vivo assay, of isogenic mutants 70
in which production of either toxin had been ablated. Initial findings made by Lyras et al.8 71
appeared to turn the perceived view on its head, through the demonstration that a tcdA 72
mutant producing TcdB alone (A-B+) was capable of causing disease in the hamster model 73
while a tcdB mutant producing only TcdA (A+B-) did not. These data were, however, almost 74
immediately questioned by a second study conducted in the Minton laboratory 9 showing 75
that both tcdA and tcdB C. difficile mutants, and therefore TcdA and TcdB alone, were 76
independently capable of causing disease. Interestingly, a strain has recently10 beren 77
isolated from a clinical case of CDI, that only produces TcdA (A+B-) 78
The possible reasons for the observed difference in outcomes of the two studies have 79
been discussed previously. 11 Both studies agree on the virulence potential of toxin B, but 80
uncertainties remain about the different outcomes concerning the effects of toxin A. In the 81
work presented here, we have hence focused on comparisons of the parental strains and 82
the strains only producing toxin A (A+B-). In essence, both sets of mutants were generated 83
by insertional inactivation of the toxin genes of the C. difficile strain 630 12 and, once created, 84
were tested in the hamster infection model. However, in order to implement the available 85
gene tools in strain 630 (at the time the only strain for which a genome sequence was 86
available), it was necessary to first isolate a variant that had become sensitive to 87
erythromycin, thereby allowing the use of an ermB gene as a selective, genetic marker. Both 88
studies used such an erythromycin-sensitive derivative of strain 630, but they were 89
independently isolated. In our study (Minton group), 9 we used the strain 630Δerm, isolated 90
in the Mullany laboratory (UCL, London, UK) after 30 repeated subcultures of strain 630 in 91
5
non-selective media. 13 In parallel, the Rood laboratory (Monash, Australia) independently 92
isolated the erythromycin sensitive strain JIR8094 (also referred to as 630E), 14 through an 93
undisclosed number of subcultures of strain 630 in non-selective media. Both strains are 94
reported to possess the same specific deletion of ermB. 13, 14 95
We have previously hypothesised 11 that the different outcomes of the two studies 8, 9 96
are a direct consequence of the use of the two, independently isolated erythromycin-97
sensitive strains, 630Δerm and 630E. We suggested that during repeated subculture, 98
ancillary mutations arose which impacted on the virulence potential of one or other of the 99
two strains in the presence of different toxin gene alleles. In the current piece of work, we 100
have set out to test this hypothesis. We have undertaken side-by-side comparisons of 101
630Δerm and 630E, and the A+B- mutant derivatives, in a variety of assays to establish 102
phenotypic differences. In parallel, we have determined the genome sequences of the 103
various strains used in the two studies. 8, 9 Then, we have used our newly developed allelic 104
exchange methodologies 15 to correct a number of SNPs in strain 630E back to wild-type and 105
assessed the consequences. Furthermore we have performed RNAseq experiments 106
comparing the transcriptome of 630, 630Δerm and 630E at three different time points. The 107
RNA data were related to the whole genome data to draw our final conclusions. 108
109
Results 110
Generation of a ClosTron insertion in tcdB of 630E 111
Although considered unlikely, the possibility existed that mutants made by the insertion 112
of a plasmid element carrying ermB 14 might behave differently to an equivalent mutant 113
made by the insertion of a group II intron incorporating ermB. 16 Our initial step was, 114
6
therefore, to create a tcdB mutant of strain 630E using ClosTron technology. Accordingly, 115
the ClosTron plasmid pMTL007C-E2::Cdi-tcdB-1511a that had previously been used to 116
generate strain 630∆erm A+B- 9 was used to create an equivalent mutant in strain 630E as 117
described. 9 The resulting mutant, 630E A+B-CT, was verified by PCR, Sanger sequencing and 118
shown by Southern blot to carry a single group II intron insertion (Fig. S1A). Parental strains, 119
original A+B- mutants and the newly obtained mutant were tested for production of toxin A 120
in a Western blot (Fig. S1B). As expected all strains produced toxin A. 121
122
Phenotypic characterisation of strains 123
In order to establish whether all strains were phenotypically identical a range of assays 124
were performed, comparing growth, motility and spore properties. An analysis of growth 125
rates using the procedure described in Materials and Methods showed that strain 630∆erm 126
and derivatives grew to the highest optical density, closely followed by strain 630 and 630E, 127
and derivatives thereof (Fig. 1A and 1B). The data clearly demonstrated that strain 630∆erm 128
and its 630∆erm A+B- derivative had relatively higher growth rates and achieved higher 129
optical densities (p < 0.0001, unpaired t-test at 24 h) than strain 630E and its derivatives, 130
with strain 630E A+B-CT growing the least (Fig. 1B). It was also apparent, shown by plate 131
motility assay (Fig. 2), that strains 630 and 630∆erm were motile, while 630E was not. Only 132
630 and 630∆erm, but not 630E, form pseudopod-like structures, which are characteristic 133
for swarming motility in bacteria. 134
Following the protocols of Burns et al, 17 comparative differences in the numbers of 135
colony forming units (CFUs) obtained following heat shock were assessed between the 136
strains, as a crude estimate of spore formation. 18 On this basis, strains 630∆erm and 137
7
630∆erm A+B- produced a greater numbers of spores than 630E and its derivatives, which 138
failed to produce any spores until 72 h. The total number of CFU/mL at this time point was 139
103 times fewer than that obtained with 630∆erm or 630∆erm A+B- (Fig. 3A). Interestingly 140
parental strain 630 produced very few spores before 72 h, but spore counts increased from 141
72 h onwards and reached similar levels to strains 630∆erm and 630∆erm A+B- by the end 142
of the experiment. The reduction in spore formation may in part be due to the observed 143
reduction in OD as the 630E strains enter stationary phase, which might also explain their 144
predilection to flocculate. Indeed comparing percentage sporulation (relative to vegetative 145
cell count), confirmed the observation that 630∆erm and 630∆erm A+B- have a higher 146
sporulation frequency than both 630E (and derivatives) and strain 630. 147
The germination of the 630E strains was also comparatively reduced and did not reach 148
the same level as that of 630∆erm and its progeny. At the last time point (240 min) strains 149
630E and 630E A+B- reach the same level of CFU/ml as strain 630. The observed delay could 150
be due to the previously observed reduced cell growth of the 630E strains (Fig. 3B). 151
152
Toxin Production 153
Measurements of the amounts of toxin being produced by 630E and 630∆erm and their 154
derivatives were undertaken using both the C. DIFFICILE TOX A/B II™ ELISA assay kit from 155
TechLab, measuring toxin A and B, and kits from TGCbiomics, specifically measuring either 156
only toxin A or only toxin B. The results of the 72 h time point are shown in Fig. 4. 157
As shown in Fig. 4A, toxin production of 630, 630∆erm or 630∆erm A+B- clustered 158
together, as did toxin production of 630E, 630E A+B- or 630E A+B- CT with the latter three 159
showing no statistical differences between them (P >0.05, one-way ANOVA with Fisher’s LSD 160
8
test). There was, however, a statistically significant difference between the first three strains 161
(630, 630∆erm or 630∆erm A+B-) and the second set of three strains (630E, 630E A+B- or 162
630E A+B- CT) (P < 0.0001). The C. DIFFICILE TOX A/B II™ ELISA does not differentiate 163
between toxin A and B. In order to be able to quantify each toxin, the kits from TGCbiomics 164
were used (Fig. 4B and 4C). The toxin A ELISA showed significantly higher production in strain 165
630Δerm compared to 630E (p<0.0016) and also confirmed the previous observations that 166
strains with impaired tcdB, produce more toxin A 8, 9 (Fig. 4B). No toxin B production was 167
seen, as expected, in the tcdB-mutants. Strains 630 and 630Δerm, however, both produced 168
significantly more toxin B than 630E (p<0.0001) (Fig. 4C). 169
170
Whole genome sequencing 171
To establish whether strains 630E and 630Δerm, and derivatives, contained any 172
additional changes to the ermB gene deletion, relative to the parent strain 630, the following 173
strains were sequenced using Next Generation Sequencing platforms: 630E A+B-, 630E A+B- 174
CT on Illumina HiSeq (GATC, Germany) and 630Δerm A-B on a Roche 454 (Deepseq, 175
University of Nottingham, UK) and the data compared to the published genome of the 176
parental strain 630 12 and previously sequenced 630ΔermΔpyrE. 19 We used a frequency of 177
70% as a cut-off for SNP calling and found multiple SNPs, InDels and other minor changes, 178
both common and unique to 630, 630E and 630Δerm. In total, two SNPs in coding regions 179
with non-synonymous changes were found that were common to all three strains (in 180
CD630_11900, encoding an acyl-CoA N-acyltransferase where SNP changes 181
phenylalanine133 to leucine and in CD630_13880, a pseudo gene where a frameshift is 182
introduced). In addition to these, we found in both 630 and 630Δerm strains three SNPs (two 183

9
in intergenic regions and one in a coding region of CD630_2667, encoding the BC domain of 184
a glucose PTS, changing valine228 to isoleucine). 630Δerm had seven unique changes 185
compared to 630 and 630E (including six non-synonymous SNPs in coding regions), while 186
630E had eleven SNPs (with nine non-synonymous SNPs in coding regions) not found in the 187
other two strains. SNPs were confirmed by Sanger sequencing and thereafter by RNAseq 188
data (see below). Indeed, the SNPs found in the DNA-seq data were validated by using 189
the RNA-seq sequence reads mapped on the genome sequence with Bowtie2 20 with each 190
position being checked using Tablet 21. A complete list of SNPs and other small changes are 191
indicated in Table 1 and in supplementary Table S1. During the preparation of this 192
manuscript a new sequence of 630 was published by Riedel et al. 22. We incorporated their 193
data into Table 1 (and Table S1). Overall this new sequence shows very few disparities to 194
the original one. However two SNPs found in our data were attributed to mistakes in the 195
original sequence (in CD630_17670 and CD630_31561). Another paper was recently 196
published by van Eijk et al., 23 resequencing 630Δerm. Overall there are very few 197
discrepancies between their data and our findings, confirming the quality of both data sets. 198
We have incorporated their findings into Table S1. 199
It may be assumed, that during the repeated subculture of strain 630 undertaken in the 200
Mullany 13 and Rood 14 laboratories, sub-populations within the culture were isolated 201
carrying SNPs. However, it seems improbable that the two SNPs (Table 1), common to all 202
three strains, arose independently. Rather we hypothesise that these SNPs might be 203
sequencing mistakes. This theory gains weight through the new sequencing data by Riedel 204
et al. 22. Two SNP changes which we identified originally between the published 630 205
sequence and our data were confirmed by Riedel et al to also be the sequence of their 630 206
10
seed stock. Unfortunately the genome announcement 22 does not state the exact source of 207
their 630 strain. As mentioned above another three SNPs were only found in 630 and 208
630Δerm, two of these are in intergenic regions which showed no expression in our RNAseq 209
experiment, and the third is located in a PTS gene in 630 and 630Δerm (position 3080703, 210
Val228Ile). Rather than having occurred independently it is more likely that these SNPs arose 211
in the Mullany laboratory, subsequent to provision of chromosomal DNA to the Sanger 212
Centre for determination of the 630 genome sequence 12, and before the strain 630 was 213
passaged to obtain 630Δerm. At the time, C. difficile strains in the Mullany laboratory were 214
routinely stored at 4°C as Robertson’s Cooked Meat stocks, as opposed to being frozen at -215
80°C in 10% glycerol (A.R. Roberts, personal communication). On this basis, the traditional 216
microbiological practice of using Robertson’s Cooked Meat to curate strains might not be 217
ideal as strains are not entirely dormant and genome changes can occur over time. The SNPs 218
that were found to be unique to 630Δerm and 630E (n=8 and n=11, respectively) can be 219
assumed to have been accrued at some point after the two 630 populations diverged, that 220
is when the strain was sent to the Rood laboratory. It is most likely, although not certain, 221
that the majority, if not all of the strain-specific SNPs arose during the repeated subculture 222
experiments undertaken to isolate the ermB deletion strains 630E and 630Δerm. 223
Changes specific to 630Δerm include SNPs in three intergenic regions, which all have 224
been determined with a coverage of over 150 and 100 % frequency (see Table 1). The other 225
five changes comprise four non-synonymous SNPs and an insertion. The insertion has 226
previously been reported by Rosenbusch et al.24 and was confirmed by van Eijk et al. 23 and 227
is an 18 bp duplication in spo0A, the master regulator of sporulation. This insertion might be 228
responsible for the reduced sporulation frequency seen in strain 630 and also in 630E and 229
11
derivatives, which do not carry this duplication (which does not have this duplication) (Fig. 230
3A). The SNPs have been found in the following genes: CD630_08260, encoding a ferric 231
uptake regulator (perR homologue) (Thr41Ala); CD630_19070, encoding an alcohol 232
dehydrogenase homologue (eutG) (Gly252Glu); and CD630_35630, encoding a transcriptional 233
regulator of the GntR family (Ala91Val). 234
In contrast, strain 630E contains a larger number of non-synonymous SNPs including 235
changes that result in nonsense mutations and in one case the inversion of a small segment 236
of DNA preceding a flagella operon. We found two changes in intergenic regions, one with 237
100 % frequency and a coverage of 94 (position 3528736); the other at a much lower 238
frequency (41 %), but confirmed a 150 bp inversion by Sanger sequencing in the promoter 239
region of flgB, the first gene in a F3 flagella operon (early flagella genes). Non-synonymous 240
SNPs were found in CD630_07610, encoding a putative RNA helicase (Asp136Tyr); 241
CD630_14040, encoding an oligopeptide transporter (Glu536Gly); CD630_20270, encoding a 242
hydrolase (Gly373Glu); CD630_29430, encoding a phage replication protein (Asn210Asp); and 243
CD630_33790, encoding a conjugative transposon protein (Glu63Asp). Finally, there is 244
another SNP at position 3034953, in gene CD630_26270 (Gly68Cys), encoding a conserved 245
hypothetical protein. Interestingly the new genome sequence from Eijk et al. 23 suggested 246
an “A” at position 3034953 in contrast to the earlier annotation suggesting “C”. The new 247
annotation is in line with our RNAseq data (Table S1) and taken into account our sequencing 248
data (Table 1) suggests that this is indeed a mutation in 630E and was miss-annotated in the 249
original sequence. In one instance the nucleotide substitution resulted in the creation of a 250
nonsense, stop codon, and as a consequence a severe, premature truncation of the encoding 251
protein. Thus, the stop codon introduced into CD630_12740 encoding a topoisomerase I 252

12
(topA) homologue (Gln386*) truncated the protein from 695 amino acids to 385 amino acids. 253
Conversely, in the case of the glucose PTS operon ptsG-BC, the conversion of the stop codon 254
of ptsG-B gene (CD630_26670) to a Glu codon (*524Glu) resulted in its fusion to the coding 255
region of the immediately downstream ptsG-C gene. 256
Virulence testing of 630Δerm, 630E and mutants using an in vivo model 257
In order to confirm previous data and to rule out differences in experimental set up in 258
different laboratories, the virulence of 630E and derivatives was assessed using the hamster 259
infection model in our laboratory (University of Nottingham) as previously described. 9 260
Figure 5 shows the times from infection to endpoint (in days) for the hamsters infected 261
with 630E, 630E A+B- and 630E A+B- CT. For comparative purposes data for infection with 262
630Δerm and 630Δerm A+B- from a previous study 9 is also included. The latter emphasises 263
the fact that all eight hamsters infected with strain 630Δerm were colonised and succumbed 264
to C. difficile disease (with an average time of 3.25 days from infection to endpoint). This is 265
in direct contrast to what is observed with 630E where of the five animals successfully 266
infected, only three were colonised till the respective endpoints and of these, two 267
succumbed to disease (at day two and six). Two animals lost colonisation after days 15 and 268
18, respectively. 269
In our previous study 9 seven, of the eight animals infected with 630∆erm A+B- (as also 270
shown in Fig. 5), succumbed to disease with an average time to death of colonised hamsters 271
being just under two days. One animal showed no signs of disease until the experimental 272
endpoint, but was found not to have been colonised. Here of the 11 animals infected with 273
the equivalent mutant of strain 630E (630E A+B-), only two animals succumbed to CDI (on 274
day two and nine). Four animals in this group were never colonised, one lost colonisation 275

13
after day three and the others were colonised till endpoint. Six animals were infected with 276
630E A+B- CT, and of these two hamsters developed infection (day three and five). Two of 277
the surviving animals lost colonisation after day 15 and 18 respectively. (Fig. 5 and Table S2). 278
The difference between the average time to death of all hamsters administered 279
630∆erm and 630∆erm A+B- was found not to be statistically significant (one-way ANOVA, 280
p=0.5355) (results from Kuehne et al. 9). Similarly, the differences between the average 281
times to death of all animals administered 630E, 630E A+B- and 630E A+B- CT was not 282
statistically significant (one-way ANOVA, p=0.8919). In contrast, the difference between the 283
630∆erm strain (and derivative) and the 630E strain (and derivatives) was statistically 284
significant (one-way ANOVA, p>0.0001). 285
286
Correction of SNPs in strain 630E 287
In view of the large number of SNPs present in strain 630E, it was impractical to change 288
them all back to the 630 parental sequence. We therefore selected just three specific 289
mutations present in 630E and converted them back to the sequence present in the parental 290
strain, 630. 291
Our principal target was to remove the stop codon from within the topoisomerase I gene, 292
CD630_12740, as this enzyme plays a central role in the regulation of DNA negative 293
supercoiling and its inactivation is likely to result in extensive pleiotropic effects. Indeed, in 294
some bacteria its inactivation is lethal. 25-27 Moreover, bacterial genes related to 295
pathogenesis and virulence have been shown to be sensitive to topA mutation in E. coli, 28 296
S. flexneri, 29 Yersinia enterocolitica 30 and Salmonella. 31 We therefore converted the “T” 297
nucleotide at position 1480649 in 630E back to an “A” nucleotide, thereby removing the 298
14
nonsense stop codon and allowing the production of full length native topoisomerase 299
enzyme. 300
As a second target we elected to correct the inversion of DNA upstream of the F3 flagella 301
operon. As strain 630E is non-motile, and as the inverted region encompasses the non-302
coding region immediately upstream of the flgB gene, it is likely to have disrupted the 303
promoter responsible for both flgB expression and the genes in the downstream operon. 304
The inversion is therefore likely to be the principal cause of the loss of motility in 630E. 305
Furthermore, factors affecting flagella expression can also influence toxin expression levels. 306
32, 33 307
Finally, we sought to correct the fusion of the two PTS components ptsG-B and ptsG-C, by 308
resurrection of the stop codon of ptsG-B through the conversion of the “C” nucleotide at 309
position 3079815 back to an “A” nucleotide. As glucose is known to affect toxin production, 310
through catabolite repression, 34, 35 it was reasoned that this particular SNP could be 311
affecting toxin expression, and therefore virulence. 312
The plasmids carrying the 630 wildtype alleles necessary for the correction of the three 313
targeted SNPs were assembled as described in Materials and Methods and then used to 314
effect the replacement of the 630E mutant alleles by allelic exchange. 15 To verify that the 315
mutant clones obtained were correct, each targeted region was amplified by PCR using 316
appropriate oligonucleotide primers and the DNA fragments obtained subjected to Sanger 317
sequencing on both DNA strands. In every case, clones carrying the desired ‘corrected’ 318
sequence were obtained. The new strains were named after the genes or regions that were 319
corrected, namely 630E_topA, 630E_CD2667 and 630E_flgB, respectively. 320
15
To assess the effects of the changes on the characteristics of the mutant strains, growth 321
rate, sporulation and germination, motility, and in vitro cytotoxicity and toxin production 322
(ELISA) were measured. None of the three corrected mutants exhibited any difference in 323
growth rate compared to the parental strain 630E (data not shown). Similarly, sporulation 324
and germination remained unaffected (data not shown). Toxicity testing revealed no 325
difference to 630E using the C. DIFFICILE TOX A/B II™ ELISA assay kit from TechLab (Fig. 4A). 326
To quantify toxin A and toxin B individually the ELISA kits from TGCbiomics were used to 327
assay 630E_topA and 630E_CD2667 (Fig. 4B). No differences were measured for toxin A, but 328
the strain 630E_topA showed significantly higher levels of toxin B than the parental strain 329
630E. 330
331
Transcriptomic comparison of 630, 630∆erm and 630E 332
RNA was extracted from strains 630, 630∆erm and 630E at 6, 14 and 24 h and used in 333
an RNAseq experiment as described in Materials and Methods. The Principal Component 334
Analysis (PCA) (Fig. 6) showed that strain 630∆erm and 630E are closely correlated on a 335
transcriptional level which is significantly separated from 630. While this result implies that 336
both strains are fundamentally different to the parental strain, it does not indicate that the 337
differences to 630 are the same for both strains. The analysis depicted by the Venn diagram 338
(Fig. 7) confirms the results of the PCA, showing that the majority of differentially expressed 339
genes are observed comparing 630∆erm and 630E to 630. From a total of 1337 differentially 340
expressed genes (Table S3 contains all the genes differentially expressed along the growth 341
and also comparisons between the strains), only 139 were common between all three 342

16
strains. A total of 345 were common between 630E and 630∆erm, 60 were common 343
between 630 and 630∆erm and 58 were common between 630 and 630E. 344
Most of the 345 genes differentially expressed in both, 630∆erm and 630E, were either 345
up or down-regulated in the same way highlighting again how distinct the two strains are 346
from the parental strain 630 (Table S3). In TY medium used for the transcriptomic 347
experiments, known as a non-optimal for spore production, a total of 44 sporulation genes 348
were differentially expressed in both 630∆erm and 630E, and all of these were 349
downregulated at 14 and 24 h compared to 6 h. No further differentially expressed 350
sporulation genes appeared in 630∆erm, however, our analysis showed a further 22 351
sporulation genes, of which 21 were downregulated, in 630E. Amongst these was the master 352
regulator of sporulation spo0A. Nine genes classed as stress-related are differentially 353
expressed in all three strains (five upregulated), with a further three in 630 (all upregulated), 354
seven in 630∆erm (four upregulated) and 16 in 630E (11 upregulated). Nine genes related to 355
secretion are down regulated in 630E and one gene related to type IV pili is upregulated. In 356
comparison only one secretion gene (putative pilus assembly ATPase) is differentially 357
expressed only in 630∆erm (down regulated) and none in 630. Metabolism is also highly 358
differentially regulated in the three strains. 90 genes were uniquely, differentially expressed 359
in 630E, 50 in 630∆erm and 30 in 630. In particular the amino acid metabolism stands out 360
for 630E with the majority of genes being downregulated. (Table S3). 361
RNAseq data can be used to independently corroborate genome re-sequencing data. 362
Thus, it was apparent that those changes identified by CLC Bio as being present with a 363
frequency of 70% or less, except for CD630_20102, were not real accordingly to the RNAseq 364
analysis (Table S1). This increases the confidence in disregarding changes identified by NGS 365

17
with a low frequency. In most cases, the SNPs and Indels identified by NGS were confirmed 366
by the RNAseq analysis, with the following exceptions: for SNPs in 630E we found two 367
disagreements notably in CD630_33790 and CD630_29430, which both had 100 % frequency 368
and a high coverage (around 200 reads) in the DNA sequence analysis, but only low coverage 369
in the RNAseq experiment. Due to the low coverage of these regions during the RNAseq 370
experiment, which is indicative of low or no expression under the examined conditions, a 371
sequencing error cannot be excluded. For the SNP in CD630_12740 the RNA coverage 372
corroborated the genomic data for 630E, but was in disagreement with the genomic data 373
for 630 and 630∆erm. For three SNPs in 630∆erm similar scenarios were observed. 374
CD630_19070 had very low RNA coverage, CD630_35650 showed ambiguous RNA data with 375
low coverage for 630E. CD630_08260, the perR homologue, had convincing DNA data, with 376
frequencies of 98-100 % and coverage of at least a 100 which was corroborated for 630∆erm 377
by RNAseq coverage. 378
In terms of actual expression data (Table S1), CD630_07610 (the RNA helicase), 379
CD630_14040 (oligopeptide transporter), CD630_20270 (hydrolase) and CD630_29430 380
(phage replication protein) all showed differential expression in 630E compared to the other 381
two strains, with the first two showing reduced expression and the latter two an increase. 382
CD630_29430, however, also showed an increase in expression in 630 at the later time point. 383
Changes in CD630_26670 in 630∆erm and 630E both seem to lead to severely reduced 384
expression. CD630_12740 (topA) only showed differential expression at 24 h in 630∆erm and 385
CD630_12140 (spo0A) expression was severely reduced in 630E. 386
387
Discussion 388
18
Previously, two studies 8,9 have attempted to use isogenic mutants defective in the 389
production of either toxin A or toxin B to determine the relative importance of these two 390
virulence factors in CDI using the hamster infection model. However, despite generating 391
essentially equivalent A+B-insertion mutants in ostensibly the same strain of C. difficile 392
(630), contradictory outcomes were obtained in terms of the importance of toxin A. Thus, a 393
tcdB mutant created in the one study 8 producing only TcdA did not cause disease in the 394
hamster, whereas the equivalent ClosTron mutant made in our laboratory (Minton group) 9 395
remained virulent. The work undertaken here has provided compelling evidence that the 396
reason for the observed conundrum resides in the use of two different erythromycin-397
sensitive derivatives of strain 630. 398
Here we have shown that both erythromycin-sensitive derivatives, 630E 14 and 630∆erm 399
13 carry a significant number of SNPs compared to the published sequence. Moreover, it is 400
clear that whilst the phenotypic properties of 630∆erm and its mutant derivatives closely 401
resemble that of the parent strain 630, strain 630E and its progeny exhibit substantive 402
differences. Thus, whereas latter strains exhibit reduced growth rates, are less proficient in 403
spore formation and are non-motile, 630∆erm strains mirror the behaviour of the 630 404
parental strain with respect to these phenotypes. Furthermore, 630E strains produce 405
reduced amounts of toxin and both struggle to colonise hamsters, and once colonised, 406
animals are less likely to succumb to disease. In short, 630E and its derivatives (i.e., 630E A-407
B+ and 630E A+B- CT) are less virulent than 630∆erm and its mutant counterparts (i.e., 408
630∆erm A+B-). 409
The altered properties of 630E and its derivatives are undoubtedly a consequence of 410
the observed SNPs. However, the substantive number of changes involved makes it difficult 411

19
to assign any particular SNP to a specific alteration in the observed phenotype, particularly 412
as a combination of mutagenic changes could be responsible. Whilst it is now possible to 413
make precise changes to the genome using allelic exchange methodologies 15 it is not 414
practically feasible to make all of the sequential rational changes needed to definitively 415
identify the mutation(s) responsible for a particular phenotype. As such, we only corrected 416
three specific SNPs that we reasoned may be making a significant contribution. The 417
outcomes of these experiments only emphasised the difficulty of such an undertaking, and 418
served to highlight the dangers involved in making assumptions. Thus, whilst it seemed 419
reasonable to assume that the DNA inversion within the promoter region of the flagella 420
operon was likely to have caused the observed non-motile phenotype, this surprisingly 421
proved not to be the case. Re-inversion of the 150 bp region failed to restore motility. Clearly 422
other SNPs are at least partly responsible for the observed lack of motility. Singling out any 423
other SNP as the culprit would in the absence of experimental evidence be 424
counterproductive. 425
Equally negative was the observed outcome of correcting the mutation in CD630_12740 426
that results in a truncation of the encoded topoisomerase I enzyme. Given this enzyme 427
controls DNA supercoiling, and given that its mutation in certain bacteria is either a lethal 428
event 25-27 and/or is involved in the regulation of virulence factors, 28-30 it seemed likely that 429
its presence would result in pleiotropic effects that could have contributed to the observed 430
phenotypic changes. However, its correction, with the exception of a measurable increase 431
in toxin B levels, seemingly had no effects on the behaviour of the strain, at least for those 432
properties measured. The reasons are not clear. In other bacteria, mutations of topA are 433
only isolated if compensatory mutations arise elsewhere in the genome. 26 Whether any of 434

20
the other SNPs present in 630E (eg., the RNA helicase mutation) are negating the effects of 435
the TopA truncation is currently unknown. 436
To understand the differences observed further, we analysed the transcriptome of 630, 437
630∆erm and 630E, comparing expression at 6 h to 14 h and to 24 h (Table S3). The data 438
corroborated the phenotypic analysis, showing vastly different transcriptomes for all three 439
strains. While 630E and 630∆erm cluster together in the PCA (Fig. 6), this only highlights how 440
different the two strains really are from the progenitor. The analysis clearly shows that the 441
three strains are very different from each other and also serves as an explanation as to why 442
the change of a single SNP could not restore any given phenotype. Overall 630E seems the 443
most divergent with many genes differentially expressed involved in metabolism and 444
regulation (Table S3). Additionally 32 genes grouped under the descriptor ‘cell factor’, many 445
of which play a role in energy metabolism, are differentially expressed in 630E, with only six 446
of these being upregulated. In contrast out of 19 genes in 630, 11 are upregulated and, out 447
of 10 in 630∆erm, six were upregulated. The number of genes downregulated in energy 448
metabolism in 630E might relate to the growth differences seen between the strains. 449
Interestingly 22 genes involved in sporulation are differentially expressed, 21 of these 450
downregulated, in 630E versus one in 630 and two in 630∆erm. This is consistent with the 451
observed delay in sporulation and reduced amount of spores produced by 630E. Secretion 452
also seems most affected in 630E, with 10 genes differentially expressed, compared to none 453
in 630 and one in 630∆erm. A general defect in secretion could affect the secretion of certain 454
virulence or adhesion factors. Furthermore, 33 cell wall genes are differentially expressed in 455
630E (compared to 14 each in 630∆erm and 630). This may also contribute to the observed 456
colonisation deficiencies. Mobile elements are, however, more differentially transcribed in 457

21
630 and 630∆erm (15 each) versus 630E (nine). As in many cases different pathways were 458
affected, we propose that this could at least in part explain the different adaptability and 459
virulence of the two strains. In both strains many regulators were differentially affected 460
providing a further basis for the observed phenotypic variation between strains. 461
462
Conclusion 463
Our study has established that the parental strains (630E and 630∆erm) used in the two 464
previous studies, that explored the relative roles of toxin A and toxin B in disease, 8, 9 are 465
phenotypically and genetically distinct. Here we also reveal that the three strains (630, 466
630∆erm and 630E) have vastly different transcriptomes, which no doubt lead to the 467
different phenotypes observed. This immense diversity also underlines our finding that by 468
restoring just one SNP, the entire transcriptome cannot be changed. The presence of SNPs 469
in strain 630E significantly affects its transcriptome which in turn has a significant impact on 470
growth, sporulation and finally virulence of this strain in the hamster model of infection 471
under the conditions tested. Data (such as motility, toxicity and virulence) obtained with 472
strain 630∆erm reflects more accurately the behaviour of the parent strain 630. As such, it 473
may be concluded that 630 producing toxin A alone will cause disease in the hamster. As a 474
consequence, toxin A should remain a target for the rational development of effective 475
countermeasures against C. difficile. 476
This study has also highlighted a number of issues that need to be borne in mind in the 477
future. At a specific level, if researchers wish to undertake genetic-based studies with strain 478
630, then the use of strain 630∆erm should be favoured over strain 630E. At a more 479
fundamental level, researchers need to effectively curate their strains to prevent the 480

22
inadvertent isolation of SNPs. Ideally, master seed banks need to be established as frozen 481
glycerol stocks. Moreover, the genome of the stored strain should be re-sequenced as part 482
of the storage process whenever a strain is received from external sources, regardless of 483
whether it has been re-sequenced in the sending laboratory. 484
485
Materials and Methods 486
Bacterial strains and routine culture conditions 487
Bacterial strains and plasmids used in this study are listed in Table 2. E. coli was cultured 488
aerobically at 37°C with shaking at 200 rpm in LB medium with chloramphenicol 489
supplementation (25 μg/ml) where appropriate. C. difficile was cultured in TY (tryptose 490
yeast) medium supplemented with thiamphenicol (15 μg/ml) where appropriate. When 491
needed, C. difficile strains were plated on BHIS agar (Brain Heart Infusion agar [Oxoid] 492
supplemented with 5 mg/ml yeast extract [Oxoid] and 0.1% [wt/vol] cysteine [Calbiochem]) 493
supplemented with d-cycloserine (250 μg/ml), cefoxitin (8 μg/ml) [Oxoid] (BHIScc). 494
Fluorocytosine selections were carried out on C. difficile minimal medium (CDMM) as 495
described previously. 15 All C. difficile cultures were incubated at 37°C anaerobically in an 496
anaerobic MACS1000 workstation (Don Whitley, Yorkshire, UK). 497
Mutant nomenclature 498
For the sake of simplicity, C. difficile strains that carried a tcdA insertional mutant were 499
referred to as A-, those carrying a tcdB mutant as B-, and those strains carrying a mutation 500
in both genes as A-B-. To avoid any ambiguity, if the gene was not inactivated it was referred 501
to as A+ or B+, as appropriate. Thus, a tcdA mutant of 630Δerm constructed using ClosTron 502
technology as described, 9, 16 was designated 630Δerm A-B+. The equivalent mutant in 630E 503
23
constructed through the insertion of a replication-deficient plasmid, according to the 504
method of O’Connor et al., 14 was designated 630E A-B+. When ClosTron technology was 505
used in 630E, this was clarified by adding a ‘CT’ suffix, 630E A-B+CT to the strain designation. 506
507
Whole genome sequencing and bioinformatics 508
Genomic DNA from strains 630E A+B-, 630E A+B-CT and 630Δerm A+B- was prepared by 509
phenol:chloroform extraction. 630E A+B-, 630E A+B-CT, 630Δerm(ΔpyrE) were sequenced 510
on Ilumina highseq (GATC, Germany) and 630Δerm A+B- on a Roche 454 (Deepseq, 511
Nottingham, UK) and the data compared to the published genome of 630 11,19 using CLC 512
genomic workbench. All raw sequencing data have been deposited in the sequence read 513
archive (SRA) under the study name PRJNA304508. The accession number is SRP066836. The 514
sequencing data for 630ΔermΔpyrE had been obtained previously 19 and with no additional 515
changes, other than the pyrE deletion, present compared to 630Δerm, were used to analyse 516
the parental strain 630Δerm. We used a frequency of 70% as a cut-off for SNP calling. SNPs, 517
InDels and inversions were confirmed by amplifying a few hundred base pairs up- and 518
downstream of the area of interest (primers are listed in Table S4) and the amplicon was 519
Sanger sequenced (Source BioScience, UK). This confirmation was done on all strains 520
including the parental strains (630, 630Δerm, 630E) and the derivatives (630Δerm A+B-, 630E 521
A+B-, 630E A+B-CT). 522
523
Correction of SNPs and reversal of 150-bp region within the flagellar operon 524
Using the method described by Cartman et al. 15 we “corrected” the two SNPs and an 525
inversion in 630E to the 630Δerm genotype. A stretch of DNA corresponding to 526

24
approximately 500 bp either side of the area to be altered was synthesised by Biomatik and 527
cloned into plasmid pMTL-SC7315λ2.3. This vector was transformed by electroporation into 528
E. coli CA434 cells 36 and subsequently conjugated into 630E. Single crossover colonies were 529
identified as those growing faster on plates containing thiamphenicol. Following overnight 530
incubation on CDMM containing 5-fluorocytosine, colonies were incubated on BHIScc plates 531
with and without thiamphenicol. Those strains that had lost the plasmid (both wildtype and 532
double crossover) were unable to grow on thiamphenicol. SNP corrections were confirmed 533
by PCR (Primers see Table S4) and Sanger sequencing (Source BioScience, UK). 534
535
ClosTron mutagenesis 536
A tcdB mutant was generated in the 630E background according to the published 537
method, 16 using the same plasmid that was used to generate the equivalent mutant in 538
630∆erm. 9 This newly created strain was referred to as 630E A+B- CT. 539
540
Southern and Western blot 541
The Southern and Western blot were performed as described in Kuehne et al., 2010. 9 542
543
In vivo testing of mutants 544
In vivo testing was carried out in Syrian Golden hamsters (Charles River, Germany) as 545
previously described. 9 Briefly, clindamycin was administered orally on day -five to render 546
the animals susceptible to infection. On day zero, 10,000 spores were administered orally. 547
Animals were assessed for signs of CDI (weight loss, wet tail, lethargy, lack of response to 548
stimulus) six times a day for the first five days, and once daily for the following 14 days. At 549

25
this point animals that failed to display signs of CDI were euthanised. Faecal pellets were 550
collected daily from day zero to endpoint, homogenised and plated on C. difficile fructose 551
agar (CDFA). C. difficile colonies were sub-cultured onto BHIS agar and the genotype was 552
established by PCR (primers in Table S4) followed by Sanger sequencing (results in Table S2). 553
At the experimental endpoint, part of the caecum of each animal was collected. This was 554
also used to plate on CDFA to verify colonisation. 555
556
In vitro testing of mutants 557
Growth curves: To assess the effects of SNPs and “corrected” SNPs/inversion on the growth 558
characteristics of all strains, we performed growth curve experiments over 24 h. A 180 μL 559
volume of TY medium was inoculated with 20 μL of an overnight culture in 96-well plates 560
and incubated for 24 h in a GloMax-Multi Microplate Multimode Reader (Promega, USA). 561
Samples were shaken every h and OD600 measurements were taken immediately after. 562
Motility assays: 2xYTG (tryptone (1.6%), yeast (1%), NaCl (0.4%), Gelzan (0.24%)[Sigma-563
Aldrich] and glucose (0.5%)) agar was utilised. 25 mL were poured into each petri dish and 564
let to solidify at room temperature for 15 min. The plates were then dried at 37°C for 30 565
min. The plates were placed into the anaerobic cabinet 24 h before use. 2 μL volumes of 566
overnight culture were ‘dropped’ onto each plate. Plates were incubated anaerobically for 567
48 h. Motility was assessed by eye and the plates photographed. 568
Sporulation and germination assays: Sporulation and germination assays were carried out 569
as previously described. 17, 18 Briefly, for the sporulation assay cultures were grown for five 570
days, with 2 X 500 µl samples taken at 0, 24, 48, 72, 96 and 120 h. One sample from each 571
time point was heated to 65°C for 30 min while the other sample was kept at room 572

26
temperature. After this time, samples were serially diluted from 100 to 10-7 in PBS. 3 X 20µl 573
of each dilution was spotted onto BHIS plates containing 0.1% taurocholic acid and were 574
incubated for 24 h. The following day, colonies were counted and CFU/mL were calculated. 575
A 630∆erm spo0A::CT mutant strain (containing a ClosTron insertion in the spo0A gene 37), 576
which is unable to form spores, was used as a negative control. 577
Germination was measured as a function of the ability of a germinated spore to outgrow 578
in the absence of taurocholate. Spore stocks were prepared as previously described by Heeg 579
et al., 2012 38 and stored at -20°C. The optical density of spore suspensions (OD600) was 580
adjusted to 1.0 and 450 µl was used per measurement. This equated to approximately 2.5 X 581
107 spores. Spore suspensions were heat treated at 60°C for 25 min to kill any remaining 582
vegetative cells and then centrifuged and resuspended in BHIS with the germinant 583
taurocholic acid (0.1%) in a total volume of 20 ml. Samples were taken at 5, 10, 20, 30, 60, 584
90, 120, 180 and 240 min, briefly centrifuged, washed and resuspended in phosphate-585
buffered saline (PBS), the samples were then diluted and plated on plain BHIS agar. Plates 586
were incubated for 24 h before the CFUs were enumerated. Colonies that grew on these 587
plates were considered to be germinated vegetative bacteria. 588
589
Toxin A/B ELISA: ELISA assays were performed using the C. DIFFICILE TOX A/B II™ kit from 590
TechLab and the TGC-E002-1-separate detection of C. difficile toxins A and B kit from 591
TGCbiomics according to the manufacturers’ instructions. Cultures of C. difficile were grown 592
in TY medium without glucose for 72 h, at which time 1 ml samples were taken, centrifuged 593
and the supernatant filter-sterilised and used for the ELISAs. A 1:2 dilution was used for the 594
toxin B ELISA kit from TGCbiomics. To quantify toxins a standard curve with pure toxin (the 595
27
native antigen company) was established for the TechLab ELISA and also Toxin A ELISA from 596
TGCbiomics. 597
598
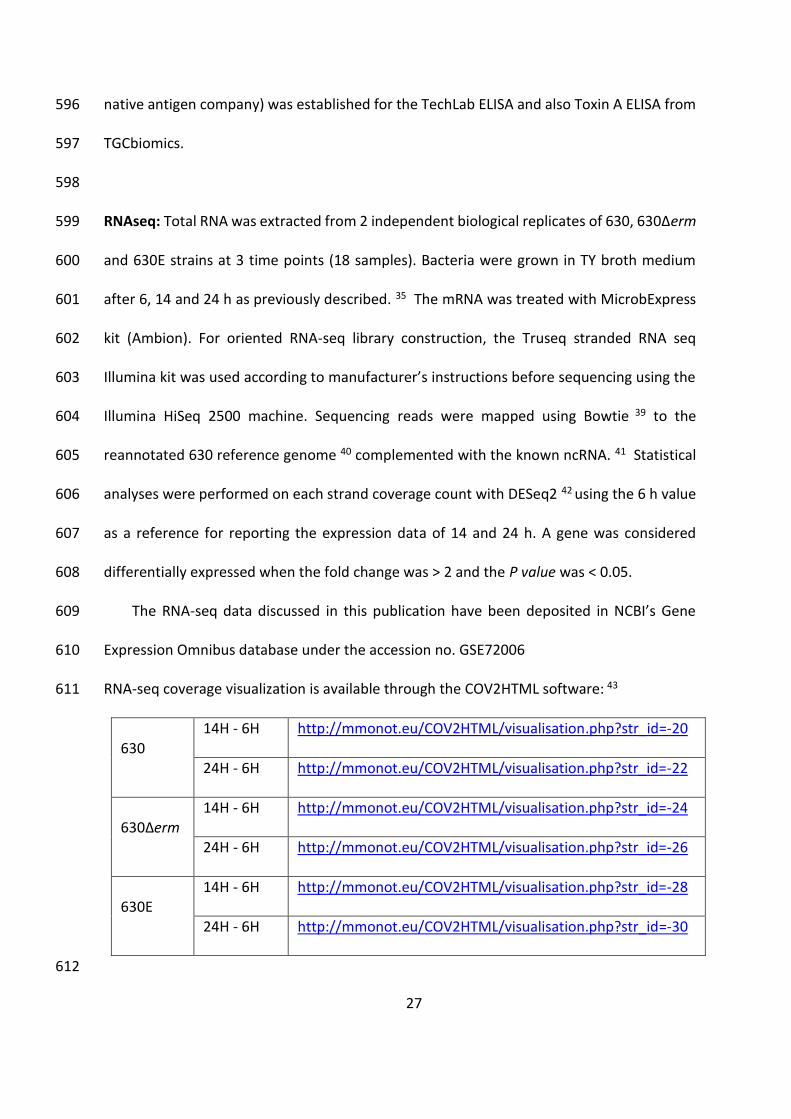
RNAseq: Total RNA was extracted from 2 independent biological replicates of 630, 630∆erm 599
and 630E strains at 3 time points (18 samples). Bacteria were grown in TY broth medium 600
after 6, 14 and 24 h as previously described. 35 The mRNA was treated with MicrobExpress 601
kit (Ambion). For oriented RNA-seq library construction, the Truseq stranded RNA seq 602
Illumina kit was used according to manufacturer’s instructions before sequencing using the 603
Illumina HiSeq 2500 machine. Sequencing reads were mapped using Bowtie 39 to the 604
reannotated 630 reference genome 40 complemented with the known ncRNA. 41 Statistical 605
analyses were performed on each strand coverage count with DESeq2 42 using the 6 h value 606
as a reference for reporting the expression data of 14 and 24 h. A gene was considered 607
differentially expressed when the fold change was > 2 and the P value was < 0.05. 608
The RNA-seq data discussed in this publication have been deposited in NCBI’s Gene 609
Expression Omnibus database under the accession no. GSE72006 610
RNA-seq coverage visualization is available through the COV2HTML software: 43 611
630 14H - 6H http://mmonot.eu/COV2HTML/visualisation.php?str_id=-20
24H - 6H http://mmonot.eu/COV2HTML/visualisation.php?str_id=-22
630∆erm 14H - 6H http://mmonot.eu/COV2HTML/visualisation.php?str_id=-24
24H - 6H http://mmonot.eu/COV2HTML/visualisation.php?str_id=-26
630E 14H - 6H http://mmonot.eu/COV2HTML/visualisation.php?str_id=-28
24H - 6H http://mmonot.eu/COV2HTML/visualisation.php?str_id=-30
612

28
Graphs and statistical analyses 613
All graphs were generated and statistical analyses were performed using GraphPad 614
PRISM 6.02. Statistical analysis comprised either 2-way ANOVA for multiple comparisons or 615
unpaired t test for pairwise comparisons. All experiments were carried out in triplicate 616
unless stated otherwise. 617
618
Ethics statement 619
This work was reviewed and approved locally by the Animal Welfare and Ethical Review 620
Body (formerly the Ethical Review Committee) at the University of Nottingham and 621
performed under a project licence (PPL 40/3590) granted under the Animal (Scientific 622
Procedures) Act, 1986, by the UK Home Office. The work was performed in accordance with 623
the NC3Rs ARRIVE guidelines. 44 624
625
Acknowledgement 626
We would like to thank Haitham Hussain for providing C. difficile 630Δerm, Dena Lyras for 627
providing C. difficile 630E and toxin mutants and Rory Cave for helping with PCRs and Sanger 628
sequencing. We would also like to acknowledge Sean Roberts who was involved in creating 629
the 630E A+B- CT strain. This work was supported by the UK Medical Research Council (grant 630
number G0601176) and a Merck Investigator Studies Program award (grant number 631
MISP#39245). The opinions expressed in this paper are those of the authors and do not 632
necessarily represent those of Merck Sharp & Dohme Limited or the Medical Research 633
Council (UK). 634
635
References 636
1. Govind R, Dupuy B. Secretion of Clostridium difficile toxins A and B requires the holin-637 like protein TcdE. PLoS Pathogens 2012; 8:e1002727. 638
29
2. Jank T, Giesemann T, Aktories K. Rho-glucosylating Clostridium difficile toxins A and 639 B: new insights into structure and function. Glycobiology 2007; 17:15R-22R. 640 3. Sun X, Savidge T, Feng H. The enterotoxicity of Clostridium difficile toxins. Toxins 641 (Basel) 2010; 2:1848-80. 642 4. Lyerly DM, Krivan HC, Wilkins TD. Clostridium difficile: its disease and toxins. Clinical 643 Microbiology Reviews 1988; 1:1-18. 644 5. Lyerly DM, Barroso LA, Wilkins TD, Depitre C, Corthier G. Characterization of a toxin 645 A-negative, toxin B-positive strain of Clostridium difficile. Infection Immunity 1992; 60:4633-646 9. 647 6. Kim J, Pai H, Seo MR, Kang JO. Clinical and microbiologic characteristics of tcdA-648 negative variant Clostridium difficile infections. BMC Infectious Diseases 2012; 12:109. 649 7. Chaves-Olarte E, Low P, Freer E, Norlin T, Weidmann M, von Eichel-Streiber C, 650 Thelestam M. A novel cytotoxin from Clostridium difficile serogroup F is a functional hybrid 651 between two other large clostridial cytotoxins. Journal of Biological Chemistry 1999; 652 274:11046-52. 653 8. Lyras D, O'Connor JR, Howarth PM, Sambol SP, Carter GP, Phumoonna T, Poon R, 654 Adams V, Vedantam G, Johnson S, et al. Toxin B is essential for virulence of Clostridium 655 difficile. Nature 2009; 458:1176-9. 656 9. Kuehne SA, Cartman ST, Heap JT, Kelly ML, Cockayne A, Minton NP. The role of toxin 657 A and toxin B in Clostridium difficile infection. Nature 2010; 467:711-3. 658 10. Monot M, Eckert C, Lemire A, Hamiot A, Dubois T, Tessier C, Dumoulard B, Hamel B, 659 Petit A, Lalande V, et al. Clostridium difficile: New Insights into the Evolution of the 660 Pathogenicity Locus. Science Reports 2015; 5:15023. 661 11. Kuehne SA, Cartman ST, Minton NP. Both, toxin A and toxin B, are important in 662 Clostridium difficile infection. Gut Microbes 2011; 2:252-5. 663 12. Sebaihia M, Wren BW, Mullany P, Fairweather NF, Minton N, Stabler R, Thomson NR, 664 Roberts AP, Cerdeno-Tarraga AM, Wang H, et al. The multidrug-resistant human pathogen 665 Clostridium difficile has a highly mobile, mosaic genome. Nature Genetics 2006; 38:779-86. 666 13. Hussain HA, Roberts AP, Mullany P. Generation of an erythromycin-sensitive 667 derivative of Clostridium difficile strain 630 (630Deltaerm) and demonstration that the 668 conjugative transposon Tn916DeltaE enters the genome of this strain at multiple sites. 669 Journal of Medical Microbiology 2005; 54:137-41. 670 14. O'Connor JR, Lyras D, Farrow KA, Adams V, Powell DR, Hinds J, Cheung JK, Rood JI. 671 Construction and analysis of chromosomal Clostridium difficile mutants. Molecular 672 Microbiology 2006; 61:1335-51. 673 15. Cartman ST, Kelly ML, Heeg D, Heap JT, Minton NP. Precise manipulation of the 674 Clostridium difficile chromosome reveals a lack of association between the tcdC genotype 675 and toxin production. Applied and Environmental Microbiology 2012; 78:4683-90. 676 16. Heap JT, Kuehne SA, Ehsaan M, Cartman ST, Cooksley CM, Scott JC, Minton NP. The 677 ClosTron: Mutagenesis in Clostridium refined and streamlined. Journal of Microbiological 678 Methods 2010; 80:49-55. 679 17. Burns DA, Heap JT, Minton NP. SleC is essential for germination of Clostridium difficile 680 spores in nutrient-rich medium supplemented with the bile salt taurocholate. Journal of 681 Bacteriology 2010; 192:657-64. 682 18. Burns DA, Heeg D, Cartman ST, Minton NP. Reconsidering the sporulation 683 characteristics of hypervirulent Clostridium difficile BI/NAP1/027. PLoS One 2011; 6:e24894. 684

30
19. Ng YK, Ehsaan M, Philip S, Collery MM, Janoir C, Collignon A, Cartman ST, Minton NP. 685 Expanding the repertoire of gene tools for precise manipulation of the Clostridium difficile 686 genome: allelic exchange using pyrE alleles. PLoS One 2013; 8:e56051. 687 20. Langmead B, Salzberg SL. Fast gapped-read alignment with Bowtie 2. Nature 688 Methods 2012; 9:357-9. 689 21. Milne I, Stephen G, Bayer M, Cock PJ, Pritchard L, Cardle L, Shaw PD, Marshall D. 690 Using Tablet for visual exploration of second-generation sequencing data. Brief Bioinform 691 2013; 14:193-202. 692 22. Riedel T, Bunk B, Thurmer A, Sproer C, Brzuszkiewicz E, Abt B, Gronow S, Liesegang 693 H, Daniel R, Overmann J. Genome Resequencing of the Virulent and Multidrug-Resistant 694 Reference Strain Clostridium difficile 630. Genome Announcements 2015; 3. 695 23. van Eijk E, Anvar SY, Browne HP, Leung WY, Frank J, Schmitz AM, Roberts AP, Smits 696 WK. Complete genome sequence of the Clostridium difficile laboratory strain 630Deltaerm 697 reveals differences from strain 630, including translocation of the mobile element CTn5. 698 BMC Genomics 2015; 16:31. 699 24. Rosenbusch KE, Bakker D, Kuijper EJ, Smits WK. C. difficile 630Deltaerm Spo0A 700 regulates sporulation, but does not contribute to toxin production, by direct high-affinity 701 binding to target DNA. PLoS One 2012; 7:e48608. 702 25. Ahmed W, Menon S, Godbole AA, Karthik PV, Nagaraja V. Conditional silencing of 703 topoisomerase I gene of Mycobacterium tuberculosis validates its essentiality for cell 704 survival. FEMS Microbiology Letters 2014; 353:116-23. 705 26. Stupina VA, Wang JC. Viability of Escherichia coli topA mutants lacking DNA 706 topoisomerase I. The Journal of Biological Chemistry 2005; 280:355-60. 707 27. Suerbaum S, Brauer-Steppkes T, Labigne A, Cameron B, Drlica K. Topoisomerase I of 708 Helicobacter pylori: juxtaposition with a flagellin gene (flaB) and functional requirement of 709 a fourth zinc finger motif. Gene 1998; 210:151-61. 710 28. Tessier MC, Graveline R, Crost C, Desabrais JA, Martin C, Drolet M, Harel J. Effects of 711 DNA supercoiling and topoisomerases on the expression of genes coding for F165(1), a P-712 like fimbriae. FEMS Microbiology Letters 2007; 277:28-36. 713 29. Ni Bhriain N, Dorman CJ. Isolation and characterization of a topA mutant of Shigella 714 flexneri. Molecular Microbiology 1993; 7:351-8. 715 30. Darwin AJ, Miller VL. Identification of Yersinia enterocolitica genes affecting survival 716 in an animal host using signature-tagged transposon mutagenesis. Molecular Microbiology 717 1999; 32:51-62. 718 31. Galan JE, Curtiss R, 3rd. Expression of Salmonella typhimurium genes required for 719 invasion is regulated by changes in DNA supercoiling. Infection and Immunity 1990; 58:1879-720 85. 721 32. Aubry A, Hussack G, Chen W, KuoLee R, Twine SM, Fulton KM, Foote S, Carrillo CD, 722 Tanha J, Logan SM. Modulation of toxin production by the flagellar regulon in Clostridium 723 difficile. Infection and Immunity 2012. 724 33. Baban ST, Kuehne SA, Barketi-Klai A, Cartman ST, Kelly ML, Hardie KR, Kansau I, 725 Collignon A, Minton NP. The Role of Flagella in Clostridium difficile Pathogenesis: 726 Comparison between a Non-Epidemic and an Epidemic Strain. PLoS One 2013; 8:e73026. 727 34. Antunes A, Martin-Verstraete I, Dupuy B. CcpA-mediated repression of Clostridium 728 difficile toxin gene expression. Molecular Microbiology 2011; 79:882-99. 729
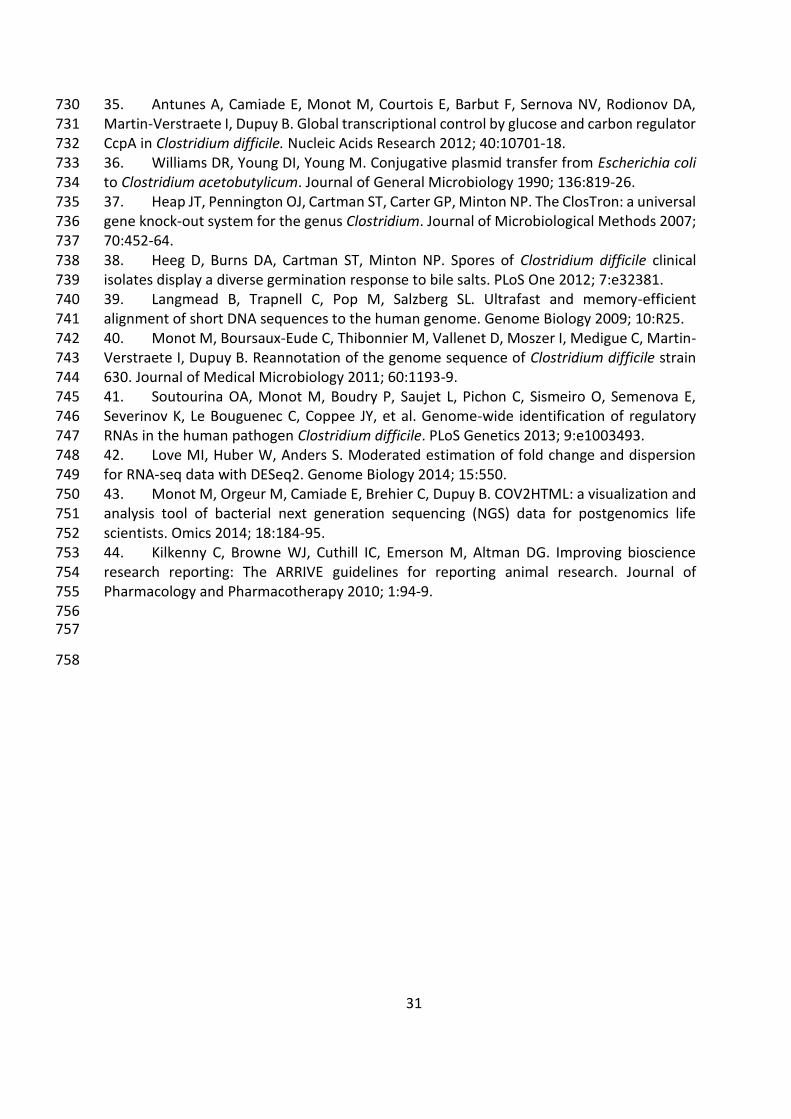
31
35. Antunes A, Camiade E, Monot M, Courtois E, Barbut F, Sernova NV, Rodionov DA, 730 Martin-Verstraete I, Dupuy B. Global transcriptional control by glucose and carbon regulator 731 CcpA in Clostridium difficile. Nucleic Acids Research 2012; 40:10701-18. 732 36. Williams DR, Young DI, Young M. Conjugative plasmid transfer from Escherichia coli 733 to Clostridium acetobutylicum. Journal of General Microbiology 1990; 136:819-26. 734 37. Heap JT, Pennington OJ, Cartman ST, Carter GP, Minton NP. The ClosTron: a universal 735 gene knock-out system for the genus Clostridium. Journal of Microbiological Methods 2007; 736 70:452-64. 737 38. Heeg D, Burns DA, Cartman ST, Minton NP. Spores of Clostridium difficile clinical 738 isolates display a diverse germination response to bile salts. PLoS One 2012; 7:e32381. 739 39. Langmead B, Trapnell C, Pop M, Salzberg SL. Ultrafast and memory-efficient 740 alignment of short DNA sequences to the human genome. Genome Biology 2009; 10:R25. 741 40. Monot M, Boursaux-Eude C, Thibonnier M, Vallenet D, Moszer I, Medigue C, Martin-742 Verstraete I, Dupuy B. Reannotation of the genome sequence of Clostridium difficile strain 743 630. Journal of Medical Microbiology 2011; 60:1193-9. 744 41. Soutourina OA, Monot M, Boudry P, Saujet L, Pichon C, Sismeiro O, Semenova E, 745 Severinov K, Le Bouguenec C, Coppee JY, et al. Genome-wide identification of regulatory 746 RNAs in the human pathogen Clostridium difficile. PLoS Genetics 2013; 9:e1003493. 747 42. Love MI, Huber W, Anders S. Moderated estimation of fold change and dispersion 748 for RNA-seq data with DESeq2. Genome Biology 2014; 15:550. 749 43. Monot M, Orgeur M, Camiade E, Brehier C, Dupuy B. COV2HTML: a visualization and 750 analysis tool of bacterial next generation sequencing (NGS) data for postgenomics life 751 scientists. Omics 2014; 18:184-95. 752 44. Kilkenny C, Browne WJ, Cuthill IC, Emerson M, Altman DG. Improving bioscience 753 research reporting: The ARRIVE guidelines for reporting animal research. Journal of 754 Pharmacology and Pharmacotherapy 2010; 1:94-9. 755
756 757
758

32
Figure legends 759
760
Figure 1. Growth curves of strain 630 and its derivatives. A. 630 (630), 630Δerm and 630E were 761
grown in TY-broth for 24 h in a 96 well plate reader. The optical density at 600 nm was measured 762
every 30 min. B. This graph shows the same growth as A. and in addition the growth of derivatives 763
630Δerm A+B-, 630E A+B- and 630E A+B- CT. 764
765
Figure 2. Motility assays. The assay was carried out by inoculating overnight cultures onto motility 766
agar plates and incubating anaerobically for 48 h. Strains 630, 630∆erm and 630E were compared for 767
their ability to swarm. 768
769
Figure 3. Sporulation and Germination. A. Sporulation over 120 h comparing heat treated CFUs of 770
strains 630, 630∆erm, 630∆erm A+B-, 630E, 630E A+B- and 630E A+B- CT with a non-sporulating 771
control (spo0A). B. The extent of germination of the indicated strains was measured over 250 min as 772
the ability of germinated spores to form colonies on plates lacking taurocholate. 773
774
Figure 4. Toxin ELISAs. A. The C. DIFFICILE TOX A/B II™ ELISA assay kit from TechLab was used to 775
measure combined toxin A and B in strains 630, 630∆erm, 630∆erm A+B-, 630E, 630E A+B-, 630E 776
A+B- CT, 630E_topA, 630E_flgB and 630E_CD2667 grown in TY for 72 h. B. and C. Toxin ELISAs 777
TGCbiomics, measuring the toxins separately were used to quantify toxin A (B) and toxin B (C) 778
produced by strains 630, 630∆erm, 630∆erm A+B-, 630E, 630E A+B- and 630E A+B- CT grown in TY 779
for 72 h. Statistics were performed using one-way ANOVA with Fisher’s LSD test. 780
781
Figure 5. Infection to endpoint in the Hamster infection model. Groups of Golden Syrian Hamsters 782
were challenged with C. difficile 630E (5 hamsters), 630E A+B- (11 hamsters) and 630E A+B- CT (6 783
hamsters). The graph represents the time from inoculation to endpoint. The maximal duration of the 784
experiment was set to 20 days. Animals represented in open symbols, have not been colonized 785
despite challenge or lost colonization before day 20. Details can be seen in Table 1. The dotted line 786
separates this experiment from data obtained by Kuehne et al. 9, which are represented here as a 787
comparator. In that study 8 hamsters were infected with C. difficile 630Δerm and another 8 hamsters 788
with 630Δerm A+B-. 789
790

33
Figure 6. Principal Component Analysis (PCA). The Principal Component Analysis (PCA) visualizes the 791
variance of the data in a single graph. The axis represent the two largest variances of the data; PC1 792
accounts for 42% and PC2 accounts for 21%, that means that 63% of the total variance of the dataset 793
is explained in this graph. The third component accounts for less than 10% and further components 794
have a value that falls rapidly. The PCA represents the RNAseq data (at three different time points, 795
six, 14 and 24 h) in duplicate for 630 (blue), 630Δerm (green) and 630E (orange). The different time 796
points are represented as dots in the different shades of the respective colour as indicated in the 797
colour legend. 798
799
Figure 7. Venn Diagram representing differentially expressed genes in the three different strains. The 800
diagram summarises the output from the RNAseq data, comparing strains 630, 630Δerm and 630E. 801
It depicts all differentially expressed genes and shows how many genes are differentially expressed 802
in all strains, in two of the strains or are unique to just one strain. 803
804
34
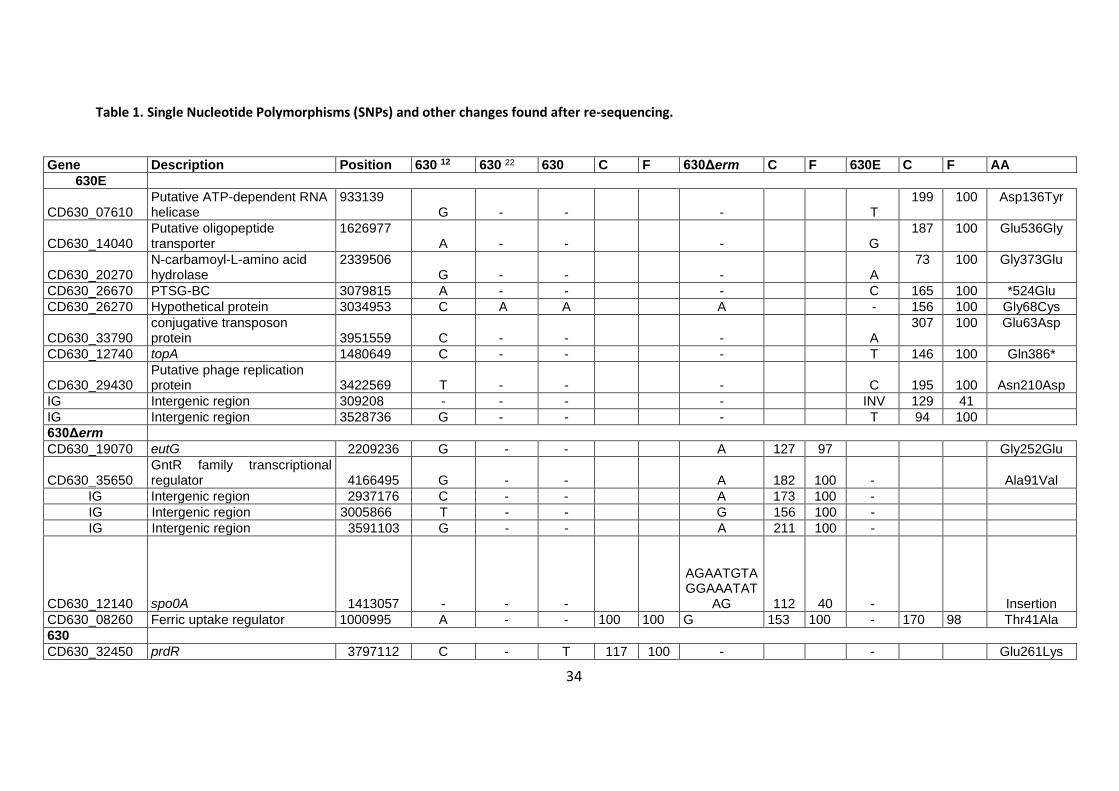
Table 1. Single Nucleotide Polymorphisms (SNPs) and other changes found after re-sequencing.
Gene Description Position 630 12 630 22 630 C F 630Δerm C F 630E C F AA
630E
CD630_07610 Putative ATP-dependent RNA helicase
933139 G - -
-
T
199 100 Asp136Tyr
CD630_14040 Putative oligopeptide transporter
1626977 A - -
-
G
187 100 Glu536Gly
CD630_20270 N-carbamoyl-L-amino acid hydrolase
2339506 G - -
-
A
73 100 Gly373Glu
CD630_26670 PTSG-BC 3079815 A - - - C 165 100 *524Glu
CD630_26270 Hypothetical protein 3034953 C A A A - 156 100 Gly68Cys
CD630_33790 conjugative transposon protein
3951559 C - -
-
A
307 100 Glu63Asp
CD630_12740 topA 1480649 C - - - T 146 100 Gln386*
CD630_29430 Putative phage replication protein
3422569 T - -
-
C
195
100 Asn210Asp
IG Intergenic region 309208 - - - - INV 129 41
IG Intergenic region 3528736 G - - - T 94 100
630Δerm
CD630_19070 eutG 2209236 G - - A 127 97 Gly252Glu
CD630_35650 GntR family transcriptional regulator 4166495 G - - A 182 100 - Ala91Val
IG Intergenic region 2937176 C - - A 173 100 -
IG Intergenic region 3005866 T - - G 156 100 -
IG Intergenic region 3591103 G - - A 211 100 -
CD630_12140 spo0A 1413057 - - -
AGAATGTAGGAAATAT
AG 112 40 - Insertion
CD630_08260 Ferric uptake regulator 1000995 A - - 100 100 G 153 100 - 170 98 Thr41Ala
630
CD630_32450 prdR 3797112 C - T 117 100 - - Glu261Lys

35
CD630_02050 Transcription antiterminator, PTS operon regulator
268934 G - T
123
97 - - Gly165Cys
630 and 630Δerm
CD630_2667 PTSG-BC 3080703 C - T 75 100 T 141 100 - Val228Ile
IG Intergenic region 2203033 A - T 105 100 T 174 99
IG Intergenic region 4007463 C 10 100 C 62 100
630 and 630Δerm and 630E
CD630_11900 acyl-CoA N-acyltransferase 1391850 T - C 118 100 C 133 100 C 143 100 Phe133Leu
CD630_13880 pseudo 1607453 INS 1 - T 119 94 T 175 94 T 124 88 Thr16fs
Mistake in original sequence
CD630_17670 gapB 2044514 C G G G G
CD630_31561 pseudo 3686535 INS 1 A A A A
The table shows the Single Nucleotide Polymorphism (SNP) changes in 630∆erm and 630E compared to the reference 630 12 and also the new annotation by
Riedel et al (The column ‘Gene’ represents the gene (or intergenic region (IG)) in which the change occurs, the column ‘position’ indicates the exact nucleotide
position of the change.). 22 It also contains SNP frequency (F) and genomic coverage (C) as well as the resultant amino acid change (AA). No change from the
original 630 annotation 12 is represented by a dash (-).
36
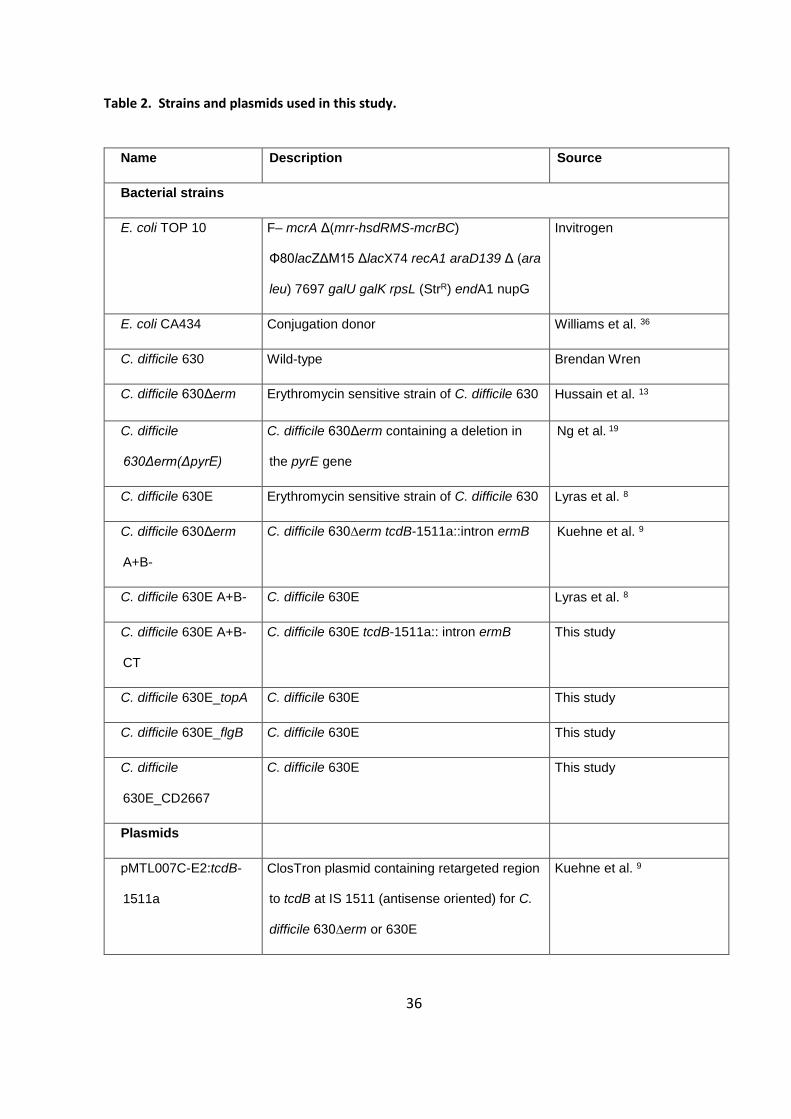
Table 2. Strains and plasmids used in this study.
Name Description Source
Bacterial strains
E. coli TOP 10 F– mcrA Δ(mrr-hsdRMS-mcrBC)
Φ80lacZΔM15 ΔlacX74 recA1 araD139 Δ (ara
leu) 7697 galU galK rpsL (StrR) endA1 nupG
Invitrogen
E. coli CA434 Conjugation donor Williams et al. 36
C. difficile 630 Wild-type Brendan Wren
C. difficile 630Δerm Erythromycin sensitive strain of C. difficile 630 Hussain et al. 13
C. difficile
630Δerm(ΔpyrE)
C. difficile 630Δerm containing a deletion in
the pyrE gene
Ng et al. 19
C. difficile 630E Erythromycin sensitive strain of C. difficile 630 Lyras et al. 8
C. difficile 630Δerm
A+B-
C. difficile 630∆erm tcdB-1511a::intron ermB Kuehne et al. 9
C. difficile 630E A+B- C. difficile 630E Lyras et al. 8
C. difficile 630E A+B-
CT
C. difficile 630E tcdB-1511a:: intron ermB This study
C. difficile 630E_topA C. difficile 630E This study
C. difficile 630E_flgB C. difficile 630E This study
C. difficile
630E_CD2667
C. difficile 630E This study
Plasmids
pMTL007C-E2:tcdB-
1511a
ClosTron plasmid containing retargeted region
to tcdB at IS 1511 (antisense oriented) for C.
difficile 630∆erm or 630E
Kuehne et al. 9

37
pMTL-
SC7315λ2.3::topA
pMTL-SC7315λ2.3 containing 1,000 bp
homology arms to change nucleotide 1480649
from T to C in 630E
This study, based on
Cartman et al. 15
pMTL-
SC7315λ2.3::flgB
pMTL-SC7315λ2.3 containing 1,156 bp
homology arms to reverse the inversion
upstream of flgB in 630E
This study, based on
Cartman et al. 15
pMTL-
SC7315λ2.3::CD2667
pMTL-SC7315λ2.3 containing 1,000 bp
homology arms to change nucleotide 3079815
from C to A in 630E
This study, based on
Cartman et al. 15
38
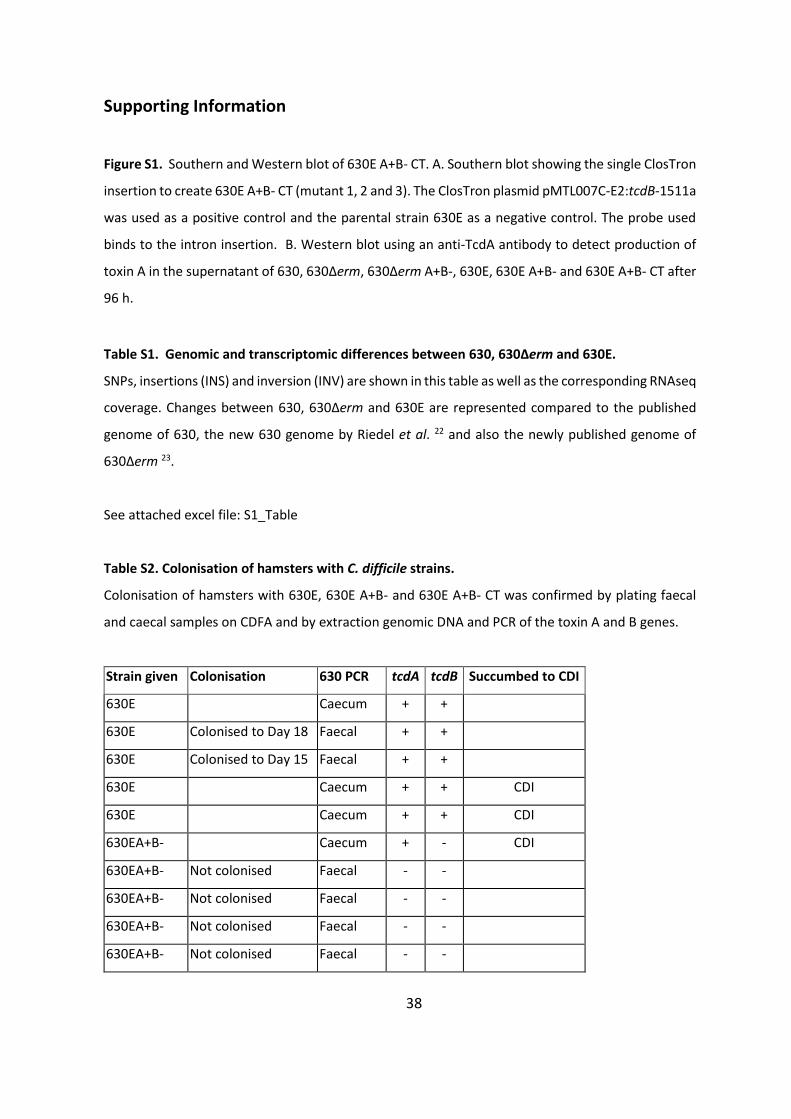
Supporting Information
Figure S1. Southern and Western blot of 630E A+B- CT. A. Southern blot showing the single ClosTron
insertion to create 630E A+B- CT (mutant 1, 2 and 3). The ClosTron plasmid pMTL007C-E2:tcdB-1511a
was used as a positive control and the parental strain 630E as a negative control. The probe used
binds to the intron insertion. B. Western blot using an anti-TcdA antibody to detect production of
toxin A in the supernatant of 630, 630Δerm, 630Δerm A+B-, 630E, 630E A+B- and 630E A+B- CT after
96 h.
Table S1. Genomic and transcriptomic differences between 630, 630Δerm and 630E.
SNPs, insertions (INS) and inversion (INV) are shown in this table as well as the corresponding RNAseq
coverage. Changes between 630, 630Δerm and 630E are represented compared to the published
genome of 630, the new 630 genome by Riedel et al. 22 and also the newly published genome of
630Δerm 23.
See attached excel file: S1_Table
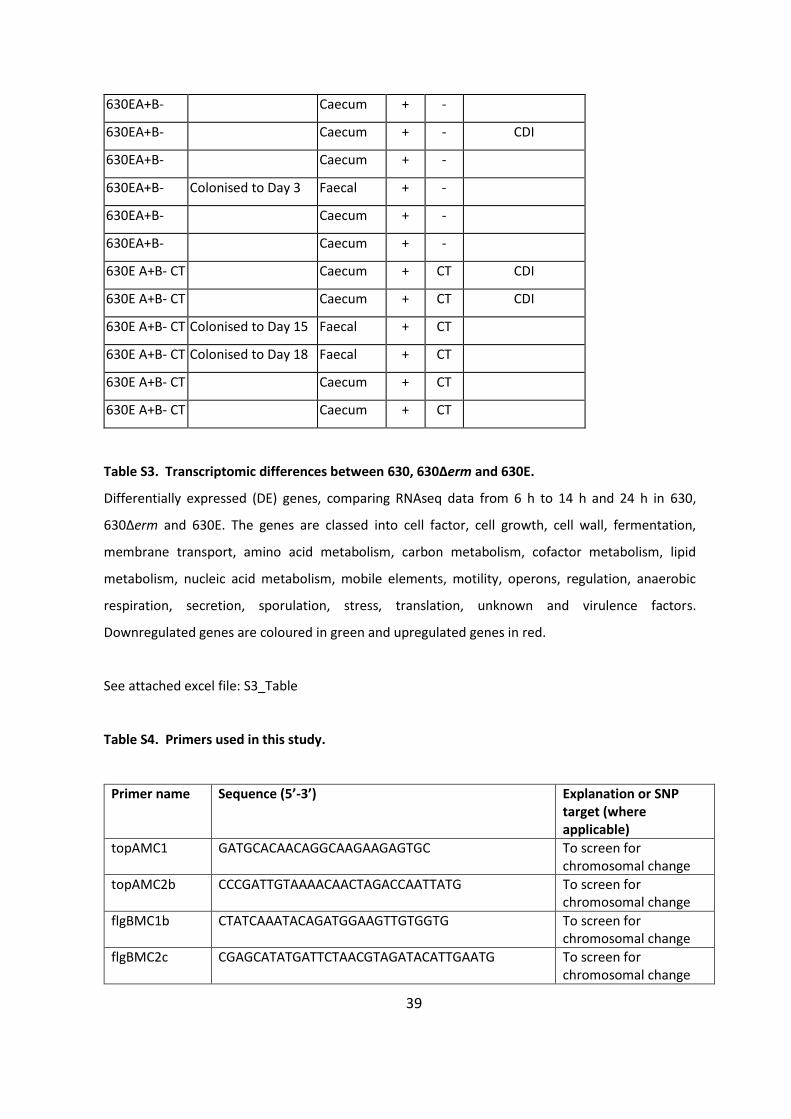
Table S2. Colonisation of hamsters with C. difficile strains.
Colonisation of hamsters with 630E, 630E A+B- and 630E A+B- CT was confirmed by plating faecal
and caecal samples on CDFA and by extraction genomic DNA and PCR of the toxin A and B genes.
Strain given Colonisation 630 PCR tcdA tcdB Succumbed to CDI
630E Caecum + +
630E Colonised to Day 18 Faecal + +
630E Colonised to Day 15 Faecal + +
630E Caecum + + CDI
630E Caecum + + CDI
630EA+B- Caecum + - CDI
630EA+B- Not colonised Faecal - -
630EA+B- Not colonised Faecal - -
630EA+B- Not colonised Faecal - -
630EA+B- Not colonised Faecal - -
39
630EA+B- Caecum + -
630EA+B- Caecum + - CDI
630EA+B- Caecum + -
630EA+B- Colonised to Day 3 Faecal + -
630EA+B- Caecum + -
630EA+B- Caecum + -
630E A+B- CT Caecum + CT CDI
630E A+B- CT Caecum + CT CDI
630E A+B- CT Colonised to Day 15 Faecal + CT
630E A+B- CT Colonised to Day 18 Faecal + CT
630E A+B- CT Caecum + CT
630E A+B- CT Caecum + CT
Table S3. Transcriptomic differences between 630, 630Δerm and 630E.
Differentially expressed (DE) genes, comparing RNAseq data from 6 h to 14 h and 24 h in 630,
630Δerm and 630E. The genes are classed into cell factor, cell growth, cell wall, fermentation,
membrane transport, amino acid metabolism, carbon metabolism, cofactor metabolism, lipid
metabolism, nucleic acid metabolism, mobile elements, motility, operons, regulation, anaerobic
respiration, secretion, sporulation, stress, translation, unknown and virulence factors.
Downregulated genes are coloured in green and upregulated genes in red.
See attached excel file: S3_Table
Table S4. Primers used in this study.
Primer name Sequence (5’-3’) Explanation or SNP target (where applicable)
topAMC1 GATGCACAACAGGCAAGAAGAGTGC To screen for chromosomal change
topAMC2b CCCGATTGTAAAACAACTAGACCAATTATG To screen for chromosomal change
flgBMC1b CTATCAAATACAGATGGAAGTTGTGGTG To screen for chromosomal change
flgBMC2c CGAGCATATGATTCTAACGTAGATACATTGAATG To screen for chromosomal change

40
CD2667MC1 GTCACCTTATGAGTGAAGTTTGTAATAAATGTGG To screen for chromosomal change
CD2667MC2b GCAAGAGCTGCTGCTGGAAGAC To screen for chromosomal change
JRP3441 8 GTTACCAGGAATACAACCAGAC To test for interrupted tcdB
JRP2839 8 CGGCCAGCCTCGCAGAGCAG To test for interrupted tcdB
JRP3442 8 GCACTTGCTTGATCAAAGCTCC toxA specific PCR, positive for all strains (630E, 630E A+B-, 630E A+B-CT)
JRP2342 8 CCGGAATTCGCTCTATTGGACTAGACCGTTG toxA specific PCR, positive for all strains (630E, 630E A+B-, 630E A+B-CT)
Cdi-tcdB-F1 9 TGATAGTATAATGGCTGAAGCTAATGCAGATAATGG To test for tcdB ClosTron insertion
Cdi-tcdB-R1 9 CTTGCATCGTCAAATGACC ATAAGCTAGCC To test for tcdB ClosTron insertion
268934_F TGTCAAGTGAATTAGAAAGAAACCA 268934
268934_R AAGTGAGCCGTGTTTTGAAAA 268934
309208_F GCCAGTTGCCAAAAAGAGTC 309208
309208_R GGCATAGCATCATTTAGTGTTTC 309208
MCSNP11 CGGGAAAAACAGCTGCTTTTAGTATCCC 933139
MCSNP12 CCTCTTGCTTGTAAATCTCCTACCAATTC 933139
10000995_F GATGAAGAAGTTGTTTGGCAAT 1000995
10000995_R CCTACTTGGCTACACCTTTTACA 1000995
1391850_F TCTGTCATTTGGAAAGGATGAA 1391850
1391850_R TCTGTACTTGCTTTTGATATACTTGGA 1391850
Spo0A_F1 GGCATAGCTAAGGATGGAATTG 1413057
Spo0A_R1 GGAGTAGAGGAAAAGTTGACACAA 1413057
1480649_F GCTTCAACAAGAAGGAGCAAA 1480649
1480649_R TGCTGGTGGTTGTGTAAAATG 1480649
1607453_F TTGAAGGTGTAAACTCAGTTGTAGG 1607453
1607453_R TCCAAATAAAAGTCTATGAAAATGAA 1607453
1626977_F TGGTGGTAGCAAAAACGAAA 1626977
1626977_R TGCCATTGAATTTGTTGCAG 1626977
2044514_F CATACTAAATGAGGGGTAAAATAAAGA 2044514
2044514_R TTTTTCTGCCTTTTCTCTTTGTG 2044514
MCSNP1 GTTCTGTAATACCTTTTTCTTTAGCTATTTTAATTGC 2203033
MCSNP2 GTTACCGATATTATAGGCAAAACTGCCC 2203033
2209236_F CCATTAGTGAGTGATGATTTACTTCC 2209236
2209236_R GCAAGTTTTGCTATTTCTCTTTCTT 2209236
2320410_F GTCACTGGTAGGAATTAATCTAACG 2320410
2320410_R TGCTTTCACAAATGCTTTCG 2320410
MCSNP13 GAAAGATGAATTTCTATCCATCTTCATCAAATGTGG 2339506
MCSNP14 GGGGCTGTTGACCTTGGACCC 2339506
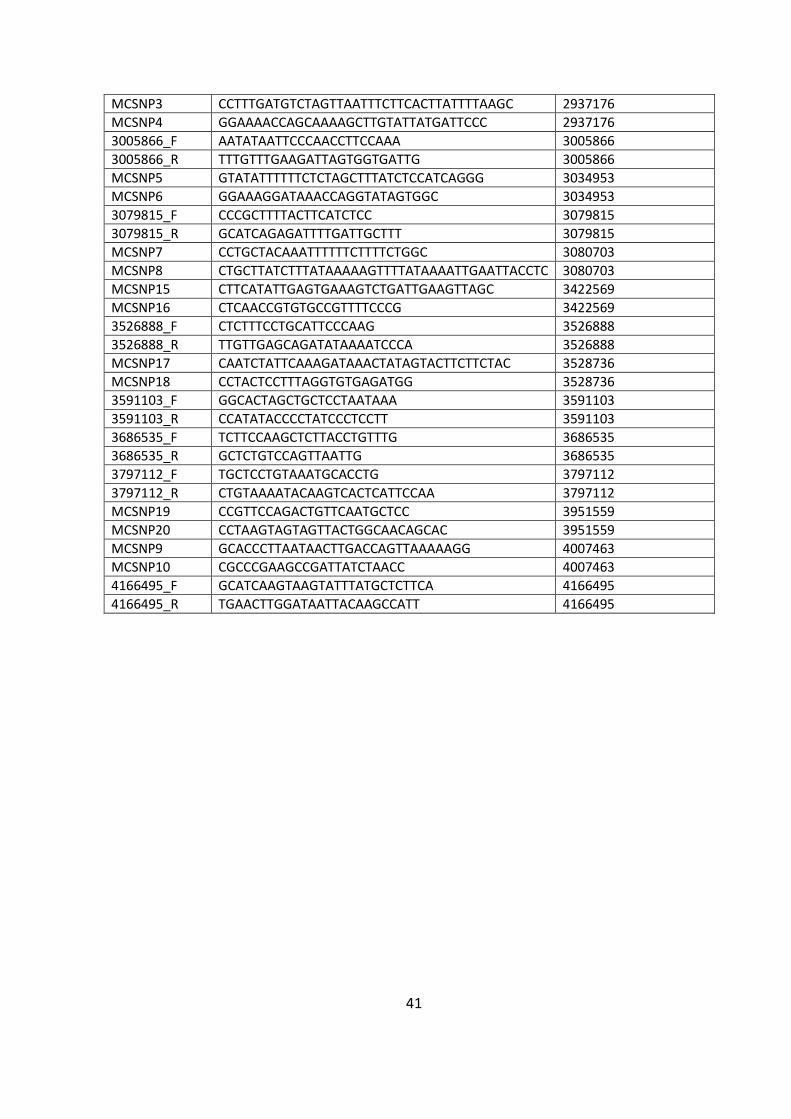
41
MCSNP3 CCTTTGATGTCTAGTTAATTTCTTCACTTATTTTAAGC 2937176
MCSNP4 GGAAAACCAGCAAAAGCTTGTATTATGATTCCC 2937176
3005866_F AATATAATTCCCAACCTTCCAAA 3005866
3005866_R TTTGTTTGAAGATTAGTGGTGATTG 3005866
MCSNP5 GTATATTTTTTCTCTAGCTTTATCTCCATCAGGG 3034953
MCSNP6 GGAAAGGATAAACCAGGTATAGTGGC 3034953
3079815_F CCCGCTTTTACTTCATCTCC 3079815
3079815_R GCATCAGAGATTTTGATTGCTTT 3079815
MCSNP7 CCTGCTACAAATTTTTTCTTTTCTGGC 3080703
MCSNP8 CTGCTTATCTTTATAAAAAGTTTTATAAAATTGAATTACCTC 3080703
MCSNP15 CTTCATATTGAGTGAAAGTCTGATTGAAGTTAGC 3422569
MCSNP16 CTCAACCGTGTGCCGTTTTCCCG 3422569
3526888_F CTCTTTCCTGCATTCCCAAG 3526888
3526888_R TTGTTGAGCAGATATAAAATCCCA 3526888
MCSNP17 CAATCTATTCAAAGATAAACTATAGTACTTCTTCTAC 3528736
MCSNP18 CCTACTCCTTTAGGTGTGAGATGG 3528736
3591103_F GGCACTAGCTGCTCCTAATAAA 3591103
3591103_R CCATATACCCCTATCCCTCCTT 3591103
3686535_F TCTTCCAAGCTCTTACCTGTTTG 3686535
3686535_R GCTCTGTCCAGTTAATTG 3686535
3797112_F TGCTCCTGTAAATGCACCTG 3797112
3797112_R CTGTAAAATACAAGTCACTCATTCCAA 3797112
MCSNP19 CCGTTCCAGACTGTTCAATGCTCC 3951559
MCSNP20 CCTAAGTAGTAGTTACTGGCAACAGCAC 3951559
MCSNP9 GCACCCTTAATAACTTGACCAGTTAAAAAGG 4007463
MCSNP10 CGCCCGAAGCCGATTATCTAACC 4007463
4166495_F GCATCAAGTAAGTATTTATGCTCTTCA 4166495
4166495_R TGAACTTGGATAATTACAAGCCATT 4166495