Embed Size (px)
Citation preview
20 JANUARY 2005 FLARE
CORONAS OBSERVATIONS
Kuznetzov Sergey (PI), [email protected], Kurt Victoria, [email protected], Yushkov Boris, clef@srd,sinp.msu.ru, Svertilov Sergey
Skobeltzyn Institute of Nuclear Physics, Moscow State University
Kudela Karel (co-PI) Institute of Experimental Physics, Slovak Academy of Sciences, Kosice, [email protected]
6th RHESSI workshop
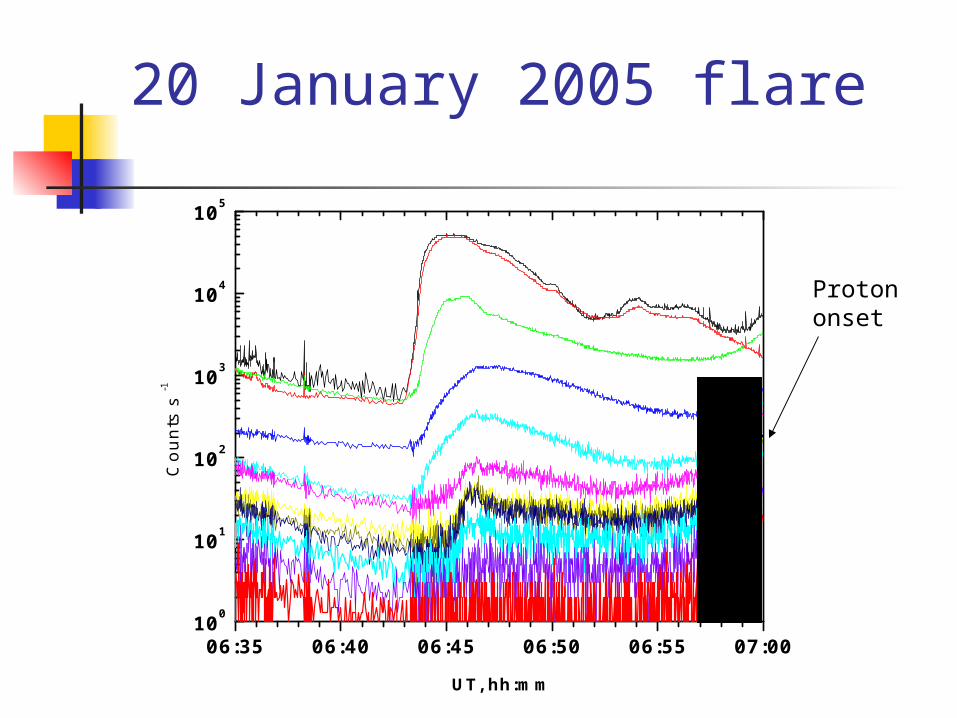
20 January 2005 flare
06:35 06:40 06:45 06:50 06:55 07:00100
101
102
103
104
105
C
ou
nts
s -1
UT, hh:mm
Proton onset
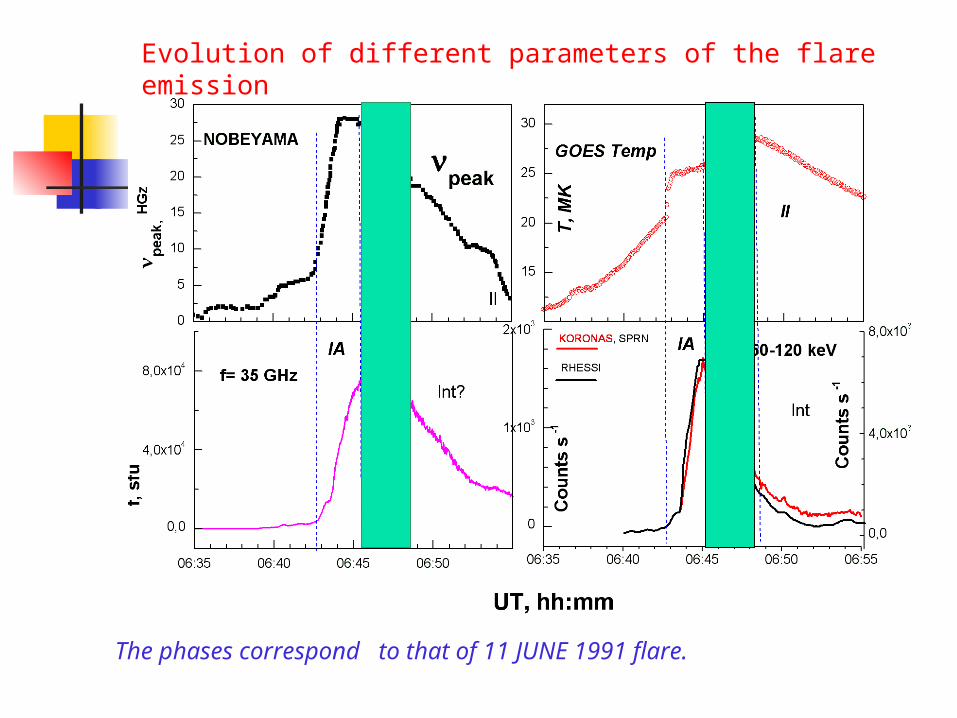
Evolution of different parameters of the flare emission
The phases correspond to that of 11 JUNE 1991 flare.

Time profiles of the low and high energy gamma-ray emission
High energy emission is delayed compared to the low one.
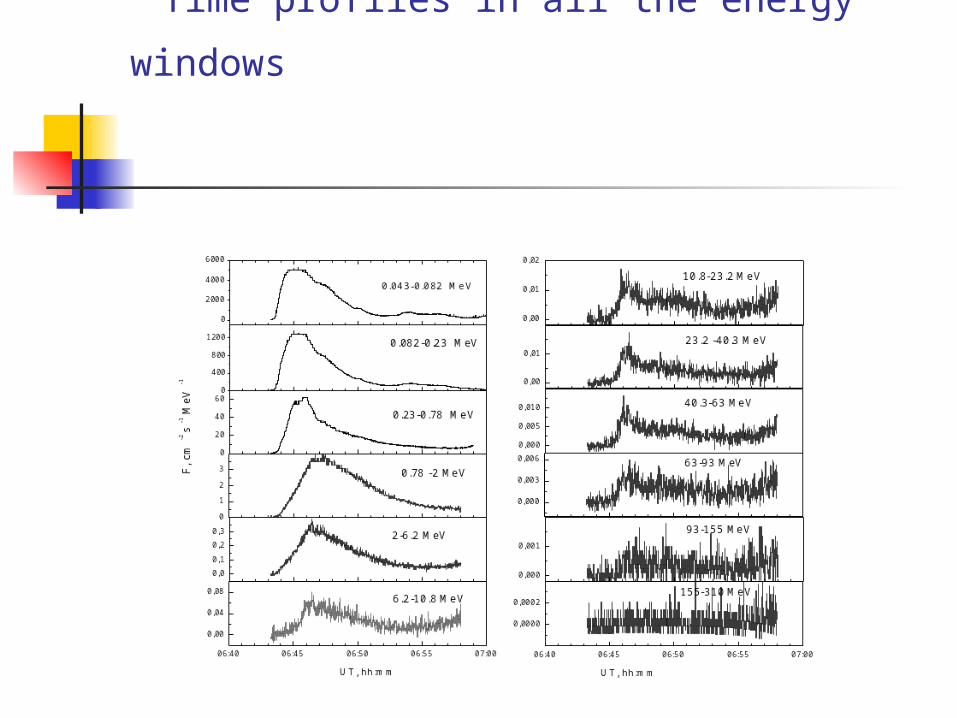
Time profiles in all the energy windows
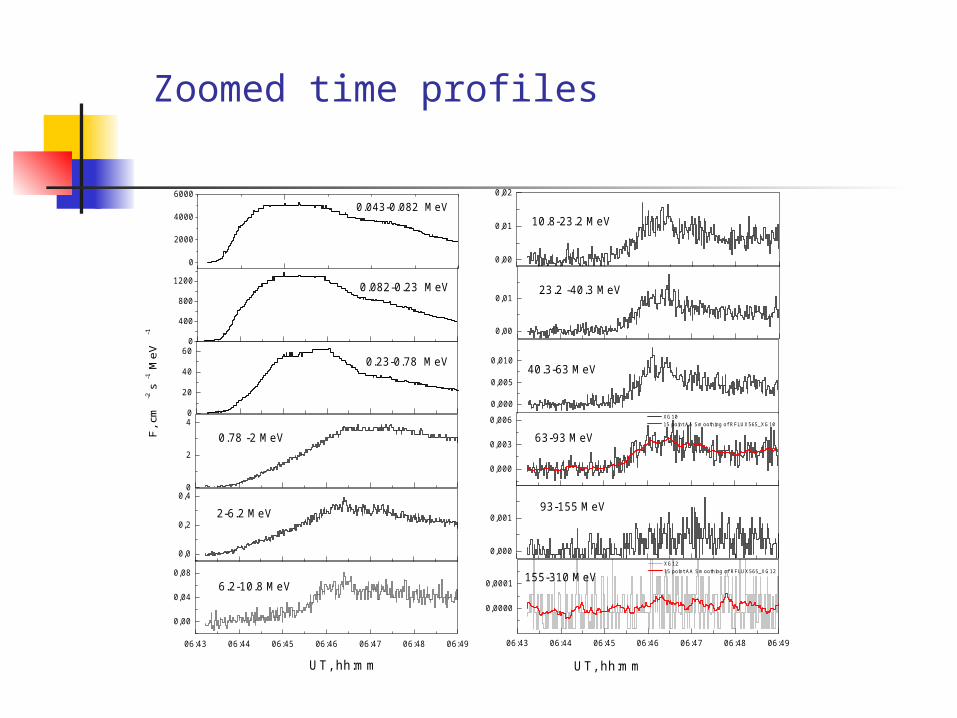
Zoomed time profiles
0
2000
4000
6000
0
400
800
1200
0
20
40
60
0
2
4
0,0
0,2
0,4
06:43 06:44 06:45 06:46 06:47 06:48 06:49
0,00
0,04
0,08
0,00
0,01
0,02
0,00
0,01
0,000
0,005
0,010
0,000
0,003
0,006
0,000
0,001
06:43 06:44 06:45 06:46 06:47 06:48 06:49
0,0000
0,0001
UT, hh:mm
0.082-0.23 MeV
F, c
m -2
s -1 M
eV -1
0.23-0.78 MeV
0.78 -2 MeV
2-6.2 MeV
6.2-10.8 MeV
10.8-23.2 MeV
23.2 -40.3 MeV
40.3-63 MeV
XG10 15 point AA Smoothing of RFLUX565_XG10
63-93 MeV
93-155 MeV
0.043-0.082 MeV
XG12 15 point AA Smoothing of RFLUX565_XG12
UT, hh:mm
155-310 MeV
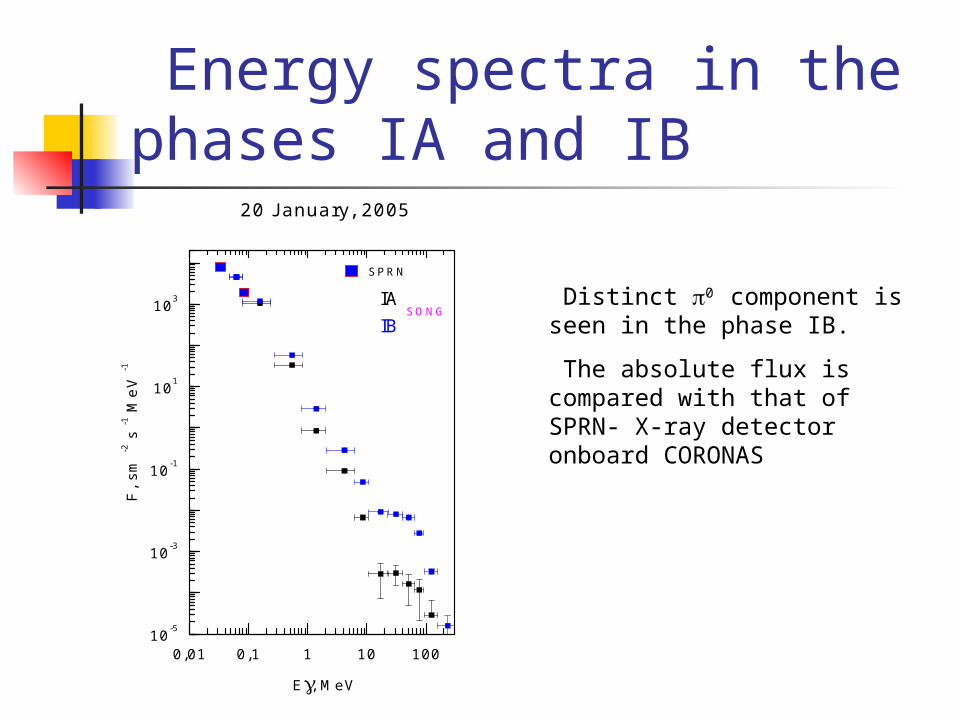
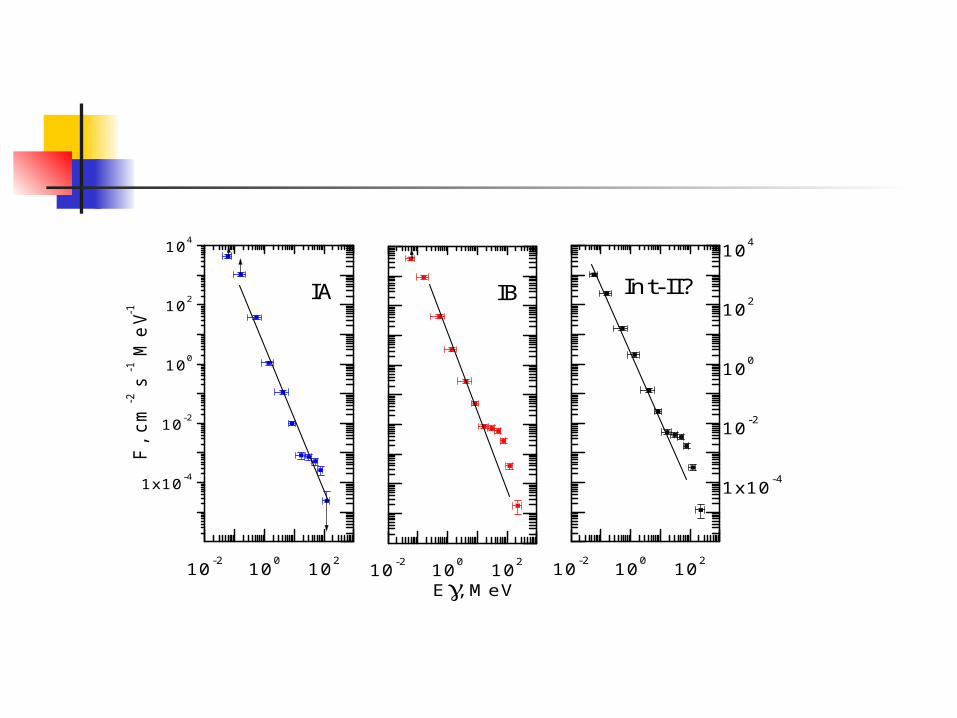
Energy spectra in the phases IA and IB
0,01 0,1 1 10 10010-5
10-3
10-1
101
103
SPRN
IAIB
SONG
20 January, 2005
F,
sm -2
s -1
Me
V -1
E, MeV
Distinct 0 component is seen in the phase IB.
The absolute flux is compared with that of SPRN- X-ray detector onboard CORONAS
10-2 100 102
1x10⁻⁴
10-2
100
102
104
10-2 100 102 10-2 100 102
1x10⁻⁴
10-2
100
102
104
F,
cm
-2 s
-1 M
eV-1
IA
E, MeV
IB
Int-II?
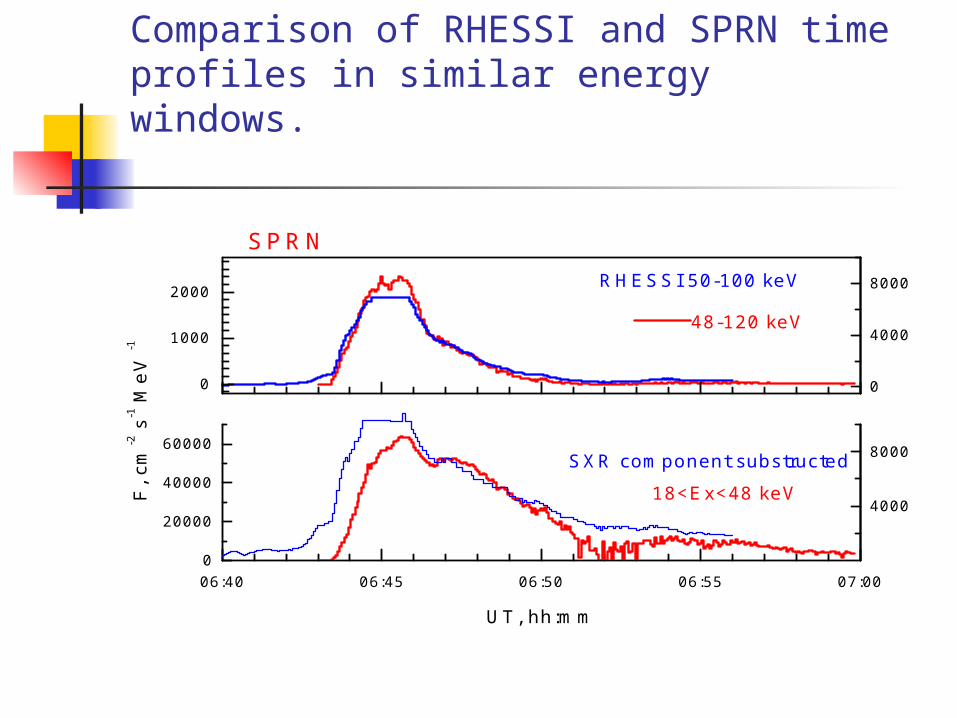
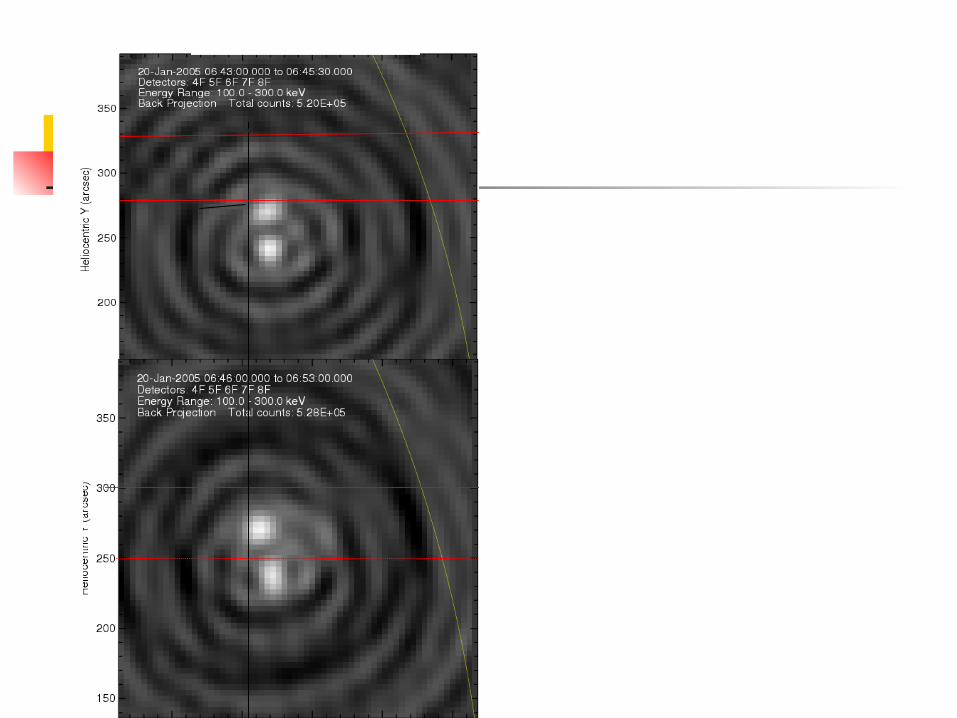
Comparison of RHESSI and SPRN time profiles in similar energy windows.
06:40 06:45 06:50 06:55 07:000
20000
40000
60000 SXR component substructed
F, c
m-2 s
-1 M
eV -1
UT, hh:mm
48-120 keV
0
1000
2000 RHESSI 50-100 keV
SPRN
18<Ex<48 keV4000
8000
0
4000
8000
06:40 06:43 06:46 06:48 06:510
1000
2000
3000
Co
un
ts s
-1
UT
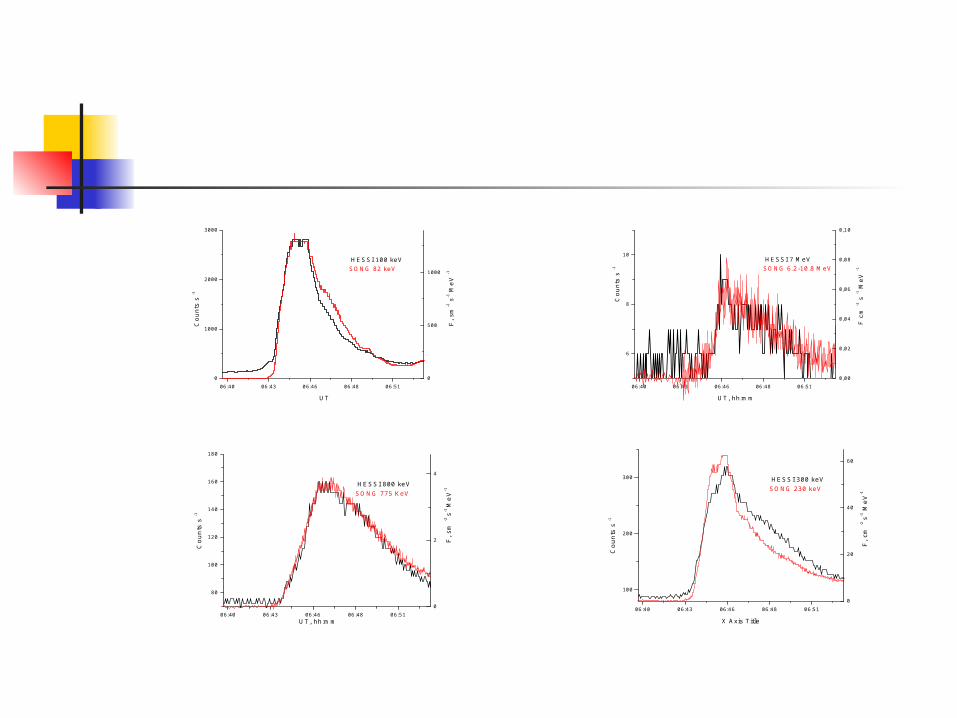
HESSI 100 keVSONG 82 keV
0
500
1000
F, s
m-2 s
-1 M
eV
-1
06:40 06:43 06:46 06:48 06:51
6
8
10
Co
un
ts s
-1
F c
m -2
s -1
Me
V -1
UT, hh:mm
HESSI 7 MeVSONG 6.2-10.8 MeV
0,00
0,02
0,04
0,06
0,08
0,10
06:40 06:43 06:46 06:48 06:51
80
100
120
140
160
180
Co
un
ts s
-1
UT, hh:mm
F,
sm -2
s-1 M
eV
-1
HESSI 800 keVSONG 775 KeV
0
2
4
06:40 06:43 06:46 06:48 06:51
100
200
300
Co
un
ts s
-1
F, c
m -2
s-1 M
eV
-1
X Axis Title
HESSI 300 keVSONG 230 keV
0
20
40
60
06:43 06:46 06:48 06:51 06:54 06:57
0,0
0,4
0,8
1,2
1,6
RHESSI
UT, hh:mm
0
20
40
60
80
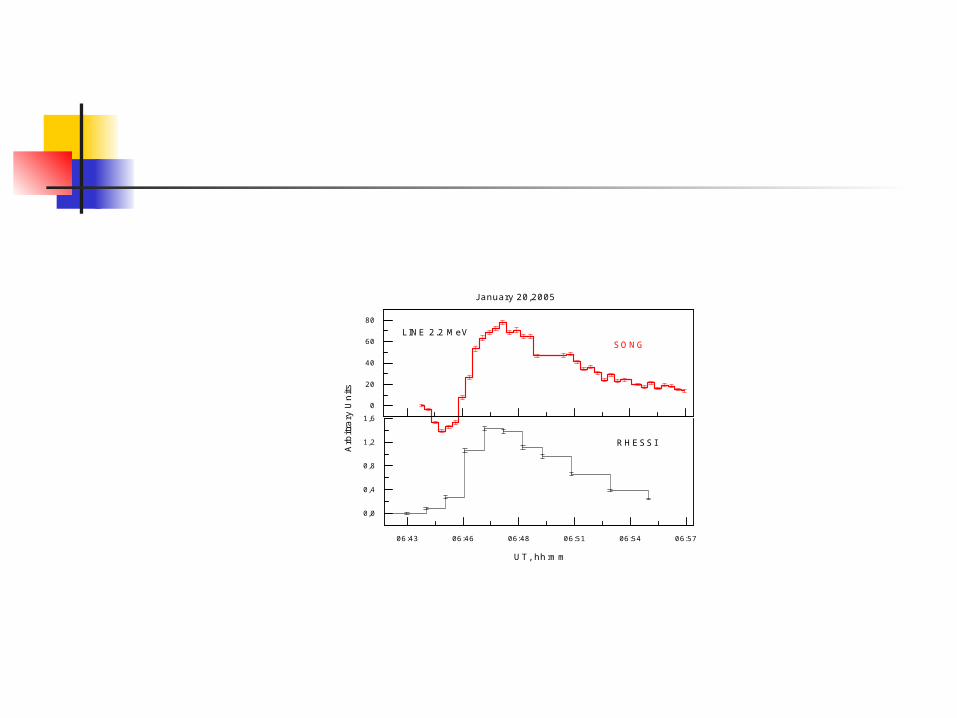
SONG LINE 2.2 MeV
January 20,2005
Arb
itra
ry U
nits

06:40 06:42 06:44 06:46 06:48 06:50 06:52 06:54-5
0
5
10
15
20
E >60 MeV E 0.78-2 MeV
Cou
nts
s -1
Cou
nts
s -1
UT, hh:mm
0,0
0,5
1,0
line 511 keV RHESSI
Arb
itra
ry u
nits
0
20
40
60
80
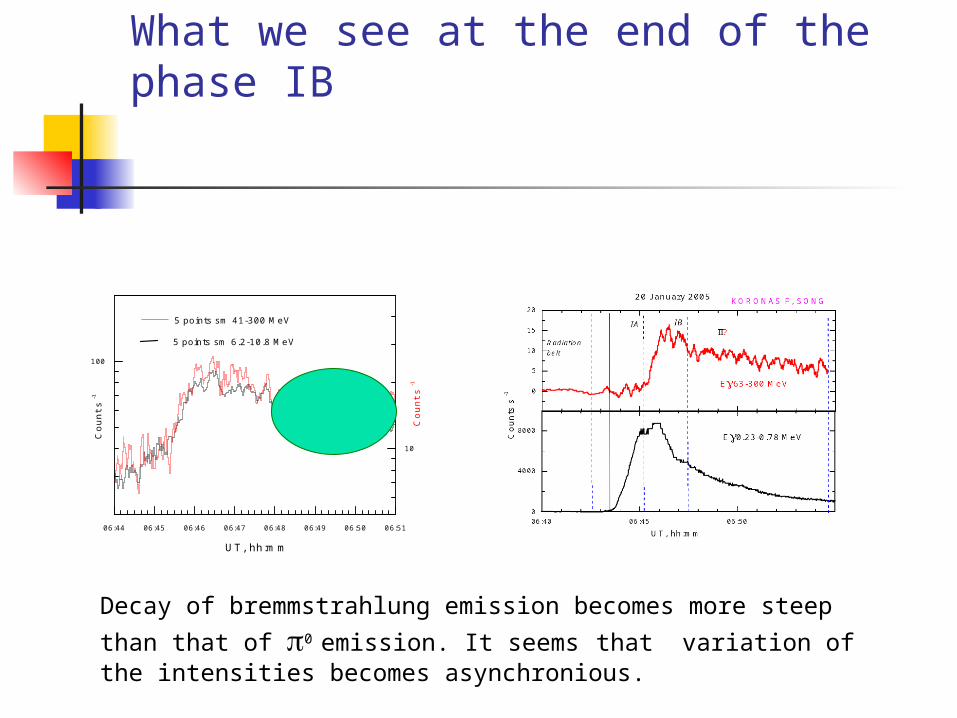
What we see at the end of the phase IB
06:44 06:45 06:46 06:47 06:48 06:49 06:50 06:51
100
Cou
nt s
-1
Cou
nt s
-1
UT, hh:mm
10
5 points sm 6.2-10.8 MeV
5 points sm 41-300 MeV
Decay of bremmstrahlung emission becomes more steep than
that of 0 emission. It seems that variation of the intensities becomes asynchronious.
06:44 06:45 06:46 06:47 06:48 06:49 06:50 06:512000
3000
4000
5000
6000
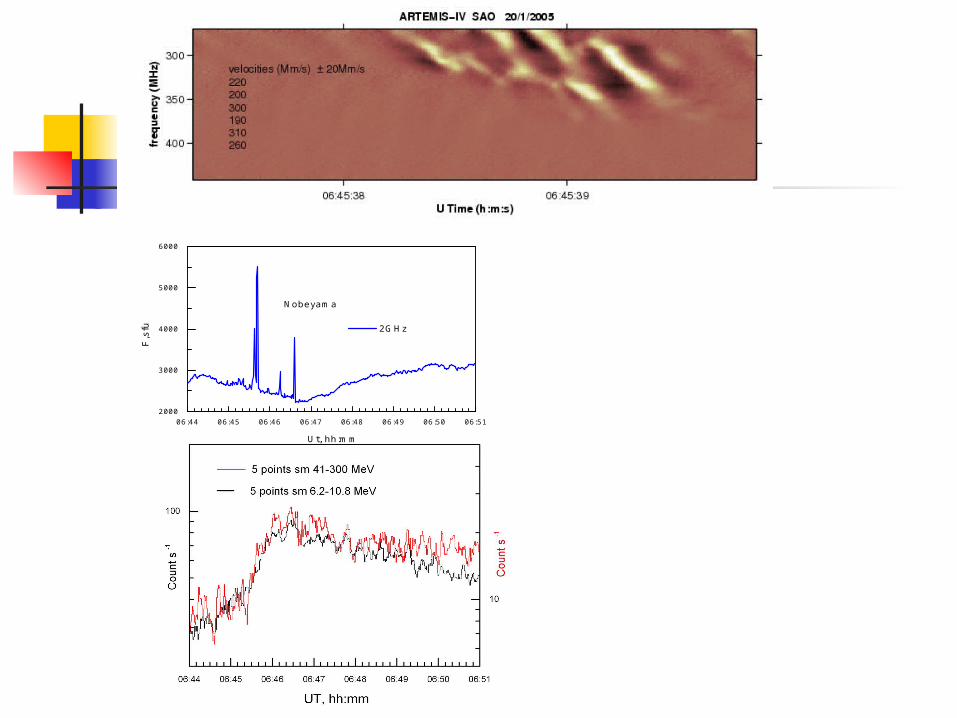
Nobeyama
F,s
fu
Ut, hh:mm
2GHz
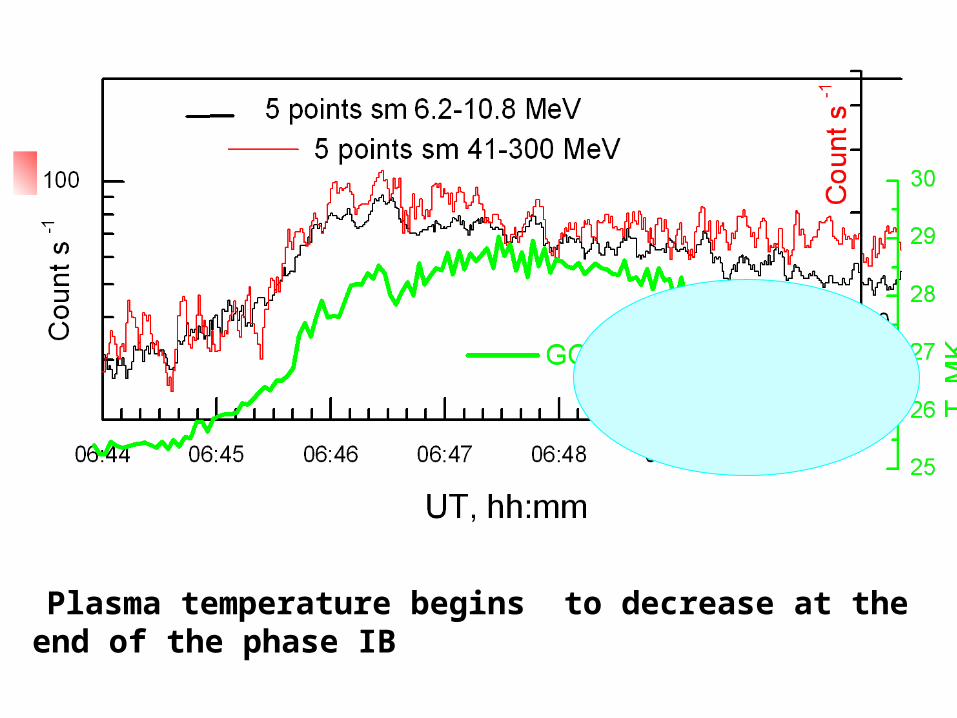
Plasma temperature begins to decrease at the end of the phase IB

0
10
20
30IIIBIA E>60 МэВ
Отсчёты, с-1
UT, час : мин
06:40 06:42 06:44 06:46 06:48 06:50 06:52 06:54 06:560
4000
8000E 0.23-0.78 МэВ
110
1001000
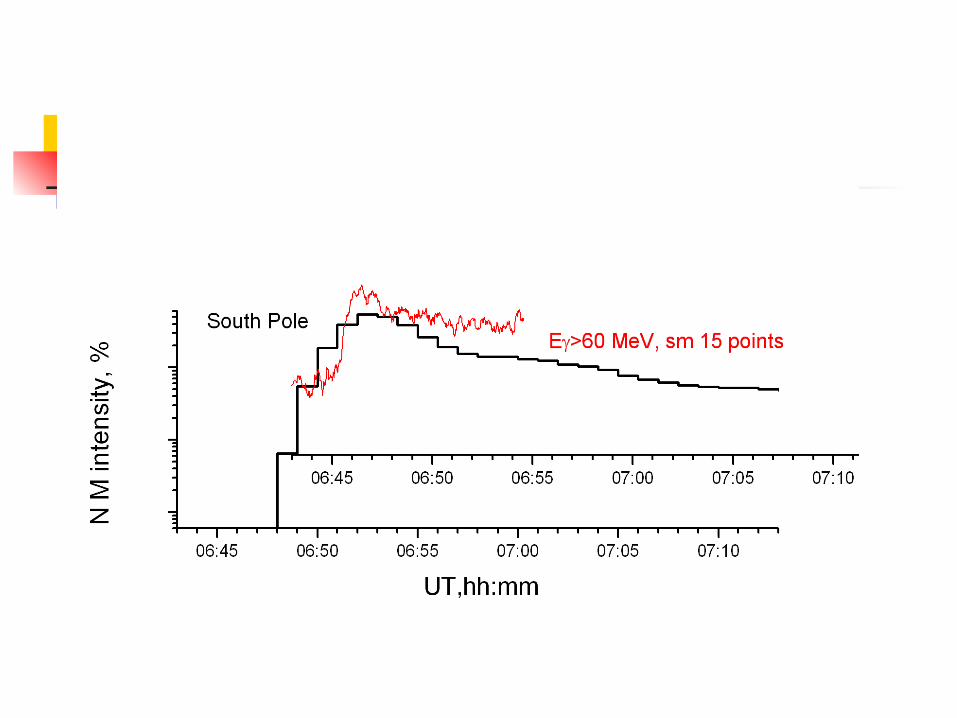
% South Pole NM
0
10
20
30IIIBIA E>60 МэВ
Отсчёты, с-1
UT, час : мин
06:40 06:42 06:44 06:46 06:48 06:50 06:52 06:54 06:560
4000
8000E 0.23-0.78 МэВ
110
1001000
% South Pole NM
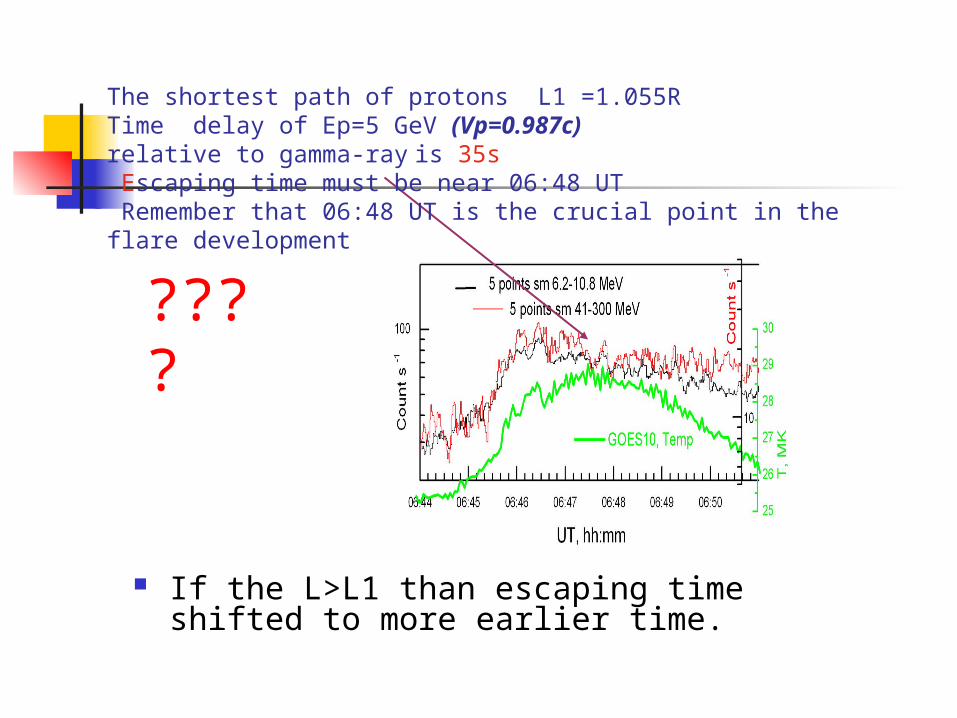
If the L>L1 than escaping time shifted to more earlier time.
????
The shortest path of protons L1 =1.055RTime delay of Ep=5 GeV (Vp=0.987c)relative to gamma-ray is 35s Escaping time must be near 06:48 UT Remember that 06:48 UT is the crucial point in the flare development
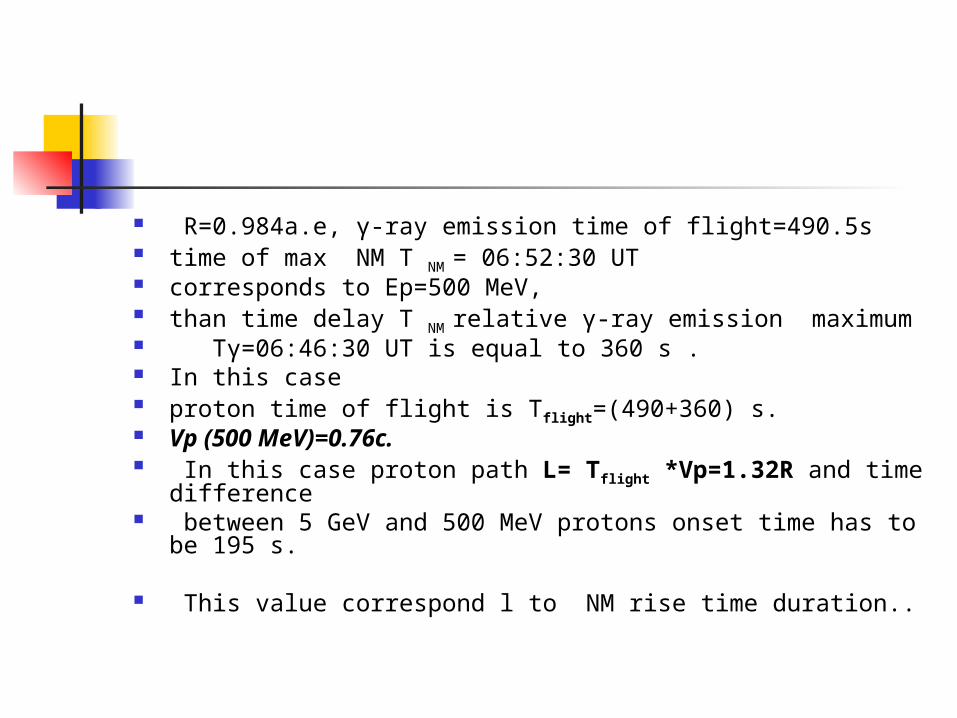
R=0.984a.e, γ-ray emission time of flight=490.5s time of max NM T NM = 06:52:30 UT corresponds to Ep=500 MeV, than time delay T NM relative γ-ray emission maximum Tγ=06:46:30 UT is equal to 360 s . In this case proton time of flight is Tflight=(490+360) s. Vp (500 MeV)=0.76c. In this case proton path L= Tflight *Vp=1.32R and time
difference between 5 GeV and 500 MeV protons onset time has to be
195 s.
This value correspond l to NM rise time duration..

![arXiv:1702.00743v1 [hep-th] 2 Feb 2017dec1.sinp.msu.ru/~panov/Lib/Papers/SUSY/1702.00743v1.pdf · CERN-TH-2017-005 Supergravity at 40: Reflections and Perspectives S. Ferraraa;b;c](https://img.pdfslide.net/doc/110x75/60572d495874bb0759301506/arxiv170200743v1-hep-th-2-feb-panovlibpaperssusy170200743v1pdf-cern-th-2017-005.jpg)