Embed Size (px)
Citation preview

20 QUESTIONS YOU SHOULD ASK YOURSELF
BEFORE YOU APPROVE THAT DESIGN
By: Danny K. McCook, Civil Engineer, National Design, Construction, and Soil Mechanics Center, Natural Resources Conservation Service, Fort Worth, TX
Abstract
Every embankment project is unique. In addition, design procedures and templates are not well codified and standardized. A “checklist” for designers and reviewers may prevent overlooking critical aspects of a design because designs are not standardized. This article presents a “checklist” that highlights some of the important aspects of the geotechnical issues in the design of embankments. The Author developed the checklist based on 39 years of experience in design of small earth embankments. Examples of topics included in the paper include:
Are the specifications for degree of compaction appropriate considering the size of the embankment and the zone in the dam for which the specifications are written?
Could the specifications for placement water content allow compaction of soils to undesirable conditions? Specifically, would they allow a brittle over-compacted condition in the soils? Has the natural water content of the borrow soils been considered?
Is an embankment chimney filter or filter diaphragm part of the design? If not, does the design documentation adequately justify the elimination of these features? Examples of justification are a lack of differential foundation settlement, erosion resistant, non-dispersive embankment soils, and placement recommendations for wetter than normal compaction.
Have suitable quality control procedures been specified for construction, particularly the method of selecting reference compaction tests values? Has a quality control plan been made part of the construction effort?
Is the proposed cutoff measure a complete cutoff of seepage? If not, have adequate drainage and filters been included in the design to address uplift and critical discharge gradients?
Has differential settlement been evaluated and defensive design measures included in the design if the differential settlement is excessive?
Critical questions that should be asked in evaluating shear tests are discussed
Have tests been performed to evaluate problematic embankment and foundation soil types? Examples are tests to identify dispersive clays, collapsible soils, sands susceptible to liquefaction, and others.

Have critical readings been established for all instruments installed that permit personnel collecting the readings to determine when action may be required. Have personnel been instructed that deviations from patterns in readings as well as absolute values may indicate potential problems. Has a filling plan been prepared that assigns responsibility for various activities to appropriate parties?
Twenty Questions
Earth Fill Design
Question 1. Is the sampling and testing of proposed borrow soils appropriate considering the size and complexity of the embankment project?
Designs for earth embankment projects should be based on an appropriate number of samples that adequately represent each major zone of the proposed fill. The number of samples considered adequate to represent zones in the embankment depends on the size (yardage) of each zone in the dam. The Author is aware of some designs where a single sample was assumed to represent a zone in a proposed embankment design that was 500,000 cubic yards in volume. Clearly a single sample could not adequately statistically represent this large a yardage. No widely accepted rule of thumb is known to the Author, but as a rule of thumb, in the opinion of the Author, a sample should be obtained and a battery of tests including standard index tests (gradation and Atterberg limit), compaction, and complex engineering tests performed on each sample that:
represents any zone in the dam that is greater than 20 % of the total fill volume or 100,000 cubic yards, whichever is less.
represents any critical zone in the dam, regardless of volume, for example a narrow core zone in the dam.
represents on-site materials that are to be used for aggregate sources, sampling and testing of these soils is particularly critical to establish fines content and properties such as cementation and durability.
Were enough shear tests performed or correlations clearly documented so that each zone of the embankment and major foundation horizons can be represented by valid parameters in the stability analyses?
Question 2. Is the degree of compaction specified suitable for each earth fill zone?
Specifications for soil compaction should be based on engineering property tests or correlations, including shear strength, consolidation (including flexibility), and permeability. These engineering properties depend both on the compacted dry density (usually expressed as a percentage of a reference compaction test) and on the compacted water content (usually referenced to the same compaction test). For many soils, compaction to 95 percent of Standard Proctor (ASTM D698) maximum dry density achieves acceptable engineering properties for small to medium size embankments.Even on larger embankments, this degree of compaction is often appropriate for narrow central core zones of embankments.
Designers should always consider the tradeoffs in design of plastic clay core zones, and decisions on specifying soil compaction that increase the shear strength but decrease the flexibility of the soils in the zone should always be closely evaluated. In the opinion of the Author, using modified Proctor (ASTM D1557) as a design reference test is seldom justified except for highly plastic clay soils which have low values of maximum dry density in the Standard Proctor (ASTM D698) test. When a higher density is required for a high plasticity clay soil to achieve a desirable shear strength/low compressibility design goal, a contract specification using Modified Proctor (D1557A) allows a designer to specify a higher design density without requiring a seemingly difficult to achieve 100 percent or higher percentage of Standard Proctor D698 dry density. In those cases, Modified Proctor (D1557) is justified.
Slope stability evaluations usually show that where central core zones have side slopes steeper than about 0.5H: 1V, the shear strength of the zone does not strongly influence the safety factor of the design. The stronger shell zones commonly provide adequate strength to outweigh any lower strength in the core zone.
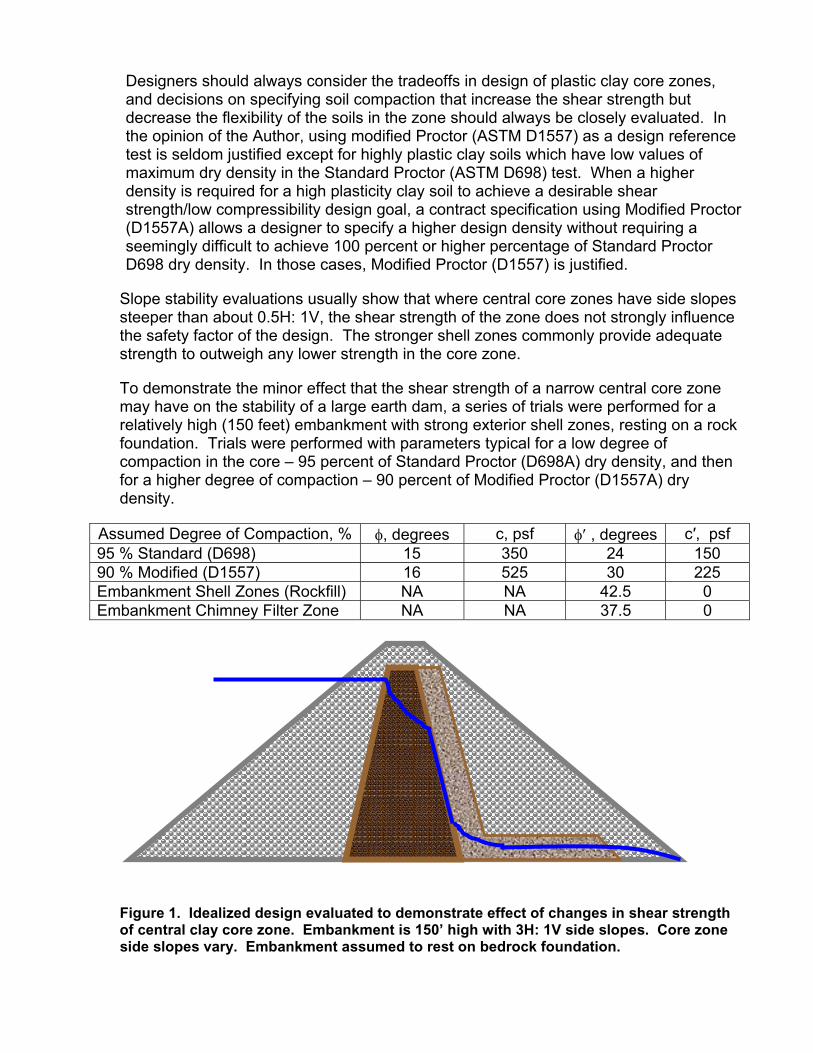
To demonstrate the minor effect that the shear strength of a narrow central core zone may have on the stability of a large earth dam, a series of trials were performed for a relatively high (150 feet) embankment with strong exterior shell zones, resting on a rock foundation. Trials were performed with parameters typical for a low degree of compaction in the core – 95 percent of Standard Proctor (D698A) dry density, and then for a higher degree of compaction – 90 percent of Modified Proctor (D1557A) dry density.
Assumed Degree of Compaction, % , degrees c, psf , degrees c , psf 95 % Standard (D698) 15 350 24 150 90 % Modified (D1557) 16 525 30 225 Embankment Shell Zones (Rockfill) NA NA 42.5 0 Embankment Chimney Filter Zone NA NA 37.5 0
Figure 1. Idealized design evaluated to demonstrate effect of changes in shear strength
of central clay core zone. Embankment is 150’ high with 3H: 1V side slopes. Core zone
side slopes vary. Embankment assumed to rest on bedrock foundation.

Following are results of the analyses:
Slope of Core Zone (H: V) Compaction Type for Core FS
95 % Standard (D698) 2.07 1-1/2 H: 1V 90 % Modified (D1557) 2.23 95 % Standard (D698) 1.70 2 H: 1V 90 % Modified (D1557) 1.90 95 % Standard (D698) 1.40 2-1/2 H: 1V 90 % Modified (D1557) 1.63
The trials show that the safety factors for 95 % of D698 dry density strengths are only about 10 to 15 % lower than the trials for 90 % of D1557 dry density. The size of the central clay core has a far greater influence on safety factors than the compaction of the core zone. The FS for the trial with a large center section is drastically different than it is for a narrow central core. For assumed parameters representing 95 % of Standard Proctor D698A, the safety factor for a narrow core is 2.07 but for a wide central core, only 1.40.
Additional trials (not shown here) demonstrate that when the central core has side slopes steeper than about 3/4H: 1V, the shear strength of the core zone is for all purposes not germane to the computed safety factor because the critical failure surfaces are infinite slope type surfaces in the exterior shell zones. As a reminder, this illustration is for an embankment resting on a firm foundation. The strength of the clay core would be more important when failure surfaces might combine in the clay core and through a lower shear strength foundation horizon.
Question 3. Are the specifications for water content appropriate for the soil types being used for each zone in the embankment? Do the specifications allow placement conditions to occur that may be undesirable.
Acceptable placement water contents are often provided as a range of water contents referenced to the optimum water content from the reference compaction test. Examples are:
From 2 percent dry of optimum to 3 percent wet of optimum. Plus or minus 2 percent from optimum. From optimum to 4 percent above optimum.
Reviewers should always ask whether the range of properties allowed by the specifications could result in undesirable properties in the soil. Specifications that could permit over-compaction of soils should be closely evaluated. Soils that are compacted to a higher density at too low a water content may be low in flexibility and prone to cracking. Photographs in Figure 2 illustrates an earthen embankment that was compacted at a high density and relatively low water content. Soils were compacted to about 110% of D698A maximum dry density based on construction QC measurements.
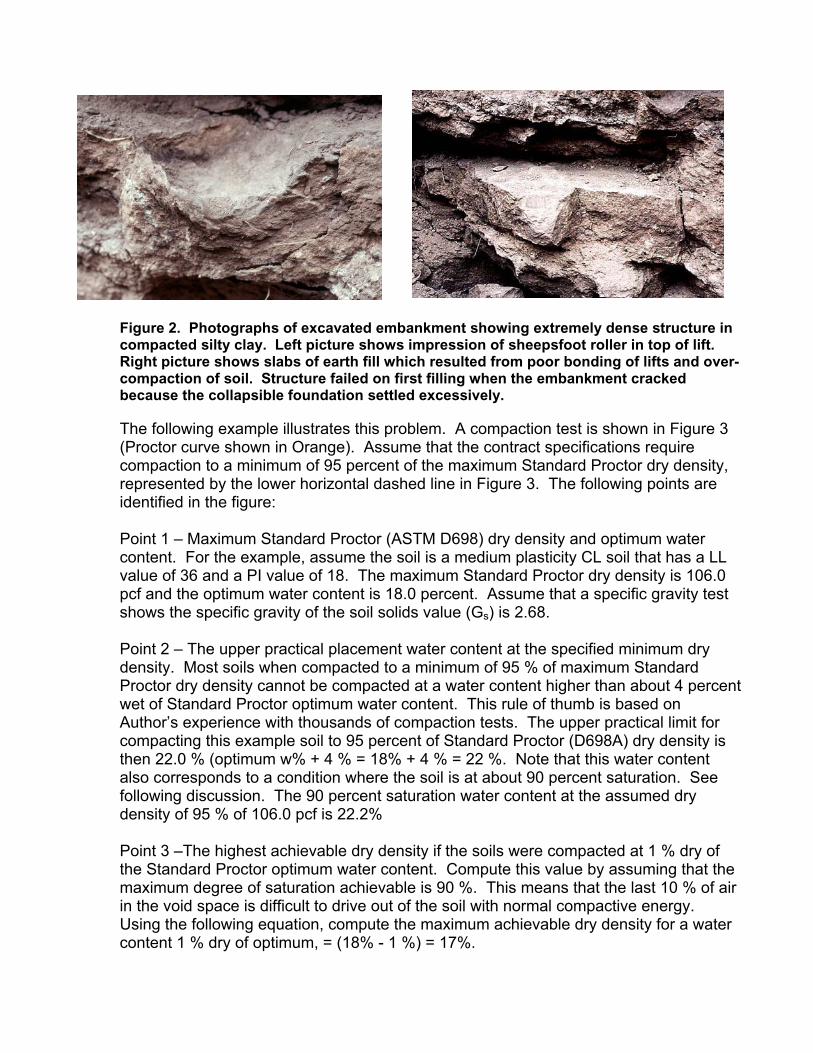
Figure 2. Photographs of excavated embankment showing extremely dense structure in
compacted silty clay. Left picture shows impression of sheepsfoot roller in top of lift.
Right picture shows slabs of earth fill which resulted from poor bonding of lifts and over-
compaction of soil. Structure failed on first filling when the embankment cracked
because the collapsible foundation settled excessively.
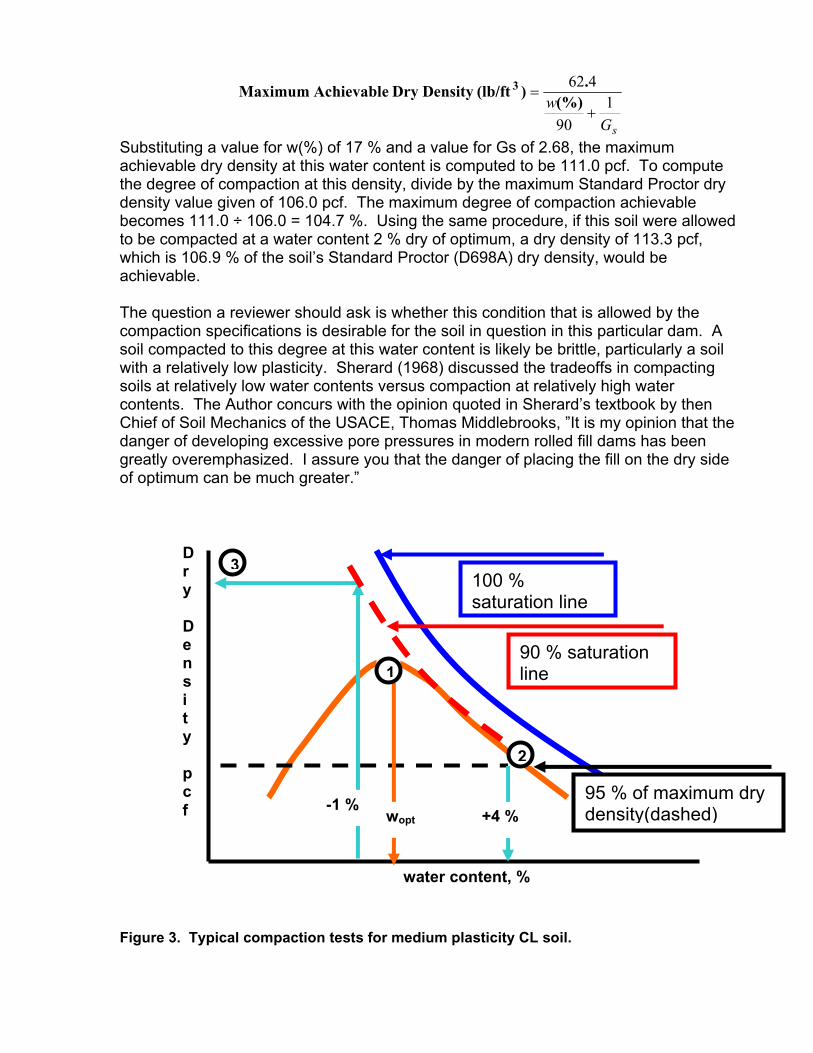
The following example illustrates this problem. A compaction test is shown in Figure 3 (Proctor curve shown in Orange). Assume that the contract specifications require compaction to a minimum of 95 percent of the maximum Standard Proctor dry density, represented by the lower horizontal dashed line in Figure 3. The following points are identified in the figure:
Point 1 – Maximum Standard Proctor (ASTM D698) dry density and optimum water content. For the example, assume the soil is a medium plasticity CL soil that has a LL value of 36 and a PI value of 18. The maximum Standard Proctor dry density is 106.0 pcf and the optimum water content is 18.0 percent. Assume that a specific gravity test shows the specific gravity of the soil solids value (Gs) is 2.68.
Point 2 – The upper practical placement water content at the specified minimum dry density. Most soils when compacted to a minimum of 95 % of maximum Standard Proctor dry density cannot be compacted at a water content higher than about 4 percent wet of Standard Proctor optimum water content. This rule of thumb is based on Author’s experience with thousands of compaction tests. The upper practical limit for compacting this example soil to 95 percent of Standard Proctor (D698A) dry density is then 22.0 % (optimum w% + 4 % = 18% + 4 % = 22 %. Note that this water content also corresponds to a condition where the soil is at about 90 percent saturation. See following discussion. The 90 percent saturation water content at the assumed dry density of 95 % of 106.0 pcf is 22.2%
Point 3 –The highest achievable dry density if the soils were compacted at 1 % dry of the Standard Proctor optimum water content. Compute this value by assuming that the maximum degree of saturation achievable is 90 %. This means that the last 10 % of air in the void space is difficult to drive out of the soil with normal compactive energy.Using the following equation, compute the maximum achievable dry density for a water content 1 % dry of optimum, = (18% - 1 %) = 17%.
sG
w 1
90
462(%)
.)(lb/ftDensityDrye AchievablMaximum 3
Substituting a value for w(%) of 17 % and a value for Gs of 2.68, the maximum achievable dry density at this water content is computed to be 111.0 pcf. To compute the degree of compaction at this density, divide by the maximum Standard Proctor dry density value given of 106.0 pcf. The maximum degree of compaction achievable becomes 111.0 ÷ 106.0 = 104.7 %. Using the same procedure, if this soil were allowed to be compacted at a water content 2 % dry of optimum, a dry density of 113.3 pcf, which is 106.9 % of the soil’s Standard Proctor (D698A) dry density, would be achievable.
The question a reviewer should ask is whether this condition that is allowed by the compaction specifications is desirable for the soil in question in this particular dam. A soil compacted to this degree at this water content is likely be brittle, particularly a soil with a relatively low plasticity. Sherard (1968) discussed the tradeoffs in compacting soils at relatively low water contents versus compaction at relatively high water contents. The Author concurs with the opinion quoted in Sherard’s textbook by then Chief of Soil Mechanics of the USACE, Thomas Middlebrooks, ”It is my opinion that the danger of developing excessive pore pressures in modern rolled fill dams has been greatly overemphasized. I assure you that the danger of placing the fill on the dry side of optimum can be much greater.”
Figure 3. Typical compaction tests for medium plasticity CL soil.
water content, %
D
r
y
D
e
n
s
i
t
y
p
c
f -1 % +4 % wopt
100 % saturation line
3
1
2
90 % saturation line
95 % of maximum dry density(dashed)
The above discussion addressed the potential problems that could result if soils are allowed to be compacted dry of optimum water content. The next question is what are the implications of compacting soils at too high a water content? What are good reasons for limiting the upper placement water content?
Specifications commonly place a restriction on the upper permissible placement water content to no higher than 2 or 3 percent wet of optimum. This limitation may have several purposes such as limiting the development of pore pressures in the compacted fill and increasing the overall shear strength of the zone. In the opinion of the Author, these requirements are seldom justified. The exceptions are when a relatively high embankment is being constructed primarily with clay soils because gravelly or rocky materials are not available to construct stronger shell zones. Even for this situation, using flatter embankment slopes may be preferable to using compaction specifications that result in an overly brittle fill.
As noted in the previous section, the shear strength of clay zones in a zoned embankment can be addressed by limiting the size of the clay core and using strong shell materials. The potential sacrifices in flexibility caused by limiting placement water content to no more than 2 or 3 percent above optimum should be carefully considered.The need for a more flexible fill is particularly critical when a soft compressible foundation occurs beneath a section of the embankment and where differential settlement is estimated to be severe. See a following section of this paper for more discussion of differential settlement.
Most cohesive soils can be satisfactorily compacted to 95 percent of Standard Proctor maximum dry density at a water content up to about 4 percent above optimum water content. Some designers recognize this implicit limitation and then use a specification that compaction to 95 percent of Standard Proctor (D698A) dry density is required and the acceptable water content is only stated as optimum or wetter. This may be seen by examining the typical shape of a compaction curve like that shown in Figure 3 above.Some silty and sandy soils may be difficult to compact when the natural water content is 4 percent above optimum and those soils may require a different water content specification than optimum and wetter.
Question 4. Have problematic embankment soils such as dispersive clays, slaking shales, and gravelly materials subject to breakdown on compaction been investigated adequately? Some problematic soils require special sampling and testing to evaluate their properties correctly. Examples include dispersive clays and shales. Following sections include recommendations of the Author based on his experience in design of small dams.
Sampling for dispersive clays must be done correctly. The key phrase in sampling for dispersive clays is “numerous, discrete, small natural water content” samples. The Author recommends obtaining a minimum of 20-30 samples, even for a small earthen embankment project This is because dispersive clays seldom occur as homogeneous strata within a deposit of soil. Even in a predominately dispersive layer, a single sample may produce non-dispersive results.
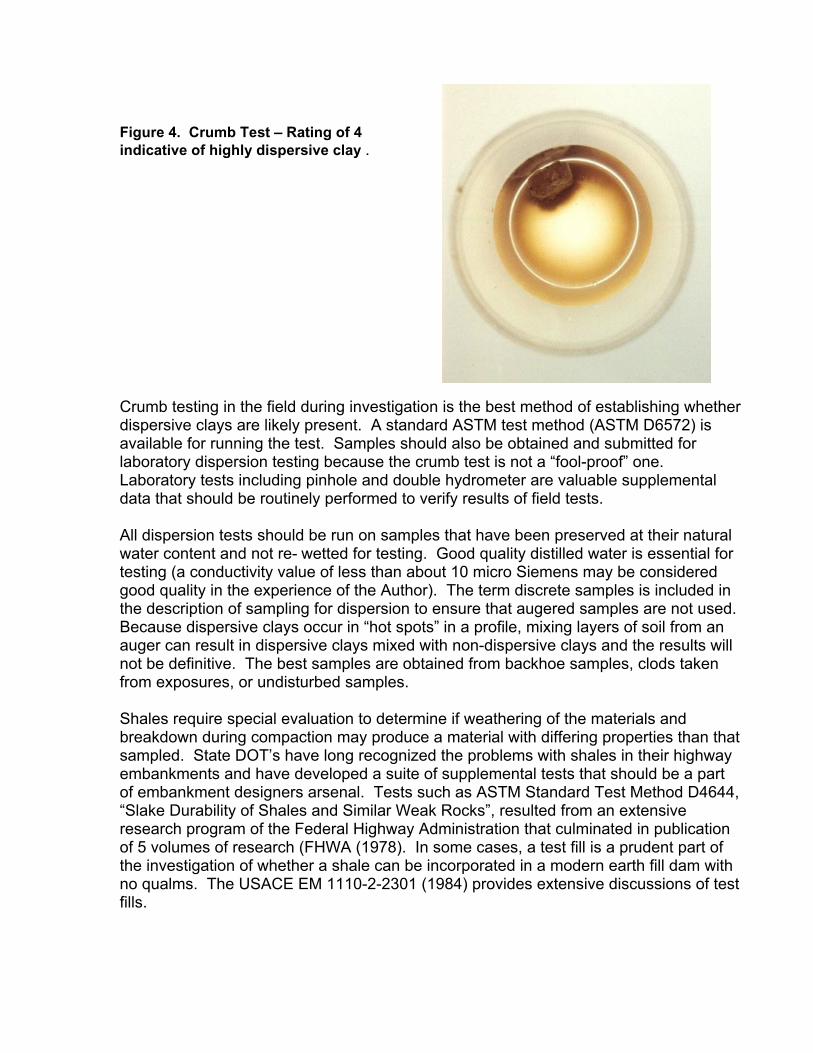
Figure 4. Crumb Test – Rating of 4
indicative of highly dispersive clay .
Crumb testing in the field during investigation is the best method of establishing whether dispersive clays are likely present. A standard ASTM test method (ASTM D6572) is available for running the test. Samples should also be obtained and submitted for laboratory dispersion testing because the crumb test is not a “fool-proof” one.Laboratory tests including pinhole and double hydrometer are valuable supplemental data that should be routinely performed to verify results of field tests.
All dispersion tests should be run on samples that have been preserved at their natural water content and not re- wetted for testing. Good quality distilled water is essential for testing (a conductivity value of less than about 10 micro Siemens may be considered good quality in the experience of the Author). The term discrete samples is included in the description of sampling for dispersion to ensure that augered samples are not used.Because dispersive clays occur in “hot spots” in a profile, mixing layers of soil from an auger can result in dispersive clays mixed with non-dispersive clays and the results will not be definitive. The best samples are obtained from backhoe samples, clods taken from exposures, or undisturbed samples.
Shales require special evaluation to determine if weathering of the materials and breakdown during compaction may produce a material with differing properties than that sampled. State DOT’s have long recognized the problems with shales in their highway embankments and have developed a suite of supplemental tests that should be a part of embankment designers arsenal. Tests such as ASTM Standard Test Method D4644,“Slake Durability of Shales and Similar Weak Rocks”, resulted from an extensive research program of the Federal Highway Administration that culminated in publication of 5 volumes of research (FHWA (1978). In some cases, a test fill is a prudent part of the investigation of whether a shale can be incorporated in a modern earth fill dam with no qualms. The USACE EM 1110-2-2301 (1984) provides extensive discussions of test fills.

The NRCS developed extensive guidance on sampling and shear testing of embankment samples that contained gravelly constituents consisting of shale and softer rock particles subject to breakdown during construction. Designers are encouraged to consult those publications (TR26 and 27), available from the NRCS web site:
http://www.info.usda.gov/CED/
Question 5. Is a chimney filter included in the design and does it extend laterally and vertically to the extent needed to intercept all hydraulic fracture zones? If this zone is not included, does the design document that the site has favorable properties in both the site configuration and in properties of embankment soils that justify not including this important feature. Favorable site configuration includes little potential for differential settlement. Favorable soil properties include no dispersive properties in soils with PI values of at least 10.
Several high profile embankment failures in the past several years have emphasized the importance of including a chimney filter in most important and significant or high hazard embankment designs. The sites that failed in the recent past to the best of knowledge of the Author did not include an embankment chimney filter in their design.Numerous citations such as the following emphasize the importance of chimney filters in modern embankment designs:
A. J.L. Sherard (1984) provided the following advice and conclusions on chimney filters:
P. 5, “I believe there is already sufficient evidence from dam behavior, supported by theory, to require the designer to assume that small concentrated leaks can develop through the impervious section of most embankment dams, even those without exceptional differential settlement.
P. 9, “In any event, as discussed earlier, the experience with dam behavior has shown practically no trouble with erosion of concentrated leaks through dam earth cores where there were reasonable downstream filters. As a result of this experience there has been less concern about differential settlement. The trend among many specialists, which I believe is justified . . . and in the correct direction toward both conservatism and economy, is to reverse the previous emphasis and consider that the downstream filter is the primary line of defense, and the other design measures to reduce the differential settlement are of secondary importance.”
B. U.S. Bureau of Reclamation, Design of Small Dams, Third Edition, 1987 This standard reference has been used by embankment designers since it was published by the Superintendent of Documents in 1960. The third edition (1987) is the source of the following citations. The following quotations emphasize the importance of including a chimney filter when embankment soils are erodible or contain potential flow paths.
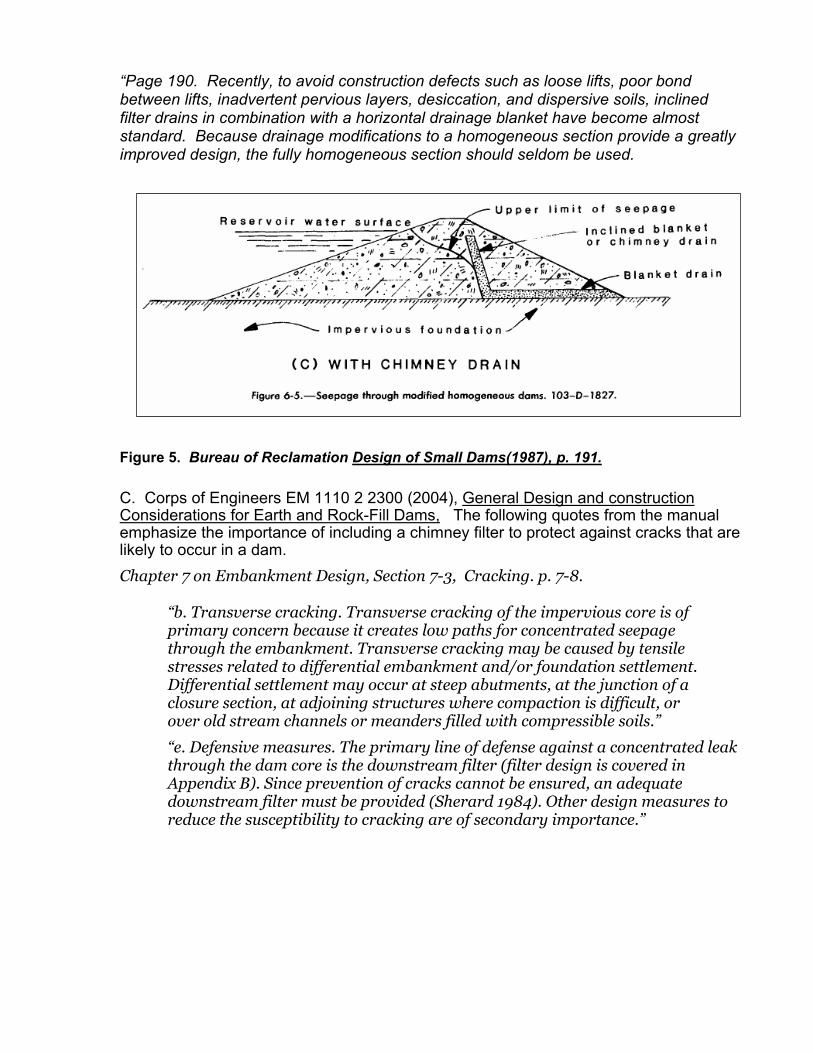
“Page 190. Recently, to avoid construction defects such as loose lifts, poor bond between lifts, inadvertent pervious layers, desiccation, and dispersive soils, inclined filter drains in combination with a horizontal drainage blanket have become almost standard. Because drainage modifications to a homogeneous section provide a greatly improved design, the fully homogeneous section should seldom be used.
Figure 5. Bureau of Reclamation Design of Small Dams(1987), p. 191.
C. Corps of Engineers EM 1110 2 2300 (2004), General Design and construction Considerations for Earth and Rock-Fill Dams, The following quotes from the manual emphasize the importance of including a chimney filter to protect against cracks that are likely to occur in a dam.Chapter 7 on Embankment Design, Section 7-3, Cracking. p. 7-8.
“b. Transverse cracking. Transverse cracking of the impervious core is of primary concern because it creates low paths for concentrated seepage through the embankment. Transverse cracking may be caused by tensile stresses related to differential embankment and/or foundation settlement. Differential settlement may occur at steep abutments, at the junction of a closure section, at adjoining structures where compaction is difficult, or over old stream channels or meanders filled with compressible soils.”
“e. Defensive measures. The primary line of defense against a concentrated leak through the dam core is the downstream filter (filter design is covered in Appendix B). Since prevention of cracks cannot be ensured, an adequate downstream filter must be provided (Sherard 1984). Other design measures to reduce the susceptibility to cracking are of secondary importance.”
D. Dr. Ronald Hirschfeld (1995), one of the founders of the firm GEI, was a well-known expert in embankment design and provided the following advice on chimney filters.
P. 4, “Even the most careful design and construction cannot be relied upon to produce a dam in which there are no details that may lead to piping. Therefore, every embankment dam should have a chimney drain and a blanket drain beneath the downstream shell, as discussed in Section 3.0.
P. 39, “The most important conclusions about designing, constructing, and inspecting dams to minimize the risk of piping are:
Every dam should have a first line of defense against piping, in the form of a chimney drain and a blanket drain under the downstream shell, unless the designer can determine that there is no unacceptable risk in eliminating one or both. Details of design and construction that will reduce the risk of piping should be incorporated in the design of every dam, as described in Section 2.0. “
Many small, low and significant hazard embankments are built without a chimney filter.Few high hazard dams are. Designs that do not include a chimney filter should have as a minimum the following favorable conditions in the opinion of the Author:
1. Differential foundation settlement should be less than guidelines discussed in this article, (See Question 9)
2. Embankment soils, at least the core zone, should be erosion resistant, non-dispersive soils. Erosion resistant soils commonly have PI values of greater than 10.
3. Placement specifications should not permit over compaction of embankment soils that could result in brittle behavior. (See Question 3)
Question 6. Has a filter diaphragm been included in the design that is commensurate in size and location with the soils and geometry of the conduit and the site?
If a design includes a chimney filter, that feature usually also serves the purpose of a filter diaphragm by wrapping the conduit to dimensions recommended for a filter diaphragm. However, if a site does not warrant a full chimney filter that extends completely from abutment to abutment and upwards to the auxiliary spillway elevation, all modern embankment designs should include a filter diaphragm around conduits that extend through the earthen embankment, in the opinion of the Author.
Conduits and excavations made to install them increase the likelihood that the embankment above it will arch and develop hydraulic fractures. A filter diaphragm is intended to intercept potential hydraulic fracture cracks in the fill and prevent erosion of the crack by forming a filter seal at the contact between the crack and the filter. The NRCS recently issued a comprehensive design document with their guidance on filter diaphragms Chapter 45 of the National Engineering Handbook (NRCS, 2006).
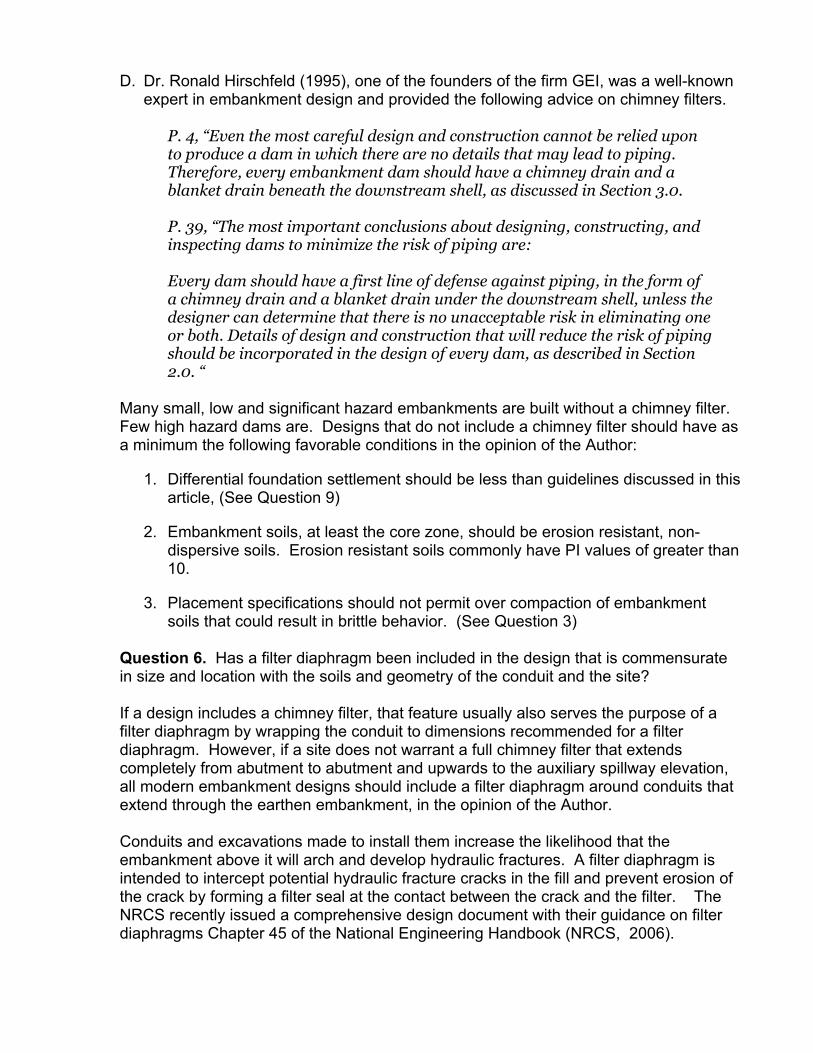
The recently released FEMA document, “Technical Manual, Conduits through Embankment Dams,” (2005) also provides extensive discussions of filter diaphragms.
Figure 6. Filter diaphragm being
installed around conduit in small
NRCS embankment in Ohio
Foundations
Question 7. Have problematic soils such as collapsible soil, and liquefiable sands been adequately characterized and identified?
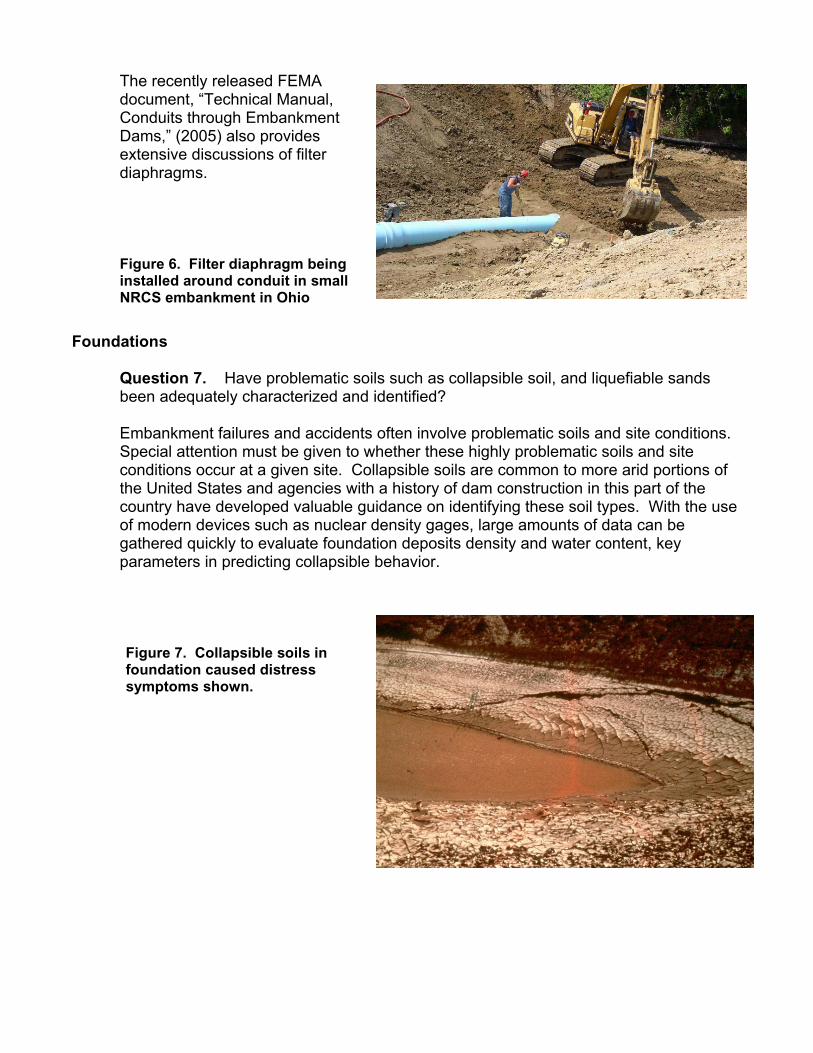
Embankment failures and accidents often involve problematic soils and site conditions.Special attention must be given to whether these highly problematic soils and site conditions occur at a given site. Collapsible soils are common to more arid portions of the United States and agencies with a history of dam construction in this part of the country have developed valuable guidance on identifying these soil types. With the use of modern devices such as nuclear density gages, large amounts of data can be gathered quickly to evaluate foundation deposits density and water content, key parameters in predicting collapsible behavior.
Figure 7. Collapsible soils in
foundation caused distress
symptoms shown.
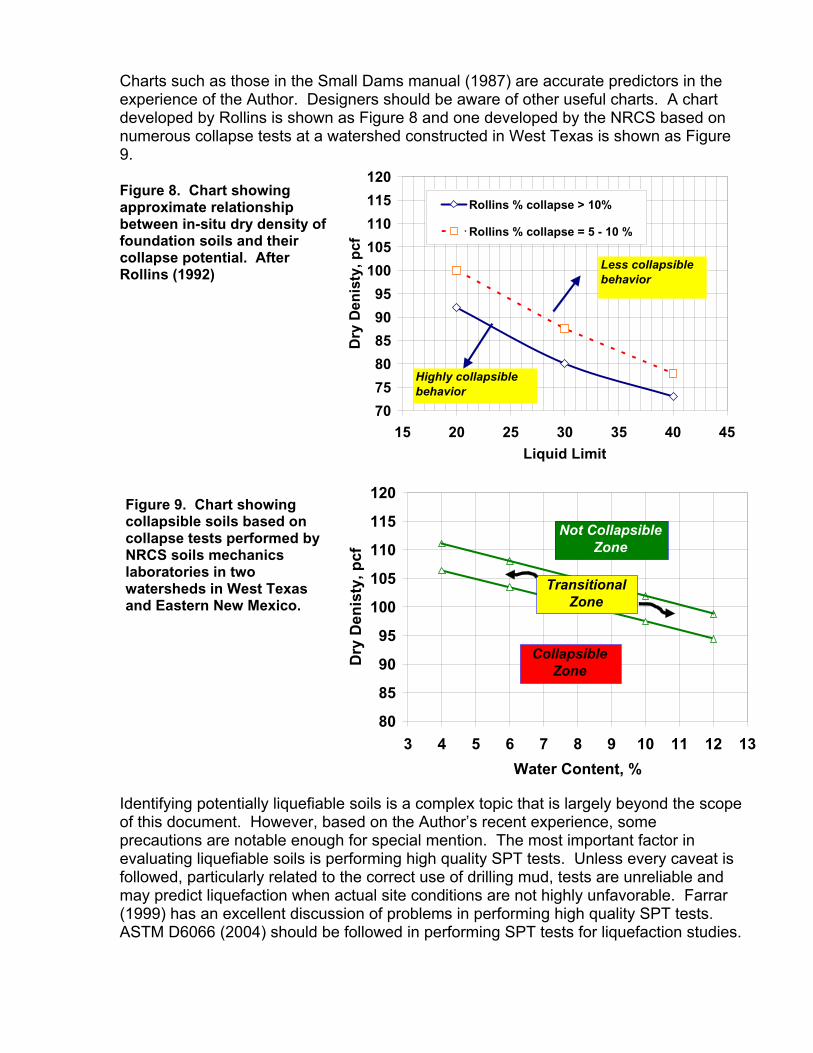
Charts such as those in the Small Dams manual (1987) are accurate predictors in the experience of the Author. Designers should be aware of other useful charts. A chart developed by Rollins is shown as Figure 8 and one developed by the NRCS based on numerous collapse tests at a watershed constructed in West Texas is shown as Figure 9.
Figure 8. Chart showing
approximate relationship
between in-situ dry density of
foundation soils and their
collapse potential. After
Rollins (1992)
Figure 9. Chart showing
collapsible soils based on
collapse tests performed by
NRCS soils mechanics
laboratories in two
watersheds in West Texas
and Eastern New Mexico.
Identifying potentially liquefiable soils is a complex topic that is largely beyond the scope of this document. However, based on the Author’s recent experience, some precautions are notable enough for special mention. The most important factor in evaluating liquefiable soils is performing high quality SPT tests. Unless every caveat is followed, particularly related to the correct use of drilling mud, tests are unreliable and may predict liquefaction when actual site conditions are not highly unfavorable. Farrar (1999) has an excellent discussion of problems in performing high quality SPT tests. ASTM D6066 (2004) should be followed in performing SPT tests for liquefaction studies.
70
75
80
85
90
95
100
105
110
115
120
15 20 25 30 35 40 45
Liquid Limit
Dry
De
nis
ty,
pc
f
Rollins % collapse > 10%
Rollins % collapse = 5 - 10 %
Highly collapsible
behavior
Less collapsible
behavior
80
85
90
95
100
105
110
115
120
3 4 5 6 7 8 9 10 11 12 13
Water Content, %
Dry
De
nis
ty, p
cf
Collapsible
Zone
Not Collapsible
Zone
Transitional
Zone
0
20
40
60
80
100
0 20 40 60 80 100
Percent of Foundation Intercepted by Cutoff
Perc
en
t R
ed
ucti
on
in
Flo
w, Q
Kh = Kv
Kh = 100 * Kv
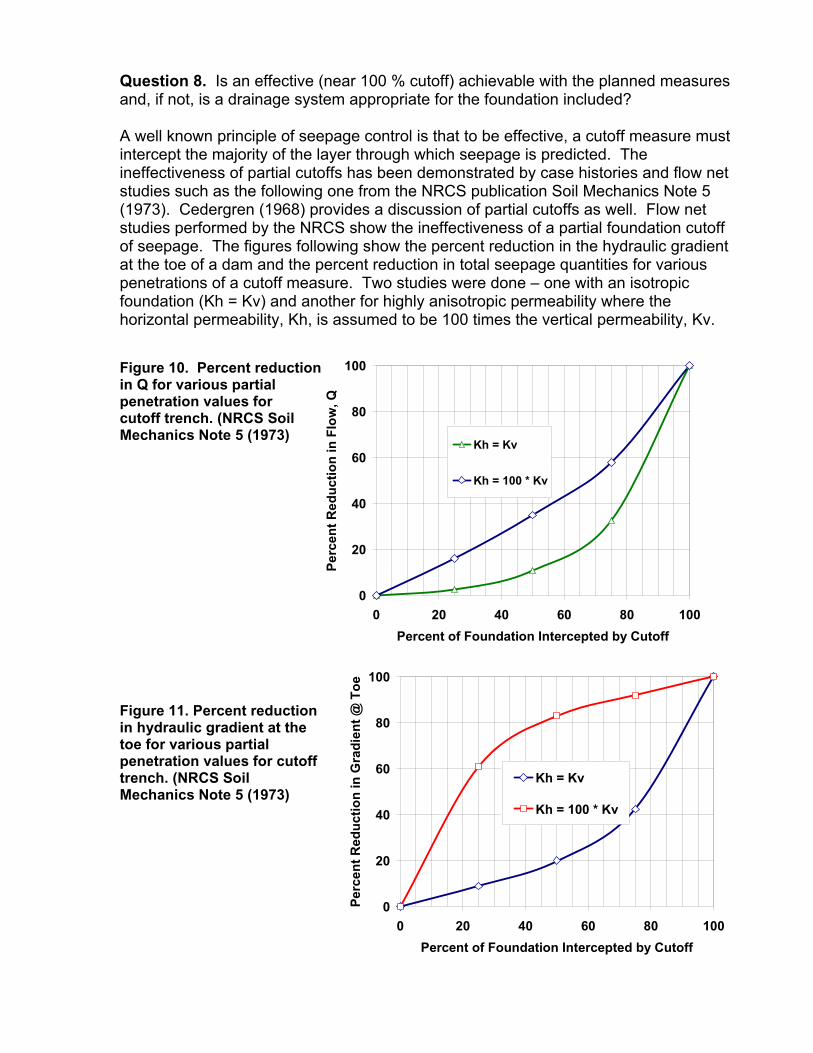
Question 8. Is an effective (near 100 % cutoff) achievable with the planned measures and, if not, is a drainage system appropriate for the foundation included?
A well known principle of seepage control is that to be effective, a cutoff measure must intercept the majority of the layer through which seepage is predicted. The ineffectiveness of partial cutoffs has been demonstrated by case histories and flow net studies such as the following one from the NRCS publication Soil Mechanics Note 5 (1973). Cedergren (1968) provides a discussion of partial cutoffs as well. Flow net studies performed by the NRCS show the ineffectiveness of a partial foundation cutoff of seepage. The figures following show the percent reduction in the hydraulic gradient at the toe of a dam and the percent reduction in total seepage quantities for various penetrations of a cutoff measure. Two studies were done – one with an isotropic foundation (Kh = Kv) and another for highly anisotropic permeability where the horizontal permeability, Kh, is assumed to be 100 times the vertical permeability, Kv.
Figure 10. Percent reduction
in Q for various partial
penetration values for
cutoff trench. (NRCS Soil
Mechanics Note 5 (1973)
Figure 11. Percent reduction
in hydraulic gradient at the
toe for various partial
penetration values for cutoff
trench. (NRCS Soil
Mechanics Note 5 (1973)
0
20
40
60
80
100
0 20 40 60 80 100
Percent of Foundation Intercepted by Cutoff
Perc
en
t R
ed
uc
tio
n in
Gra
die
nt
@ T
oe
Kh = Kv
Kh = 100 * Kv
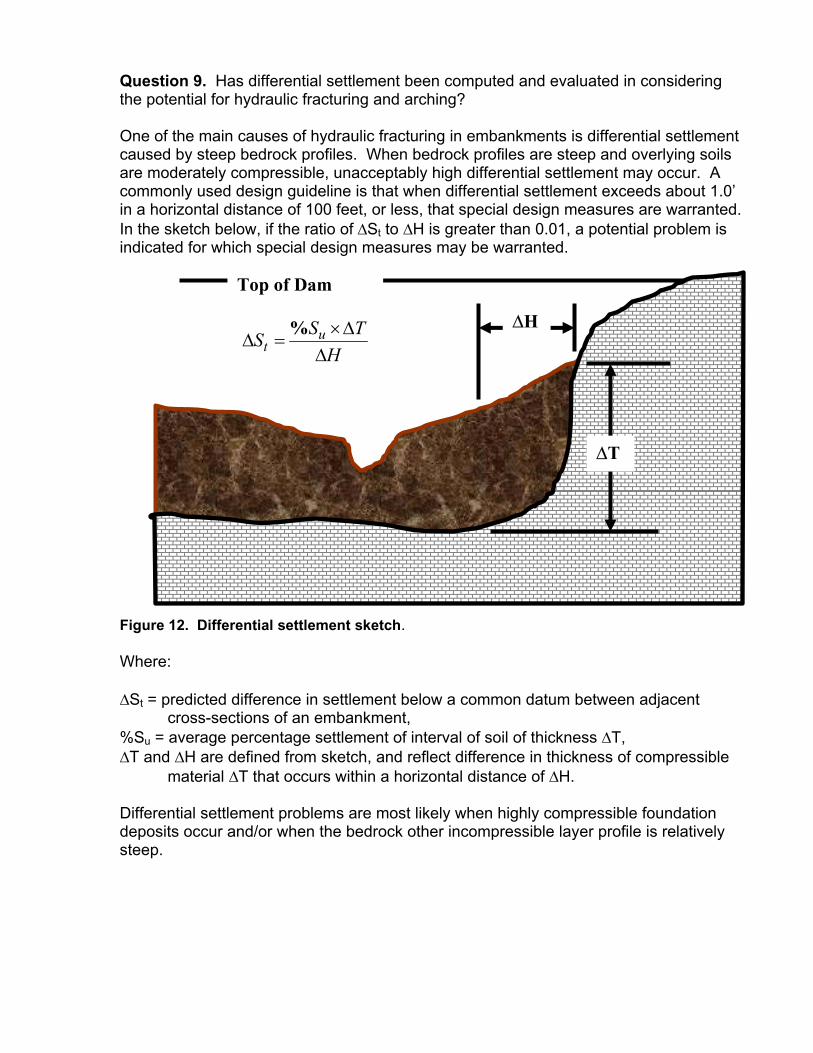
Question 9. Has differential settlement been computed and evaluated in considering the potential for hydraulic fracturing and arching?
One of the main causes of hydraulic fracturing in embankments is differential settlement caused by steep bedrock profiles. When bedrock profiles are steep and overlying soils are moderately compressible, unacceptably high differential settlement may occur. A commonly used design guideline is that when differential settlement exceeds about 1.0’ in a horizontal distance of 100 feet, or less, that special design measures are warranted.In the sketch below, if the ratio of St to H is greater than 0.01, a potential problem is indicated for which special design measures may be warranted.
Figure 12. Differential settlement sketch.
Where:
St = predicted difference in settlement below a common datum between adjacent cross-sections of an embankment,
%Su = average percentage settlement of interval of soil of thickness T,T and H are defined from sketch, and reflect difference in thickness of compressible
material T that occurs within a horizontal distance of H.
Differential settlement problems are most likely when highly compressible foundation deposits occur and/or when the bedrock other incompressible layer profile is relatively steep.
T
H
H
TSS u
t%
Top of Dam

To illustrate with an example, assume that the bedrock surface in Figure 12 changes by a total of 15 feet within a horizontal distance of 50 feet. Assume that the foundation alluvium which is T thick will compress by 4%. Then the total settlement of the Tthickness is 0.04 x 15’ = 0.6’. The differential settlement ratio becomes St ÷ H = 0.6’ ÷ 50’ = 0.012, above that level considered acceptable without special design considerations.
Design considerations could include:
Placing embankment soils at water contents substantially wet of optimum to improve flexibility. For instance, placement water contents could be specified as a minimum of optimum, but an additional requirement that the average placement water content from a series of tests must average two percent above optimum could be added to the specifications.
Including a chimney filter in the embankment, at least across this section of the profile
Shaping bedrock surfaces beneath a portion of the embankment, at least under the core zone of the embankment, could reduce differential settlement
Removing highly compressible foundation soils and replacing them with compacted less compressible soil
Using relatively flat side slopes on any excavations and closure sections that are transverse to the embankment centerline. Recommendations typically are in the range of 3H: 1V to 4H: 1V.
Double Check of Data
Question 10. Do index tests provide consistent characterization of samples?
Designers and reviewers should always check soil mechanics data to ensure that material characterizations are consistent. Shear, consolidation and permeability test results should reflect the basic character of the soils being tested. Commonly used empirical correlations should be examined for soils using basic index data and compared with complex test results. If a designer has performed tests on similar soils in the same physiographic area or geologic formations, that data may also provide valuable correlations to verify reliability of test results. The following examples illustrate several empirical correlations the Author has been found useful.
One example of such a check of data for cohesionless soil types. The method compares saturated water content values from foundation samples to results of SPT tests,. The Author used relationships developed in a study for the Alaska pipeline (Donovan and Singh 1975) to correlate saturated water content to approximate values of relative density. Values of dry density in the study were converted to saturated water content using the relationship between wsat (%) and dry density. Such a chart is useful in cross-checking against predicted values for relative density based on SPT data. When discrepancies occur, one should explore the reason for the discrepancy. Such checks are particularly important when evaluating liquefaction caused by seismicity.
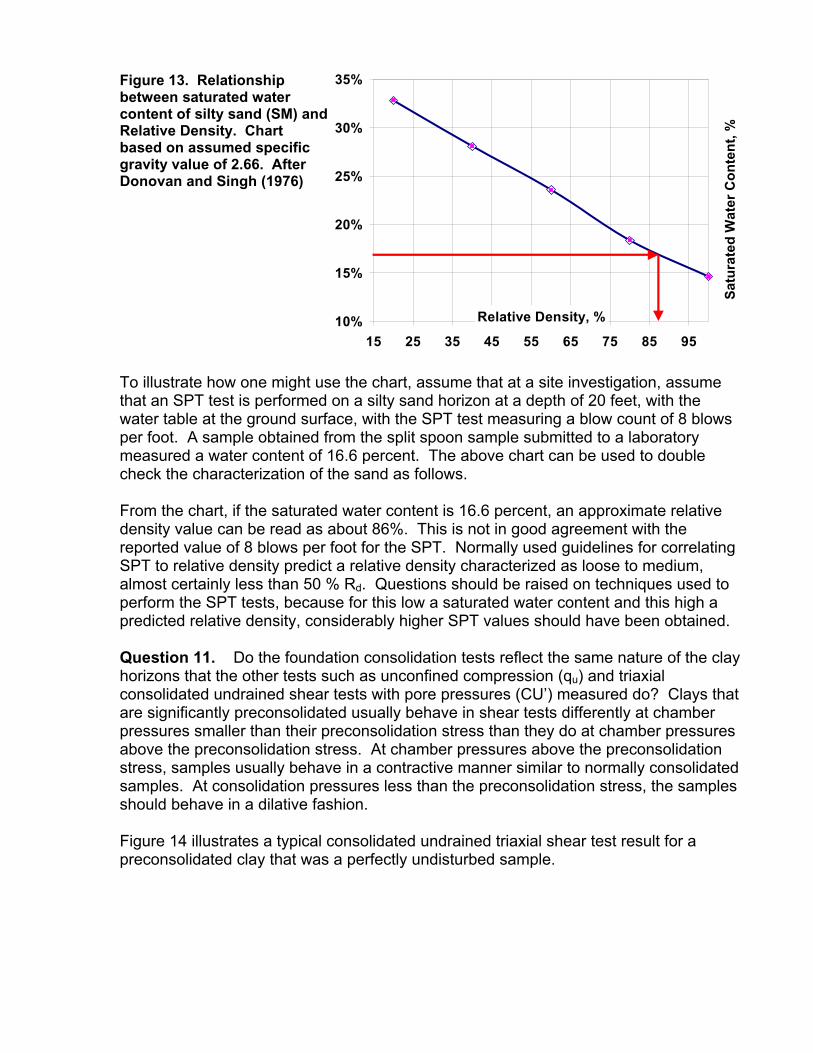
Figure 13. Relationship
between saturated water
content of silty sand (SM) and
Relative Density. Chart
based on assumed specific
gravity value of 2.66. After
Donovan and Singh (1976)
To illustrate how one might use the chart, assume that at a site investigation, assume that an SPT test is performed on a silty sand horizon at a depth of 20 feet, with the water table at the ground surface, with the SPT test measuring a blow count of 8 blows per foot. A sample obtained from the split spoon sample submitted to a laboratory measured a water content of 16.6 percent. The above chart can be used to double check the characterization of the sand as follows.
From the chart, if the saturated water content is 16.6 percent, an approximate relative density value can be read as about 86%. This is not in good agreement with the reported value of 8 blows per foot for the SPT. Normally used guidelines for correlating SPT to relative density predict a relative density characterized as loose to medium, almost certainly less than 50 % Rd. Questions should be raised on techniques used to perform the SPT tests, because for this low a saturated water content and this high a predicted relative density, considerably higher SPT values should have been obtained.
Question 11. Do the foundation consolidation tests reflect the same nature of the clayhorizons that the other tests such as unconfined compression (qu) and triaxial consolidated undrained shear tests with pore pressures (CU’) measured do? Clays that are significantly preconsolidated usually behave in shear tests differently at chamber pressures smaller than their preconsolidation stress than they do at chamber pressures above the preconsolidation stress. At chamber pressures above the preconsolidation stress, samples usually behave in a contractive manner similar to normally consolidated samples. At consolidation pressures less than the preconsolidation stress, the samples should behave in a dilative fashion.
Figure 14 illustrates a typical consolidated undrained triaxial shear test result for a preconsolidated clay that was a perfectly undisturbed sample.
10%
15%
20%
25%
30%
35%
15 25 35 45 55 65 75 85 95
Relative Density, %
Sa
tura
ted
Wa
ter
Co
nte
nt,
%
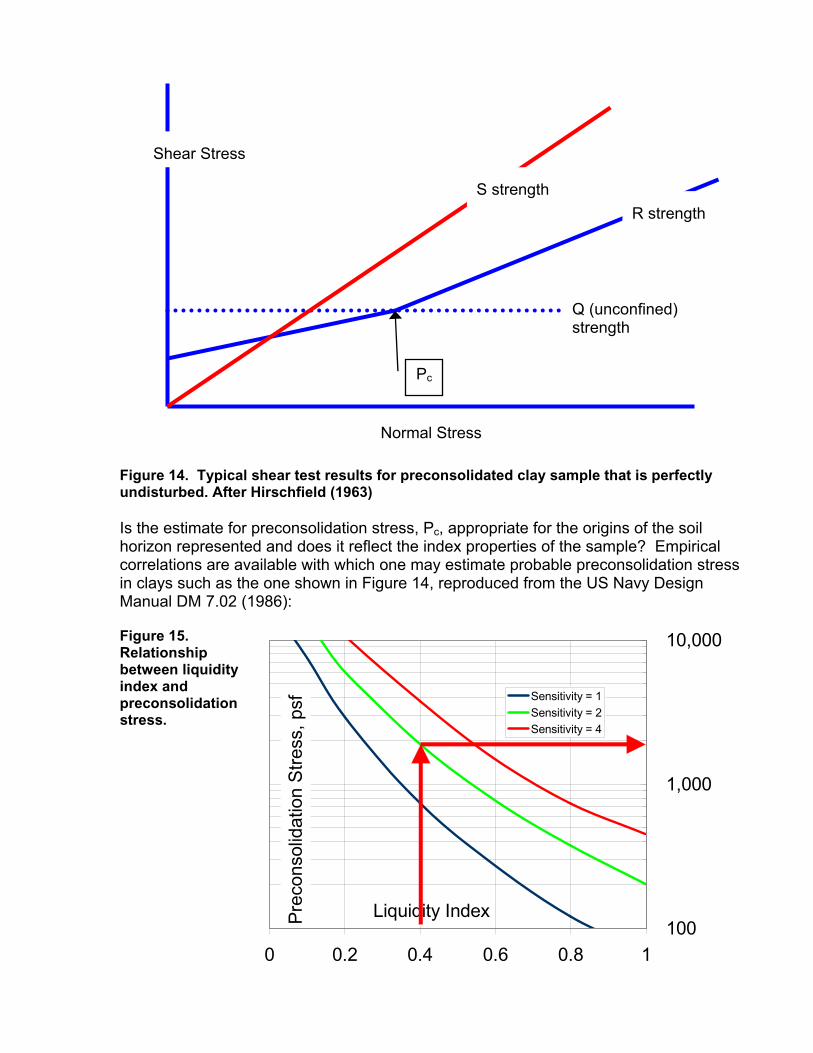
Figure 14. Typical shear test results for preconsolidated clay sample that is perfectly
undisturbed. After Hirschfield (1963)
Is the estimate for preconsolidation stress, Pc, appropriate for the origins of the soil horizon represented and does it reflect the index properties of the sample? Empirical correlations are available with which one may estimate probable preconsolidation stress in clays such as the one shown in Figure 14, reproduced from the US Navy Design Manual DM 7.02 (1986):
Figure 15.
Relationship
between liquidity
index and
preconsolidation
stress.
Shear Stress
Normal Stress
Pc
Q (unconfined) strength
R strength S strength
100
1,000
10,000
0 0.2 0.4 0.6 0.8 1
Liquidity IndexPrec
onso
lidat
ion
Stre
ss, p
sf Sensitivity = 1Sensitivity = 2Sensitivity = 4
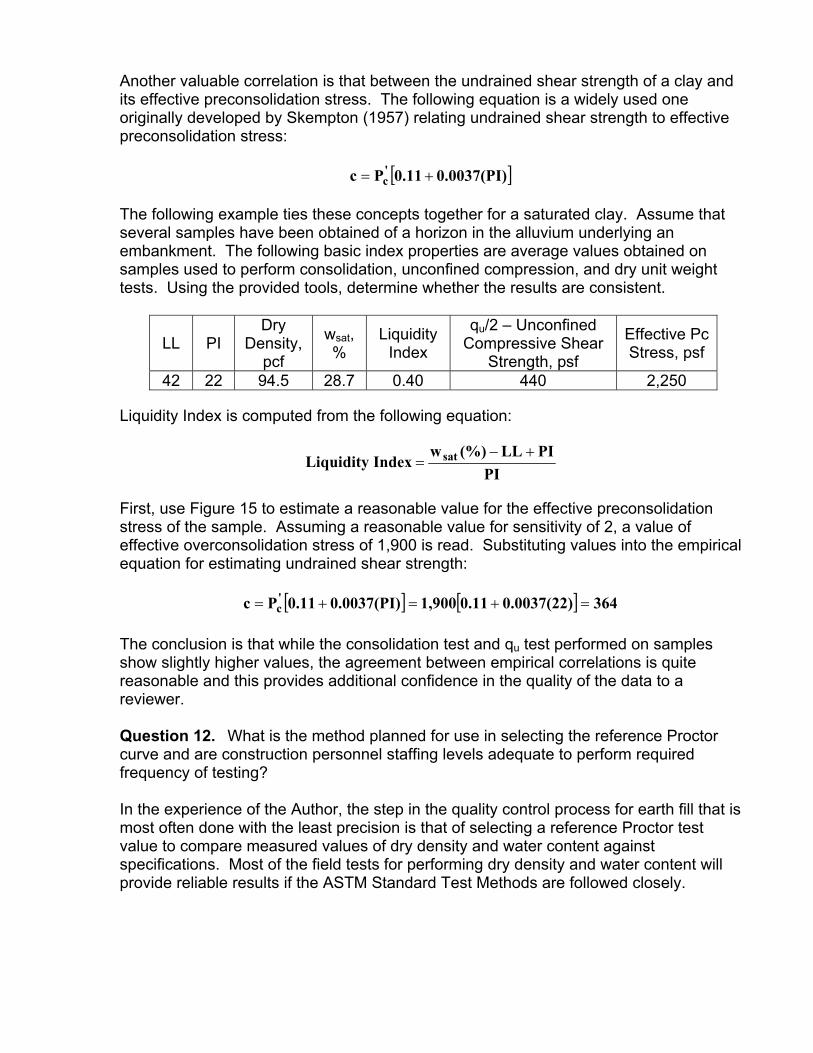
Another valuable correlation is that between the undrained shear strength of a clay and its effective preconsolidation stress. The following equation is a widely used one originally developed by Skempton (1957) relating undrained shear strength to effective preconsolidation stress:
0.0037(PI)0.11Pc 'c
The following example ties these concepts together for a saturated clay. Assume that several samples have been obtained of a horizon in the alluvium underlying an embankment. The following basic index properties are average values obtained on samples used to perform consolidation, unconfined compression, and dry unit weight tests. Using the provided tools, determine whether the results are consistent.
LL PI Dry
Density,pcf
wsat,%
LiquidityIndex
qu/2 – Unconfined Compressive Shear
Strength, psf
Effective Pc Stress, psf
42 22 94.5 28.7 0.40 440 2,250
Liquidity Index is computed from the following equation:
PI
PILL(%)wIndexLiquidity sat
First, use Figure 15 to estimate a reasonable value for the effective preconsolidation stress of the sample. Assuming a reasonable value for sensitivity of 2, a value of effective overconsolidation stress of 1,900 is read. Substituting values into the empirical equation for estimating undrained shear strength:
3640.0037(22)0.111,9000.0037(PI)0.11Pc 'c
The conclusion is that while the consolidation test and qu test performed on samples show slightly higher values, the agreement between empirical correlations is quite reasonable and this provides additional confidence in the quality of the data to a reviewer.
Question 12. What is the method planned for use in selecting the reference Proctor curve and are construction personnel staffing levels adequate to perform required frequency of testing?
In the experience of the Author, the step in the quality control process for earth fill that is most often done with the least precision is that of selecting a reference Proctor test value to compare measured values of dry density and water content against specifications. Most of the field tests for performing dry density and water content will provide reliable results if the ASTM Standard Test Methods are followed closely.
The Author has participated in numerous trials comparing results of nuclear density, sand cone, rubber balloon, drive cylinder, and clod density tests on a uniform compacted fill. All of the tests produce consistent, equivalent values when carefully performed by trained personnel who follow all the precautions in the ASTM’s. The most important of these precautions is unquestionably the step of calibrating nuclear meter water contents to oven dry water contents for each soil type being used in a fill.Uncorrected, the nuclear meter water content can be 6% or even more, above the oven dry water content for plastic clay soils. Some soils may have a positive rather than negative water content correction.
The various methods that may be used for selecting a reference Proctor test include:
“jar” method – the reference Proctor is estimated from a comparison of previous tests run at a site, using color and plasticity for parameters. This is the least reliable yet most frequently used method.
The one-point Proctor and Family of Curves method. This method is widely used by many state DOT’s in highway work and used moderately by earth dam QC personnel. An ASTM is not currently available. This is an excellent, quick method at sites where a family of curves can be developed specific to the site.
The Rapid 3-point method. This method, developed by the Bureau of Reclamation for use at remote sites with no access to power, is an excellent tool in the hands of highly experienced and trained personnel. It is not a tool for casual users with little experience.
The ultimate method for determining a reference Proctor test is actually performing a full ASTM D698 test at the location the field measurement of density and water content is made. Because of the time and costs associated with this method, it is seldom used except for very important projects.
Critical Questions in Reviewing Shear Strength Testing
Question 13. Were all three triaxial specimens the correct dimensions and of the same type of soil?
Unless multistage testing is used, performing triaxial shear tests on undisturbed samples requires obtaining 3 samples, each of which must have a height that is 2.1 times its diameter. Because many geotechnical investigations routinely collect 2-7/8” diameter Shelby tube samples, this means that the height of each specimen must be about 6 inches. One must evaluate whether the samples collected from a particular horizon allow preparation of 3 samples each 6-inches long for the test, as this would total 18-inches of the same soil. As a minimum, reviewers should require that a gradation, water content determination and dry unit weight measurement be provided for each of the 3 specimens used in a triaxial test on an undisturbed specimen.Requiring separate gradations would be unnecessary for remolded samples. Because of these problems, many firms use a multi-stage technique for performing shear tests. This method allows a test to be performed on a single specimen at 3 different confining pressures. Multistage testing is not usually permitted in NRCS contracts for design of earthen embankments because defining failure for each stage of the test is difficult.

Question 14. Was a sufficient backpressure used to saturate the sample?
Triaxial shear testing both for undisturbed and remolded samples often is performed on saturated samples to provide the lowest or most conservative estimate of shear strength. The accepted practice to obtain saturated samples is to employ backpressure saturation techniques. This technique employs water that has been de-aired by one of several acceptable methods. The de-aired water is applied under pressure to both ends of the triaxial specimens which results in dissolving the air in the sample according to Henry’s law. The Corps of Engineers (1986) states the following equation that expresses the relationship between the variables involved: Where:
u0 = Backpressure required to achieve final degree of saturation Sf S0 = Initial degree of saturation of molded or undisturbed specimen Sf = Final degree of saturation goal (usually at least 98) H = Henry’s constant, assumed equal to 0.018
This equation is shown graphically in the following figure.
Required Back Pressure to Achieve
Given Degree of Saturation
25
45
65
85
105
125
145
165
50 60 70 80 90
Initial Degree of Saturation, (%)
Requir
ed B
ackpre
ssure
, psi
Sf = 95%
Sf = 96 %
Sf = 97 %
Sf = 98 %
Sf = 99 %
Sf = 100 %
Figure 16. Backpressure required to achieve given final degree of saturation for given
initial degree of saturation. After USACE (1986)
11100
1100714 0
0fSH
SHu .
Too often, laboratories rely solely on measurement of the “B” parameter, which is allowed in the ASTM test procedure, to demonstrate saturation rather than using this valuable chart. Many tests reviewed by the Author have used back pressures as low as 40 psi for samples that are initially at a degree of saturation of 80 percent. Using the chart above, the highest achievable degree of saturation in this example would be about 96%. To avoid this problem, the practice of NRCS laboratories is to mold most shear test specimens at about 90 percent saturation and employ a backpressure of 100 psi. If you consider that a cell pressure may need to be 40 psi above the minimum backpressure, backpressure is limited to about 100 psi because commonly used air compressors only develop sustained pressures of about 150 psi. Undisturbed samples that are at a low degree of initial saturation must be backpressured using nitrogen tanks and special triaxial cells that allow very high backpressures, or they must be soaked prior to backpressuring them to achieve a higher initial degree of saturation.
Question 15. Was the speed used for shearing slow enough to allow equalization of pore pressures at the end of the sample?
Triaxial CU’ shear tests are most commonly used to determine shear strength parameters for slope stability analyses. The test allows interpretation of both total stress and effective stress parameters on saturated clay soils. To ensure correct measurement of pore pressures at the ends of the specimens, tests must be performed slowly enough that pore pressures generated by loading in the middle of the specimen are the same as those measured at the ends of the specimens. Complex calculations may be made to determine rate of loading, but years of testing experience in NRCS laboratories has led those engineers to consider the following rules of thumb sufficient to achieve this goal. For soils with even relatively low values of permeability, if side filter drain strips are used, a strain rate of less than about 0.05 % strain per minute is sufficiently slow to ensure pore pressure equalization. The USACE laboratory testing manual (1970) recommends a time to failure of no less than 2 hours. For samples that fail at 15 % strain, this strain rate would be 0.125% per minute.
Question 16. Did the end of test water content reflect a consolidated dry density commensurate with the initial conditions and the cell pressure used for consolidation?
A triaxial test involves a series of steps in preparing a sample for testing. Changes in the soils properties are likely in each step of the process, and unless testing personnel are aware, the final test condition of the sample may not be the same as the initial condition. The most common variations occur in the Author’s experience in the backpressure saturation procedure. Frequently, more plastic clay soils undergo significant swell during backpressure. This results in a lower density sample than assumed. The Author routinely recommends measuring the final water content of each triaxial specimen to determine whether this may have occurred. The following steps should be followed to use final water content to evaluate this possibility.
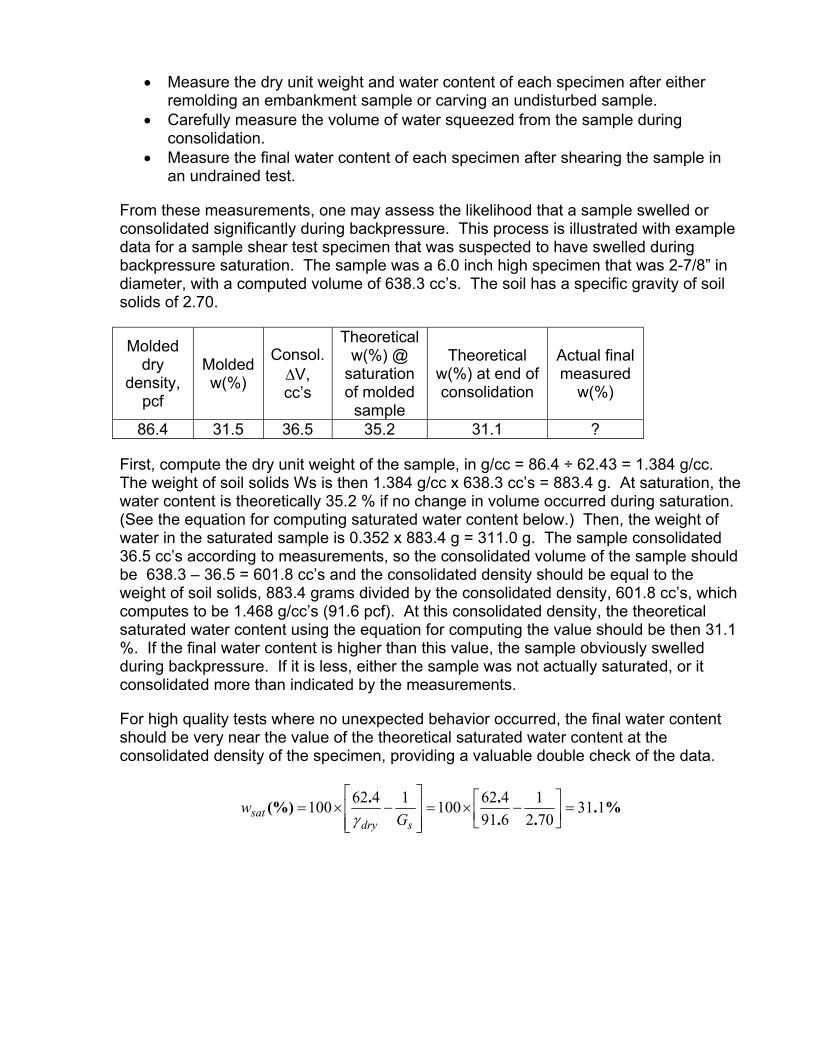
Measure the dry unit weight and water content of each specimen after either remolding an embankment sample or carving an undisturbed sample.
Carefully measure the volume of water squeezed from the sample during consolidation.
Measure the final water content of each specimen after shearing the sample in an undrained test.
From these measurements, one may assess the likelihood that a sample swelled or consolidated significantly during backpressure. This process is illustrated with example data for a sample shear test specimen that was suspected to have swelled during backpressure saturation. The sample was a 6.0 inch high specimen that was 2-7/8” in diameter, with a computed volume of 638.3 cc’s. The soil has a specific gravity of soil solids of 2.70.
Moldeddry
density,pcf
Moldedw(%)
Consol.V,
cc’s
Theoreticalw(%) @
saturationof molded
sample
Theoreticalw(%) at end of consolidation
Actual final measured
w(%)
86.4 31.5 36.5 35.2 31.1 ?
First, compute the dry unit weight of the sample, in g/cc = 86.4 ÷ 62.43 = 1.384 g/cc.The weight of soil solids Ws is then 1.384 g/cc x 638.3 cc’s = 883.4 g. At saturation, the water content is theoretically 35.2 % if no change in volume occurred during saturation. (See the equation for computing saturated water content below.) Then, the weight of water in the saturated sample is 0.352 x 883.4 g = 311.0 g. The sample consolidated 36.5 cc’s according to measurements, so the consolidated volume of the sample should be 638.3 – 36.5 = 601.8 cc’s and the consolidated density should be equal to the weight of soil solids, 883.4 grams divided by the consolidated density, 601.8 cc’s, which computes to be 1.468 g/cc’s (91.6 pcf). At this consolidated density, the theoretical saturated water content using the equation for computing the value should be then 31.1 %. If the final water content is higher than this value, the sample obviously swelled during backpressure. If it is less, either the sample was not actually saturated, or it consolidated more than indicated by the measurements.
For high quality tests where no unexpected behavior occurred, the final water content should be very near the value of the theoretical saturated water content at the consolidated density of the specimen, providing a valuable double check of the data.
%...
..(%) 131
7021
691462
1001462
100sdry
sat Gw
Question 17. Were the appropriate types of tests run for each soil in the model for each condition in the slope stability analyses?
Were tests performed to allow evaluation of the end of construction condition if this condition is likely to be a critical one? The most critical condition for an earth dam on a clay foundation is likely to be that during construction, also termed the end of construction condition. While a failure of this type probably will not result in loss of stored reservoir water, the economic implications can be significant. The Author has observed many designs where this condition was overlooked in analyses in favor of performing long term strength tests exclusively. Where the end of construction condition may be critical (medium to soft clays in the foundation), either a large number of extra undisturbed samples should be obtained, or preferably, an extensive cone penetration and vane shear testing program should be undertaken.
In the Author’s experience, soils in the foundation of low to moderate sized earthen dams that have a liquidity index value greater than 0.5 should always be investigated for this condition of stability. Downstream steady seepage and upstream drawdown conditions are other conditions normally analyzed by procedures such as those in the USACE manual on slope stability (USACE 2005)
Instrumentation
Question 18. Have critical readings been established for all installed instruments?Critical or “alarm level” trigger a notification to responsible officials who can then determine whether additional study or remedial measures may be required?
An instrumentation plan should clearly describe the type of each instrument, details on its location, and a clearly stated purpose for installing the instrument. The plan should identify the frequency of recording data, clearly define the procedure to be used for recording and plotting the data, and a clearly defined “alarm level”. In some cases, a single alarm level may not be appropriate, but the alarm level could be defined in terms of trends or deviations from a pattern. In addition to establishing alarm levels, the instrumentation plan should include clear directions for field personnel to follow when alarm readings or an unusual pattern occurs. An example check list is shown as an attachment to this paper.
Guidance on “alarm level” readings should be accompanied by instructions to consider significant deviations between successive readings. When conditions such as reservoir levels have not changed drastically since the last reading, large changes in piezometric levels or other instrumented readings should be cause for investigation, even if the levels are far below established “alarm level” readings. Such deviations are often attributable to errors in reading the instruments or malfunctions in the equipment. However, they may be attributable to changes in performance in the structure that requires investigation before critical behavior occurs.
Question 19. Has an appropriate safety factor been used for evaluating uplift pressures at a site with a clay blanket/aquifer situation?
When artesian pressures are recorded during filling of the reservoir or during flood stages after the reservoir has been in operation, a design must contain clear guidance on what is regarded as excessive uplift pressures for each point at which the pressures are being measured. Critical conditions may be defined in terms of a minimum acceptable safety factor or in terms of a maximum gradient. McCook (2007) describes methods for computing these terms and discusses appropriate values. The Corps of Engineers is currently re-examining their criteria related to acceptable uplift safety factors and gradients.
Question 20. Has a filling plan been prepared that clearly identifies the responsibility and the duties of each party while the reservoir is filling?
Many studies of embankment failures have shown that a large percentage of failures of earth embankments occur during first filling of the reservoir. Consequently, special attention is warranted to this period. A filling plan should be prepared for most high and significant hazard dams, even if State and Federal regulations do not require them.
A filling plan usually specifies an acceptable rate at which a reservoir may be filled safely. It also includes detailed inspection requirements. The filling plan may include an instrumentation plan, but visual observations probably are more important, especially if a limited number, or no instruments are included in the design. The Author is aware of a site that failed recently where local inexperienced observers, recreational users of the site, observed muddy water discharging at the base of a dam while it was being filled initially after construction, but no alarms were raised with responsible officials. The site did not include a filling plan with clearly identified responsible trained observers, with observational duties and frequency of observations defined. Attachments to this paper are examples of inspection reports that are typically included as part of a filling plan.
Summary
Designers of earth fill projects rely on geotechnical specialists to provide quality field and laboratory testing parameters and analyses to ensure a final product that meets all regulatory and generally accepted state-of-practice designs. However, the lack of codification in practice allows many items to slip past reviews and checks. By using a checklist of critical items, reviewers should be able to do a more credible job of ensuring quality designs are approved.
Reviewers should be aware that their job is not complete until the dam is constructed and past the first filling critical stage in its life. By ensuring that adequate inspection programs are in place, the probability of the long term success of the project is improved.

References
1. American Society for Testing Materials, ASTM D6066, “Standard Practice for Determining the Normalized Penetration Resistance of Sands for Evaluation of Liquefaction Potential,” 2004.
2. Cedergren, Harry. “Seepage Control in Earth Dams,” Casagrande Memorial Volume, edited by Steve Poulos, pp.21-45. John Wiley and Sons, 1973.
3. Cedergren, Harry. Seepage, Drainage, and Flow Nets. John Wiley and Sons. 1968.
4. Donovan, N.C. and Sukhmander Singh, “Liquefaction Criteria for the Trans-Alaska Pipeline”, ASCE Symposium on Liquefaction Problems in Geotechnical Engineering, Philadelphia, PA. 1976. pp. 139-168.
5. Farrar, Jeff, U.S. Bureau of Reclamation, “Standard Penetration Test Driller’s/Operator’s Guide,” DSO-98-17. Earth Sciences and Research Laboratory, May 1999.
6. Federal Emergency Management Administration. “Technical Manual: Conduits through Embankment Dams,” FEMA 484 CD and FEMA 484DVD. 2005.
7. Federal Highway Administration, Offices of Research and Development. Volume 1, FHWA No. RD-75-61, “Survey of Problem Areas and Current Practices,”1975.
8. Federal Highway Administration, Offices of Research and Development. Volume 2, FHWA No. RD-75-62, “Evaluation and Remedial Treatment of Shale Embankments,” 1975.
9. Federal Highway Administration, Offices of Research and Development. Volume 3, FHWA No. RD-77-1, “Slaking Indexes for Design,” 1977.
10. Federal Highway Administration, Offices of Research and Development. Volume 4, FHWA No. RD-78-140, “Field and Laboratory Investigations, Phase III,” 1975.
11. Federal Highway Administration, Offices of Research and Development. Volume 54, FHWA No. RD-78-141, “Technical Guidelines,” December, 1978.
12. Gibbs, Harold J. and John P. Bara. “Stability Problems of Collapsing Soils,” Journal Soil Mechanics and Foundations Division, ASCE, Vol. 93, No. SM 4, July, 1967, pp. 577-594.
13. Hirschfeld, Ronald, “Stress-Deformation and Strength Characteristics of Soils,”Harvard University, 1963, Treatise (Unpublished).

14. Hirschfeld, Ronald, “Design, Construction, and Inspection of Embankment Dams to Reduce the Risk of Piping”, Seepage, Piping and Remedial Measures Interagency Committee on Dam Safety (ICODS) article, March 23-24, 1995
15. McCook, Danny K., “A Discussion of Uplift Computations for Embankments and Levees,” The Journal of Dam Safety, Association of State Dam Safety Officials. Winter, 2007, pp. 30-39.
16. McCook, Danny K., “A Discussion of Uplift Computations for Embankments and Levees, ASDSO Western Regional Seminar, Kansas City, KS, 2006.
17. Rollins, Kyle M, et al, “Identification, Characterization, and Mapping of Collapsible Soils in Southwestern Utah,” Utah Geologic Association Publication 21, Engineering and Environmental Geology of Southwestern Utah, edited by Kyle Rollins, 1992
18. Sherard, J.L., Richard Woodward, Stanley Gizienski, and William Clevenger. Earth and Earth-Rock Dams. John Wiley and Sons. 1963.
19. Sherard, J.L., “Hydraulic Fracturing in Embankment Dams,” American Society of Civil Engineering, Journal of Geotechnical Engineering, Vol. 112, No. 10, October, 1986, pp. 905-927
20. J.L. Sherard, lecture on ““Debatable Trends in Embankment Engineering,” Presentation to the A.S.C.E. National Capital Section Geotechnical Committee Seminar on Lessons Learned from Geotechnical Failures, February 3, 1984.
21. Skempton, A.W., Proceedings of the Institution of Civil Engineers, Volume 7, 1957. pp. 305-307. London
22. U.S. Army Corps of Engineers EM 1110 2 2300 (2004), General Design and Construction Considerations for Earth and Rock-Fill Dams,
23. U.S. Army Corps of Engineers, Engineering Manual EM 1110-2-2301, Test Quarries and Test Fills, September, 1994.
24. U.S. Army Corps of Engineers, Engineering Manual EM 1110-2-1902, SlopeStability, October, 2003..
25. U.S. Department of Agriculture, Soil Conservation Service, Soil Mechanics Note 5, Flow Net Construction and Use,” 1973.
26. U.S. Navy, Naval Facilities Engineering Command, Design Manual DM 7.02, Foundations & Earth Structures. 1986.