Embed Size (px)
Citation preview
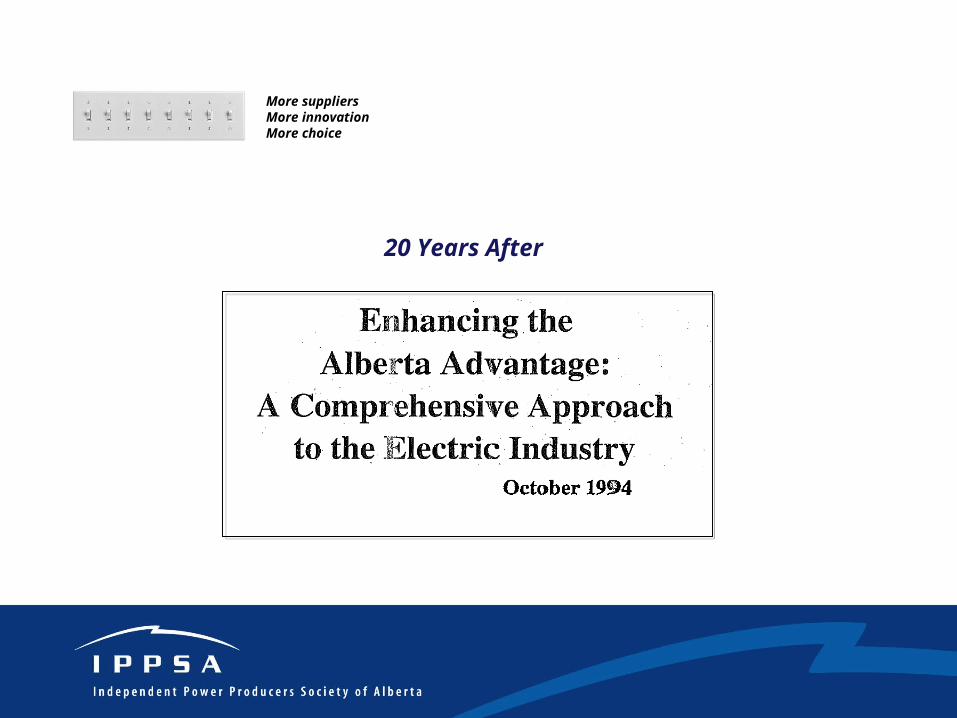
20 Years After
More suppliersMore innovation More choice
Overview
• Twenty years ago Enhancing the Alberta Advantage was issued.
• This was the Department of Energy’s white paper that kicked off our market’s restructuring. The paper states,
• The following takes a number of forecasts and data points of Alberta’s power industry from 1994 and compares them to how our market’s history has actually evolved. ..
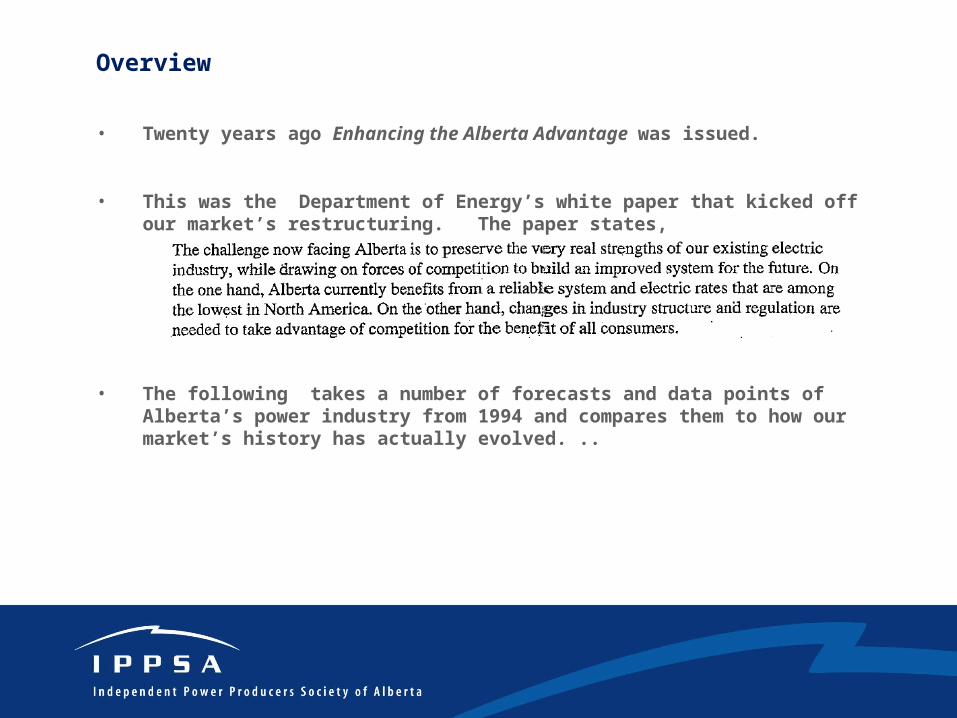
1) The Supply and Demand Forecast
• Page 13 of the 1994 white paper provided this snapshot of Alberta’s supply/demand forecast:
• In 1994, Alberta had 7000 MW of supply and was expected to hit 10,000 MW of demand in 2022
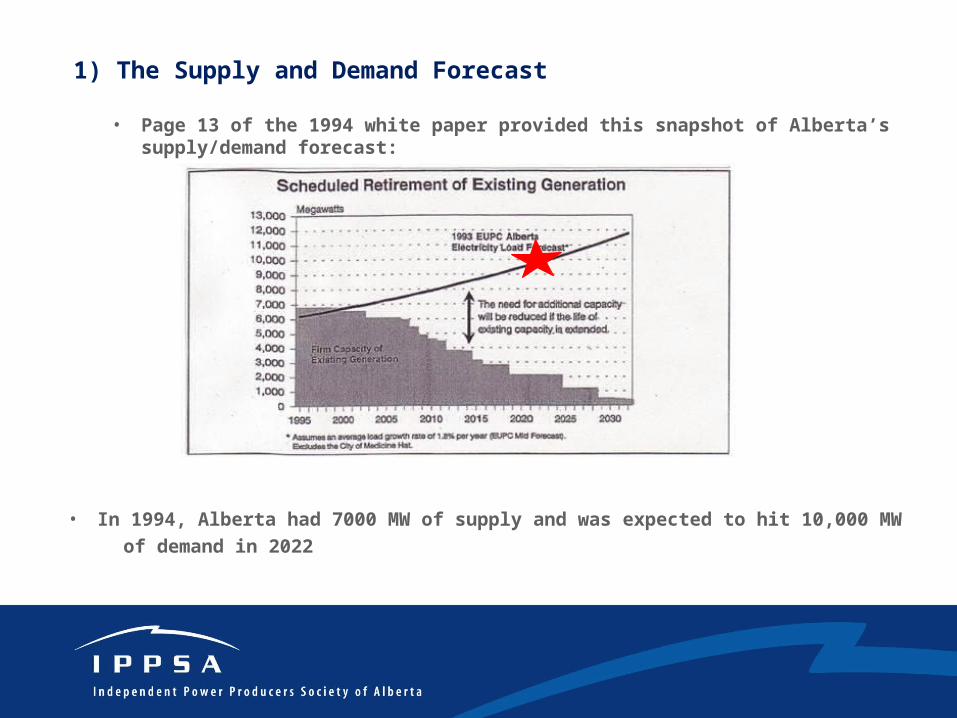
1) The Supply and Demand Forecast
• In reality, demand hit 9900 MW in winter of 2009, or 13 years ahead of the forecast.
• Today, Alberta has 15,877 MW of supply, or more than twice what we had in 1995. • We’ve added 9000 MW - or 2.5 ‘SaskPowers’ - in 20 years. • Demand growth has averaged almost twice the 1.8% estimated in 1994.

BC Hydro ratepayers on hook for $750 million Powerex settlement- Commonsense Canadian, 17 August 2013
BC Hydro ratepayers on hook for $750 million Powerex settlement- Commonsense Canadian, 17 August 2013
2) Competition has Shifted Investment Risk to Developers
• In Alberta’s open market, developers take investment risk. This drives efficiency. This efficiency is reflected in lower offers in the energy market and a downward pressure on prices. It also leads to the retirement of inefficient supply.
• As a result of this shift of investment risk, Alberta has been a rapid adopter of efficient generation as evidenced by our cogen volumes, large-scale wind turbines, and supercritical coal plants.
• Furthermore, developers no longer have recourse to consumers to backstop their investments, which is function of regulated regimes…
Ontario electricity consumers on the hook for power plant construction
The Globe and Mail, Monday 24th September, 2012
Ontario electricity consumers on the hook for power plant construction
The Globe and Mail, Monday 24th September, 2012

Comparing the generation market of 1994 to 2014 demonstrates the significant decontrol of generation that has occurred and the introduction of new entrants.
3) Introducing Competition and New Generation Entrants
Source: MSA
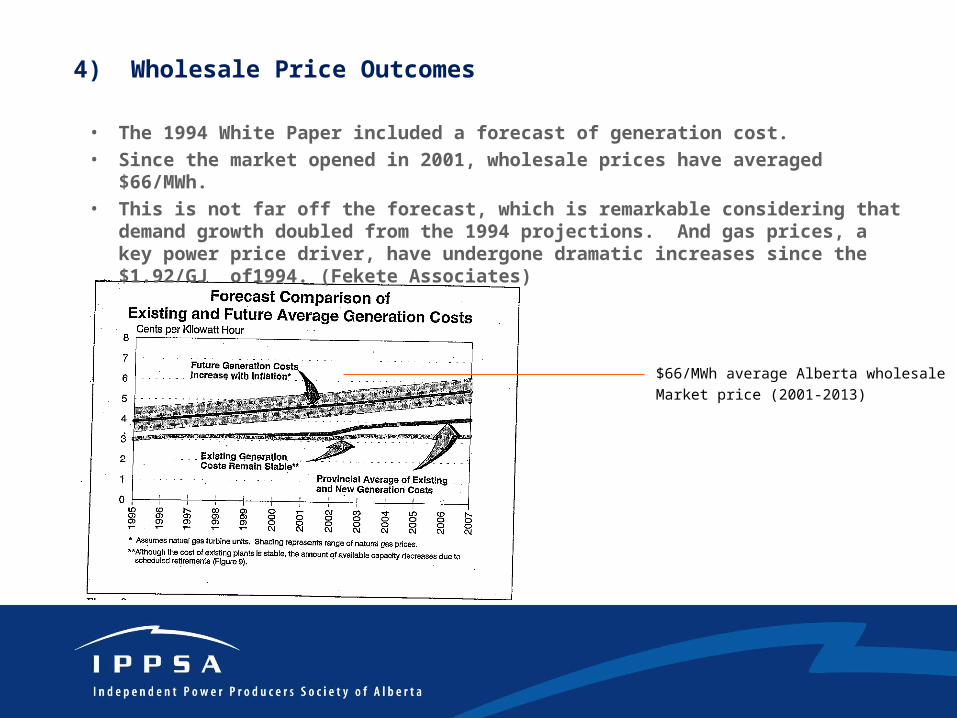
4) Wholesale Price Outcomes
• The 1994 White Paper included a forecast of generation cost. • Since the market opened in 2001, wholesale prices have averaged
$66/MWh.• This is not far off the forecast, which is remarkable considering that
demand growth doubled from the 1994 projections. And gas prices, a key power price driver, have undergone dramatic increases since the $1.92/GJ of1994. (Fekete Associates)
$66/MWh average Alberta wholesaleMarket price (2001-2013)

$0
$20
$40
$60
$80
$100
$120
$140
$160
$180
CTSimple Cycle
CCGT Combined Cycle
Cogeneration with Surplus
Power
Subcritical Coal Brownfield Supercritical
Coal
Mid Sized Hydroelectric
Large Scale Wind Power
Advanced Nuclear
45% CF 75% CF 85% CF 90% CF 90% CF 67% CF 35% CF 90% CF
30-Year Life 30-Year Life 30-Year Life 40-Year Life 40-Year Life 40-Year Life 20-Year Life 40-Year Life
$/M
Wh
(201
1$)
Levelized Unit Costs (exlcuding GHG Compliance Costs)EDCA - Q3-2011 Quarterly Forecast Update
Capital Fuel Var O&M Fx O&M G&A Property Tax Transmission Tariffs
Capital Structure of 60/40 with D&E costs of 7% and 15%, respectively. Construction start date of 2011. Average natrual gas price pf $4.57/GJ (2011$).
Comparative Levelized Costs (2013-2027, using EDCA Q1, 2013 Report Assumptions)
Source: EDC Associates
$55/MWh YTD prices
4) Wholesale Price Outcomes
• Today, Alberta’s market is extremely competitive• 2014 pricing is below the levelized cost of all new power supply, except
cogen.

Host of Industry Issues
2013 Residential Electricity Rates by Province
5) Alberta’s Residential Compared to Other Provinces
Source: London Economics Int, 2014
• Page 5 of the White Paper shows that Alberta’s and Canada’s residential rates were ~ ¢10/Kwh.
• Twenty years later, Alberta remains in close proximity to the national average, even as supply has more than doubled, and gas prices have risen dramatically.

6) Providing Choice to Consumers in Managing Price
• Page 3 of the White Paper promoted customer choice as a policy goal.
• Today, Alberta consumers can choose fixed-priced contracts, flow-through contracts, dual fuel contracts (gas & power), green power or on-site generation. (Recently, ENMAX added its100th residential solar system)
• The following shows the percentage of Albertans who have exercised choice:
Source: UCA
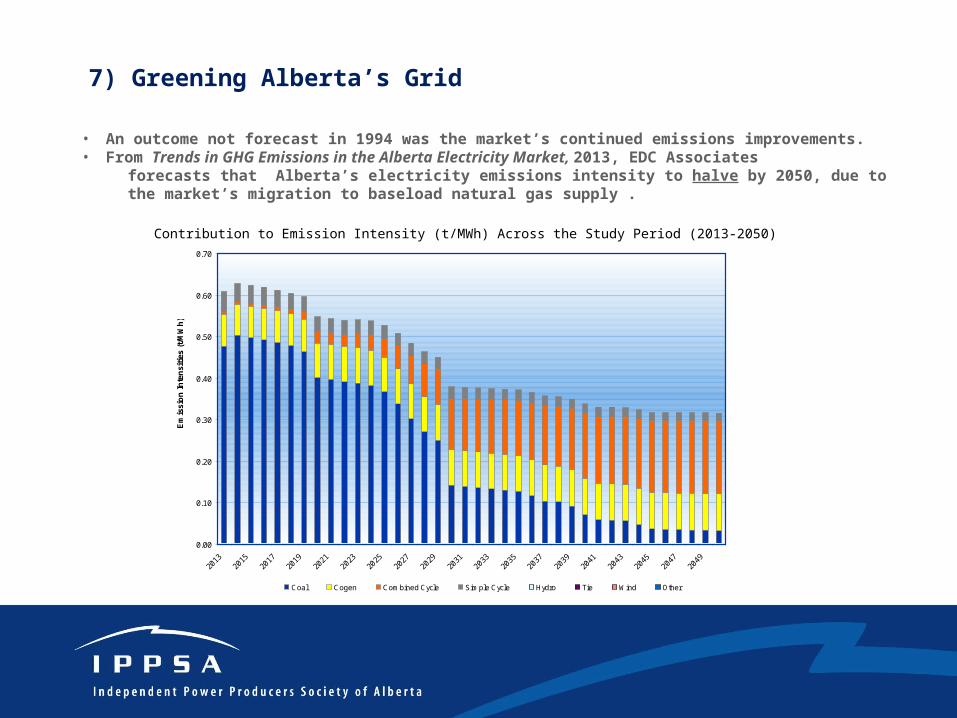
• An outcome not forecast in 1994 was the market’s continued emissions improvements.• From Trends in GHG Emissions in the Alberta Electricity Market, 2013, EDC Associates forecasts that Alberta’s electricity emissions intensity to halve by 2050, due to the market’s migration to baseload natural gas supply .
0.00
0.10
0.20
0.30
0.40
0.50
0.60
0.70
2013
2015
2017
2019
2021
2023
2025
2027
2029
2031
2033
2035
2037
2039
2041
2043
2045
2047
2049
Em
issi
on
In
ten
siti
es (
t/M
Wh
)
Coal Cogen Combined Cycle Simple Cycle Hydro Tie Wind Other
Contribution to Emission Intensity (t/MWh) Across the Study Period (2013-2050)
7) Greening Alberta’s Grid

• Tonnage of CO2 emitted is set to fall from 2013 to 2030. • Tonnage is forecast to rise from 2030 to 2050 by 7%, even as fleet
increases by 100%. Should gas turbine technology continue to improve, or Alberta’s demand slow, tonnage of power sector emissions could even fall by 2050 from 2013 levels.
0
10
20
30
40
50
60
70
Mt
Emissions Pattern (Mt) Delayed 30 Years
$0/t $15/t $30/t $60/t
Total Emissions (t) (2013-2050)
7) Greening Alberta’s Grid
•Source: EDC Associates Ltd.
Conclusion
• Who could have imagined how Alberta’s power market would evolve in the 20 years since Enhancing the Alberta Advantage was first issued?
• Yes, the authors missed ENRON, and gas prices rising from $2 to $12 and plummeting back to $2 and everything in between, and Alberta’s protracted, unparalleled economic boom, and landowner transmission backlash, and Bill 50, and climate change policy… But some of the document’s original goals of introducing competition and choice have been achieved.
• Evaluating the merits of the market’s 20-year evolution from the white paper should be based on the facts of what the market has produced. IPPSA hopes the preceding has provided some context for that review.