Embed Size (px)
Citation preview
®
Dechra Pharmaceuticals PLC Annual Results Presentation 2017
20 years of strategic growth
Dechra Presentation Singles.indd 1 31/08/2017 12:41:50
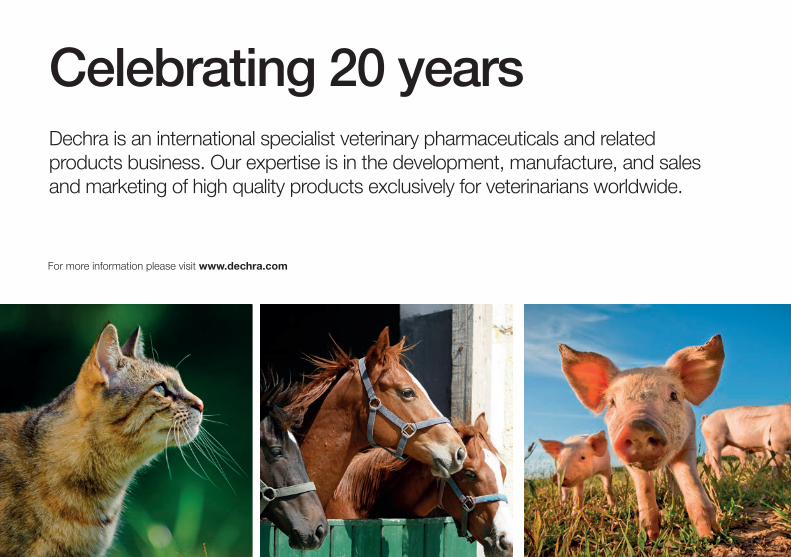
Celebrating 20 yearsDechra is an international specialist veterinary pharmaceuticals and related products business. Our expertise is in the development, manufacture, and sales and marketing of high quality products exclusively for veterinarians worldwide.
For more information please visit www.dechra.com
Dechra Presentation Singles.indd 2 31/08/2017 12:41:56
®
3
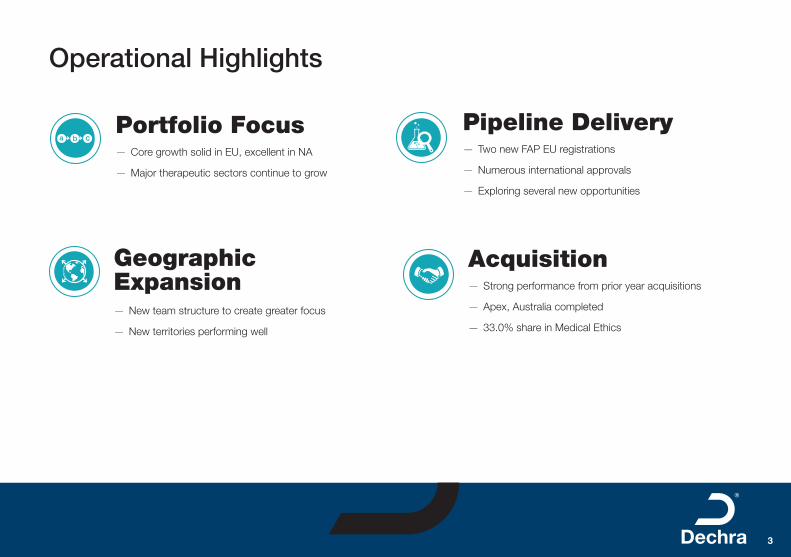
Operational Highlights
Pipeline Delivery
Geographic Expansion
— Two new FAP EU registrations
— Numerous international approvals
— Exploring several new opportunities
— New team structure to create greater focus
— New territories performing well
Portfolio Focus — Core growth solid in EU, excellent in NA
— Major therapeutic sectors continue to grow
a b c
Acquisition — Strong performance from prior year acquisitions
— Apex, Australia completed
— 33.0% share in Medical Ethics
Dechra Presentation Singles.indd 3 31/08/2017 12:41:57
®
4
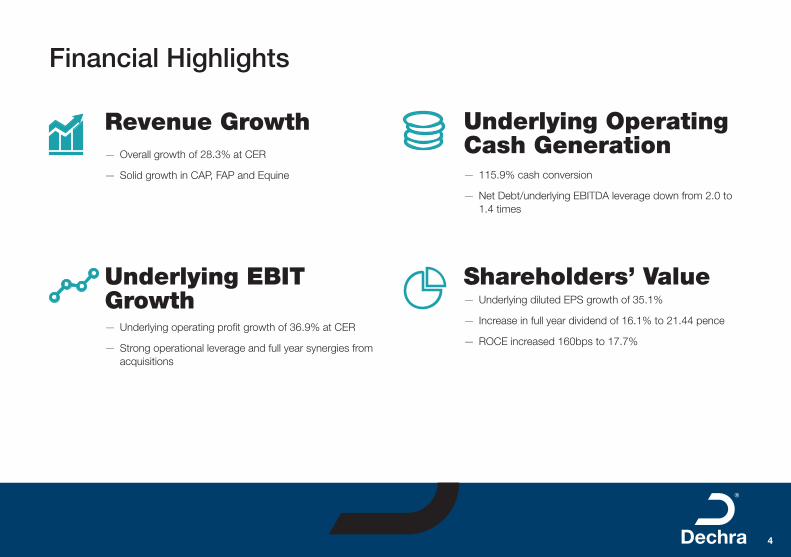
Financial Highlights
Revenue Growth Underlying Operating Cash Generation
Underlying EBIT Growth
Shareholders’ Value
— Overall growth of 28.3% at CER
— Solid growth in CAP, FAP and Equine — 115.9% cash conversion
— Net Debt/underlying EBITDA leverage down from 2.0 to 1.4 times
— Underlying operating profit growth of 36.9% at CER
— Strong operational leverage and full year synergies from acquisitions
— Underlying diluted EPS growth of 35.1%
— Increase in full year dividend of 16.1% to 21.44 pence
— ROCE increased 160bps to 17.7%
Dechra Presentation Singles.indd 4 31/08/2017 12:41:57
®
5
Our Strategy
To continue to develop our position as an international, high margin, cash generative, veterinary pharmaceuticals and related products business with a clear focus on key therapeutic areas:
— Endocrinology
— Dermatology
— Ophthalmology
— Equine medicine
— Anaesthesia and analgesia
— Cardiovascular disease
— Food producing animal antibiotics
— Poultry vaccines
— Pet diets
— Complementary generics
a b c
Pipeline Delivery
Portfolio Focus
Geographic Expansion
Acquisition
Strategic Growth Drivers
Generating and maximising returns and long term value for shareholders
Dechra Presentation Singles.indd 5 31/08/2017 12:41:58
6
®
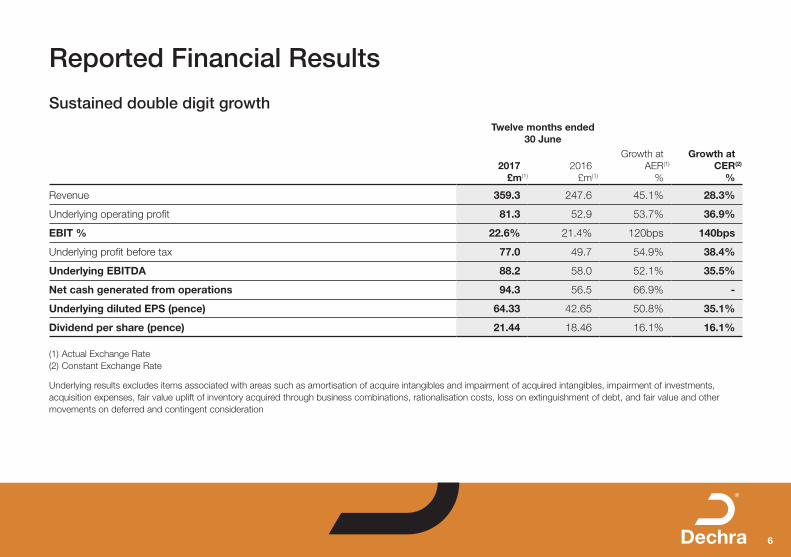
Reported Financial Results
Twelve months ended 30 June
Growth atCER(2)
%2017
£m(1)
2016£m(1)
Growth at AER(1)
%
Revenue 359.3 247.6 45.1% 28.3%
Underlying operating profit 81.3 52.9 53.7% 36.9%
EBIT % 22.6% 21.4% 120bps 140bps
Underlying profit before tax 77.0 49.7 54.9% 38.4%
Underlying EBITDA 88.2 58.0 52.1% 35.5%
Net cash generated from operations 94.3 56.5 66.9% -
Underlying diluted EPS (pence) 64.33 42.65 50.8% 35.1%
Dividend per share (pence) 21.44 18.46 16.1% 16.1%
(1) Actual Exchange Rate(2) Constant Exchange Rate
Underlying results excludes items associated with areas such as amortisation of acquire intangibles and impairment of acquired intangibles, impairment of investments, acquisition expenses, fair value uplift of inventory acquired through business combinations, rationalisation costs, loss on extinguishment of debt, and fair value and other movements on deferred and contingent consideration
Sustained double digit growth
Dechra Presentation Singles.indd 6 31/08/2017 12:41:58
7
®
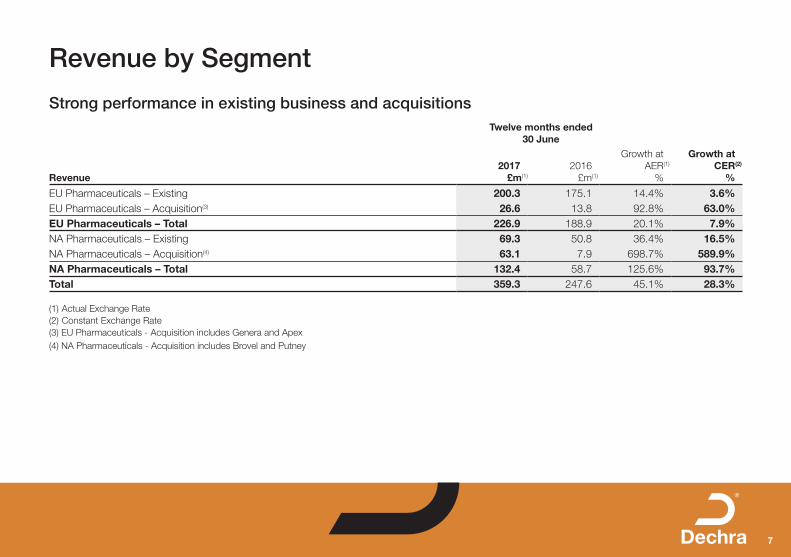
Revenue by Segment
Revenue
Twelve months ended 30 June
Growth atCER(2)
%2017
£m(1)
2016£m(1)
Growth at AER(1)
%
EU Pharmaceuticals – Existing 200.3 175.1 14.4% 3.6%EU Pharmaceuticals – Acquisition(3) 26.6 13.8 92.8% 63.0%EU Pharmaceuticals – Total 226.9 188.9 20.1% 7.9%NA Pharmaceuticals – Existing 69.3 50.8 36.4% 16.5%NA Pharmaceuticals – Acquisition(4) 63.1 7.9 698.7% 589.9%NA Pharmaceuticals – Total 132.4 58.7 125.6% 93.7%Total 359.3 247.6 45.1% 28.3%
(1) Actual Exchange Rate(2) Constant Exchange Rate (3) EU Pharmaceuticals - Acquisition includes Genera and Apex (4) NA Pharmaceuticals - Acquisition includes Brovel and Putney
Strong performance in existing business and acquisitions
Dechra Presentation Singles.indd 7 31/08/2017 12:41:58
8
®
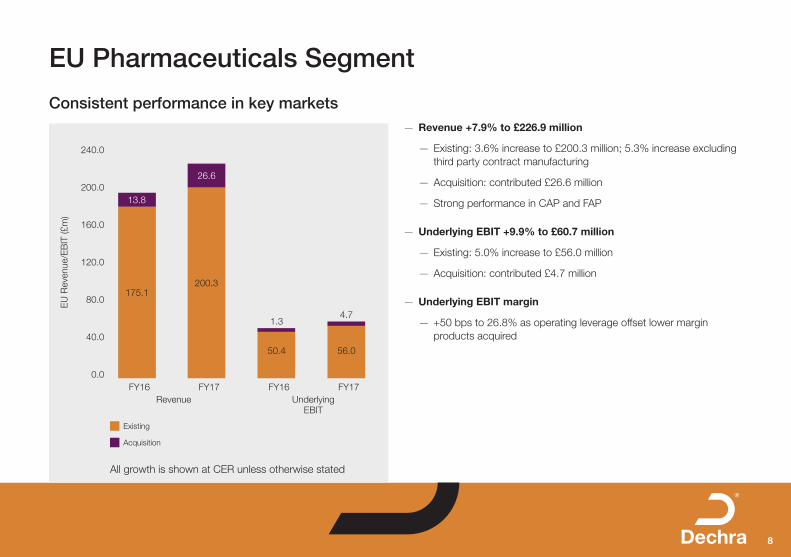
EU Pharmaceuticals Segment
Consistent performance in key markets — Revenue +7.9% to £226.9 million
— Existing: 3.6% increase to £200.3 million; 5.3% increase excluding third party contract manufacturing
— Acquisition: contributed £26.6 million
— Strong performance in CAP and FAP
— Underlying EBIT +9.9% to £60.7 million
— Existing: 5.0% increase to £56.0 million
— Acquisition: contributed £4.7 million
— Underlying EBIT margin
— +50 bps to 26.8% as operating leverage offset lower margin products acquired
240.0
200.0
160.0
120.0
80.0
40.0
0.0
EU
Rev
enue
/EB
IT (£
m)
Existing
Acquisition
26.6
200.3
13.8
175.1
4.7
56.050.4
1.3
FY16 FY17 FY16 FY17 Revenue Underlying
EBIT
All growth is shown at CER unless otherwise stated
Dechra Presentation Singles.indd 8 31/08/2017 12:41:58
9
®
NA Pharmaceuticals Segment
Strong organic growth and leverage of Putney — Revenue +93.7% to £132.4 million
— Existing: 16.5% increase to £69.3 million
— Acquisition: contributed £63.1 million
— Strong performance in CAP and Equine
— Underlying EBIT +110.9% to £43.2 million
— Existing: 31.4% increase to £24.5 million
— Acquisition: contributed £18.7 million
— Underlying EBIT margin
— +270 bps to 32.6%
— Existing: +400 bps to 35.4%
— Strong margin performance
240.0
200.0
160.0
120.0
80.0
40.0
0.0
NA
Rev
enue
/EB
IT (£
m)
FY16 FY17 FY16 FY17 Revenue Underlying
EBIT
Existing
Acquisition
63.1
69.350.8
7.9
18.7
24.515.9
1.6
All growth is shown at CER unless otherwise stated
Dechra Presentation Singles.indd 9 31/08/2017 12:41:58
10
®
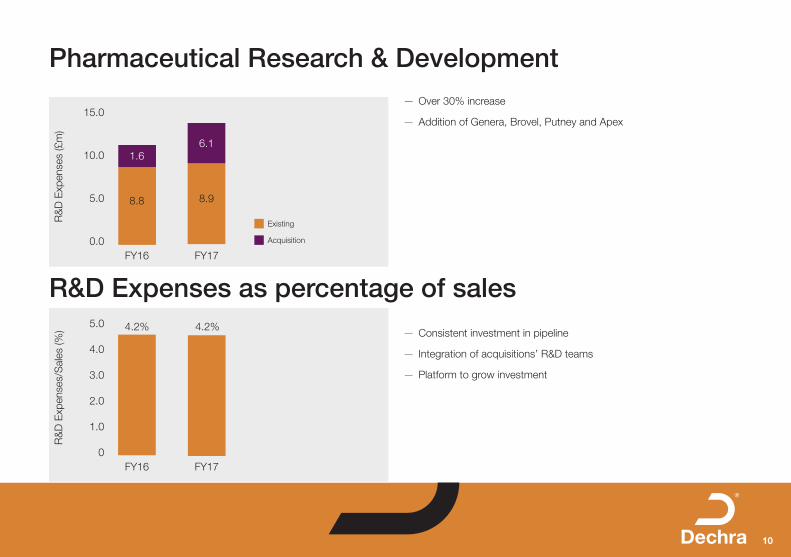
Pharmaceutical Research & Development
R&D Expenses as percentage of sales
— Over 30% increase
— Addition of Genera, Brovel, Putney and Apex
— Consistent investment in pipeline
— Integration of acquisitions’ R&D teams
— Platform to grow investment
15.0
10.0
5.0
0.0
5.0
4.0
3.0
2.0
1.0
0
R&
D E
xpen
ses
(£m
)R
&D
Exp
ense
s/S
ales
(%)
FY16 FY17
FY16 FY17
6.1
8.9
4.2% 4.2%
1.6
8.8
Existing
Acquisition
Dechra Presentation Singles.indd 10 31/08/2017 12:42:00
11
®
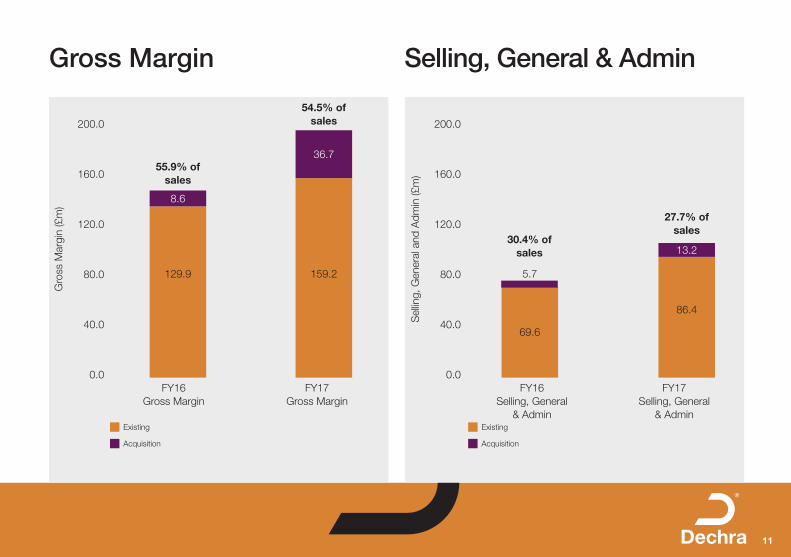
Gross Margin Selling, General & Admin
200.0
160.0
120.0
80.0
40.0
0.0
200.0
160.0
120.0
80.0
40.0
0.0
Gro
ss M
argi
n (£
m)
Sel
ling,
Gen
eral
and
Adm
in (£
m)
FY16 Gross Margin
FY17 Gross Margin
FY16 Selling, General
& Admin
FY17 Selling, General
& Admin
36.7
159.2
13.2
86.4
8.6
129.9
69.6
5.7
Existing Existing
Acquisition Acquisition
55.9% of sales
30.4% of sales
54.5% of sales
27.7% of sales
Dechra Presentation Singles.indd 11 31/08/2017 12:42:00
12
®
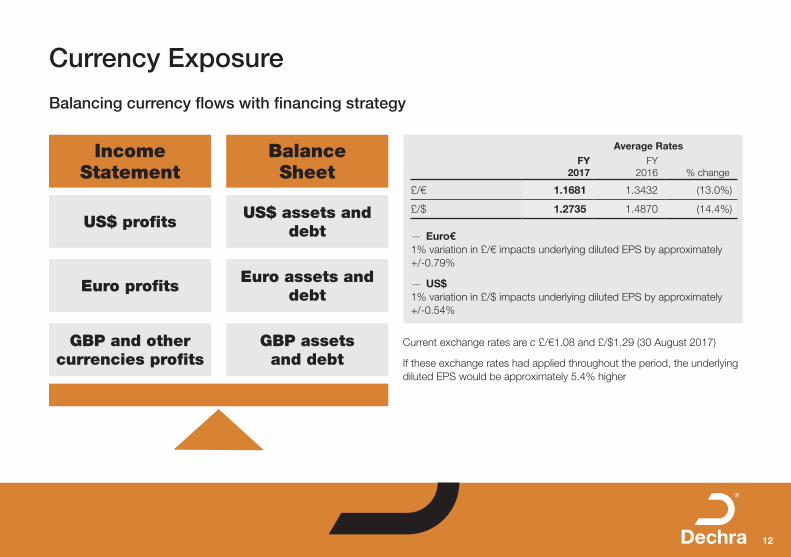
Currency Exposure
Balancing currency flows with financing strategy
Income Statement
US$ profits
Euro profits
GBP and other currencies profits
Balance Sheet
US$ assets and debt
Euro assets and debt
GBP assets and debt
Average RatesFY
2017FY
2016 % change
£/€ 1.1681 1.3432 (13.0%)
£/$ 1.2735 1.4870 (14.4%)
— Euro€1% variation in £/€ impacts underlying diluted EPS by approximately +/-0.79%
— US$1% variation in £/$ impacts underlying diluted EPS by approximately +/-0.54%
Current exchange rates are c £/€1.08 and £/$1.29 (30 August 2017)
If these exchange rates had applied throughout the period, the underlying diluted EPS would be approximately 5.4% higher
Dechra Presentation Singles.indd 12 31/08/2017 12:42:00

13
®
Cash Flow
Continuing strong cash generation30 June
2017£m
2016£m
Underlying operating profit 81.3 52.9Depreciation and amortisation 6.9 5.1Underlying EBITDA 88.2 58.0
% 24.5% 23.4%Working Capital 6.9 (1.6)Other 2.9 4.7Net cash generated from operations before non-underlying items 98.0 61.1Non-underlying items (3.7) (4.6)Net cash generated from operations 94.3 56.5
Cash conversion % 115.9% 106.8%
ROCE % 17.7% 16.1%
Dechra Presentation Singles.indd 13 31/08/2017 12:42:00
14
®
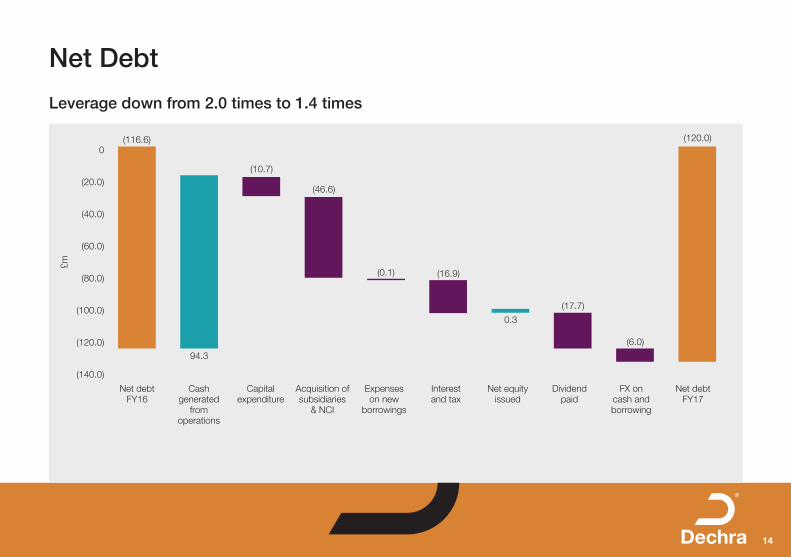
Net Debt
Leverage down from 2.0 times to 1.4 times
0
(20.0)
(40.0)
(60.0)
(80.0)
(100.0)
(120.0)
(140.0)
£m
Net debt FY16
Cash generated
from operations
Capital expenditure
Acquisition of subsidiaries
& NCI
Expenses on new
borrowings
Interest and tax
Net equity issued
Dividend paid
FX on cash and borrowing
Net debt FY17
(116.6)
94.3
(10.7)
(46.6)
(0.1) (16.9)
0.3
(17.7)
(6.0)
(120.0)
Dechra Presentation Singles.indd 14 31/08/2017 12:42:00
15
®
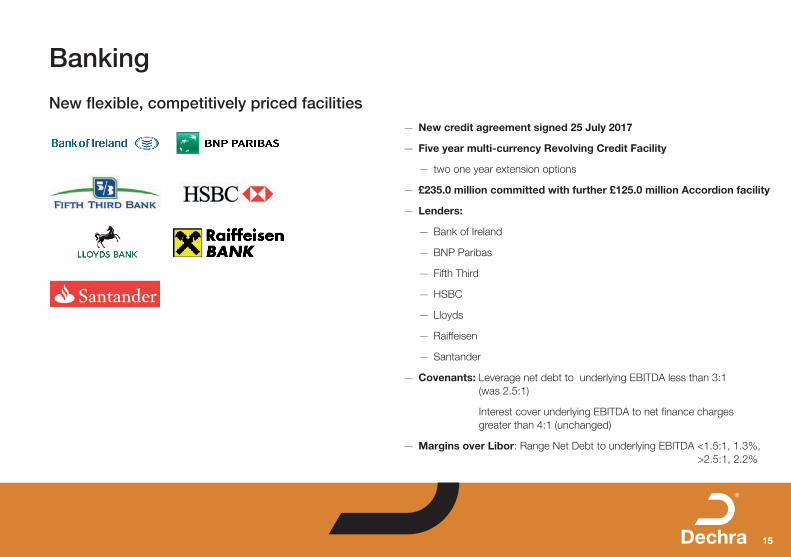
Banking
— New credit agreement signed 25 July 2017
— Five year multi-currency Revolving Credit Facility
— two one year extension options
— £235.0 million committed with further £125.0 million Accordion facility
— Lenders:
— Bank of Ireland
— BNP Paribas
— Fifth Third
— HSBC
— Lloyds
— Raiffeisen
— Santander
— Covenants: Leverage net debt to underlying EBITDA less than 3:1 (was 2.5:1)
Interest cover underlying EBITDA to net finance charges greater than 4:1 (unchanged)
— Margins over Libor: Range Net Debt to underlying EBITDA <1.5:1, 1.3%, >2.5:1, 2.2%
New flexible, competitively priced facilities
Dechra Presentation Singles.indd 15 31/08/2017 12:42:01
16
®
Other Financial Items
— Non-underlying items (pre-tax) £48.4 million (2016: £35.1 million) — Increase of £20.3 million on amortisation of acquired intangibles to £40.4 million
— Amortisation of associate intangible, acquisition and integration costs £3.6 million
— Acquisition fair value uplift of inventory £4.2 million
— Fair value and other movements on deferred consideration £0.2 million
— Dividend — Final dividend increased 18.7% to 15.33p per share (2016: 12.91p)
— Full dividend increased 16.1% to 21.44p (2016: 18.46p). Payable on 17 November 2017; Record Date 27 October 2017
— Dividend cover on underlying diluted EPS of 3.0 times
— Tax — Effective Tax Rate (ETR) on PBT for the period reduced to 8.6% (2016: 14.0%)
— Underlying ETR on underlying PBT is 21.9% (2016: 22.7%)
— Banking — Net debt of £120.0 million at 30 June 2017 (2016: £116.6 million)
— Leverage ratio is 1.4 at 30 June 2017 (2016: 2.0): covenant cannot be higher than 2.5:1*
— Interest ratio is 21.2 at 30 June 2017 (2016: 16.0): covenant cannot be lower than 4:1*
* 2.5:1 under old credit agreement. 3.0:1 under new credit agreement.
Dechra Presentation Singles.indd 16 31/08/2017 12:42:01
17
®
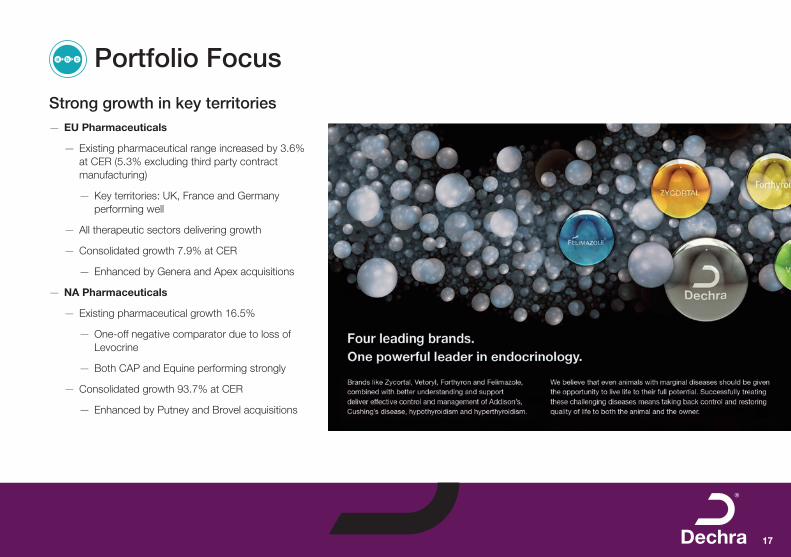
Portfolio Focus
— EU Pharmaceuticals
— Existing pharmaceutical range increased by 3.6% at CER (5.3% excluding third party contract manufacturing)
— Key territories: UK, France and Germany performing well
— All therapeutic sectors delivering growth
— Consolidated growth 7.9% at CER
— Enhanced by Genera and Apex acquisitions
— NA Pharmaceuticals
— Existing pharmaceutical growth 16.5%
— One-off negative comparator due to loss of Levocrine
— Both CAP and Equine performing strongly
— Consolidated growth 93.7% at CER
— Enhanced by Putney and Brovel acquisitions
Strong growth in key territories
a b c
Dechra Presentation Singles.indd 17 31/08/2017 12:42:02
18
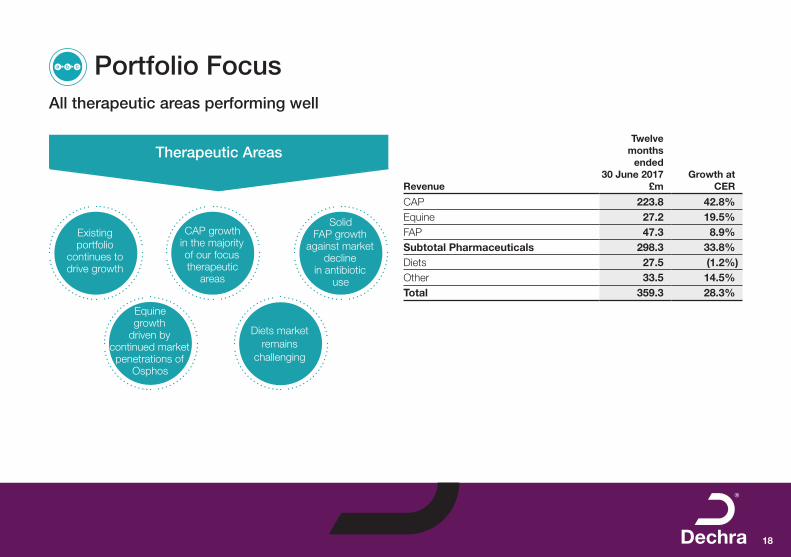
®
Portfolio Focusa b c
Therapeutic Areas
Existing portfolio
continues to drive growth
Equine growth
driven by continued market penetrations of
Osphos
Diets market remains
challenging
CAP growth in the majority of our focus therapeutic
areas
Solid FAP growth
against market decline
in antibiotic use
Revenue
Twelve months
ended30 June 2017
£mGrowth at
CER
CAP 223.8 42.8%Equine 27.2 19.5%FAP 47.3 8.9%Subtotal Pharmaceuticals 298.3 33.8%Diets 27.5 (1.2%)Other 33.5 14.5%Total 359.3 28.3%
All therapeutic areas performing well
Dechra Presentation Singles.indd 18 31/08/2017 12:42:02
19
®
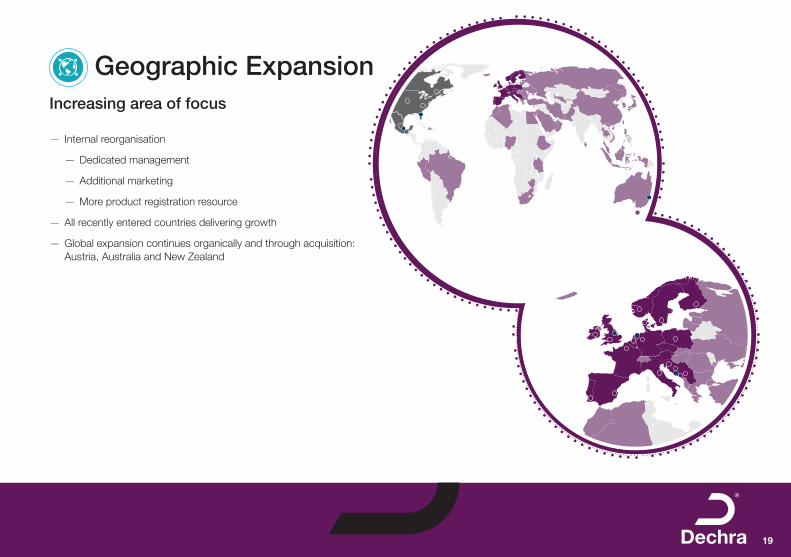
Geographic ExpansionIncreasing area of focus
— Internal reorganisation
— Dedicated management
— Additional marketing
— More product registration resource
— All recently entered countries delivering growth
— Global expansion continues organically and through acquisition: Austria, Australia and New Zealand
Dechra Presentation Singles.indd 19 31/08/2017 12:42:03
20
®
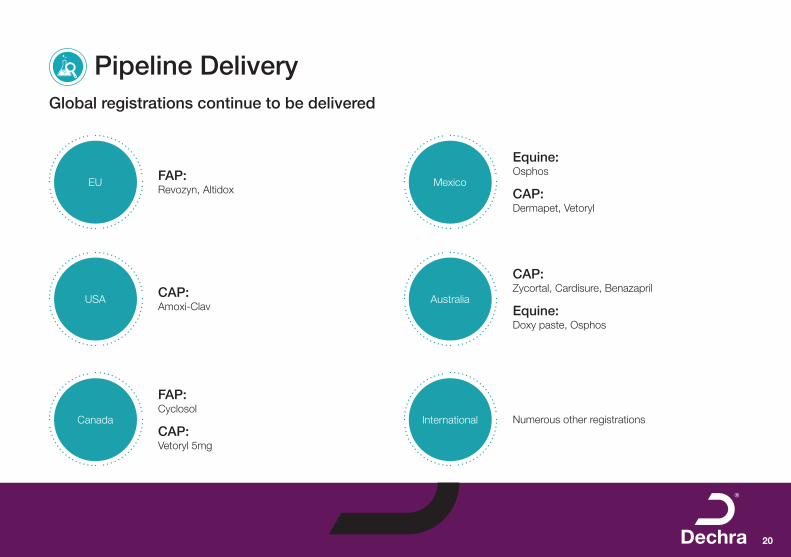
Pipeline DeliveryGlobal registrations continue to be delivered
EU Mexico
USA Australia
Canada International
FAP: Revozyn, Altidox
Equine: Osphos
CAP: Dermapet, Vetoryl
CAP: Amoxi-Clav
CAP: Zycortal, Cardisure, Benazapril
Equine: Doxy paste, Osphos
FAP: Cyclosol
CAP: Vetoryl 5mg
Numerous other registrations
Dechra Presentation Singles.indd 20 31/08/2017 12:42:03
21
®
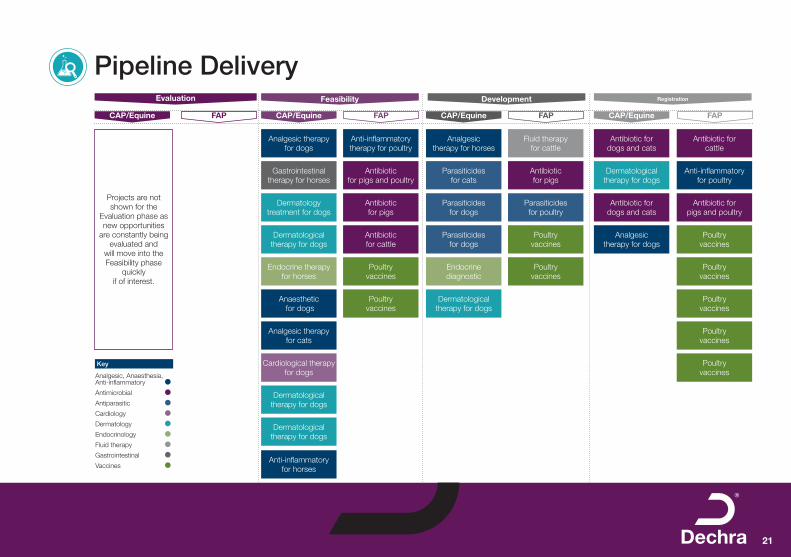
Pipeline DeliveryEvaluation
CAP/Equine CAP/Equine CAP/Equine CAP/EquineFAP FAP FAP FAP
DevelopmentFeasibility Registration
Analgesic therapy for dogs
Projects are not shown for the
Evaluation phase as new opportunities
are constantly being evaluated and
will move into the Feasibility phase
quickly if of interest.
Gastrointestinal therapy for horses
Dermatology treatment for dogs
Dermatological therapy for dogs
Endocrine therapy for horses
Anaesthetic for dogs
Analgesic therapy for cats
Cardiological therapy for dogs
Dermatological therapy for dogs
Dermatological therapy for dogs
Anti-inflammatory for horses
Analgesic therapy for horses
Parasiticides for cats
Parasiticides for dogs
Parasiticides for dogs
Endocrine diagnostic
Dermatological therapy for dogs
Antibiotic for dogs and cats
Dermatological therapy for dogs
Antibiotic for dogs and cats
Analgesic therapy for dogs
Anti-inflammatory therapy for poultry
Antibiotic for pigs and poultry
Antibiotic for pigs
Antibiotic for cattle
Poultry vaccines
Poultry vaccines
Fluid therapy for cattle
Antibiotic for pigs
Parasiticides for poultry
Poultry vaccines
Poultry vaccines
Poultry vaccines
Poultry vaccines
Poultry vaccines
Poultry vaccines
Poultry vaccines
Antibiotic for cattle
Anti-inflammatory for poultry
Antibiotic for pigs and poultry
Key
Analgesic, Anaesthesia, Anti-inflammatory
Antimicrobial
Antiparasitic
Cardiology
Dermatology
Endocrinology
Fluid therapy
Gastrointestinal
Vaccines
Dechra Presentation Singles.indd 21 31/08/2017 12:42:03
22
®
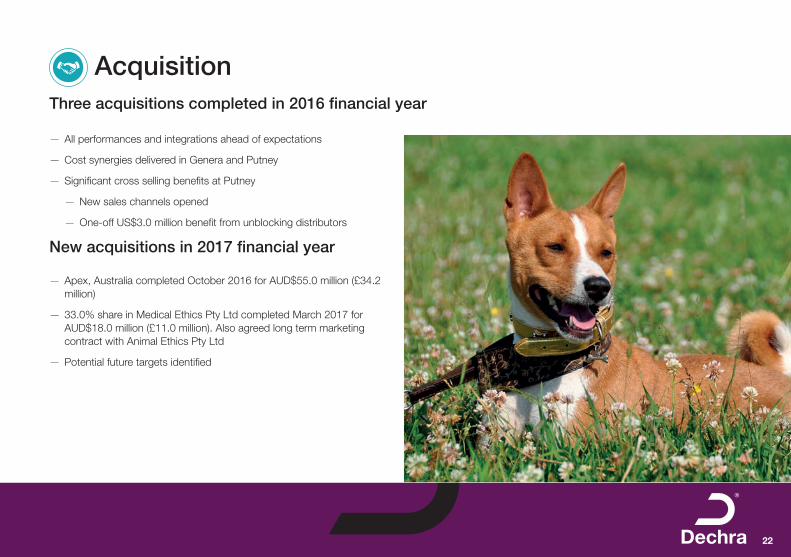
AcquisitionThree acquisitions completed in 2016 financial year
— All performances and integrations ahead of expectations
— Cost synergies delivered in Genera and Putney
— Significant cross selling benefits at Putney
— New sales channels opened
— One-off US$3.0 million benefit from unblocking distributors
New acquisitions in 2017 financial year
— Apex, Australia completed October 2016 for AUD$55.0 million (£34.2 million)
— 33.0% share in Medical Ethics Pty Ltd completed March 2017 for AUD$18.0 million (£11.0 million). Also agreed long term marketing contract with Animal Ethics Pty Ltd
— Potential future targets identified
Dechra Presentation Singles.indd 22 31/08/2017 12:42:06
23
®
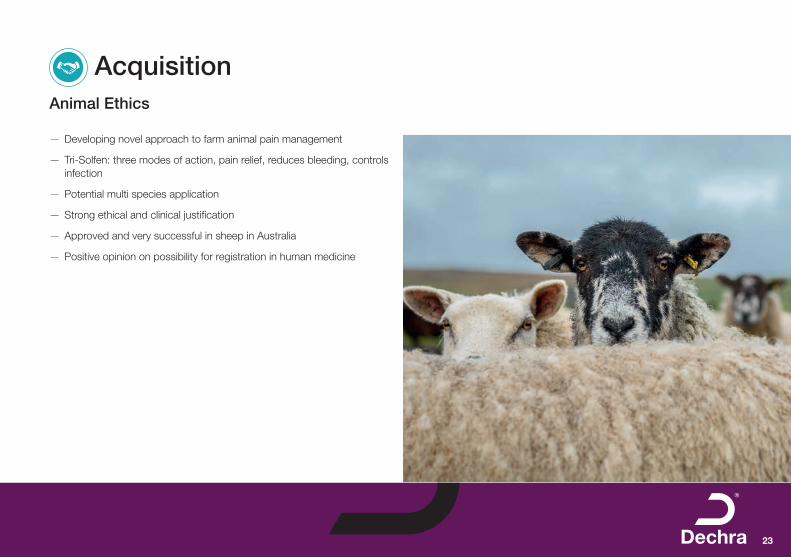
AcquisitionAnimal Ethics
— Developing novel approach to farm animal pain management
— Tri-Solfen: three modes of action, pain relief, reduces bleeding, controls infection
— Potential multi species application
— Strong ethical and clinical justification
— Approved and very successful in sheep in Australia
— Positive opinion on possibility for registration in human medicine
Dechra Presentation Singles.indd 23 31/08/2017 12:42:10

24
®
Strategic Enablers – ManufacturingChange to support our future
— Manufacturing
— 9.7% planned decline in revenue from contract manufacturing
— Management team strengthened
— Five year plan established and implemented to improve efficiency, create centres of excellence, reduce costs
— New third party supply chain initiatives completed
Dechra Presentation Singles.indd 24 31/08/2017 12:42:12

25
®
Strategic Enablers – IT and PeopleChange to support our future
— People
— SET performing well
— New Chairman, Tony Rice, commenced at October 2016 AGM
— New Non-Executive Director, Lawson Macartney, veterinarian and development expertise, commenced December 2016
— Chief Financial Officer, Richard Cotton, commenced January 2017
— IT
— Oracle ERP ‘go-live’ delayed
— Implementation expected 2018 financial year
Dechra Presentation Singles.indd 25 31/08/2017 12:42:15

26
®
— Acquisitions delivering growth
— Pipeline producing new products
— Trading outperforming the majority of markets in which we trade
— New opportunities identified
— Current trading in line with management expectations
— Entering our 21st year with confidence
Outlook
Our strategy continues to outperform
Dechra Presentation Singles.indd 26 31/08/2017 12:42:18
Appendices
®
Dechra Presentation Singles.indd 27 31/08/2017 12:42:18
28
®
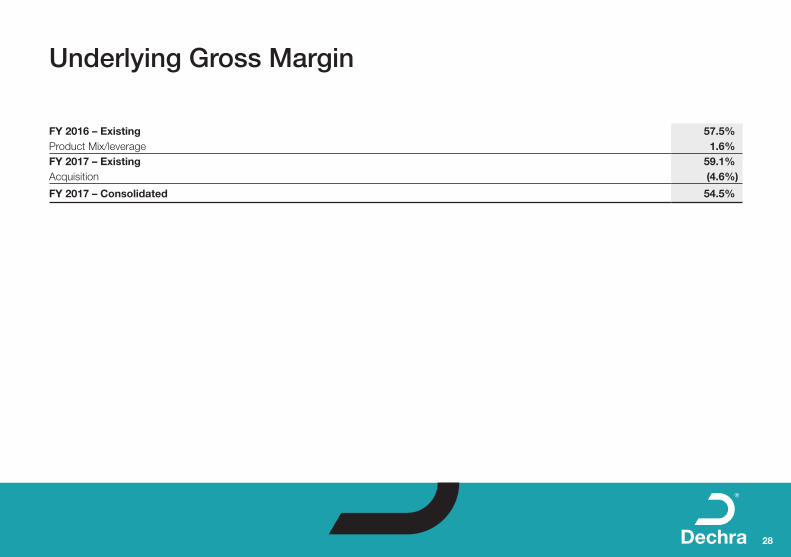
Underlying Gross Margin
FY 2016 – Existing 57.5%Product Mix/leverage 1.6%FY 2017 – Existing 59.1%Acquisition (4.6%)
FY 2017 – Consolidated 54.5%
Dechra Presentation Singles.indd 28 31/08/2017 12:42:18
29
®
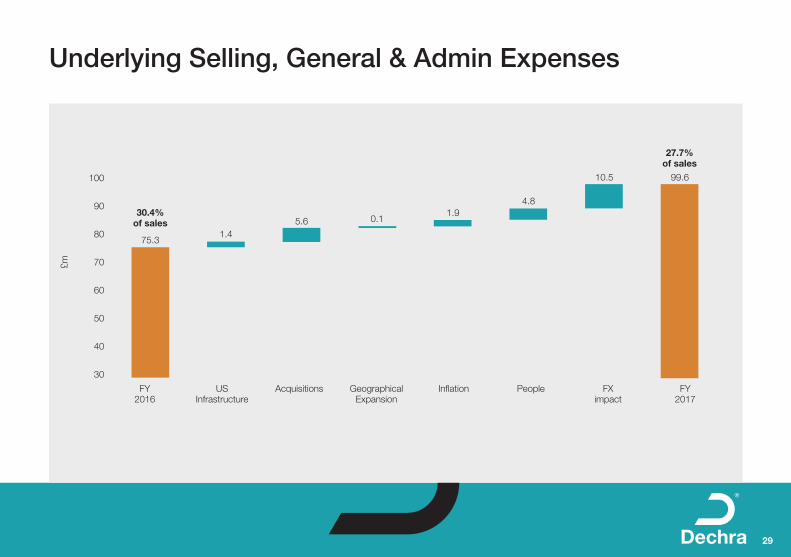
Underlying Selling, General & Admin Expenses
100
90
80
70
60
50
40
30
£m
FY 2016
US Infrastructure
Acquisitions Geographical Expansion
Inflation People FX impact
FY 2017
75.3
30.4% of sales
27.7% of sales
1.45.6 0.1
1.94.8
10.5 99.6
Dechra Presentation Singles.indd 29 31/08/2017 12:42:18
30
®
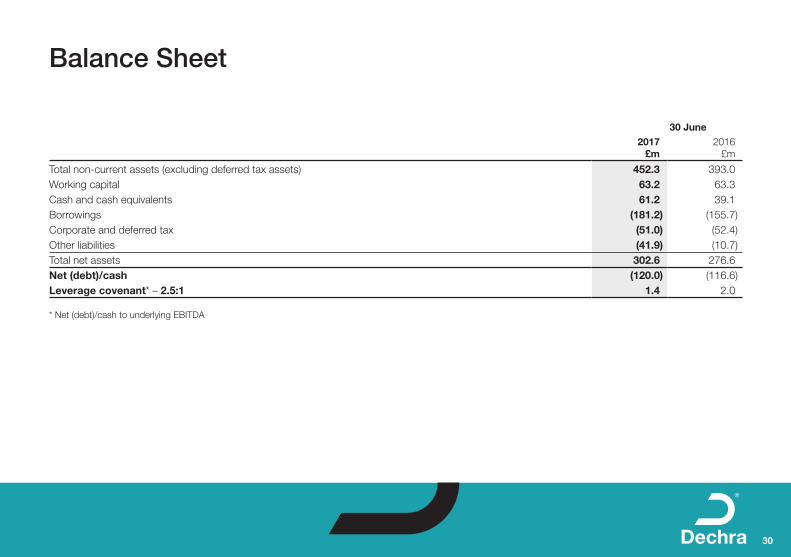
Balance Sheet
30 June2017
£m2016
£m
Total non-current assets (excluding deferred tax assets) 452.3 393.0Working capital 63.2 63.3Cash and cash equivalents 61.2 39.1Borrowings (181.2) (155.7)Corporate and deferred tax (51.0) (52.4)Other liabilities (41.9) (10.7)Total net assets 302.6 276.6Net (debt)/cash (120.0) (116.6)Leverage covenant* – 2.5:1 1.4 2.0
* Net (debt)/cash to underlying EBITDA
Dechra Presentation Singles.indd 30 31/08/2017 12:42:19

31
®
Working Capital
60.0
40.0
20.0
0.0
£m
FY16 FY17
Cash conversion115.9%
21.7
11.9
29.6
10.010.2
43.1
Cash conversion106.8%
EU Pharma
Acquisition
North America
Dechra Presentation Singles.indd 31 31/08/2017 12:42:19

32
®
Our History
2000 IPO – main
listing on LSE
1997 MBO of Lloyds
veterinary division
2007 Trading
commences in the US
2010 Dermapet:
new US Derm product range
$60m
2012 Eurovet:
strengthens Dechra EU
€126m
2015 Genera: entry into poultry
Vaccines €37m
2016 Apex: access to Australian CAP market AUD$55m
2008 VetXX: wider EU presence
£61.7m
2013 Divestment of Service business £87.5m
proceeds
2014 PSPC: US bolt-
on $10m
2016 Putney:
transformational US deal $200m
2017 Medical Ethics
AUD$18m
Services: 90% Sales Pharma: 90% Sales
Market Capitalisation£60m £1.7bn
31
Our History
31
Our History
31
Our History
31
Our History
31
Our History
31
Our History
Dechra Presentation Singles.indd 32 31/08/2017 12:42:20
33
®
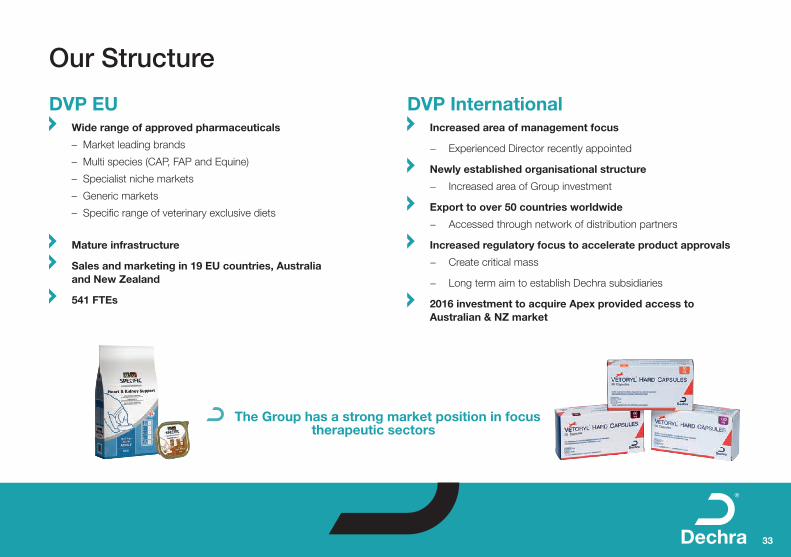
Our Structure
DVP EU Wide range of approved pharmaceuticals
– Market leading brands
– Multi species (CAP, FAP and Equine)
– Specialist niche markets
– Generic markets
– Specific range of veterinary exclusive diets
Mature infrastructure
Sales and marketing in 19 EU countries, Australia and New Zealand
541 FTEs
DVP International Increased area of management focus
− Experienced Director recently appointed
Newly established organisational structure
− Increased area of Group investment
Export to over 50 countries worldwide
− Accessed through network of distribution partners
Increased regulatory focus to accelerate product approvals
− Create critical mass
− Long term aim to establish Dechra subsidiaries
2016 investment to acquire Apex provided access to Australian & NZ market
The Group has a strong market position in focus therapeutic sectors
Dechra Presentation Singles.indd 33 31/08/2017 12:42:21
34
®
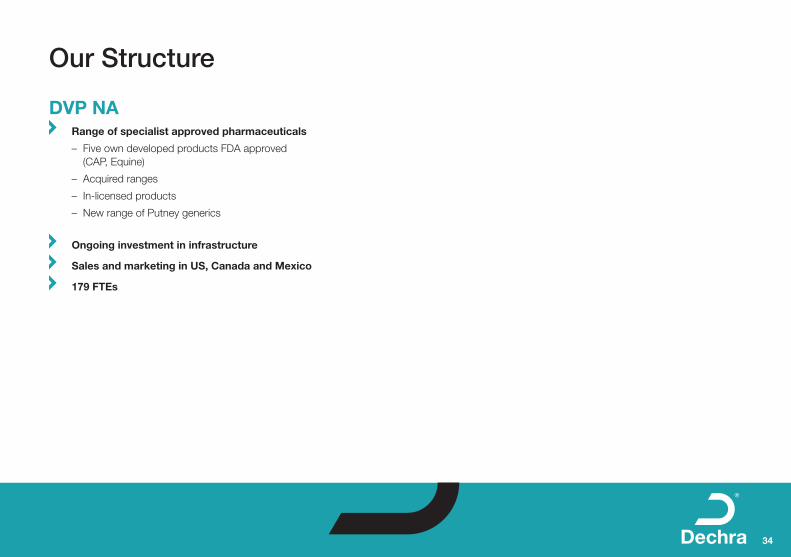
Our Structure
DVP NA Range of specialist approved pharmaceuticals
– Five own developed products FDA approved (CAP, Equine)
– Acquired ranges
– In-licensed products
– New range of Putney generics
Ongoing investment in infrastructure
Sales and marketing in US, Canada and Mexico
179 FTEs
Dechra Presentation Singles.indd 34 31/08/2017 12:42:21
35
®
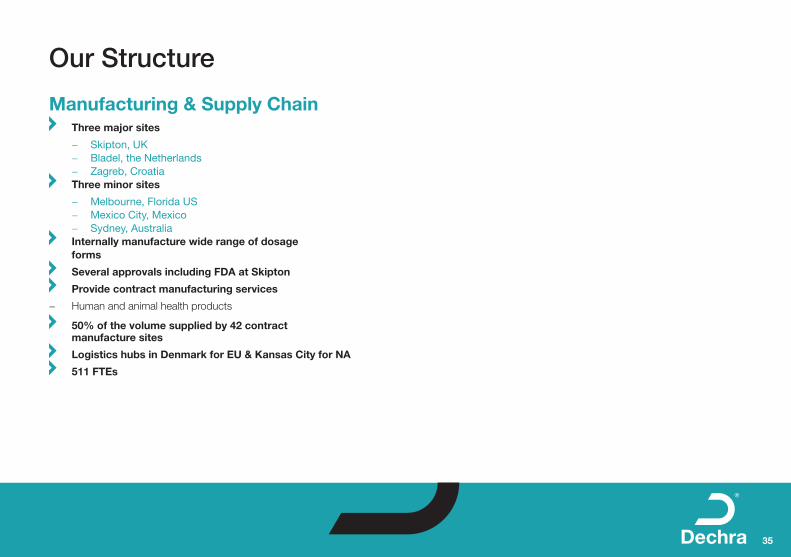
Our Structure
Manufacturing & Supply Chain Three major sites
− Skipton, UK − Bladel, the Netherlands − Zagreb, Croatia
Three minor sites
− Melbourne, Florida US − Mexico City, Mexico − Sydney, Australia
Internally manufacture wide range of dosage forms
Several approvals including FDA at Skipton
Provide contract manufacturing services
− Human and animal health products
50% of the volume supplied by 42 contract manufacture sites
Logistics hubs in Denmark for EU & Kansas City for NA
511 FTEs
Dechra Presentation Singles.indd 35 31/08/2017 12:42:21
36
®
Our Structure
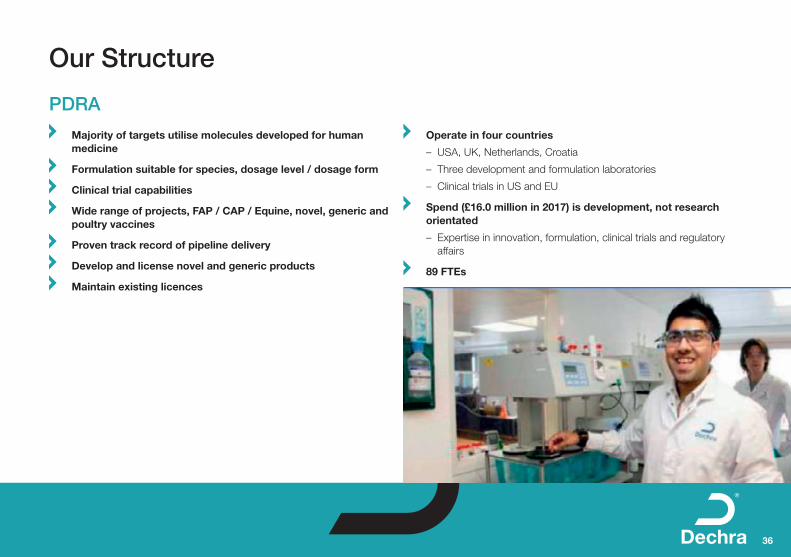
PDRA
Majority of targets utilise molecules developed for human medicine
Formulation suitable for species, dosage level / dosage form
Clinical trial capabilities
Wide range of projects, FAP / CAP / Equine, novel, generic and poultry vaccines
Proven track record of pipeline delivery
Develop and license novel and generic products
Maintain existing licences
Operate in four countries
– USA, UK, Netherlands, Croatia
– Three development and formulation laboratories
– Clinical trials in US and EU
Spend (£16.0 million in 2017) is development, not research orientated
– Expertise in innovation, formulation, clinical trials and regulatory affairs
89 FTEs
Dechra Presentation Singles.indd 36 31/08/2017 12:42:21
37
®
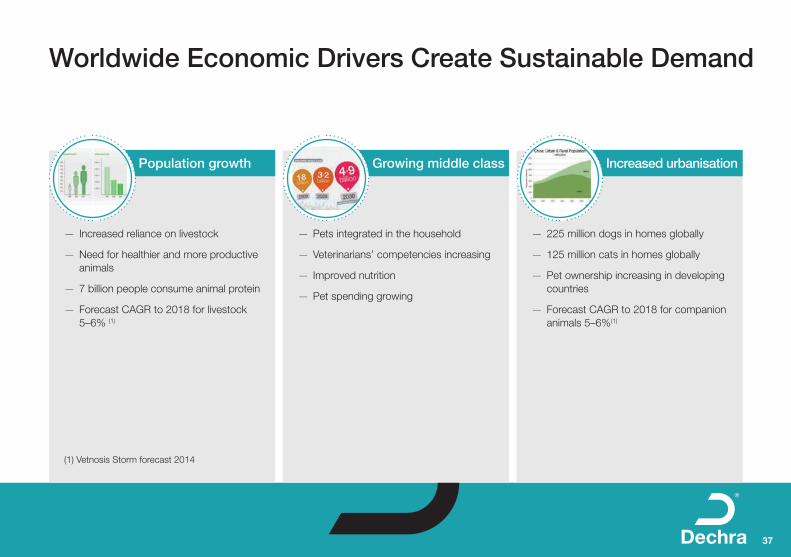
Worldwide Economic Drivers Create Sustainable Demand
— Increased reliance on livestock
— Need for healthier and more productive animals
— 7 billion people consume animal protein
— Forecast CAGR to 2018 for livestock 5–6% (1)
— Pets integrated in the household
— Veterinarians’ competencies increasing
— Improved nutrition
— Pet spending growing
— 225 million dogs in homes globally
— 125 million cats in homes globally
— Pet ownership increasing in developing countries
— Forecast CAGR to 2018 for companion animals 5–6%(1)
Population growth Growing middle class Increased urbanisation
(1) Vetnosis Storm forecast 2014
Dechra Presentation Singles.indd 37 31/08/2017 12:42:23

38
®
Key Drivers of the Veterinary Market
+ Increased demand for new treatments and medicines
+ Increase in owners’ compassion for their pets
+ Little pricing pressure; generics do not de-value markets to the extent of human products
+ EU Cascade supports licensed product use
+ Increased world demand for animal protein
+ Improved meat quality requires high quality pharmaceuticals
- Decline in use of antibiotics in Western Europe
+ Increased use of vaccines
CAP FAP
Dechra Presentation Singles.indd 38 31/08/2017 12:42:24

39
®
Our Strategy
Generate long term value for shareholders
Strategic Enablers
a b c
Pipeline Delivery
Portfolio Focus
Geographic Expansion
Manufacturing and Supply Chain
Technology People
Acquisition
Dedication Dedication Dedication Dedication Dedication DedicationDedication Enjoyment Courage Honesty Relationships Ambition
Strategic Growth Drivers
International specialist veterinary pharmaceuticals & related products business
Dechra Values
Dechra Presentation Singles.indd 39 31/08/2017 12:42:25
40
®
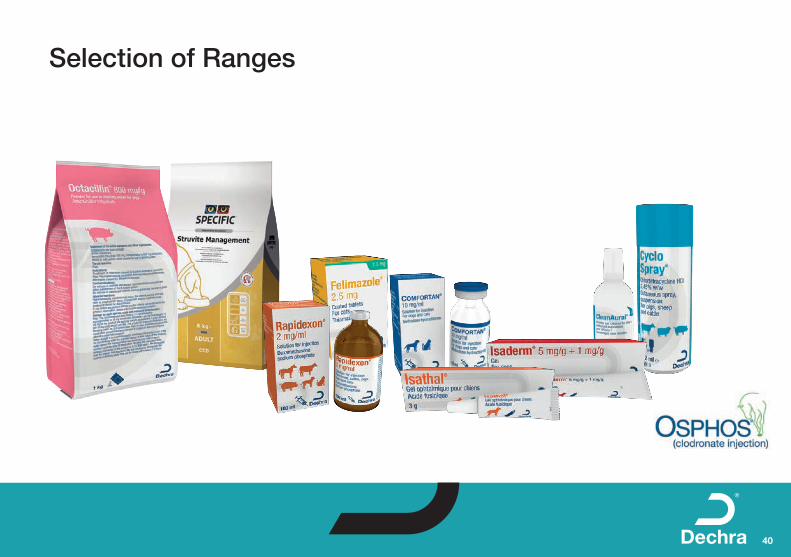
Selection of Ranges
Dechra Presentation Singles.indd 40 31/08/2017 12:43:05

41
®
Five Year Summary of Financials
Consolidated Income Statement (£m) 2017 2016 2015 2014 2013
Revenue 359.3 247.6 203.5 193.6 189.2Underlying operating profit 81.3 52.9 44.4 42.2 39.1Operating margin % 22.6% 21.4% 21.8% 21.8% 20.7%Underlying profit after taxation 60.1 38.4 35.3 31.8 25.5Underlying earnings per share 64.68 42.95 40.17 37.61 38.98– basic (pence)– diluted (pence) 64.33 42.65 39.90 37.48 38.71Dividend per share (pence) 21.44 18.46 16.94 15.40 14.00Operating profit 33.2 19.5 26.0 25.0 18.3Profit after taxation 26.1 12.5 19.5 19.4 10.9Earnings per share 28.09 14.00 22.14 67.57 20.59– basic (pence)– diluted (pence) 27.93 13.90 21.99 67.33 20.45
Dechra Presentation Singles.indd 41 31/08/2017 12:43:05

42
®
Glossary
AER: Actual Exchange Rate
CAP: Companion Animal Products
CER: Constant Exchange Rate
EPS: Earnings Per Share
EU: Europe
FAP: Food producing Animal Products
FX: Foreign Exchange
NA: North America
Underlying results: excludes amortisation of acquired intangibles and impairment of acquired intangibles, impairment of investments, acquisition expenses, fair value uplift of inventory acquired through business combinations, rationalisation costs, loss on extinguishment of debt, and fair value and other movements on deferred and contingent consideration
Dechra Presentation Singles.indd 42 31/08/2017 12:43:05
®
43
Forward Looking Statements
This document contains certain forward-looking statements which reflect the knowledge and information available to the Company during the preparation and up to the publication of this document. By their very nature, these statements depend upon circumstances and relate to events that may occur in the future and thereby involve a degree of uncertainty. Therefore, nothing in this document should be construed as a profit forecast by the Company.
TrademarksTrademarks appear throughout this document in italics. Dechra and the Dechra “D” logo are registered trademarks of Dechra Pharmaceuticals PLC.
Dechra Presentation Singles.indd 43 31/08/2017 12:43:05
®
Dechra Pharmaceuticals PLC 24 Cheshire Avenue Cheshire Business Park Lostock Gralam Northwich CW9 7UAT: +44 (0) 1606 814730 F: +44 (0) 1606 814731 E: [email protected] www.dechra.com
Stock code: DPH
®
Dechra Presentation Singles.indd 44 31/08/2017 12:43:05