Embed Size (px)
Citation preview

2000-2001 FINALHatchery Escapement Report
June 12, 2002
Washington Department of Fish and WildlifeFish Program/Hatcheries Division
By Stan Hammer/Hatchery Data Unit600 Capital Way NorthOlympia, WA 98501-1091E-mail: [email protected](360) 902-2665

Table of Contents
Section Page
Narrative 1
Hatchery Anadromous Fish Escapement Summary 3
Hatchery Resident Fish Escapement Summary 6
Anadromous Fish Escapement by Species 7
Resident Fish Escapement by Species 32

1
Hatchery Escapement Report
This report is published annually by the Washington Department of Fish and Wildlife(WDFW) Fish Program/ Hatcheries Division. It is generated directly from the WDFW AdultReport Database. This database contains daily records of adult fish handling activities asreported by hatchery facilities on the Adult Record Form. It describes the total escapement orreturn of species of salmon and trout to WDFW and cooperative projects within Washingtonstate. It enumerates the total number of fish returning to hatchery racks or traps in the rivers andstreams of Washington state for the spawning activity cycle beginning in approximately March2000 and ending in approximately March 2001.* We define escapement as the return of spawning fish to hatchery racks or traps. The data for this report is developed by WDFWhatchery staff and Olympia hatchery division staff who enumerate the runs of fish returning totheir respective natal streams; these numbers are transferred to adult records which are sent toOlympia for compilation and analysis. These records provide information on run timing forstatewide runs of fish; information on the results of selective fisheries, and critical data for codedwire tag (CWT) analysis. CWTs are a management tool used to determine the status of runs andthe effect of various management strategies and research projects. (These CWT recovery totalsare available at www.rmis.org). This report represents the collective work of many people andas such captures the definitive data for that spawning cycle providing a summary of salmonidsreturning to WDFW facilities throughout the state of Washington and the eggs that werespawned in association with those returning fish. For example: the 2000-2001 return yearproduced 646,441 adult fish returning to hatchery racks and traps and 214,488,683 eggs werecollected.
This annual hatchery escapement report is organized and divided into three geographicalregions: Puget Sound(including the Straits of Juan de Fuca), Coast, and Columbia River. It isfurther divided by species and races. For example: chinook salmon are described in threegeographic regions, Puget Sound(including the Straits of Juan de Fuca), Coastal, and ColumbiaRiver, as well as by their fall, spring, and summer races.______________________________________________________________________________
Definitions
Some column heading definitions and other word definitions are provided to aid understandingof this document. The facility name column describes the location where fish were trapped.Because this report was generated directly from the Adult Record Database, many facility namesare abbreviated to match the standard names used for data sharing through the Pacific SalmonCommission. The stock column represents the known origin of the fish returning to that river orstream. The Bo, or brood origin column represents the origin of the fish as to whether they arehatchery origin (H) stock, wild origin (W) stock, or mixed origin (M) stock of hatchery and wildfish. The Total Trapped Adults column enumerates full-sized sexually mature fish returning tospawn in their home streams or rivers. The Total Trapped Jacks column enumerates sexuallymature male fish that return at a very small size to their home streams or rivers. Coho andchinook salmon produce the largest numbers of jacks. The Total Trapped column represents
2
the total number of fish trapped at the hatchery rack. It may not represent the total run to anygiven river due to presence of either wild, hatchery, or mixed stocks that may spawn below thehatchery rack or may die or be harvested below the hatchery via sport, commercial, or tribalfisheries. This column also does not include fish that pass the trap/rack when it is not in use suchas a temporary weir or a fish collection facility that is only used intermittently. Eggtake goalswere taken from the 2000 Future Brood Document and represent the pre-season eggtake goals.The goals may have changed in-season due to unforseen factors, meaning that actual eggtakesmay have differed from the listed goals. NA for eggtake goal means there was no eggtake goal. The Released to stream column records the numbers of fish returned to the stream above orbelow the hatchery rack or trap that were not spawned. The Trapped less released columnequals the number of fish that were spawned, died, transferred out, or distributed minus the fishpassed upstream. Race is defined as broad groupings of hatchery stock fish species representingdistinct adult timing or juvenile migration patterns. Wild stock timings may differ according tolocation and the stock of fish. NA for race refers means that we do not identify a timingdifference. Example: Most Puget Sound region coho and chum salmon stocks are NA. Type Nrefers to Columbia River region juvenile coho that turn north (N) as they leave the ColumbiaRiver and return later than normal as adult fish. Type S refers to Columbia River juvenile cohothat turn south(S) as they leave the Columbia River and return earlier than normal as adult fish. Sea-run refers to coastal cutthroat that spend a portion of their life in saltwater. Westslopegenerally refers to resident cutthroat originating from the drainages of the westslope of theRocky Mountains. Westslope is used here to refer to resident cutthroat from the Yakima Riverupstream in the Columbia drainage. Fall refers to adults that return to spawn primarily in the fallmonths of the year although this timing varies between chinook and chum salmon. Spring refersto adults that return their home streams in the spring months of the year and spawn primarily inthe late summer to early fall months of the year. For steelhead, summer refers to adults thatreturn from July to September and spawn from December to January; for chinook summer refersto adults that arrive from July through August and are spawned in October through the early partof November, and for chum summer refers to adults that return in August to mid-September andare spawned from August to mid-September. Winter refers to adults that return from mid-November to the end of January and spawn from December to January. Winter-Late refers to aspecific stock of Cowlitz river wild winter steelhead with a later than normal timing that is beingrestored.
* This report does not include the captive brood programs which will be released in a separatereport.

Hatchery Anadromous Fish Escapement Summary
Species/Race Adults Jacks Eggtake Adults Jacks Adults JacksEggtake Goal
Total Trapped Released to stream Trapped less released
68,901 10,579 88,895,432 10,313 802 58,588 9,77799,275,000CHINOOK/FALL
9,981 7,937 11,624,505 1,852 3,217 8,129 4,72012,590,000CHINOOK/SPRING
6,135 312 7,143,330 858 231 5,277 817,435,000CHINOOK/SUMMER
85,017CHINOOKTOTAL 18,828 107,663,267 119,300,000 13,023 4,250 71,994 14,578
20,755 2 14,996,721 0 0 20,755 27,390,000CHUM/FALL
359 0 67,000 323 0 36 075,000CHUM/LATE
29,306 0 7,959,600 18,514 0 10,792 036,600,000CHUM/NA
50,420CHUMTOTAL 2 23,023,321 44,065,000 18,837 0 31,583 2
3,211 210 1,192,400 287 7 2,924 2031,069,000COHO/LATE
260,360 15,531 27,482,430 42,174 523 218,186 15,00829,903,800COHO/NA
2000-2001 Final Hatchery Escapement Report Page 3 June 03, 2002
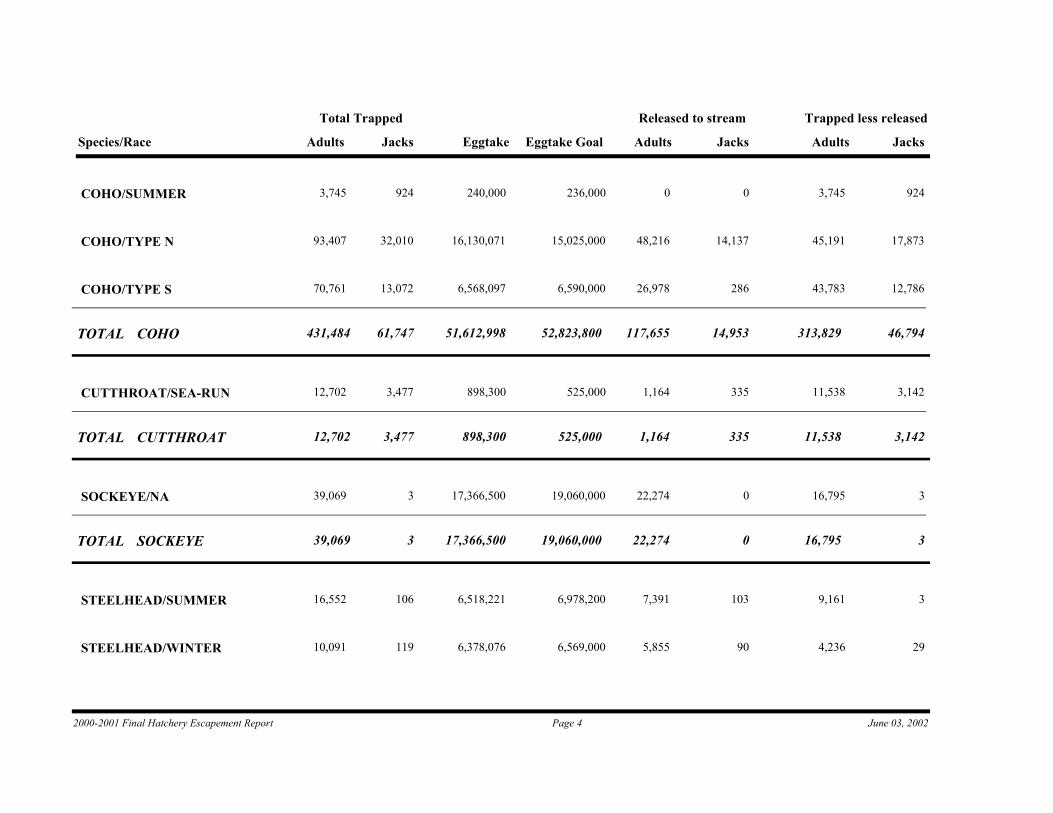
Species/Race Adults Jacks Eggtake Adults Jacks Adults JacksEggtake Goal
Total Trapped Released to stream Trapped less released
3,745 924 240,000 0 0 3,745 924236,000COHO/SUMMER
93,407 32,010 16,130,071 48,216 14,137 45,191 17,87315,025,000COHO/TYPE N
70,761 13,072 6,568,097 26,978 286 43,783 12,7866,590,000COHO/TYPE S
431,484COHOTOTAL 61,747 51,612,998 52,823,800 117,655 14,953 313,829 46,794
12,702 3,477 898,300 1,164 335 11,538 3,142525,000CUTTHROAT/SEA-RUN
12,702CUTTHROATTOTAL 3,477 898,300 525,000 1,164 335 11,538 3,142
39,069 3 17,366,500 22,274 0 16,795 319,060,000SOCKEYE/NA
39,069SOCKEYETOTAL 3 17,366,500 19,060,000 22,274 0 16,795 3
16,552 106 6,518,221 7,391 103 9,161 36,978,200STEELHEAD/SUMMER
10,091 119 6,378,076 5,855 90 4,236 296,569,000STEELHEAD/WINTER
2000-2001 Final Hatchery Escapement Report Page 4 June 03, 2002

Species/Race Adults Jacks Eggtake Adults Jacks Adults JacksEggtake Goal
Total Trapped Released to stream Trapped less released
1,106 122 1,028,000 804 120 302 21,108,000STEELHEAD/WINTER-LATE
27,749STEELHEADTOTAL 347 13,924,297 14,655,200 14,050 313 13,699 34
646,441Total Anadromous Escapement 84,404 214,488,683 250,429,000 187,003 19,851 459,438 64,553
2000-2001 Final Hatchery Escapement Report Page 5 June 03, 2002

Hatchery Resident Fish Escapement Summary
Species/Race Adults Eggtake Adults AdultsEggtake Goal
Total trapped Released to stream Trapped less released
9 0 6 3NACUTTHROAT/NA
4,491 1,671,025 4,371 1201,791,000CUTTHROAT/WESTSLOPE
294 0 294 0NADOLLY/BULL TR/NA
119,002 12,247,200 49 118,95313,950,000KOKANEE/NA
2,128 0 2,128 0NAWHITEFISH/NA
125,924Total Resident Escapement 13,918,225 15,741,000 6,848 119,076
2000-2001 Final Hatchery Escapement Report Page 6 June 03, 2002

Facility Bo Adults Jacks Eggtake Adults Jacks Adults Jacks
Trapped less releasedReleased to streamTotal Trapped
Stock
CHINOOK FALLEggtake goal
Puget Sound Region
H 25 2 50,000 0 0 25 2Nooksack RiverKENDALL CR HATCHERY NA
H 3,707 897 6,119,200 200 0 3,507 897SamishSAMISH HATCHERY 8,000,000
W 88 0 175,765 0 0 88 0Skagit RiverMARBLEMOUNT HATCHERY NA
H 90 9 0 90 9 0 0Tokul CreekTOKUL CR HATCHERY NA
H 1,931 53 2,000,000 0 0 1,931 53Skykomish RiverWALLACE R HATCHERY 1,760,000
H 3,676 458 2,454,000 1,221 49 2,455 409Issaquah CreekISSAQUAH HATCHERY 2,425,000
W 10 11 0 10 11 0 0Cedar RiverCEDAR RIVER HATCHERY NA
H 5,929 38 4,664,800 3,401 0 2,528 38Big Soos CreekSOOS CREEK HATCHERY 4,770,000
H 1,591 24 2,264,400 0 0 1,591 24Voight CreekVOIGHTS CR HATCHERY 2,500,000
H 2,250 602 2,659,000 891 0 1,359 602McAllister CreekMCALLISTER HATCHERY 1,650,000
H 336 555 523,600 27 2 309 553Chambers CreekGARRISON HATCHERY 1,400,000
H 5,671 277 4,863,000 2,838 39 2,833 238Deschutes RiverTUMWATER FALLS HATCH 4,800,000
H 6,170 1,281 4,660,000 0 0 6,170 1,281Minter CreekMINTER HATCHERY 3,700,000
H 4,031 1,490 4,349,900 0 0 4,031 1,490George AdamsGEORGE ADAMS HATCHRY 4,570,000
H 4,785 1,358 3,990,000 0 0 4,785 1,358Hood CanalHOODSPORT HATCHERY 3,600,000
2000-2001 Final Hatchery Escapement Report Page 7 June 03, 2002

Facility Bo Adults Jacks Eggtake Adults Jacks Adults Jacks
Trapped less releasedReleased to streamTotal Trapped
Stock
CHINOOK FALLEggtake goal
H 93 10 130,000 0 0 93 10Glenwood SpringsGLENWOOD SPRINGS
Cooperative project.
590,000
M 1,244 3 3,156,500 46 0 1,198 3Elwha RiverELWHA HATCHERY 5,000,000
Total 41,627Puget Sound Region 7,068 42,060,165 44,765,000 8,724 110 32,903 6,958
Coastal Region
H 169 2 262,000 0 0 169 2Humptulips RiverHUMPTULIPS HATCHERY 590,000
H 55 1 117,000 0 0 55 1Van Winkle CreekLK ABERDEEN HATCHERY 75,000
M 30 0 0 27 0 3 0Satsop RiverBINGHAM CR HATCHERY NA
H 2,306 15 4,001,000 0 0 2,306 15Willapa RiverFORKS CREEK HATCHERY 2,500,000
H 932 22 1,605,300 0 0 932 22Nemah RiverNEMAH HATCHERY 2,500,000
H 1,325 99 2,747,000 0 0 1,325 99Naselle RiverNASELLE HATCHERY 7,250,000
Total 4,817Coastal Region 139 8,732,300 12,915,000 27 0 4,790 139
Columbia River Region
H 73 0 0 27 0 46 0Grays RiverGRAYS RIVER HATCHERY NA
H 10 0 11,300 0 0 10 0Rogue RiverELOCHOMAN HATCHERY NA
H 1,753 9 2,946,000 0 0 1,753 9Elochoman RiverELOCHOMAN HATCHERY 2,300,000
2000-2001 Final Hatchery Escapement Report Page 8 June 03, 2002

Facility Bo Adults Jacks Eggtake Adults Jacks Adults Jacks
Trapped less releasedReleased to streamTotal Trapped
Stock
CHINOOK FALLEggtake goal
H 5 7 0 3 7 2 0Cowlitz RiverCOWLITZ TROUT HATCH NA
H 3,029 746 7,020,758 2 636 3,027 110Cowlitz RiverCOWLITZ SALMON HATCH 7,800,000
H 6 1 0 1 0 5 1Toutle RiverNORTH TOUTLE FCF
North Toutle Fish Collection Facility. 3 adults and 1 jack shipped to North Toutle Hatchery.
NA
H 1,617 127 779,494 820 0 797 127Toutle RiverNORTH TOUTLE HATCHRY
Additional 3 adults and 1 jack received from North Toutle FCF.
2,900,000
H 353 58 5,624,715 0 0 353 58Kalama RiverKALAMA FALLS HATCHRY
Additional 2098 adults and 14 jacks received from Modrow Trap.
4,120,000
H 2,462 14 0 364 0 2,098 14Kalama RiverMODROW TRAP
2098 adults and 14 jacks shipped from Modrow to Kalama Falls Hatchery.
NA
H 96 84 87,200 0 0 96 84Kalama RiverFALLERT CR HATCHERY NA
W 336 49 0 333 47 3 2Lewis RiverLEWIS RIVER HATCHERY NA
H 1,969 504 4,011,200 0 0 1,969 504Washougal RiverWASHOUGAL HATCHERY 4,700,000
H 3,513 1,330 3,667,300 10 2 3,503 1,328Snake RiverLYONS FERRY HATCHERY
Totals include 1526 adults and 926 jacks trapped at Lower Granite Dam and hauled to Lyons Ferry, and 1987 adults and 404 jacks volunteers to Lyons Ferry.
3,500,000
H 7,235 443 13,955,000 2 0 7,233 443Priest RapidsPRIEST RAPIDS HATCH. 16,275,000
Total 22,457Columbia River Region 3,372 38,102,967 41,595,000 1,562 692 20,895 2,680
Total Statewide 68,901 10,579 88,895,432 99,275,000 10,313 802 58,588 9,777
2000-2001 Final Hatchery Escapement Report Page 9 June 03, 2002
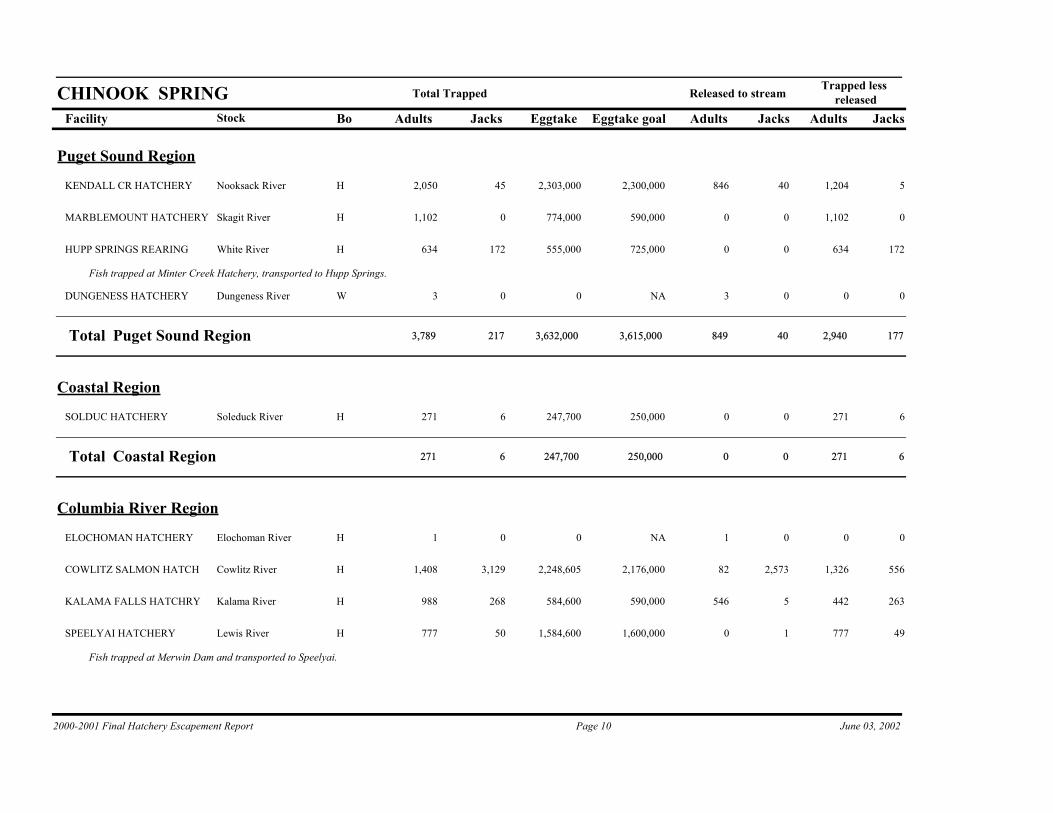
Facility Bo Adults Jacks Eggtake Adults Jacks Adults Jacks
Trapped less releasedReleased to streamTotal Trapped
Stock
CHINOOK SPRINGEggtake goal
Puget Sound Region
H 2,050 45 2,303,000 846 40 1,204 5Nooksack RiverKENDALL CR HATCHERY 2,300,000
H 1,102 0 774,000 0 0 1,102 0Skagit RiverMARBLEMOUNT HATCHERY 590,000
H 634 172 555,000 0 0 634 172White RiverHUPP SPRINGS REARING
Fish trapped at Minter Creek Hatchery, transported to Hupp Springs.
725,000
W 3 0 0 3 0 0 0Dungeness RiverDUNGENESS HATCHERY NA
Total 3,789Puget Sound Region 217 3,632,000 3,615,000 849 40 2,940 177
Coastal Region
H 271 6 247,700 0 0 271 6Soleduck RiverSOLDUC HATCHERY 250,000
Total 271Coastal Region 6 247,700 250,000 0 0 271 6
Columbia River Region
H 1 0 0 1 0 0 0Elochoman RiverELOCHOMAN HATCHERY NA
H 1,408 3,129 2,248,605 82 2,573 1,326 556Cowlitz RiverCOWLITZ SALMON HATCH 2,176,000
H 988 268 584,600 546 5 442 263Kalama RiverKALAMA FALLS HATCHRY 590,000
H 777 50 1,584,600 0 1 777 49Lewis RiverSPEELYAI HATCHERY
Fish trapped at Merwin Dam and transported to Speelyai.
1,600,000
2000-2001 Final Hatchery Escapement Report Page 10 June 03, 2002

Facility Bo Adults Jacks Eggtake Adults Jacks Adults Jacks
Trapped less releasedReleased to streamTotal Trapped
Stock
CHINOOK SPRINGEggtake goal
H 965 3,777 1,379,200 224 210 741 3,567Klickitat RiverKLICKITAT HATCHERY
Jack totals include 3730 mini-jacks.
950,000
H 66 0 126,000 0 0 66 0Tucannon RiverLYONS FERRY HATCHERY
Trapped at Tucannon and transported to Lyons Ferry. Evaluation team reported final totals of 169 adults and 11 jacks trapped, 94 adults passed upstream, 63 adults and 6 jacks collected for broodstock, and 17 stray fish killed.
80,000
H 512 56 988,000 0 0 512 56Rapid River - IdahoLYONS FERRY HATCHERY
Trapped at Lower Granite Dam and transported to Lyons Ferry.
2,000,000
W 10 5 10,500 0 0 10 5Tucannon RiverLYONS FERRY HATCHERY
Trapped at Tucannon and transported to Lyons Ferry. Evaluation team reported final totals of 18 adults and 11 jacks trapped, 10 adults and 3 jacks passed upstream, 8 adults and 4 jacks collected for broodstock.
80,000
H 503 329 0 0 316 503 13RingoldRINGOLD SPRINGS HATC NA
M 12 8 49,500 4 5 8 3Chiwawa RiverEASTBANK HATCHERY
Fish trapped at Tumwater Dam and shipped to Eastbank. Additional 27 adults and 10 jacks trapped at Chiwawa and shipped to Eastbank.
809,000
M 49 34 0 49 34 0 0Wenatchee RiverEASTBANK HATCHERY NA
M 53 43 0 26 33 27 10Chiwawa RiverCHIWAWA HATCHERY
27 adults and 10 jacks shipped to Eastbank Hatchery.
NA
M 577 15 773,800 71 0 506 15Methow RiverMETHOW HATCHERY
162 Adults trapped at Methow Hatchery and shipped to Winthrop NFH. Remainder were trapped at Wells West Ladder and shipped to Methow Hatchery.
440,000
Total 5,921Columbia River Region 7,714 7,744,805 8,725,000 1,003 3,177 4,918 4,537
Total Statewide 9,981 7,937 11,624,505 12,590,000 1,852 3,217 8,129 4,720
2000-2001 Final Hatchery Escapement Report Page 11 June 03, 2002
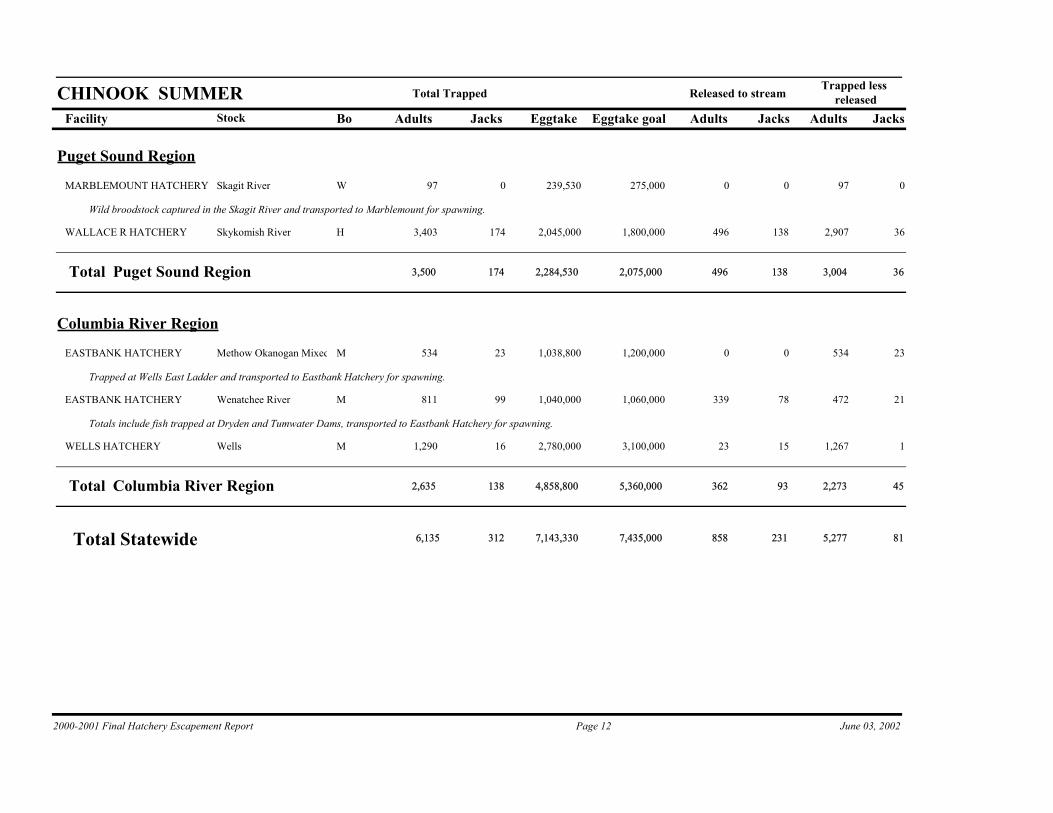
Facility Bo Adults Jacks Eggtake Adults Jacks Adults Jacks
Trapped less releasedReleased to streamTotal Trapped
Stock
CHINOOK SUMMEREggtake goal
Puget Sound Region
W 97 0 239,530 0 0 97 0Skagit RiverMARBLEMOUNT HATCHERY
Wild broodstock captured in the Skagit River and transported to Marblemount for spawning.
275,000
H 3,403 174 2,045,000 496 138 2,907 36Skykomish RiverWALLACE R HATCHERY 1,800,000
Total 3,500Puget Sound Region 174 2,284,530 2,075,000 496 138 3,004 36
Columbia River Region
M 534 23 1,038,800 0 0 534 23Methow Okanogan MixedEASTBANK HATCHERY
Trapped at Wells East Ladder and transported to Eastbank Hatchery for spawning.
1,200,000
M 811 99 1,040,000 339 78 472 21Wenatchee RiverEASTBANK HATCHERY
Totals include fish trapped at Dryden and Tumwater Dams, transported to Eastbank Hatchery for spawning.
1,060,000
M 1,290 16 2,780,000 23 15 1,267 1WellsWELLS HATCHERY 3,100,000
Total 2,635Columbia River Region 138 4,858,800 5,360,000 362 93 2,273 45
Total Statewide 6,135 312 7,143,330 7,435,000 858 231 5,277 81
2000-2001 Final Hatchery Escapement Report Page 12 June 03, 2002
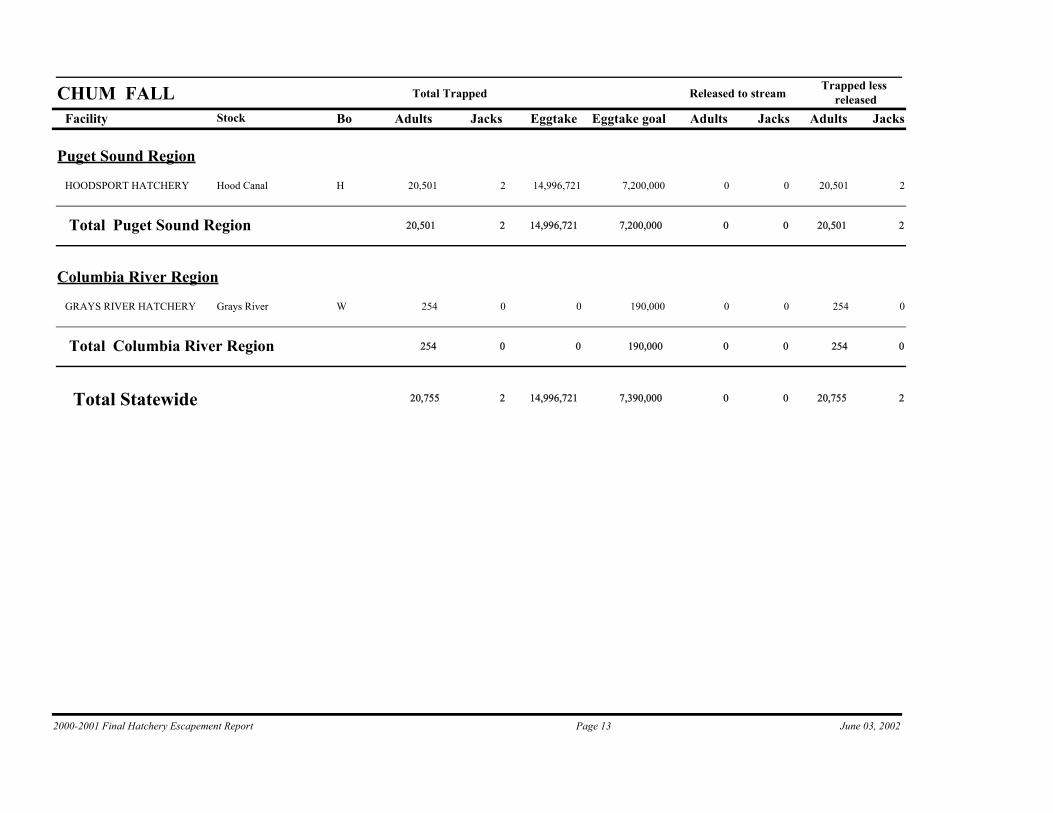
Facility Bo Adults Jacks Eggtake Adults Jacks Adults Jacks
Trapped less releasedReleased to streamTotal Trapped
Stock
CHUM FALLEggtake goal
Puget Sound Region
H 20,501 2 14,996,721 0 0 20,501 2Hood CanalHOODSPORT HATCHERY 7,200,000
Total 20,501Puget Sound Region 2 14,996,721 7,200,000 0 0 20,501 2
Columbia River Region
W 254 0 0 0 0 254 0Grays RiverGRAYS RIVER HATCHERY 190,000
Total 254Columbia River Region 0 0 190,000 0 0 254 0
Total Statewide 20,755 2 14,996,721 7,390,000 0 0 20,755 2
2000-2001 Final Hatchery Escapement Report Page 13 June 03, 2002
Facility Bo Adults Jacks Eggtake Adults Jacks Adults Jacks
Trapped less releasedReleased to streamTotal Trapped
Stock
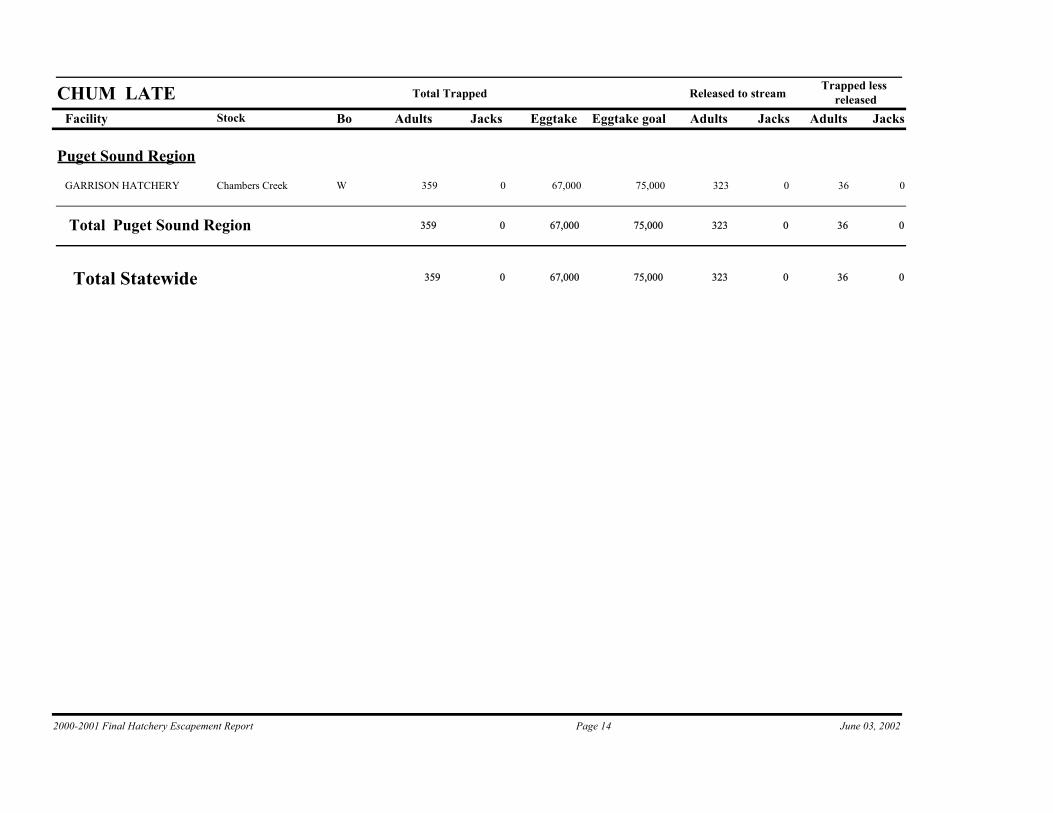
CHUM LATEEggtake goal
Puget Sound Region
W 359 0 67,000 323 0 36 0Chambers CreekGARRISON HATCHERY 75,000
Total 359Puget Sound Region 0 67,000 75,000 323 0 36 0
Total Statewide 359 0 67,000 75,000 323 0 36 0
2000-2001 Final Hatchery Escapement Report Page 14 June 03, 2002

Facility Bo Adults Jacks Eggtake Adults Jacks Adults Jacks
Trapped less releasedReleased to streamTotal Trapped
Stock
CHUM NAEggtake goal
Puget Sound Region
H 317 0 272,000 0 0 317 0Nooksack RiverKENDALL CR HATCHERY 2,400,000
H 1,589 0 1,422,500 0 0 1,589 0George AdamsGEORGE ADAMS HATCHRY 10,000,000
H 2,158 0 1,376,900 0 0 2,158 0McKernanMCKERNAN HATCHERY 17,900,000
H 24,973 0 4,736,000 18,399 0 6,574 0Minter CreekMINTER HATCHERY 6,100,000
Total 29,037Puget Sound Region 0 7,807,400 36,400,000 18,399 0 10,638 0
Coastal Region
W 203 0 152,200 58 0 145 0Nemah RiverNEMAH HATCHERY 200,000
H 48 0 0 39 0 9 0Naselle RiverNASELLE HATCHERY NA
Total 251Coastal Region 0 152,200 200,000 97 0 154 0
Columbia River Region
W 18 0 0 18 0 0 0Cowlitz RiverCOWLITZ SALMON HATCH NA
Total 18Columbia River Region 0 0 NA 18 0 0 0
Total Statewide 29,306 0 7,959,600 36,600,000 18,514 0 10,792 0
2000-2001 Final Hatchery Escapement Report Page 15 June 03, 2002

Facility Bo Adults Jacks Eggtake Adults Jacks Adults Jacks
Trapped less releasedReleased to streamTotal Trapped
Stock
COHO LATEEggtake goal
Coastal Region
H 318 53 236,000 0 0 318 53Satsop RiverHUMPTULIPS HATCHERY 236,000
M 823 125 588,000 195 7 628 118Bingham CreekBINGHAM CR HATCHERY 530,000
H 1,883 30 156,000 92 0 1,791 30Willapa RiverFORKS CREEK HATCHERY 115,000
H 187 2 212,400 0 0 187 2Naselle RiverNASELLE HATCHERY 188,000
Total 3,211Coastal Region 210 1,192,400 1,069,000 287 7 2,924 203
Total Statewide 3,211 210 1,192,400 1,069,000 287 7 2,924 203
2000-2001 Final Hatchery Escapement Report Page 16 June 03, 2002

Facility Bo Adults Jacks Eggtake Adults Jacks Adults Jacks
Trapped less releasedReleased to streamTotal Trapped
Stock
COHO NAEggtake goal
Puget Sound Region
H 3,100 211 710,000 500 20 2,600 191Nooksack RiverKENDALL CR HATCHERY 600,000
M 4,745 342 2,000 4,742 342 3 0SamishSAMISH HATCHERY 5,000
H 11,110 7 1,041,370 594 0 10,516 7Skagit RiverMARBLEMOUNT HATCHERY 650,000
H 24 7 0 24 7 0 0Tokul CreekTOKUL CR HATCHERY NA
H 26,213 50 3,475,000 0 0 26,213 50Skykomish RiverWALLACE R HATCHERY 6,341,000
H 27,225 65 3,566,660 20,691 29 6,534 36Issaquah CreekISSAQUAH HATCHERY 3,300,000
W 27 0 0 27 0 0 0Cedar RiverCEDAR RIVER HATCHERY NA
H 43,774 153 2,906,000 10,601 0 33,173 153Big Soos CreekSOOS CREEK HATCHERY 2,825,000
H 39,394 238 1,945,300 0 0 39,394 238Voight CreekVOIGHTS CR HATCHERY 1,800,000
W 41 0 0 41 0 0 0Chambers CreekGARRISON HATCHERY NA
H 15,433 677 3,930,000 892 2 14,541 675Minter CreekMINTER HATCHERY 5,300,000
H 9,465 862 712,400 0 0 9,465 862George AdamsGEORGE ADAMS HATCHRY 590,000
H 48 11 0 0 0 48 11Hood CanalHOODSPORT HATCHERY NA
H 400 200 120,000 0 0 400 200Glenwood SpringsGLENWOOD SPRINGS
Cooperative project.
NA
H 17,351 247 623,200 0 0 17,351 247Dungeness RiverDUNGENESS HATCHERY 627,800
2000-2001 Final Hatchery Escapement Report Page 17 June 03, 2002
Facility Bo Adults Jacks Eggtake Adults Jacks Adults Jacks
Trapped less releasedReleased to streamTotal Trapped
Stock
COHO NAEggtake goal
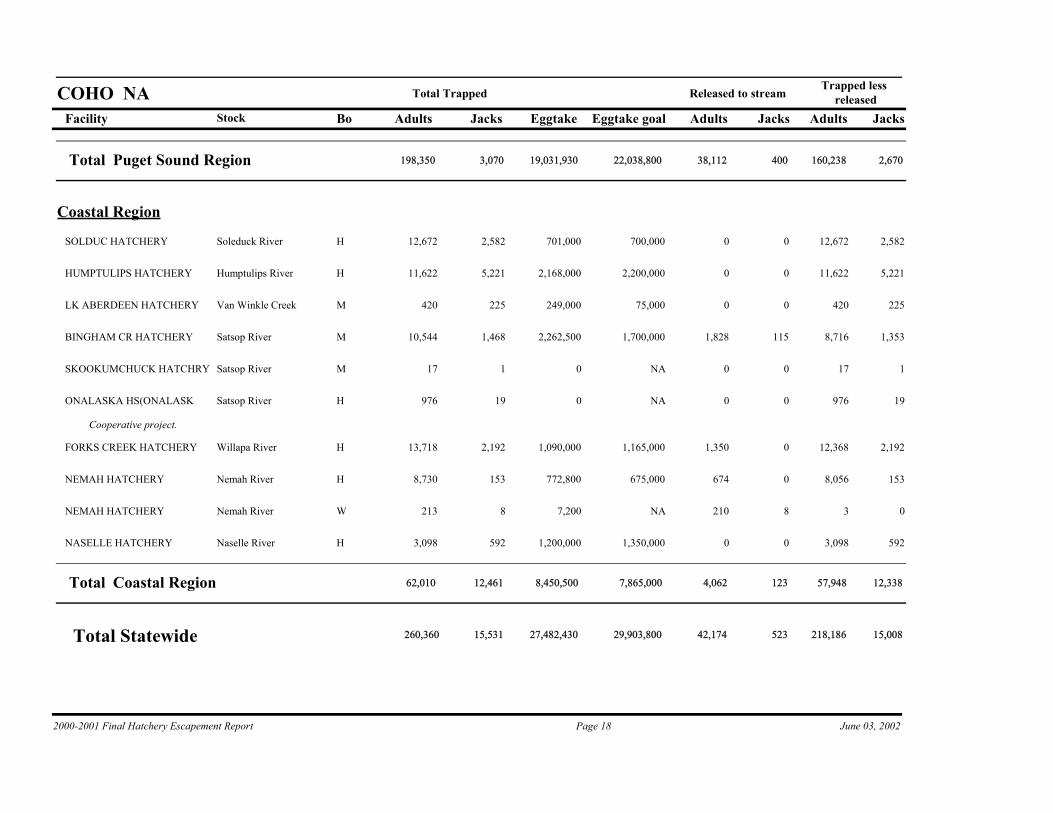
Total 198,350Puget Sound Region 3,070 19,031,930 22,038,800 38,112 400 160,238 2,670
Coastal Region
H 12,672 2,582 701,000 0 0 12,672 2,582Soleduck RiverSOLDUC HATCHERY 700,000
H 11,622 5,221 2,168,000 0 0 11,622 5,221Humptulips RiverHUMPTULIPS HATCHERY 2,200,000
M 420 225 249,000 0 0 420 225Van Winkle CreekLK ABERDEEN HATCHERY 75,000
M 10,544 1,468 2,262,500 1,828 115 8,716 1,353Satsop RiverBINGHAM CR HATCHERY 1,700,000
M 17 1 0 0 0 17 1Satsop RiverSKOOKUMCHUCK HATCHRY NA
H 976 19 0 0 0 976 19Satsop RiverONALASKA HS(ONALASK
Cooperative project.
NA
H 13,718 2,192 1,090,000 1,350 0 12,368 2,192Willapa RiverFORKS CREEK HATCHERY 1,165,000
H 8,730 153 772,800 674 0 8,056 153Nemah RiverNEMAH HATCHERY 675,000
W 213 8 7,200 210 8 3 0Nemah RiverNEMAH HATCHERY NA
H 3,098 592 1,200,000 0 0 3,098 592Naselle RiverNASELLE HATCHERY 1,350,000
Total 62,010Coastal Region 12,461 8,450,500 7,865,000 4,062 123 57,948 12,338
Total Statewide 260,360 15,531 27,482,430 29,903,800 42,174 523 218,186 15,008
2000-2001 Final Hatchery Escapement Report Page 18 June 03, 2002

Facility Bo Adults Jacks Eggtake Adults Jacks Adults Jacks
Trapped less releasedReleased to streamTotal Trapped
Stock
COHO SUMMEREggtake goal
Coastal Region
H 3,745 924 240,000 0 0 3,745 924Soleduck RiverSOLDUC HATCHERY 236,000
Total 3,745Coastal Region 924 240,000 236,000 0 0 3,745 924
Total Statewide 3,745 924 240,000 236,000 0 0 3,745 924
2000-2001 Final Hatchery Escapement Report Page 19 June 03, 2002
Facility Bo Adults Jacks Eggtake Adults Jacks Adults Jacks
Trapped less releasedReleased to streamTotal Trapped
Stock
COHO TYPE NEggtake goal
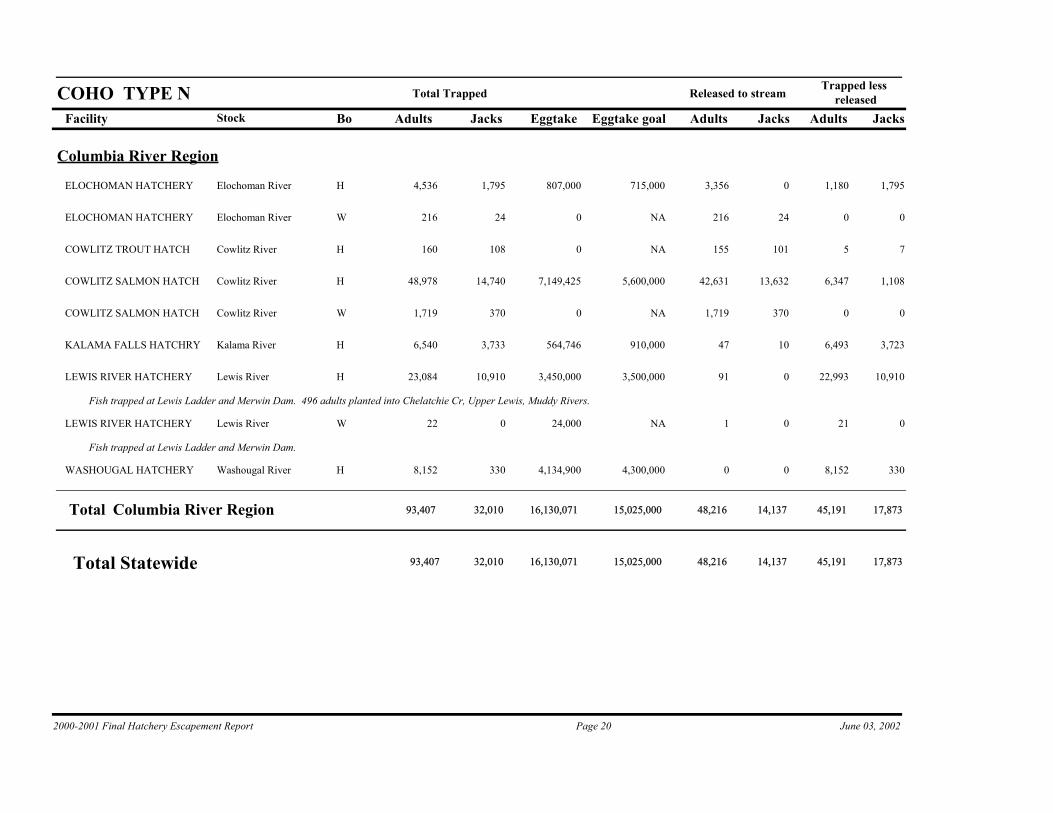
Columbia River Region
H 4,536 1,795 807,000 3,356 0 1,180 1,795Elochoman RiverELOCHOMAN HATCHERY 715,000
W 216 24 0 216 24 0 0Elochoman RiverELOCHOMAN HATCHERY NA
H 160 108 0 155 101 5 7Cowlitz RiverCOWLITZ TROUT HATCH NA
H 48,978 14,740 7,149,425 42,631 13,632 6,347 1,108Cowlitz RiverCOWLITZ SALMON HATCH 5,600,000
W 1,719 370 0 1,719 370 0 0Cowlitz RiverCOWLITZ SALMON HATCH NA
H 6,540 3,733 564,746 47 10 6,493 3,723Kalama RiverKALAMA FALLS HATCHRY 910,000
H 23,084 10,910 3,450,000 91 0 22,993 10,910Lewis RiverLEWIS RIVER HATCHERY
Fish trapped at Lewis Ladder and Merwin Dam. 496 adults planted into Chelatchie Cr, Upper Lewis, Muddy Rivers.
3,500,000
W 22 0 24,000 1 0 21 0Lewis RiverLEWIS RIVER HATCHERY
Fish trapped at Lewis Ladder and Merwin Dam.
NA
H 8,152 330 4,134,900 0 0 8,152 330Washougal RiverWASHOUGAL HATCHERY 4,300,000
Total 93,407Columbia River Region 32,010 16,130,071 15,025,000 48,216 14,137 45,191 17,873
Total Statewide 93,407 32,010 16,130,071 15,025,000 48,216 14,137 45,191 17,873
2000-2001 Final Hatchery Escapement Report Page 20 June 03, 2002
Facility Bo Adults Jacks Eggtake Adults Jacks Adults Jacks
Trapped less releasedReleased to streamTotal Trapped
Stock
COHO TYPE SEggtake goal
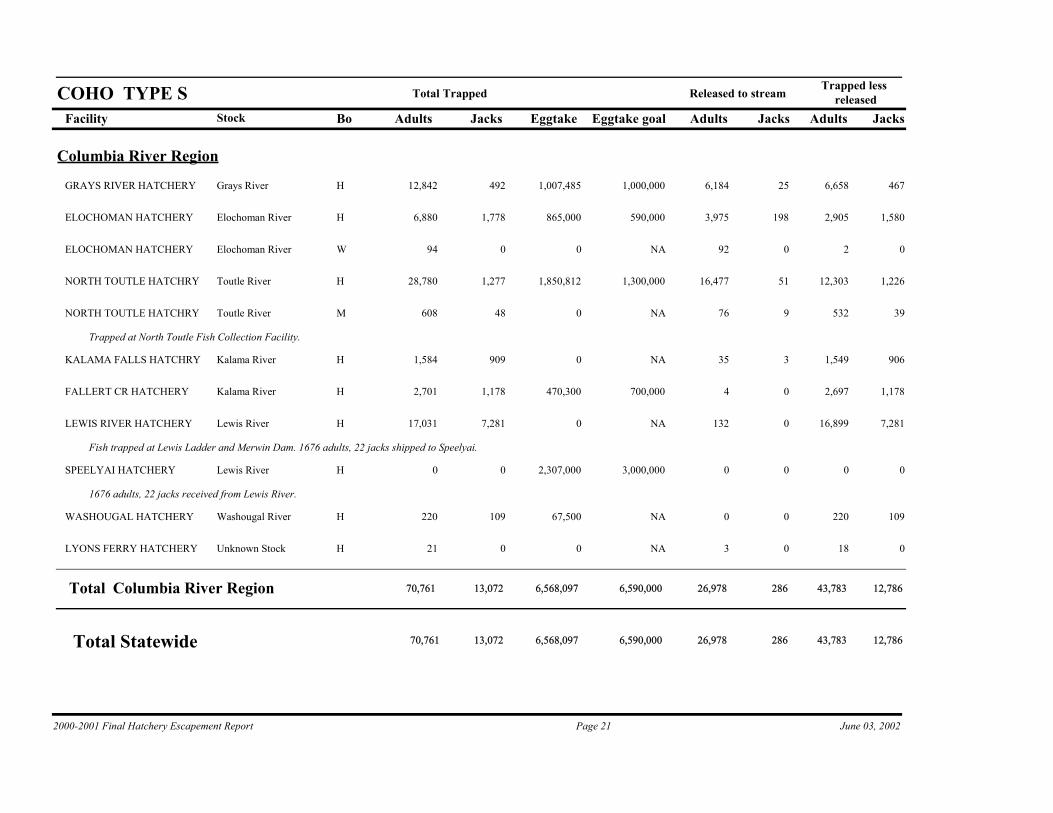
Columbia River Region
H 12,842 492 1,007,485 6,184 25 6,658 467Grays RiverGRAYS RIVER HATCHERY 1,000,000
H 6,880 1,778 865,000 3,975 198 2,905 1,580Elochoman RiverELOCHOMAN HATCHERY 590,000
W 94 0 0 92 0 2 0Elochoman RiverELOCHOMAN HATCHERY NA
H 28,780 1,277 1,850,812 16,477 51 12,303 1,226Toutle RiverNORTH TOUTLE HATCHRY 1,300,000
M 608 48 0 76 9 532 39Toutle RiverNORTH TOUTLE HATCHRY
Trapped at North Toutle Fish Collection Facility.
NA
H 1,584 909 0 35 3 1,549 906Kalama RiverKALAMA FALLS HATCHRY NA
H 2,701 1,178 470,300 4 0 2,697 1,178Kalama RiverFALLERT CR HATCHERY 700,000
H 17,031 7,281 0 132 0 16,899 7,281Lewis RiverLEWIS RIVER HATCHERY
Fish trapped at Lewis Ladder and Merwin Dam. 1676 adults, 22 jacks shipped to Speelyai.
NA
H 0 0 2,307,000 0 0 0 0Lewis RiverSPEELYAI HATCHERY
1676 adults, 22 jacks received from Lewis River.
3,000,000
H 220 109 67,500 0 0 220 109Washougal RiverWASHOUGAL HATCHERY NA
H 21 0 0 3 0 18 0Unknown StockLYONS FERRY HATCHERY NA
Total 70,761Columbia River Region 13,072 6,568,097 6,590,000 26,978 286 43,783 12,786
Total Statewide 70,761 13,072 6,568,097 6,590,000 26,978 286 43,783 12,786
2000-2001 Final Hatchery Escapement Report Page 21 June 03, 2002
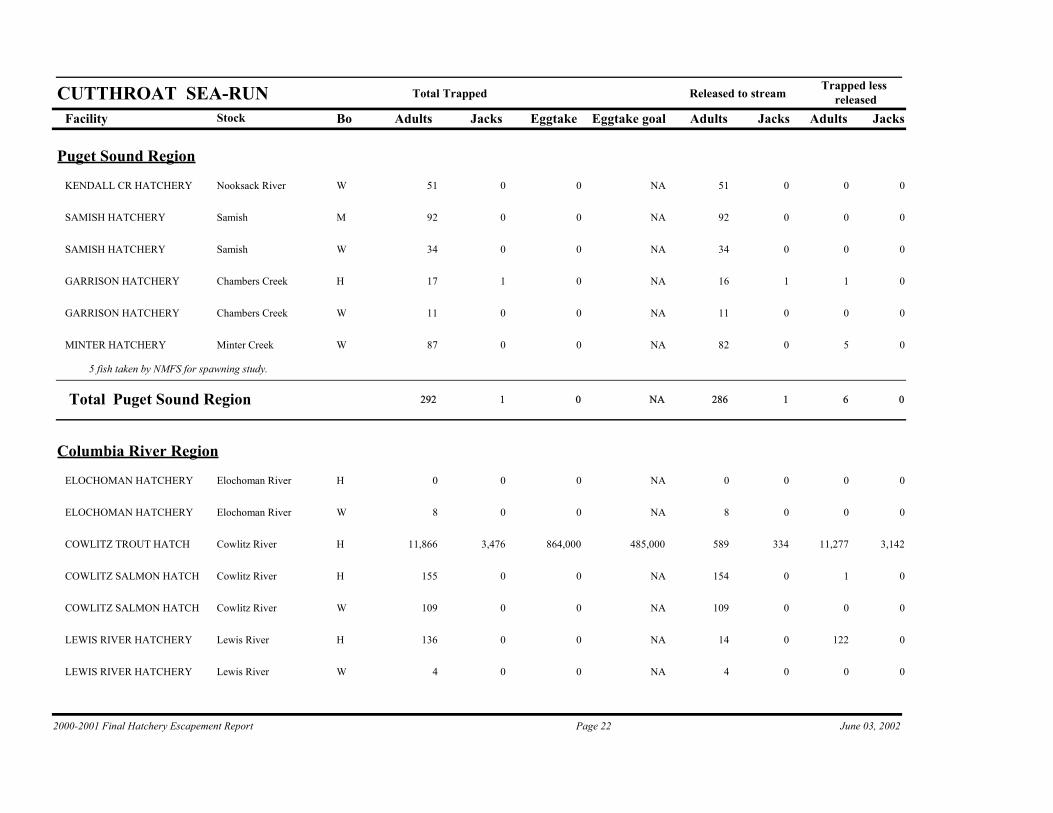
Facility Bo Adults Jacks Eggtake Adults Jacks Adults Jacks
Trapped less releasedReleased to streamTotal Trapped
Stock
CUTTHROAT SEA-RUNEggtake goal
Puget Sound Region
W 51 0 0 51 0 0 0Nooksack RiverKENDALL CR HATCHERY NA
M 92 0 0 92 0 0 0SamishSAMISH HATCHERY NA
W 34 0 0 34 0 0 0SamishSAMISH HATCHERY NA
H 17 1 0 16 1 1 0Chambers CreekGARRISON HATCHERY NA
W 11 0 0 11 0 0 0Chambers CreekGARRISON HATCHERY NA
W 87 0 0 82 0 5 0Minter CreekMINTER HATCHERY
5 fish taken by NMFS for spawning study.
NA
Total 292Puget Sound Region 1 0 NA 286 1 6 0
Columbia River Region
H 0 0 0 0 0 0 0Elochoman RiverELOCHOMAN HATCHERY NA
W 8 0 0 8 0 0 0Elochoman RiverELOCHOMAN HATCHERY NA
H 11,866 3,476 864,000 589 334 11,277 3,142Cowlitz RiverCOWLITZ TROUT HATCH 485,000
H 155 0 0 154 0 1 0Cowlitz RiverCOWLITZ SALMON HATCH NA
W 109 0 0 109 0 0 0Cowlitz RiverCOWLITZ SALMON HATCH NA
H 136 0 0 14 0 122 0Lewis RiverLEWIS RIVER HATCHERY NA
W 4 0 0 4 0 0 0Lewis RiverLEWIS RIVER HATCHERY NA
2000-2001 Final Hatchery Escapement Report Page 22 June 03, 2002
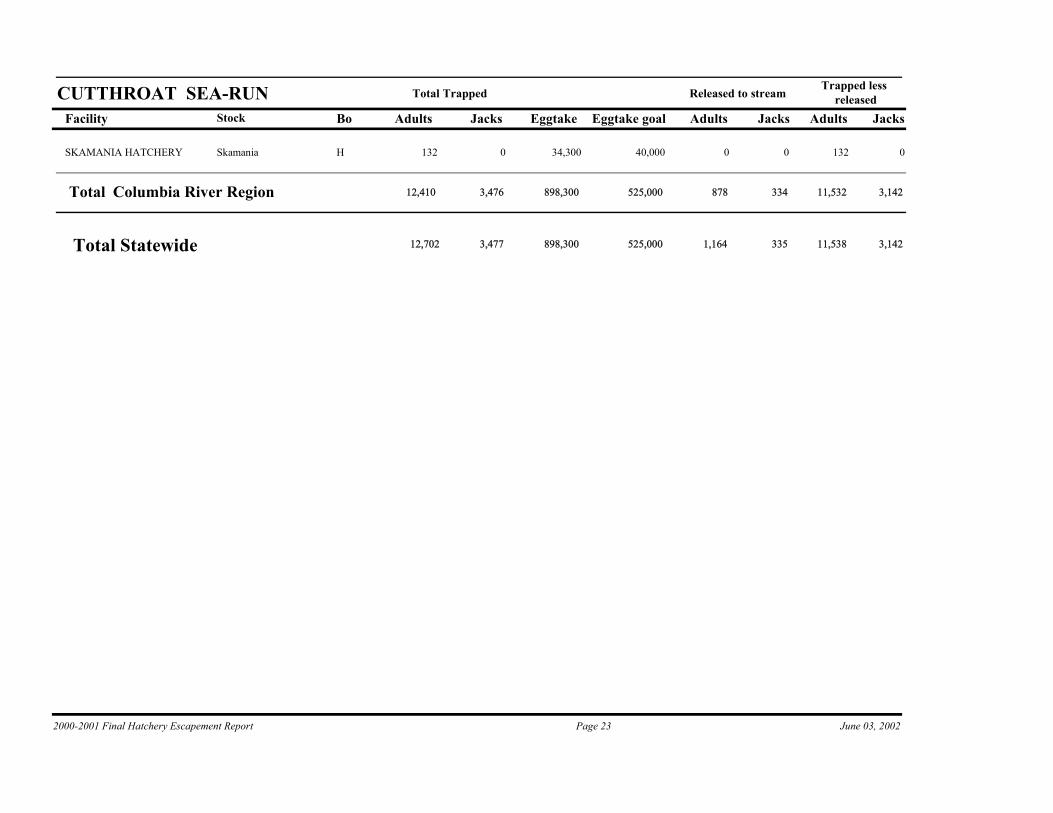
Facility Bo Adults Jacks Eggtake Adults Jacks Adults Jacks
Trapped less releasedReleased to streamTotal Trapped
Stock
CUTTHROAT SEA-RUNEggtake goal
H 132 0 34,300 0 0 132 0SkamaniaSKAMANIA HATCHERY 40,000
Total 12,410Columbia River Region 3,476 898,300 525,000 878 334 11,532 3,142
Total Statewide 12,702 3,477 898,300 525,000 1,164 335 11,538 3,142
2000-2001 Final Hatchery Escapement Report Page 23 June 03, 2002

Facility Bo Adults Jacks Eggtake Adults Jacks Adults Jacks
Trapped less releasedReleased to streamTotal Trapped
Stock
SOCKEYE NAEggtake goal
Puget Sound Region
H 10,303 0 0 5,155 0 5,148 0Baker RiverBAKER SP BEACHES 3+4
Baker Spawning Beaches.
NA
W 8,466 0 0 8,242 0 224 0Issaquah CreekISSAQUAH HATCHERY NA
M 18,674 3 17,171,000 7,447 0 11,227 3Cedar RiverCEDAR RIVER HATCHERY 18,800,000
Total 37,443Puget Sound Region 3 17,171,000 18,800,000 20,844 0 16,599 3
Coastal Region
H 3 0 0 1 0 2 0Wynoochee RiverLK ABERDEEN HATCHERY NA
Total 3Coastal Region 0 0 NA 1 0 2 0
Columbia River Region
M 531 0 0 531 0 0 0Lake WenatcheeWENATCHEE NET PENS
Fish trapped and returned to stream at Dryden and Tumwater FCF.
NA
M 1,092 0 195,500 898 0 194 0Lake WenatcheeCHIWAWA HATCHERY
Fish trapped at Tumwater FCF and returned to stream or shipped to Wenatchee Net Pens for spawning.
260,000
Total 1,623Columbia River Region 0 195,500 260,000 1,429 0 194 0
Total Statewide 39,069 3 17,366,500 19,060,000 22,274 0 16,795 3
2000-2001 Final Hatchery Escapement Report Page 24 June 03, 2002

Facility Bo Adults Jacks Eggtake Adults Jacks Adults Jacks
Trapped less releasedReleased to streamTotal Trapped
Stock
STEELHEAD SUMMEREggtake goal
Puget Sound Region
H 33 0 0 33 0 0 0Stillaguamish RiverWHITEHORSE POND 90,000
H 98 0 0 89 0 9 0Snohomish RiverTOKUL CR HATCHERY NA
H 249 0 0 0 0 249 0Snohomish RiverWALLACE R HATCHERY NA
H 421 0 811,500 0 0 421 0Snohomish RiverREITER PONDS 800,000
H 54 0 90,000 0 0 54 0Green RiverPALMER HATCHERY NA
Total 855Puget Sound Region 0 901,500 890,000 122 0 733 0
Coastal Region
H 521 0 144,000 0 0 521 0Quillayute RiverBOGACHIEL HATCHERY 190,000
H 183 0 0 0 0 183 0Van Winkle CreekHUMPTULIPS HATCHERY NA
H 936 0 301,000 0 0 936 0Van Winkle CreekLK ABERDEEN HATCHERY 125,000
Total 1,640Coastal Region 0 445,000 315,000 0 0 1,640 0
Columbia River Region
H 8 0 0 8 0 0 0Elochoman RiverELOCHOMAN HATCHERY NA
H 1,370 40 1,113,400 1,206 68 789 1Cowlitz RiverCOWLITZ TROUT HATCH
625 adults and 29 jacks received from Cowlitz Salmon Hatchery.
952,000
2000-2001 Final Hatchery Escapement Report Page 25 June 03, 2002

Facility Bo Adults Jacks Eggtake Adults Jacks Adults Jacks
Trapped less releasedReleased to streamTotal Trapped
Stock
STEELHEAD SUMMEREggtake goal
H 2,153 64 0 1,517 35 11 0Cowlitz RiverCOWLITZ SALMON HATCH
625 adults and 29 jacks shipped to Cowlitz Trout Hatchery. Escapement less upstream totals do not include these shipped fish.
NA
W 6 0 0 6 0 0 0Cowlitz RiverCOWLITZ SALMON HATCH NA
H 53 0 0 46 0 7 0Toutle RiverNORTH TOUTLE HATCHRY NA
H 864 0 0 864 0 0 0Kalama RiverKALAMA FALLS HATCHRY NA
W 317 0 101,165 307 0 10 0Kalama RiverKALAMA FALLS HATCHRY 90,000
H 2,071 0 0 931 0 1,140 0Lewis RiverLEWIS RIVER HATCHERY
Trapped at Merwin Dam and Lewis Ladder. 740 adults shipped to Merwin Hatchery.
NA
W 8 0 0 8 0 0 0Lewis RiverLEWIS RIVER HATCHERY NA
H 0 0 474,000 0 0 0 0Lewis RiverMERWIN HATCHERY
740 adults received from Merwin Dam and Lewis Ladder.
300,000
H 2,616 0 632,000 0 0 2,616 0SkamaniaSKAMANIA HATCHERY 1,100,000
H 2,929 0 800,350 1,711 0 1,218 0Lyons FerryLYONS FERRY HATCHERY 1,000,000
W 35 0 67,861 2 0 33 0Touchet RiverLYONS FERRY HATCHERY
Trapped at Dayton trap.
85,600
W 35 0 113,563 10 0 25 0Tucannon RiverLYONS FERRY HATCHERY 85,600
H 2 0 0 2 0 0 0Tucannon RiverTUCANNON HATCHERY NA
H 776 2 504,182 376 0 400 2WallowaCOTTONWOOD CR POND 450,000
H 37 0 0 21 0 16 0WellsRINGOLD SPRINGS HATC NA
2000-2001 Final Hatchery Escapement Report Page 26 June 03, 2002
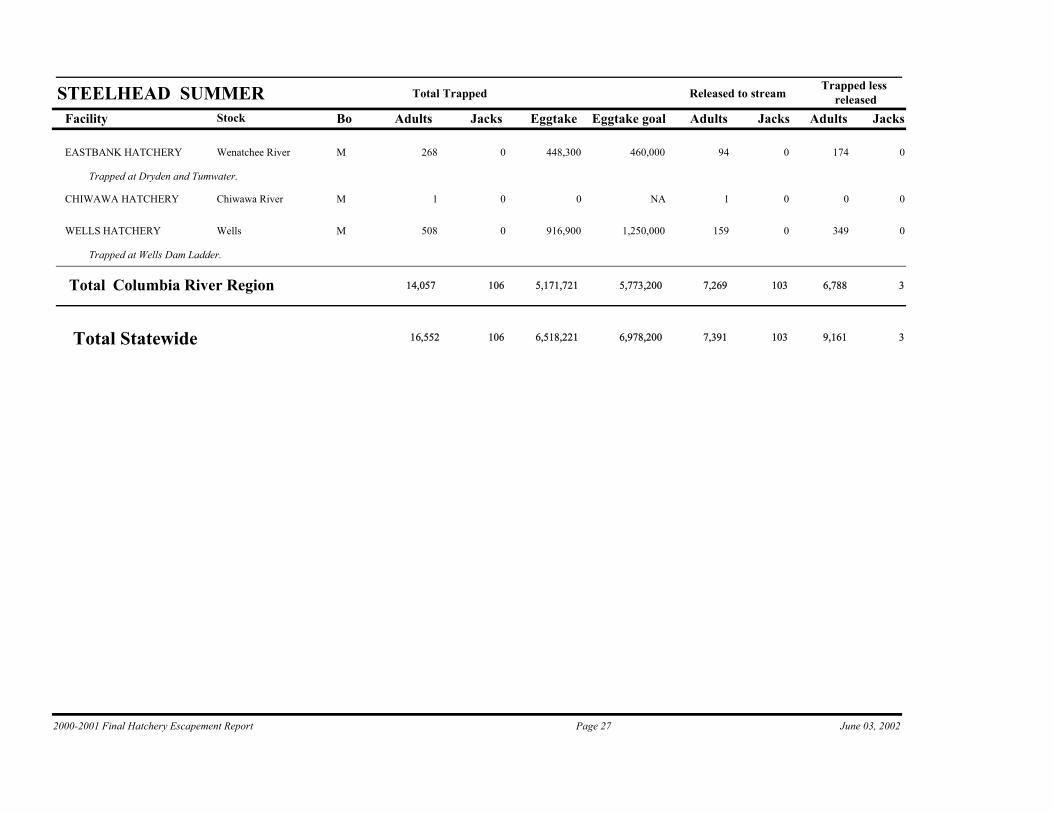
Facility Bo Adults Jacks Eggtake Adults Jacks Adults Jacks
Trapped less releasedReleased to streamTotal Trapped
Stock
STEELHEAD SUMMEREggtake goal
M 268 0 448,300 94 0 174 0Wenatchee RiverEASTBANK HATCHERY
Trapped at Dryden and Tumwater.
460,000
M 1 0 0 1 0 0 0Chiwawa RiverCHIWAWA HATCHERY NA
M 508 0 916,900 159 0 349 0WellsWELLS HATCHERY
Trapped at Wells Dam Ladder.
1,250,000
Total 14,057Columbia River Region 106 5,171,721 5,773,200 7,269 103 6,788 3
Total Statewide 16,552 106 6,518,221 6,978,200 7,391 103 9,161 3
2000-2001 Final Hatchery Escapement Report Page 27 June 03, 2002

Facility Bo Adults Jacks Eggtake Adults Jacks Adults Jacks
Trapped less releasedReleased to streamTotal Trapped
Stock
STEELHEAD WINTEREggtake goal
Puget Sound Region
H 18 0 15,000 6 0 12 0Nooksack RiverKENDALL CR HATCHERY NA
H 339 0 648,900 49 0 290 0Skagit RiverMARBLEMOUNT HATCHERY 250,000
H 91 0 180,000 17 0 74 0Stillaguamish RiverWHITEHORSE POND 360,000
H 483 0 938,500 176 0 307 0Snohomish RiverTOKUL CR HATCHERY 1,200,000
H 3 0 0 3 0 0 0Lake WashingtonISSAQUAH HATCHERY NA
W 2 0 0 2 0 0 0Cedar RiverCEDAR RIVER HATCHERY NA
H 19 0 18,000 0 0 19 0Green RiverPALMER HATCHERY NA
H 49 0 84,000 0 0 49 0Puallup RiverVOIGHTS CR HATCHERY 500,000
W 2 0 0 2 0 0 0Chambers CreekGARRISON HATCHERY NA
H 3 0 3,000 0 0 3 0Dungeness RiverDUNGENESS HATCHERY 11,000
H 109 0 85,930 0 0 109 0Elwha RiverELWHA HATCHERY NA
Total 1,118Puget Sound Region 0 1,973,330 2,321,000 255 0 863 0
Coastal Region
W 45 0 76,000 10 0 35 0Soleduck RiverSOLDUC HATCHERY 80,000
H 1 0 0 0 0 1 0Quillayute RiverBOGACHIEL HATCHERY NA
H 701 15 1,033,000 0 0 701 15Bogachiel RiverBOGACHIEL HATCHERY 900,000
2000-2001 Final Hatchery Escapement Report Page 28 June 03, 2002

Facility Bo Adults Jacks Eggtake Adults Jacks Adults Jacks
Trapped less releasedReleased to streamTotal Trapped
Stock
STEELHEAD WINTEREggtake goal
H 204 0 200,000 0 0 204 0Humptulips RiverHUMPTULIPS HATCHERY 125,000
H 213 0 175,000 0 0 213 0Van Winkle CreekLK ABERDEEN HATCHERY 300,000
H 166 0 324,000 0 0 166 0Wynoochee RiverLK ABERDEEN HATCHERY 300,000
M 747 0 240,000 643 0 104 0Skookumchuck RiverBINGHAM CR HATCHERY 200,000
M 131 0 148,500 40 0 91 0Satsop RiverBINGHAM CR HATCHERY 175,000
W 19 0 6,000 0 0 19 0Chehalis RiverBINGHAM CR HATCHERY 175,000
H 139 1 110,000 20 0 119 1Willapa RiverFORKS CREEK HATCHERY 66,000
H 17 0 21,000 0 0 17 0Nemah RiverNEMAH HATCHERY 15,000
H 29 0 45,000 0 0 29 0Naselle RiverNASELLE HATCHERY 85,000
Total 2,412Coastal Region 16 2,378,500 2,421,000 713 0 1,699 16
Columbia River Region
H 5 0 0 5 0 0 0Grays RiverGRAYS RIVER HATCHERY NA
H 249 0 283,000 0 0 249 0Elochoman RiverELOCHOMAN HATCHERY 370,000
W 98 0 69,700 97 0 1 0Elochoman RiverELOCHOMAN HATCHERY NA
H 1,867 87 836,000 1,620 87 276 0Cowlitz RiverCOWLITZ TROUT HATCH
29 adults received from Cowlitz Salmon Hatchery.
672,000
H 803 3 0 774 3 0 0Cowlitz RiverCOWLITZ SALMON HATCH
29 adults shipped to Cowlitz Trout Hatchery. Trapped less upstream totals do not include these shipped fish.
NA
2000-2001 Final Hatchery Escapement Report Page 29 June 03, 2002

Facility Bo Adults Jacks Eggtake Adults Jacks Adults Jacks
Trapped less releasedReleased to streamTotal Trapped
Stock
STEELHEAD WINTEREggtake goal
W 196 0 0 196 0 0 0Cowlitz RiverCOWLITZ SALMON HATCH NA
H 1,056 0 116,699 822 0 234 0Kalama RiverKALAMA FALLS HATCHRY 90,000
W 982 0 64,847 981 0 1 0Kalama RiverKALAMA FALLS HATCHRY 45,000
H 824 13 0 281 0 543 13Lewis RiverLEWIS RIVER HATCHERY
Trapped at Merwin Dam and Lewis Ladder. 416 adults shipped to Merwin Hatchery. 6 males later radio tagged at returned to stream by Merwin, included in released to stream total for Lewis River.
NA
W 111 0 0 111 0 0 0Lewis RiverLEWIS RIVER HATCHERY NA
H 0 0 432,000 0 0 0 0Lewis RiverMERWIN HATCHERY
416 adults received from Merwin Dam and Lewis Ladder. 6 males radio tagged and returned to river, included in released to stream total for Lewis River.
250,000
H 370 0 224,000 0 0 370 0SkamaniaSKAMANIA HATCHERY 400,000
Total 6,561Columbia River Region 103 2,026,246 1,827,000 4,887 90 1,674 13
Total Statewide 10,091 119 6,378,076 6,569,000 5,855 90 4,236 29
2000-2001 Final Hatchery Escapement Report Page 30 June 03, 2002

Facility Bo Adults Jacks Eggtake Adults Jacks Adults Jacks
Trapped less releasedReleased to streamTotal Trapped
Stock
STEELHEAD WINTER-LATEEggtake goal
Columbia River Region
H 79 6 1,028,000 212 23 302 2Cowlitz RiverCOWLITZ TROUT HATCH
435 adults and 19 jacks received from Cowlitz Salmon Hatchery.
1,108,000
H 794 85 0 359 66 0 0Cowlitz RiverCOWLITZ SALMON HATCH
435 adults and 19 jacks shipped to Cowlitz Trout Hatchery. Trapped less upstream totals do not include these shipped fish.
NA
W 233 31 0 233 31 0 0Cowlitz RiverCOWLITZ SALMON HATCH NA
Total 1,106Columbia River Region 122 1,028,000 1,108,000 804 120 302 2
Total Statewide 1,106 122 1,028,000 1,108,000 804 120 302 2
2000-2001 Final Hatchery Escapement Report Page 31 June 03, 2002

Facility Bo Adults Jacks Eggtake Adults Jacks Adults Jacks
Trapped less releasedReleased to streamTotal Trapped
Stock
CUTTHROAT NAEggtake goal
Coastal Region
W 9 0 0 6 0 3 0Satsop RiverBINGHAM CR HATCHERY NA
Total 9Coastal Region 0 0 NA 6 0 3 0
Total Statewide 9 0 0 NA 6 0 3 0
2000-2001 Final Hatchery Escapement Report Page 32 June 03, 2002
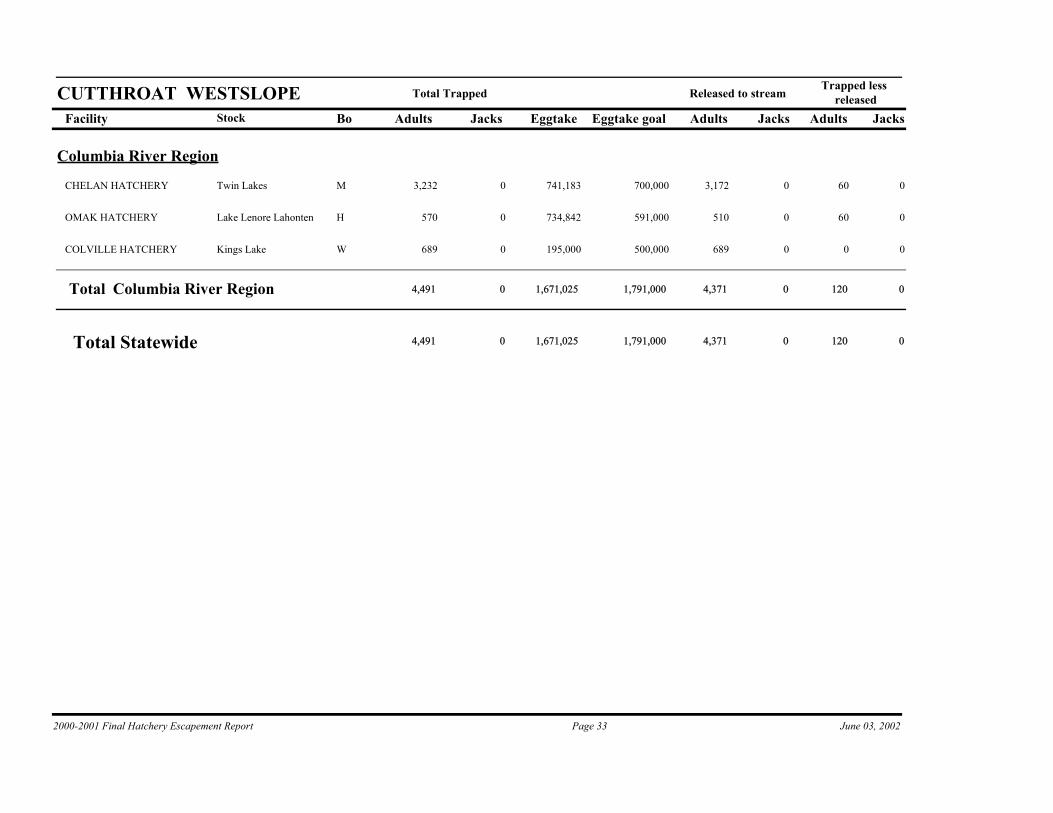
Facility Bo Adults Jacks Eggtake Adults Jacks Adults Jacks
Trapped less releasedReleased to streamTotal Trapped
Stock
CUTTHROAT WESTSLOPEEggtake goal
Columbia River Region
M 3,232 0 741,183 3,172 0 60 0Twin LakesCHELAN HATCHERY 700,000
H 570 0 734,842 510 0 60 0Lake Lenore LahontenOMAK HATCHERY 591,000
W 689 0 195,000 689 0 0 0Kings LakeCOLVILLE HATCHERY 500,000
Total 4,491Columbia River Region 0 1,671,025 1,791,000 4,371 0 120 0
Total Statewide 4,491 0 1,671,025 1,791,000 4,371 0 120 0
2000-2001 Final Hatchery Escapement Report Page 33 June 03, 2002

Facility Bo Adults Jacks Eggtake Adults Jacks Adults Jacks
Trapped less releasedReleased to streamTotal Trapped
Stock
DOLLY/BULL TR NAEggtake goal
Puget Sound Region
W 1 0 0 1 0 0 0Dungeness RiverDUNGENESS HATCHERY NA
Total 1Puget Sound Region 0 0 NA 1 0 0 0
Columbia River Region
W 27 0 0 27 0 0 0Touchet RiverLYONS FERRY HATCHERY
Trapped at Dayton trap.
NA
W 41 0 0 41 0 0 0Tucannon RiverTUCANNON HATCHERY NA
W 10 0 0 10 0 0 0Wenatchee RiverEASTBANK HATCHERY NA
W 209 0 0 209 0 0 0Chiwawa RiverCHIWAWA HATCHERY NA
W 6 0 0 6 0 0 0Unknown StockWELLS HATCHERY
Trapped at Wells Dam Ladder.
NA
Total 293Columbia River Region 0 0 NA 293 0 0 0
Total Statewide 294 0 0 NA 294 0 0 0
2000-2001 Final Hatchery Escapement Report Page 34 June 03, 2002

Facility Bo Adults Jacks Eggtake Adults Jacks Adults Jacks
Trapped less releasedReleased to streamTotal Trapped
Stock
KOKANEE NAEggtake goal
Puget Sound Region
M 117,825 0 12,000,000 0 0 117,825 0Lake WhatcomLK WHATCOM HATCHERY 13,100,000
M 248 0 67,200 0 0 248 0Summit LakeCHAMBERS CR HATCHERY 550,000
Total 118,073Puget Sound Region 0 12,067,200 13,650,000 0 0 118,073 0
Columbia River Region
H 929 0 180,000 49 0 880 0Lewis RiverSPEELYAI HATCHERY 300,000
Total 929Columbia River Region 0 180,000 300,000 49 0 880 0
Total Statewide 119,002 0 12,247,200 13,950,000 49 0 118,953 0
2000-2001 Final Hatchery Escapement Report Page 35 June 03, 2002
Facility Bo Adults Jacks Eggtake Adults Jacks Adults Jacks
Trapped less releasedReleased to streamTotal Trapped
Stock
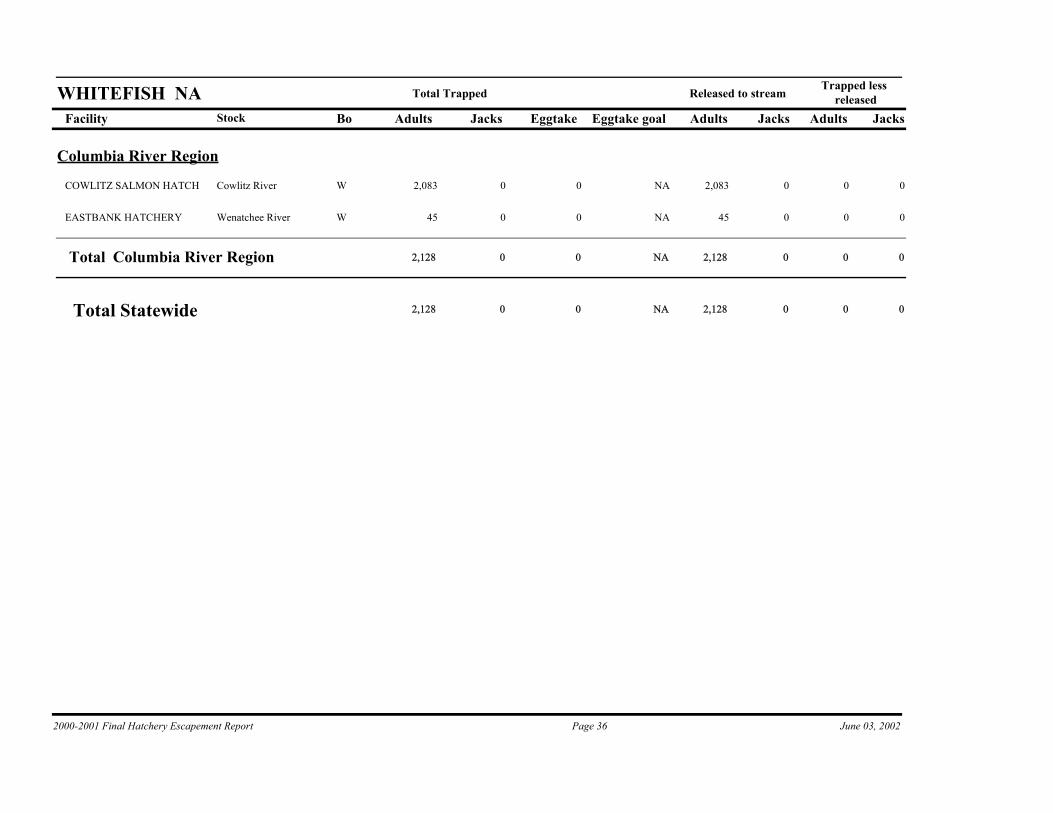
WHITEFISH NAEggtake goal
Columbia River Region
W 2,083 0 0 2,083 0 0 0Cowlitz RiverCOWLITZ SALMON HATCH NA
W 45 0 0 45 0 0 0Wenatchee RiverEASTBANK HATCHERY NA
Total 2,128Columbia River Region 0 0 NA 2,128 0 0 0
Total Statewide 2,128 0 0 NA 2,128 0 0 0
2000-2001 Final Hatchery Escapement Report Page 36 June 03, 2002
![pq] - Oregon Department of Fish and Wildlife...at Gold Ray Dam is not a re1 iable estimate of spawning escapement of wild fish because (1) unmarked hatchery fish compose a large portion](https://img.pdfslide.net/doc/110x75/5e7fe1b867c3fd50345b9ef4/pq-oregon-department-of-fish-and-wildlife-at-gold-ray-dam-is-not-a-re1-iable.jpg)