Embed Size (px)
Citation preview

2000/2001 Household Budget Survey (HBS)
Conducted by
The National Bureau of Statistics

Sample Design
• 22,178 Households were covered in 2000/01
• Around 1,000 Households in each region
• The Survey provides Regional Estimates
• 4,823 Households were covered in 1991/92
• It provides National Estimates
• Both surveys provide rural/urban/DSM

Information Collected
• Household Members’ Education, Economic Activities and Health Status
• Household Expenditure, Consumption and Income
• Ownership of Consumer Goods and Assets
• Housing Structure and Building Materials, and
• Household Access to Services and Facilities

Analysis: General Issues
• In framework of poverty monitoring &
policy: Tanzania development Vision
2025, National Poverty Eradication
Strategy and the PRSP,
•Analysis guided by the Research and
Analysis TWG and stakeholder
consultations
• Provides a baseline for the future
• Describes trends in 1990s, comparing
with HBS 1991/92

RESULTS
The Tanzanian Household

Percentage of Households Headed by
Women by Area
14
24
17 1821
28
22 23
0
5
10
15
20
25
30
DSM Other Urban Rural Total
91/9200/01
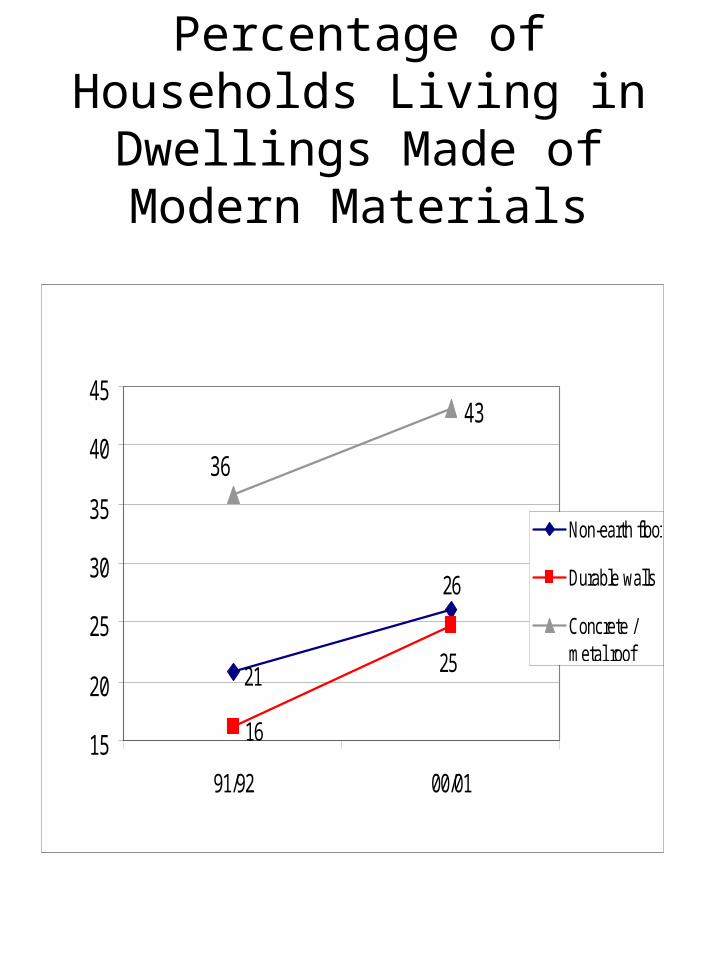
Percentage of Households Living in Dwellings Made of
Modern Materials
21
16
43
26
25
36
15
20
25
30
35
40
45
91/92 00/01
Non-earth floor
Durable walls
Concrete /metal roof

Household Amenities
• Fall in Average Distance to Some Key Services (Markets, Public Transport, Shops)
• Increase in Ownership of a Number of Consumer Goods
• 10% of Hhs are Connected to Electricity National Grid
• This Increased in Urban Areas Only

Percentage of Households with Mains Electricity
Dodoma6%
Arusha11%
Kilimanjaro18%
Tanga7%
Morogoro10%
Pwani6%
Dar es Salaam59%
Lindi5%
Mtwara5%
Ruvuma5%
Iringa6%
Mbeya9%
Singida5%
Tabora4%
Rukwa4%
Kigoma6%
Shinyanga3%
Kagera2%
Mwanza5%
Mara10%
Percent
2 - 4
5 - 9
10 - 14
15 - 19
20 - 59

Education

Percentage of Adults with Some Education, by Sex and
Area, 2000/01
96 9280 83
8982
6368
0
20
40
60
80
100
120
DSM Other Urban Rural Total
MaleFemale

Percentage of Children Aged 7-13 in School, 1991/92 and 2000/01
66 6456 57
76 77
58 61
0
10
20
30
40
50
60
70
80
90
DSM Other Urban Rural Total
91/9200/01
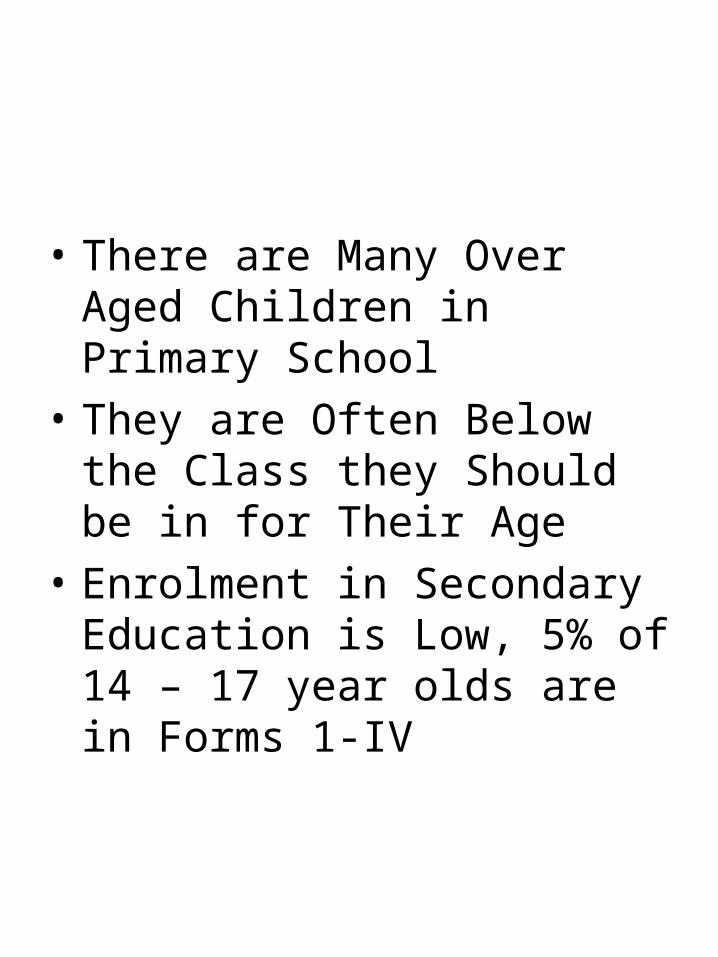
• There are Many Over Aged Children in Primary School
• They are Often Below the Class they Should be in for Their Age
• Enrolment in Secondary Education is Low, 5% of 14 – 17 year olds are in Forms 1-IV

Health

Percent of People Ill or Injured in the Last Four
Weeks
0
10
20
30
40
50
60
70
0-4 5-14 15-24 25-34 35-44 45-54 55-64 65+
Male Female

Source of Consultation
Government
Dispensary/hospital 41.6
Regional hospital 3.1
Community health centre 10.4
Private, modern
Dispensary/hospital 22.3
Doctor/dentist 7.0
Missionary hospital/dispensary
9.2
Other
Traditional healer 15.0
Pharmacy/chemist 2.5
Other 1.7

Client (User) Satisfaction
• Clients reported most dissatisfaction with Govt. Providers
• Long waiting times• Lack of Drugs
• High Cost of Modern private care
• Ineffectiveness of Treatment for Traditional Healers

Drinking Water

Source of Drinking Water
Other 1%
Unprotected 44%
Other P rotected 16%
P iped 39%

Economic Activities
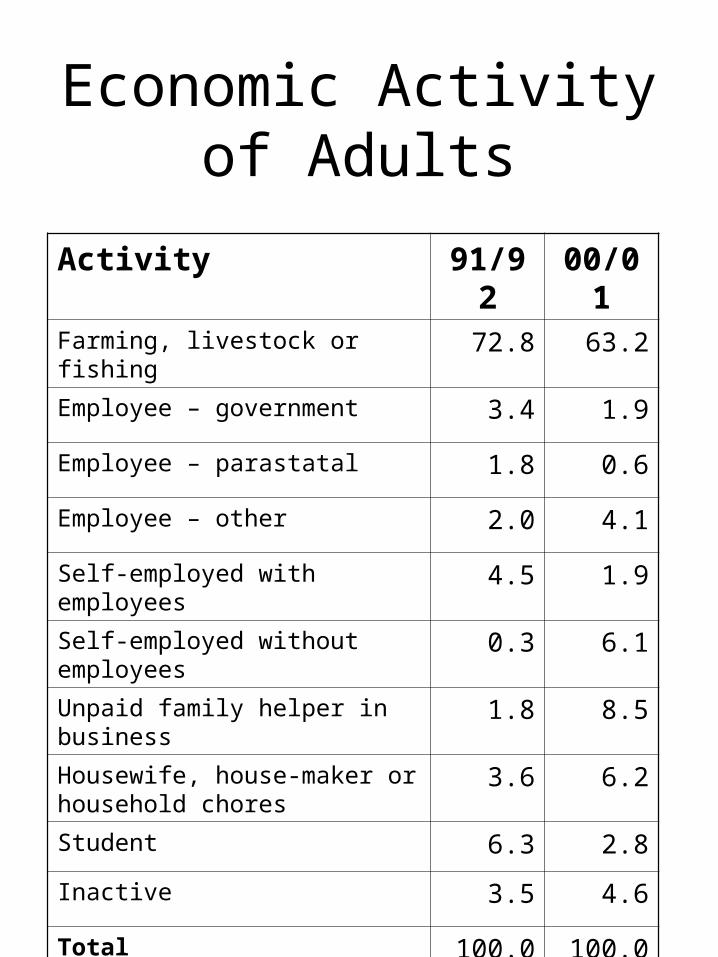
Economic Activity of Adults
Activity 91/92 00/01
Farming, livestock or fishing 72.8 63.2
Employee – government 3.4 1.9
Employee – parastatal 1.8 0.6
Employee – other 2.0 4.1
Self-employed with employees 4.5 1.9
Self-employed without employees 0.3 6.1
Unpaid family helper in business 1.8 8.5
Housewife, house-maker or household chores
3.6 6.2
Student 6.3 2.8
Inactive 3.5 4.6
Total 100.0 100.0

• About 89% of Rural Hhs owned Land for Agriculture or Grazing, As was in 1991/92
• The Degree of Agriculture Mechanisation among Rural Hhs is Low – 11% Own a Plough, only 0.2% have a Tractor

Household Consumption

Expenditure Recorded over One Month
• The survey recorded everything that the interviewed households consumed over one month
• It included food and other items that have been purchased, and food grown by the Hh and consumed during the month
• It excluded household expenditure that was not for consumption, e.g., purchasing inputs for a farm worked by the household

Trends in Household Consumption Expenditure
per Person
• Average Consumption is highest in Dar es Salaam and lowest in Rural Areas (TShs. 21,949 compared to 8,538)
• After adjusting for inflation, Hh consumption rose by around 17%
• The largest rise was in DSM

Percentage Share of Consumption by type of Item
Consumed
1991/92 2002/02
Food – Purchased 35.8 38.6
Food – Home Produced 35.5 26.8
Durable Goods 7.2 7.3
Medical Expenditure 0.9 2.2
Education Expenditure 0.8 2.0
Other Non – Durable 19.7 23.1
Total 100.0 100.0
of which, Total Food 71.3 65.4

Income Poverty and Inequality

House-hold
Data
TotalExp.
Non-Cons.
Cons.Cons.AE
PovertyLine
NotPoor
Poor
Overview of Poverty Analysis
AE = Adult Equivalent
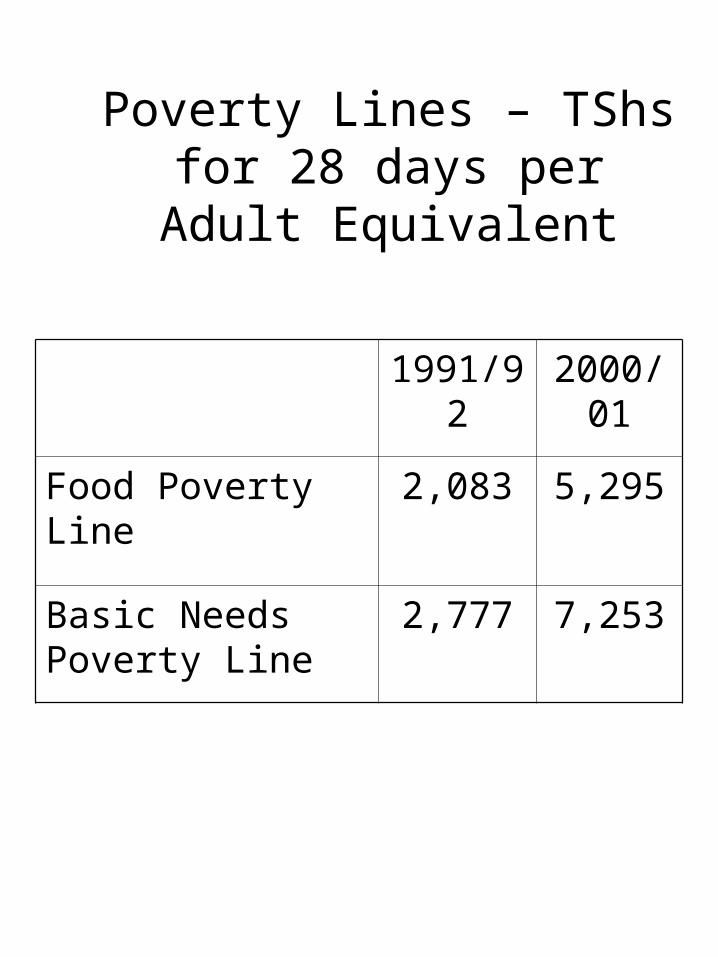
Poverty Lines – TShs for 28 days per Adult Equivalent
1991/92 2000/01
Food Poverty Line 2,083 5,295
Basic Needs Poverty Line
2,777 7,253
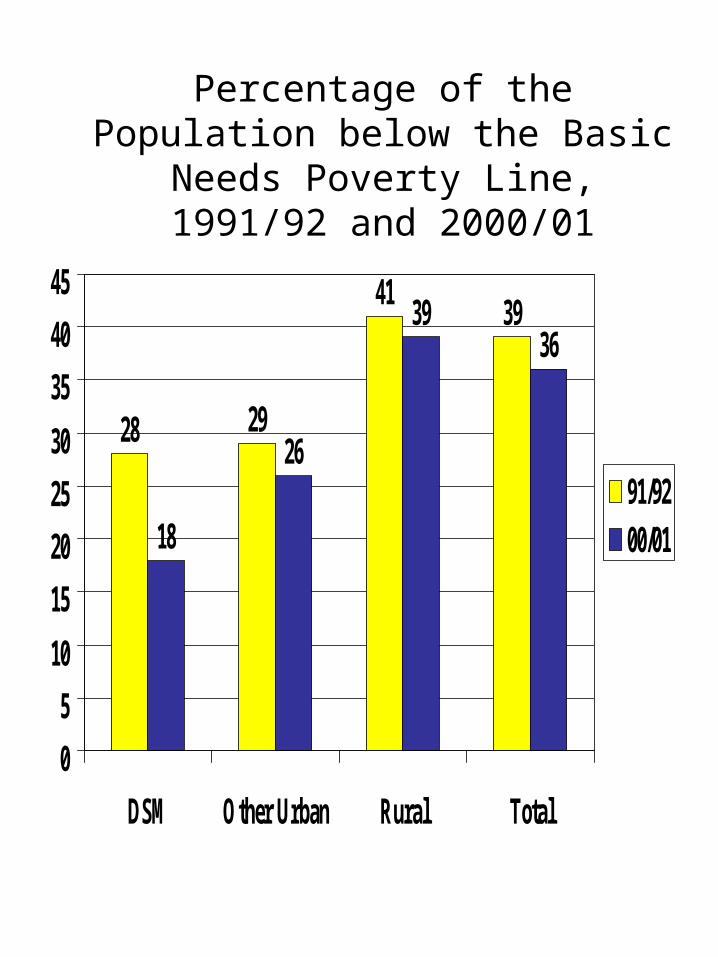
Percentage of the Population below the Basic Needs Poverty Line,
1991/92 and 2000/01
28 29
4139
18
26
3936
0
5
10
15
20
25
30
35
40
45
DSM Other Urban Rural Total
91/9200/01

• Because of population growth, there was an increase in the number of individuals living in poverty (11.4 mill in 2000/01 compared to 9.5 mill in 1991/92)
• A small increase in inequality occurred

Percentage of Poor Individuals, by Education of Household Head,
1991/92 and 2000/01
4651
36
13
5146
32
12
0
10
20
30
40
50
60
None AdultEducation
Primary Only AbovePrimary
91/9200/01

Percentage of Population below the Basic Needs Poverty
Line
Dodoma34%
Arusha39%
Kilimanjaro31%
Tanga36%
Morogoro29%
Pwani46%
Dar es Salaam18%
Lindi53%
Mtwara38%
Ruvuma41%
Iringa29%
Mbeya21%
Singida55%
Tabora26%
Rukwa31%
Kigoma38%
Shinyanga42%
Kagera29%
Mwanza48%
Mara46%
Percent
10 - 19
20 - 29
30 - 3940 - 49
50 - 59

Reported Income

A Diversity of Sources
• The sale of Agricultural products was the main source of Cash Income for 62% of Hhs, compared with 67% in 1991/92
• Food Crops remain the most important single source
• The importance of cash crops has fallen. They provide the main cash source for only 17% of Hhs
• Agriculture provides slightly over half of total household Income, 60% in rural areas.

Mean Monthly Income per Earner by Gender and
Educational Level (‘000 TShs)
18
38
9684
38
16 20
45 43
20
0
20
40
60
80
100
120
None Primary Secondary Tetiary Total
MaleFemale

Conclusions
• Income poverty is high and many social indicators are poor
• There are large differences in the indicators between different groups
• The largest gap is between urban and rural populations – the rural population is much poorer

• Regional differences are more variable; some are consistently disadvantaged e.g Lindi, Singida
• Differences between men and women are smaller than the geographical differences
• Women have lower incomes than men and less education, but girls have higher primary school enrolment

• Many measures of welfare show modest improvements during the 1990s
• The economy diversified and household consumption has increased
• The proportion who are poor has fallen slightly, although the absolute numbers has risen.
• But there have been increases in inequality – particularly between urban and rural areas