Embed Size (px)
Citation preview
AG 761
1
2002-2003 Wheat Research Verification Program
Conducted by: Mr. Jack ‘Trey’ Reaper III, WRVP Coordinator Mr. J. Dwayne Beaty, WRVP Coordinator Mr. Jeremy Ross, WRVP Coordinator Dr. Jason P. Kelley, Extension Agronomist Mr. James Marshall, Extension Economist Dr. Tony Windham, Extension Economist, Section Leader – Agricultural Economics
County Agents Cooperators County Mr. Ken Adams Mr. Danny Hall Arkansas Mr. Roger Gipson Mr. Mark Ahrent Clay Mr. Brady Harmon Mr. Chad Render Jefferson Mr. Blair Griffin Mr. Richard Plugge Johnson Mr. Stewart Runsick Mr. Michael Butts Lawrence Mr. Mike English Mr. Tom Gist Lee Ms. Sunny Wilkerson Gassoway Brothers Lincoln Mr. Larry Campbell Schluterman Brothers Logan Mr. Reggie Talley Mr. Gerald Jackson Monroe Mr. Ken Combs Mr. Bobby Crow Yell
Acknowledgements: Agricultural Experiment Station, Fayetteville Dr. Gene Milus, Department of Plant Pathology Dr. Robert Bacon, Department of Crop, Soil, and Environmental Sciences Extension Service Specialists Dr. Rick Cartwright, Extension Plant Pathologist Mr. Cliff Coker, Extension Plant Pathologist Dr. Leo Espinoza, Extension Soils Specialist Dr. Dennis Gardisser, Extension Agricultural Engineer
Mr. Gary Huitink, Extension Agricultural Engineer Dr. Don Johnson, Extension Entomologist Dr. Terry Kirkpatrick, Extension Plant Pathologist Mr. Phil Tacker, Extension Agricultural Engineer Special acknowledgement to the members of the Arkansas Wheat Promotion Board:
Mr. Morris Crandall Mr. Davey Farabough Mr. Dennis Haigwood Mr. David Jessup Mr. William Turner Mr. Cal McCastlain
Mr. Richard Plugge Mr. Gary Shrum Mr. Barry Walls
2

Table of Contents
Page Authors and Acknowledgments……………………………………………………………….…. 1
Abstract…………………………………………………………………………………………… 2
Introduction………………………………………………………………………………………. 3
WRVP Methodology……………………………………………………………………………... 4
Results and Discussion………………………………………………………….……………….. 6
Table 1. Variety, Field Size, and Preplant Fertilizer, WRVP Fields, 2002-03………………….. 6
Table 2. General Soils Information, WRVP Fields, 2002-03…………………………………… 7
Table 3. Fall 2002 Soil Test Results…………………………………………………………….. 7
Table 4. Previous Crop and Preplant Tillage Operations for WRVP Fields, 2002-03………….. 8
Table 5. Variety, Seeding Date, Rate, and Method, WRVP Fields, Fall, 2002………….……… 8
Table 6. Spring Nitrogen, WRVP Fields, 2002-03………………………………………….…... 10
Table 7. Stand, Tiller, and Head Counts, WRVP Fields, 2002-03………………………………. 10
Table 8. Weed, Disease, and Insect Summary, WRVP Fields, 2002-03………………………… 11
Table 9. Harvest Date, Grain Yield, Test Weight for WRVP Fields and Pounds of Nitrogen per Bushel, 2002-03………………………………………………….……………….…….
12
Economic Analysis……………………………………………………………………………….. 12
Table 10. Economic Summary of WRVP Fields, 2002-03……………………………………... 15
Table 11. Various Specified Operating Costs of WRVP Fields, 2002-03………………………. 16
Appendix, Economic Analysis By County………………………………………………….……. 17
3
Abstract
The 2002-2003 Wheat Research Verification Program (WRVP) was implemented by the University of Arkansas Cooperative Extension Service on 12 producer fields located in Arkansas, Clay (2), Jefferson, Johnson, Lawrence (2), Lee, Lincoln, Logan, Monroe, and Yell Counties. Frequent rains throughout October and early November delayed planting in many areas across the state. Because of this, fields in Monroe and Lincoln Counties were selected from established fields that met the criteria for the WRVP. Cooperators from the counties above selected 10 varieties from a short list provided by the agent and research verification coordinator. These varieties were selected based upon performance and characteristics determined by the University of Arkansas variety tests. Soil types ranged from silt loam to silty clay, with previous crops of corn, soybean, rice, and summer fallow. Seeding dates ranged from October 7 through November 14, with seeding rates varying from 115 to 180 lbs/ac. Nine fields were drill seeded and two were broadcast seeded. Cooperators in Clay and Jefferson Counties utilized a bedding system to provide multiple drain furrows. Ryegrass, wild garlic, and other winter weeds were common and required the use of herbicide on eight fields. Stripe rust and other diseases remained low throughout the season and because of intensive scouting, no fields were treated with a fungicide. Insects were also not a factor throughout the season. Severe glyphosate drift caused a significant reduction in yield of the Lee County field; therefore, it was not included in the harvest data averages. Harvest dates ranged from June 4 through June 26. Average yield for the WRVP was 63.7 bu/ac, compared to a state average yield of 50 bu/ac on 570,000 harvested acres. As with much of the state, test weight was lower than previous years with an average of 56.2 lb/bu. Improved variety selection, good surface drainage, timely fertilization, and effective pest management practices have been frequently mentioned by producers and county agents as factors which make WRVP fields more profitable and/or produce higher yields. Economic analysis was conducted using a budget generator to estimate specific costs of production for each field. A fixed price of $3.16/bu was used to calculate total income as a result of seed yield. This price was the state average wheat price for June delivery based upon June prices at elevators throughout eastern Arkansas and the Arkansas River Valley. Ten of the 12 WRVP fields resulted in a positive net return. Fertilizer remains the greatest input cost associated with wheat production in Arkansas. The Wheat Research Verification Program continues to demonstrate that Extension’s research-based recommendations can produce profitable, high yielding wheat across a wide range of conditions and soil types. Over a 17-year period, the WRVP has averaged 13.1 bu/ac greater than the state average yield. The program is funded by the wheat checkoff dollars and administered through the Arkansas Wheat Promotion Board.
4
Introduction
The Wheat Research Verification Program (WRVP) represents an interdisciplinary effort of farmers, county Extension agents, Extension specialists, and researchers committed to improving the profitability of wheat production in Arkansas. The WRVP program began in 1986 under the direction of the University of Arkansas Cooperative Extension Service. The Arkansas Wheat Promotion Board has allocated the funding necessary for the WRVP program each year since its inception. The WRVP program is designed as on-farm demonstrations of all the research-based recommendations required to grow wheat profitably in Arkansas. The WRVP program is part of the University of Arkansas Extension Service's goal of helping wheat producers make economically, agronomically, and environmentally sound decisions on their farms. The specific objectives of the program are: 1. To verify research-based recommendations for profitable wheat production in
all wheat producing areas of Arkansas. 2. To develop a database for economic analysis of all aspects of wheat production. 3. To demonstrate that consistently high yields of wheat can be produced
economically with the use of available technology and inputs. 4. To identify specific problems and opportunities in Arkansas wheat production
for further investigation. 5. To promote timely cultural and management practices among all wheat
farmers. 6. To provide training and assistance to county agents with limited expertise in
wheat production.
5
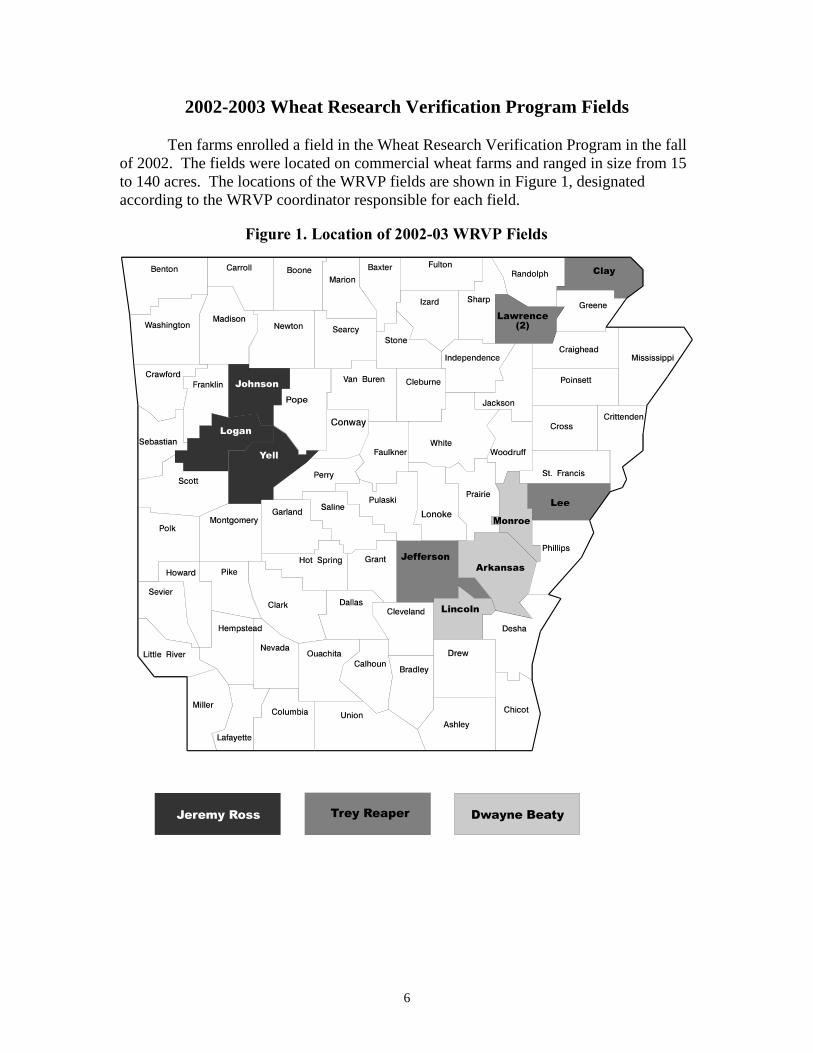
2002-2003 Wheat Research Verification Program Fields
Ten farms enrolled a field in the Wheat Research Verification Program in the fall of 2002. The fields were located on commercial wheat farms and ranged in size from 15 to 140 acres. The locations of the WRVP fields are shown in Figure 1, designated according to the WRVP coordinator responsible for each field.
6
The program is conducted for two consecutive years with each grower/cooperator. When an interested cooperator was identified, the cooperator, county agent, and specialist selected a field to enroll in the program in the fall of 2002. Prospective fields are required to meet the following criteria specified by the WRVP advisory committee: 1. Field size of at least 15 acres. 2. A yield potential equal to or greater than the county average. 3. A soil pH above 5.6. 4. A previous crop of corn, sorghum (without atrazine), soybeans, summer fallow,
rice, or pasture. 5. The potential for good surface drainage. A representative soil sample of the field was analyzed and the field was inspected by the coordinator and county agent. When the soil test results were obtained, the county agent, cooperator, and coordinator met to discuss recommended practices for seedbed preparation, wheat variety selection, and fertilization. All management decisions were made based on current Extension recommendations. For situations where there were no specific recommendations included in the field plan, a member of the Wheat Verification Committee was consulted. As often as practical, members of the committee were consulted and updated on the condition of the fields. Once seedbed preparation began, the day-to-day management decisions were made by the county agent and coordinator with assistance from appropriate specialists and researchers as conditions warranted. Data were collected on stand counts, growth stage, tillering, heads per square foot, diseases, weeds, and insects during the course of the growing season. Grain yields and test weights were determined by elevator weigh tickets on all WRVP fields except Johnson County. Where demonstrations were conducted within a field or problem areas within a field were identified during the season, weigh wagons were used to determine yields. Occasionally, a WRVP is located in an odd-shaped field where acreage is difficult to measure. Thus, estimating field-wide yields using a weigh wagon is more accurate than using weigh tickets. To estimate the field-wide yields in a WRVP, a random strip in the field was harvested with the farmer's combine and the grain was augered into the weigh wagon. The weight of the grain was recorded. The strip was measured for length and width and the yield was then calculated on a per acre basis. The entire procedure was repeated at least four times and an average yield was recorded. Test weight was determined from a composite sample from the four strips. Harvest loss was estimated by determining the number of grains per square foot remaining after harvest. Twenty-one grains per square foot is equal to the threshold value of one bushel per acre. The 2002-2003 WRVP fields had low harvest loss estimates. An economic analysis of each field was conducted by an Extension economist and is included in the appendix of this report. To facilitate comparisons among fields and to allow year-to-year comparisons, average costs of certain operations are computed and used to generate the budgets in this report.
7

Results and Discussion
The variety, field size and preplant fertilizer for each WRVP field are listed in Table 1. The average field size was 57.3 acres ranging from 15 to 140 acres.
Table 1. Variety, Field Size, and Preplant Fertilizer, WRVP Fields 2002-03
County Variety Field Size (Acres)
Preplant Fertilizer1
(lbs/ac) Arkansas Sabbe 89 0-40-60
Clay Pioneer 2684 & Pat 76 40-40-80 Jefferson AgriPro Natchez 115 35-60-60 Johnson Pat 30 32-23-60
Lawrence 1 Croplan 554W 15 None Lawrence 2 Terral 8555 15 None
Lee Delta King 7777 & Dixie 900 45 None
Lincoln Delta Grow 5300 40 None Logan Delta King 7777 35 41-36-0
Monroe Delta King 9216 140 21-33-106-24 Yell Sabbe 30 2.2 tons lime/ac
1Nitrogen – Phosphorus – Potassium – Sulfur.
Coordinators of the Wheat Research Verification Program met with the Extension Wheat Agronomist to develop a short list of varieties suited to each potential verification field’s environment. Wheat Update, a summary of variety trials conducted by the University of Arkansas Agricultural Experiment Station, was used to obtain yield, physiological, and disease data for certain varieties on a range of soil types. The producer made the final variety selection using those on the list provided by the county agent. The best overall disease resistance and yield history is sought in variety selection. Ten varieties were planted in the WRVP in the fall of 2002, reflecting the specific needs of different soil types, geographic regions, and the overall management strategy employed by the cooperators. Seven varieties-Sabbe, Pat, AgriPro Natchez, Croplan 554W, Delta King 7777, Dixie 900, and Delta King 9216-were planted in the WRVP for the first time. Sabbe and Pat are varieties recently released from the University of Arkansas Division of Agriculture wheat breeding program. The preplant fertilizer was applied according to soil test recommendations. Lime was applied in Yell County to increase nutrient availability. The fields in Lawrence, Lee, and Lincoln Counties did not require any fall fertilization due to the previous crop. All others received mixed fertilizer. In most cases, it is expedient and practical to apply fertilizer for both wheat and double-cropped soybeans in the fall. Thus, the fertilizer applied may not accurately reflect the needs of the wheat crop alone. This is especially true for the fields where large amounts of potash and phosphorus were applied. Furthermore, the cost of preplant fertilizer was assigned to wheat according to the following schedule: 100% of nitrogen applied and 50% of phosphorus and potash. 8
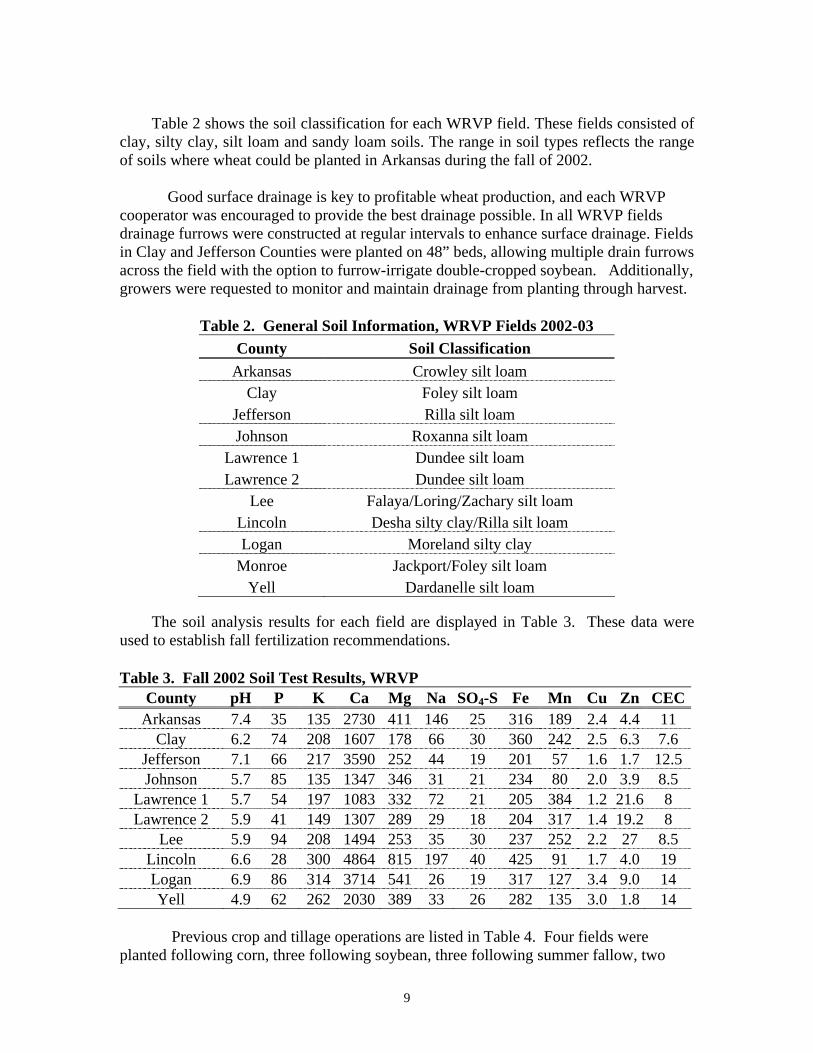
Table 2 shows the soil classification for each WRVP field. These fields consisted of clay, silty clay, silt loam and sandy loam soils. The range in soil types reflects the range of soils where wheat could be planted in Arkansas during the fall of 2002. Good surface drainage is key to profitable wheat production, and each WRVP cooperator was encouraged to provide the best drainage possible. In all WRVP fields drainage furrows were constructed at regular intervals to enhance surface drainage. Fields in Clay and Jefferson Counties were planted on 48” beds, allowing multiple drain furrows across the field with the option to furrow-irrigate double-cropped soybean. Additionally, growers were requested to monitor and maintain drainage from planting through harvest.
Table 2. General Soil Information, WRVP Fields 2002-03 County Soil Classification
Arkansas Crowley silt loam Clay Foley silt loam
Jefferson Rilla silt loam Johnson Roxanna silt loam
Lawrence 1 Dundee silt loam Lawrence 2 Dundee silt loam
Lee Falaya/Loring/Zachary silt loam Lincoln Desha silty clay/Rilla silt loam Logan Moreland silty clay
Monroe Jackport/Foley silt loam Yell Dardanelle silt loam
The soil analysis results for each field are displayed in Table 3. These data were used to establish fall fertilization recommendations. Table 3. Fall 2002 Soil Test Results, WRVP
County pH P K Ca Mg Na SO4-S Fe Mn Cu Zn CECArkansas 7.4 35 135 2730 411 146 25 316 189 2.4 4.4 11
Clay 6.2 74 208 1607 178 66 30 360 242 2.5 6.3 7.6 Jefferson 7.1 66 217 3590 252 44 19 201 57 1.6 1.7 12.5 Johnson 5.7 85 135 1347 346 31 21 234 80 2.0 3.9 8.5
Lawrence 1 5.7 54 197 1083 332 72 21 205 384 1.2 21.6 8 Lawrence 2 5.9 41 149 1307 289 29 18 204 317 1.4 19.2 8
Lee 5.9 94 208 1494 253 35 30 237 252 2.2 27 8.5 Lincoln 6.6 28 300 4864 815 197 40 425 91 1.7 4.0 19 Logan 6.9 86 314 3714 541 26 19 317 127 3.4 9.0 14 Yell 4.9 62 262 2030 389 33 26 282 135 3.0 1.8 14
Previous crop and tillage operations are listed in Table 4. Four fields were planted following corn, three following soybean, three following summer fallow, two
9

following rice, and one following grain sorghum. Conventional tillage operations were used for seedbed preparation in all fields. Fields following rice, corn, or grain sorghum generally require more tillage operations due to heavy crop residue.
Table 4. Previous Crop and Preplant Tillage Operation for WRVP Fields, 2002-03
County Previous Crop Tillage Operations Arkansas Soybean None
Clay Rice Disk 2X, Field cultivate, Float Jefferson Soybean Field cultivate 2X Johnson Corn Disk 2X, Field cultivate
Lawrence 1 Fallow Disk, Float Lawrence 2 Fallow Disk, Float
Lee Fallow Field cultivate Lincoln Rice None Logan Corn Disk 3X, Chisel plow
Monroe Rice Disk 2X Yell Soybean Disk, Field cultivate
The seeding date and rate for each county and variety are given in Table 5. The recommended planting dates for wheat are: North Arkansas - October 1 through October 30, Central Arkansas – October 10 through November 10, South Arkansas – October 15 through November 20. All fields were planted within the recommended seeding date for their region in 2002. Frequent rains prevented planting of the field in St. Francis County; therefore, the second year for that county will be deferred to the 2003-2004 growing season.
Table 5. Variety, Seeding Date, Rate, Method, WRVP Fields, Fall, 2002.
County Variety Seeding Date
Seeding Rate (lbs/ac)
Seeding Method
Arkansas Sabbe 1-Nov 150 Drill Clay Pioneer 2684 & Pat 7-Oct 180 Drill
Jefferson AgriPro Natchez 14-Nov 180 BroadcastJohnson Pat 10-Oct 150 Broadcast
Lawrence 1 Croplan 554W 8-Oct 115 Drill Lawrence 2 Terral 8555 8-Oct 115 Drill
Lee Delta King 7777 & Dixie 900 1-Nov 150 Drill
Lincoln Delta Grow 5300 10-Oct 138 Drill Logan Delta King 7777 17-Oct 120 Drill
Monroe Delta King 9216 14-Nov 150 Drill Yell Sabbe 24-Oct 150 Drill
10

Seeding rates ranged from 115 to 180 pounds per acre. The recommended seeding rates vary according to seed size, seedbed conditions, anticipated germination, and seedling survival. Seeding rates are designed to achieve a final stand of 26 plants per square foot. Nine fields were drill seeded while two fields were broadcast seeded. Data on spring nitrogen applications are displayed in Table 6 on the next page. Total applied nitrogen ranged from 102.5 lbs/acre on the Yell, Johnson, and Logan County fields to 147 lbs/acre on the Arkansas County field. The average spring nitrogen rate was 119.3 lbs/acre. The first spring nitrogen application is based on soil texture and drainage classification. On clay and poorly drained silt loam soils, 55 pounds of nitrogen per acre is recommended for the first application with the remaining 45 pounds of nitrogen to be applied 3-4 weeks later. On clay soils with a yield potential greater than 55 bu/ac, 75 pounds of nitrogen per acre is recommended at early tillering with the remaining 65 pounds to be applied 3-4 weeks later. On loamy soils with good drainage, 90-100 pounds of nitrogen per acre is generally recommended for high yields. A single application at mid-tillering stage of wheat development may often satisfy the nitrogen requirements of the crop. However, heavy or frequent spring rainfall causes saturated soils and subsequent loss and/or leaching of nitrates outside the root zone. Thus, split applications of nitrogen are often required to avoid excessive nitrogen losses. In addition, standing water may cause nitrogen losses that can be corrected with supplemental fertilizer of 20-40 pounds of nitrogen per acre, according to Extension recommendations. Frequent rainfall, heavy rainfall, and standing water did occur on WRVP fields in the spring. All 2001-2002 WRVP fields except those located in the Arkansas River Valley (Yell, Johnson, and Logan Counties) received split applications of nitrogen. Six WRVP fields received sulfur with the first spring nitrogen application. The Monroe County field received sulfur with the mixed fertilizer in the fall (Table 1). Sulfur was applied due to the sandy, low organic matter soil types and the potential of sulfur deficiency from the heavy and frequent winter rains. Unlike many Arkansas wheat fields in 2003, all WRVP fields received the first application of spring nitrogen timely. Fields that were fertilized on dry soil the last couple of days in January were provided adequate amounts of nutrients that frequent rains would have otherwise prevented. Several fields across the state were fertilized late because of rainfall and/or abandoned due to decreased yield potential.
11

Table 6. Spring Nitrogen, WRVP Fields, 2002-03 First Spring Application Second Application
County Date
Source1
lb/A2
N lb/A3
S
Date
Source lb/A
N Total
lb N/A Arkansas 1/31 Urea 55 0 3/4 Urea 46
3rd Application: 3/24 Urea 46 147
Clay 1/28 Urea + DAP + A.S. 64.5 12 3/7 Urea 56.5 121
Jefferson 1/31 Urea + A.S. 61 12 2/28 Urea 53 114 Johnson 2/16 Urea + A.S. 102.5 12 N/A None 0 102.5
Lawrence 1 1/29 Urea + DAP 54.6 0 3/10 Urea 55.2 110 Lawrence 2 1/29 Urea + DAP 54.6 0 3/10 Urea 55.2 110
Lee 1/31 A.S. + DAP 19.5 12 3/2 Urea 92 111.5 Lincoln 2/11 Urea + DAP 64 0 3/20 Mixed 100 164 Logan 2/15 Urea + A.S. 102.5 12 N/A None 0 102.5
Monroe 2/13 Urea 58 0 3/17 Urea 67 125 Yell 2/13 Urea + A.S. 102.5 12 N/A None 0 102.5
1Urea (46-0-0), A.S. = Ammonium sulfate (21-0-0-24), DAP = Diammonium phosphate (18-46-0). 2N = nitrogen 3S = sulfur The stand counts, tiller counts, and head counts for each field are given in Table 7. Each of these data represents the average of 15 randomly selected square foot counts. The initial stand was measured as the number of plants per square foot at Feekes' growth stage 2. The tiller count was measured as total number of culms per plant at Feekes’ growth stage 6. The head count was determined by counting the number of heads per square foot at Feekes' growth stage 11.
Table 7. Stand, Tiller, and Head Counts, WRVP Fields, 2002-03
County Initial Stand (#plts/ft2)
Tiller Count (#tillers/plant)
Head Count (#heads/ft2)
Arkansas 35.3 2.1 71 Clay – Pion2684 38.2 3.0 87.8
Clay – Pat 34.1 3.4 71.4 Jefferson 31.3 3.8 112.4 Johnson 45.2 4.5 51.3
Lawrence 1 44.0 2.5 68.0 Lawrence 2 35.6 2.4 60.7
Lee 32.4 2.4 67.4 Lincoln 31.1 3.7 77.3 Logan 33.7 4.9 52.3
Monroe 24.5 3.9 61.5 Yell 40.6 3.5 58.3 Avg: 35.5 3.3 69.9
12

The initial stand averaged 35.5 plants/ft2 across all 2002-03 WRVP fields. This figure is higher than that observed in 2002 (27.6 plts/ft2). Fields planted early in the recommended planting window resulted in higher than normal plant populations due to optimal weather conditions for emergence. Tiller counts observed in spring 2003 averaged 3.3 tillers/plant. Head counts averaged 59.8 heads/ft2. Disease did not severely affect any WRVP fields during the 2002-2003 growing season. Stripe rust was treated on several acres in southwest Arkansas; however, when stripe rust reached the eastern side of the state, most fields had reached 50% heading, the treatment cutoff. Because of intensive scouting, no WRVP fields were treated with a fungicide. Common wheat diseases such as Septoria tritici blotch, barley yellow dwarf, and loose smut were observed in most fields but did not have an economic impact. Other than spring aphids, insects were relatively nonexistent in 2002-2003. True armyworm populations were very low throughout the later stages of reproductive development. As in any other year, weeds were a factor in most fields. Finesse was used for ryegrass suppression in the Lawrence County fields (Table 8). Field 1 had relatively low ryegrass pressure compared to Field 2. Early fall control of ryegrass and winter annuals was excellent in both fields; however, a late flush emerged in Field 2. While yield was probably not affected, it does support data indicating 70% control of ryegrass with Finesse. Fields in Lee, Lincoln, and Logan Counties were treated for ryegrass with Hoelon either by border or blanket applications. Garlic, vetch, and winter junk weeds reached treatment threshold in four fields. The WRVP fields in Jefferson, Monroe, and Johnson Counties experienced low pest levels throughout the growing season; therefore, no treatments were applied. Table 8. Weed, Disease, and Insect Summary - Wheat Research Verification Program, 2002-03
County Pest Summary and Chemical Application Arkansas Express (0.25 oz/ac)
Clay Express (0.25 oz/ac) Jefferson None Johnson None
Lawrence 1 Finesse (0.5 oz/ac) Lawrence 2 Finesse (0.5 oz/ac)
Lee Harmony Extra (0.5 oz/ac), Border App.: Hoelon (2.66 pt/ac) Lincoln Border Application: Hoelon (1.33 pt/ac) Logan Hoelon (1.33 pt/ac)
Monroe None Yell Express (0.25 oz/ac)
The harvest date, grain yield, test weight, and pounds of nitrogen per bushel are shown in Table 9 on page 12. All WRVP fields were harvested in June. The Lee County field was severely affected by glyphosate drift around Feekes’ growth stage 8. The yield potential was drastically reduced; therefore, it was not included in the WRVP yield average. Most areas of Arkansas experienced heavy and frequent rainfall throughout the wheat growing season. Despite this, the 2002-2003 WRVP fields achieved a respectable
13
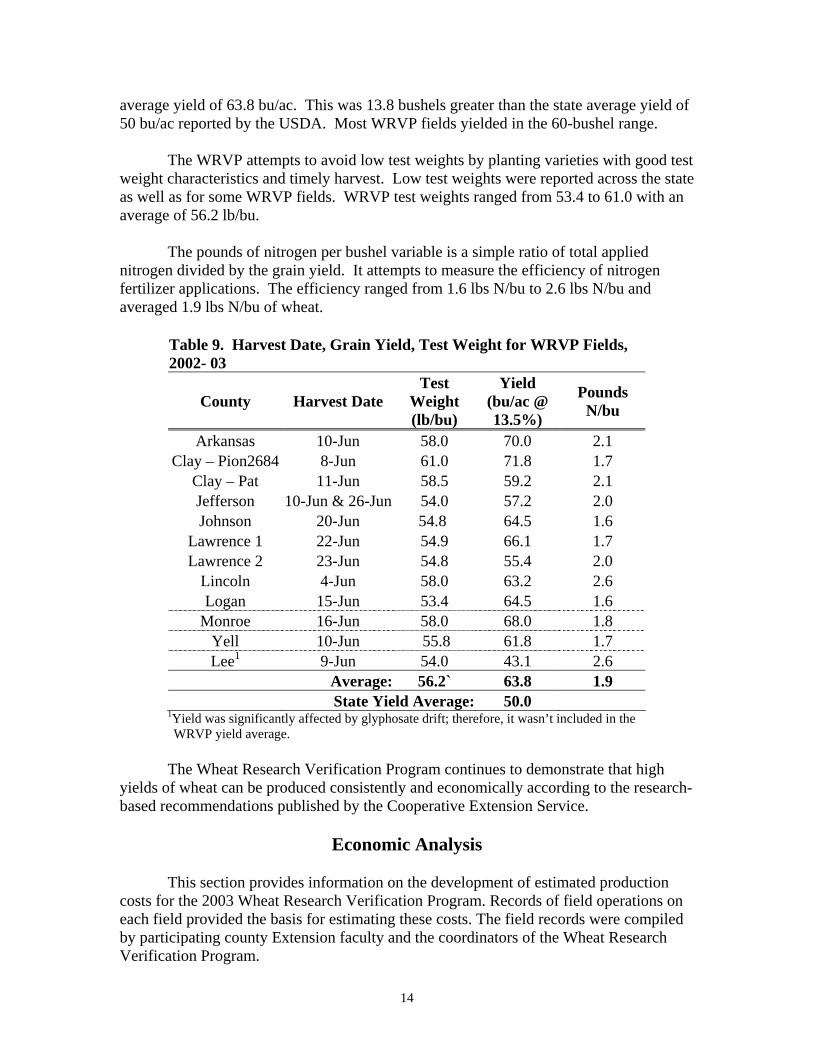
average yield of 63.8 bu/ac. This was 13.8 bushels greater than the state average yield of 50 bu/ac reported by the USDA. Most WRVP fields yielded in the 60-bushel range.
The WRVP attempts to avoid low test weights by planting varieties with good test weight characteristics and timely harvest. Low test weights were reported across the state as well as for some WRVP fields. WRVP test weights ranged from 53.4 to 61.0 with an average of 56.2 lb/bu.
The pounds of nitrogen per bushel variable is a simple ratio of total applied
nitrogen divided by the grain yield. It attempts to measure the efficiency of nitrogen fertilizer applications. The efficiency ranged from 1.6 lbs N/bu to 2.6 lbs N/bu and averaged 1.9 lbs N/bu of wheat.
Table 9. Harvest Date, Grain Yield, Test Weight for WRVP Fields, 2002- 03
County Harvest Date Test
Weight (lb/bu)
Yield (bu/ac @ 13.5%)
Pounds N/bu
Arkansas 10-Jun 58.0 70.0 2.1 Clay – Pion2684 8-Jun 61.0 71.8 1.7
Clay – Pat 11-Jun 58.5 59.2 2.1 Jefferson 10-Jun & 26-Jun 54.0 57.2 2.0 Johnson 20-Jun 54.8 64.5 1.6
Lawrence 1 22-Jun 54.9 66.1 1.7 Lawrence 2 23-Jun 54.8 55.4 2.0
Lincoln 4-Jun 58.0 63.2 2.6 Logan 15-Jun 53.4 64.5 1.6
Monroe 16-Jun 58.0 68.0 1.8 Yell 10-Jun 55.8 61.8 1.7 Lee1 9-Jun 54.0 43.1 2.6
Average: 56.2` 63.8 1.9 State Yield Average: 50.0
1Yield was significantly affected by glyphosate drift; therefore, it wasn’t included in the WRVP yield average.
The Wheat Research Verification Program continues to demonstrate that high yields of wheat can be produced consistently and economically according to the research-based recommendations published by the Cooperative Extension Service.
Economic Analysis
This section provides information on the development of estimated production costs for the 2003 Wheat Research Verification Program. Records of field operations on each field provided the basis for estimating these costs. The field records were compiled by participating county Extension faculty and the coordinators of the Wheat Research Verification Program.
14

Using WRVP production data from 12 fields in 10 counties, operating costs, and
net returns above total specified costs assuming a 25 percent land rent were estimated for each field. Break-even prices needed to cover total specified costs are also presented. Specified Operating Costs
Specified operating costs listed in Table 10 are those expenditures that would generally require annual cash outlays and would be included on an annual operating loan application. Actual quantities of all operating inputs were used in this analysis. However, since prices of inputs may be influenced by quantity discounts, and similar factors that are independent of production management issues being tested by WRVP, constant input prices were used across all fields. This procedure was used so that the objective to verify research recommendations would not be obscured by highly variable input prices.
Machinery fuel and repair costs were calculated using a budget generator based on parameters and standards published in the American Society of Agricultural Engineers 1995 Handbook. Therefore, the producer’s actual machinery costs will likely vary somewhat from the machinery cost estimates that are presented in this report. However, the producer’s actual field operations were used as a basis for the calculations. Equipment size and type were matched as closely as possible to the existing data set used in the series of Extension Technical Bulletins Estimating 2002 Production Costs in Arkansas.
Specified operating costs for the 12 WRVP fields ranged from $84.65 per acre to $152.75 per acre. The average over all fields was $108.51. Although economic data from Lee County is displayed, it is not included in the economic summary averages. Specified Ownership Costs
Machinery ownership costs represent the capital replacement costs of owning and using equipment and can vary greatly from one farm to another depending on the farm’s size, management skills, and annual use. Specified ownership costs presented in Table 10 include depreciation, interest, taxes, and insurance. These costs were based on the initial cost and expected useful life of the machinery and were allocated on a per acre basis using estimated performance rates and hours of annual use.
These are economic costs and may differ from short-run tax based cash accounting figures for a particular year. This economic approach spreads these costs over the entire useful life of the machinery. In the long run the farm business must cover these costs to remain viable. Specified ownership costs ranged from $11.11 per acre to $29.94 per acre with an average of $21.93 per acre. The fields with lower ownership costs generally had fewer field operations. Total Specified Costs
Total specified costs presented in Table 10 are the summation of total specified operating costs and total specified ownership costs. Not included in these costs are charges for land, risk, overhead, and management. The overhead and management costs
15
would be better addressed in a whole-farm analysis and will not be dealt with in this discussion. Total specified costs ranged from $101.63 per acre to $180.42 per acre with an average of $130.45.
Break-even prices need to cover total specified costs ranged from $1.49 per bushel to $2.88 per bushel. Over the 12 fields an average break-even price of $2.05 per bushel was needed. Land Costs
Land costs incurred by producers participating in the Wheat Research Verification Program would likely vary from land ownership, cash rent, or some form of crop share arrangement. Therefore, a comparison of these divergent cost structures would contribute little to this analysis. For this reason, a 25 percent crop share rental arrangement, with no cost sharing was assumed to provide a consistent standard for comparison. This is not meant to imply that this arrangement is normal or that it should be used in place of existing arrangements. It is simply a constant measure to be used across all WRVP fields. Net Returns Per Acre
Table 10 also presents estimated returns per acre above Total Specified Costs plus a 25 percent crop share rent. A fixed price of $3.16/bu was used to calculate total income as a result of seed yield. This price was the state average wheat price for June delivery based upon June prices at elevators throughout eastern Arkansas and the Arkansas River Valley. It is important to note that the income displayed in Table 10 does not represent the actual income received for each field. The fixed price is a way to gauge production and input costs and the potential income for all WRVP fields. All fields generated a positive net return with the exception of the Clay and Lee County fields.. Net returns ranged from ($30.10) per acre to $59.53 per acre. The average over all fields was $20.74 per acre. Costs for risk, overhead, and management have not been included. These costs must be accounted for in any further interpretation of this data. Various Specified Operating Costs
Table 11 lists various specified operating costs that are required for wheat production. As seen in previous years, the largest specified operating cost in the WRVP was for fertilization with an average cost of $49.58 per acre. These costs ranged from $34.85 to $70.44 and include those associated with fertilizer application. This broad range can be attributed to three production aspects: previous crop, double-cropped production, and single vs. split fertilizer applications. The highest fertilization costs were in Clay and Lincoln Counties. These wheat fields were planted following rice, a rotation that requires high amounts of fall-applied N, P, and K. Fields in Arkansas, Jefferson, and Monroe Counties were more than likely fertilized in the fall with the following soybean crop in mind. The low fertilizer costs in Johnson, Logan, and Yell Counties can be attributed to single spring fertilizer applications with ground-driven equipment. Seed cost ranged from $19.50 to $29.58 per acre, averaging $23.13 per acre over the 12 fields. Preplant tillage was another notable specified operating cost for some fields. It ranged from $0 to $19.91 per acre with an average of $10.91 per acre.
16

Table 10. Economic Summary of Wheat Research Verification Fields in 2002-2003. Total Specified Total Specified Break-even Returns Above Total Operating Break-even Operating and Break-even Price with Total Specified Yield1 Income2 Costs3 Operating4 Ownership Costs5 Price6 Land Costs7 Costs8
County (bu/ac) ($/ac) ($/ac) ($/bu) ($/ac) ($/bu) ($/bu) ($/ac)
Arkansas 70.0 $221.20 $108.48 $1.55 $125.25 $1.79 $2.39 $40.65Clay - Pion 71.8 $226.89 $152.75 $2.13 $180.42 $2.51 $3.35 ($10.25)Clay - Pat 59.2 $187.07 $142.73 $2.41 $170.40 $2.88 $3.84 ($30.10)Jefferson 57.2 $180.75 $99.72 $1.74 $120.22 $2.10 $2.80 $15.34Johnson 64.5 $203.82 $86.97 $1.35 $108.87 $1.69 $2.25 $44.00
Lawrence 1 66.1 $208.88 $98.29 $1.49 $119.64 $1.81 $2.41 $37.02Lawrence 2 55.4 $175.06 $96.64 $1.74 $117.99 $2.13 $2.84 $13.31
Lincoln 63.2 $199.71 $126.27 $2.00 $145.94 $2.31 $3.08 $3.84Logan 64.5 $203.82 $106.64 $1.65 $136.58 $2.12 $2.82 $16.29
Monroe 68.0 $214.88 $90.52 $1.33 $101.63 $1.49 $1.99 $59.53Yell 61.8 $195.29 $84.65 $1.37 $107.96 $1.75 $2.33 $38.51Lee9
43.1 $136.20 $101.00 $2.34 $120.72 $2.80 $3.73 ($18.57)Average: 63.8 $201.58 $108.51 $1.71 $130.45 $2.05 $2.74 $20.74
1Yields adjusted to 13.5% moisture. 2Based upon state average wheat price for June delivery, $3.16/bu.
3Specified out-of-pocket expenses, such as seed, fertilizer, herbicides, irrigation, etc. 4Price per bushel required by the farmer to equal total specified operating costs. Does not include land, overhead, risk, and management cost. 5Total specified operating costs plus ownership costs which include charges for depreciation and interest on all machinery and irrigation equipment, taxes, and insurance. 6Price per bushel required by the farmer to equal total specified operating and ownership costs. Does not include overhead, risk, and management costs. 7Break-even price per bushel plus a 25% crop share rent. Does not include overhead, risk, and management costs. 8A 25% crop share rent was assumed as a land charge for a renter situation. No cost sharing was assumed. 9Yield of the Lee County field was significantly affected by glyphosate drift; therefore, it was excluded from the economic summary averages.
17

Table 11. Various Specified Operating Costs of the Wheat Verification Fields in 2002-2003. Preplant Tillage Fertilization Pest Control Operating Cost with Seed Insecticide Fungicide Herbicide No. of Cost Application Cost Cost Cost Cost
County Trips ($/ac) ($/ac) ($/ac) ($/ac) ($/ac) ($/ac)
Arkansas 0 $0.00 $54.20 $19.50 $0.00 $0.00 $8.18Clay - Pion 4 $18.54 $70.44 $29.58 $0.00 $0.00 $12.87 Clay - Pat 4 $18.54 $70.44 $22.62 $0.00 $0.00 $12.87 Jefferson 2 $6.22 $50.91 $27.20 $0.00 $0.00 $0.00 Johnson 2 $10.46 $42.24 $19.50 $0.00 $0.00 $0.00
Lawrence 1 2 $11.80 $38.57 $19.55 $0.00 $0.00 $10.56 Lawrence 2 2 $11.80 $38.57 $19.55 $0.00 $0.00 $10.56
Lee 1 $2.66 $39.85 $25.50 $0.00 $0.00 $12.14 Lincoln 1 $2.90 $70.00 $25.50 $0.00 $0.00 $1.38 Logan 4 $19.91 $34.85 $20.40 $0.00 $0.00 $12.89
Monroe 2 $8.86 $51.09 $25.50 $0.00 $0.00 $0.00 Yell 2 $8.29 $38.40 $19.50 $0.00 $0.00 $0.00
Average: 2 $10.91 $49.58 $23.13 $0.00 $0.00 $6.79
18

Appendix
Economic Analysis By County
Estimated operating expenses and crop input costs
19
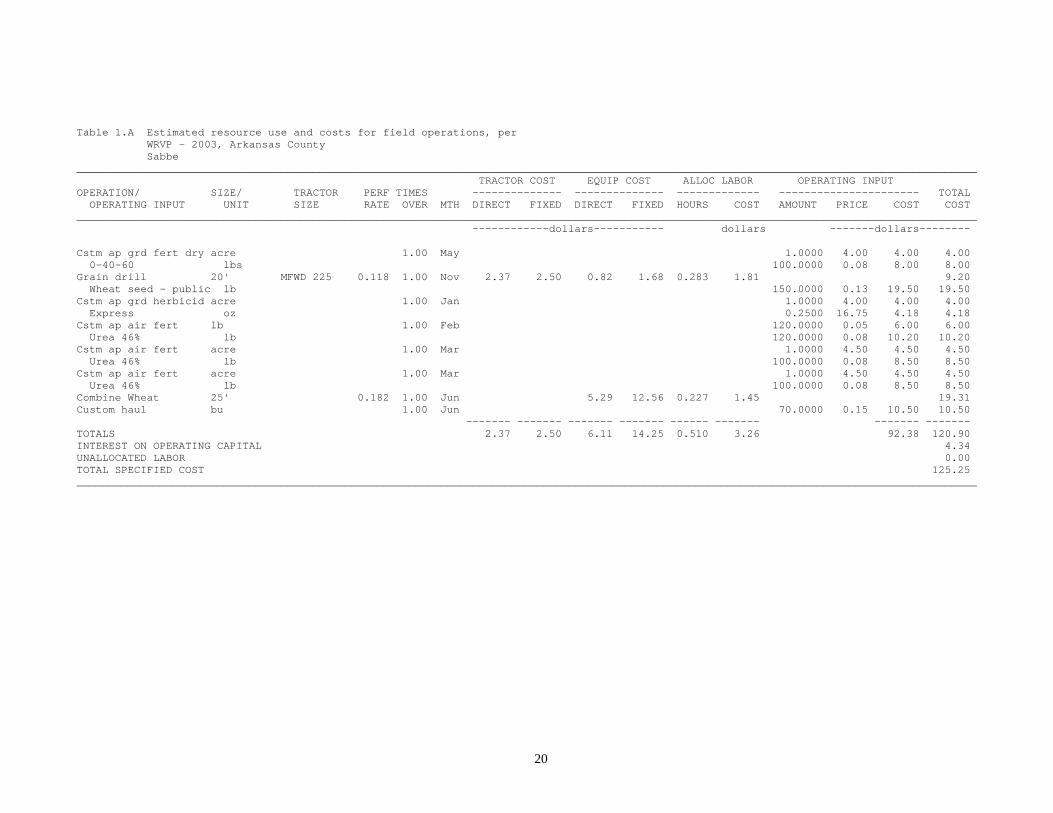
Table 1.A Estimated resource use and costs for field operations, per WRVP - 2003, Arkansas County Sabbe _____________________________________________________________________________________________________________________________________________ TRACTOR COST EQUIP COST ALLOC LABOR OPERATING INPUT OPERATION/ SIZE/ TRACTOR PERF TIMES -------------- -------------- ------------- ---------------------- TOTAL OPERATING INPUT UNIT SIZE RATE OVER MTH DIRECT FIXED DIRECT FIXED HOURS COST AMOUNT PRICE COST COST _____________________________________________________________________________________________________________________________________________ ------------dollars----------- dollars -------dollars-------- Cstm ap grd fert dry acre 1.00 May 1.0000 4.00 4.00 4.00 0-40-60 lbs 100.0000 0.08 8.00 8.00 Grain drill 20' MFWD 225 0.118 1.00 Nov 2.37 2.50 0.82 1.68 0.283 1.81 9.20 Wheat seed - public lb 150.0000 0.13 19.50 19.50 Cstm ap grd herbicid acre 1.00 Jan 1.0000 4.00 4.00 4.00 Express oz 0.2500 16.75 4.18 4.18 Cstm ap air fert lb 1.00 Feb 120.0000 0.05 6.00 6.00 Urea 46% lb 120.0000 0.08 10.20 10.20 Cstm ap air fert acre 1.00 Mar 1.0000 4.50 4.50 4.50 Urea 46% lb 100.0000 0.08 8.50 8.50 Cstm ap air fert acre 1.00 Mar 1.0000 4.50 4.50 4.50 Urea 46% lb 100.0000 0.08 8.50 8.50 Combine Wheat 25' 0.182 1.00 Jun 5.29 12.56 0.227 1.45 19.31 Custom haul bu 1.00 Jun 70.0000 0.15 10.50 10.50 ------- ------- ------- ------- ------ ------- ------- ------- TOTALS 2.37 2.50 6.11 14.25 0.510 3.26 92.38 120.90 INTEREST ON OPERATING CAPITAL 4.34 UNALLOCATED LABOR 0.00 TOTAL SPECIFIED COST 125.25 _____________________________________________________________________________________________________________________________________________
20
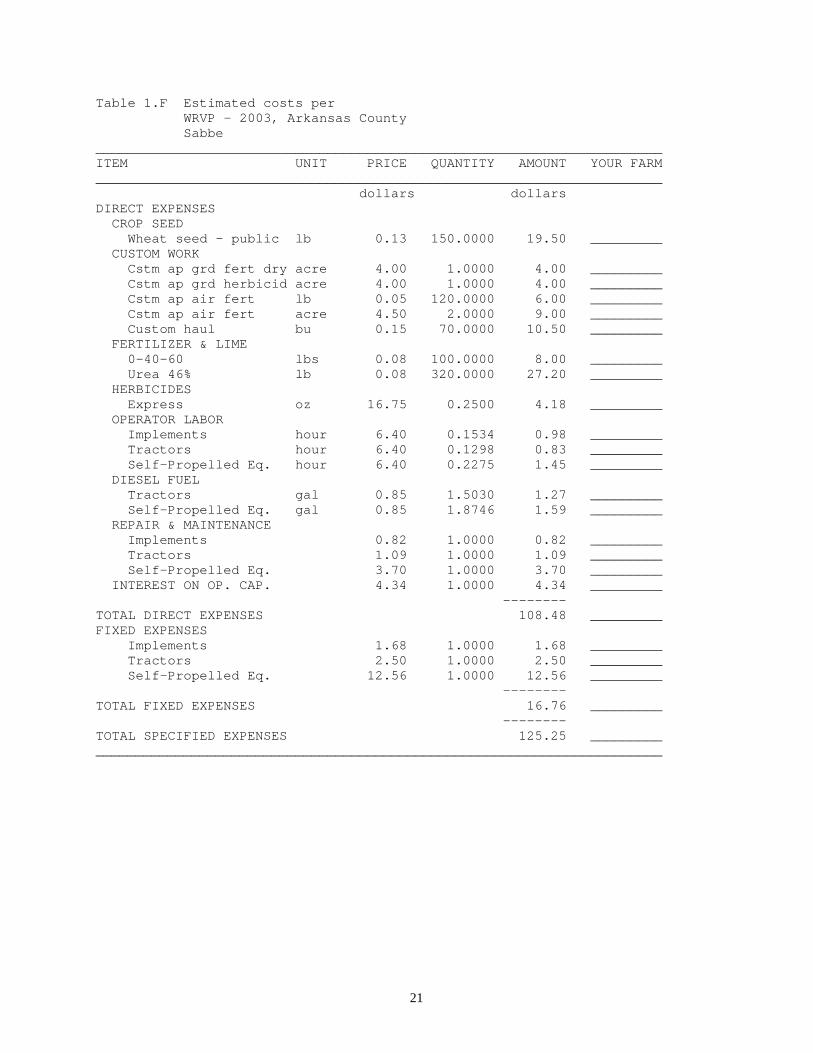
Table 1.F Estimated costs per WRVP - 2003, Arkansas County Sabbe _______________________________________________________________________ ITEM UNIT PRICE QUANTITY AMOUNT YOUR FARM _______________________________________________________________________ dollars dollars DIRECT EXPENSES CROP SEED Wheat seed - public lb 0.13 150.0000 19.50 _________ CUSTOM WORK Cstm ap grd fert dry acre 4.00 1.0000 4.00 _________ Cstm ap grd herbicid acre 4.00 1.0000 4.00 _________ Cstm ap air fert lb 0.05 120.0000 6.00 _________ Cstm ap air fert acre 4.50 2.0000 9.00 _________ Custom haul bu 0.15 70.0000 10.50 _________ FERTILIZER & LIME 0-40-60 lbs 0.08 100.0000 8.00 _________ Urea 46% lb 0.08 320.0000 27.20 _________ HERBICIDES Express oz 16.75 0.2500 4.18 _________ OPERATOR LABOR Implements hour 6.40 0.1534 0.98 _________ Tractors hour 6.40 0.1298 0.83 _________ Self-Propelled Eq. hour 6.40 0.2275 1.45 _________ DIESEL FUEL Tractors gal 0.85 1.5030 1.27 _________ Self-Propelled Eq. gal 0.85 1.8746 1.59 _________ REPAIR & MAINTENANCE Implements 0.82 1.0000 0.82 _________ Tractors 1.09 1.0000 1.09 _________ Self-Propelled Eq. 3.70 1.0000 3.70 _________ INTEREST ON OP. CAP. 4.34 1.0000 4.34 _________ -------- TOTAL DIRECT EXPENSES 108.48 _________ FIXED EXPENSES Implements 1.68 1.0000 1.68 _________ Tractors 2.50 1.0000 2.50 _________ Self-Propelled Eq. 12.56 1.0000 12.56 _________ -------- TOTAL FIXED EXPENSES 16.76 _________ -------- TOTAL SPECIFIED EXPENSES 125.25 _________ _______________________________________________________________________
21
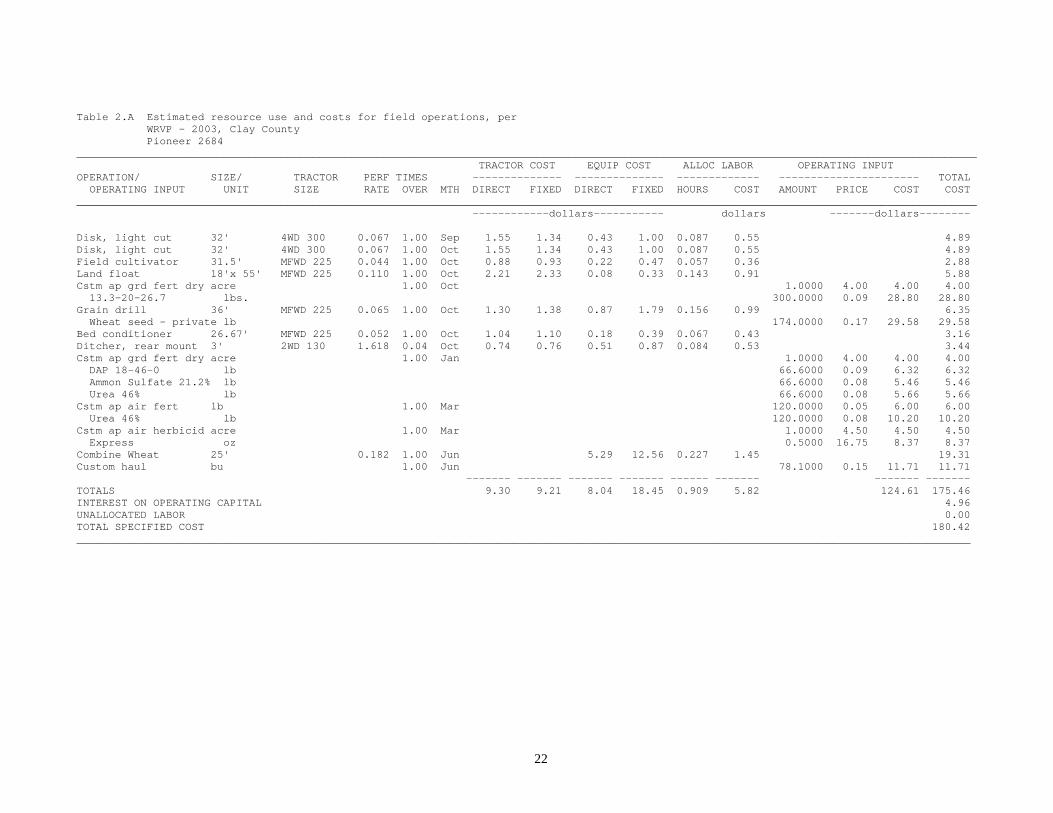
Table 2.A Estimated resource use and costs for field operations, per WRVP - 2003, Clay County Pioneer 2684 _____________________________________________________________________________________________________________________________________________ TRACTOR COST EQUIP COST ALLOC LABOR OPERATING INPUT OPERATION/ SIZE/ TRACTOR PERF TIMES -------------- -------------- ------------- ---------------------- TOTAL OPERATING INPUT UNIT SIZE RATE OVER MTH DIRECT FIXED DIRECT FIXED HOURS COST AMOUNT PRICE COST COST _____________________________________________________________________________________________________________________________________________ ------------dollars----------- dollars -------dollars-------- Disk, light cut 32' 4WD 300 0.067 1.00 Sep 1.55 1.34 0.43 1.00 0.087 0.55 4.89 Disk, light cut 32' 4WD 300 0.067 1.00 Oct 1.55 1.34 0.43 1.00 0.087 0.55 4.89 Field cultivator 31.5' MFWD 225 0.044 1.00 Oct 0.88 0.93 0.22 0.47 0.057 0.36 2.88 Land float 18'x 55' MFWD 225 0.110 1.00 Oct 2.21 2.33 0.08 0.33 0.143 0.91 5.88 Cstm ap grd fert dry acre 1.00 Oct 1.0000 4.00 4.00 4.00 13.3-20-26.7 lbs. 300.0000 0.09 28.80 28.80 Grain drill 36' MFWD 225 0.065 1.00 Oct 1.30 1.38 0.87 1.79 0.156 0.99 6.35 Wheat seed - private lb 174.0000 0.17 29.58 29.58 Bed conditioner 26.67' MFWD 225 0.052 1.00 Oct 1.04 1.10 0.18 0.39 0.067 0.43 3.16 Ditcher, rear mount 3' 2WD 130 1.618 0.04 Oct 0.74 0.76 0.51 0.87 0.084 0.53 3.44 Cstm ap grd fert dry acre 1.00 Jan 1.0000 4.00 4.00 4.00 DAP 18-46-0 lb 66.6000 0.09 6.32 6.32 Ammon Sulfate 21.2% lb 66.6000 0.08 5.46 5.46 Urea 46% lb 66.6000 0.08 5.66 5.66 Cstm ap air fert lb 1.00 Mar 120.0000 0.05 6.00 6.00 Urea 46% lb 120.0000 0.08 10.20 10.20 Cstm ap air herbicid acre 1.00 Mar 1.0000 4.50 4.50 4.50 Express oz 0.5000 16.75 8.37 8.37 Combine Wheat 25' 0.182 1.00 Jun 5.29 12.56 0.227 1.45 19.31 Custom haul bu 1.00 Jun 78.1000 0.15 11.71 11.71 ------- ------- ------- ------- ------ ------- ------- ------- TOTALS 9.30 9.21 8.04 18.45 0.909 5.82 124.61 175.46 INTEREST ON OPERATING CAPITAL 4.96 UNALLOCATED LABOR 0.00 TOTAL SPECIFIED COST 180.42 ________________________________________________________________________________________________________________________________________________________________________
22

23
Table 2.F Estimated costs per WRVP - 2003, Clay County Pioneer 2684 _______________________________________________________________________ ITEM UNIT PRICE QUANTITY AMOUNT YOUR FARM _______________________________________________________________________ dollars dollars DIRECT EXPENSES CROP SEED Wheat seed - private lb 0.17 174.0000 29.58 _________ CUSTOM WORK Cstm ap grd fert dry acre 4.00 2.0000 8.00 _________ Cstm ap air fert lb 0.05 120.0000 6.00 _________ Cstm ap air herbicid acre 4.50 1.0000 4.50 _________ Custom haul bu 0.15 78.1000 11.71 _________ FERTILIZER & LIME 13.3-20-26.7 lbs. 0.09 300.0000 28.80 _________ DAP 18-46-0 lb 0.09 66.6000 6.32 _________ Ammon Sulfate 21.2% lb 0.08 66.6000 5.46 _________ Urea 46% lb 0.08 186.6000 15.86 _________ HERBICIDES Express oz 16.75 0.5000 8.37 _________ OPERATOR LABOR Implements hour 6.40 0.1654 1.05 _________ Tractors hour 6.40 0.5166 3.30 _________ Self-Propelled Eq. hour 6.40 0.2275 1.45 _________ DIESEL FUEL Tractors gal 0.85 6.2041 5.27 _________ Self-Propelled Eq. gal 0.85 1.8746 1.59 _________ REPAIR & MAINTENANCE Implements 2.75 1.0000 2.75 _________ Tractors 4.02 1.0000 4.02 _________ Self-Propelled Eq. 3.70 1.0000 3.70 _________ INTEREST ON OP. CAP. 4.96 1.0000 4.96 _________ -------- TOTAL DIRECT EXPENSES 152.75 _________ FIXED EXPENSES Implements 5.88 1.0000 5.88 _________ Tractors 9.21 1.0000 9.21 _________ Self-Propelled Eq. 12.56 1.0000 12.56 _________ -------- TOTAL FIXED EXPENSES 27.67 _________ -------- TOTAL SPECIFIED EXPENSES 180.42 _________ _______________________________________________________________________
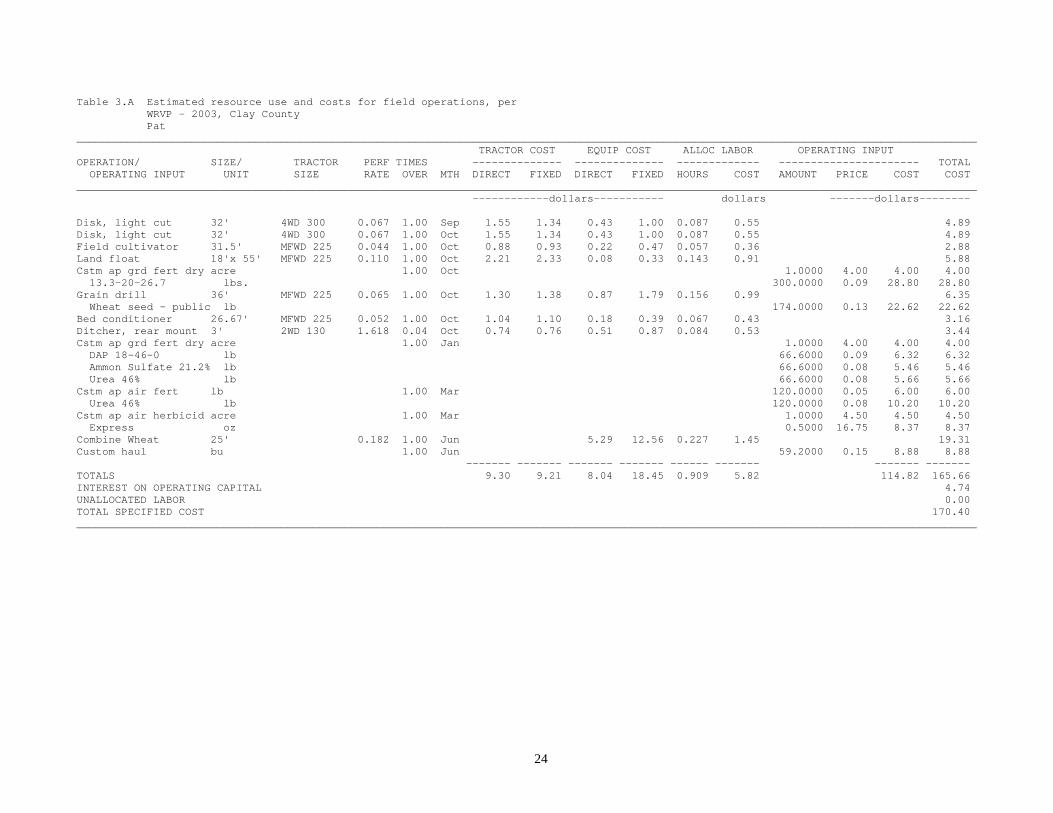
Table 3.A Estimated resource use and costs for field operations, per WRVP - 2003, Clay County Pat _____________________________________________________________________________________________________________________________________________ TRACTOR COST EQUIP COST ALLOC LABOR OPERATING INPUT OPERATION/ SIZE/ TRACTOR PERF TIMES -------------- -------------- ------------- ---------------------- TOTAL OPERATING INPUT UNIT SIZE RATE OVER MTH DIRECT FIXED DIRECT FIXED HOURS COST AMOUNT PRICE COST COST _____________________________________________________________________________________________________________________________________________ ------------dollars----------- dollars -------dollars-------- Disk, light cut 32' 4WD 300 0.067 1.00 Sep 1.55 1.34 0.43 1.00 0.087 0.55 4.89 Disk, light cut 32' 4WD 300 0.067 1.00 Oct 1.55 1.34 0.43 1.00 0.087 0.55 4.89 Field cultivator 31.5' MFWD 225 0.044 1.00 Oct 0.88 0.93 0.22 0.47 0.057 0.36 2.88 Land float 18'x 55' MFWD 225 0.110 1.00 Oct 2.21 2.33 0.08 0.33 0.143 0.91 5.88 Cstm ap grd fert dry acre 1.00 Oct 1.0000 4.00 4.00 4.00 13.3-20-26.7 lbs. 300.0000 0.09 28.80 28.80 Grain drill 36' MFWD 225 0.065 1.00 Oct 1.30 1.38 0.87 1.79 0.156 0.99 6.35 Wheat seed - public lb 174.0000 0.13 22.62 22.62 Bed conditioner 26.67' MFWD 225 0.052 1.00 Oct 1.04 1.10 0.18 0.39 0.067 0.43 3.16 Ditcher, rear mount 3' 2WD 130 1.618 0.04 Oct 0.74 0.76 0.51 0.87 0.084 0.53 3.44 Cstm ap grd fert dry acre 1.00 Jan 1.0000 4.00 4.00 4.00 DAP 18-46-0 lb 66.6000 0.09 6.32 6.32 Ammon Sulfate 21.2% lb 66.6000 0.08 5.46 5.46 Urea 46% lb 66.6000 0.08 5.66 5.66 Cstm ap air fert lb 1.00 Mar 120.0000 0.05 6.00 6.00 Urea 46% lb 120.0000 0.08 10.20 10.20 Cstm ap air herbicid acre 1.00 Mar 1.0000 4.50 4.50 4.50 Express oz 0.5000 16.75 8.37 8.37 Combine Wheat 25' 0.182 1.00 Jun 5.29 12.56 0.227 1.45 19.31 Custom haul bu 1.00 Jun 59.2000 0.15 8.88 8.88 ------- ------- ------- ------- ------ ------- ------- ------- TOTALS 9.30 9.21 8.04 18.45 0.909 5.82 114.82 165.66 INTEREST ON OPERATING CAPITAL 4.74 UNALLOCATED LABOR 0.00 TOTAL SPECIFIED COST 170.40 _____________________________________________________________________________________________________________________________________________
24

25
Table 3.F Estimated costs per WRVP - 2003, Clay County Pat _______________________________________________________________________ ITEM UNIT PRICE QUANTITY AMOUNT YOUR FARM _______________________________________________________________________ dollars dollars DIRECT EXPENSES CROP SEED Wheat seed - public lb 0.13 174.0000 22.62 _________ CUSTOM WORK Cstm ap grd fert dry acre 4.00 2.0000 8.00 _________ Cstm ap air fert lb 0.05 120.0000 6.00 _________ Cstm ap air herbicid acre 4.50 1.0000 4.50 _________ Custom haul bu 0.15 59.2000 8.88 _________ FERTILIZER & LIME 13.3-20-26.7 lbs. 0.09 300.0000 28.80 _________ DAP 18-46-0 lb 0.09 66.6000 6.32 _________ Ammon Sulfate 21.2% lb 0.08 66.6000 5.46 _________ Urea 46% lb 0.08 186.6000 15.86 _________ HERBICIDES Express oz 16.75 0.5000 8.37 _________ OPERATOR LABOR Implements hour 6.40 0.1654 1.05 _________ Tractors hour 6.40 0.5166 3.30 _________ Self-Propelled Eq. hour 6.40 0.2275 1.45 _________ DIESEL FUEL Tractors gal 0.85 6.2041 5.27 _________ Self-Propelled Eq. gal 0.85 1.8746 1.59 _________ REPAIR & MAINTENANCE Implements 2.75 1.0000 2.75 _________ Tractors 4.02 1.0000 4.02 _________ Self-Propelled Eq. 3.70 1.0000 3.70 _________ INTEREST ON OP. CAP. 4.74 1.0000 4.74 _________ -------- TOTAL DIRECT EXPENSES 142.73 _________ FIXED EXPENSES Implements 5.88 1.0000 5.88 _________ Tractors 9.21 1.0000 9.21 _________ Self-Propelled Eq. 12.56 1.0000 12.56 _________ -------- TOTAL FIXED EXPENSES 27.67 _________ -------- TOTAL SPECIFIED EXPENSES 170.40 _________ _______________________________________________________________________
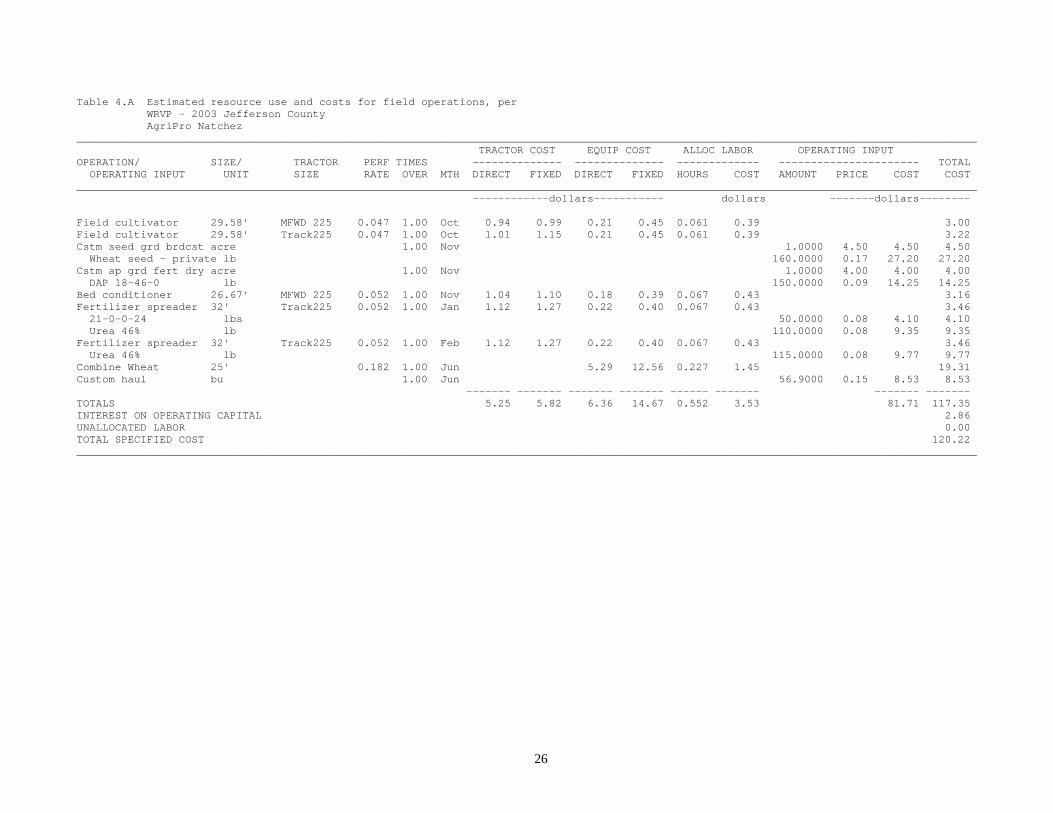
Table 4.A Estimated resource use and costs for field operations, per WRVP - 2003 Jefferson County AgriPro Natchez _____________________________________________________________________________________________________________________________________________ TRACTOR COST EQUIP COST ALLOC LABOR OPERATING INPUT OPERATION/ SIZE/ TRACTOR PERF TIMES -------------- -------------- ------------- ---------------------- TOTAL OPERATING INPUT UNIT SIZE RATE OVER MTH DIRECT FIXED DIRECT FIXED HOURS COST AMOUNT PRICE COST COST _____________________________________________________________________________________________________________________________________________ ------------dollars----------- dollars -------dollars-------- Field cultivator 29.58' MFWD 225 0.047 1.00 Oct 0.94 0.99 0.21 0.45 0.061 0.39 3.00 Field cultivator 29.58' Track225 0.047 1.00 Oct 1.01 1.15 0.21 0.45 0.061 0.39 3.22 Cstm seed grd brdcst acre 1.00 Nov 1.0000 4.50 4.50 4.50 Wheat seed - private lb 160.0000 0.17 27.20 27.20 Cstm ap grd fert dry acre 1.00 Nov 1.0000 4.00 4.00 4.00 DAP 18-46-0 lb 150.0000 0.09 14.25 14.25 Bed conditioner 26.67' MFWD 225 0.052 1.00 Nov 1.04 1.10 0.18 0.39 0.067 0.43 3.16 Fertilizer spreader 32' Track225 0.052 1.00 Jan 1.12 1.27 0.22 0.40 0.067 0.43 3.46 21-0-0-24 lbs 50.0000 0.08 4.10 4.10 Urea 46% lb 110.0000 0.08 9.35 9.35 Fertilizer spreader 32' Track225 0.052 1.00 Feb 1.12 1.27 0.22 0.40 0.067 0.43 3.46 Urea 46% lb 115.0000 0.08 9.77 9.77 Combine Wheat 25' 0.182 1.00 Jun 5.29 12.56 0.227 1.45 19.31 Custom haul bu 1.00 Jun 56.9000 0.15 8.53 8.53 ------- ------- ------- ------- ------ ------- ------- ------- TOTALS 5.25 5.82 6.36 14.67 0.552 3.53 81.71 117.35 INTEREST ON OPERATING CAPITAL 2.86 UNALLOCATED LABOR 0.00 TOTAL SPECIFIED COST 120.22 _____________________________________________________________________________________________________________________________________________
26

27
Table 4.F Estimated costs per WRVP - 2003 Jefferson County AgriPro Natchez _______________________________________________________________________ ITEM UNIT PRICE QUANTITY AMOUNT YOUR FARM _______________________________________________________________________ dollars dollars DIRECT EXPENSES CROP SEED Wheat seed - private lb 0.17 160.0000 27.20 _________ CUSTOM WORK Cstm seed grd brdcst acre 4.50 1.0000 4.50 _________ Cstm ap grd fert dry acre 4.00 1.0000 4.00 _________ Custom haul bu 0.15 56.9000 8.53 _________ FERTILIZER & LIME DAP 18-46-0 lb 0.09 150.0000 14.25 _________ 21-0-0-24 lbs 0.08 50.0000 4.10 _________ Urea 46% lb 0.08 225.0000 19.12 _________ OPERATOR LABOR Implements hour 6.40 0.0500 0.32 _________ Tractors hour 6.40 0.2750 1.76 _________ Self-Propelled Eq. hour 6.40 0.2275 1.45 _________ DIESEL FUEL Tractors gal 0.85 3.1845 2.70 _________ Self-Propelled Eq. gal 0.85 1.8746 1.59 _________ REPAIR & MAINTENANCE Implements 1.06 1.0000 1.06 _________ Tractors 2.54 1.0000 2.54 _________ Self-Propelled Eq. 3.70 1.0000 3.70 _________ INTEREST ON OP. CAP. 2.86 1.0000 2.86 _________ -------- TOTAL DIRECT EXPENSES 99.72 _________ FIXED EXPENSES Implements 2.11 1.0000 2.11 _________ Tractors 5.82 1.0000 5.82 _________ Self-Propelled Eq. 12.56 1.0000 12.56 _________ -------- TOTAL FIXED EXPENSES 20.49 _________ -------- TOTAL SPECIFIED EXPENSES 120.22 _________ _______________________________________________________________________

Table 5.A Estimated resource use and costs for field operations, per WRVP -2003, Johnson County Pat _____________________________________________________________________________________________________________________________________________ TRACTOR COST EQUIP COST ALLOC LABOR OPERATING INPUT OPERATION/ SIZE/ TRACTOR PERF TIMES -------------- -------------- ------------- ---------------------- TOTAL OPERATING INPUT UNIT SIZE RATE OVER MTH DIRECT FIXED DIRECT FIXED HOURS COST AMOUNT PRICE COST COST _____________________________________________________________________________________________________________________________________________ ------------dollars----------- dollars -------dollars-------- Fertilizer spreader 32' 2WD 130 0.052 1.00 Oct 0.59 0.61 0.22 0.40 0.067 0.43 2.27 0-0-60 lb 100.0000 0.07 7.60 7.60 DAP 18-46-0 lb 50.0000 0.09 4.75 4.75 Urea 46% lb 50.0000 0.08 4.25 4.25 Disk, light cut 21.75' 2WD 170 0.099 2.00 Oct 2.91 2.97 0.87 2.04 0.257 1.64 10.46 Fertilizer spreader 32' 2WD 130 0.052 1.00 Oct 0.59 0.61 0.22 0.40 0.067 0.43 2.27 Wheat seed - public lb 150.0000 0.13 19.50 19.50 Field cultivator 25.5' MFWD 170 0.054 1.00 Oct 0.79 0.81 0.20 0.43 0.070 0.44 2.69 Fertilizer spreader 32' 2WD 130 0.052 1.00 Feb 0.59 0.61 0.22 0.40 0.067 0.43 2.27 Urea 46% lb 200.0000 0.08 17.00 17.00 21-0-0-24 lbs 50.0000 0.08 4.10 4.10 Combine Wheat 25' 0.182 1.00 Jun 5.29 12.56 0.227 1.45 19.31 Custom haul bu 1.00 Jun 64.5000 0.15 9.67 9.67 ------- ------- ------- ------- ------ ------- ------- ------- TOTALS 5.49 5.63 7.05 16.26 0.757 4.85 66.87 106.18 INTEREST ON OPERATING CAPITAL 2.69 UNALLOCATED LABOR 0.00 TOTAL SPECIFIED COST 108.87 _____________________________________________________________________________________________________________________________________________
28

29
Table 5.F Estimated costs per WRVP -2003, Johnson County Pat _______________________________________________________________________ ITEM UNIT PRICE QUANTITY AMOUNT YOUR FARM _______________________________________________________________________ dollars dollars DIRECT EXPENSES CROP SEED Wheat seed - public lb 0.13 150.0000 19.50 _________ CUSTOM WORK Custom haul bu 0.15 64.5000 9.67 _________ FERTILIZER & LIME 0-0-60 lb 0.07 100.0000 7.60 _________ DAP 18-46-0 lb 0.09 50.0000 4.75 _________ Urea 46% lb 0.08 250.0000 21.25 _________ 21-0-0-24 lbs 0.08 50.0000 4.10 _________ OPERATOR LABOR Implements hour 6.40 0.0816 0.52 _________ Tractors hour 6.40 0.4488 2.87 _________ Self-Propelled Eq. hour 6.40 0.2275 1.45 _________ DIESEL FUEL Tractors gal 0.85 3.5735 3.03 _________ Self-Propelled Eq. gal 0.85 1.8746 1.59 _________ REPAIR & MAINTENANCE Implements 1.76 1.0000 1.76 _________ Tractors 2.46 1.0000 2.46 _________ Self-Propelled Eq. 3.70 1.0000 3.70 _________ INTEREST ON OP. CAP. 2.69 1.0000 2.69 _________ -------- TOTAL DIRECT EXPENSES 86.97 _________ FIXED EXPENSES Implements 3.70 1.0000 3.70 _________ Tractors 5.63 1.0000 5.63 _________ Self-Propelled Eq. 12.56 1.0000 12.56 _________ -------- TOTAL FIXED EXPENSES 21.90 _________ -------- TOTAL SPECIFIED EXPENSES 108.87 _________ _______________________________________________________________________

Table 6.A Estimated resource use and costs for field operations, per WRVP - 2003. Lawrence County East Croplan 554W _____________________________________________________________________________________________________________________________________________ TRACTOR COST EQUIP COST ALLOC LABOR OPERATING INPUT OPERATION/ SIZE/ TRACTOR PERF TIMES -------------- -------------- ------------- ---------------------- TOTAL OPERATING INPUT UNIT SIZE RATE OVER MTH DIRECT FIXED DIRECT FIXED HOURS COST AMOUNT PRICE COST COST _____________________________________________________________________________________________________________________________________________ ------------dollars----------- dollars -------dollars-------- Disk, medium cut 29.25' MFWD 225 0.074 1.00 Sep 1.48 1.57 0.45 1.06 0.096 0.61 5.19 Land float 16'x 56' MFWD190 0.138 1.00 Sep 2.40 2.61 0.09 0.35 0.179 1.14 6.61 Grain drill 36' MFWD 225 0.065 1.00 Oct 1.30 1.38 0.87 1.79 0.156 0.99 6.35 Wheat seed - private lb 115.0000 0.17 19.55 19.55 Cstm ap grd herbicid acre 1.00 Oct 1.0000 4.00 4.00 4.00 Finesse oz 0.5000 13.12 6.56 6.56 Cstm ap grd fert dry acre 1.00 Jan 1.0000 4.00 4.00 4.00 DAP 18-46-0 lb 130.0000 0.09 12.35 12.35 Urea 46-0-0 lb 55.0000 0.08 4.67 4.67 Cstm ap air fert lb 1.00 Mar 130.0000 0.05 6.50 6.50 Urea 46-0-0 lb 130.0000 0.08 11.05 11.05 Combine Wheat 25' 0.182 1.00 Jun 5.29 12.56 0.227 1.45 19.31 Custom haul bu 65.7000 0.15 9.85 9.85 ------- ------- ------- ------- ------ ------- ------- ------- TOTALS 5.19 5.56 6.71 15.77 0.659 4.21 78.54 116.01 INTEREST ON OPERATING CAPITAL 3.62 UNALLOCATED LABOR 0.00 TOTAL SPECIFIED COST 119.64 _____________________________________________________________________________________________________________________________________________
30

31
Table 6.F Estimated costs per WRVP - 2003. Lawrence County East Croplan 554W _______________________________________________________________________ ITEM UNIT PRICE QUANTITY AMOUNT YOUR FARM _______________________________________________________________________ dollars dollars DIRECT EXPENSES CROP SEED Wheat seed - private lb 0.17 115.0000 19.55 _________ CUSTOM WORK Cstm ap grd herbicid acre 4.00 1.0000 4.00 _________ Cstm ap grd fert dry acre 4.00 1.0000 4.00 _________ Cstm ap air fert lb 0.05 130.0000 6.50 _________ Custom haul bu 0.15 65.7000 9.85 _________ FERTILIZER & LIME DAP 18-46-0 lb 0.09 130.0000 12.35 _________ Urea 46-0-0 lb 0.08 185.0000 15.72 _________ HERBICIDES Finesse oz 13.12 0.5000 6.56 _________ OPERATOR LABOR Implements hour 6.40 0.1269 0.81 _________ Tractors hour 6.40 0.3047 1.95 _________ Self-Propelled Eq. hour 6.40 0.2275 1.45 _________ DIESEL FUEL Tractors gal 0.85 3.2538 2.76 _________ Self-Propelled Eq. gal 0.85 1.8746 1.59 _________ REPAIR & MAINTENANCE Implements 1.42 1.0000 1.42 _________ Tractors 2.43 1.0000 2.43 _________ Self-Propelled Eq. 3.70 1.0000 3.70 _________ INTEREST ON OP. CAP. 3.62 1.0000 3.62 _________ -------- TOTAL DIRECT EXPENSES 98.29 _________ FIXED EXPENSES Implements 3.20 1.0000 3.20 _________ Tractors 5.56 1.0000 5.56 _________ Self-Propelled Eq. 12.56 1.0000 12.56 _________ -------- TOTAL FIXED EXPENSES 21.34 _________ -------- TOTAL SPECIFIED EXPENSES 119.64 _________ _______________________________________________________________________

Table 7.A Estimated resource use and costs for field operations, per WRVP - 2003, Lawrence County West Terral 8555 _____________________________________________________________________________________________________________________________________________ TRACTOR COST EQUIP COST ALLOC LABOR OPERATING INPUT OPERATION/ SIZE/ TRACTOR PERF TIMES -------------- -------------- ------------- ---------------------- TOTAL OPERATING INPUT UNIT SIZE RATE OVER MTH DIRECT FIXED DIRECT FIXED HOURS COST AMOUNT PRICE COST COST _____________________________________________________________________________________________________________________________________________ ------------dollars----------- dollars -------dollars-------- Disk, medium cut 29.25' MFWD 225 0.074 1.00 Sep 1.48 1.57 0.45 1.06 0.096 0.61 5.19 Land float 16'x 56' MFWD190 0.138 1.00 Sep 2.40 2.61 0.09 0.35 0.179 1.14 6.61 Grain drill 36' MFWD 225 0.065 1.00 Oct 1.30 1.38 0.87 1.79 0.156 0.99 6.35 Wheat seed - private lb 115.0000 0.17 19.55 19.55 Cstm ap grd herbicid acre 1.00 Oct 1.0000 4.00 4.00 4.00 Finesse oz 0.5000 13.12 6.56 6.56 Cstm ap grd fert dry acre 1.00 Jan 1.0000 4.00 4.00 4.00 DAP 18-46-0 lb 130.0000 0.09 12.35 12.35 Urea 46-0-0 lb 55.0000 0.08 4.67 4.67 Cstm ap air fert lb 1.00 Mar 130.0000 0.05 6.50 6.50 Urea 46-0-0 lb 130.0000 0.08 11.05 11.05 Combine Wheat 25' 0.182 1.00 Jun 5.29 12.56 0.227 1.45 19.31 Custom haul bu 55.1000 0.15 8.26 8.26 ------- ------- ------- ------- ------ ------- ------- ------- TOTALS 5.19 5.56 6.71 15.77 0.659 4.21 76.95 114.42 INTEREST ON OPERATING CAPITAL 3.56 UNALLOCATED LABOR 0.00 TOTAL SPECIFIED COST 117.99 _____________________________________________________________________________________________________________________________________________
32
33
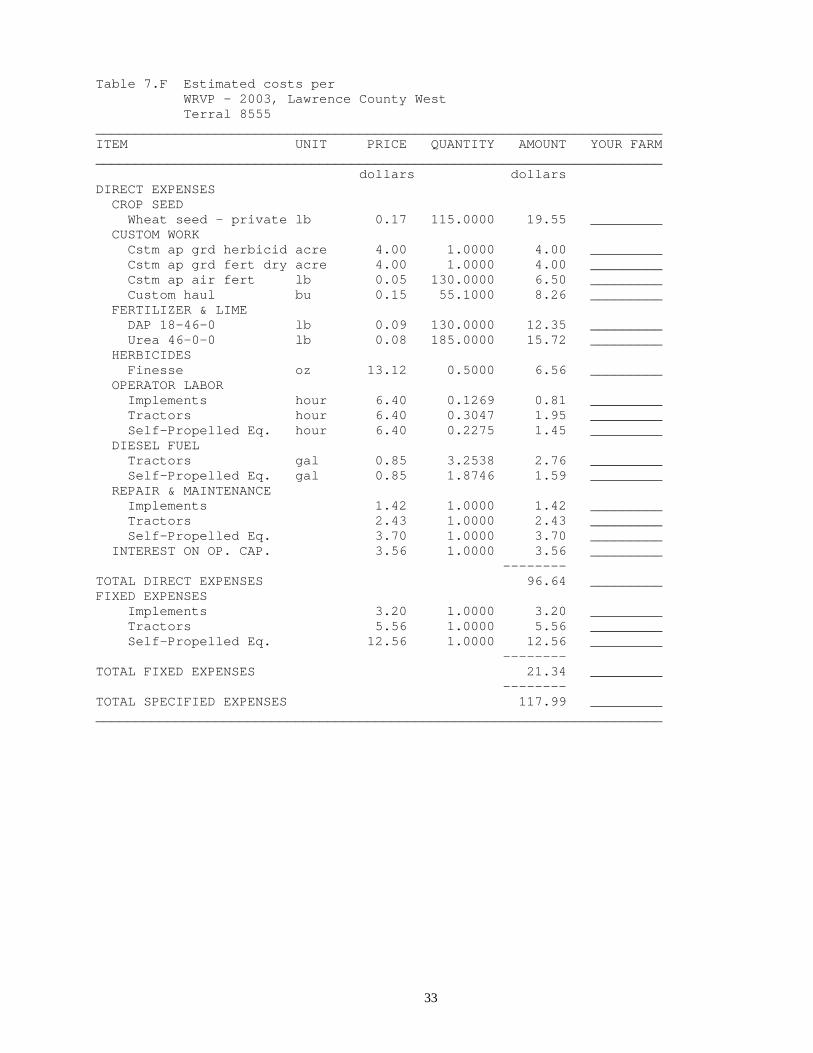
Table 7.F Estimated costs per WRVP - 2003, Lawrence County West Terral 8555 _______________________________________________________________________ ITEM UNIT PRICE QUANTITY AMOUNT YOUR FARM _______________________________________________________________________ dollars dollars DIRECT EXPENSES CROP SEED Wheat seed - private lb 0.17 115.0000 19.55 _________ CUSTOM WORK Cstm ap grd herbicid acre 4.00 1.0000 4.00 _________ Cstm ap grd fert dry acre 4.00 1.0000 4.00 _________ Cstm ap air fert lb 0.05 130.0000 6.50 _________ Custom haul bu 0.15 55.1000 8.26 _________ FERTILIZER & LIME DAP 18-46-0 lb 0.09 130.0000 12.35 _________ Urea 46-0-0 lb 0.08 185.0000 15.72 _________ HERBICIDES Finesse oz 13.12 0.5000 6.56 _________ OPERATOR LABOR Implements hour 6.40 0.1269 0.81 _________ Tractors hour 6.40 0.3047 1.95 _________ Self-Propelled Eq. hour 6.40 0.2275 1.45 _________ DIESEL FUEL Tractors gal 0.85 3.2538 2.76 _________ Self-Propelled Eq. gal 0.85 1.8746 1.59 _________ REPAIR & MAINTENANCE Implements 1.42 1.0000 1.42 _________ Tractors 2.43 1.0000 2.43 _________ Self-Propelled Eq. 3.70 1.0000 3.70 _________ INTEREST ON OP. CAP. 3.56 1.0000 3.56 _________ -------- TOTAL DIRECT EXPENSES 96.64 _________ FIXED EXPENSES Implements 3.20 1.0000 3.20 _________ Tractors 5.56 1.0000 5.56 _________ Self-Propelled Eq. 12.56 1.0000 12.56 _________ -------- TOTAL FIXED EXPENSES 21.34 _________ -------- TOTAL SPECIFIED EXPENSES 117.99 _________ _______________________________________________________________________

Table 8.A Estimated resource use and costs for field operations, per WRVP - 2003, Lee County Dixie 900 & Delta King 7777 _____________________________________________________________________________________________________________________________________________ TRACTOR COST EQUIP COST ALLOC LABOR OPERATING INPUT OPERATION/ SIZE/ TRACTOR PERF TIMES -------------- -------------- ------------- ---------------------- TOTAL OPERATING INPUT UNIT SIZE RATE OVER MTH DIRECT FIXED DIRECT FIXED HOURS COST AMOUNT PRICE COST COST _____________________________________________________________________________________________________________________________________________ ------------dollars----------- dollars -------dollars-------- Field cultivator 31.5' MFWD190 0.044 1.00 Oct 0.76 0.83 0.22 0.47 0.057 0.36 2.66 Grain drill 36' MFWD 225 0.065 1.00 Nov 1.30 1.38 0.87 1.79 0.156 0.99 6.35 Wheat seed - private lb 150.0000 0.17 25.50 25.50 Ditcher, rear mount 3' MFWD 225 1.618 0.04 Nov 1.30 1.37 0.51 0.87 0.084 0.53 4.61 Hiclr sprayer,320gal 60' 0.027 0.10 Jan 0.04 0.07 0.003 0.02 0.14 Hoelon pint 0.2330 7.44 1.73 1.73 Cstm ap grd fert dry acre 1.00 Jan 1.0000 4.00 4.00 4.00 DAP 18-46-0 lb 50.0000 0.09 4.75 4.75 21-0-0-24 lbs 50.0000 0.08 4.10 4.10 Cstm ap air fert lb 1.00 Mar 200.0000 0.05 10.00 10.00 Urea 46-0-0 lb 200.0000 0.08 17.00 17.00 Cstm ap air herbicid acre 1.00 Mar 1.0000 4.50 4.50 4.50 Harmony Extra oz 0.5000 11.55 5.77 5.77 Combine Wheat 25' 0.182 1.00 Jun 5.29 12.56 0.227 1.45 19.31 Custom haul bu 42.9400 0.15 6.44 6.44 ------- ------- ------- ------- ------ ------- ------- ------- TOTALS 3.37 3.59 6.94 15.79 0.528 3.38 83.79 116.89 INTEREST ON OPERATING CAPITAL 3.82 UNALLOCATED LABOR 0.00 TOTAL SPECIFIED COST 120.72 _____________________________________________________________________________________________________________________________________________
34
35
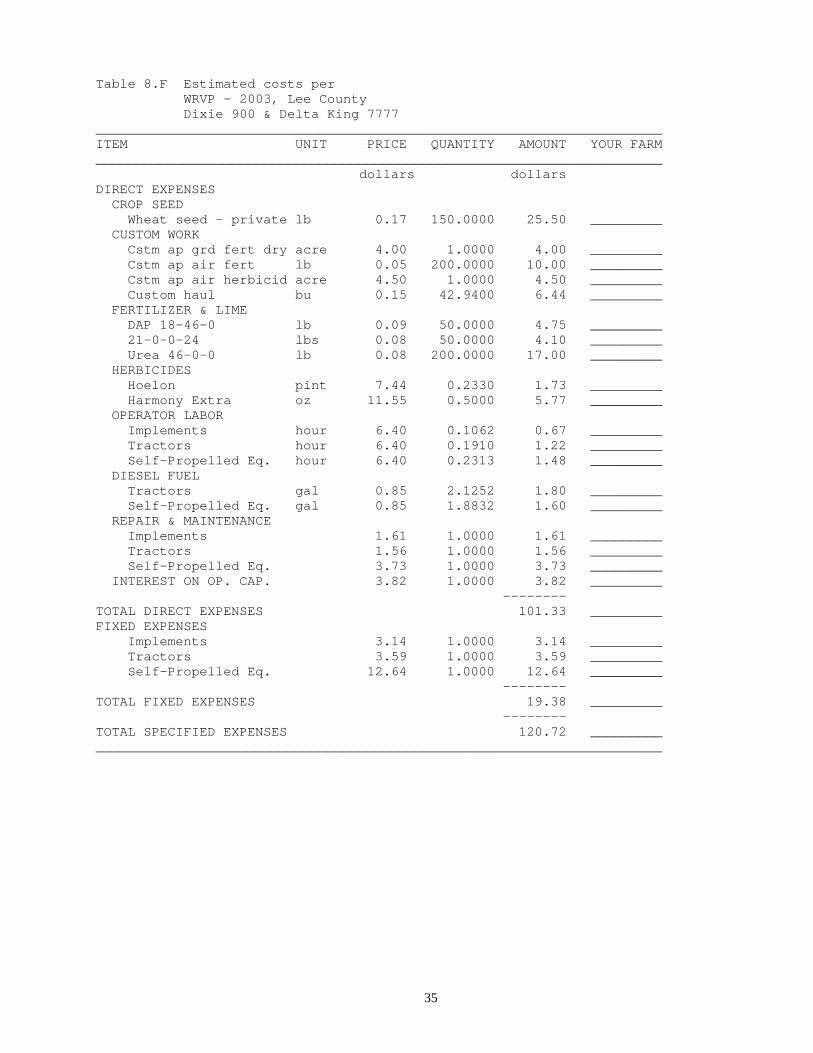
Table 8.F Estimated costs per WRVP - 2003, Lee County Dixie 900 & Delta King 7777 _______________________________________________________________________ ITEM UNIT PRICE QUANTITY AMOUNT YOUR FARM _______________________________________________________________________ dollars dollars DIRECT EXPENSES CROP SEED Wheat seed - private lb 0.17 150.0000 25.50 _________ CUSTOM WORK Cstm ap grd fert dry acre 4.00 1.0000 4.00 _________ Cstm ap air fert lb 0.05 200.0000 10.00 _________ Cstm ap air herbicid acre 4.50 1.0000 4.50 _________ Custom haul bu 0.15 42.9400 6.44 _________ FERTILIZER & LIME DAP 18-46-0 lb 0.09 50.0000 4.75 _________ 21-0-0-24 lbs 0.08 50.0000 4.10 _________ Urea 46-0-0 lb 0.08 200.0000 17.00 _________ HERBICIDES Hoelon pint 7.44 0.2330 1.73 _________ Harmony Extra oz 11.55 0.5000 5.77 _________ OPERATOR LABOR Implements hour 6.40 0.1062 0.67 _________ Tractors hour 6.40 0.1910 1.22 _________ Self-Propelled Eq. hour 6.40 0.2313 1.48 _________ DIESEL FUEL Tractors gal 0.85 2.1252 1.80 _________ Self-Propelled Eq. gal 0.85 1.8832 1.60 _________ REPAIR & MAINTENANCE Implements 1.61 1.0000 1.61 _________ Tractors 1.56 1.0000 1.56 _________ Self-Propelled Eq. 3.73 1.0000 3.73 _________ INTEREST ON OP. CAP. 3.82 1.0000 3.82 _________ -------- TOTAL DIRECT EXPENSES 101.33 _________ FIXED EXPENSES Implements 3.14 1.0000 3.14 _________ Tractors 3.59 1.0000 3.59 _________ Self-Propelled Eq. 12.64 1.0000 12.64 _________ -------- TOTAL FIXED EXPENSES 19.38 _________ -------- TOTAL SPECIFIED EXPENSES 120.72 _________ _______________________________________________________________________
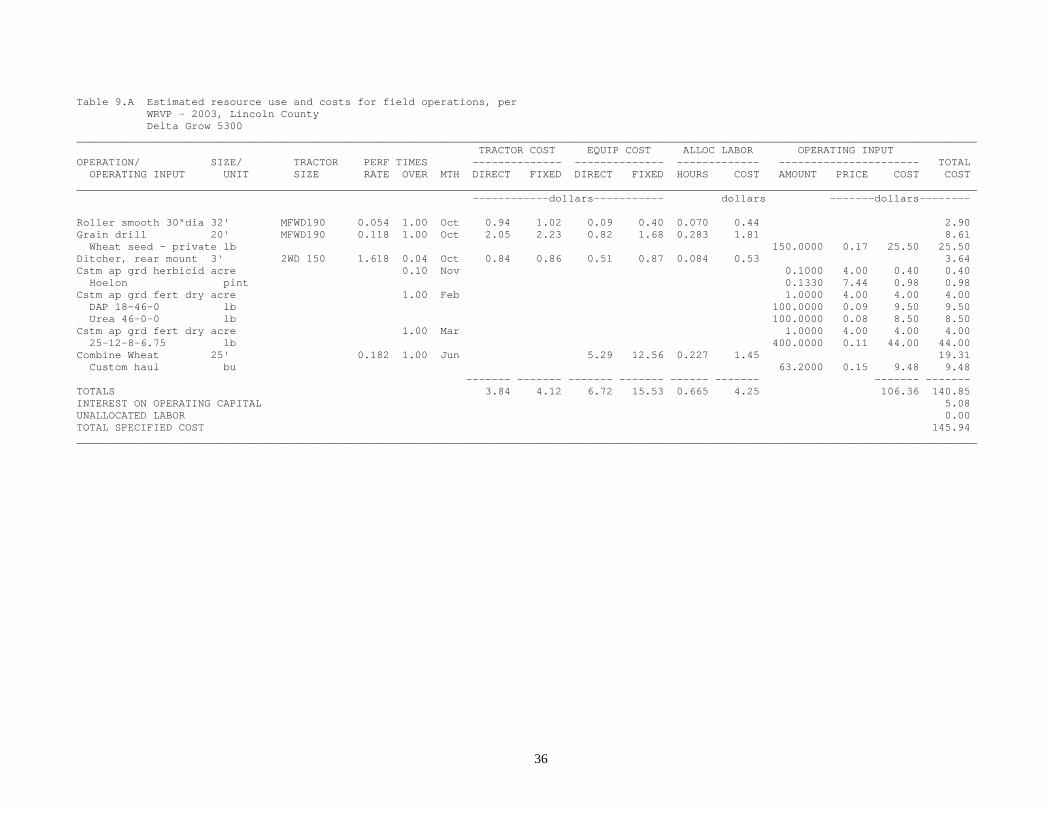
Table 9.A Estimated resource use and costs for field operations, per WRVP - 2003, Lincoln County Delta Grow 5300 _____________________________________________________________________________________________________________________________________________ TRACTOR COST EQUIP COST ALLOC LABOR OPERATING INPUT OPERATION/ SIZE/ TRACTOR PERF TIMES -------------- -------------- ------------- ---------------------- TOTAL OPERATING INPUT UNIT SIZE RATE OVER MTH DIRECT FIXED DIRECT FIXED HOURS COST AMOUNT PRICE COST COST _____________________________________________________________________________________________________________________________________________ ------------dollars----------- dollars -------dollars-------- Roller smooth 30"dia 32' MFWD190 0.054 1.00 Oct 0.94 1.02 0.09 0.40 0.070 0.44 2.90 Grain drill 20' MFWD190 0.118 1.00 Oct 2.05 2.23 0.82 1.68 0.283 1.81 8.61 Wheat seed - private lb 150.0000 0.17 25.50 25.50 Ditcher, rear mount 3' 2WD 150 1.618 0.04 Oct 0.84 0.86 0.51 0.87 0.084 0.53 3.64 Cstm ap grd herbicid acre 0.10 Nov 0.1000 4.00 0.40 0.40 Hoelon pint 0.1330 7.44 0.98 0.98 Cstm ap grd fert dry acre 1.00 Feb 1.0000 4.00 4.00 4.00 DAP 18-46-0 lb 100.0000 0.09 9.50 9.50 Urea 46-0-0 lb 100.0000 0.08 8.50 8.50 Cstm ap grd fert dry acre 1.00 Mar 1.0000 4.00 4.00 4.00 25-12-8-6.75 lb 400.0000 0.11 44.00 44.00 Combine Wheat 25' 0.182 1.00 Jun 5.29 12.56 0.227 1.45 19.31 Custom haul bu 63.2000 0.15 9.48 9.48 ------- ------- ------- ------- ------ ------- ------- ------- TOTALS 3.84 4.12 6.72 15.53 0.665 4.25 106.36 140.85 INTEREST ON OPERATING CAPITAL 5.08 UNALLOCATED LABOR 0.00 TOTAL SPECIFIED COST 145.94 _____________________________________________________________________________________________________________________________________________
36

37
Table 9.F Estimated costs per WRVP - 2003, Lincoln County Delta Grow 5300 _______________________________________________________________________ ITEM UNIT PRICE QUANTITY AMOUNT YOUR FARM _______________________________________________________________________ dollars dollars DIRECT EXPENSES CROP SEED Wheat seed - private lb 0.17 150.0000 25.50 _________ CUSTOM WORK Cstm ap grd herbicid acre 4.00 0.1000 0.40 _________ Cstm ap grd fert dry acre 4.00 2.0000 8.00 _________ Custom haul bu 0.15 63.2000 9.48 _________ FERTILIZER & LIME DAP 18-46-0 lb 0.09 100.0000 9.50 _________ Urea 46-0-0 lb 0.08 100.0000 8.50 _________ 25-12-8-6.75 lb 0.11 400.0000 44.00 _________ HERBICIDES Hoelon pint 7.44 0.1330 0.98 _________ OPERATOR LABOR Implements hour 6.40 0.1771 1.13 _________ Tractors hour 6.40 0.2603 1.66 _________ Self-Propelled Eq. hour 6.40 0.2275 1.45 _________ DIESEL FUEL Tractors gal 0.85 2.3982 2.03 _________ Self-Propelled Eq. gal 0.85 1.8746 1.59 _________ REPAIR & MAINTENANCE Implements 1.42 1.0000 1.42 _________ Tractors 1.80 1.0000 1.80 _________ Self-Propelled Eq. 3.70 1.0000 3.70 _________ INTEREST ON OP. CAP. 5.08 1.0000 5.08 _________ -------- TOTAL DIRECT EXPENSES 126.27 _________ FIXED EXPENSES Implements 2.96 1.0000 2.96 _________ Tractors 4.12 1.0000 4.12 _________ Self-Propelled Eq. 12.56 1.0000 12.56 _________ -------- TOTAL FIXED EXPENSES 19.66 _________ -------- TOTAL SPECIFIED EXPENSES 145.94 _________ _______________________________________________________________________

Table 10.A Estimated resource use and costs for field operations, per WRVP - 2003, Logan County Delta King 7777 _____________________________________________________________________________________________________________________________________________ TRACTOR COST EQUIP COST ALLOC LABOR OPERATING INPUT OPERATION/ SIZE/ TRACTOR PERF TIMES -------------- -------------- ------------- ---------------------- TOTAL OPERATING INPUT UNIT SIZE RATE OVER MTH DIRECT FIXED DIRECT FIXED HOURS COST AMOUNT PRICE COST COST _____________________________________________________________________________________________________________________________________________ ------------dollars----------- dollars -------dollars-------- Disk, light cut 32' MFWD 225 0.067 1.00 Aug 1.34 1.42 0.43 1.00 0.087 0.55 4.76 Chisel plow 17' MFWD190 0.114 1.00 Aug 1.98 2.16 0.17 0.35 0.148 0.94 5.62 Fertilizer spreader 32' 2WD 130 0.052 1.00 Oct 0.59 0.61 0.22 0.40 0.067 0.43 2.27 DAP 18-46-0 lb 100.0000 0.09 9.50 9.50 Urea 46-0-0 lb 50.0000 0.08 4.25 4.25 Disk, light cut 32' MFWD 225 0.067 2.00 Oct 2.69 2.84 0.86 2.01 0.174 1.11 9.53 Grain drill 20' 2WD 130 0.118 1.00 Oct 1.35 1.40 0.82 1.68 0.283 1.81 7.07 Wheat seed - private lb 120.0000 0.17 20.40 20.40 Ditcher, rear mount 3' 2WD 130 1.618 0.04 Oct 0.74 0.76 0.51 0.87 0.084 0.53 3.44 Hiclr sprayer,320gal 60' 0.027 1.00 Nov 0.41 0.78 0.038 0.24 1.44 Hoelon pint 1.3300 7.44 9.89 9.89 Peak oz 0.2500 12.00 3.00 3.00 Fertilizer spreader 32' 2WD 130 0.052 1.00 Feb 0.59 0.61 0.22 0.40 0.067 0.43 2.27 Urea 46-0-0 lb 200.0000 0.08 17.00 17.00 21-0-0-24 lbs 50.0000 0.08 4.10 4.10 Combine Wheat 25' 0.182 1.00 Jun 5.29 12.56 0.227 1.45 19.31 Custom haul bu 64.5000 0.15 9.67 9.67 ------- ------- ------- ------- ------ ------- ------- ------- TOTALS 9.31 9.83 8.97 20.10 1.178 7.54 77.82 133.58 INTEREST ON OPERATING CAPITAL 2.99 UNALLOCATED LABOR 0.00 TOTAL SPECIFIED COST 136.58 _____________________________________________________________________________________________________________________________________________
38
39
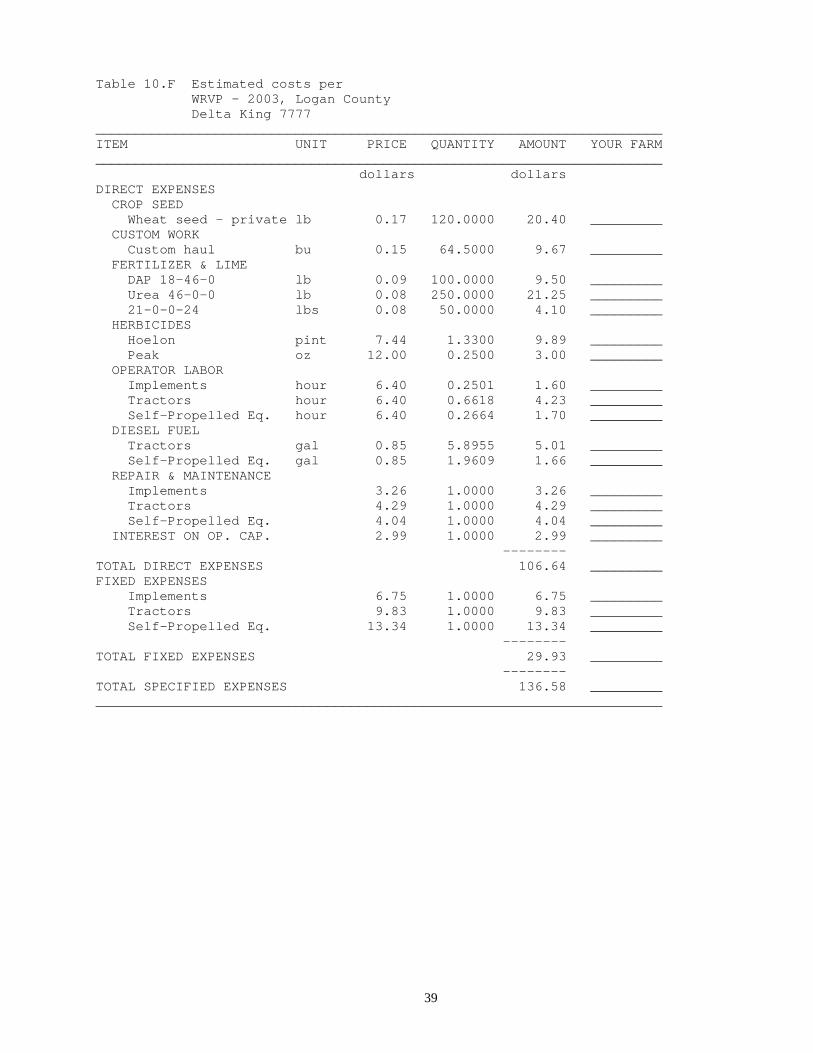
Table 10.F Estimated costs per WRVP - 2003, Logan County Delta King 7777 _______________________________________________________________________ ITEM UNIT PRICE QUANTITY AMOUNT YOUR FARM _______________________________________________________________________ dollars dollars DIRECT EXPENSES CROP SEED Wheat seed - private lb 0.17 120.0000 20.40 _________ CUSTOM WORK Custom haul bu 0.15 64.5000 9.67 _________ FERTILIZER & LIME DAP 18-46-0 lb 0.09 100.0000 9.50 _________ Urea 46-0-0 lb 0.08 250.0000 21.25 _________ 21-0-0-24 lbs 0.08 50.0000 4.10 _________ HERBICIDES Hoelon pint 7.44 1.3300 9.89 _________ Peak oz 12.00 0.2500 3.00 _________ OPERATOR LABOR Implements hour 6.40 0.2501 1.60 _________ Tractors hour 6.40 0.6618 4.23 _________ Self-Propelled Eq. hour 6.40 0.2664 1.70 _________ DIESEL FUEL Tractors gal 0.85 5.8955 5.01 _________ Self-Propelled Eq. gal 0.85 1.9609 1.66 _________ REPAIR & MAINTENANCE Implements 3.26 1.0000 3.26 _________ Tractors 4.29 1.0000 4.29 _________ Self-Propelled Eq. 4.04 1.0000 4.04 _________ INTEREST ON OP. CAP. 2.99 1.0000 2.99 _________ -------- TOTAL DIRECT EXPENSES 106.64 _________ FIXED EXPENSES Implements 6.75 1.0000 6.75 _________ Tractors 9.83 1.0000 9.83 _________ Self-Propelled Eq. 13.34 1.0000 13.34 _________ -------- TOTAL FIXED EXPENSES 29.93 _________ -------- TOTAL SPECIFIED EXPENSES 136.58 _________ _______________________________________________________________________
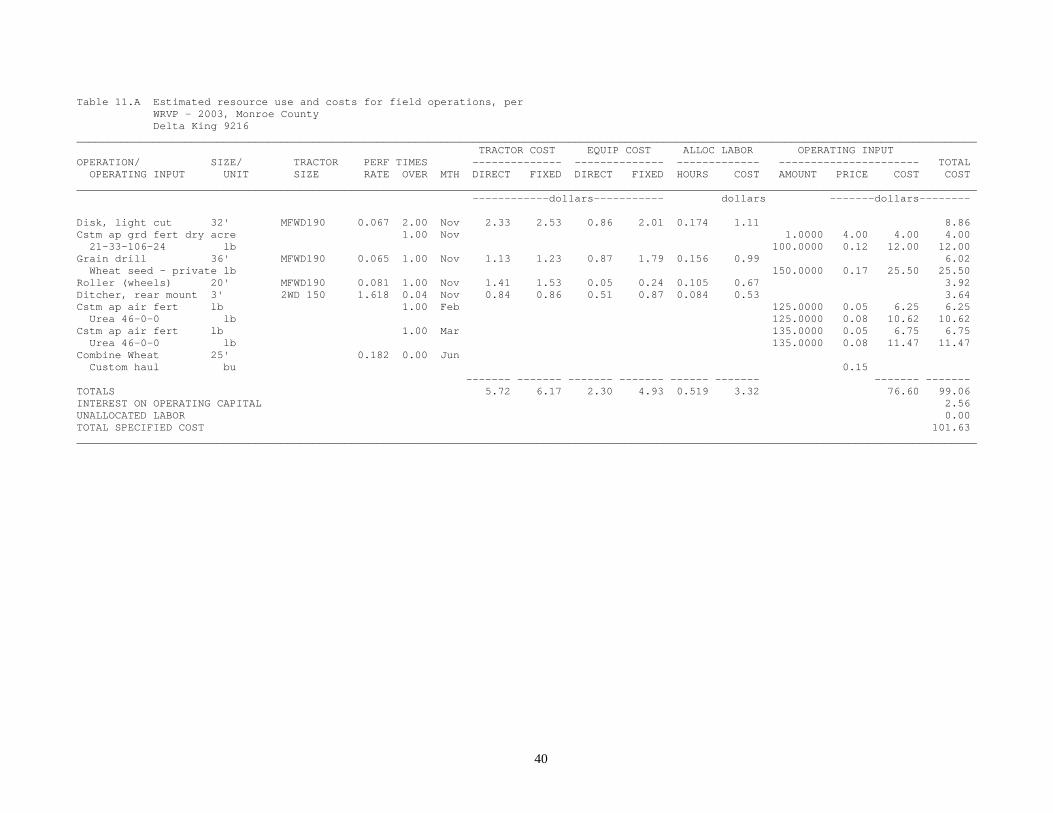
Table 11.A Estimated resource use and costs for field operations, per WRVP - 2003, Monroe County Delta King 9216 _____________________________________________________________________________________________________________________________________________ TRACTOR COST EQUIP COST ALLOC LABOR OPERATING INPUT OPERATION/ SIZE/ TRACTOR PERF TIMES -------------- -------------- ------------- ---------------------- TOTAL OPERATING INPUT UNIT SIZE RATE OVER MTH DIRECT FIXED DIRECT FIXED HOURS COST AMOUNT PRICE COST COST _____________________________________________________________________________________________________________________________________________ ------------dollars----------- dollars -------dollars-------- Disk, light cut 32' MFWD190 0.067 2.00 Nov 2.33 2.53 0.86 2.01 0.174 1.11 8.86 Cstm ap grd fert dry acre 1.00 Nov 1.0000 4.00 4.00 4.00 21-33-106-24 lb 100.0000 0.12 12.00 12.00 Grain drill 36' MFWD190 0.065 1.00 Nov 1.13 1.23 0.87 1.79 0.156 0.99 6.02 Wheat seed - private lb 150.0000 0.17 25.50 25.50 Roller (wheels) 20' MFWD190 0.081 1.00 Nov 1.41 1.53 0.05 0.24 0.105 0.67 3.92 Ditcher, rear mount 3' 2WD 150 1.618 0.04 Nov 0.84 0.86 0.51 0.87 0.084 0.53 3.64 Cstm ap air fert lb 1.00 Feb 125.0000 0.05 6.25 6.25 Urea 46-0-0 lb 125.0000 0.08 10.62 10.62 Cstm ap air fert lb 1.00 Mar 135.0000 0.05 6.75 6.75 Urea 46-0-0 lb 135.0000 0.08 11.47 11.47 Combine Wheat 25' 0.182 0.00 Jun Custom haul bu 0.15 ------- ------- ------- ------- ------ ------- ------- ------- TOTALS 5.72 6.17 2.30 4.93 0.519 3.32 76.60 99.06 INTEREST ON OPERATING CAPITAL 2.56 UNALLOCATED LABOR 0.00 TOTAL SPECIFIED COST 101.63 _____________________________________________________________________________________________________________________________________________
40
41
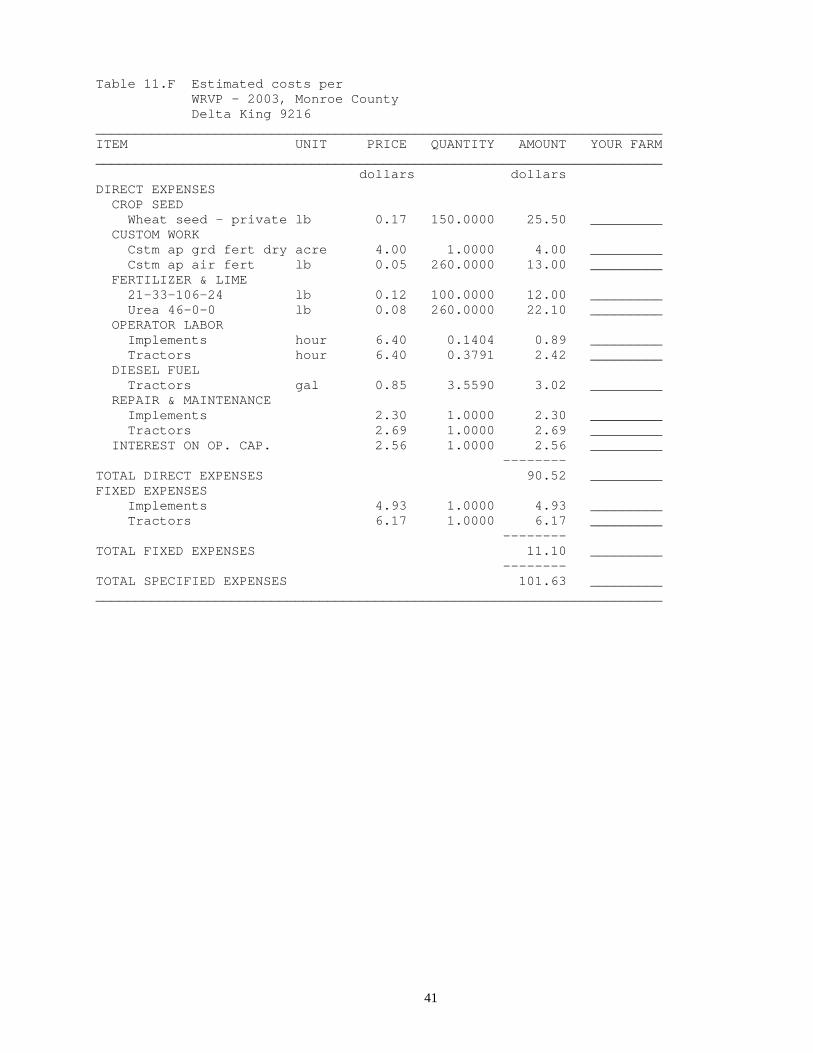
Table 11.F Estimated costs per WRVP - 2003, Monroe County Delta King 9216 _______________________________________________________________________ ITEM UNIT PRICE QUANTITY AMOUNT YOUR FARM _______________________________________________________________________ dollars dollars DIRECT EXPENSES CROP SEED Wheat seed - private lb 0.17 150.0000 25.50 _________ CUSTOM WORK Cstm ap grd fert dry acre 4.00 1.0000 4.00 _________ Cstm ap air fert lb 0.05 260.0000 13.00 _________ FERTILIZER & LIME 21-33-106-24 lb 0.12 100.0000 12.00 _________ Urea 46-0-0 lb 0.08 260.0000 22.10 _________ OPERATOR LABOR Implements hour 6.40 0.1404 0.89 _________ Tractors hour 6.40 0.3791 2.42 _________ DIESEL FUEL Tractors gal 0.85 3.5590 3.02 _________ REPAIR & MAINTENANCE Implements 2.30 1.0000 2.30 _________ Tractors 2.69 1.0000 2.69 _________ INTEREST ON OP. CAP. 2.56 1.0000 2.56 _________ -------- TOTAL DIRECT EXPENSES 90.52 _________ FIXED EXPENSES Implements 4.93 1.0000 4.93 _________ Tractors 6.17 1.0000 6.17 _________ -------- TOTAL FIXED EXPENSES 11.10 _________ -------- TOTAL SPECIFIED EXPENSES 101.63 _________ _______________________________________________________________________
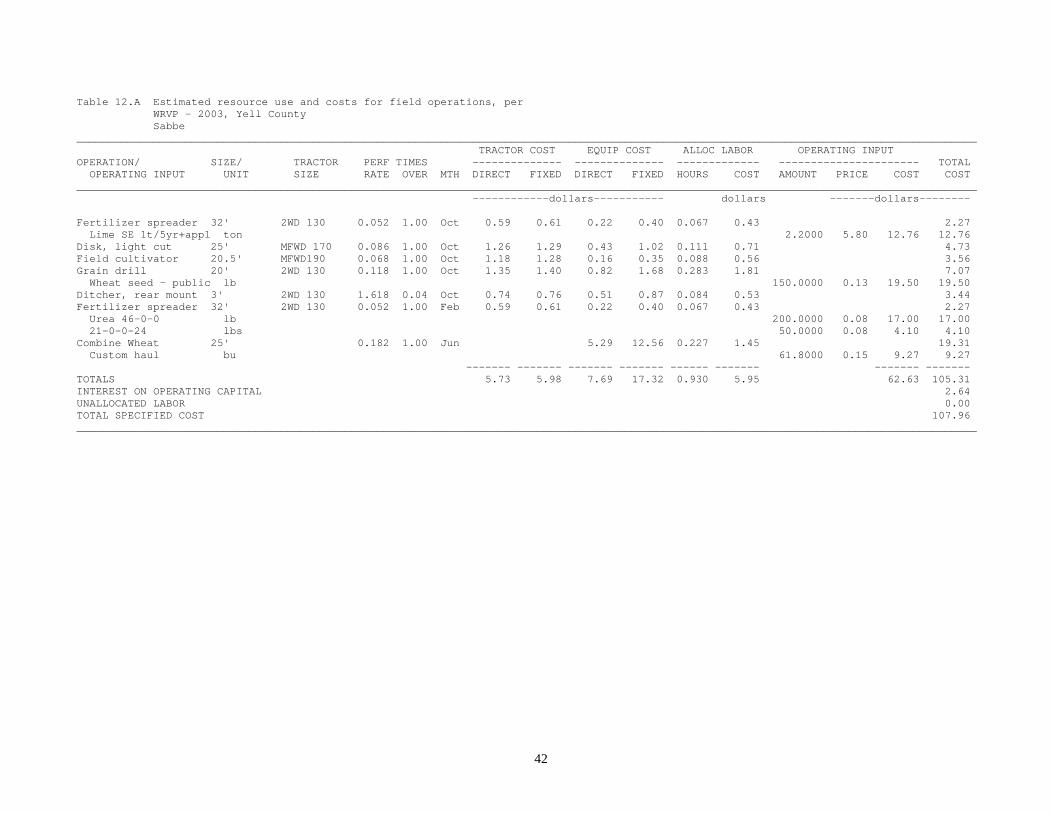
Table 12.A Estimated resource use and costs for field operations, per WRVP - 2003, Yell County Sabbe _____________________________________________________________________________________________________________________________________________ TRACTOR COST EQUIP COST ALLOC LABOR OPERATING INPUT OPERATION/ SIZE/ TRACTOR PERF TIMES -------------- -------------- ------------- ---------------------- TOTAL OPERATING INPUT UNIT SIZE RATE OVER MTH DIRECT FIXED DIRECT FIXED HOURS COST AMOUNT PRICE COST COST _____________________________________________________________________________________________________________________________________________ ------------dollars----------- dollars -------dollars-------- Fertilizer spreader 32' 2WD 130 0.052 1.00 Oct 0.59 0.61 0.22 0.40 0.067 0.43 2.27 Lime SE 1t/5yr+appl ton 2.2000 5.80 12.76 12.76 Disk, light cut 25' MFWD 170 0.086 1.00 Oct 1.26 1.29 0.43 1.02 0.111 0.71 4.73 Field cultivator 20.5' MFWD190 0.068 1.00 Oct 1.18 1.28 0.16 0.35 0.088 0.56 3.56 Grain drill 20' 2WD 130 0.118 1.00 Oct 1.35 1.40 0.82 1.68 0.283 1.81 7.07 Wheat seed - public lb 150.0000 0.13 19.50 19.50 Ditcher, rear mount 3' 2WD 130 1.618 0.04 Oct 0.74 0.76 0.51 0.87 0.084 0.53 3.44 Fertilizer spreader 32' 2WD 130 0.052 1.00 Feb 0.59 0.61 0.22 0.40 0.067 0.43 2.27 Urea 46-0-0 lb 200.0000 0.08 17.00 17.00 21-0-0-24 lbs 50.0000 0.08 4.10 4.10 Combine Wheat 25' 0.182 1.00 Jun 5.29 12.56 0.227 1.45 19.31 Custom haul bu 61.8000 0.15 9.27 9.27 ------- ------- ------- ------- ------ ------- ------- ------- TOTALS 5.73 5.98 7.69 17.32 0.930 5.95 62.63 105.31 INTEREST ON OPERATING CAPITAL 2.64 UNALLOCATED LABOR 0.00 TOTAL SPECIFIED COST 107.96 _____________________________________________________________________________________________________________________________________________
42

43
Table 12.F Estimated costs per WRVP - 2003, Yell County Sabbe _______________________________________________________________________ ITEM UNIT PRICE QUANTITY AMOUNT YOUR FARM _______________________________________________________________________ dollars dollars DIRECT EXPENSES CROP SEED Wheat seed - public lb 0.13 150.0000 19.50 _________ CUSTOM WORK Custom haul bu 0.15 61.8000 9.27 _________ FERTILIZER & LIME Lime SE 1t/5yr+appl ton 5.80 2.2000 12.76 _________ Urea 46-0-0 lb 0.08 200.0000 17.00 _________ 21-0-0-24 lbs 0.08 50.0000 4.10 _________ OPERATOR LABOR Implements hour 6.40 0.2179 1.39 _________ Tractors hour 6.40 0.4847 3.10 _________ Self-Propelled Eq. hour 6.40 0.2275 1.45 _________ DIESEL FUEL Tractors gal 0.85 3.6685 3.11 _________ Self-Propelled Eq. gal 0.85 1.8746 1.59 _________ REPAIR & MAINTENANCE Implements 2.39 1.0000 2.39 _________ Tractors 2.61 1.0000 2.61 _________ Self-Propelled Eq. 3.70 1.0000 3.70 _________ INTEREST ON OP. CAP. 2.64 1.0000 2.64 _________ -------- TOTAL DIRECT EXPENSES 84.65 _________ FIXED EXPENSES Implements 4.75 1.0000 4.75 _________ Tractors 5.98 1.0000 5.98 _________ Self-Propelled Eq. 12.56 1.0000 12.56 _________ -------- TOTAL FIXED EXPENSES 23.31 _________ -------- TOTAL SPECIFIED EXPENSES 107.96 _________ _______________________________________________________________________