Embed Size (px)
Citation preview
i
Freeway Volume-Crash SummaryTwin Cities Metropolitan Area
Continuation Report2002 Data
Minnesota Department of TransportationOffice of Traffic, Security and OperationsFreeway Operations SectionRegional Transportation Management Center
March 2004
ii
TABLE OF CONTENTS
FREEWAY CRASH SUMMARY ..………………………………………………………… …… ….….1
Purpose and Need ....... ………………………………...…………………………………………… 1
Study Methodology................................................................................................................. 3
Segment Definition ................................................................................................................... 4
Study Corridors ........................................................................................................................ 5
Summary of Results ................................................................................................................. 6
Summary of Crash Data—Twin Cities Metro Area Freeways .................................................. 7
2002 Metro Freeway Map – Peak Period Crashes .................................................................. 9
SELECTED INTERSTATES AND STATE ROADS
How to Read This Section .......................................................................................................... 11
Interstate 35E ..........................................................................................................................................12
Interstate 35W ..........................................................................................................................................14
Interstate 94 ........................................................................................................................... .16
Interstate 494 ..........................................................................................................................................18
Interstate 694 ..........................................................................................................................................20
Interstate 394 ..........................................................................................................................................22
US 169 ..........................................................................................................................................24
Minnesota 36 ..........................................................................................................................................26
Minnesota 62 ..........................................................................................................................................28
Minnesota 77 ..........................................................................................................................................30
Minnesota 100 .........................................................................................................................................32
Other Roads: MN 280, MN 5, MN 610, US 10, US 212, and US 52........................................... 34
APPENDIX A: 2002 AM Congestion Map................................................................................... 35
APPENDIX B: 2002 PM Congestion Map................................................................................... 36
1
Freeway Volume-Crash Summary
Twin Cities Metropolitan Area_____________________________________________________________________Purpose and NeedThe purpose of this report is to identify segments on the metro area freeway system that experiencehigh numbers of crashes. This information is then used for:
• identification of locations that experience higher crash rates due to recurringcongestion.
• project planning• resource allocation (Traffic Management Systems, FIRST routes, incident
management, etc.)
This report is typically published on an annual basis. Data within this report represents 2002 peakperiods and 24-hour volume levels, crashes, and crash rates for each freeway segment.
_____________________________________________________________________
IntroductionThis report is a summary of the metro area freeway system’s crash data and volume data in 2002. The report has been developed by the Traffic Management Center since 1975 and was primarilyused by TMC personnel to help establish priorities for future traffic management systems. This yearthe report has been reformatted to help broaden the audience of the report. Graphicalrepresentations of the data where added to make the report more user friendly and to show theconnection between congestion and freeway crashes.
Congestion and Freeway CrashesFreeway congestion and freeway crashes are related. Freeway congestion can be defined as eitherrecurring congestion or incident related congestion. Recurring congestion is congestion that occursat the same location on a daily basis due to some type of roadway characteristic that affects trafficflow such as a major interchange, lane drop, or weaving traffic. Incident related congestion can becaused by a crash, a stalled vehicle, debris on the roadway, adverse weather, or a special event. According to the FHWA, incident congestion accounts for up to 50% of the total congestion.
2
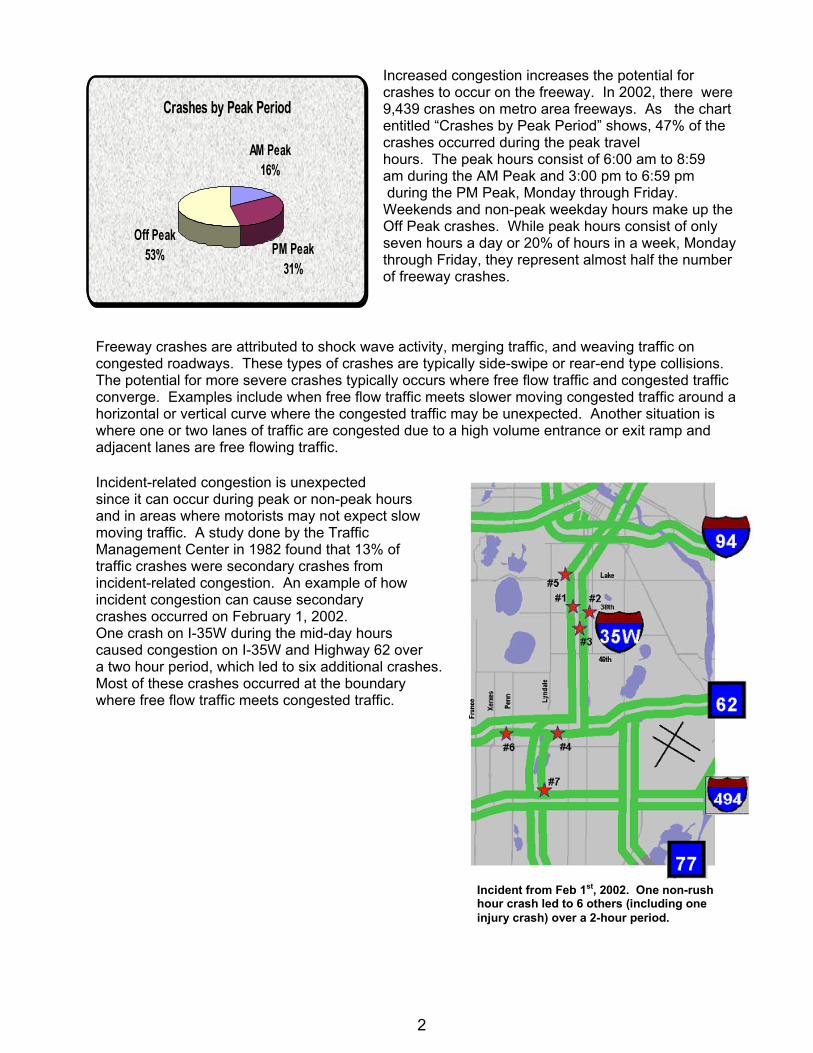
Increased congestion increases the potential forcrashes to occur on the freeway. In 2002, there were9,439 crashes on metro area freeways. As the chartentitled “Crashes by Peak Period” shows, 47% of thecrashes occurred during the peak travelhours. The peak hours consist of 6:00 am to 8:59am during the AM Peak and 3:00 pm to 6:59 pm during the PM Peak, Monday through Friday. Weekends and non-peak weekday hours make up theOff Peak crashes. While peak hours consist of onlyseven hours a day or 20% of hours in a week, Mondaythrough Friday, they represent almost half the numberof freeway crashes.
Freeway crashes are attributed to shock wave activity, merging traffic, and weaving traffic oncongested roadways. These types of crashes are typically side-swipe or rear-end type collisions. The potential for more severe crashes typically occurs where free flow traffic and congested trafficconverge. Examples include when free flow traffic meets slower moving congested traffic around ahorizontal or vertical curve where the congested traffic may be unexpected. Another situation iswhere one or two lanes of traffic are congested due to a high volume entrance or exit ramp andadjacent lanes are free flowing traffic.
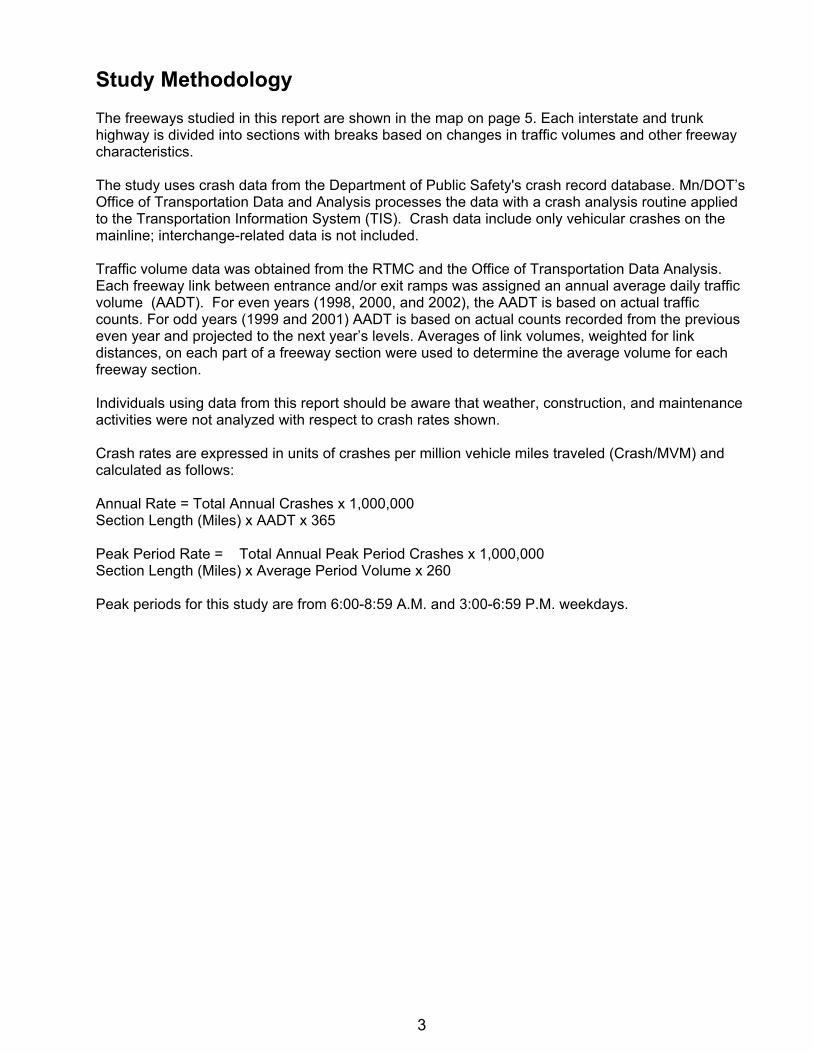
Incident-related congestion is unexpectedsince it can occur during peak or non-peak hoursand in areas where motorists may not expect slowmoving traffic. A study done by the TrafficManagement Center in 1982 found that 13% oftraffic crashes were secondary crashes fromincident-related congestion. An example of howincident congestion can cause secondarycrashes occurred on February 1, 2002. One crash on I-35W during the mid-day hourscaused congestion on I-35W and Highway 62 overa two hour period, which led to six additional crashes. Most of these crashes occurred at the boundarywhere free flow traffic meets congested traffic.
Crashes by Peak Period
AM Peak16%
Off Peak53% PM Peak
31%
Incident from Feb 1st, 2002. One non-rushhour crash led to 6 others (including one injury crash) over a 2-hour period.
3
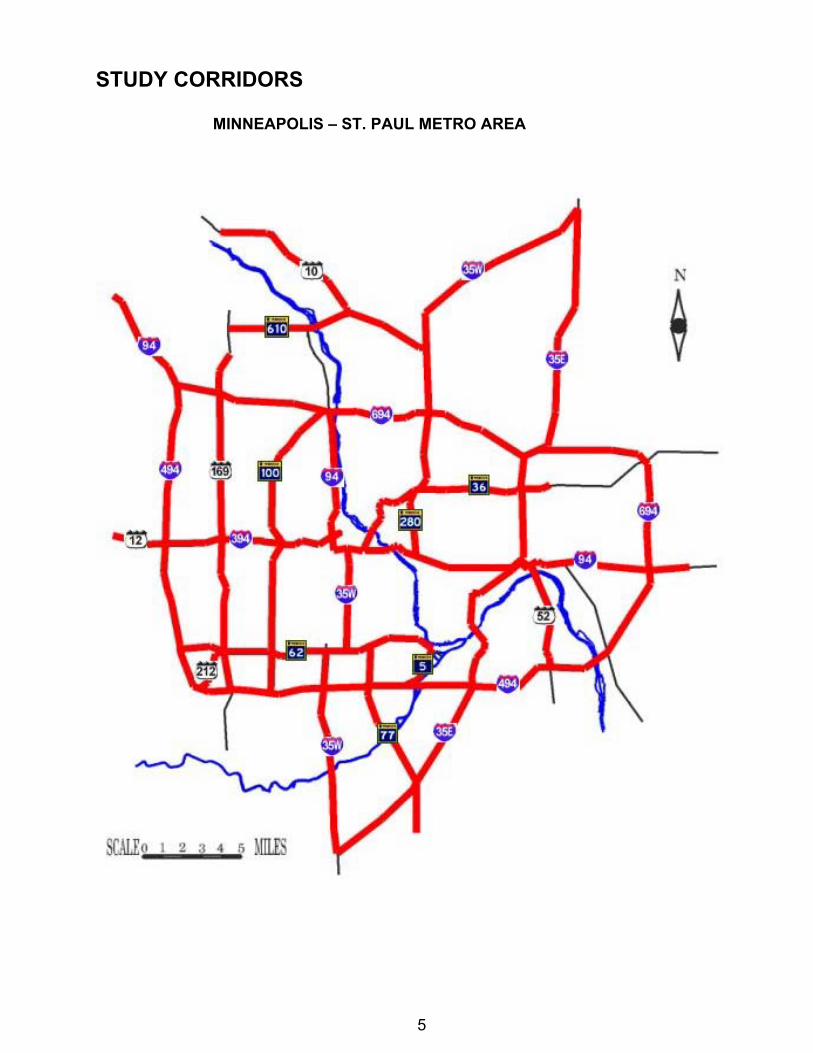
Study MethodologyThe freeways studied in this report are shown in the map on page 5. Each interstate and trunkhighway is divided into sections with breaks based on changes in traffic volumes and other freewaycharacteristics.
The study uses crash data from the Department of Public Safety's crash record database. Mn/DOT’sOffice of Transportation Data and Analysis processes the data with a crash analysis routine appliedto the Transportation Information System (TIS). Crash data include only vehicular crashes on themainline; interchange-related data is not included.
Traffic volume data was obtained from the RTMC and the Office of Transportation Data Analysis.Each freeway link between entrance and/or exit ramps was assigned an annual average daily trafficvolume (AADT). For even years (1998, 2000, and 2002), the AADT is based on actual trafficcounts. For odd years (1999 and 2001) AADT is based on actual counts recorded from the previouseven year and projected to the next year’s levels. Averages of link volumes, weighted for linkdistances, on each part of a freeway section were used to determine the average volume for eachfreeway section.
Individuals using data from this report should be aware that weather, construction, and maintenanceactivities were not analyzed with respect to crash rates shown.
Crash rates are expressed in units of crashes per million vehicle miles traveled (Crash/MVM) andcalculated as follows:
Annual Rate = Total Annual Crashes x 1,000,000Section Length (Miles) x AADT x 365
Peak Period Rate = Total Annual Peak Period Crashes x 1,000,000Section Length (Miles) x Average Period Volume x 260
Peak periods for this study are from 6:00-8:59 A.M. and 3:00-6:59 P.M. weekdays.
4
Segment Definition
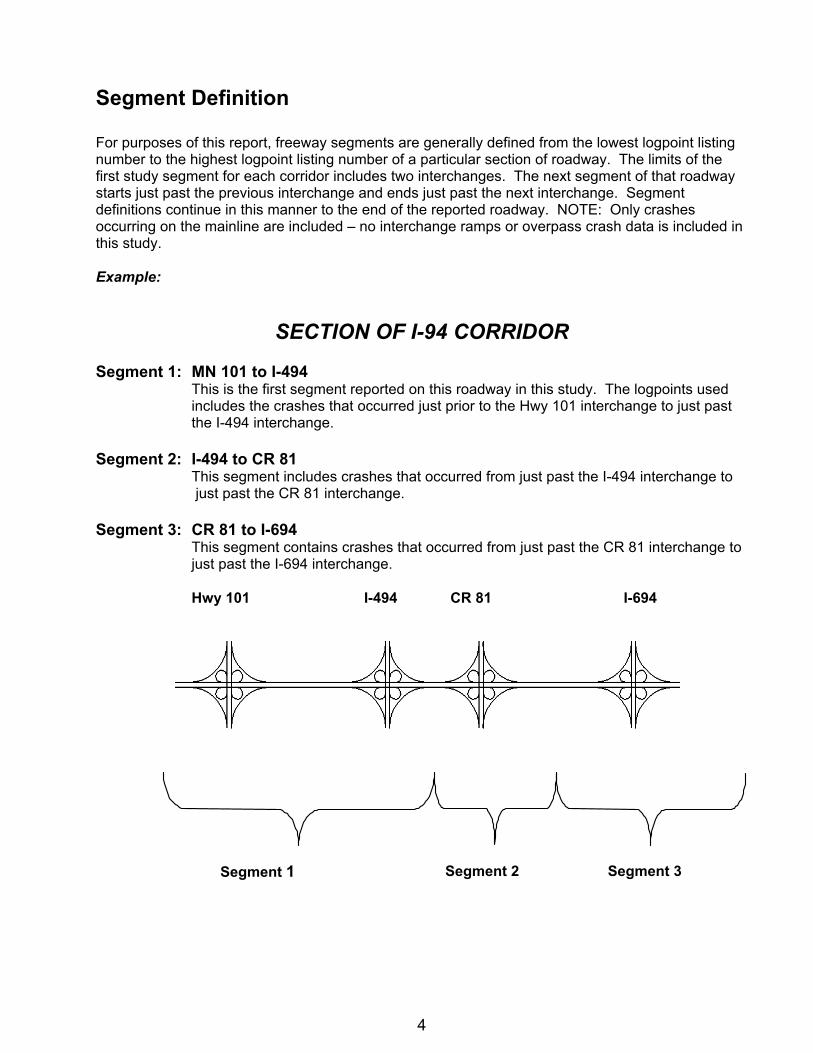
For purposes of this report, freeway segments are generally defined from the lowest logpoint listingnumber to the highest logpoint listing number of a particular section of roadway. The limits of thefirst study segment for each corridor includes two interchanges. The next segment of that roadwaystarts just past the previous interchange and ends just past the next interchange. Segmentdefinitions continue in this manner to the end of the reported roadway. NOTE: Only crashesoccurring on the mainline are included – no interchange ramps or overpass crash data is included inthis study.
Example:
SECTION OF I-94 CORRIDOR
Segment 1: MN 101 to I-494This is the first segment reported on this roadway in this study. The logpoints usedincludes the crashes that occurred just prior to the Hwy 101 interchange to just pastthe I-494 interchange.
Segment 2: I-494 to CR 81This segment includes crashes that occurred from just past the I-494 interchange to just past the CR 81 interchange.
Segment 3: CR 81 to I-694This segment contains crashes that occurred from just past the CR 81 interchange tojust past the I-694 interchange.
Hwy 101 I-494 CR 81 I-694
Segment 3Segment 2Segment 1
5
STUDY CORRIDORS
MINNEAPOLIS – ST. PAUL METRO AREA
6
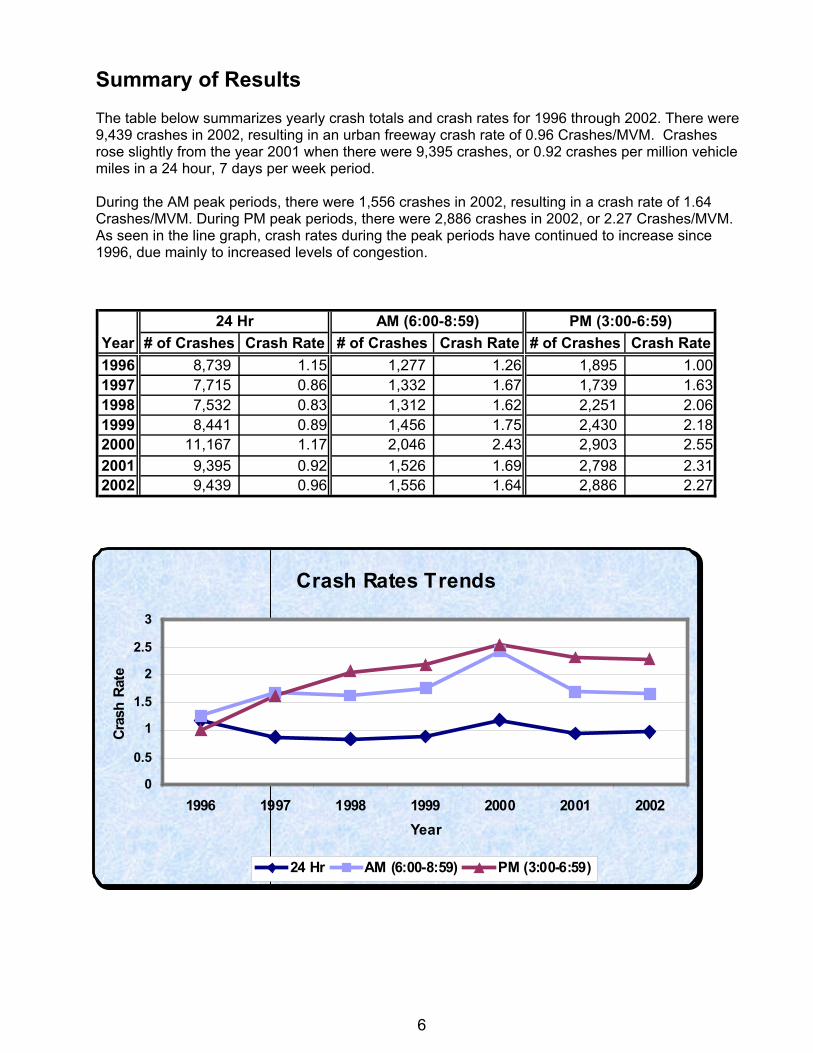
Summary of ResultsThe table below summarizes yearly crash totals and crash rates for 1996 through 2002. There were9,439 crashes in 2002, resulting in an urban freeway crash rate of 0.96 Crashes/MVM. Crashesrose slightly from the year 2001 when there were 9,395 crashes, or 0.92 crashes per million vehiclemiles in a 24 hour, 7 days per week period.
During the AM peak periods, there were 1,556 crashes in 2002, resulting in a crash rate of 1.64Crashes/MVM. During PM peak periods, there were 2,886 crashes in 2002, or 2.27 Crashes/MVM.As seen in the line graph, crash rates during the peak periods have continued to increase since1996, due mainly to increased levels of congestion.
Year # of Crashes Crash Rate # of Crashes Crash Rate # of Crashes Crash Rate1996 8,739 1.15 1,277 1.26 1,895 1.001997 7,715 0.86 1,332 1.67 1,739 1.631998 7,532 0.83 1,312 1.62 2,251 2.061999 8,441 0.89 1,456 1.75 2,430 2.182000 11,167 1.17 2,046 2.43 2,903 2.552001 9,395 0.92 1,526 1.69 2,798 2.312002 9,439 0.96 1,556 1.64 2,886 2.27
24 Hr AM (6:00-8:59) PM (3:00-6:59)
Crash Rates Trends
0
0.5
1
1.5
2
2.5
3
1996 1997 1998 1999 2000 2001 2002Year
Cras
h Ra
te
24 Hr AM (6:00-8:59) PM (3:00-6:59)
7
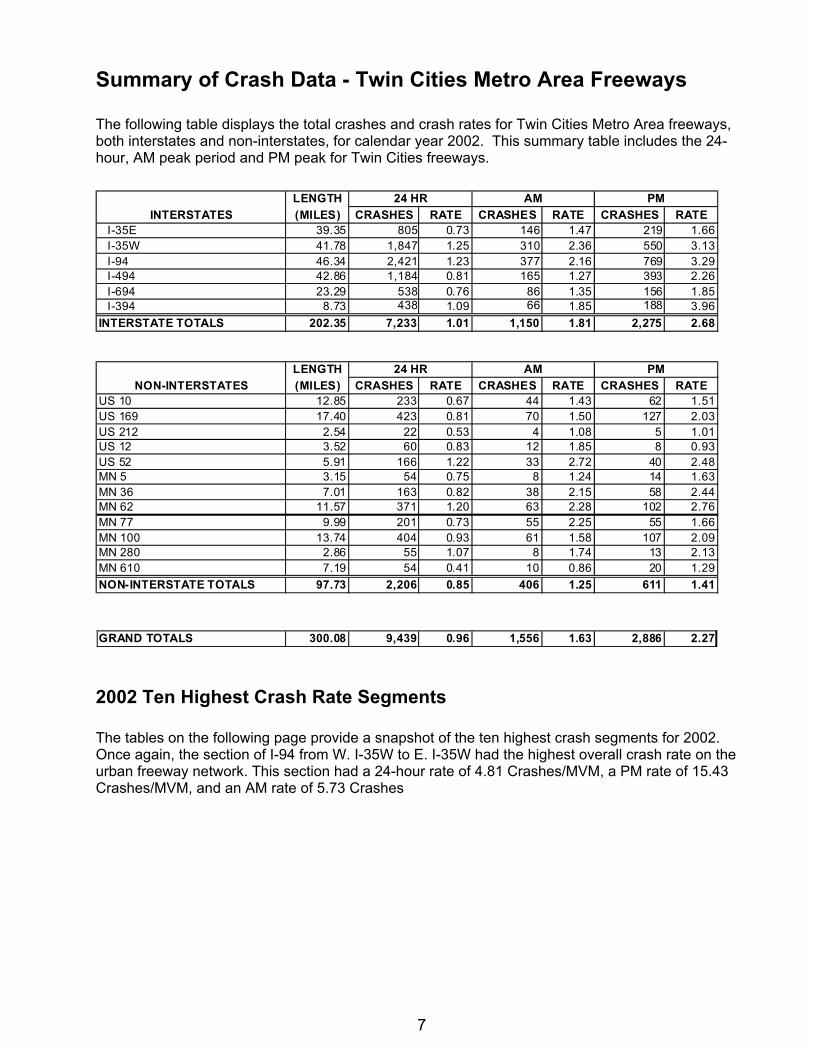
Summary of Crash Data - Twin Cities Metro Area Freeways
The following table displays the total crashes and crash rates for Twin Cities Metro Area freeways,both interstates and non-interstates, for calendar year 2002. This summary table includes the 24-hour, AM peak period and PM peak for Twin Cities freeways.
2002 Ten Highest Crash Rate Segments
The tables on the following page provide a snapshot of the ten highest crash segments for 2002.Once again, the section of I-94 from W. I-35W to E. I-35W had the highest overall crash rate on theurban freeway network. This section had a 24-hour rate of 4.81 Crashes/MVM, a PM rate of 15.43Crashes/MVM, and an AM rate of 5.73 Crashes
LENGTHINTERSTATES (MILES) CRASHES RATE CRASHES RATE CRASHES RATE
I-35E 39.35 805 0.73 146 1.47 219 1.66I-35W 41.78 1,847 1.25 310 2.36 550 3.13I-94 46.34 2,421 1.23 377 2.16 769 3.29I-494 42.86 1,184 0.81 165 1.27 393 2.26I-694 23.29 538 0.76 86 1.35 156 1.85I-394 8.73 438 1.09 66 1.85 188 3.96
INTERSTATE TOTALS 202.35 7,233 1.01 1,150 1.81 2,275 2.68
24 HR AM PM
LENGTHNON-INTERSTATES (MILES) CRASHES RATE CRASHES RATE CRASHES RATE
US 10 12.85 233 0.67 44 1.43 62 1.51US 169 17.40 423 0.81 70 1.50 127 2.03US 212 2.54 22 0.53 4 1.08 5 1.01US 12 3.52 60 0.83 12 1.85 8 0.93US 52 5.91 166 1.22 33 2.72 40 2.48MN 5 3.15 54 0.75 8 1.24 14 1.63MN 36 7.01 163 0.82 38 2.15 58 2.44MN 62 11.57 371 1.20 63 2.28 102 2.76MN 77 9.99 201 0.73 55 2.25 55 1.66MN 100 13.74 404 0.93 61 1.58 107 2.09MN 280 2.86 55 1.07 8 1.74 13 2.13MN 610 7.19 54 0.41 10 0.86 20 1.29NON-INTERSTATE TOTALS 97.73 2,206 0.85 406 1.25 611 1.41
24 HR AM PM
GRAND TOTALS 300.08 9,439 0.96 1,556 1.63 2,886 2.27
8
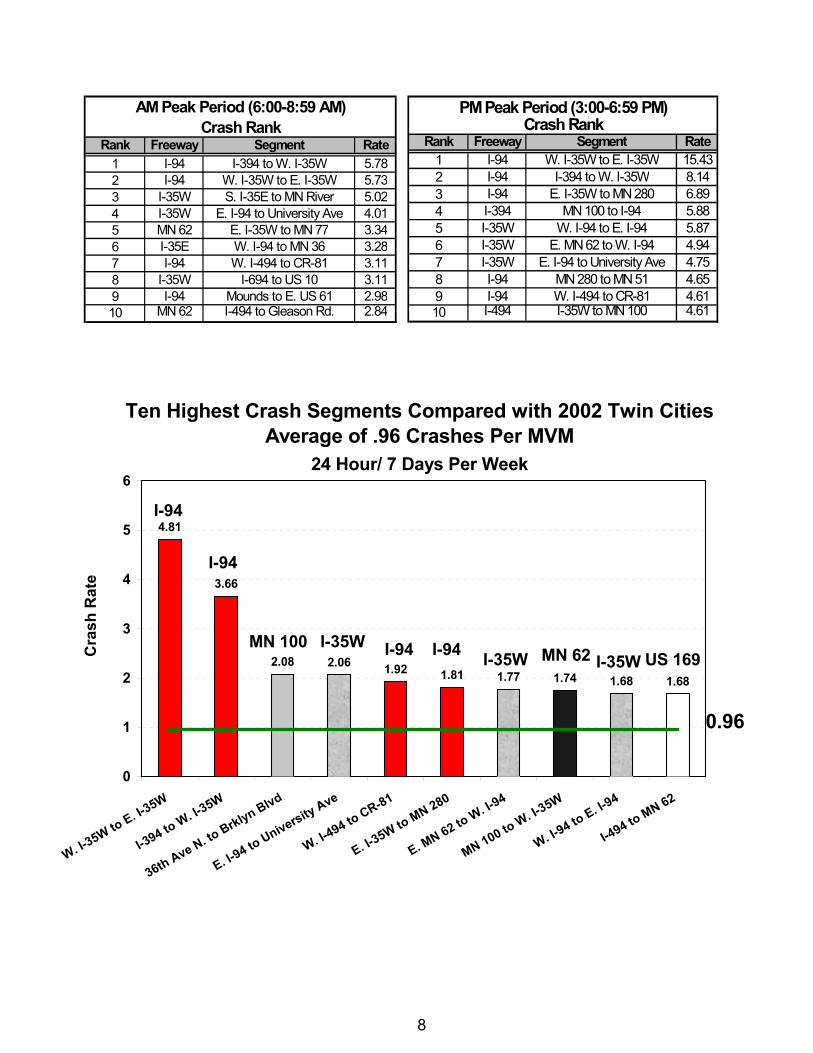
Rank Freeway Segment Rate1 I-94 I-394 to W. I-35W 5.782 I-94 W. I-35W to E. I-35W 5.733 I-35W S. I-35E to MN River 5.024 I-35W E. I-94 to University Ave 4.015 MN 62 E. I-35W to MN 77 3.346 I-35E W. I-94 to MN 36 3.287 I-94 W. I-494 to CR-81 3.118 I-35W I-694 to US 10 3.119 I-94 Mounds to E. US 61 2.9810 MN 62 I-494 to Gleason Rd. 2.84
AM Peak Period (6:00-8:59 AM)Crash Rank
Rank Freeway Segment Rate1 I-94 W. I-35W to E. I-35W 15.432 I-94 I-394 to W. I-35W 8.143 I-94 E. I-35W to MN 280 6.894 I-394 MN 100 to I-94 5.885 I-35W W. I-94 to E. I-94 5.876 I-35W E. MN 62 to W. I-94 4.947 I-35W E. I-94 to University Ave 4.758 I-94 MN 280 to MN 51 4.659 I-94 W. I-494 to CR-81 4.6110 I-494 I-35W to MN 100 4.61
PM Peak Period (3:00-6:59 PM)Crash Rank
Ten Highest Crash Segments Compared with 2002 Twin Cities Average of .96 Crashes Per MVM
24 Hour/ 7 Days Per Week
4.81
3.66
1.681.681.741.771.811.922.062.08
0
1
2
3
4
5
6
W. I-35W to E. I-3
5W
I-394 to W. I-35W
36th Ave N. to Brklyn Blvd
E. I-94 to University Ave
W. I-494 to CR-81
E. I-35W to MN 280
E. MN 62 to W. I-94
MN 100 to W. I-35W
W. I-94 to E. I-9
4
I-494 to MN 62
Cra
sh R
ate
0.96
I-94
I-94
I-94
I-94MN 100 I-35WI-35W I-35W US 169MN 62
9
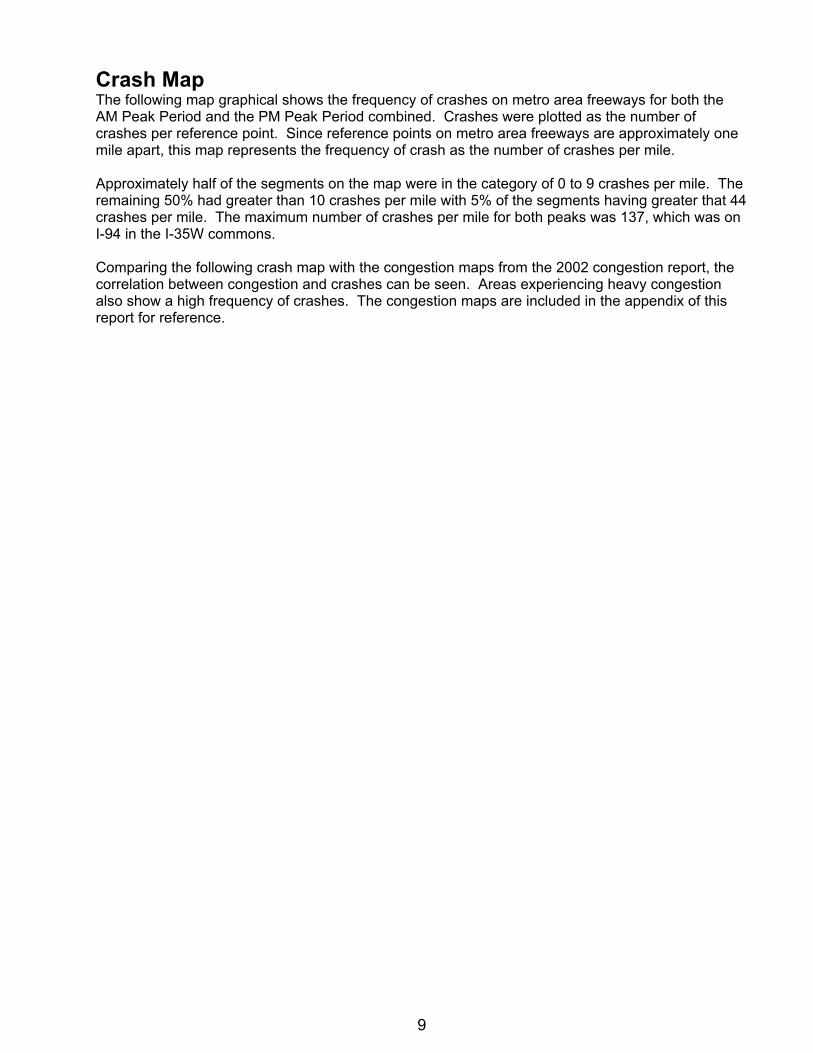
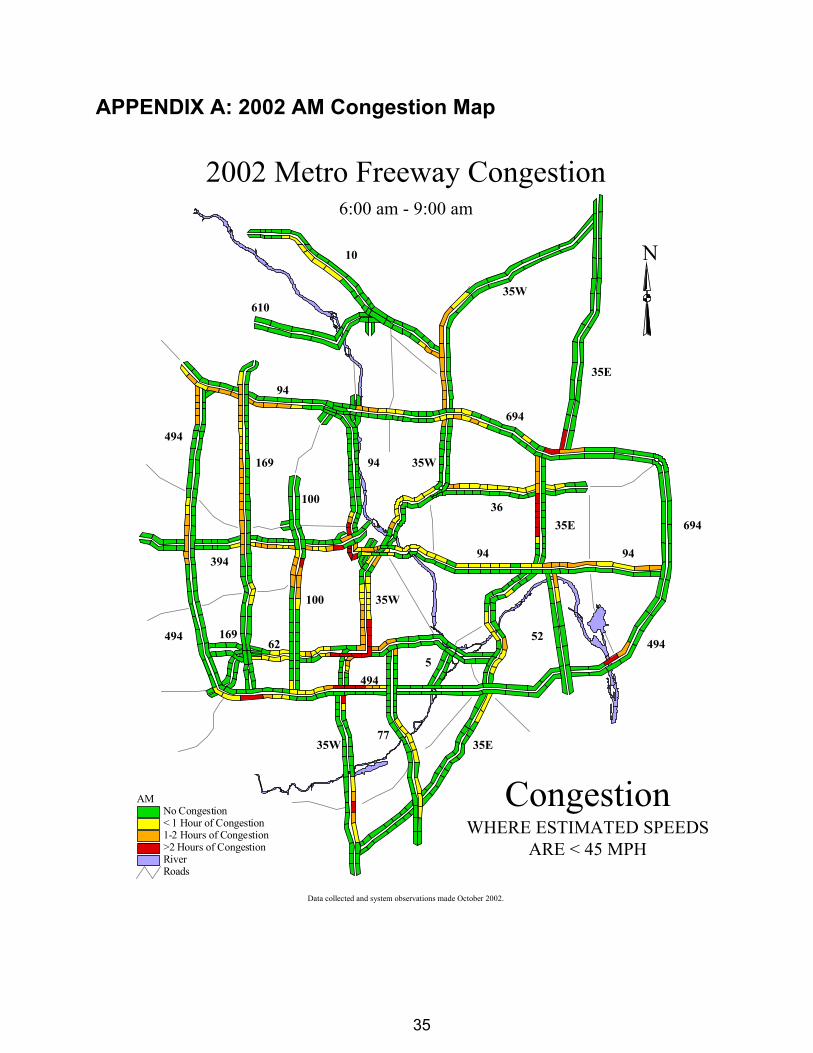
Crash MapThe following map graphical shows the frequency of crashes on metro area freeways for both theAM Peak Period and the PM Peak Period combined. Crashes were plotted as the number ofcrashes per reference point. Since reference points on metro area freeways are approximately onemile apart, this map represents the frequency of crash as the number of crashes per mile.
Approximately half of the segments on the map were in the category of 0 to 9 crashes per mile. Theremaining 50% had greater than 10 crashes per mile with 5% of the segments having greater that 44crashes per mile. The maximum number of crashes per mile for both peaks was 137, which was onI-94 in the I-35W commons.
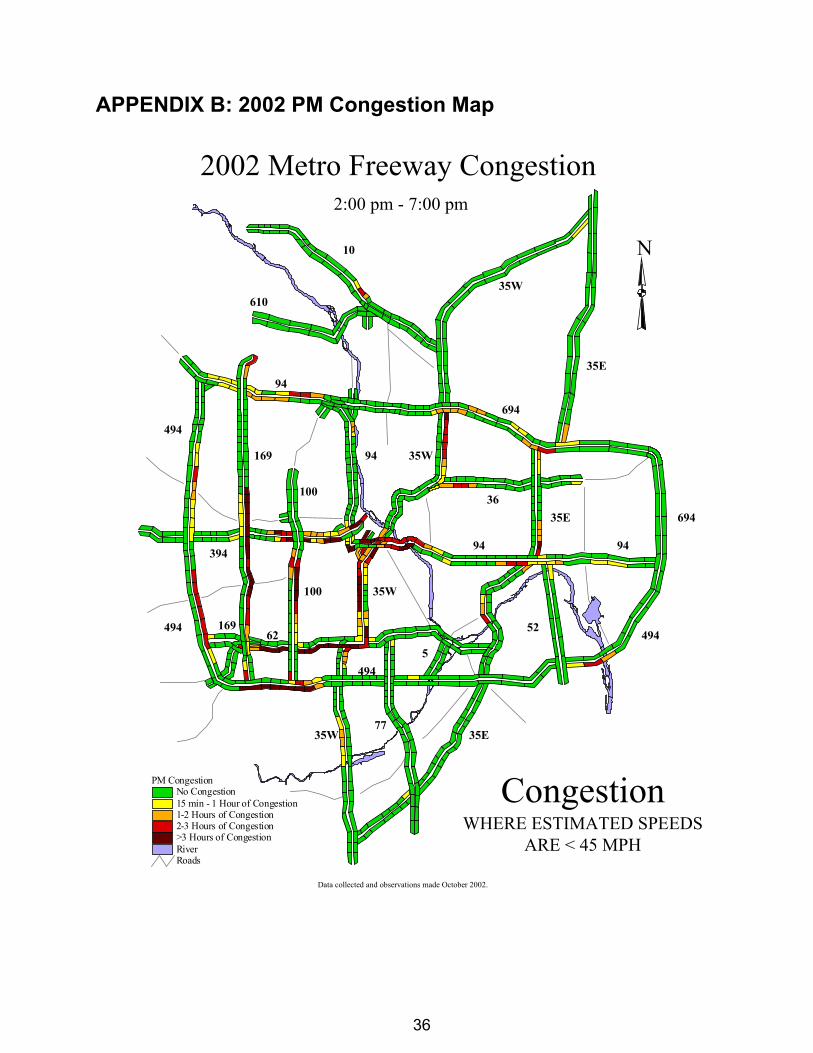
Comparing the following crash map with the congestion maps from the 2002 congestion report, thecorrelation between congestion and crashes can be seen. Areas experiencing heavy congestionalso show a high frequency of crashes. The congestion maps are included in the appendix of thisreport for reference.
10
11
SELECTED INTERSTATE AND STATE ROADS
How To Read This Section
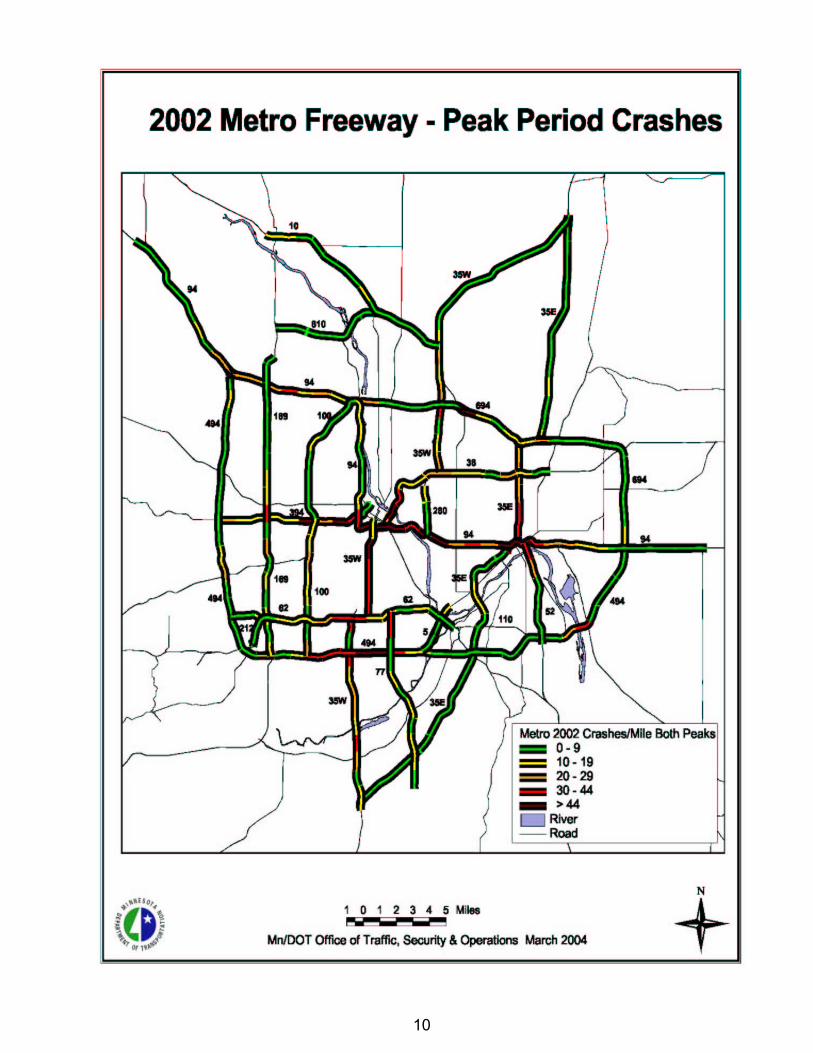
The following pages provide more detailed information on selected metro area freeways. The firstpage for each metro area freeway has a bar graph that shows the trends in crash rates from 1996 to2002. Each grouping of bars in the graph represents a specific segment of that freeway. Individualbars within the grouping then represent the crash rate for a given year. The table below the barchart represents 2002 volume and crash data for that freeway.
The second page for each freeway contains two bar charts that show the number of crashes perreference point during the AM and PM peak periods. Reference points on metro area freeways areabout one mile in length. The purpose of these charts is to show locations where there are a highnumber of crashes. These locations are typically at major interchanges, bottlenecks, and areaexperiencing high levels of congestion.
Table summarizing2002 volume andcrash data for eachfreeway segment.
Bar chart showingtrends in crashrates for eachsegment.
Number ofcrashes per yearby reference
12
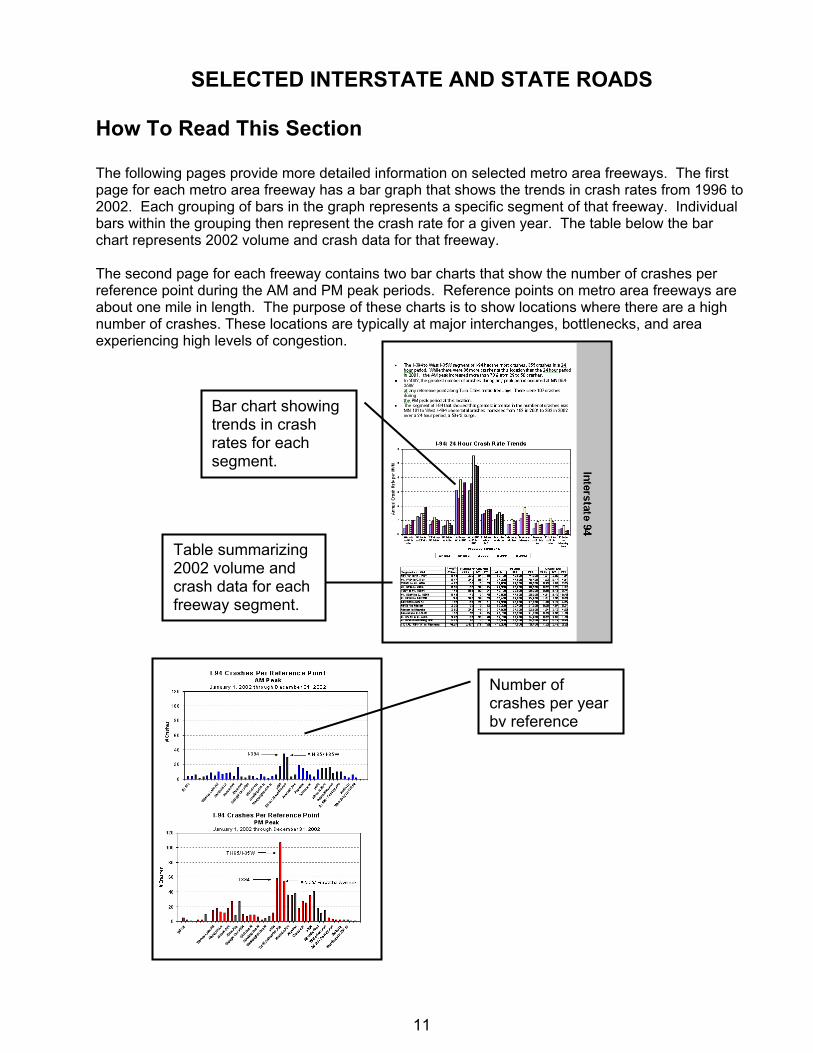
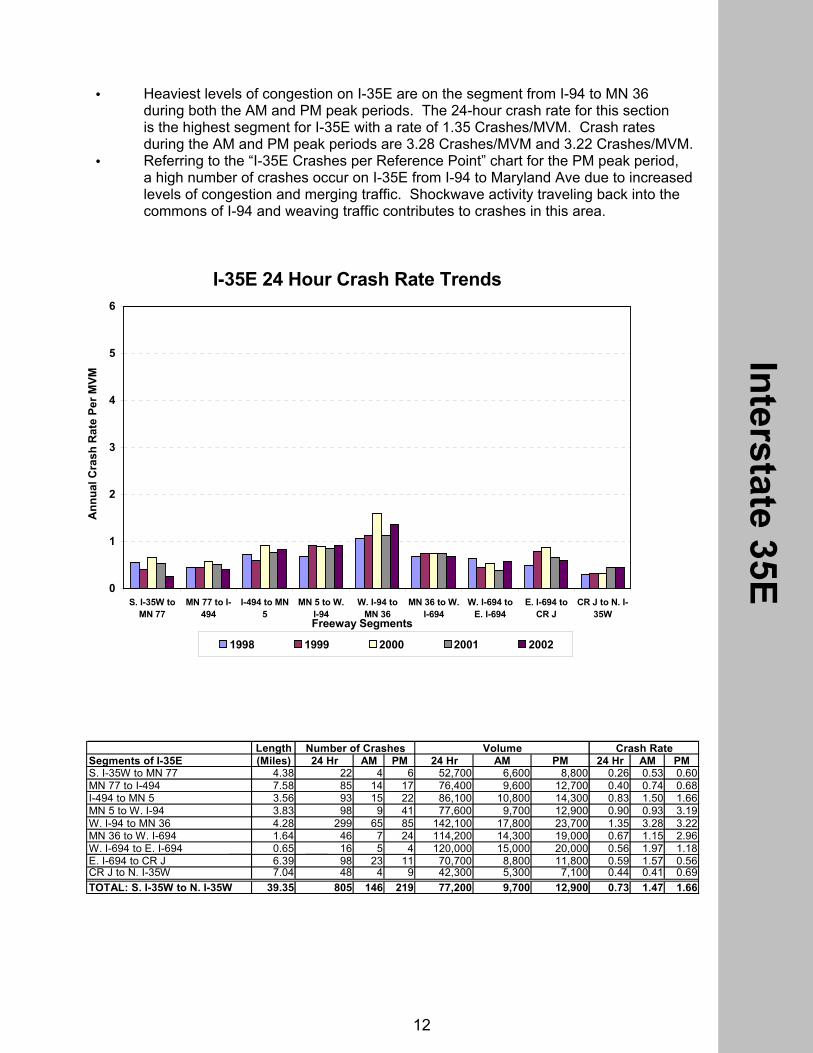
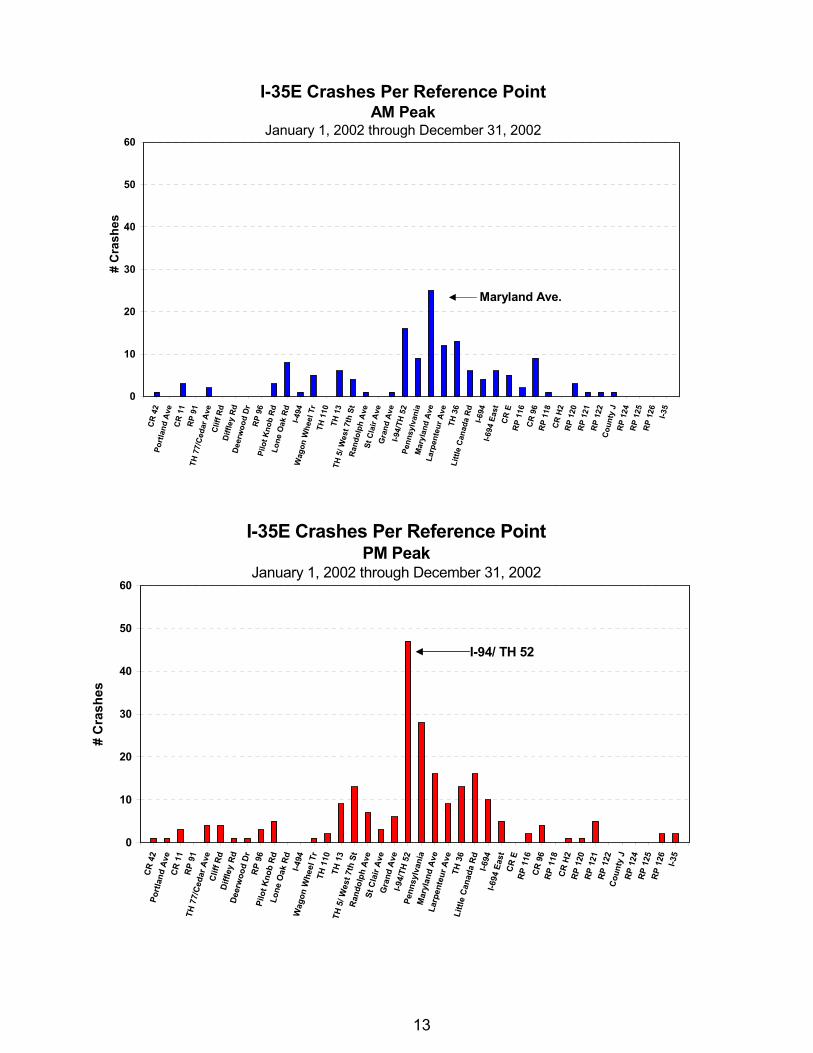
• Heaviest levels of congestion on I-35E are on the segment from I-94 to MN 36during both the AM and PM peak periods. The 24-hour crash rate for this sectionis the highest segment for I-35E with a rate of 1.35 Crashes/MVM. Crash ratesduring the AM and PM peak periods are 3.28 Crashes/MVM and 3.22 Crashes/MVM.
• Referring to the “I-35E Crashes per Reference Point” chart for the PM peak period,a high number of crashes occur on I-35E from I-94 to Maryland Ave due to increasedlevels of congestion and merging traffic. Shockwave activity traveling back into thecommons of I-94 and weaving traffic contributes to crashes in this area.
I-35E 24 Hour Crash Rate Trends
0
1
2
3
4
5
6
S. I-35W toMN 77
MN 77 to I-494
I-494 to MN5
MN 5 to W.I-94
W. I-94 toMN 36
MN 36 to W.I-694
W. I-694 toE. I-694
E. I-694 toCR J
CR J to N. I-35W
Freeway Segments
Ann
ual C
rash
Rat
e Pe
r MVM
1998 1999 2000 2001 2002
LengthSegments of I-35E (Miles) 24 Hr AM PM 24 Hr AM PM 24 Hr AM PMS. I-35W to MN 77 4.38 22 4 6 52,700 6,600 8,800 0.26 0.53 0.60MN 77 to I-494 7.58 85 14 17 76,400 9,600 12,700 0.40 0.74 0.68I-494 to MN 5 3.56 93 15 22 86,100 10,800 14,300 0.83 1.50 1.66MN 5 to W. I-94 3.83 98 9 41 77,600 9,700 12,900 0.90 0.93 3.19W. I-94 to MN 36 4.28 299 65 85 142,100 17,800 23,700 1.35 3.28 3.22MN 36 to W. I-694 1.64 46 7 24 114,200 14,300 19,000 0.67 1.15 2.96W. I-694 to E. I-694 0.65 16 5 4 120,000 15,000 20,000 0.56 1.97 1.18E. I-694 to CR J 6.39 98 23 11 70,700 8,800 11,800 0.59 1.57 0.56CR J to N. I-35W 7.04 48 4 9 42,300 5,300 7,100 0.44 0.41 0.69TOTAL: S. I-35W to N. I-35W 39.35 805 146 219 77,200 9,700 12,900 0.73 1.47 1.66
Number of Crashes Volume Crash Rate
Interstate 35E
13
I-35E Crashes Per Reference Point AM Peak
January 1, 2002 through December 31, 2002
0
10
20
30
40
50
60CR
42
Portl
and
Ave
CR 1
1RP
91
TH 7
7/Ce
dar A
veCl
iff R
dDi
ffley
Rd
Deer
woo
d Dr
RP 9
6Pi
lot K
nob
RdLo
ne O
ak R
dI-4
94W
agon
Whe
el T
rTH
110
TH 1
3TH
5/ W
est 7
th S
tRa
ndol
ph A
veSt
Cla
ir Av
eG
rand
Ave
I-94/
TH 5
2Pe
nnsy
lvan
iaM
aryl
and
Ave
Larp
ente
ur A
veTH
36
Littl
e Ca
nada
Rd
I-694
I-694
Eas
tCR
ERP
116
CR 9
6RP
118
CR H
2RP
120
RP 1
21RP
122
Coun
ty J
RP 1
24RP
125
RP 1
26 I-35
# C
rash
es
Maryland Ave.
I-35E Crashes Per Reference PointPM Peak
January 1, 2002 through December 31, 2002
0
10
20
30
40
50
60
CR 4
2Po
rtlan
d Av
eCR
11
RP 9
1TH
77/
Ceda
r Ave
Cliff
Rd
Diffl
ey R
dDe
erw
ood
DrRP
96
Pilo
t Kno
b Rd
Lone
Oak
Rd
I-494
Wag
on W
heel
Tr
TH 1
10TH
13
TH 5
/ Wes
t 7th
St
Rand
olph
Ave
St C
lair
Ave
Gra
nd A
veI-9
4/TH
52
Penn
sylv
ania
Mar
ylan
d Av
eLa
rpen
teur
Ave
TH 3
6 Li
ttle
Cana
da R
dI-6
94I-6
94 E
ast
CR E
RP 1
16CR
96
RP 1
18CR
H2
RP 1
20RP
121
RP 1
22Co
unty
JRP
124
RP 1
25RP
126 I-35
# C
rash
es
I-94/ TH 52
14
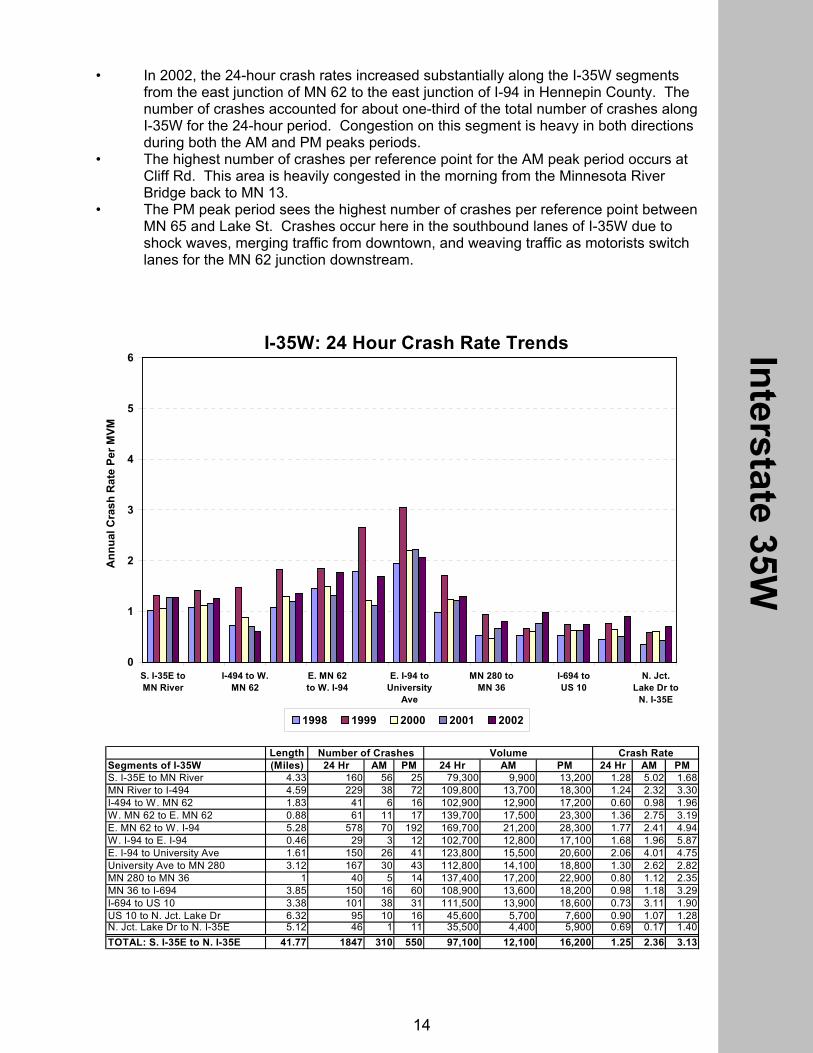
• In 2002, the 24-hour crash rates increased substantially along the I-35W segmentsfrom the east junction of MN 62 to the east junction of I-94 in Hennepin County. Thenumber of crashes accounted for about one-third of the total number of crashes alongI-35W for the 24-hour period. Congestion on this segment is heavy in both directionsduring both the AM and PM peaks periods.
• The highest number of crashes per reference point for the AM peak period occurs atCliff Rd. This area is heavily congested in the morning from the Minnesota RiverBridge back to MN 13.
• The PM peak period sees the highest number of crashes per reference point betweenMN 65 and Lake St. Crashes occur here in the southbound lanes of I-35W due toshock waves, merging traffic from downtown, and weaving traffic as motorists switchlanes for the MN 62 junction downstream.
I-35W: 24 Hour Crash Rate Trends
0
1
2
3
4
5
6
S. I-35E toMN River
I-494 to W.MN 62
E. MN 62to W. I-94
E. I-94 toUniversity
Ave
MN 280 toMN 36
I-694 toUS 10
N. Jct.Lake Dr to
N. I-35E
Ann
ual C
rash
Rat
e Pe
r MVM
1998 1999 2000 2001 2002
LengthSegments of I-35W (Miles) 24 Hr AM PM 24 Hr AM PM 24 Hr AM PMS. I-35E to MN River 4.33 160 56 25 79,300 9,900 13,200 1.28 5.02 1.68MN River to I-494 4.59 229 38 72 109,800 13,700 18,300 1.24 2.32 3.30I-494 to W. MN 62 1.83 41 6 16 102,900 12,900 17,200 0.60 0.98 1.96W. MN 62 to E. MN 62 0.88 61 11 17 139,700 17,500 23,300 1.36 2.75 3.19E. MN 62 to W. I-94 5.28 578 70 192 169,700 21,200 28,300 1.77 2.41 4.94W. I-94 to E. I-94 0.46 29 3 12 102,700 12,800 17,100 1.68 1.96 5.87E. I-94 to University Ave 1.61 150 26 41 123,800 15,500 20,600 2.06 4.01 4.75University Ave to MN 280 3.12 167 30 43 112,800 14,100 18,800 1.30 2.62 2.82MN 280 to MN 36 1 40 5 14 137,400 17,200 22,900 0.80 1.12 2.35MN 36 to I-694 3.85 150 16 60 108,900 13,600 18,200 0.98 1.18 3.29I-694 to US 10 3.38 101 38 31 111,500 13,900 18,600 0.73 3.11 1.90US 10 to N. Jct. Lake Dr 6.32 95 10 16 45,600 5,700 7,600 0.90 1.07 1.28N. Jct. Lake Dr to N. I-35E 5.12 46 1 11 35,500 4,400 5,900 0.69 0.17 1.40TOTAL: S. I-35E to N. I-35E 41.77 1847 310 550 97,100 12,100 16,200 1.25 2.36 3.13
Number of Crashes Volume Crash Rate
Interstate 35W
15
•
I-35W Crashes Per Reference PointAM Peak
January 1, 2002 through December 31, 2002
0
10
20
30
40
50
60
McA
ndre
ws
Dr
Cliff
Rd
106t
h St
86th
St
76th
St
Nico
llet A
ve
46th
St
Lake
St
TH 5
5 / H
iaw
atha
Ave
Henn
epin
Ave
In
dust
rial B
lvd
CR C
TH 9
6
CR I
Lexi
ngto
n Av
e
Coun
ty 1
4
RP 3
9
I-35
# C
rash
es
Cliff Road Diamond Lake Road
Mississippi River
I-35W Crashes Per Reference Point PM Peak
January 1, 2002 through December 31, 2002
0
10
20
30
40
50
60
McA
ndre
ws
Dr
Cliff
Rd
106t
h St
86th
St
76th
St
Nico
llet A
ve
46th
St
Lake
St
TH 5
5 / H
iaw
atha
Ave
Henn
epin
Ave
In
dust
rial B
lvd
CR C
TH 9
6
CR I
Lexi
ngto
n Av
e
Coun
ty 1
4
RP 3
9
I-35
# C
rash
es
Lake StreetFranklin Avenue
16
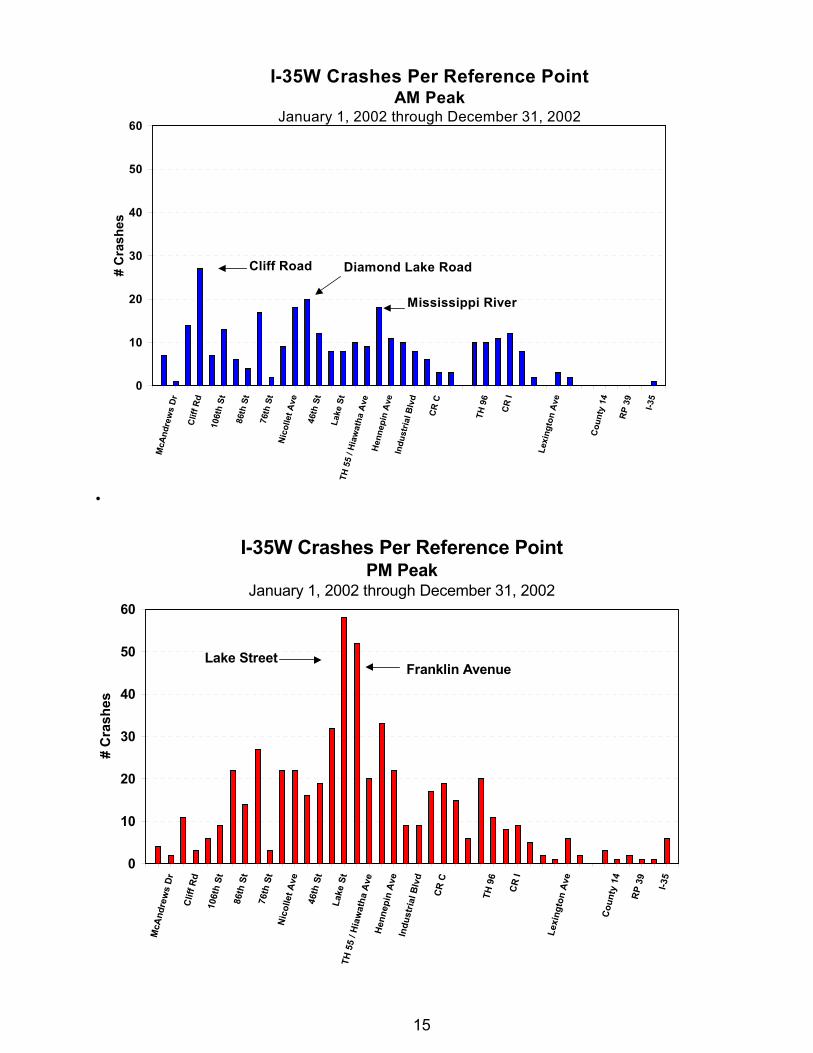
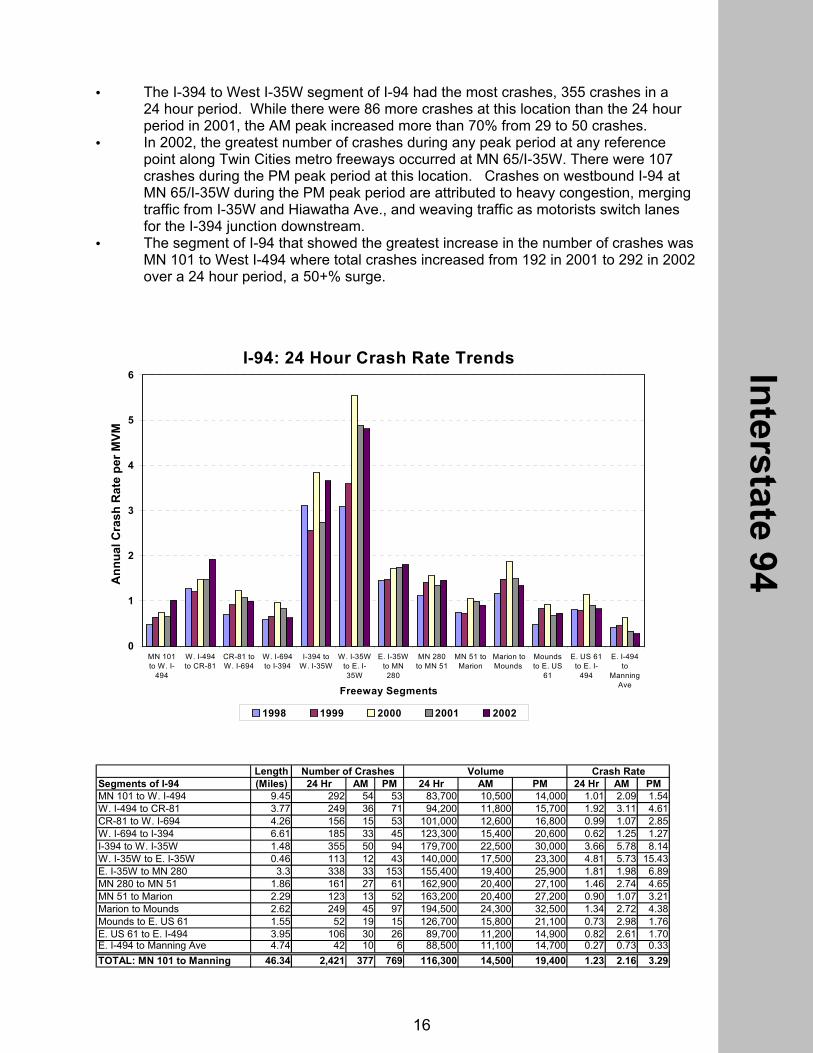
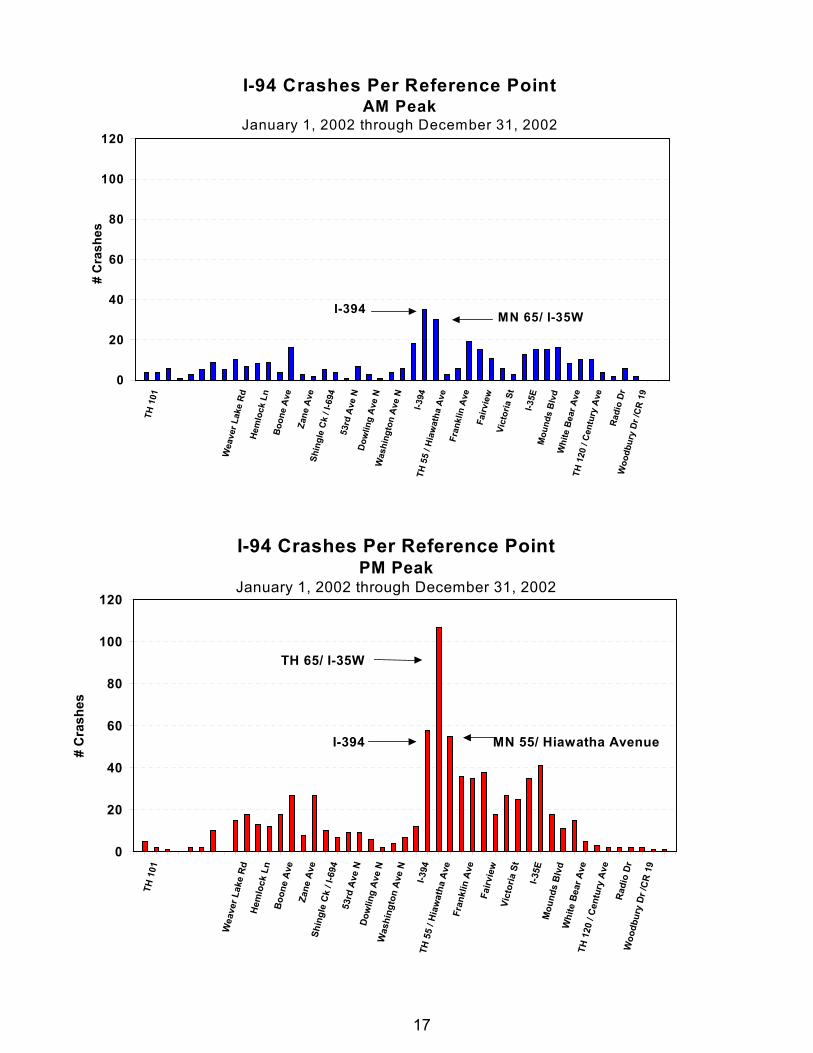
• The I-394 to West I-35W segment of I-94 had the most crashes, 355 crashes in a24 hour period. While there were 86 more crashes at this location than the 24 hourperiod in 2001, the AM peak increased more than 70% from 29 to 50 crashes.
• In 2002, the greatest number of crashes during any peak period at any referencepoint along Twin Cities metro freeways occurred at MN 65/I-35W. There were 107crashes during the PM peak period at this location. Crashes on westbound I-94 atMN 65/I-35W during the PM peak period are attributed to heavy congestion, mergingtraffic from I-35W and Hiawatha Ave., and weaving traffic as motorists switch lanesfor the I-394 junction downstream.
• The segment of I-94 that showed the greatest increase in the number of crashes wasMN 101 to West I-494 where total crashes increased from 192 in 2001 to 292 in 2002over a 24 hour period, a 50+% surge.
I-94: 24 Hour Crash Rate Trends
0
1
2
3
4
5
6
MN 101to W. I-
494
W. I-494to CR-81
CR-81 toW. I-694
W. I-694to I-394
I-394 toW. I-35W
W. I-35Wto E. I-35W
E. I-35Wto MN280
MN 280to MN 51
MN 51 toMarion
Marion toMounds
Moundsto E. US
61
E. US 61to E. I-
494
E. I-494to
ManningAveFreeway Segments
Ann
ual C
rash
Rat
e pe
r MVM
1998 1999 2000 2001 2002
LengthSegments of I-94 (Miles) 24 Hr AM PM 24 Hr AM PM 24 Hr AM PMMN 101 to W. I-494 9.45 292 54 53 83,700 10,500 14,000 1.01 2.09 1.54W. I-494 to CR-81 3.77 249 36 71 94,200 11,800 15,700 1.92 3.11 4.61CR-81 to W. I-694 4.26 156 15 53 101,000 12,600 16,800 0.99 1.07 2.85W. I-694 to I-394 6.61 185 33 45 123,300 15,400 20,600 0.62 1.25 1.27I-394 to W. I-35W 1.48 355 50 94 179,700 22,500 30,000 3.66 5.78 8.14W. I-35W to E. I-35W 0.46 113 12 43 140,000 17,500 23,300 4.81 5.73 15.43E. I-35W to MN 280 3.3 338 33 153 155,400 19,400 25,900 1.81 1.98 6.89MN 280 to MN 51 1.86 161 27 61 162,900 20,400 27,100 1.46 2.74 4.65MN 51 to Marion 2.29 123 13 52 163,200 20,400 27,200 0.90 1.07 3.21Marion to Mounds 2.62 249 45 97 194,500 24,300 32,500 1.34 2.72 4.38Mounds to E. US 61 1.55 52 19 15 126,700 15,800 21,100 0.73 2.98 1.76E. US 61 to E. I-494 3.95 106 30 26 89,700 11,200 14,900 0.82 2.61 1.70E. I-494 to Manning Ave 4.74 42 10 6 88,500 11,100 14,700 0.27 0.73 0.33TOTAL: MN 101 to Manning 46.34 2,421 377 769 116,300 14,500 19,400 1.23 2.16 3.29
Number of Crashes Volume Crash Rate
Interstate 94
17
I-94 Crashes Per Reference PointAM Peak
January 1, 2002 through December 31, 2002
0
20
40
60
80
100
120TH
101
Wea
ver L
ake
Rd
Hem
lock
Ln
Boon
e Av
eZa
ne A
veSh
ingl
e Ck
/ I-6
94
53rd
Ave
NDo
wlin
g Av
e N
Was
hing
ton
Ave
N
I-394
TH
55
/ Hia
wat
ha A
veFr
ankl
in A
veFa
irvie
wVi
ctor
ia S
t
I-35
EM
ound
s Bl
vdW
hite
Bea
r Ave
TH 1
20 /
Cent
ury
Ave
Radi
o Dr
Woo
dbur
y Dr
/CR
19
# C
rash
es
I-394 MN 65/ I-35W
I-94 Crashes Per Reference PointPM Peak
January 1, 2002 through December 31, 2002
0
20
40
60
80
100
120
TH 1
01
Wea
ver L
ake
Rd
Hem
lock
Ln
Boon
e Av
eZa
ne A
veSh
ingl
e Ck
/ I-6
94
53rd
Ave
NDo
wlin
g Av
e N
Was
hing
ton
Ave
N
I-394
TH
55
/ Hia
wat
ha A
veFr
ankl
in A
veFa
irvie
wVi
ctor
ia S
t
I-35
EM
ound
s Bl
vdW
hite
Bea
r Ave
TH 1
20 /
Cent
ury
Ave
Radi
o Dr
Woo
dbur
y Dr
/CR
19
# C
rash
es
TH 65/ I-35W
I-394 MN 55/ Hiawatha Avenue
18
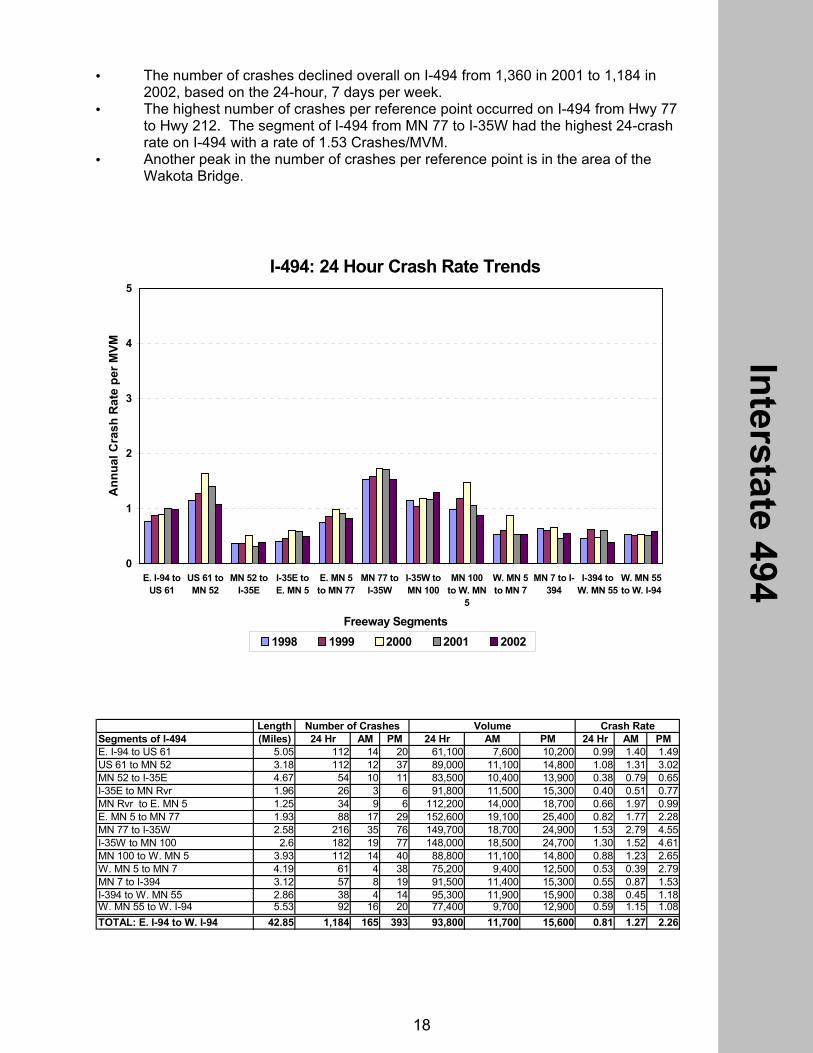
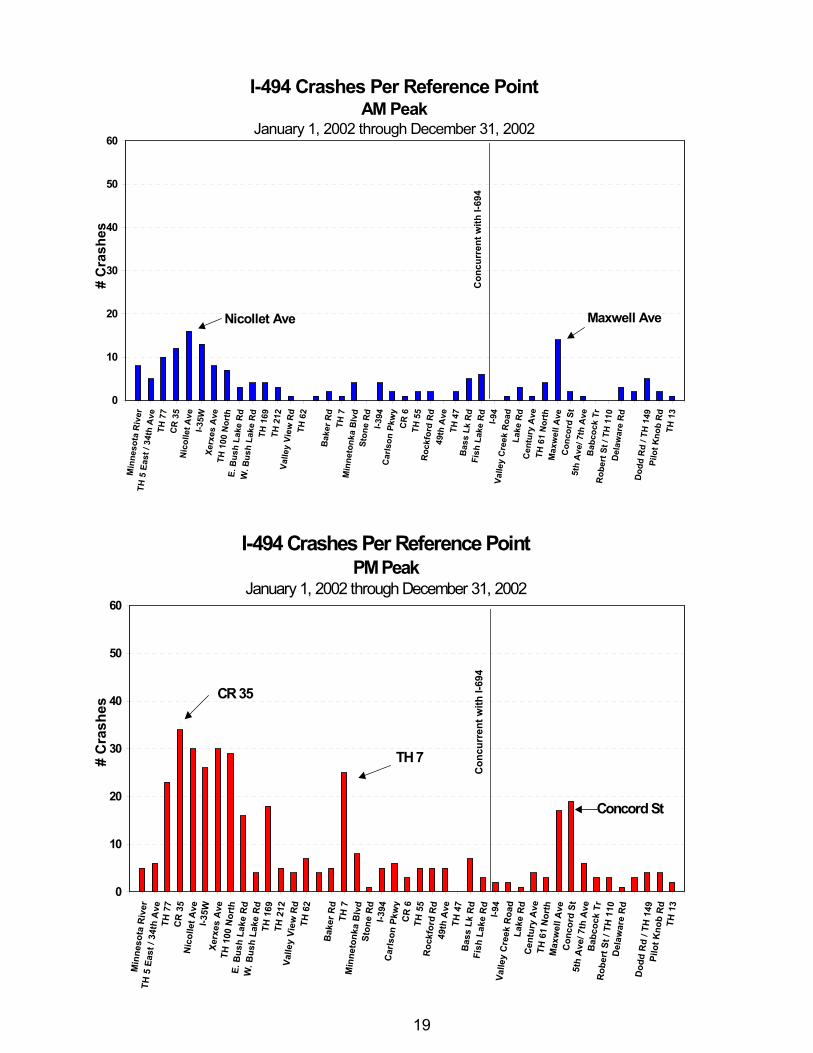
• The number of crashes declined overall on I-494 from 1,360 in 2001 to 1,184 in2002, based on the 24-hour, 7 days per week.
• The highest number of crashes per reference point occurred on I-494 from Hwy 77to Hwy 212. The segment of I-494 from MN 77 to I-35W had the highest 24-crashrate on I-494 with a rate of 1.53 Crashes/MVM.
• Another peak in the number of crashes per reference point is in the area of theWakota Bridge.
I-494: 24 Hour Crash Rate Trends
0
1
2
3
4
5
E. I-94 toUS 61
US 61 toMN 52
MN 52 toI-35E
I-35E toE. MN 5
E. MN 5to MN 77
MN 77 toI-35W
I-35W toMN 100
MN 100to W. MN
5
W. MN 5to MN 7
MN 7 to I-394
I-394 toW. MN 55
W. MN 55to W. I-94
Freeway Segments
Ann
ual C
rash
Rat
e pe
r MVM
1998 1999 2000 2001 2002
Interstate 494
LengthSegments of I-494 (Miles) 24 Hr AM PM 24 Hr AM PM 24 Hr AM PME. I-94 to US 61 5.05 112 14 20 61,100 7,600 10,200 0.99 1.40 1.49US 61 to MN 52 3.18 112 12 37 89,000 11,100 14,800 1.08 1.31 3.02MN 52 to I-35E 4.67 54 10 11 83,500 10,400 13,900 0.38 0.79 0.65I-35E to MN Rvr 1.96 26 3 6 91,800 11,500 15,300 0.40 0.51 0.77MN Rvr to E. MN 5 1.25 34 9 6 112,200 14,000 18,700 0.66 1.97 0.99E. MN 5 to MN 77 1.93 88 17 29 152,600 19,100 25,400 0.82 1.77 2.28MN 77 to I-35W 2.58 216 35 76 149,700 18,700 24,900 1.53 2.79 4.55I-35W to MN 100 2.6 182 19 77 148,000 18,500 24,700 1.30 1.52 4.61MN 100 to W. MN 5 3.93 112 14 40 88,800 11,100 14,800 0.88 1.23 2.65W. MN 5 to MN 7 4.19 61 4 38 75,200 9,400 12,500 0.53 0.39 2.79MN 7 to I-394 3.12 57 8 19 91,500 11,400 15,300 0.55 0.87 1.53I-394 to W. MN 55 2.86 38 4 14 95,300 11,900 15,900 0.38 0.45 1.18W. MN 55 to W. I-94 5.53 92 16 20 77,400 9,700 12,900 0.59 1.15 1.08TOTAL: E. I-94 to W. I-94 42.85 1,184 165 393 93,800 11,700 15,600 0.81 1.27 2.26
Number of Crashes Volume Crash Rate
19
I-494 Crashes Per Reference PointAM Peak
January 1, 2002 through December 31, 2002
0
10
20
30
40
50
60M
inne
sota
Riv
erTH
5 E
ast /
34t
h A
ve
TH 7
7 CR
35
Nico
llet A
veI-3
5W
Xerx
es A
veTH
100
Nor
thE.
Bus
h La
ke R
d W
. Bus
h La
ke R
dTH
169
TH 2
12
Valle
y Vi
ew R
d TH
62
Bake
r Rd
TH 7
M
inne
tonk
a Bl
vdSt
one
RdI-3
94C
arls
on P
kwy
CR 6
TH 5
5R
ockf
ord
Rd
49th
Ave
TH 4
7B
ass
Lk R
dFi
sh L
ake
Rd
I-94
Valle
y C
reek
Roa
d La
ke R
dC
entu
ry A
veTH
61
Nor
th
Max
wel
l Ave
Con
cord
St
5th
Ave
/ 7th
Ave
Bab
cock
Tr
Rob
ert S
t / T
H 1
10D
elaw
are
Rd
Dod
d R
d / T
H 1
49
Pilo
t Kno
b R
d TH
13
# C
rash
es
Maxwell AveNicollet Ave
Con
curr
ent w
ith I-
694
I-494 Crashes Per Reference PointPM Peak
January 1, 2002 through December 31, 2002
0
10
20
30
40
50
60
Min
neso
ta R
iver
TH 5
Eas
t / 3
4th
Ave
TH
77
CR 3
5N
icol
let A
veI-3
5W
Xerx
es A
veTH
100
Nor
thE.
Bus
h La
ke R
d W
. Bus
h La
ke R
dTH
169
TH 2
12
Valle
y Vi
ew R
d TH
62
Bak
er R
dTH
7
Min
neto
nka
Blv
dSt
one
RdI-3
94C
arls
on P
kwy
CR 6
TH 5
5R
ockf
ord
Rd
49th
Ave
TH 4
7B
ass
Lk R
dFi
sh L
ake
Rd
I-94
Valle
y C
reek
Roa
d La
ke R
dCe
ntur
y A
veTH
61
Nor
th
Max
wel
l Ave
Con
cord
St
5th
Ave/
7th
Ave
Bab
cock
Tr
Rob
ert S
t / T
H 1
10D
elaw
are
Rd
Dod
d R
d / T
H 1
49
Pilo
t Kno
b Rd
TH
13
# C
rash
es
CR 35
TH 7
Concord St
Con
curr
ent w
ith I-
694
20
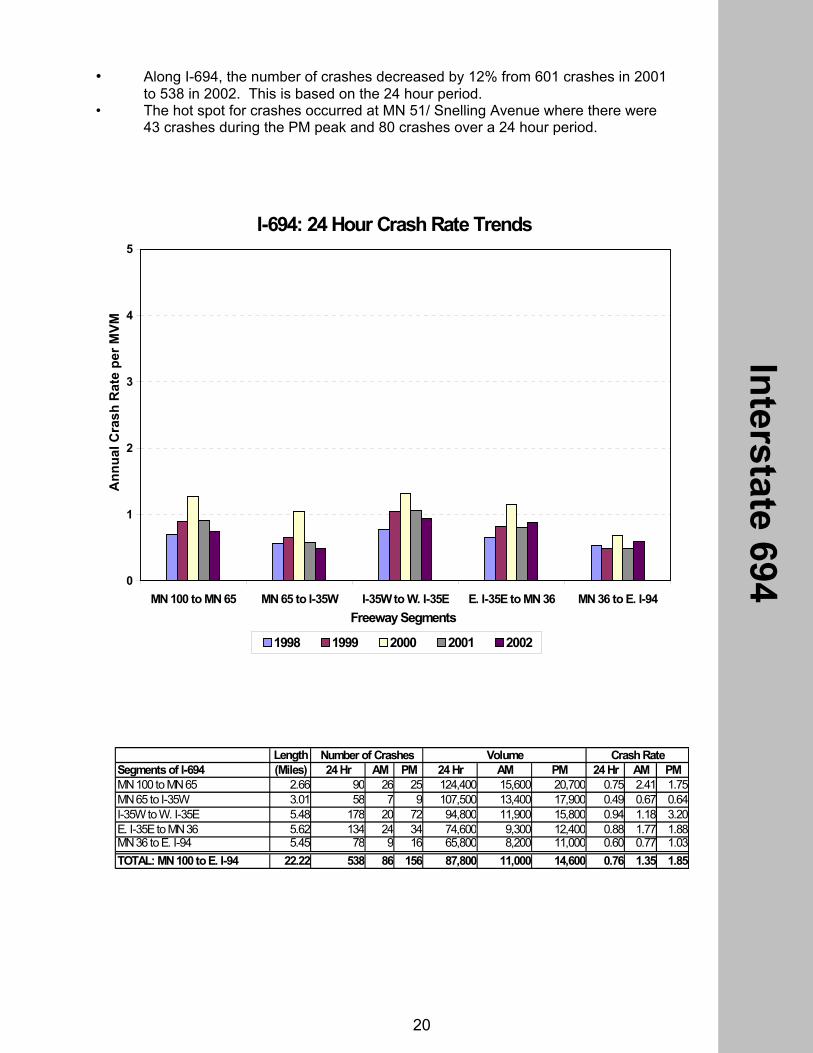
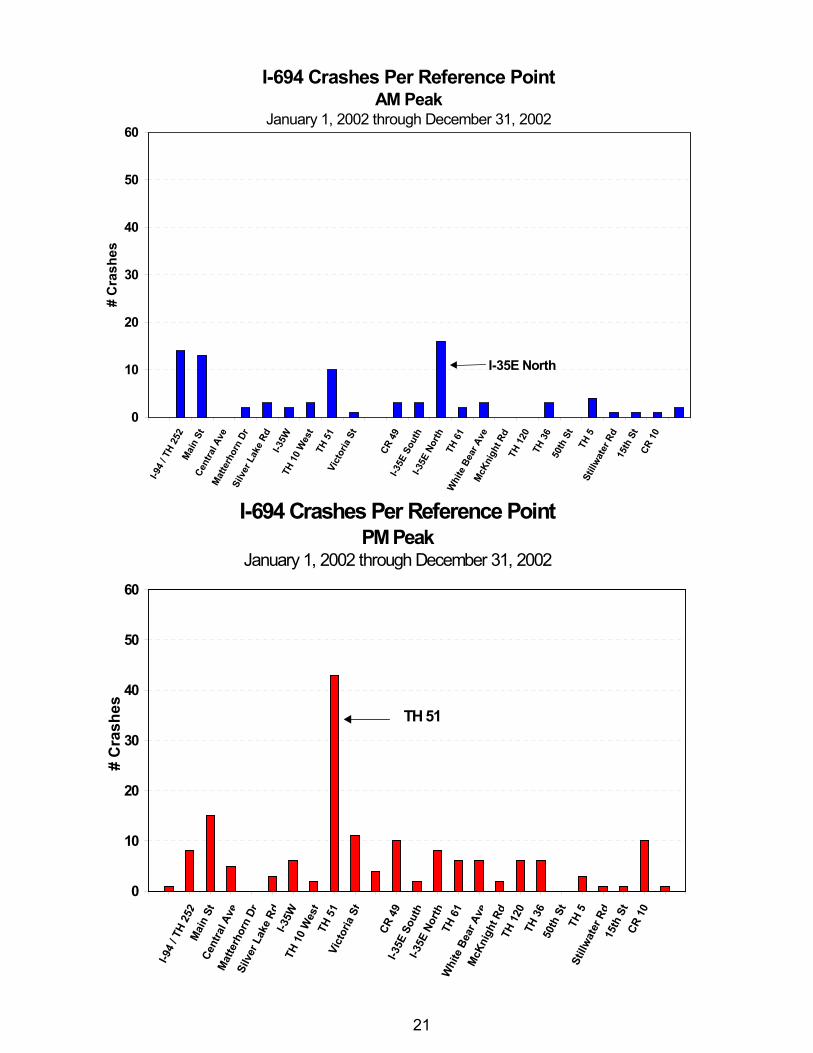
• Along I-694, the number of crashes decreased by 12% from 601 crashes in 2001to 538 in 2002. This is based on the 24 hour period.
• The hot spot for crashes occurred at MN 51/ Snelling Avenue where there were43 crashes during the PM peak and 80 crashes over a 24 hour period.
I-694: 24 Hour Crash Rate Trends
0
1
2
3
4
5
MN 100 to MN 65 MN 65 to I-35W I-35W to W. I-35E E. I-35E to MN 36 MN 36 to E. I-94Freeway Segments
Ann
ual C
rash
Rat
e pe
r MVM
1998 1999 2000 2001 2002
LengthSegments of I-694 (Miles) 24 Hr AM PM 24 Hr AM PM 24 Hr AM PMMN 100 to MN 65 2.66 90 26 25 124,400 15,600 20,700 0.75 2.41 1.75MN 65 to I-35W 3.01 58 7 9 107,500 13,400 17,900 0.49 0.67 0.64I-35W to W. I-35E 5.48 178 20 72 94,800 11,900 15,800 0.94 1.18 3.20E. I-35E to MN 36 5.62 134 24 34 74,600 9,300 12,400 0.88 1.77 1.88MN 36 to E. I-94 5.45 78 9 16 65,800 8,200 11,000 0.60 0.77 1.03TOTAL: MN 100 to E. I-94 22.22 538 86 156 87,800 11,000 14,600 0.76 1.35 1.85
Number of Crashes Volume Crash Rate
Interstate 694
21
I-694 Crashes Per Reference Point AM Peak
January 1, 2002 through December 31, 2002
0
10
20
30
40
50
60I-9
4 / T
H 25
2 M
ain
StCe
ntra
l Ave
Mat
terh
orn
DrSi
lver
Lak
e Rd
I-35W
TH
10
Wes
tTH
51
Vict
oria
St
CR 4
9I-3
5E S
outh
I-3
5E N
orth
TH
61
Whi
te B
ear A
veM
cKni
ght R
dTH
120
TH
36
50th
St
TH 5
Still
wate
r Rd
15th
St
CR 1
0
# C
rash
es
I-35E North
I-694 Crashes Per Reference Point PM Peak
January 1, 2002 through December 31, 2002
0
10
20
30
40
50
60
I-94
/ TH
252
Mai
n St
Cent
ral A
veM
atte
rhor
n Dr
Silv
er L
ake
RdI-3
5W
TH 1
0 W
est
TH 5
1Vi
ctor
ia S
t
CR 4
9I-3
5E S
outh
I-35E
Nor
thTH
61
Whi
te B
ear A
veM
cKni
ght R
dTH
120
TH 3
6 50
th S
tTH
5St
illwa
ter R
d15
th S
tCR
10
# C
rash
es TH 51
22
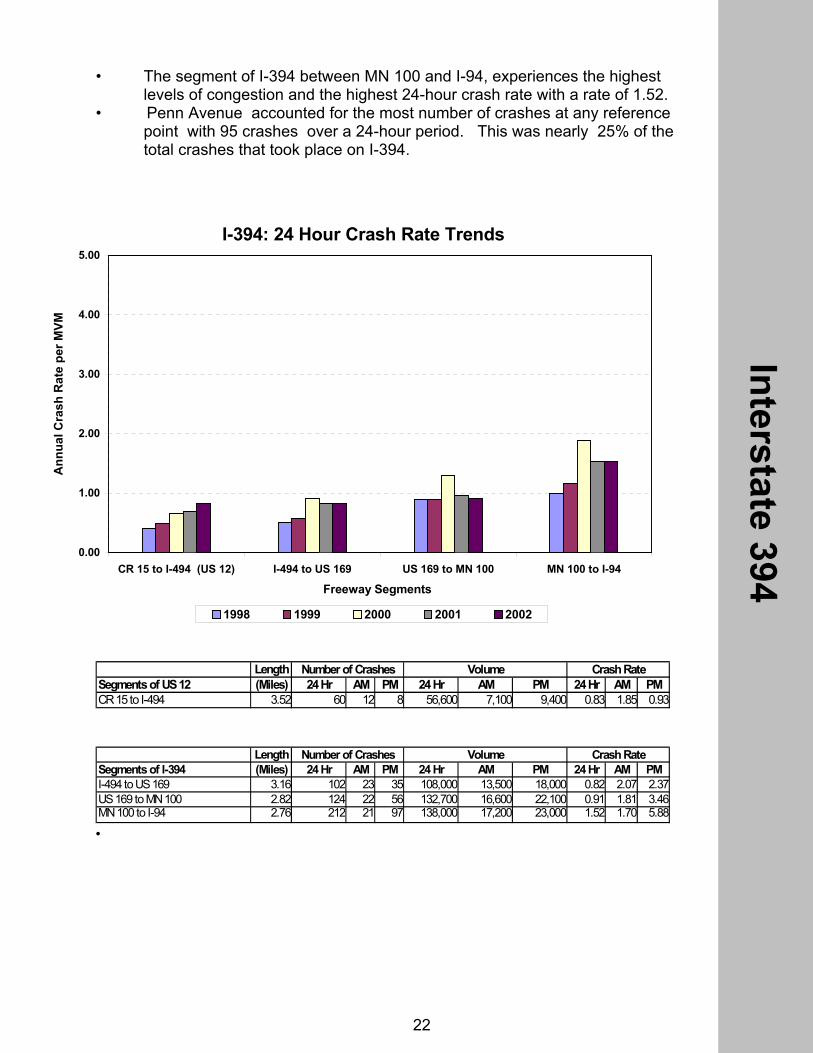
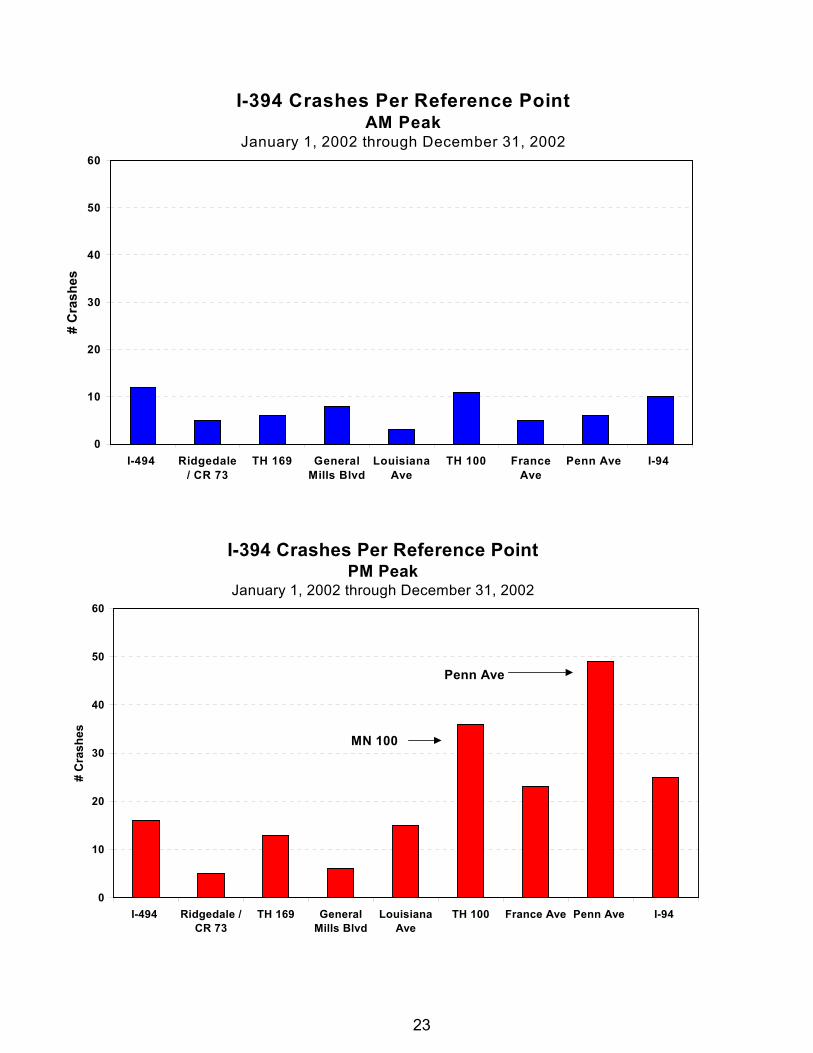
• The segment of I-394 between MN 100 and I-94, experiences the highestlevels of congestion and the highest 24-hour crash rate with a rate of 1.52.
• Penn Avenue accounted for the most number of crashes at any referencepoint with 95 crashes over a 24-hour period. This was nearly 25% of thetotal crashes that took place on I-394.
•
LengthSegments of US 12 (Miles) 24 Hr AM PM 24 Hr AM PM 24 Hr AM PMCR 15 to I-494 3.52 60 12 8 56,600 7,100 9,400 0.83 1.85 0.93
Number of Crashes Volume Crash Rate
Interstate 394
LengthSegments of I-394 (Miles) 24 Hr AM PM 24 Hr AM PM 24 Hr AM PMI-494 to US 169 3.16 102 23 35 108,000 13,500 18,000 0.82 2.07 2.37US 169 to MN 100 2.82 124 22 56 132,700 16,600 22,100 0.91 1.81 3.46MN 100 to I-94 2.76 212 21 97 138,000 17,200 23,000 1.52 1.70 5.88
Number of Crashes Volume Crash Rate
I-394: 24 Hour Crash Rate Trends
0.00
1.00
2.00
3.00
4.00
5.00
CR 15 to I-494 (US 12) I-494 to US 169 US 169 to MN 100 MN 100 to I-94
Freeway Segments
Ann
ual C
rash
Rat
e pe
r MVM
1998 1999 2000 2001 2002
23
I-394 Crashes Per Reference Point AM Peak
January 1, 2002 through December 31, 2002
0
10
20
30
40
50
60
I-494 Ridgedale/ CR 73
TH 169 GeneralMills Blvd
LouisianaAve
TH 100 FranceAve
Penn Ave I-94
# C
rash
es
I-394 Crashes Per Reference Point PM Peak
January 1, 2002 through December 31, 2002
0
10
20
30
40
50
60
I-494 Ridgedale /CR 73
TH 169 GeneralMills Blvd
LouisianaAve
TH 100 France Ave Penn Ave I-94
# C
rash
es
Penn Ave
MN 100
24
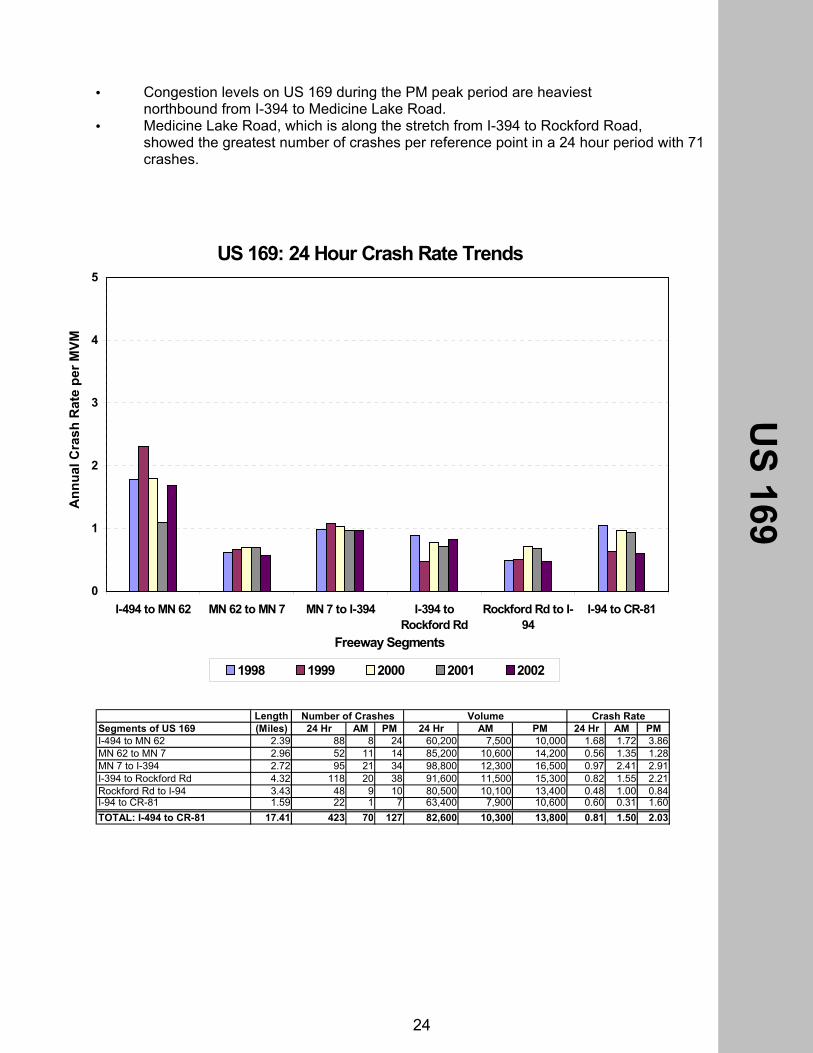
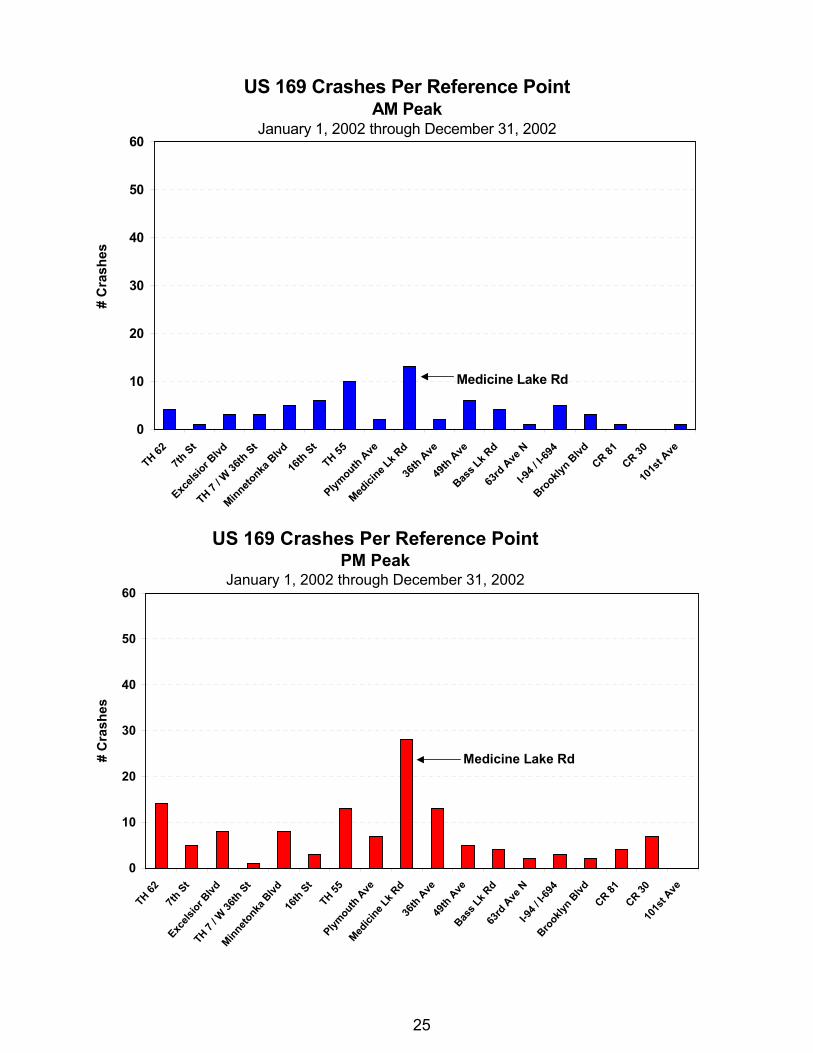
• Congestion levels on US 169 during the PM peak period are heaviestnorthbound from I-394 to Medicine Lake Road.
• Medicine Lake Road, which is along the stretch from I-394 to Rockford Road,showed the greatest number of crashes per reference point in a 24 hour period with 71crashes.
US 169: 24 Hour Crash Rate Trends
0
1
2
3
4
5
I-494 to MN 62 MN 62 to MN 7 MN 7 to I-394 I-394 toRockford Rd
Rockford Rd to I-94
I-94 to CR-81
Freeway Segments
Ann
ual C
rash
Rat
e pe
r MVM
1998 1999 2000 2001 2002
LengthSegments of US 169 (Miles) 24 Hr AM PM 24 Hr AM PM 24 Hr AM PMI-494 to MN 62 2.39 88 8 24 60,200 7,500 10,000 1.68 1.72 3.86MN 62 to MN 7 2.96 52 11 14 85,200 10,600 14,200 0.56 1.35 1.28MN 7 to I-394 2.72 95 21 34 98,800 12,300 16,500 0.97 2.41 2.91I-394 to Rockford Rd 4.32 118 20 38 91,600 11,500 15,300 0.82 1.55 2.21Rockford Rd to I-94 3.43 48 9 10 80,500 10,100 13,400 0.48 1.00 0.84I-94 to CR-81 1.59 22 1 7 63,400 7,900 10,600 0.60 0.31 1.60TOTAL: I-494 to CR-81 17.41 423 70 127 82,600 10,300 13,800 0.81 1.50 2.03
Number of Crashes Volume Crash Rate
US 169
25
US 169 Crashes Per Reference Point AM Peak
January 1, 2002 through December 31, 2002
0
10
20
30
40
50
60
TH 627th
St
Excels
ior Blvd
TH 7 / W
36th St
Minnetonka
Blvd
16th St
TH 55
Plymouth A
ve
Medici
ne Lk R
d
36th Ave
49th Ave
Bass L
k Rd
63rd Ave
N
I-94 /
I-694
Brooklyn B
lvdCR 81
CR 30
101s
t Ave
# C
rash
es
Medicine Lake Rd
US 169 Crashes Per Reference Point PM Peak
January 1, 2002 through December 31, 2002
0
10
20
30
40
50
60
TH 62
7th St
Excels
ior B
lvdTH
7 / W
36th
St
Minneto
nka B
lvd16
th St
TH 55
Plymou
th Ave
Medici
ne Lk
Rd
36th
Ave49
th Ave
Bass L
k Rd
63rd
Ave
NI-9
4 / I-6
94Bro
oklyn
Blvd
CR 81CR 30
101s
t Ave
# C
rash
es
Medicine Lake Rd
26
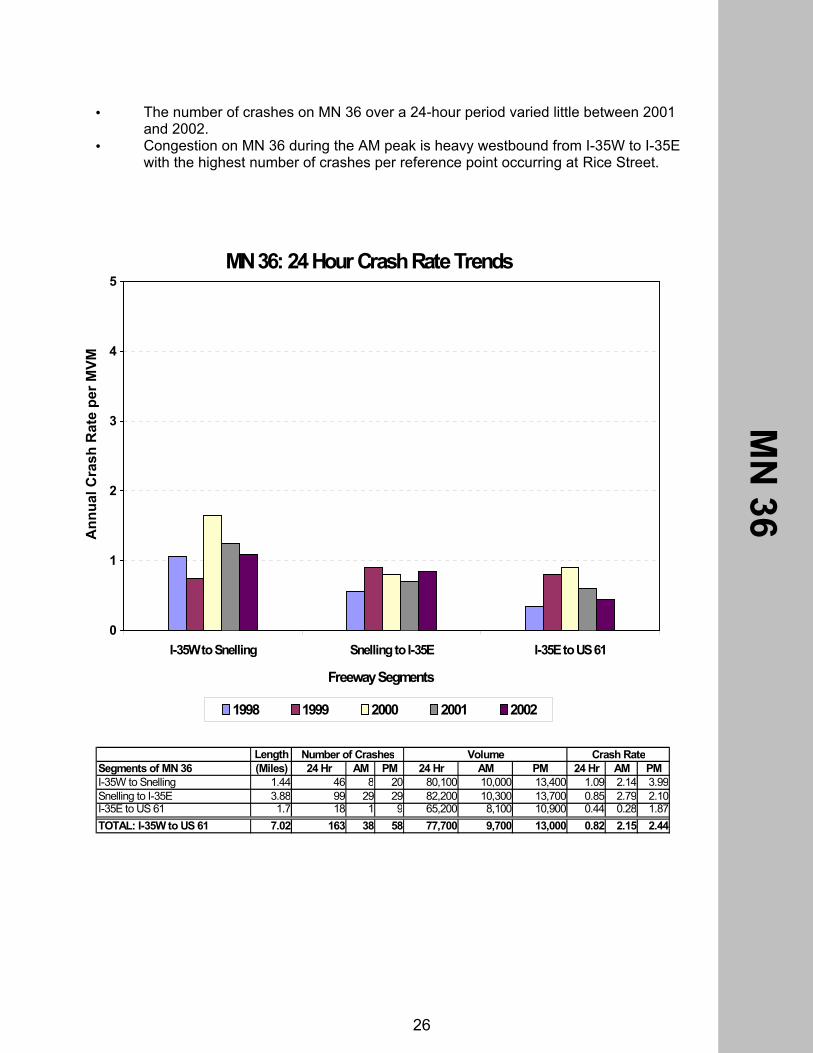
• The number of crashes on MN 36 over a 24-hour period varied little between 2001and 2002.
• Congestion on MN 36 during the AM peak is heavy westbound from I-35W to I-35Ewith the highest number of crashes per reference point occurring at Rice Street.
MN 36: 24 Hour Crash Rate Trends
0
1
2
3
4
5
I-35W to Snelling Snelling to I-35E I-35E to US 61
Freeway Segments
Ann
ual C
rash
Rat
e pe
r MVM
1998 1999 2000 2001 2002
MN
36
LengthSegments of MN 36 (Miles) 24 Hr AM PM 24 Hr AM PM 24 Hr AM PMI-35W to Snelling 1.44 46 8 20 80,100 10,000 13,400 1.09 2.14 3.99Snelling to I-35E 3.88 99 29 29 82,200 10,300 13,700 0.85 2.79 2.10I-35E to US 61 1.7 18 1 9 65,200 8,100 10,900 0.44 0.28 1.87TOTAL: I-35W to US 61 7.02 163 38 58 77,700 9,700 13,000 0.82 2.15 2.44
Number of Crashes Volume Crash Rate
27
MN 36 Crashes Per Reference Point AM Peak
January 1, 2002 through December 31, 2002
0
10
20
30
40
50
60
I-35W Snelling Ave LexingtonAve
Dale St Rice St I-35E TH 61
# C
rash
es
Rice St
MN 36 Crashes Per Reference PointPM Peak
January 1, 2002 through December 31, 2002
0
10
20
30
40
50
60
I-35W Snelling Ave LexingtonAve
Dale St Rice St I-35E TH 61
# C
rash
es
28
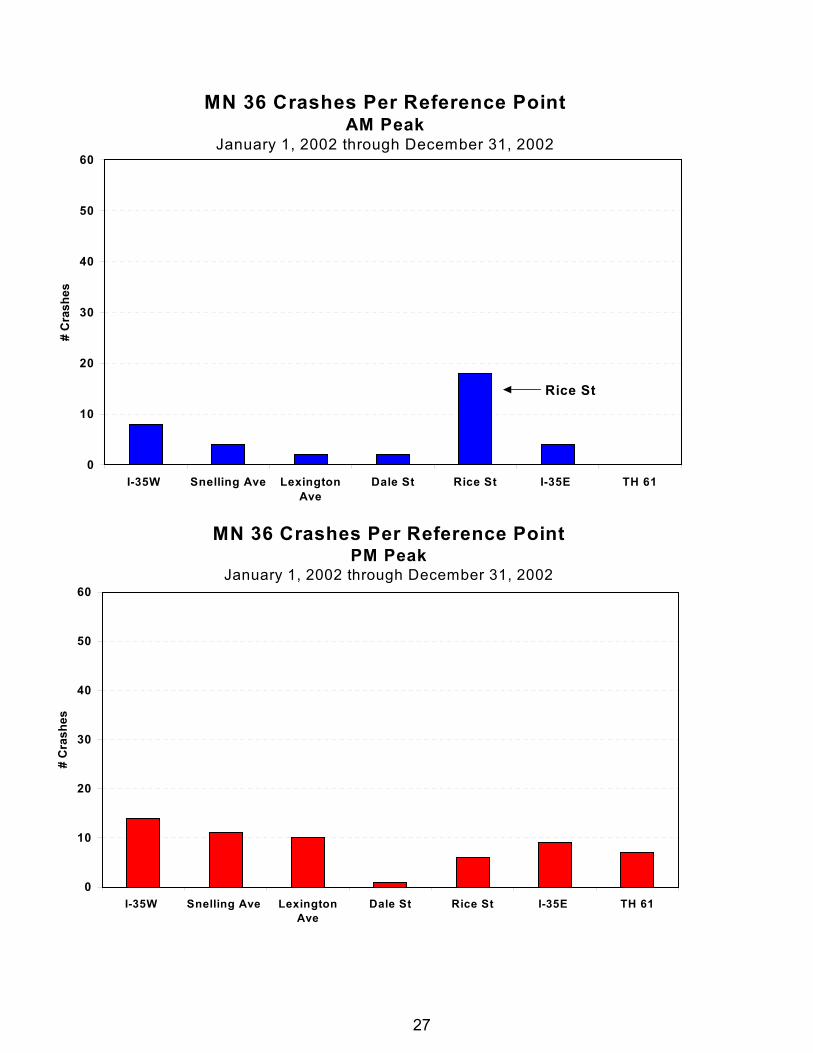
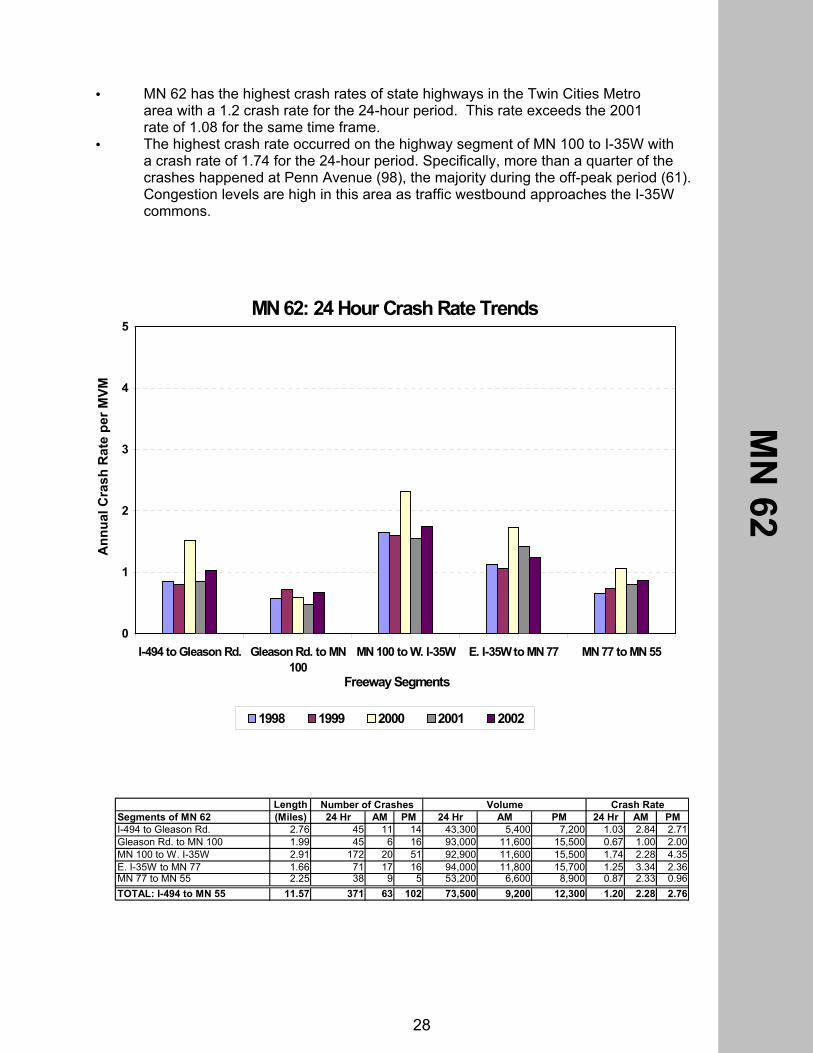
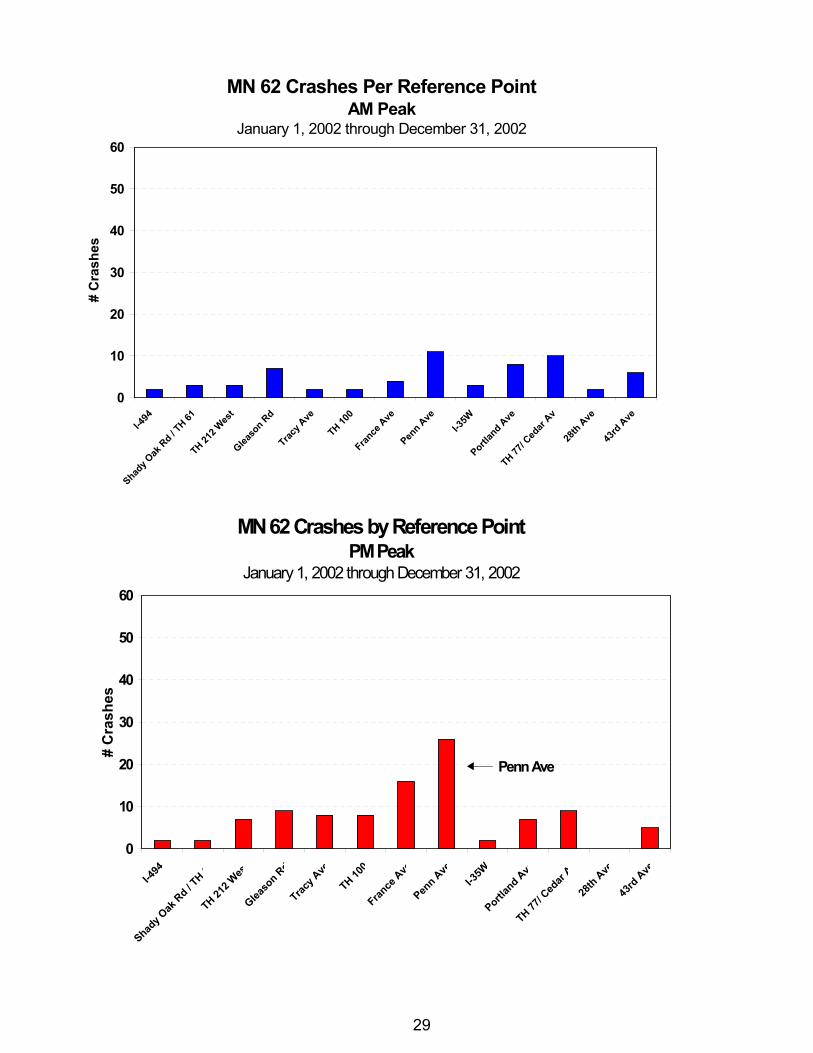
• MN 62 has the highest crash rates of state highways in the Twin Cities Metroarea with a 1.2 crash rate for the 24-hour period. This rate exceeds the 2001rate of 1.08 for the same time frame.
• The highest crash rate occurred on the highway segment of MN 100 to I-35W witha crash rate of 1.74 for the 24-hour period. Specifically, more than a quarter of thecrashes happened at Penn Avenue (98), the majority during the off-peak period (61). Congestion levels are high in this area as traffic westbound approaches the I-35Wcommons.
MN 62: 24 Hour Crash Rate Trends
0
1
2
3
4
5
I-494 to Gleason Rd. Gleason Rd. to MN100
MN 100 to W. I-35W E. I-35W to MN 77 MN 77 to MN 55
Freeway Segments
Ann
ual C
rash
Rat
e pe
r MVM
1998 1999 2000 2001 2002
LengthSegments of MN 62 (Miles) 24 Hr AM PM 24 Hr AM PM 24 Hr AM PMI-494 to Gleason Rd. 2.76 45 11 14 43,300 5,400 7,200 1.03 2.84 2.71Gleason Rd. to MN 100 1.99 45 6 16 93,000 11,600 15,500 0.67 1.00 2.00MN 100 to W. I-35W 2.91 172 20 51 92,900 11,600 15,500 1.74 2.28 4.35E. I-35W to MN 77 1.66 71 17 16 94,000 11,800 15,700 1.25 3.34 2.36MN 77 to MN 55 2.25 38 9 5 53,200 6,600 8,900 0.87 2.33 0.96TOTAL: I-494 to MN 55 11.57 371 63 102 73,500 9,200 12,300 1.20 2.28 2.76
Number of Crashes Volume Crash Rate
MN
62
29
MN 62 Crashes Per Reference Point AM Peak
January 1, 2002 through December 31, 2002
0
10
20
30
40
50
60I-4
94
Shady O
ak R
d / TH 61
TH 212 W
est
Gleaso
n Rd
Tracy A
ve
TH 100
France
Ave
Pen
n Ave
I-35W
Portl
and A
veTH 77
/ Ced
ar Av
28th A
ve43
rd A
ve
# C
rash
es
MN 62 Crashes by Reference Point PM Peak
January 1, 2002 through December 31, 2002
0
10
20
30
40
50
60
I-494
Shady O
ak Rd / T
H 6
TH 212 W
est
Gleaso
n Rd
Tracy A
ve
TH 100
France
Ave
Penn A
veI-3
5W
Portlan
d Ave
TH 77/ C
edar
A
28th Ave
43rd Ave
# C
rash
es
Penn Ave
30
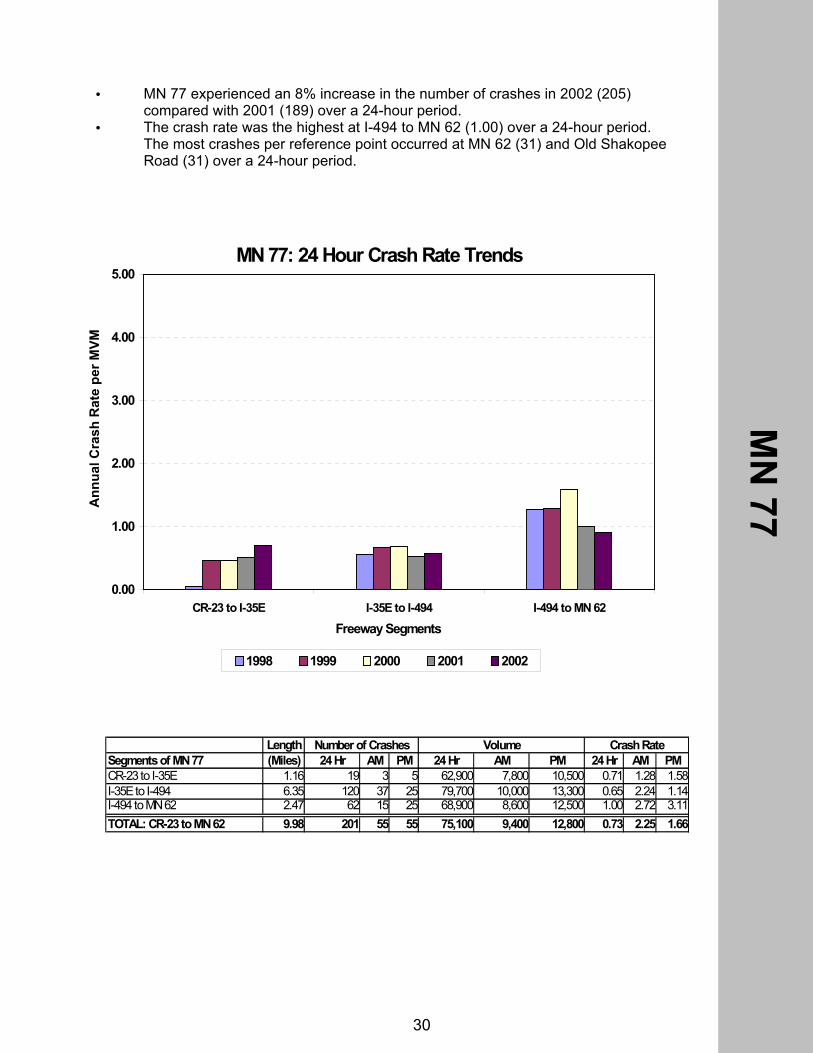
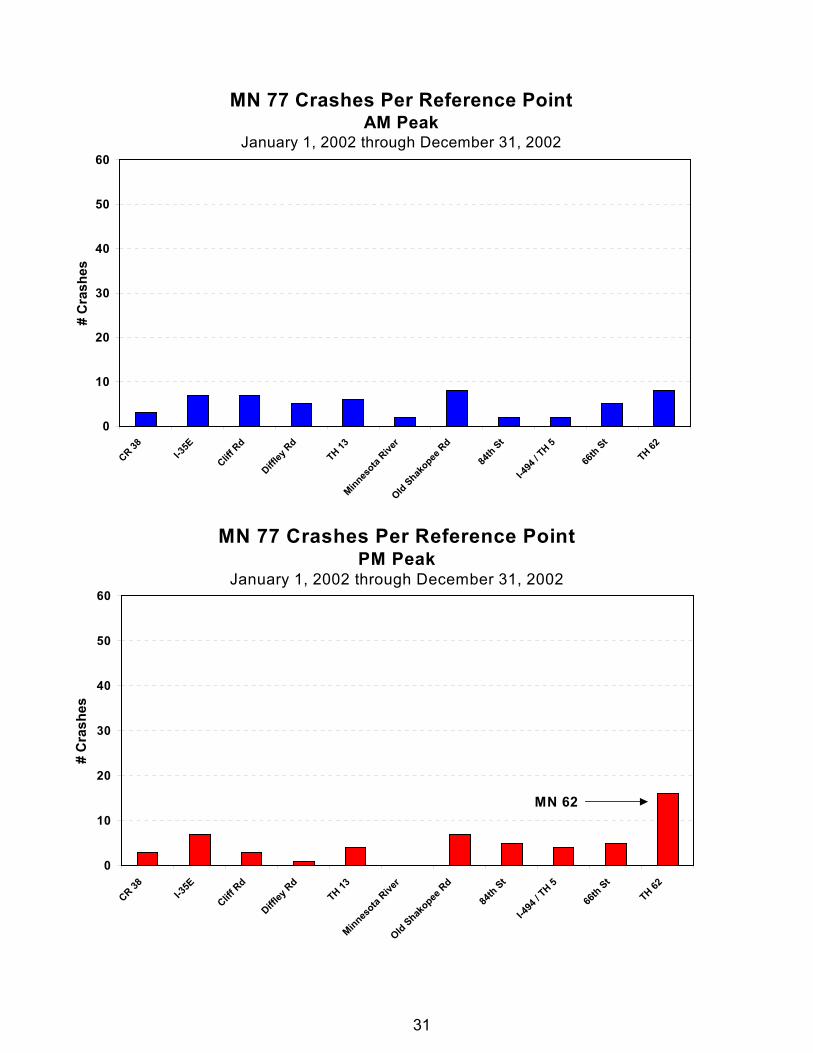
• MN 77 experienced an 8% increase in the number of crashes in 2002 (205)compared with 2001 (189) over a 24-hour period.
• The crash rate was the highest at I-494 to MN 62 (1.00) over a 24-hour period.The most crashes per reference point occurred at MN 62 (31) and Old ShakopeeRoad (31) over a 24-hour period.
MN 77: 24 Hour Crash Rate Trends
0.00
1.00
2.00
3.00
4.00
5.00
CR-23 to I-35E I-35E to I-494 I-494 to MN 62Freeway Segments
Ann
ual C
rash
Rat
e pe
r MVM
1998 1999 2000 2001 2002
LengthSegments of MN 77 (Miles) 24 Hr AM PM 24 Hr AM PM 24 Hr AM PMCR-23 to I-35E 1.16 19 3 5 62,900 7,800 10,500 0.71 1.28 1.58I-35E to I-494 6.35 120 37 25 79,700 10,000 13,300 0.65 2.24 1.14I-494 to MN 62 2.47 62 15 25 68,900 8,600 12,500 1.00 2.72 3.11TOTAL: CR-23 to MN 62 9.98 201 55 55 75,100 9,400 12,800 0.73 2.25 1.66
Number of Crashes Volume Crash Rate
MN
77
31
MN 77 Crashes Per Reference PointAM Peak
January 1, 2002 through December 31, 2002
0
10
20
30
40
50
60
CR 38
I-35E
Cliff R
d
Diffley
Rd
TH 13Minnes
ota Rive
rOld Shak
opee R
d
84th St
I-494
/ TH 5
66th St
TH 62
# C
rash
es
MN 77 Crashes Per Reference Point PM Peak
January 1, 2002 through December 31, 2002
0
10
20
30
40
50
60
CR 38 I-35E
Cliff Rd
Diffley
RdTH 13
Minnesota
River
Old Shakopee
Rd
84th St
I-494
/ TH 5
66th St
TH 62
# C
rash
es
MN 62
32
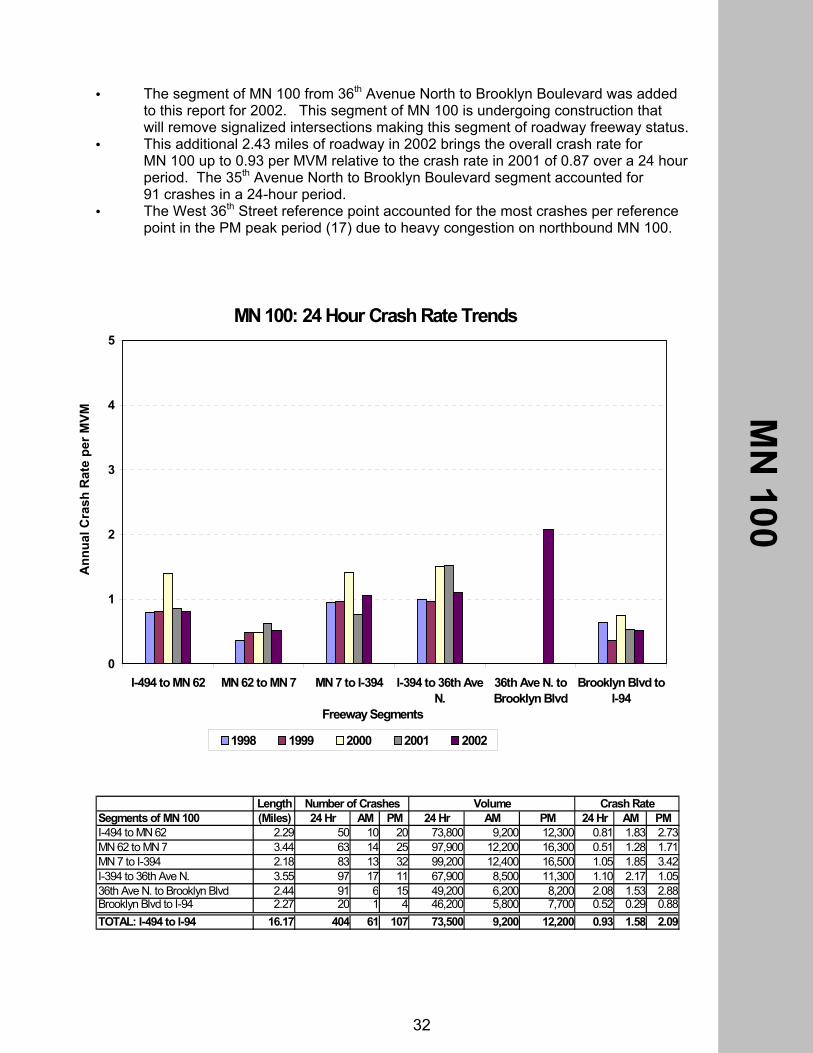
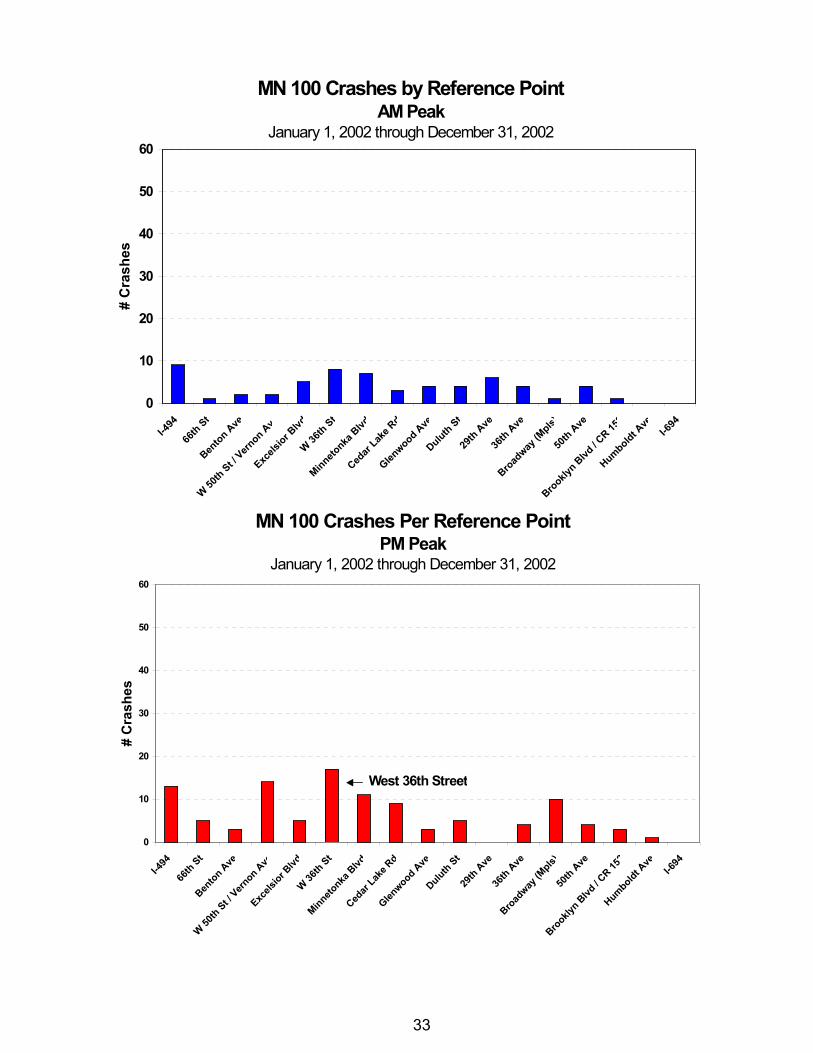
• The segment of MN 100 from 36th Avenue North to Brooklyn Boulevard was addedto this report for 2002. This segment of MN 100 is undergoing construction thatwill remove signalized intersections making this segment of roadway freeway status.
• This additional 2.43 miles of roadway in 2002 brings the overall crash rate forMN 100 up to 0.93 per MVM relative to the crash rate in 2001 of 0.87 over a 24 hourperiod. The 35th Avenue North to Brooklyn Boulevard segment accounted for91 crashes in a 24-hour period.
• The West 36th Street reference point accounted for the most crashes per referencepoint in the PM peak period (17) due to heavy congestion on northbound MN 100.
MN 100: 24 Hour Crash Rate Trends
0
1
2
3
4
5
I-494 to MN 62 MN 62 to MN 7 MN 7 to I-394 I-394 to 36th AveN.
36th Ave N. toBrooklyn Blvd
Brooklyn Blvd toI-94
Freeway Segments
Ann
ual C
rash
Rat
e pe
r MVM
1998 1999 2000 2001 2002
LengthSegments of MN 100 (Miles) 24 Hr AM PM 24 Hr AM PM 24 Hr AM PMI-494 to MN 62 2.29 50 10 20 73,800 9,200 12,300 0.81 1.83 2.73MN 62 to MN 7 3.44 63 14 25 97,900 12,200 16,300 0.51 1.28 1.71MN 7 to I-394 2.18 83 13 32 99,200 12,400 16,500 1.05 1.85 3.42I-394 to 36th Ave N. 3.55 97 17 11 67,900 8,500 11,300 1.10 2.17 1.0536th Ave N. to Brooklyn Blvd 2.44 91 6 15 49,200 6,200 8,200 2.08 1.53 2.88Brooklyn Blvd to I-94 2.27 20 1 4 46,200 5,800 7,700 0.52 0.29 0.88TOTAL: I-494 to I-94 16.17 404 61 107 73,500 9,200 12,200 0.93 1.58 2.09
Number of Crashes Volume Crash Rate
MN
100
33
MN 100 Crashes by Reference Point AM Peak
January 1, 2002 through December 31, 2002
0
10
20
30
40
50
60
I-494
66th St
Benton Ave
W 50th St /
Vernon Ave
Excels
ior Blvd
W 36th St
Minnetonka
Blvd
Cedar
Lake R
d
Glenwood Ave
Duluth St
29th Ave
36th Ave
Broadway
(Mpls)
50th Ave
Brooklyn Blvd
/ CR 15
2
Humboldt Ave
I-694
# C
rash
es
MN 100 Crashes Per Reference Point PM Peak
January 1, 2002 through December 31, 2002
0
10
20
30
40
50
60
I-494
66th St
Benton A
ve
W 50th St /
Vernon A
veExc
elsior B
lvdW 36
th St
Minnetonka
Blvd
Cedar
Lake R
dGlen
wood Ave
Duluth St29
th Ave
36th A
veBro
adway
(Mpls)
50th A
ve
Brookly
n Blvd
/ CR 15
2Humboldt A
ve
I-694
# C
rash
es
West 36th Street
34
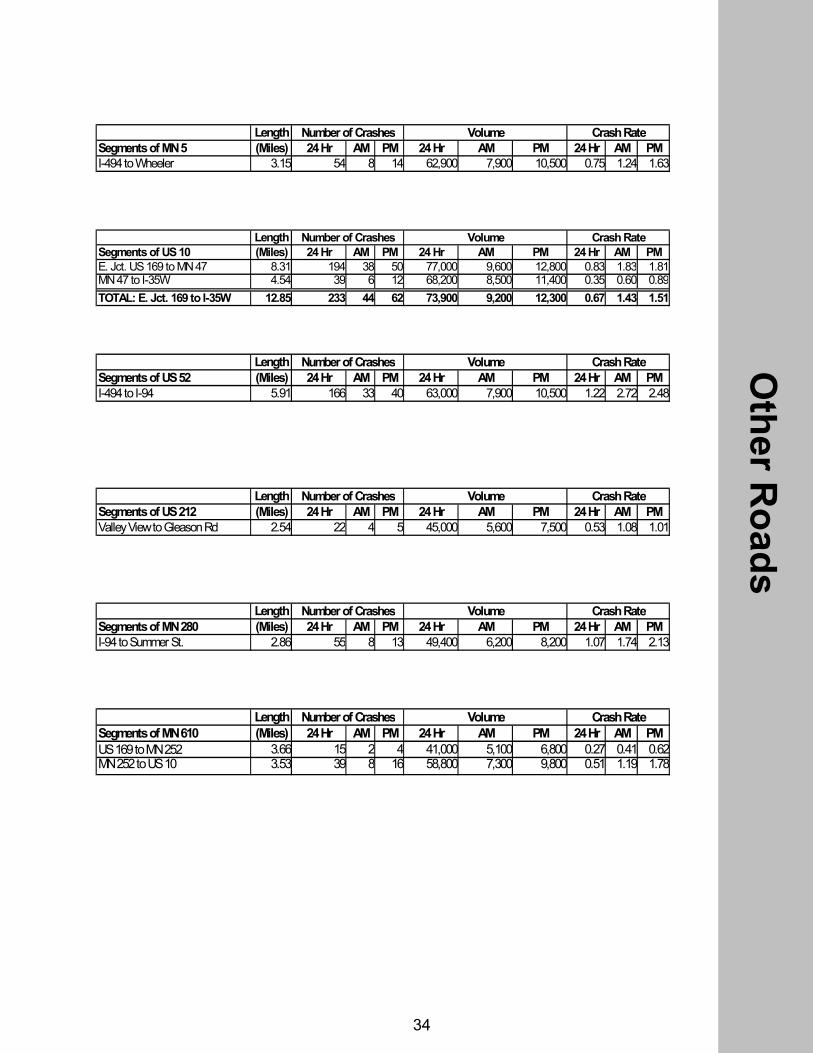
LengthSegments of MN 5 (Miles) 24 Hr AM PM 24 Hr AM PM 24 Hr AM PMI-494 to Wheeler 3.15 54 8 14 62,900 7,900 10,500 0.75 1.24 1.63
Number of Crashes Volume Crash Rate
LengthSegments of US 10 (Miles) 24 Hr AM PM 24 Hr AM PM 24 Hr AM PME. Jct. US 169 to MN 47 8.31 194 38 50 77,000 9,600 12,800 0.83 1.83 1.81MN 47 to I-35W 4.54 39 6 12 68,200 8,500 11,400 0.35 0.60 0.89TOTAL: E. Jct. 169 to I-35W 12.85 233 44 62 73,900 9,200 12,300 0.67 1.43 1.51
Number of Crashes Volume Crash Rate
LengthSegments of US 52 (Miles) 24 Hr AM PM 24 Hr AM PM 24 Hr AM PMI-494 to I-94 5.91 166 33 40 63,000 7,900 10,500 1.22 2.72 2.48
Number of Crashes Volume Crash Rate
LengthSegments of US 212 (Miles) 24 Hr AM PM 24 Hr AM PM 24 Hr AM PMValley View to Gleason Rd 2.54 22 4 5 45,000 5,600 7,500 0.53 1.08 1.01
Number of Crashes Volume Crash Rate
LengthSegments of MN 280 (Miles) 24 Hr AM PM 24 Hr AM PM 24 Hr AM PMI-94 to Summer St. 2.86 55 8 13 49,400 6,200 8,200 1.07 1.74 2.13
Number of Crashes Volume Crash Rate
LengthSegments of MN 610 (Miles) 24 Hr AM PM 24 Hr AM PM 24 Hr AM PMUS 169 to MN 252 3.66 15 2 4 41,000 5,100 6,800 0.27 0.41 0.62MN 252 to US 10 3.53 39 8 16 58,800 7,300 9,800 0.51 1.19 1.78
Number of Crashes Volume Crash Rate
Other R
oads
35
APPENDIX A: 2002 AM Congestion Map
RoadsRiver
AMNo Congestion< 1 Hour of Congestion1-2 Hours of Congestion>2 Hours of Congestion
N
6:00 - 9:00 AM
CongestionWHERE ESTIMATED SPEEDS
ARE < 45 MPH
Total Miles of Congestion Total Miles of Freeway
2002 Metro Freeway Congestion6:00 am - 9:00 am
CongestionWHERE ESTIMATED SPEEDS
ARE < 45 MPH
35W 35E
494494
394
35W100
62
4945
52
77
169
35W
35E
694
694494
94
94
35E
94
10
610
35W169
36100
94
Data collected and system observations made October 2002.
36
APPENDIX B: 2002 PM Congestion Map
Total Miles of Congestion Total Miles of Freeway
WHERE ESTIMATED SPEEDSARE < 45 MPH
Congestion
2:00 - 7:00 PM2002 Metro Freeway Congestion
N
RoadsRiver
PM CongestionNo Congestion15 min - 1 Hour of Congestion1-2 Hours of Congestion2-3 Hours of Congestion>3 Hours of Congestion
2002 Metro Freeway Congestion2:00 pm - 7:00 pm
CongestionWHERE ESTIMATED SPEEDS
ARE < 45 MPH
35W 35E
494494
394
35W100
62
4945
52
77
169
35W
35E
694
694494
94
94
35E
94
10
610
35W169
36100
94
Data collected and observations made October 2002.