Embed Size (px)
Citation preview
VOLUME 13 n NOVEMBER 2003
NCSBN Research Brief
2002Licensure andExamination Statistics
Lynda Crawford, PhD, RN, CAECasey Marks, PhDMichelle Reynolds, MSEsther White
National Council of State Boards of Nursing, Inc. (NCSBN)

2002Licensure andExamination Statistics
Lynda Crawford, PhD, RN, CAECasey Marks, PhDMichelle Reynolds, MSEsther White
National Council of State Boards of Nursing, Inc. (NCSBN)
National Council of State Boards of Nursing, Inc. (NCSBN) u 2003
NCSBN Mission StatementThe National Council of State Boards of Nursing, composed of member boards, provides leadership to advance regulatory excellence for public protection.
Copyright © 2003 National Council of State Boards of Nursing, Inc. (NCSBN)
All rights reserved.
The NCSBN logo, NCLEX®, NCLEX-RN® and NCLEX-PN® are registered trademarks ofNCSBN and may not be used or reproduced without written permission from NCSBN. No part of this publication may be reproduced, stored in a retrieval system or transmittedin any form by any means (electronic, mechanical, photocopying, recording, or otherwisenow known or to be invented) for any commercial or for-profit use or purpose without written permission from NCSBN.
Address inquiries in writing to NCSBN Permissions, 111 E. Wacker Drive, Suite 2900,Chicago, IL 60601-4277.
Printed in the United States of America
ISBN# 0-9720273-9-4
National Council of State Boards of Nursing, Inc. (NCSBN) u 2003
ii
2002 LICENSURE &EXAMINATION STATISTICS
Table of Contents
List of Tables . . . . . . . . . . . . . . . . . . . . . . . . . . . . . . . . . . . . . . . . . . . . . . . . . . . . . . . . . . . . . . . . v
List of Figures . . . . . . . . . . . . . . . . . . . . . . . . . . . . . . . . . . . . . . . . . . . . . . . . . . . . . . . . . . . . . . vii
Introduction . . . . . . . . . . . . . . . . . . . . . . . . . . . . . . . . . . . . . . . . . . . . . . . . . . . . . . . . . . . . . . . . . 1
I. 2002 Licensure Statistics . . . . . . . . . . . . . . . . . . . . . . . . . . . . . . . . . . . . . . . . . . . . . . . . . . . 3
II. 2002 Licensure Examination Statistics . . . . . . . . . . . . . . . . . . . . . . . . . . . . . . . . . . . . . . 17
NCLEX-PN® Examination, January 1, 2002 - December 31, 2002 . . . . . . 19NCLEX-RN® Examination, January 1, 2002 - December 31, 2002 . . . . . . 29
Appendix A: Licensure Examination Summary Statistics Definitions . . . . . . . . . . . . . . . 46
National Council of State Boards of Nursing, Inc. (NCSBN) u 2003
iii
TABLE OF CONTENTS
National Council of State Boards of Nursing, Inc. (NCSBN) u 2003
iv
2002 LICENSURE &EXAMINATION STATISTICS
List of TablesPart I
1. Boards of Nursing Empowered to License Registered Nurses, Licensed Practical/Vocational Nurses or Other Categories of Nursing Personnel . . . . . . . . . . . . . . . . . . . . . . . . . . . . . . . . . . . . . . . . 4
2. Registered Nurses: New-in-State Functions, by Jurisdiction . . . . . . . . . 6
3. Licensed Practical/Vocational Nurses: New-in-State Functions, by Jurisdiction . . . . . . . . . . . . . . . . . . . . . . . . . . . . . . . . . . . . . . . . . . . . . 8
4. Total Number of Active Licenses: Registered Nurses and Licensed Practical/Vocational Nurses, by Jurisdiction . . . . . . . . . . . . . 10
5. Number of Graduates of Foreign Nursing Programs Licensed, by Jurisdiction . . . . . . . . . . . . . . . . . . . . . . . . . . . . . . . . . . . . . . . . . . . . 12
6. Summary of Licensing Activities . . . . . . . . . . . . . . . . . . . . . . . . . . . . . 12
7. Distribution of Active Advanced Practice/Authority to Practice Licenses Within Each Specialty Category, by Jurisdiction . . . . . . . . . . . . . . . . . . . . . . . . . . . . . . . . . . . . . . . . . . . . 14
8. Total Number of Active Specialty Licenses Within Member Board Jurisdictions . . . . . . . . . . . . . . . . . . . . . . . . . . . . . . . . . 16
Part II
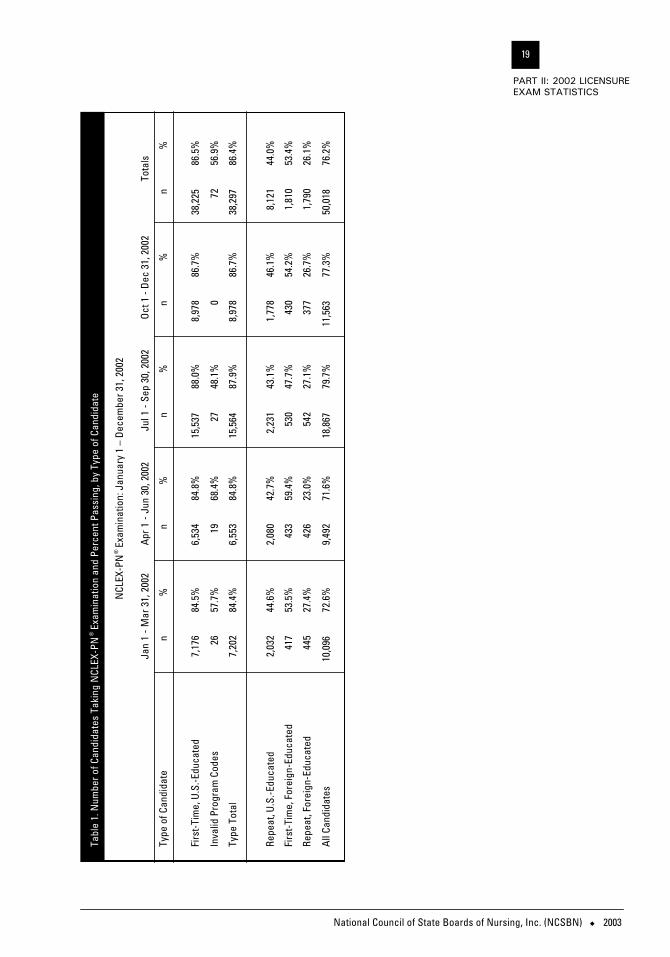
1. Number of Candidates Taking NCLEX-PN® Examination and Percent Passing, by Type of Candidate: January 1 - December 31, 2002 . . . . . . . . . . . . . . . . . . . . . . . . . . . . . . 19
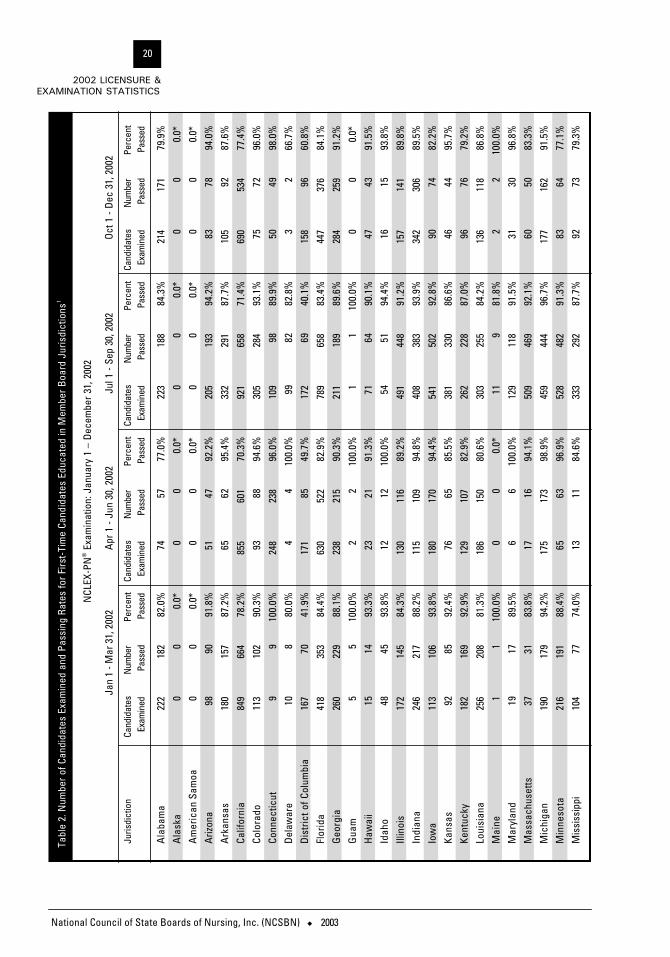
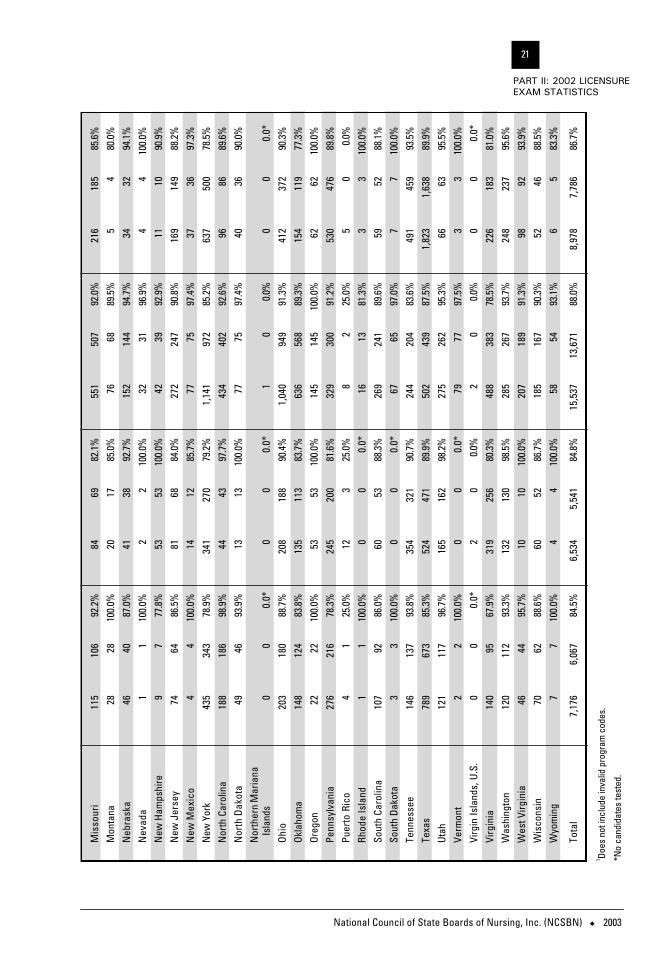
2. Number of Candidates Examined and Passing Rates for First-Time Candidates Educated in Member Board Jurisdictions: NCLEX-PN® Examination, January 1 - December 31, 2002 . . . . . . . . . . . . . . . . . . . . . . . . . . . . . . . . . . . . . . . . 20
3. Number of First-Time Candidates Not Educated in Member Board Jurisdictions Taking NCLEX-PN® Examination and Percent Passing: January 1 - December 31, 2002 . . . . . . . . . . . . . 22
4. Summary Statistics for First-Time U.S.-Educated Candidates Taking NCLEX-PN® Examination, January - December 2002 . . . . . . . . 25
5. Number of Candidates Taking NCLEX-RN® Examination and Percent Passing, by Type of Candidate: January 1 - December 31, 2002 . . . . . . . . . . . . . . . . . . . . . . . . . . . . . . 29
National Council of State Boards of Nursing, Inc. (NCSBN) u 2003
v
LIST OF TABLES
National Council of State Boards of Nursing, Inc. (NCSBN) u 2003
vi
2002 LICENSURE &EXAMINATION STATISTICS
6. Number of Candidates Examined and Passing Rates for First-Time Candidates Educated in Member Board Jurisdictions, by Degree Type: NCLEX-RN® Examination, January 1 - March 31, 2002 . . . . . . . . . . . . . . . . . . . . . . . . . . . . . . . . . 30
7. Number of Candidates Examined and Passing Rates for First-Time Candidates Educated in Member Board Jurisdictions, by Degree Type: NCLEX-RN® Examination, April 1 - June 30, 2002 . . . . . . . . . . . . . . . . . . . . . . . . . . . . . . . . . . . . . 32
8. Number of Candidates Examined and Passing Rates for First-Time Candidates Educated in Member Board Jurisdictions, by Degree Type: NCLEX-RN® Examination, July 1 - September 30, 2002 . . . . . . . . . . . . . . . . . . . . . . . . . . . . . . . . . 34
9. Number of Candidates Examined and Passing Rates for First-Time Candidates Educated in Member Board Jurisdictions, by Degree Type: NCLEX-RN® Examination, October 1 - December 31, 2002 . . . . . . . . . . . . . . . . . . . . . . . . . . . . . . 36
10. Number of First-Time Candidates Not Educated in Member Board Jurisdictions Taking NCLEX-RN® Examination and Percent Passing: January 1 - December 31, 2002 . . . . . . . . . . . . . 38
11. Summary Statistics for First-Time, U.S.-Educated Candidates Taking NCLEX-RN® Examination, January - December 2002 . . . . . . . . 42
National Council of State Boards of Nursing, Inc. (NCSBN) u 2003
vii
LIST OF FIGURES
List of FiguresPart I
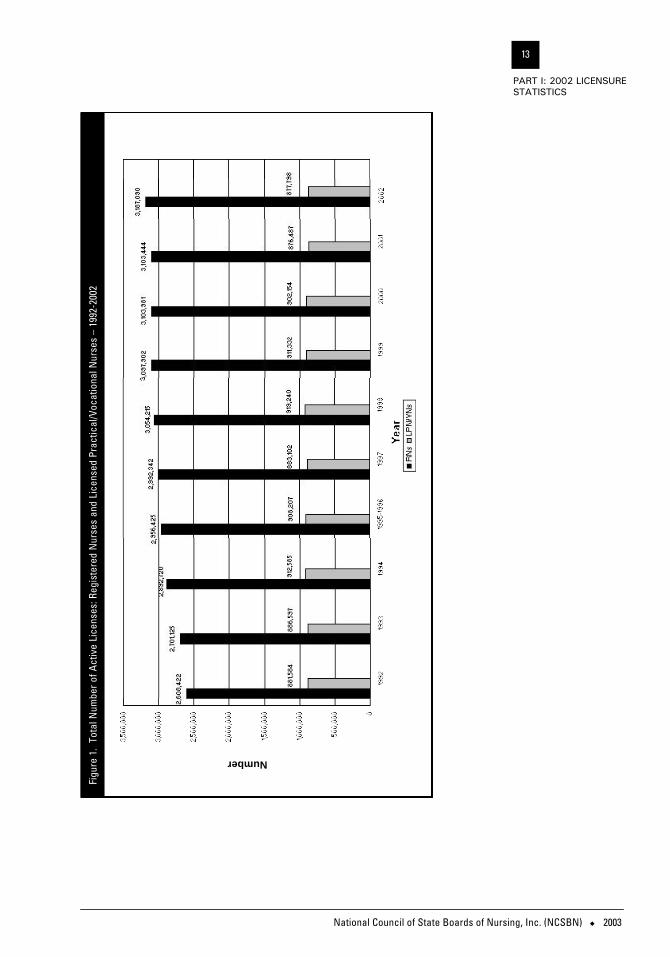
1. Total Number of Active Licenses: Registered Nurses and LicensedPractical/Vocational Nurses, 1992-2002. . . . . . . . . . . . . . . . . . . . . . . . 13
Part II
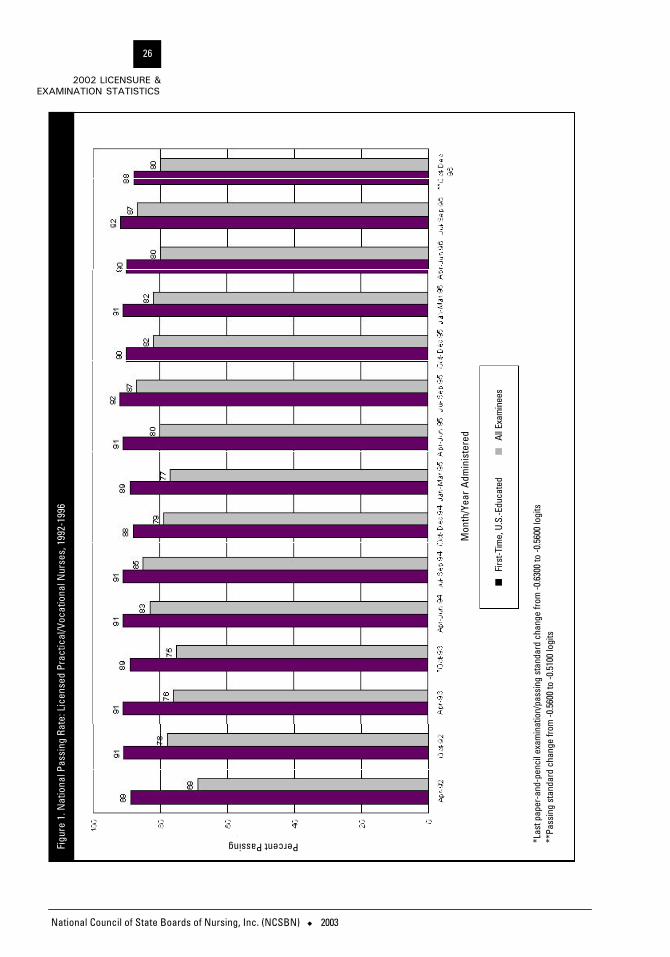
1. National Passing Rate: Licensed Practical/Vocational Nurses, 1992-1996 . . . . . . . . . . . . . . . . . . . . . . . . . . . . . . . . . . . . . . . . . . . . . . . 26
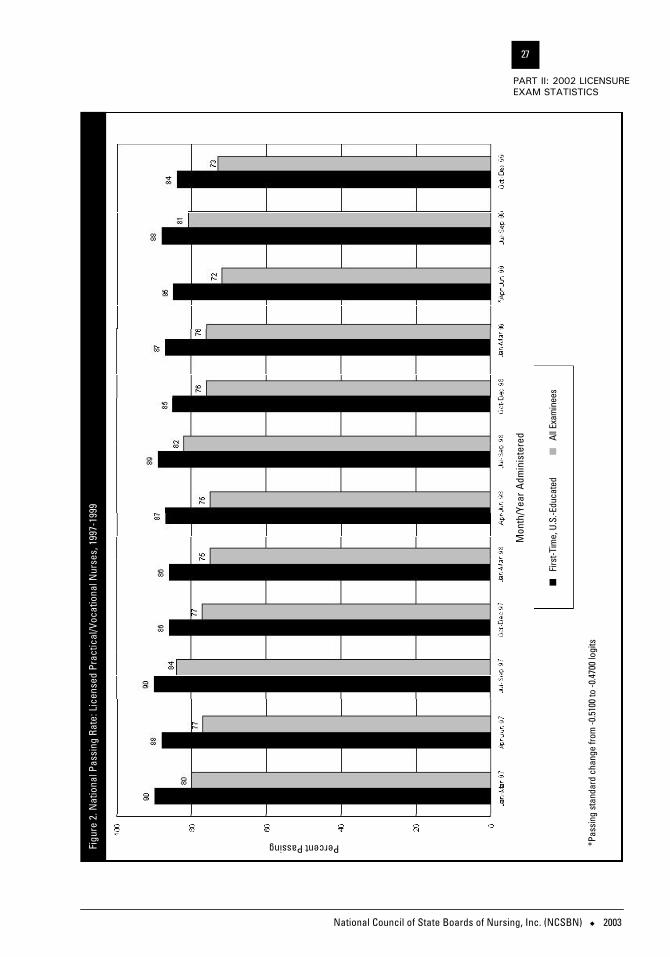
2. National Passing Rate: Licensed Practical/Vocational Nurses, 1997-1999 . . . . . . . . . . . . . . . . . . . . . . . . . . . . . . . . . . . . . . . . . . . . . . . 27
3. National Passing Rate: Licensed Practical/Vocational Nurses, 2000-2002 . . . . . . . . . . . . . . . . . . . . . . . . . . . . . . . . . . . . . . . . . . . . . . . 28
4. National Passing Rate: Registered Nurses, 1992-1996. . . . . . . . . . . . . 43
5. National Passing Rate: Registered Nurses, 1997-1999. . . . . . . . . . . . . 44
6. National Passing Rate: Registered Nurses, 2000-2002. . . . . . . . . . . . . 45

National Council of State Boards of Nursing, Inc. (NCSBN) u 2003
viii
2002 LICENSURE &EXAMINATION STATISTICS
INTRODUCTION
National Council of State Boards of Nursing, Inc. (NCSBN) u 2003
1
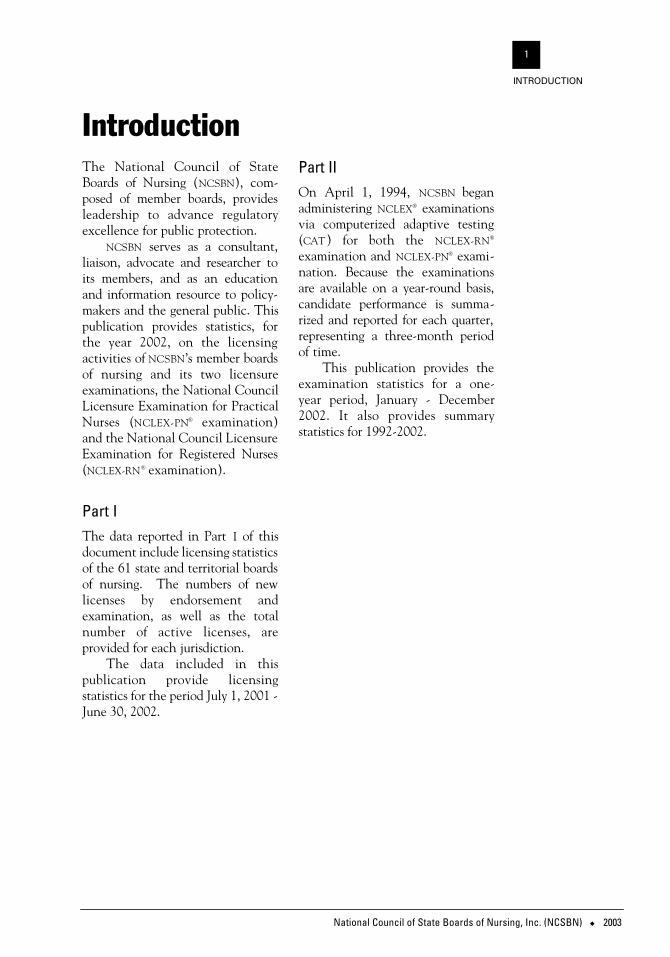
The National Council of StateBoards of Nursing (NCSBN), com-posed of member boards, providesleadership to advance regulatoryexcellence for public protection.
NCSBN serves as a consultant,liaison, advocate and researcher toits members, and as an educationand information resource to policy-makers and the general public. Thispublication provides statistics, forthe year 2002, on the licensingactivities of NCSBN’s member boardsof nursing and its two licensureexaminations, the National CouncilLicensure Examination for PracticalNurses (NCLEX-PN® examination)and the National Council LicensureExamination for Registered Nurses(NCLEX-RN® examination).
Part IThe data reported in Part I of thisdocument include licensing statisticsof the 61 state and territorial boardsof nursing. The numbers of newlicenses by endorsement and examination, as well as the totalnumber of active licenses, are provided for each jurisdiction.
The data included in this publication provide licensing statistics for the period July 1, 2001 -June 30, 2002.
Part IIOn April 1, 1994, NCSBN beganadministering NCLEX® examinationsvia computerized adaptive testing(CAT) for both the NCLEX-RN®
examination and NCLEX-PN® exami-nation. Because the examinationsare available on a year-round basis,candidate performance is summa-rized and reported for each quarter,representing a three-month periodof time.
This publication provides theexamination statistics for a one-year period, January - December2002. It also provides summarystatistics for 1992-2002.
Introduction

National Council of State Boards of Nursing, Inc. (NCSBN) u 2003
2
2002 LICENSURE &EXAMINATION STATISTICS
National Council of State Boards of Nursing, Inc. (NCSBN) u 2003
3
PART I: 2002 LICENSURE STATISTICS
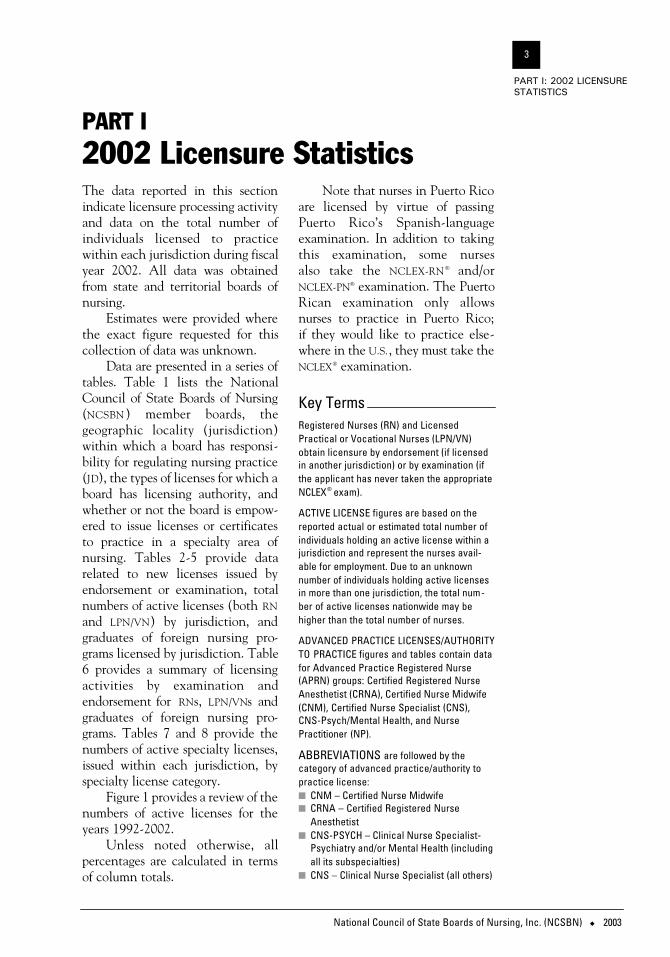
The data reported in this sectionindicate licensure processing activityand data on the total number ofindividuals licensed to practicewithin each jurisdiction during fiscalyear 2002. All data was obtainedfrom state and territorial boards ofnursing.
Estimates were provided wherethe exact figure requested for thiscollection of data was unknown.
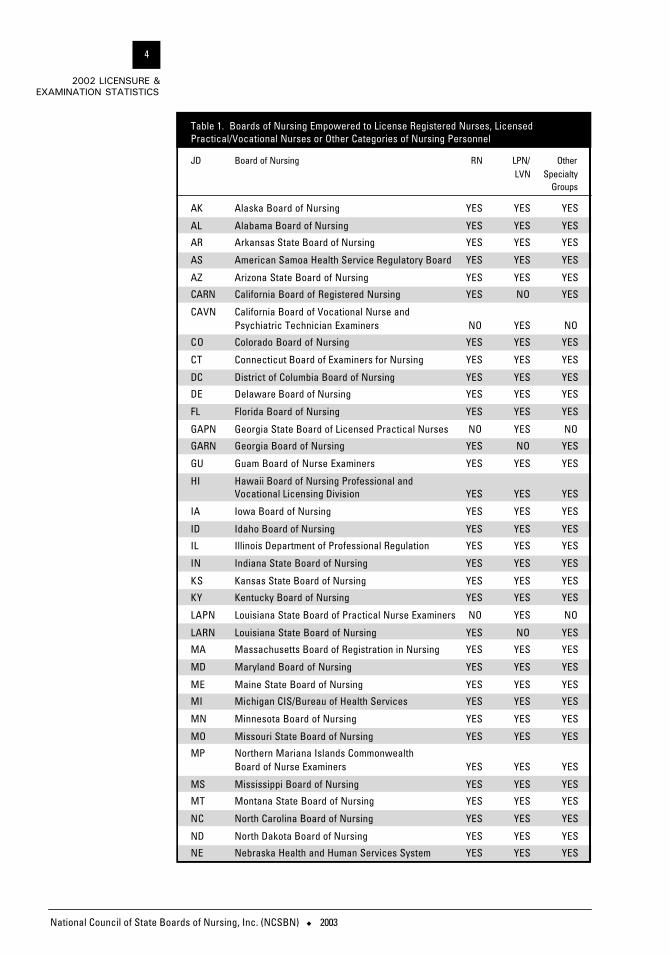
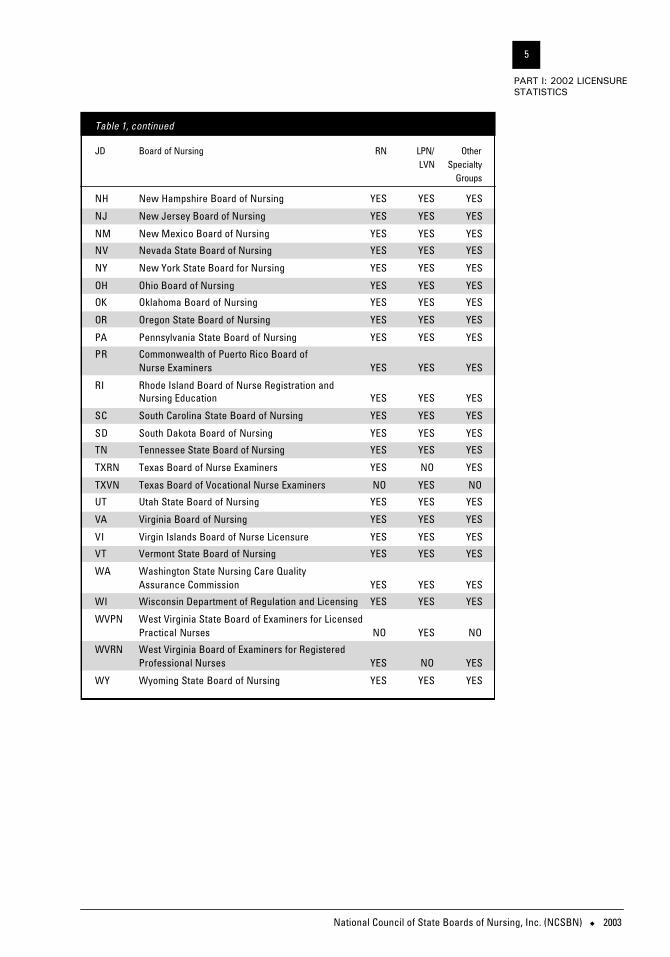
Data are presented in a series oftables. Table 1 lists the NationalCouncil of State Boards of Nursing(NCSBN) member boards, the geographic locality (jurisdiction)within which a board has responsi-bility for regulating nursing practice(JD), the types of licenses for which aboard has licensing authority, andwhether or not the board is empow-ered to issue licenses or certificatesto practice in a specialty area ofnursing. Tables 2-5 provide datarelated to new licenses issued byendorsement or examination, totalnumbers of active licenses (both RN
and LPN/VN) by jurisdiction, andgraduates of foreign nursing pro-grams licensed by jurisdiction. Table6 provides a summary of licensingactivities by examination and endorsement for RNs, LPN/VNs andgraduates of foreign nursing pro-grams. Tables 7 and 8 provide thenumbers of active specialty licenses,issued within each jurisdiction, byspecialty license category.
Figure 1 provides a review of thenumbers of active licenses for theyears 1992-2002.
Unless noted otherwise, all percentages are calculated in termsof column totals.
Note that nurses in Puerto Ricoare licensed by virtue of passingPuerto Rico’s Spanish-languageexamination. In addition to takingthis examination, some nurses also take the NCLEX-RN ® and/orNCLEX-PN® examination. The PuertoRican examination only allows nurses to practice in Puerto Rico; if they would like to practice else-where in the U.S., they must take theNCLEX® examination.
Key TermsRegistered Nurses (RN) and LicensedPractical or Vocational Nurses (LPN/VN)obtain licensure by endorsement (if licensedin another jurisdiction) or by examination (ifthe applicant has never taken the appropriateNCLEX® exam).
ACTIVE LICENSE figures are based on thereported actual or estimated total number ofindividuals holding an active license within ajurisdiction and represent the nurses avail-able for employment. Due to an unknownnumber of individuals holding active licensesin more than one jurisdiction, the total num-ber of active licenses nationwide may behigher than the total number of nurses.
ADVANCED PRACTICE LICENSES/AUTHORITYTO PRACTICE figures and tables contain datafor Advanced Practice Registered Nurse(APRN) groups: Certified Registered NurseAnesthetist (CRNA), Certified Nurse Midwife(CNM), Certified Nurse Specialist (CNS),CNS-Psych/Mental Health, and NursePractitioner (NP).
ABBREVIATIONS are followed by the category of advanced practice/authority topractice license:n CNM – Certified Nurse Midwifen CRNA – Certified Registered Nurse
Anesthetistn CNS-PSYCH – Clinical Nurse Specialist-
Psychiatry and/or Mental Health (includingall its subspecialties)
n CNS – Clinical Nurse Specialist (all others)
PART I2002 Licensure Statistics
National Council of State Boards of Nursing, Inc. (NCSBN) u 2003
4
2002 LICENSURE &EXAMINATION STATISTICS
Table 1. Boards of Nursing Empowered to License Registered Nurses, LicensedPractical/Vocational Nurses or Other Categories of Nursing Personnel
JD Board of Nursing RN LPN/ OtherLVN Specialty
Groups
AK Alaska Board of Nursing YES YES YES
AL Alabama Board of Nursing YES YES YES
AR Arkansas State Board of Nursing YES YES YES
AS American Samoa Health Service Regulatory Board YES YES YES
AZ Arizona State Board of Nursing YES YES YES
CARN California Board of Registered Nursing YES NO YES
CAVN California Board of Vocational Nurse and Psychiatric Technician Examiners NO YES NO
CO Colorado Board of Nursing YES YES YES
CT Connecticut Board of Examiners for Nursing YES YES YES
DC District of Columbia Board of Nursing YES YES YES
DE Delaware Board of Nursing YES YES YES
FL Florida Board of Nursing YES YES YES
GAPN Georgia State Board of Licensed Practical Nurses NO YES NO
GARN Georgia Board of Nursing YES NO YES
GU Guam Board of Nurse Examiners YES YES YES
HI Hawaii Board of Nursing Professional and Vocational Licensing Division YES YES YES
IA Iowa Board of Nursing YES YES YES
ID Idaho Board of Nursing YES YES YES
IL Illinois Department of Professional Regulation YES YES YES
IN Indiana State Board of Nursing YES YES YES
KS Kansas State Board of Nursing YES YES YES
KY Kentucky Board of Nursing YES YES YES
LAPN Louisiana State Board of Practical Nurse Examiners NO YES NO
LARN Louisiana State Board of Nursing YES NO YES
MA Massachusetts Board of Registration in Nursing YES YES YES
MD Maryland Board of Nursing YES YES YES
ME Maine State Board of Nursing YES YES YES
MI Michigan CIS/Bureau of Health Services YES YES YES
MN Minnesota Board of Nursing YES YES YES
MO Missouri State Board of Nursing YES YES YES
MP Northern Mariana Islands Commonwealth Board of Nurse Examiners YES YES YES
MS Mississippi Board of Nursing YES YES YES
MT Montana State Board of Nursing YES YES YES
NC North Carolina Board of Nursing YES YES YES
ND North Dakota Board of Nursing YES YES YES
NE Nebraska Health and Human Services System YES YES YES
National Council of State Boards of Nursing, Inc. (NCSBN) u 2003
5
PART I: 2002 LICENSURE STATISTICS
Table 1, continued
JD Board of Nursing RN LPN/ OtherLVN Specialty
Groups
NH New Hampshire Board of Nursing YES YES YES
NJ New Jersey Board of Nursing YES YES YES
NM New Mexico Board of Nursing YES YES YES
NV Nevada State Board of Nursing YES YES YES
NY New York State Board for Nursing YES YES YES
OH Ohio Board of Nursing YES YES YES
OK Oklahoma Board of Nursing YES YES YES
OR Oregon State Board of Nursing YES YES YES
PA Pennsylvania State Board of Nursing YES YES YES
PR Commonwealth of Puerto Rico Board of Nurse Examiners YES YES YES
RI Rhode Island Board of Nurse Registration and Nursing Education YES YES YES
SC South Carolina State Board of Nursing YES YES YES
SD South Dakota Board of Nursing YES YES YES
TN Tennessee State Board of Nursing YES YES YES
TXRN Texas Board of Nurse Examiners YES NO YES
TXVN Texas Board of Vocational Nurse Examiners NO YES NO
UT Utah State Board of Nursing YES YES YES
VA Virginia Board of Nursing YES YES YES
VI Virgin Islands Board of Nurse Licensure YES YES YES
VT Vermont State Board of Nursing YES YES YES
WA Washington State Nursing Care Quality Assurance Commission YES YES YES
WI Wisconsin Department of Regulation and Licensing YES YES YES
WVPN West Virginia State Board of Examiners for Licensed Practical Nurses NO YES NO
WVRN West Virginia Board of Examiners for Registered Professional Nurses YES NO YES
WY Wyoming State Board of Nursing YES YES YES
National Council of State Boards of Nursing, Inc. (NCSBN) u 2003
6
2002 LICENSURE &EXAMINATION STATISTICS
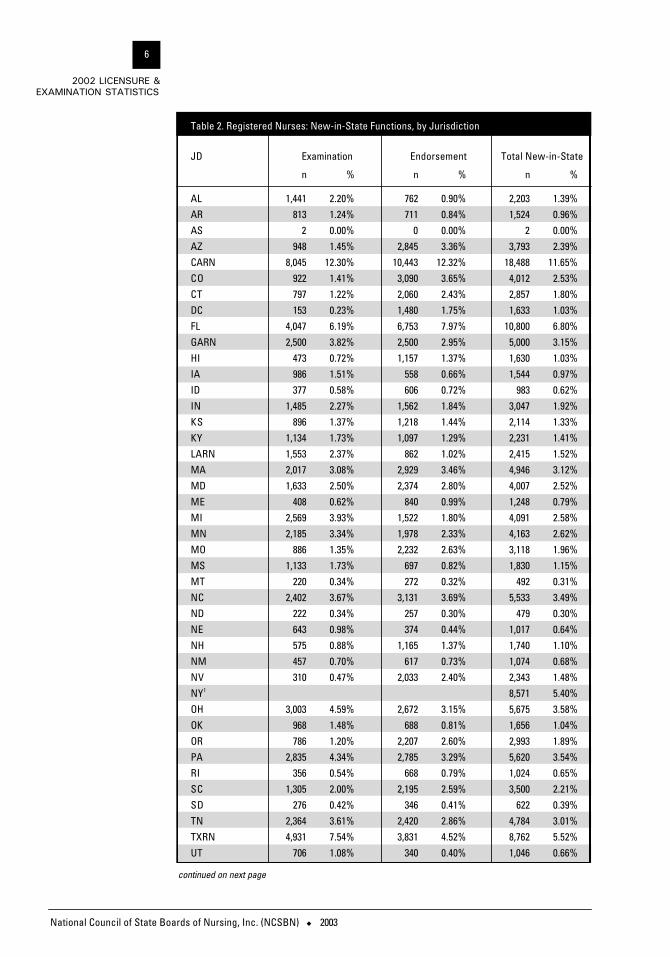
Table 2. Registered Nurses: New-in-State Functions, by Jurisdiction
JD Examination Endorsement Total New-in-State
n % n % n %
AL 1,441 2.20% 762 0.90% 2,203 1.39%AR 813 1.24% 711 0.84% 1,524 0.96%AS 2 0.00% 0 0.00% 2 0.00%AZ 948 1.45% 2,845 3.36% 3,793 2.39%CARN 8,045 12.30% 10,443 12.32% 18,488 11.65%CO 922 1.41% 3,090 3.65% 4,012 2.53%CT 797 1.22% 2,060 2.43% 2,857 1.80%DC 153 0.23% 1,480 1.75% 1,633 1.03%FL 4,047 6.19% 6,753 7.97% 10,800 6.80%GARN 2,500 3.82% 2,500 2.95% 5,000 3.15%HI 473 0.72% 1,157 1.37% 1,630 1.03%IA 986 1.51% 558 0.66% 1,544 0.97%ID 377 0.58% 606 0.72% 983 0.62%IN 1,485 2.27% 1,562 1.84% 3,047 1.92%KS 896 1.37% 1,218 1.44% 2,114 1.33%KY 1,134 1.73% 1,097 1.29% 2,231 1.41%LARN 1,553 2.37% 862 1.02% 2,415 1.52%MA 2,017 3.08% 2,929 3.46% 4,946 3.12%MD 1,633 2.50% 2,374 2.80% 4,007 2.52%ME 408 0.62% 840 0.99% 1,248 0.79%MI 2,569 3.93% 1,522 1.80% 4,091 2.58%MN 2,185 3.34% 1,978 2.33% 4,163 2.62%MO 886 1.35% 2,232 2.63% 3,118 1.96%MS 1,133 1.73% 697 0.82% 1,830 1.15%MT 220 0.34% 272 0.32% 492 0.31%NC 2,402 3.67% 3,131 3.69% 5,533 3.49%ND 222 0.34% 257 0.30% 479 0.30%NE 643 0.98% 374 0.44% 1,017 0.64%NH 575 0.88% 1,165 1.37% 1,740 1.10%NM 457 0.70% 617 0.73% 1,074 0.68%NV 310 0.47% 2,033 2.40% 2,343 1.48%NY1 8,571 5.40%OH 3,003 4.59% 2,672 3.15% 5,675 3.58%OK 968 1.48% 688 0.81% 1,656 1.04%OR 786 1.20% 2,207 2.60% 2,993 1.89%PA 2,835 4.34% 2,785 3.29% 5,620 3.54%RI 356 0.54% 668 0.79% 1,024 0.65%SC 1,305 2.00% 2,195 2.59% 3,500 2.21%SD 276 0.42% 346 0.41% 622 0.39%TN 2,364 3.61% 2,420 2.86% 4,784 3.01%TXRN 4,931 7.54% 3,831 4.52% 8,762 5.52%UT 706 1.08% 340 0.40% 1,046 0.66%
continued on next page
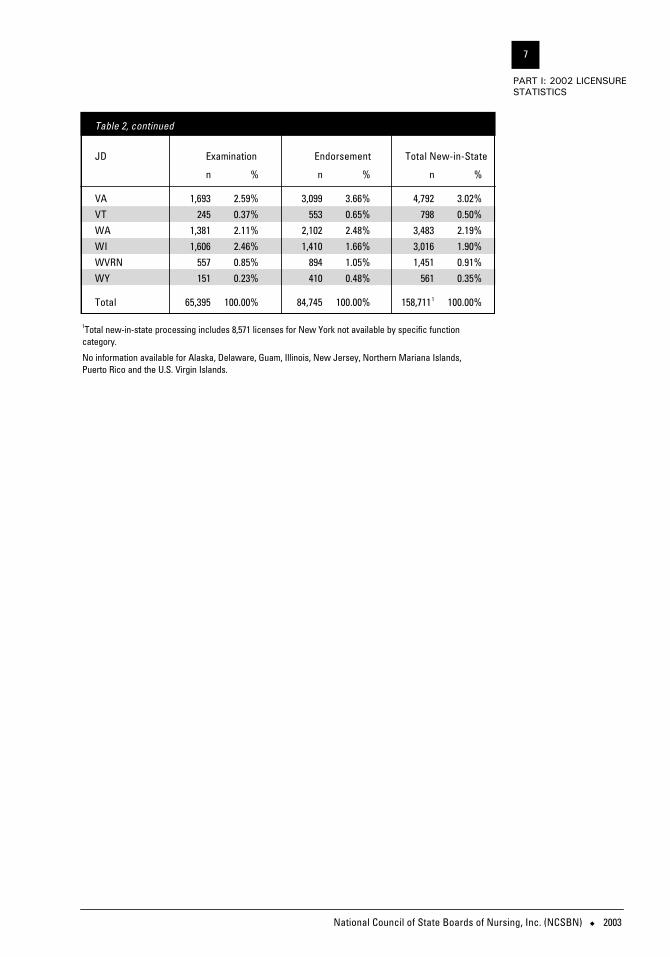
Table 2, continued
JD Examination Endorsement Total New-in-State
n % n % n %
VA 1,693 2.59% 3,099 3.66% 4,792 3.02%VT 245 0.37% 553 0.65% 798 0.50%WA 1,381 2.11% 2,102 2.48% 3,483 2.19%WI 1,606 2.46% 1,410 1.66% 3,016 1.90%WVRN 557 0.85% 894 1.05% 1,451 0.91%WY 151 0.23% 410 0.48% 561 0.35%
Total 65,395 100.00% 84,745 100.00% 158,7111 100.00%
National Council of State Boards of Nursing, Inc. (NCSBN) u 2003
7
PART I: 2002 LICENSURE STATISTICS
1Total new-in-state processing includes 8,571 licenses for New York not available by specific function category.
No information available for Alaska, Delaware, Guam, Illinois, New Jersey, Northern Mariana Islands, Puerto Rico and the U.S. Virgin Islands.

National Council of State Boards of Nursing, Inc. (NCSBN) u 2003
8
2002 LICENSURE &EXAMINATION STATISTICS
Table 3. Licensed Practical/Vocational Nurses: New-in-State Functions, by Jurisdiction
JD Examination Endorsement Total New-in-State
n % n % n %
AL 712 2.29% 197 1.42% 909 1.90%AR 646 2.08% 209 1.50% 855 1.79%AS 3 0.01% 0 0.00% 3 0.01%AZ 386 1.24% 413 2.97% 799 1.67%CAVN 3,762 12.12% 602 4.33% 4,364 9.12%CO 577 1.86% 353 2.54% 930 1.94%CT 331 1.07% 280 2.01% 611 1.28%DC 24 0.08% 274 1.97% 298 0.62%FL 1,919 6.18% 1,556 11.19% 3,475 7.26%GAPN 891 2.87% 771 5.54% 1,662 3.47%HI 73 0.24% 243 1.75% 316 0.66%IA 755 2.43% 154 1.11% 909 1.90%ID 187 0.60% 96 0.69% 283 0.59%IN 942 3.03% 328 2.36% 1,270 2.65%KS 566 1.82% 236 1.70% 802 1.68%KY 533 1.72% 309 2.22% 842 1.76%LAPN 799 2.57% 206 1.48% 1,005 2.10%MA 568 1.83% 131 0.94% 699 1.46%MD 363 1.17% 622 4.47% 985 2.06%ME 19 0.06% 105 0.75% 124 0.26%MI 1,059 3.41% 231 1.66% 1,290 2.70%MN 868 2.80% 154 1.11% 1,022 2.14%MO 1,233 3.97% 379 2.72% 1,612 3.37%MS 476 1.53% 166 1.19% 642 1.34%MT 111 0.36% 34 0.24% 145 0.30%NC 790 2.54% 556 4.00% 1,346 2.81%ND 130 0.42% 61 0.44% 191 0.40%NE 261 0.84% 71 0.51% 332 0.69%NH 223 0.72% 201 1.44% 424 0.89%NM 152 0.49% 112 0.81% 264 0.55%NV 45 0.14% 245 1.76% 290 0.61%NY1 2885 6.03%OH 1,577 5.08% 382 2.75% 1,959 4.09%OK 968 3.12% 164 1.18% 1,132 2.37%OR 229 0.74% 171 1.23% 400 0.84%PA 1,061 3.42% 375 2.70% 1,436 3.00%RI 24 0.08% 50 0.36% 74 0.15%SC 519 1.67% 367 2.64% 886 1.85%SD 61 0.20% 62 0.45% 123 0.26%TN 1,026 3.30% 700 5.03% 1,726 3.61%TXVN 3,259 10.50% 947 6.81% 4,206 8.79%UT 368 1.19% 59 0.42% 427 0.89%
continued on next page
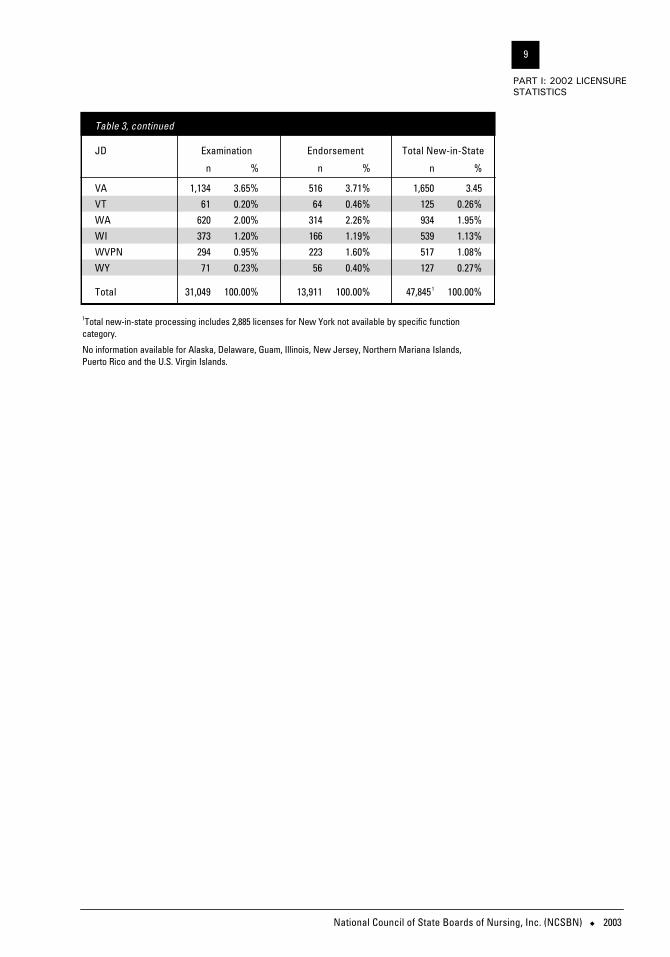
Table 3, continued
JD Examination Endorsement Total New-in-State
n % n % n %
VA 1,134 3.65% 516 3.71% 1,650 3.45VT 61 0.20% 64 0.46% 125 0.26%WA 620 2.00% 314 2.26% 934 1.95%WI 373 1.20% 166 1.19% 539 1.13%WVPN 294 0.95% 223 1.60% 517 1.08%WY 71 0.23% 56 0.40% 127 0.27%
Total 31,049 100.00% 13,911 100.00% 47,8451 100.00%
National Council of State Boards of Nursing, Inc. (NCSBN) u 2003
9
PART I: 2002 LICENSURE STATISTICS
1Total new-in-state processing includes 2,885 licenses for New York not available by specific function category.
No information available for Alaska, Delaware, Guam, Illinois, New Jersey, Northern Mariana Islands, Puerto Rico and the U.S. Virgin Islands.
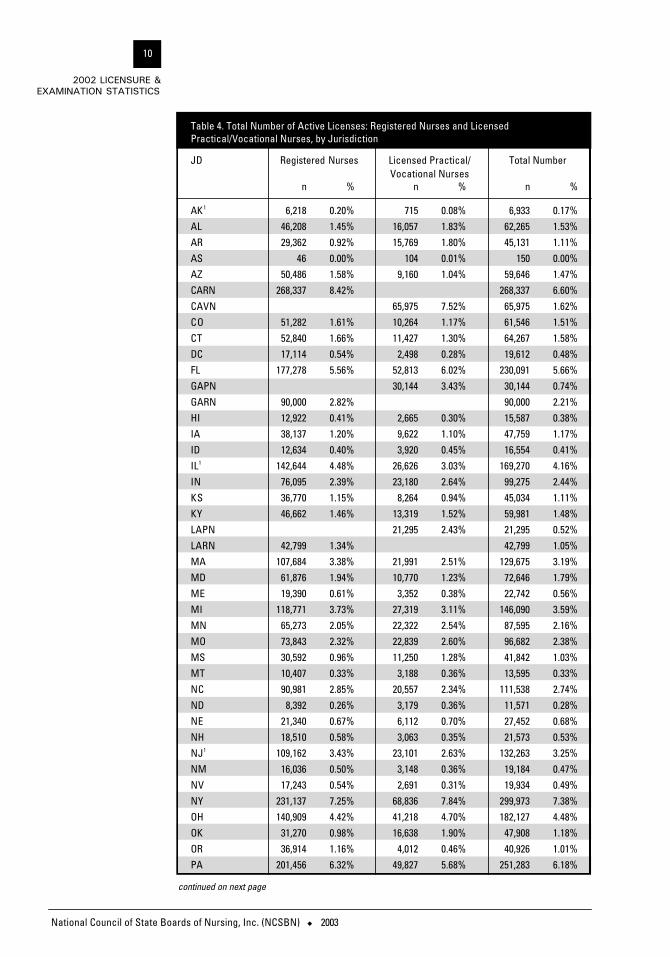
Table 4. Total Number of Active Licenses: Registered Nurses and LicensedPractical/Vocational Nurses, by Jurisdiction
JD Registered Nurses Licensed Practical/ Total NumberVocational Nurses
n % n % n %
AK1 6,218 0.20% 715 0.08% 6,933 0.17%AL 46,208 1.45% 16,057 1.83% 62,265 1.53%AR 29,362 0.92% 15,769 1.80% 45,131 1.11%AS 46 0.00% 104 0.01% 150 0.00%AZ 50,486 1.58% 9,160 1.04% 59,646 1.47%CARN 268,337 8.42% 268,337 6.60%CAVN 65,975 7.52% 65,975 1.62%CO 51,282 1.61% 10,264 1.17% 61,546 1.51%CT 52,840 1.66% 11,427 1.30% 64,267 1.58%DC 17,114 0.54% 2,498 0.28% 19,612 0.48%FL 177,278 5.56% 52,813 6.02% 230,091 5.66%GAPN 30,144 3.43% 30,144 0.74%GARN 90,000 2.82% 90,000 2.21%HI 12,922 0.41% 2,665 0.30% 15,587 0.38%IA 38,137 1.20% 9,622 1.10% 47,759 1.17%ID 12,634 0.40% 3,920 0.45% 16,554 0.41%IL1 142,644 4.48% 26,626 3.03% 169,270 4.16%IN 76,095 2.39% 23,180 2.64% 99,275 2.44%KS 36,770 1.15% 8,264 0.94% 45,034 1.11%KY 46,662 1.46% 13,319 1.52% 59,981 1.48%LAPN 21,295 2.43% 21,295 0.52%LARN 42,799 1.34% 42,799 1.05%MA 107,684 3.38% 21,991 2.51% 129,675 3.19%MD 61,876 1.94% 10,770 1.23% 72,646 1.79%ME 19,390 0.61% 3,352 0.38% 22,742 0.56%MI 118,771 3.73% 27,319 3.11% 146,090 3.59%MN 65,273 2.05% 22,322 2.54% 87,595 2.16%MO 73,843 2.32% 22,839 2.60% 96,682 2.38%MS 30,592 0.96% 11,250 1.28% 41,842 1.03%MT 10,407 0.33% 3,188 0.36% 13,595 0.33%NC 90,981 2.85% 20,557 2.34% 111,538 2.74%ND 8,392 0.26% 3,179 0.36% 11,571 0.28%NE 21,340 0.67% 6,112 0.70% 27,452 0.68%NH 18,510 0.58% 3,063 0.35% 21,573 0.53%NJ1 109,162 3.43% 23,101 2.63% 132,263 3.25%NM 16,036 0.50% 3,148 0.36% 19,184 0.47%NV 17,243 0.54% 2,691 0.31% 19,934 0.49%NY 231,137 7.25% 68,836 7.84% 299,973 7.38%OH 140,909 4.42% 41,218 4.70% 182,127 4.48%OK 31,270 0.98% 16,638 1.90% 47,908 1.18%OR 36,914 1.16% 4,012 0.46% 40,926 1.01%PA 201,456 6.32% 49,827 5.68% 251,283 6.18%
National Council of State Boards of Nursing, Inc. (NCSBN) u 2003
10
2002 LICENSURE &EXAMINATION STATISTICS
continued on next page
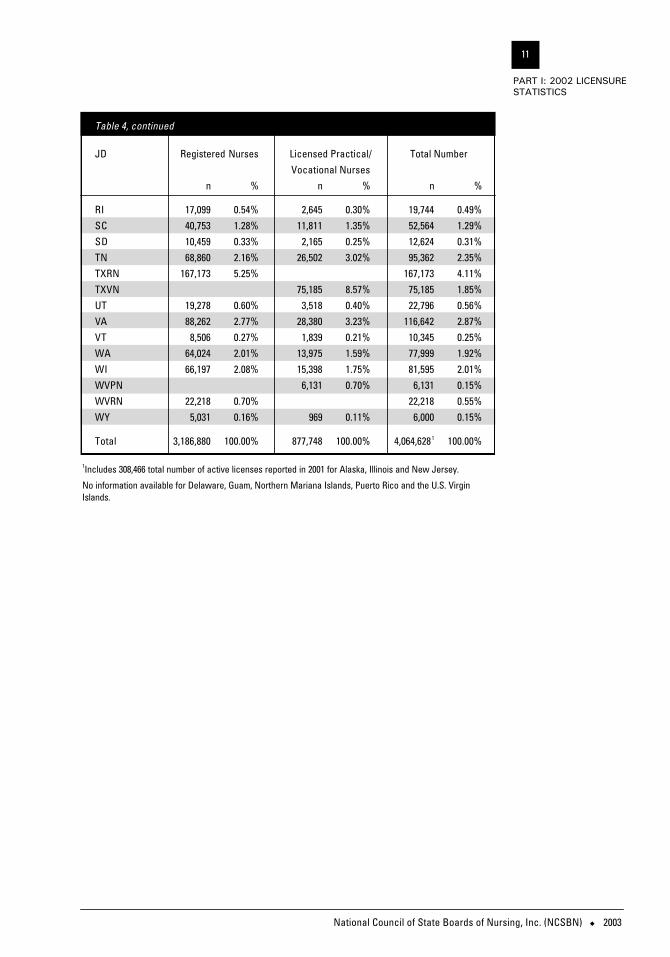
Table 4, continued
JD Registered Nurses Licensed Practical/ Total NumberVocational Nurses
n % n % n %
RI 17,099 0.54% 2,645 0.30% 19,744 0.49%SC 40,753 1.28% 11,811 1.35% 52,564 1.29%SD 10,459 0.33% 2,165 0.25% 12,624 0.31%TN 68,860 2.16% 26,502 3.02% 95,362 2.35%TXRN 167,173 5.25% 167,173 4.11%TXVN 75,185 8.57% 75,185 1.85%UT 19,278 0.60% 3,518 0.40% 22,796 0.56%VA 88,262 2.77% 28,380 3.23% 116,642 2.87%VT 8,506 0.27% 1,839 0.21% 10,345 0.25%WA 64,024 2.01% 13,975 1.59% 77,999 1.92%WI 66,197 2.08% 15,398 1.75% 81,595 2.01%WVPN 6,131 0.70% 6,131 0.15%WVRN 22,218 0.70% 22,218 0.55%WY 5,031 0.16% 969 0.11% 6,000 0.15%
Total 3,186,880 100.00% 877,748 100.00% 4,064,628 1 100.00%
National Council of State Boards of Nursing, Inc. (NCSBN) u 2003
11
PART I: 2002 LICENSURE STATISTICS
1Includes 308,466 total number of active licenses reported in 2001 for Alaska, Illinois and New Jersey.
No information available for Delaware, Guam, Northern Mariana Islands, Puerto Rico and the U.S. VirginIslands.
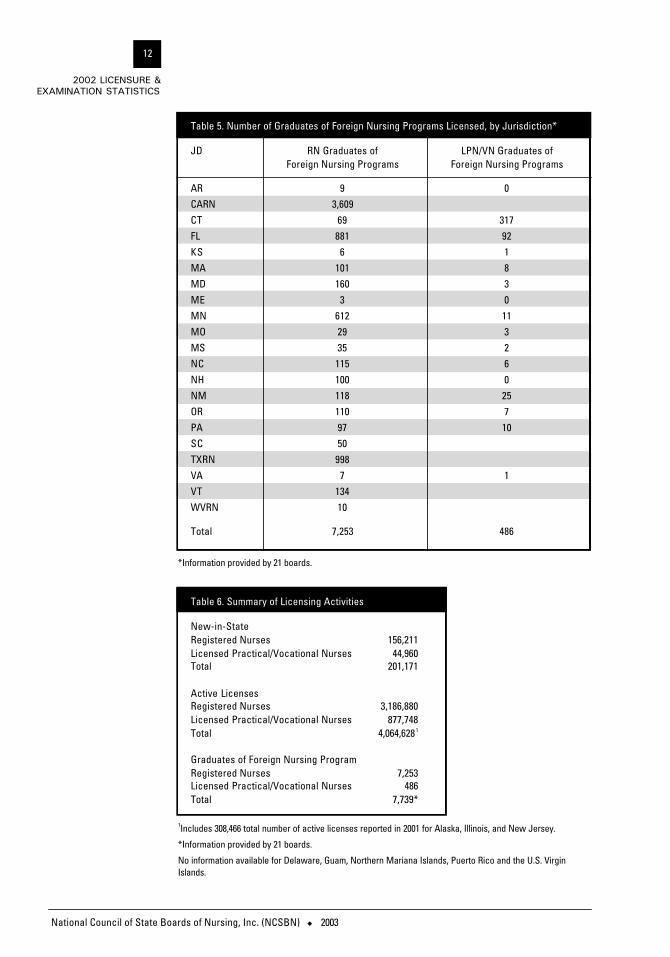
Table 6. Summary of Licensing Activities
New-in-StateRegistered Nurses 156,211Licensed Practical/Vocational Nurses 44,960Total 201,171
Active LicensesRegistered Nurses 3,186,880Licensed Practical/Vocational Nurses 877,748Total 4,064,628 1
Graduates of Foreign Nursing ProgramRegistered Nurses 7,253Licensed Practical/Vocational Nurses 486Total 7,739*
Table 5. Number of Graduates of Foreign Nursing Programs Licensed, by Jurisdiction*
JD RN Graduates of LPN/VN Graduates of Foreign Nursing Programs Foreign Nursing Programs
AR 9 0CARN 3,609CT 69 317FL 881 92KS 6 1MA 101 8MD 160 3ME 3 0MN 612 11MO 29 3MS 35 2NC 115 6NH 100 0NM 118 25OR 110 7PA 97 10SC 50TXRN 998VA 7 1VT 134WVRN 10
Total 7,253 486
National Council of State Boards of Nursing, Inc. (NCSBN) u 2003
12
2002 LICENSURE &EXAMINATION STATISTICS
*Information provided by 21 boards.
1Includes 308,466 total number of active licenses reported in 2001 for Alaska, Illinois, and New Jersey.
*Information provided by 21 boards.
No information available for Delaware, Guam, Northern Mariana Islands, Puerto Rico and the U.S. VirginIslands.
National Council of State Boards of Nursing, Inc. (NCSBN) u 2003
13
PART I: 2002 LICENSURE STATISTICS
Figu
re 1
. To
tal N
umbe
r of A
ctiv
e Li
cens
es: R
egis
tere
d N
urse
s an
d Li
cens
ed P
ract
ical
/Voc
atio
nal N
urse
s –
1992
-200
2
Number

Tabl
e 7.
Dis
trib
utio
n of
Act
ive
Adv
ance
d Pr
actic
e/A
utho
rity
to P
ract
ice
Lice
nses
With
in E
ach
Spec
ialty
Cat
egor
y, b
y Ju
risdi
ctio
n
CNS
Type
s of
Nur
se P
ract
ition
ers*
JDCN
MCR
NA
CNS
CNS
CNS
ACA
HCH
PCO
LEM
RFA
MFP
NGE
RN
EOW
OMPS
YSC
HN
POt
her
Tota
lPS
YCH
No
No
Type
sAc
tive
Desi
gnat
ion
Spec
ialty
Licen
ses
nn
nn
nn
nn
nn
nn
nn
nn
nn
nn
AL
431,
364
4410
092
159
119
762
2173
140
51
101
2,93
4AR
2862
786
561
1,30
2AS
20
01
00
00
00
40
00
00
00
7A
Z18
820
692
638
020
088
748
146
317
105
96
2,59
0CA
RN1,
085
1,56
70
1,61
40
00
00
00
00
00
011
,115
015
,381
CO26
838
288
02,
296
3,82
6DC
8118
019
1,04
11,
321
FL62
32,
445
214
1,25
855
82,
017
298
285
376
409
903
9,38
6GA
RN35
01,
375
325
00
00
00
00
00
00
02,
600
04,
650
IA60
365
114
551
164
371
345
159
194
11,
352
ID24
289
117
357
688
IN56
101
1,25
01,
407
KS41
612
51,
023
116
025
00
391
190
1918
40
3319
02,
352
KY11
287
411
526
3417
293
741
2213
151
101
52,
369
LARN
3399
710
320
039
4746
500
1399
671
9251
2,28
8M
A45
988
598
50
00
00
00
00
00
00
4,72
90
7,05
8M
D18
542
537
977
700
367
424
104
129
148
02,
938
ME
7438
215
917
515
783
20
395
617
2069
122
016
1,41
6M
I26
31,
908
2,47
74,
648
MN
163
1,44
021
915
727
344
281
00
594
021
272
254
01
02
3,76
6M
O93
1,28
313
129
029
356
313
00
1,15
90
8712
424
415
00
24,
126
MS
3245
10
030
4834
00
726
413
2445
150
00
1,42
2M
T38
142
2633
554
1N
C19
21,
933
1,16
745
325
185
21,
068
871
141
169
101
45,
321
ND
721
729
232
485
NE
2040
044
086
0
National Council of State Boards of Nursing, Inc. (NCSBN) u 2003
14
2002 LICENSURE &EXAMINATION STATISTICS

National Council of State Boards of Nursing, Inc. (NCSBN) u 2003
15
PART I: 2002 LICENSURE STATISTICS
NH
9422
911
176
850
139
70
2618
7512
02
00
1,23
4N
M23
813
259
496
4N
V90
361
451
NY
151
3,21
71,
330
13,
460
480
207
921
690
2877
10,5
62OH
260
1,77
41,
660
2,27
85,
972
OK30
409
140
916
8025
01
3412
60
01,
095
OR20
331
911
019
295
148
263
937
2614
327
32,
214
PA19
987
564
32
1,97
642
217
176
558
6039
063
55,
422
RI18
229
444
655
SC1,
550
SD12
317
683
210
120
017
10
1033
143
05
067
8TX
RN34
72,
467
332
1,04
512
739
662
20
462,
015
020
226
190
671
4537
8,91
9U
T10
617
50
00
00
00
00
00
00
090
80
1,18
9VA
214
1,47
547
682
515
431
241,
567
354
107
267
31
15,
220
VT60
8453
45
8427
00
156
013
742
21
538
WA
280
548
417
412
213
1,14
610
448
266
219
3,45
5W
I70
294
271
135
591
8914
159
650
1,68
8W
VRN
5556
80
878
4431
00
417
09
2054
02
015
1,31
0W
Y7
895
60
87
00
851
210
00
022
9To
tal
6,25
830
,007
5,91
55,
077
2,01
81,
217
10,4
766,
232
575
22,5
5310
22,
168
2,08
25,
710
2,06
914
129
,865
4,25
913
7,77
91
*See
Tab
le 8
for a
bbre
viat
ion
defin
ition
s, p
age
16.
1 Incl
udes
1,5
50 li
cens
es n
ot a
vaila
ble
by s
peci
alty
lice
nse
cate
gory
.

Table 8. Total Number of Active Specialty Licenses Within Member Board Jurisdictions
Abbreviation Category Active Licensesn %
CNM Certified Nurse Midwife 6,258 4.6%
CRNA Certified Registered Nurse Anesthetist 30,007 22.0%
CNS-PSYCH Clinical Nurse Specialist – Psychiatry and/or Mental Health (including all its subspecialties) 5,915 4.3%
CNS Clinical Nurse Specialist (all others) 5,077 3.7%
CNS-no designation Clinical Nurse Specialist (no designation) 2,018 1.5%
Nurse Practitioners
AC Acute Care 1,217 0.9%
AHP Adult Health 10,476 7.7%
CHP Child Health/Pediatric 6,232 4.6%
COL College Health 5 0.0%
EMR Emergency 75 0.1%
FAM Family 22,553 16.6%
FPN Family Planning 102 0.1%
GER Geriatric 2,168 1.6%
NEO Neonatal 2,082 1.5%
WOM Obstetrical and/or Gynecological and/or Women’s Health 5,710 4.2%
PSY Psychiatric and/or Mental Health 2,069 1.5%
SCH School Health 141 0.1%
NP Nurse Practitioner – no specialty designation 29,865 21.9%
OTS Other Specialty (unspecified) 4,259 3.1%
Total 136,2291 100.0%
National Council of State Boards of Nursing, Inc. (NCSBN) u 2003
16
2002 LICENSURE &EXAMINATION STATISTICS
1Excludes 1,550 licenses not available by specialty license category.
National Council of State Boards of Nursing, Inc. (NCSBN) u 2003
17
PART II: 2002 LICENSUREEXAM STATISTICS
The National Council LicensureExamination for Registered Nurses(NCLEX-RN® examination) and theNational Council LicensureExamination for Practical Nurses(NCLEX-PN® examination) areadministered to candidates on behalfof NCSBN ’s member boards. The purpose of the licensing examina-tion is to determine if a candidatepossesses the minimum knowledge,skills and abilities in order to pro-vide safe and effective nursing careat the entry level.
On April 1, 1994, NCSBN imple-mented the use of the NCLEX ®
examination via computerized adap-tive testing (CAT) for the NCLEX-RN
and NCLEX-PN examinations. CAT administration offers severaladvantages over the traditionalpaper-and-pencil testing. Theseadvantages include: greater measure-ment efficiency of a candidate’s ability level, shorter testing time,year-round testing and a less stressfulenvironment.
Computerized adaptive testingis a method for administration ofexaminations that uses current com-puter technology and measurementtheory. With CAT, each candidate’stest is unique: it is assembled inter-actively as the individual is tested.As the candidate answers each ques-tion, the computer calculates anability estimate based on all earlieranswers. The test questions, whichare stored in a large item bank and
classified by test plan area and levelof difficulty, are then scanned andthe question determined to measurethe candidate’s ability most preciselyin the appropriate test plan area is selected and presented on thecomputer screen. This process isrepeated for each question, creatingan examination tailored to the individual’s knowledge and skillswhile fulfilling all NCLEX test planrequirements. The examinationcontinues in this way until a pass/faildecision is made. CAT providesgreater measurement efficiency thanpaper-and-pencil testing, as itadministers only those questionsthat will offer the best measurementof the candidate’s ability.
The NCLEX licensure examina-tions assess the ability estimate ofthe candidate in reference to theestablished passing standard. Thepassing standard is the minimumlevel of knowledge and skill a candi-date must demonstrate in order toprovide safe and effective nursingcare. Those candidates who demon-strate ability above the passing standard will pass the examination,and those with abilities at or below below the standard will failthe examination. Thus, candidateperformance is presented as a pass/fail decision.
NCLEX examination pass/faildecisions are not based solely onhow many questions a candidateanswers correctly. They are also
PART II2002 Licensure ExaminationStatistics
National Council of State Boards of Nursing, Inc. (NCSBN) u 2003
18
2002 LICENSURE &EXAMINATION STATISTICS
based on the difficulty of the questions a candidate answers correctly. CAT administers questionswith difficulty levels so that eachcandidate will answer about half correctly; these questions providethe most information. Thus, all candidates answer about 50 percentcorrectly: passing candidates answer50 percent of the more difficultquestions correctly, and failing candidates answer 50 percent of theeasier questions correctly.
Even though candidates mayanswer different questions and dif-ferent numbers of questions, theNCLEX examination administeredusing CAT is fair to every candidate.All examinations conform to eitherthe NCLEX-RN® or NCLEX-PN® TestPlan which controls inclusion ofimportant nursing content, and allcandidates have ample opportunityto demonstrate true competence, asthe examination will not end untilstability of the pass/fail result isassured, a maximum length test istaken or time runs out.
The following statistics reportedare derived from NCSBN data. Thestatistical information is reported asfollows:1. Information regarding passing
performance by type of candidate,type of educational program,jurisdiction of education andcountry of education for foreign-educated nurses are reported on aquarterly basis.
2. Charts compare national passingrates for first-time, U.S.-educatedcandidates with all examinees,reported by quarters since 1994and in six-month time periodsprior to April 1994.
3. Annual summary statistics arereported for first-time, U.S.-educated candidates.
Definitions of selected statisticalterms are provided in Appendix A.
Tabl
e 1.
Num
ber o
f Can
dida
tes
Taki
ng N
CLEX
-PN
®Ex
amin
atio
n an
d Pe
rcen
t Pas
sing
, by
Type
of C
andi
date
NCL
EX-P
N®
Exam
inat
ion:
Jan
uary
1 –
Dec
embe
r 31,
200
2
Jan
1 - M
ar 3
1, 2
002
Apr 1
- Ju
n 30
, 200
2Ju
l 1 -
Sep
30, 2
002
Oct
1 -
Dec
31,
200
2To
tals
Type
of C
andi
date
n%
n%
n%
n%
n%
Firs
t-Ti
me,
U.S
.-Edu
cate
d 7,
176
84.5
%6,
534
84.8
%15
,537
88.0
%8,
978
86.7
%38
,225
86.5
%
Inva
lid P
rogr
am C
odes
2657
.7%
1968
.4%
2748
.1%
072
56.9
%
Type
Tot
al7,
202
84.4
%6,
553
84.8
%15
,564
87.9
%8,
978
86.7
%38
,297
86.4
%
Repe
at, U
.S.-E
duca
ted
2,03
244
.6%
2,08
042
.7%
2,23
143
.1%
1,77
846
.1%
8,12
144
.0%
Firs
t-Ti
me,
For
eign
-Edu
cate
d 41
753
.5%
433
59.4
%53
047
.7%
430
54.2
%1,
810
53.4
%
Repe
at, F
orei
gn-E
duca
ted
445
27.4
%42
623
.0%
542
27.1
%37
726
.7%
1,79
026
.1%
All C
andi
date
s10
,096
72.6
%9,
492
71.6
%18
,867
79.7
%11
,563
77.3
%50
,018
76.2
%
National Council of State Boards of Nursing, Inc. (NCSBN) u 2003
19
PART II: 2002 LICENSUREEXAM STATISTICS
Tabl
e 2.
Num
ber o
f Can
dida
tes
Exam
ined
and
Pas
sing
Rat
es fo
r Firs
t-Ti
me
Cand
idat
es E
duca
ted
in M
embe
r Boa
rd J
uris
dict
ions
1
NCL
EX-P
N®
Exam
inat
ion:
Jan
uary
1 –
Dec
embe
r 31
, 200
2
Jan
1 - M
ar 3
1, 2
002
Apr
1 -
Jun
30, 2
002
Jul 1
- Se
p 30
, 200
2Oc
t 1 -
Dec
31, 2
002
Juris
dict
ion
Cand
idat
esN
umbe
rPe
rcen
tCa
ndid
ates
Num
ber
Perc
ent
Cand
idat
esN
umbe
rPe
rcen
tCa
ndid
ates
Num
ber
Perc
ent
Exam
ined
Pass
edPa
ssed
Exam
ined
Pass
edPa
ssed
Exam
ined
Pass
edPa
ssed
Exam
ined
Pass
edPa
ssed
Ala
bam
a22
218
282
.0%
7457
77.0
%22
318
884
.3%
214
171
79.9
%A
lask
a0
00.
0*0
00.
0*0
00.
0*0
00.
0*A
mer
ican
Sam
oa0
00.
0*0
00.
0*0
00.
0*0
00.
0*Ar
izona
9890
91.8
%51
4792
.2%
205
193
94.2
%83
7894
.0%
Ark
ansa
s18
015
787
.2%
6562
95.4
%33
229
187
.7%
105
9287
.6%
Calif
orni
a84
966
478
.2%
855
601
70.3
%92
165
871
.4%
690
534
77.4
%Co
lora
do11
310
290
.3%
9388
94.6
%30
528
493
.1%
7572
96.0
%Co
nnec
ticut
99
100.
0%24
823
896
.0%
109
9889
.9%
5049
98.0
%De
law
are
108
80.0
%4
410
0.0%
9982
82.8
%3
266
.7%
Dis
tric
t of C
olum
bia
167
7041
.9%
171
8549
.7%
172
6940
.1%
158
9660
.8%
Flor
ida
418
353
84.4
%63
052
282
.9%
789
658
83.4
%44
737
684
.1%
Geo
rgia
260
229
88.1
%23
821
590
.3%
211
189
89.6
%28
425
991
.2%
Gua
m5
510
0.0%
22
100.
0%1
110
0.0%
00
0.0*
Haw
aii
1514
93.3
%23
2191
.3%
7164
90.1
%47
4391
.5%
Idah
o48
4593
.8%
1212
100.
0%54
5194
.4%
1615
93.8
%Ill
inoi
s17
214
584
.3%
130
116
89.2
%49
144
891
.2%
157
141
89.8
%In
dian
a24
621
788
.2%
115
109
94.8
%40
838
393
.9%
342
306
89.5
%Io
wa
113
106
93.8
%18
017
094
.4%
541
502
92.8
%90
7482
.2%
Kans
as92
8592
.4%
7665
85.5
%38
133
086
.6%
4644
95.7
%Ke
ntuc
ky18
216
992
.9%
129
107
82.9
%26
222
887
.0%
9676
79.2
%Lo
uisi
ana
256
208
81.3
%18
615
080
.6%
303
255
84.2
%13
611
886
.8%
Mai
ne1
110
0.0%
00
0.0*
119
81.8
%2
210
0.0%
Mar
ylan
d19
1789
.5%
66
100.
0%12
911
891
.5%
3130
96.8
%M
assa
chus
etts
3731
83.8
%17
1694
.1%
509
469
92.1
%60
5083
.3%
Mic
higa
n19
017
994
.2%
175
173
98.9
%45
944
496
.7%
177
162
91.5
%M
inne
sota
216
191
88.4
%65
6396
.9%
528
482
91.3
%83
6477
.1%
Mis
siss
ippi
104
7774
.0%
1311
84.6
%33
329
287
.7%
9273
79.3
%
National Council of State Boards of Nursing, Inc. (NCSBN) u 2003
20
2002 LICENSURE &EXAMINATION STATISTICS
National Council of State Boards of Nursing, Inc. (NCSBN) u 2003
21
PART II: 2002 LICENSUREEXAM STATISTICS
Mis
sour
i11
510
692
.2%
8469
82.1
%55
150
792
.0%
216
185
85.6
%M
onta
na28
2810
0.0%
2017
85.0
%76
6889
.5%
54
80.0
%N
ebra
ska
4640
87.0
%41
3892
.7%
152
144
94.7
%34
3294
.1%
Nev
ada
11
100.
0%2
210
0.0%
3231
96.9
%4
410
0.0%
New
Ham
pshi
re9
777
.8%
5353
100.
0%42
3992
.9%
1110
90.9
%N
ew J
erse
y74
6486
.5%
8168
84.0
%27
224
790
.8%
169
149
88.2
%N
ew M
exic
o4
410
0.0%
1412
85.7
%77
7597
.4%
3736
97.3
%N
ew Y
ork
435
343
78.9
%34
127
079
.2%
1,14
197
285
.2%
637
500
78.5
%N
orth
Car
olin
a18
818
698
.9%
4443
97.7
%43
440
292
.6%
9686
89.6
%N
orth
Dak
ota
4946
93.9
%13
1310
0.0%
7775
97.4
%40
3690
.0%
Nor
ther
n M
aria
na
Isla
nds
00
0.0*
00
0.0*
10
0.0%
00
0.0*
Ohi
o20
318
088
.7%
208
188
90.4
%1,
040
949
91.3
%41
237
290
.3%
Okla
hom
a14
812
483
.8%
135
113
83.7
%63
656
889
.3%
154
119
77.3
%Or
egon
2222
100.
0%53
5310
0.0%
145
145
100.
0%62
6210
0.0%
Penn
sylv
ania
276
216
78.3
%24
520
081
.6%
329
300
91.2
%53
047
689
.8%
Puer
to R
ico
41
25.0
%12
325
.0%
82
25.0
%5
00.0
%Rh
ode
Isla
nd1
110
0.0%
00
0.0*
1613
81.3
%3
310
0.0%
Sout
h Ca
rolin
a10
792
86.0
%60
5388
.3%
269
241
89.6
%59
5288
.1%
Sout
h Da
kota
33
100.
0%0
00.
0*67
6597
.0%
77
100.
0%Te
nnes
see
146
137
93.8
%35
432
190
.7%
244
204
83.6
%49
145
993
.5%
Texa
s78
967
385
.3%
524
471
89.9
%50
243
987
.5%
1,82
31,
638
89.9
%Ut
ah12
111
796
.7%
165
162
98.2
%27
526
295
.3%
6663
95.5
%Ve
rmon
t2
210
0.0%
00
0.0*
7977
97.5
%3
310
0.0%
Virg
in Is
land
s, U
.S.
00
0.0*
20
0.0%
20
0.0%
00
0.0*
Virg
inia
140
9567
.9%
319
256
80.3
%48
838
378
.5%
226
183
81.0
%W
ashi
ngto
n12
011
293
.3%
132
130
98.5
%28
526
793
.7%
248
237
95.6
%W
est V
irgin
ia46
4495
.7%
1010
100.
0%20
718
991
.3%
9892
93.9
%W
isco
nsin
7062
88.6
%60
5286
.7%
185
167
90.3
%52
4688
.5%
Wyo
min
g7
710
0.0%
44
100.
0%58
5493
.1%
65
83.3
%
Tota
l7,
176
6,06
784
.5%
6,53
45,
541
84.8
%15
,537
13,6
7188
.0%
8,97
87,
786
86.7
%
1 Does
not
incl
ude
inva
lid p
rogr
am c
odes
.
*No
cand
idat
es te
sted
.

Tabl
e 3.
Num
ber o
f Firs
t-Ti
me
Cand
idat
es N
ot E
duca
ted
in M
embe
r Boa
rd J
uris
dict
ions
Tak
ing
NCL
EX-P
N®
Exam
inat
ion
and
Perc
ent P
assi
ng
NCL
EX-P
N®
Exam
inat
ion
: Jan
uary
1 –
Dec
embe
r 31,
200
2
Jan
1 - M
ar 3
1, 2
002
Apr
1 -
Jun
30, 2
002
Jul 1
- Se
p 30
, 200
2Oc
t 1 -
Dec
31, 2
002
Coun
try o
f Edu
catio
nCa
ndid
ates
N
umbe
rPe
rcen
tCa
ndid
ates
Num
ber
Perc
ent
Cand
idat
esN
umbe
rPe
rcen
tCa
ndid
ates
Num
ber
Perc
ent
Exam
ined
Pass
edPa
ssed
Exam
ined
Pass
edPa
ssed
Exam
ined
Pass
edPa
ssed
Exam
ined
Pass
edPa
ssed
Arg
entin
a1
110
0.0%
Arm
enia
21
50.0
%3
133
.3%
31
33.3
%1
00.
0%B
angl
ades
h1
110
0.0%
Bela
rus
10
0.0%
Beliz
e (B
ritis
h H
ondu
ras)
11
100.
0%Bo
livia
10
0.0%
Bos
nia
and
Herz
egov
ina
20
0.0%
11
100.
0%2
210
0.0%
11
100.
0%Br
azil
10
0.0%
Briti
sh W
est I
ndie
s1
00.
0%B
ulga
ria1
00.
0%1
110
0.0%
Cam
eroo
n, F
ree
Repu
blic
of
10
0.0%
Cana
da10
1010
0.0%
128
66.7
%12
866
.7%
85
62.5
%Ca
pe V
erde
Isla
nds
11
100.
0%Ch
ina,
Peo
ples
Re
publ
ic o
f13
538
.5%
106
60.0
%20
630
.0%
179
52.9
%Co
lom
bia
10
0.0%
11
100.
0%1
00.
0%1
00.
0%Co
sta
Rica
10
0.0%
10
0.0%
Croa
tia1
00.
0%Cu
ba4
375
.0%
102
20.0
%Cz
ech
Repu
blic
11
100.
0%D
omin
ican
Rep
ublic
11
100.
0%Ec
uado
r1
110
0.0%
Egyp
t, Ar
ab
Repu
blic
of
10
0.0%
10
0.0%
El S
alva
dor
10
0.0%
10
0.0%
11
100.
0%Er
itrea
10
0.0%
10
0.0%
Ethi
opia
10
0.0%
10
0.0%
Fiji
Isla
nds
11
100.
0%Fi
nlan
d1
00.
0%
National Council of State Boards of Nursing, Inc. (NCSBN) u 2003
22
2002 LICENSURE &EXAMINATION STATISTICS

Fran
ce2
210
0.0%
Gam
bia
11
100.
0%1
00.0
%1
00.0
%G
erm
any
(Uni
ted)
21
50.0
%G
hana
22
100.
0%4
250
.0%
Gree
ce1
110
0.0%
Gua
tem
ala
10
0.0%
Guy
ana
11
100.
0%2
210
0.0%
32
66.7
%Ha
iti21
628
.6%
154
26.7
%37
924
.3%
225
22.7
%H
ondu
ras
11
100.
0%H
ong
Kong
11
100.
0%2
150
.0%
Indi
a36
2055
.6%
3217
53.1
%26
1038
.5%
2815
53.6
%In
done
sia
30
0.0%
Iran
42
50.0
%2
00.0
%1
110
0.0%
Irel
and
11
100.
0%Ita
ly1
110
0.0%
Jam
aica
11
100.
0%1
110
0.0%
31
33.3
%Ja
pan
22
100.
0%1
110
0.0%
Kaza
khst
an1
110
0.0%
Keny
a3
133
.3%
73
42.9
%3
266
.7%
10
0.0%
Kore
a (S
outh
)4
00.0
%3
266
.7%
21
50.0
%1
110
0.0%
Laos
10
0.0%
Leba
non
11
100.
0%1
00.0
%Li
beria
11
100.
0%1
00.0
%Li
thua
nia
10
0.0%
Mac
edon
ia, F
orm
er
Yugl
osla
v Re
publ
ic o
f1
00.0
%1
110
0.0%
10
0.0%
Mal
awi
10
0.0%
Mex
ico
21
50.0
%1
00.0
%3
133
.3%
31
33.3
%M
oldo
va1
00.0
%1
110
0.0%
22
100.
0%N
ethe
rland
s1
110
0.0%
Nic
arag
ua1
00.0
%1
00.0
%2
00.0
%N
iger
10
0.0%
Nig
eria
138
61.5
%12
866
.7%
176
35.3
%16
1487
.5%
Paki
stan
10
0.0%
10
0.0%
Pala
u1
00.0
%Pe
ru1
00.0
%1
110
0.0%
20
0.0%
Phili
ppin
es26
315
458
.6%
277
173
62.5
%32
516
249
.8%
264
152
57.6
%
National Council of State Boards of Nursing, Inc. (NCSBN) u 2003
23
PART II: 2002 LICENSUREEXAM STATISTICS
cont
inue
d on
nex
t pag
e

Tabl
e 3,
con
tinue
d
Jan
1 - M
ar 3
1, 2
002
Apr
1 -
Jun
30, 2
002
Jul 1
- Se
p 30
, 200
2Oc
t 1 -
Dec
31, 2
002
Coun
try o
f Edu
catio
nCa
ndid
ates
N
umbe
rPe
rcen
tCa
ndid
ates
Num
ber
Perc
ent
Cand
idat
esN
umbe
rPe
rcen
tCa
ndid
ates
Num
ber
Perc
ent
Exam
ined
Pass
edPa
ssed
Exam
ined
Pass
edPa
ssed
Exam
ined
Pass
edPa
ssed
Exam
ined
Pass
edPa
ssed
Pola
nd2
150
.0%
42
50.0
%3
266
.7%
32
66.7
%Po
rtug
al1
00.0
%Ro
man
ia3
00.0
%3
310
0.0%
43
75.0
%2
210
0.0%
Russ
ian
Fede
ratio
n3
133
.3%
31
33.3
%8
562
.5%
32
66.7
%Sa
nta
Cruz
Isla
nd1
110
0.0%
Sier
ra L
eone
20
0.0%
21
50.0
%Si
ngap
ore
11
100.
0%Sl
ovak
Rep
ublic
11
100.
0%So
uth
Afr
ica
11
100.
0%St
. Luc
ia1
110
0.0%
St. V
ince
nt1
00.0
%Ta
iwan
(Rep
ublic
of
Chi
na)
112
18.2
%3
266
.7%
95
55.6
%4
125
.0%
Tajik
ista
n1
110
0.0%
Tanz
ania
, Uni
ted
Repu
blic
of
31
33.3
%Th
aila
nd1
110
0.0%
21
50.0
%2
00.0
%Tr
inid
ad a
nd T
obag
o4
250
.0%
Uga
nda
10
0.0%
10
0.0%
Ukr
aine
11
100.
0%2
00.0
%7
685
.7%
31
33.3
%U
nite
d Ki
ngdo
m4
375
.0%
22
100.
0%2
150
.0%
11
100.
0%U
zbek
ista
n4
125
.0%
32
66.7
%4
125
.0%
Vene
zuel
a1
110
0.0%
Yugo
slav
ia/F
orm
er2
150
.0%
11
100.
0%Za
ire1
00.0
%Za
mbi
a1
110
0.0%
11
100.
0%Zi
mba
bwe
11
100.
0%1
110
0.0%
11
100.
0%
Tota
l41
722
353
.5%
433
257
59.4
%53
025
347
.7%
430
233
54.2
%
National Council of State Boards of Nursing, Inc. (NCSBN) u 2003
24
2002 LICENSURE &EXAMINATION STATISTICS
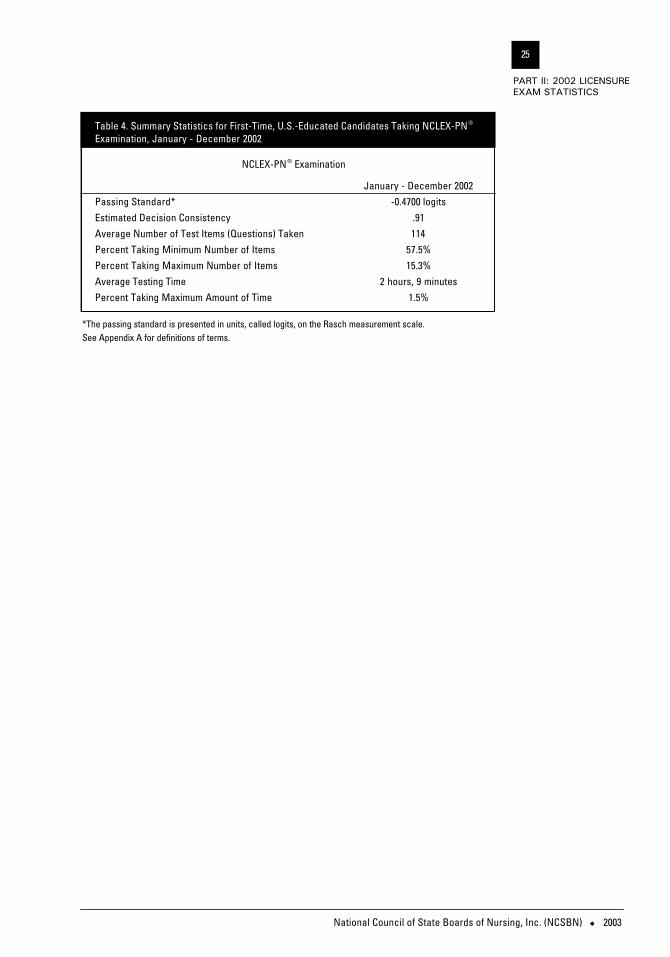
Table 4. Summary Statistics for First-Time, U.S.-Educated Candidates Taking NCLEX-PN ®
Examination, January - December 2002
NCLEX-PN® Examination
January - December 2002Passing Standard* -0.4700 logitsEstimated Decision Consistency .91Average Number of Test Items (Questions) Taken 114Percent Taking Minimum Number of Items 57.5%Percent Taking Maximum Number of Items 15.3%Average Testing Time 2 hours, 9 minutesPercent Taking Maximum Amount of Time 1.5%
National Council of State Boards of Nursing, Inc. (NCSBN) u 2003
25
PART II: 2002 LICENSUREEXAM STATISTICS
*The passing standard is presented in units, called logits, on the Rasch measurement scale.See Appendix A for definitions of terms.
National Council of State Boards of Nursing, Inc. (NCSBN) u 2003
26
2002 LICENSURE &EXAMINATION STATISTICS
Figu
re 1
. Nat
iona
l Pas
sing
Rat
e: L
icen
sed
Prac
tical
/Voc
atio
nal N
urse
s, 1
992-
1996
Mon
th/Y
ear
Adm
inis
tere
d
*Las
t pap
er-a
nd-p
enci
l exa
min
atio
n/pa
ssin
g st
anda
rd c
hang
e fro
m -0
.630
0 to
-0.5
600
logi
ts**
Pass
ing
stan
dard
cha
nge
from
-0.5
600
to -0
.510
0 lo
gits
nFi
rst-T
ime,
U.S
.-Edu
cate
d
nAl
l Exa
min
ees
Percent Passing
National Council of State Boards of Nursing, Inc. (NCSBN) u 2003
27
PART II: 2002 LICENSUREEXAM STATISTICS
Figu
re 2
. Nat
iona
l Pas
sing
Rat
e: L
icen
sed
Prac
tical
/Voc
atio
nal N
urse
s, 1
997-
1999
Mon
th/Y
ear
Adm
inis
tere
d
nFi
rst-T
ime,
U.S
.-Edu
cate
d
nAl
l Exa
min
ees
*Pas
sing
sta
ndar
d ch
ange
from
-0.5
100
to -0
.470
0 lo
gits
Percent Passing
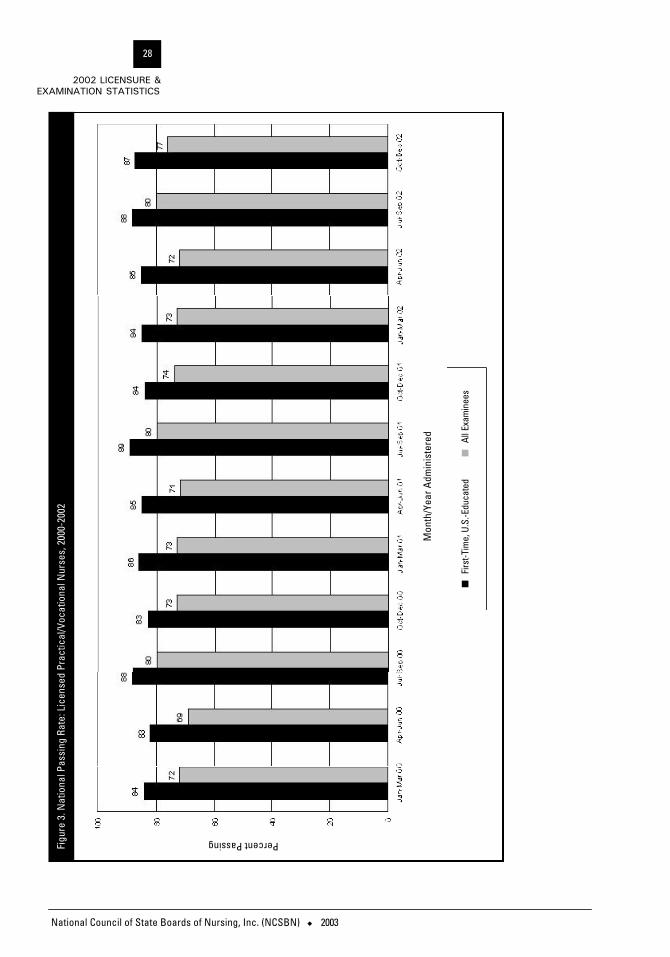
Figu
re 3
. Nat
iona
l Pas
sing
Rat
e: L
icen
sed
Prac
tical
/Voc
atio
nal N
urse
s, 2
000-
2002
National Council of State Boards of Nursing, Inc. (NCSBN) u 2003
28
2002 LICENSURE &EXAMINATION STATISTICS
Mon
th/Y
ear A
dmin
iste
red
nFi
rst-T
ime,
U.S
.-Edu
cate
d
nAl
l Exa
min
ees
Percent Passing

National Council of State Boards of Nursing, Inc. (NCSBN) u 2003
29
PART II: 2002 LICENSUREEXAM STATISTICS
Tabl
e 5.
Num
ber o
f Can
dida
tes
Taki
ng N
CLEX
-RN®
Exam
inat
ion
and
Perc
ent P
assi
ng, b
y Ty
pe o
f Can
dida
te
NCL
EX-R
N®
Exam
inat
ion:
Jan
uary
1 –
Dec
embe
r 31,
200
2
Jan
1 - M
ar 3
1, 2
002
Apr
1 -
Jun
30, 2
002
Jul 1
- Se
p 30
, 200
2Oc
t 1 -
Dec
31, 2
002
Tota
ls
Type
of C
andi
date
n%
n%
n%
n%
n%
Firs
t-Ti
me,
U.S
.-Edu
cate
d
Dip
lom
a55
285
.333
687
.21,
336
86.8
201
84.6
2,42
586
.3
Ass
ocia
te D
egre
e7,
717
86.3
8,58
988
.823
,408
86.9
2,66
878
.542
,382
86.7
Bac
cala
urea
te D
egre
e4,
912
87.6
4,11
388
.615
,411
86.7
1,38
577
.725
,821
86.7
Inva
lid/S
peci
al P
rogr
am C
odes
955
.68
62.5
1693
.831
74.2
6475
.0
Type
Tot
al13
,190
86.7
13,0
4688
.740
,171
86.8
4,28
578
.570
,692
86.7
Repe
at, U
.S.-E
duca
ted
4,19
948
.84,
142
49.8
3,99
349
.55,
430
56.9
17,7
6451
.7
Firs
t-Ti
me,
For
eign
-Edu
cate
d 2,
561
54.9
3,18
055
.44,
276
53.2
2,74
559
.212
,762
55.4
Repe
at, F
orei
gn-E
duca
ted
2,85
122
.93,
242
25.0
4,20
624
.82,
435
23.5
12,7
3424
.2
All C
andi
date
s22
,801
68.2
23,6
1068
.652
,646
76.3
14,8
9558
.111
3,95
270
.7

National Council of State Boards of Nursing, Inc. (NCSBN) u 2003
30
2002 LICENSURE &EXAMINATION STATISTICS
Tabl
e 6.
Num
ber o
f Can
dida
tes
Exam
ined
and
Pas
sing
Rat
es fo
r Firs
t-Ti
me
Cand
idat
es E
duca
ted
in M
embe
r Boa
rd J
uris
dict
ions
, by
Deg
ree
Type
1
NCL
EX-R
N®
Exam
inat
ion:
Jan
uary
1 –
Mar
ch 3
1, 2
002
Tota
lD
iplo
ma
Ass
ocia
te D
egre
eB
acca
laur
eate
Deg
ree
Juris
dict
ion
Cand
idat
esN
umbe
rPe
rcen
tCa
ndid
ates
Num
ber
Perc
ent
Cand
idat
esN
umbe
rPe
rcen
tCa
ndid
ates
Num
ber
Perc
ent
Exam
ined
Pass
edPa
ssed
Exam
ined
Pass
edPa
ssed
Exam
ined
Pass
edPa
ssed
Exam
ined
Pass
edPa
ssed
Ala
bam
a33
828
784
.9%
00
0.0*
146
112
76.7
%19
217
591
.1%
Ala
ska
1412
85.7
%0
00.
0*1
110
0.0%
1311
84.6
%A
mer
ican
Sam
oa0
00.
0*0
00.
0*0
00.
0*0
00.
0*Ar
izona
344
311
90.4
%0
00.
0*20
118
089
.6%
143
131
91.6
%A
rkan
sas
226
199
88.1
%11
293
83.0
%99
9292
.9%
1514
93.3
%Ca
lifor
nia-
RN1,
138
983
86.4
%0
00.
0*85
674
587
.0%
282
238
84.4
%Co
lora
do18
916
687
.8%
00
0.0*
104
9086
.5%
8576
89.4
%Co
nnec
ticut
4847
97.9
%0
00.
0*2
150
.0%
4646
100.
0%D
elaw
are
5249
94.2
%0
00.
0*47
4493
.6%
55
100.
0%D
istr
ict o
f Col
umbi
a11
1090
.9%
00
0.0*
10
0.0%
1010
100.
0%Fl
orid
a51
745
788
.4%
00
0.0*
438
387
88.4
%79
7088
.6%
Geor
gia-
RN19
615
981
.1%
00
0.0*
6752
77.6
%12
910
782
.9%
Gua
m10
660
.0%
00
0.0*
11
100.
0%9
555
.6%
Haw
aii
4741
87.2
%0
00.
0*20
1785
.0%
2724
88.9
%Id
aho
2121
100.
0%0
00.
0*10
1010
0.0%
1111
100.
0%Ill
inoi
s52
245
086
.2%
00
0.0*
270
229
84.8
%25
222
187
.7%
Indi
ana
344
293
85.2
%5
510
0.0%
206
174
84.5
%13
311
485
.7%
Iow
a23
220
287
.1%
00
0.0*
180
152
84.4
%52
5096
.2%
Kans
as18
315
283
.1%
00
0.0*
8770
80.5
%96
8285
.4%
Kent
ucky
316
298
94.3
%0
00.
0*20
118
893
.5%
115
110
95.7
%Lo
uisi
ana-
RN54
249
691
.5%
2222
100.
0%24
822
490
.3%
272
250
91.9
%M
aine
4034
85.0
%0
00.
0*5
510
0.0%
3529
82.9
%M
aryl
and
274
239
87.2
%0
00.
0*16
214
690
.1%
112
9383
.0%
Mas
sach
uset
ts27
925
491
.0%
00
0.0*
158
141
89.2
%12
111
393
.4%
Mic
higa
n48
441
786
.2%
00
0.0*
290
251
86.6
%19
416
685
.6%
Min
neso
ta14
011
682
.9%
00
0.0*
9576
80.0
%45
4088
.9%
Mis
siss
ippi
270
211
78.1
%0
00.
0*20
615
776
.2%
6454
84.4
%

Mis
sour
i41
935
885
.4%
43
75.0
%24
721
185
.4%
168
144
85.7
%M
onta
na45
4395
.6%
00
0.0*
32
66.7
%42
4197
.6%
Neb
rask
a18
616
890
.3%
2322
95.7
%6
610
0.0%
157
140
89.2
%N
evad
a59
5389
.8%
00
0.0*
3835
92.1
%21
1885
.7%
New
Ham
pshi
re7
571
.4%
00
0.0*
64
66.7
%1
110
0.0%
New
Jer
sey
230
213
92.6
%96
9194
.8%
128
117
91.4
%6
583
.3%
New
Mex
ico
126
106
84.1
%0
00.
0*76
6686
.8%
5040
80.0
%N
ew Y
ork
767
646
84.2
%6
583
.3%
687
586
85.3
%74
5574
.3%
Nor
th C
arol
ina
179
154
86.0
%50
3774
.0%
5949
83.1
%70
6897
.1%
Nor
th D
akot
a47
4289
.4%
00
0.0*
00
0.0*
4742
89.4
%N
orth
ern
Mar
iana
Is
land
s0
00.
0*0
00.
0*0
00.
0*0
00.
0*O
hio
461
395
85.7
%41
3585
.4%
330
289
87.6
%90
7178
.9%
Okla
hom
a19
115
882
.7%
00
0.0*
175
146
83.4
%16
1275
.0%
Oreg
on33
2575
.8%
00
0.0*
75
71.4
%26
2076
.9%
Penn
sylv
ania
309
247
79.9
%10
887
80.6
%67
5277
.6%
134
108
80.6
%Pu
erto
Ric
o49
1020
.4%
00
0.0*
203
15.0
%29
724
.1%
Rhod
e Is
land
7055
78.6
%0
00.
0*46
4087
.0%
2415
62.5
%So
uth
Caro
lina
289
256
88.6
%0
00.
0*19
116
988
.5%
9887
88.8
%So
uth
Dako
ta37
3286
.5%
00
0.0*
20
0.0%
3532
91.4
%Te
nnes
see
346
324
93.6
%15
1493
.3%
7669
90.8
%25
524
194
.5%
Texa
s-RN
1,43
21,
235
86.2
%37
3389
.2%
743
631
84.9
%65
257
187
.6%
Utah
138
124
89.9
%0
00.
0*11
710
388
.0%
2121
100.
0%Ve
rmon
t2
210
0.0%
00
0.0*
11
100.
0%1
110
0.0%
Virg
in Is
land
s, U
.S.
00
0.0*
00
0.0*
00
0.0*
00
0.0*
Virg
inia
199
171
85.9
%33
2472
.7%
112
9786
.6%
5450
92.6
%W
ashi
ngto
n25
222
488
.9%
00
0.0*
136
124
91.2
%11
610
086
.2%
Wes
t Virg
inia
-RN
1917
89.5
%0
00.
0*9
888
.9%
109
90.0
%W
isco
nsin
502
451
89.8
%0
00.
0*32
429
390
.4%
178
158
88.8
%W
yom
ing
1010
100.
0%0
00.
0*10
1010
0.0%
00
0.0*
Tota
l13
,181
11,4
3486
.7%
552
471
85.3
%7,
717
6,66
186
.3%
4,91
24,
302
87.6
%
National Council of State Boards of Nursing, Inc. (NCSBN) u 2003
31
PART II: 2002 LICENSUREEXAM STATISTICS
*No
cand
idat
es te
sted
.1 Do
es n
ot in
clud
e in
valid
/spe
cial
pro
gram
cod
es.
National Council of State Boards of Nursing, Inc. (NCSBN) u 2003
32
2002 LICENSURE &EXAMINATION STATISTICS
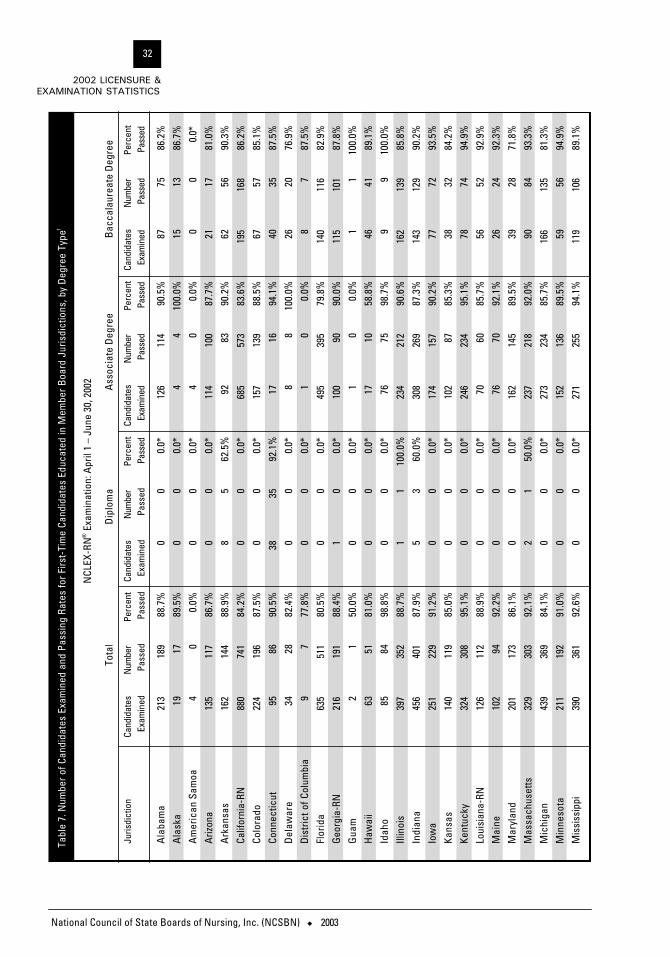
Tabl
e 7.
Num
ber o
f Can
dida
tes
Exam
ined
and
Pas
sing
Rat
es fo
r Firs
t-Ti
me
Cand
idat
es E
duca
ted
in M
embe
r Boa
rd J
uris
dict
ions
, by
Deg
ree
Type
1
NCL
EX-R
N®Ex
amin
atio
n: A
pril
1 –
June
30,
200
2
Tota
lD
iplo
ma
Ass
ocia
te D
egre
eB
acca
laur
eate
Deg
ree
Juris
dict
ion
Cand
idat
esN
umbe
rPe
rcen
tCa
ndid
ates
Num
ber
Perc
ent
Cand
idat
esN
umbe
rPe
rcen
tCa
ndid
ates
Num
ber
Perc
ent
Exam
ined
Pass
edPa
ssed
Exam
ined
Pass
edPa
ssed
Exam
ined
Pass
edPa
ssed
Exam
ined
Pass
edPa
ssed
Ala
bam
a21
318
988
.7%
00
0.0*
126
114
90.5
%87
7586
.2%
Ala
ska
1917
89.5
%0
00.
0*4
410
0.0%
1513
86.7
%A
mer
ican
Sam
oa4
00.
0%0
00.
0*4
00.
0%0
00.
0*Ar
izona
135
117
86.7
%0
00.
0*11
410
087
.7%
2117
81.0
%A
rkan
sas
162
144
88.9
%8
562
.5%
9283
90.2
%62
5690
.3%
Calif
orni
a-RN
880
741
84.2
%0
00.
0*68
557
383
.6%
195
168
86.2
%Co
lora
do22
419
687
.5%
00
0.0*
157
139
88.5
%67
5785
.1%
Conn
ectic
ut95
8690
.5%
3835
92.1
%17
1694
.1%
4035
87.5
%D
elaw
are
3428
82.4
%0
00.
0*8
810
0.0%
2620
76.9
%D
istr
ict o
f Col
umbi
a9
777
.8%
00
0.0*
10
0.0%
87
87.5
%Fl
orid
a63
551
180
.5%
00
0.0*
495
395
79.8
%14
011
682
.9%
Geor
gia-
RN21
619
188
.4%
10
0.0*
100
9090
.0%
115
101
87.8
%G
uam
21
50.0
%0
00.
0*1
00.
0%1
110
0.0%
Haw
aii
6351
81.0
%0
00.
0*17
1058
.8%
4641
89.1
%Id
aho
8584
98.8
%0
00.
0*76
7598
.7%
99
100.
0%Ill
inoi
s39
735
288
.7%
11
100.
0%23
421
290
.6%
162
139
85.8
%In
dian
a45
640
187
.9%
53
60.0
%30
826
987
.3%
143
129
90.2
%Io
wa
251
229
91.2
%0
00.
0*17
415
790
.2%
7772
93.5
%Ka
nsas
140
119
85.0
%0
00.
0*10
287
85.3
%38
3284
.2%
Kent
ucky
324
308
95.1
%0
00.
0*24
623
495
.1%
7874
94.9
%Lo
uisi
ana-
RN12
611
288
.9%
00
0.0*
7060
85.7
%56
5292
.9%
Mai
ne10
294
92.2
%0
00.
0*76
7092
.1%
2624
92.3
%M
aryl
and
201
173
86.1
%0
00.
0*16
214
589
.5%
3928
71.8
%M
assa
chus
etts
329
303
92.1
%2
150
.0%
237
218
92.0
%90
8493
.3%
Mic
higa
n43
936
984
.1%
00
0.0*
273
234
85.7
%16
613
581
.3%
Min
neso
ta21
119
291
.0%
00
0.0*
152
136
89.5
%59
5694
.9%
Mis
siss
ippi
390
361
92.6
%0
00.
0*27
125
594
.1%
119
106
89.1
%

Mis
sour
i18
616
488
.2%
33
100.
0%13
010
983
.8%
5352
98.1
%M
onta
na42
4095
.2%
00
0.0*
1818
100.
0%24
2291
.7%
Neb
rask
a28
827
394
.8%
21
50.0
%13
912
992
.8%
147
143
97.3
%N
evad
a64
5992
.2%
00
0.0*
4441
93.2
%20
1890
.0%
New
Ham
pshi
re54
5194
.4%
00
0.0*
3128
90.3
%23
2310
0.0%
New
Jer
sey
132
119
90.2
%56
4987
.5%
6762
92.5
%9
888
.9%
New
Mex
ico
5751
89.5
%0
00.
0*46
4189
.1%
1110
90.9
%N
ew Y
ork
729
595
81.6
%6
583
.3%
593
487
82.1
%13
010
379
.2%
Nor
th C
arol
ina
802
746
93.0
%16
1381
.3%
556
522
93.9
%23
021
191
.7%
Nor
th D
akot
a69
6898
.6%
00
0.0*
00
0.0*
6968
98.6
%N
orth
ern
Mar
iana
Is
land
s0
00.
0*0
00.
0*0
00.
0*0
00.
0*O
hio
631
590
93.5
%27
2696
.3%
392
364
92.9
%21
220
094
.3%
Okl
ahom
a29
726
789
.9%
00
0.0*
214
194
90.7
%83
7388
.0%
Ore
gon
267
250
93.6
%0
00.
0*13
612
692
.6%
131
124
94.7
%Pe
nnsy
lvan
ia25
920
779
.9%
8066
82.5
%83
6679
.5%
9675
78.1
%Pu
erto
Ric
o35
514
.3%
00
0.0*
162
12.5
%19
315
.8%
Rhod
e Is
land
4740
85.1
%7
710
0.0%
2422
91.7
%16
1168
.8%
Sout
h Ca
rolin
a50
946
891
.9%
00
0.0*
333
306
91.9
%17
616
292
.0%
Sout
h D
akot
a44
4193
.2%
00
0.0*
1413
92.9
%30
2893
.3%
Tenn
esse
e53
249
993
.8%
00
0.0*
345
326
94.5
%18
717
392
.5%
Texa
s-RN
853
759
89.0
%9
777
.8%
591
527
89.2
%25
322
588
.9%
Uta
h14
613
189
.7%
00
0.0*
104
9389
.4%
4238
90.5
%Ve
rmon
t17
1588
.2%
00
0.0*
65
83.3
%11
1090
.9%
Virg
in Is
land
s, U
.S.
00
0.0*
00
0.0*
00
0.0*
00
0.0*
Virg
inia
391
350
89.5
%75
7194
.7%
229
209
91.3
%87
7080
.5%
Was
hing
ton
175
158
90.3
%0
00.
0*12
111
090
.9%
5448
88.9
%W
est V
irgin
ia-R
N10
391
88.3
%0
00.
0*63
5587
.3%
4036
90.0
%W
isco
nsin
145
129
89.0
%0
00.
0*74
6891
.9%
7161
85.9
%W
yom
ing
2221
95.5
%0
00.
0*18
1794
.4%
44
100.
0%
Tota
l13
,038
11,5
6388
.7%
336
293
87.2
%8,
589
7,62
488
.8%
4,11
33,
646
88.6
%
National Council of State Boards of Nursing, Inc. (NCSBN) u 2003
33
PART II: 2002 LICENSUREEXAM STATISTICS
*No
cand
idat
es te
sted
.1 Do
es n
ot in
clud
e in
valid
/spe
cial
pro
gram
cod
es.
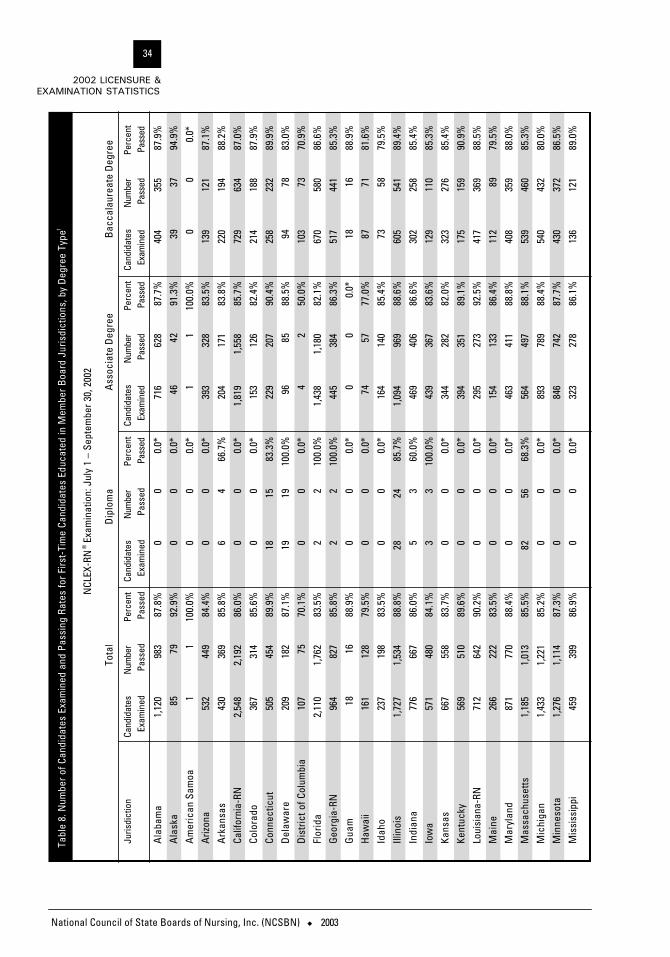
National Council of State Boards of Nursing, Inc. (NCSBN) u 2003
34
2002 LICENSURE &EXAMINATION STATISTICS
Tabl
e 8.
Num
ber o
f Can
dida
tes
Exam
ined
and
Pas
sing
Rat
es fo
r Firs
t-Ti
me
Cand
idat
es E
duca
ted
in M
embe
r Boa
rd J
uris
dict
ions
, by
Deg
ree
Type
1
NCL
EX-R
N®
Exam
inat
ion:
Jul
y 1
– Se
ptem
ber 3
0, 2
002
Tota
lD
iplo
ma
Ass
ocia
te D
egre
eB
acca
laur
eate
Deg
ree
Juris
dict
ion
Cand
idat
esN
umbe
rPe
rcen
tCa
ndid
ates
Num
ber
Perc
ent
Cand
idat
esN
umbe
rPe
rcen
tCa
ndid
ates
Num
ber
Perc
ent
Exam
ined
Pass
edPa
ssed
Exam
ined
Pass
edPa
ssed
Exam
ined
Pass
edPa
ssed
Exam
ined
Pass
edPa
ssed
Ala
bam
a1,
120
983
87.8
%0
00.
0*71
662
887
.7%
404
355
87.9
%A
lask
a85
7992
.9%
00
0.0*
4642
91.3
%39
3794
.9%
Am
eric
an S
amoa
11
100.
0%0
00.
0*1
110
0.0%
00
0.0*
Arizo
na53
244
984
.4%
00
0.0*
393
328
83.5
%13
912
187
.1%
Ark
ansa
s43
036
985
.8%
64
66.7
%20
417
183
.8%
220
194
88.2
%Ca
lifor
nia-
RN2,
548
2,19
286
.0%
00
0.0*
1,81
91,
558
85.7
%72
963
487
.0%
Colo
rado
367
314
85.6
%0
00.
0*15
312
682
.4%
214
188
87.9
%Co
nnec
ticut
505
454
89.9
%18
1583
.3%
229
207
90.4
%25
823
289
.9%
Del
awar
e20
918
287
.1%
1919
100.
0%96
8588
.5%
9478
83.0
%D
istr
ict o
f Col
umbi
a10
775
70.1
%0
00.
0*4
250
.0%
103
7370
.9%
Flor
ida
2,11
01,
762
83.5
%2
210
0.0%
1,43
81,
180
82.1
%67
058
086
.6%
Geor
gia-
RN96
482
785
.8%
22
100.
0%44
538
486
.3%
517
441
85.3
%G
uam
1816
88.9
%0
00.
0*0
00.
0*18
1688
.9%
Haw
aii
161
128
79.5
%0
00.
0*74
5777
.0%
8771
81.6
%Id
aho
237
198
83.5
%0
00.
0*16
414
085
.4%
7358
79.5
%Ill
inoi
s1,
727
1,53
488
.8%
2824
85.7
%1,
094
969
88.6
%60
554
189
.4%
Indi
ana
776
667
86.0
%5
360
.0%
469
406
86.6
%30
225
885
.4%
Iow
a57
148
084
.1%
33
100.
0%43
936
783
.6%
129
110
85.3
%Ka
nsas
667
558
83.7
%0
00.
0*34
428
282
.0%
323
276
85.4
%Ke
ntuc
ky56
951
089
.6%
00
0.0*
394
351
89.1
%17
515
990
.9%
Loui
sian
a-RN
712
642
90.2
%0
00.
0*29
527
392
.5%
417
369
88.5
%M
aine
266
222
83.5
%0
00.
0*15
413
386
.4%
112
8979
.5%
Mar
ylan
d87
177
088
.4%
00
0.0*
463
411
88.8
%40
835
988
.0%
Mas
sach
uset
ts1,
185
1,01
385
.5%
8256
68.3
%56
449
788
.1%
539
460
85.3
%M
ichi
gan
1,43
31,
221
85.2
%0
00.
0*89
378
988
.4%
540
432
80.0
%M
inne
sota
1,27
61,
114
87.3
%0
00.
0*84
674
287
.7%
430
372
86.5
%M
issi
ssip
pi45
939
986
.9%
00
0.0*
323
278
86.1
%13
612
189
.0%

Mis
sour
i93
082
188
.3%
1111
100.
0%50
944
286
.8%
410
368
89.8
%M
onta
na14
112
286
.5%
00
0.0*
8671
82.6
%55
5192
.7%
Neb
rask
a19
217
189
.1%
3835
92.1
%37
3081
.1%
117
106
90.6
%N
evad
a13
011
487
.7%
00
0.0*
8275
91.5
%48
3981
.3%
New
Ham
pshi
re27
123
486
.3%
00
0.0*
188
161
85.6
%83
7388
.0%
New
Jer
sey
999
884
88.5
%29
125
788
.3%
427
390
91.3
%28
123
784
.3%
New
Mex
ico
260
219
84.2
%0
00.
0*20
417
284
.3%
5647
83.9
%N
ew Y
ork
2,83
82,
463
86.8
%39
3384
.6%
2,01
61,
765
87.5
%78
366
584
.9%
Nor
th C
arol
ina
1,48
01,
306
88.2
%88
7787
.5%
919
805
87.6
%47
342
489
.6%
Nor
th D
akot
a17
515
990
.9%
00
0.0*
00
0.0*
175
159
90.9
%N
orth
ern
Mar
iana
Isla
nds
10
0.0%
00
0.0*
10
0.0%
00
0.0*
Ohi
o1,
838
1,66
590
.6%
130
118
90.8
%96
387
190
.4%
745
676
90.7
%Ok
laho
ma
547
446
81.5
%0
00.
0*26
621
781
.6%
281
229
81.5
%Or
egon
450
394
87.6
%0
00.
0*28
024
687
.9%
170
148
87.1
%Pe
nnsy
lvan
ia2,
150
1,88
087
.4%
353
304
86.1
%94
783
588
.2%
850
741
87.2
%Pu
erto
Ric
o50
510
.0%
00
0.0*
232
8.7%
273
11.1
%Rh
ode
Isla
nd23
820
887
.4%
1410
71.4
%12
410
887
.1%
100
9090
.0%
Sout
h Ca
rolin
a39
634
787
.6%
00
0.0*
259
237
91.5
%13
711
080
.3%
Sout
h Da
kota
280
252
90.0
%0
00.
0*15
113
186
.8%
129
121
93.8
%Te
nnes
see
751
660
87.9
%21
2110
0.0%
333
299
89.8
%39
734
085
.6%
Texa
s-RN
2,25
62,
011
89.1
%81
7187
.7%
1,33
21,
170
87.8
%84
377
091
.3%
Utah
275
252
91.6
%0
00.
0*17
216
093
.0%
103
9289
.3%
Verm
ont
9175
82.4
%0
00.
0*55
4378
.2%
3632
88.9
%Vi
rgin
Isla
nds,
U.S
.8
450
.0%
00
0.0*
00
0.0*
84
50.0
%Vi
rgin
ia1,
114
924
82.9
%10
594
89.5
%55
145
983
.3%
458
371
81.0
%W
ashi
ngto
n79
270
188
.5%
00
0.0*
517
464
89.7
%27
523
786
.2%
Wes
t Virg
inia
-RN
477
416
87.2
%0
00.
0*28
324
285
.5%
194
174
89.7
%W
isco
nsin
956
842
88.1
%0
00.
0*49
543
487
.7%
461
408
88.5
%W
yom
ing
163
139
85.3
%0
00.
0*12
811
085
.9%
3529
82.9
%
Tota
l40
,155
34,8
7386
.8%
1,33
61,
159
86.8
%23
,408
20,3
4686
.9%
15,4
1113
,368
86.7
%
National Council of State Boards of Nursing, Inc. (NCSBN) u 2003
35
PART II: 2002 LICENSUREEXAM STATISTICS
*No
cand
idat
es te
sted
.1 Do
es n
ot in
clud
e in
valid
/spe
cial
pro
gram
cod
es.
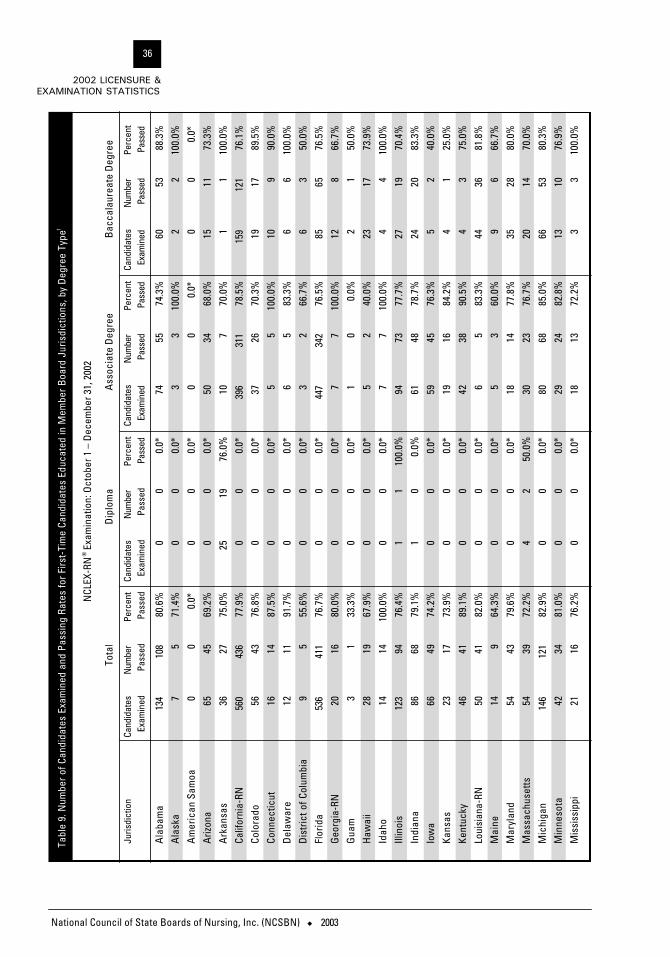
Tabl
e 9.
Num
ber o
f Can
dida
tes
Exam
ined
and
Pas
sing
Rat
es fo
r Firs
t-Ti
me
Cand
idat
es E
duca
ted
in M
embe
r Boa
rd J
uris
dict
ions
, by
Deg
ree
Type
1
NCL
EX-R
N®
Exam
inat
ion:
Oct
ober
1 –
Dec
embe
r 31,
200
2
Tota
lD
iplo
ma
Ass
ocia
te D
egre
eB
acca
laur
eate
Deg
ree
Juris
dict
ion
Cand
idat
esN
umbe
rPe
rcen
tCa
ndid
ates
Num
ber
Perc
ent
Cand
idat
esN
umbe
rPe
rcen
tCa
ndid
ates
Num
ber
Perc
ent
Exam
ined
Pass
edPa
ssed
Exam
ined
Pass
edPa
ssed
Exam
ined
Pass
edPa
ssed
Exam
ined
Pass
edPa
ssed
Ala
bam
a13
410
880
.6%
00
0.0*
7455
74.3
%60
5388
.3%
Ala
ska
75
71.4
%0
00.
0*3
310
0.0%
22
100.
0%A
mer
ican
Sam
oa0
00.
0*0
00.
0*0
00.
0*0
00.
0*Ar
izona
6545
69.2
%0
00.
0*50
3468
.0%
1511
73.3
%A
rkan
sas
3627
75.0
%25
1976
.0%
107
70.0
%1
110
0.0%
Calif
orni
a-RN
560
436
77.9
%0
00.
0*39
631
178
.5%
159
121
76.1
%Co
lora
do56
4376
.8%
00
0.0*
3726
70.3
%19
1789
.5%
Conn
ectic
ut16
1487
.5%
00
0.0*
55
100.
0%10
990
.0%
Del
awar
e12
1191
.7%
00
0.0*
65
83.3
%6
610
0.0%
Dis
tric
t of C
olum
bia
95
55.6
%0
00.
0*3
266
.7%
63
50.0
%Fl
orid
a53
641
176
.7%
00
0.0*
447
342
76.5
%85
6576
.5%
Geor
gia-
RN20
1680
.0%
00
0.0*
77
100.
0%12
866
.7%
Gua
m3
133
.3%
00
0.0*
10
0.0%
21
50.0
%H
awai
i28
1967
.9%
00
0.0*
52
40.0
%23
1773
.9%
Idah
o14
1410
0.0%
00
0.0*
77
100.
0%4
410
0.0%
Illin
ois
123
9476
.4%
11
100.
0%94
7377
.7%
2719
70.4
%In
dian
a86
6879
.1%
10
0.0%
6148
78.7
%24
2083
.3%
Iow
a66
4974
.2%
00
0.0*
5945
76.3
%5
240
.0%
Kans
as23
1773
.9%
00
0.0*
1916
84.2
%4
125
.0%
Kent
ucky
4641
89.1
%0
00.
0*42
3890
.5%
43
75.0
%Lo
uisi
ana-
RN50
4182
.0%
00
0.0*
65
83.3
%44
3681
.8%
Mai
ne14
964
.3%
00
0.0*
53
60.0
%9
666
.7%
Mar
ylan
d54
4379
.6%
00
0.0*
1814
77.8
%35
2880
.0%
Mas
sach
uset
ts54
3972
.2%
42
50.0
%30
2376
.7%
2014
70.0
%M
ichi
gan
146
121
82.9
%0
00.
0*80
6885
.0%
6653
80.3
%M
inne
sota
4234
81.0
%0
00.
0*29
2482
.8%
1310
76.9
%M
issi
ssip
pi21
1676
.2%
00
0.0*
1813
72.2
%3
310
0.0%
National Council of State Boards of Nursing, Inc. (NCSBN) u 2003
36
2002 LICENSURE &EXAMINATION STATISTICS
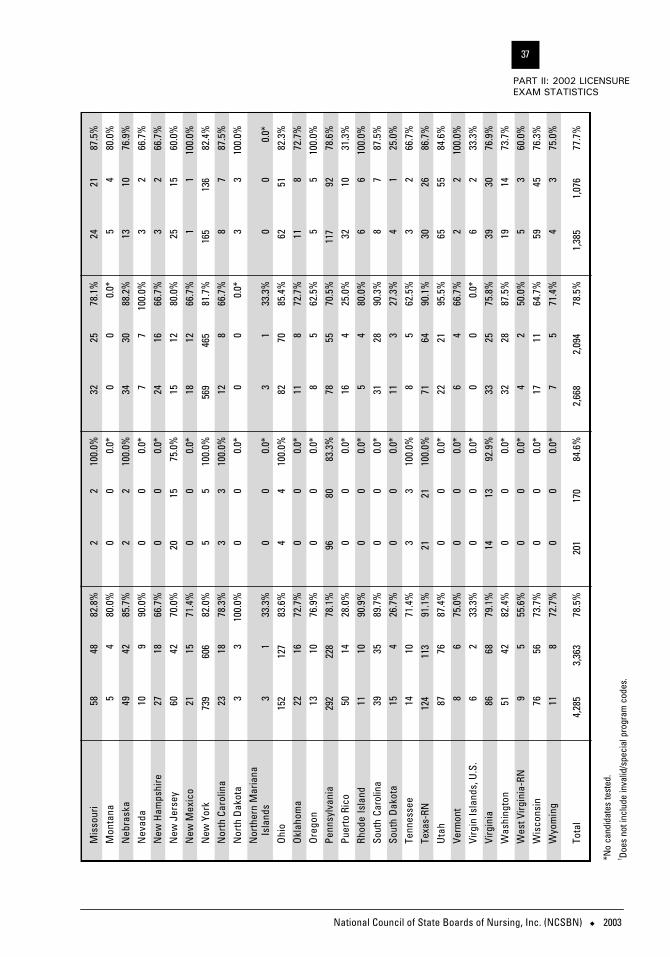
Mis
sour
i58
4882
.8%
22
100.
0%32
2578
.1%
2421
87.5
%M
onta
na5
480
.0%
00
0.0*
00
0.0*
54
80.0
%N
ebra
ska
4942
85.7
%2
210
0.0%
3430
88.2
%13
1076
.9%
Nev
ada
109
90.0
%0
00.
0*7
710
0.0%
32
66.7
%N
ew H
amps
hire
2718
66.7
%0
00.
0*24
1666
.7%
32
66.7
%N
ew J
erse
y60
4270
.0%
2015
75.0
%15
1280
.0%
2515
60.0
%N
ew M
exic
o21
1571
.4%
00
0.0*
1812
66.7
%1
110
0.0%
New
Yor
k73
960
682
.0%
55
100.
0%56
946
581
.7%
165
136
82.4
%N
orth
Car
olin
a23
1878
.3%
33
100.
0%12
866
.7%
87
87.5
%N
orth
Dak
ota
33
100.
0%0
00.
0*0
00.
0*3
310
0.0%
Nor
ther
n M
aria
na
Isla
nds
31
33.3
%0
00.
0*3
133
.3%
00
0.0*
Ohi
o15
212
783
.6%
44
100.
0%82
7085
.4%
6251
82.3
%O
klah
oma
2216
72.7
%0
00.
0*11
872
.7%
118
72.7
%O
rego
n13
1076
.9%
00
0.0*
85
62.5
%5
510
0.0%
Penn
sylv
ania
292
228
78.1
%96
8083
.3%
7855
70.5
%11
792
78.6
%Pu
erto
Ric
o50
1428
.0%
00
0.0*
164
25.0
%32
1031
.3%
Rhod
e Is
land
1110
90.9
%0
00.
0*5
480
.0%
66
100.
0%So
uth
Caro
lina
3935
89.7
%0
00.
0*31
2890
.3%
87
87.5
%So
uth
Dak
ota
154
26.7
%0
00.
0*11
327
.3%
41
25.0
%Te
nnes
see
1410
71.4
%3
310
0.0%
85
62.5
%3
266
.7%
Texa
s-RN
124
113
91.1
%21
2110
0.0%
7164
90.1
%30
2686
.7%
Uta
h87
7687
.4%
00
0.0*
2221
95.5
%65
5584
.6%
Verm
ont
86
75.0
%0
00.
0*6
466
.7%
22
100.
0%Vi
rgin
Isla
nds,
U.S
.6
233
.3%
00
0.0*
00
0.0*
62
33.3
%Vi
rgin
ia86
6879
.1%
1413
92.9
%33
2575
.8%
3930
76.9
%W
ashi
ngto
n51
4282
.4%
00
0.0*
3228
87.5
%19
1473
.7%
Wes
t Virg
inia
-RN
95
55.6
%0
00.
0*4
250
.0%
53
60.0
%W
isco
nsin
7656
73.7
%0
00.
0*17
1164
.7%
5945
76.3
%W
yom
ing
118
72.7
%0
00.
0*7
571
.4%
43
75.0
%
Tota
l4,
285
3,36
378
.5%
201
170
84.6
%2,
668
2,09
478
.5%
1,38
51,
076
77.7
%
National Council of State Boards of Nursing, Inc. (NCSBN) u 2003
37
PART II: 2002 LICENSUREEXAM STATISTICS
*No
cand
idat
es te
sted
.1 Do
es n
ot in
clud
e in
valid
/spe
cial
pro
gram
cod
es.
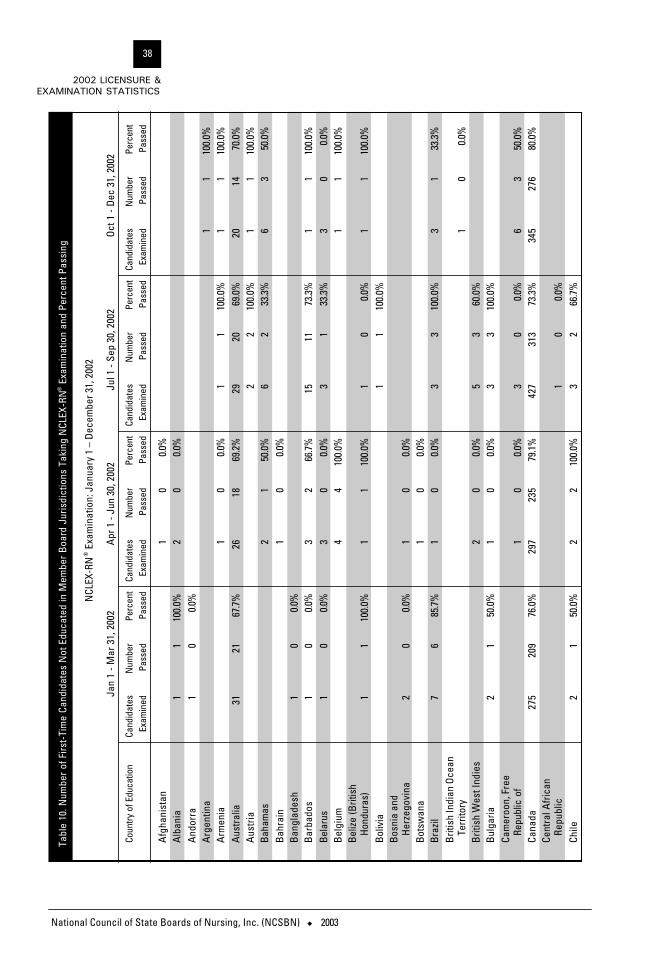
National Council of State Boards of Nursing, Inc. (NCSBN) u 2003
38
2002 LICENSURE &EXAMINATION STATISTICS
Tabl
e 10
. Num
ber o
f Firs
t-Ti
me
Cand
idat
es N
ot E
duca
ted
in M
embe
r Boa
rd J
uris
dict
ions
Tak
ing
NCL
EX-R
N®Ex
amin
atio
n an
d Pe
rcen
t Pas
sing
NCL
EX-R
N®
Exam
inat
ion:
Jan
uary
1 –
Dec
embe
r 31,
200
2
Jan
1 - M
ar 3
1, 2
002
Apr
1 -
Jun
30, 2
002
Jul 1
- Se
p 30
, 200
2Oc
t 1 -
Dec
31, 2
002
Coun
try o
f Edu
catio
nCa
ndid
ates
N
umbe
rPe
rcen
tCa
ndid
ates
Num
ber
Perc
ent
Cand
idat
esN
umbe
rPe
rcen
tCa
ndid
ates
Num
ber
Perc
ent
Exam
ined
Pass
edPa
ssed
Exam
ined
Pass
edPa
ssed
Exam
ined
Pass
edPa
ssed
Exam
ined
Pass
edPa
ssed
Afg
hani
stan
10
0.0%
Alb
ania
11
100.
0%2
00.0
%A
ndor
ra1
00.0
%A
rgen
tina
11
100.
0%A
rmen
ia1
00.0
%1
110
0.0%
11
100.
0%A
ustr
alia
3121
67.7
%26
1869
.2%
2920
69.0
%20
1470
.0%
Aus
tria
22
100.
0%1
110
0.0%
Baha
mas
21
50.0
%6
233
.3%
63
50.0
%B
ahra
in1
00.0
%B
angl
ades
h1
00.0
%B
arba
dos
10
0.0%
32
66.7
%15
1173
.3%
11
100.
0%Be
laru
s1
00.0
%3
00.0
%3
133
.3%
30
0.0%
Bel
gium
44
100.
0%1
110
0.0%
Beliz
e (B
ritis
h Ho
ndur
as)
11
100.
0%1
110
0.0%
10
0.0%
11
100.
0%Bo
livia
11
100.
0%B
osni
a an
d H
erze
govi
na2
00.0
%1
00.0
%Bo
tsw
ana
10
0.0%
Braz
il7
685
.7%
10
0.0%
33
100.
0%3
133
.3%
Brit
ish
Indi
an O
cean
Te
rrito
ry1
00.0
%B
ritis
h W
est I
ndie
s2
00.0
%5
360
.0%
Bul
garia
21
50.0
%1
00.0
%3
310
0.0%
Cam
eroo
n, F
ree
Repu
blic
of
10
0.0%
30
0.0%
63
50.0
%Ca
nada
275
209
76.0
%29
723
579
.1%
427
313
73.3
%34
527
680
.0%
Cent
ral A
fric
an
Repu
blic
10
0.0%
Chile
21
50.0
%2
210
0.0%
32
66.7
%
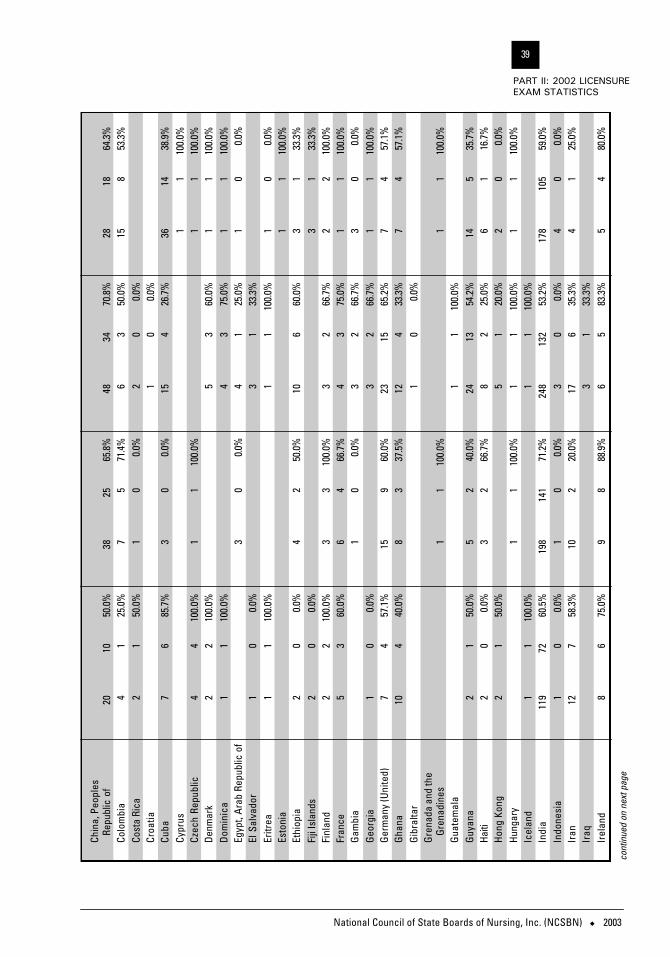
National Council of State Boards of Nursing, Inc. (NCSBN) u 2003
39
PART II: 2002 LICENSUREEXAM STATISTICS
Chin
a, P
eopl
es
Repu
blic
of
2010
50.0
%38
2565
.8%
4834
70.8
%28
1864
.3%
Colo
mbi
a4
125
.0%
75
71.4
%6
350
.0%
158
53.3
%Co
sta
Rica
21
50.0
%1
00.0
%2
00.0
%Cr
oatia
10
0.0%
Cuba
76
85.7
%3
00.0
%15
426
.7%
3614
38.9
%Cy
prus
11
100.
0%Cz
ech
Repu
blic
44
100.
0%1
110
0.0%
11
100.
0%De
nmar
k2
210
0.0%
53
60.0
%1
110
0.0%
Dom
inic
a1
110
0.0%
43
75.0
%1
110
0.0%
Egyp
t, Ar
ab R
epub
lic o
f3
00.0
%4
125
.0%
10
0.0%
El S
alva
dor
10
0.0%
31
33.3
%Er
itrea
11
100.
0%1
110
0.0%
10
0.0%
Esto
nia
11
100.
0%Et
hiop
ia2
00.0
%4
250
.0%
106
60.0
%3
133
.3%
Fiji
Isla
nds
20
0.0%
31
33.3
%Fi
nlan
d2
210
0.0%
33
100.
0%3
266
.7%
22
100.
0%Fr
ance
53
60.0
%6
466
.7%
43
75.0
%1
110
0.0%
Gam
bia
10
0.0%
32
66.7
%3
00.0
%G
eorg
ia1
00.0
%3
266
.7%
11
100.
0%G
erm
any
(Uni
ted)
74
57.1
%15
960
.0%
2315
65.2
%7
457
.1%
Gha
na10
440
.0%
83
37.5
%12
433
.3%
74
57.1
%G
ibra
ltar
10
0.0%
Gre
nada
and
the
Gren
adin
es1
110
0.0%
11
100.
0%G
uate
mal
a1
110
0.0%
Guy
ana
21
50.0
%5
240
.0%
2413
54.2
%14
535
.7%
Haiti
20
0.0%
32
66.7
%8
225
.0%
61
16.7
%H
ong
Kong
21
50.0
%5
120
.0%
20
0.0%
Hung
ary
11
100.
0%1
110
0.0%
11
100.
0%Ic
elan
d1
110
0.0%
11
100.
0%In
dia
119
7260
.5%
198
141
71.2
%24
813
253
.2%
178
105
59.0
%In
done
sia
10
0.0%
10
0.0%
30
0.0%
40
0.0%
Iran
127
58.3
%10
220
.0%
176
35.3
%4
125
.0%
Iraq
31
33.3
%Ir
elan
d8
675
.0%
98
88.9
%6
583
.3%
54
80.0
%
cont
inue
d on
nex
t pag
e
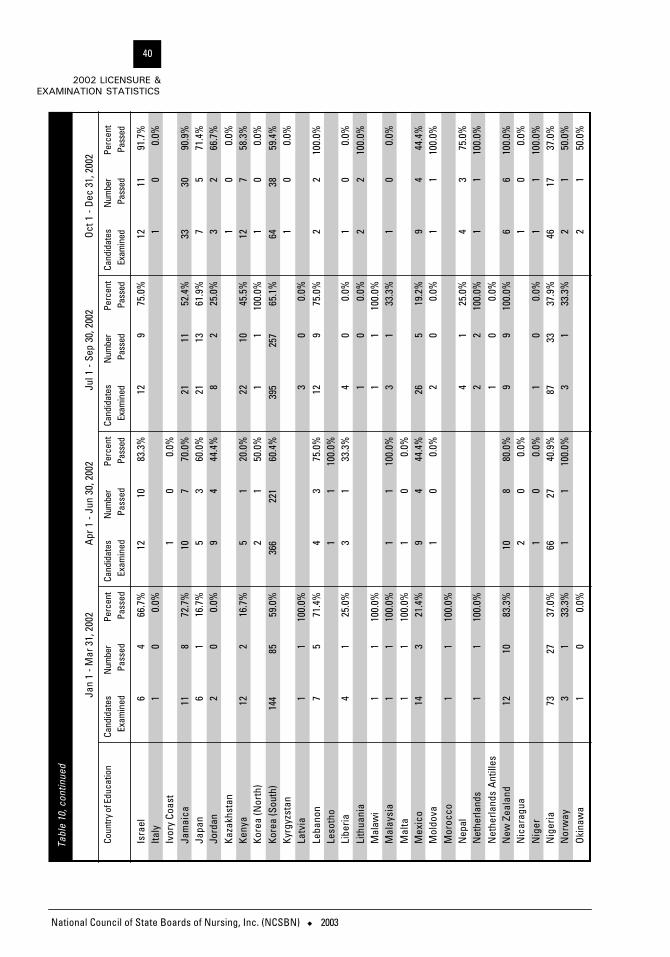
National Council of State Boards of Nursing, Inc. (NCSBN) u 2003
40
2002 LICENSURE &EXAMINATION STATISTICS
Tabl
e 10
, con
tinue
d
Jan
1 - M
ar 3
1, 2
002
Apr
1 -
Jun
30, 2
002
Jul 1
- Se
p 30
, 200
2Oc
t 1 -
Dec
31, 2
002
Coun
try o
f Edu
catio
nCa
ndid
ates
N
umbe
rPe
rcen
tCa
ndid
ates
Num
ber
Perc
ent
Cand
idat
esN
umbe
rPe
rcen
tCa
ndid
ates
Num
ber
Perc
ent
Exam
ined
Pass
edPa
ssed
Exam
ined
Pass
edPa
ssed
Exam
ined
Pass
edPa
ssed
Exam
ined
Pass
edPa
ssed
Isra
el6
466
.7%
1210
83.3
%12
975
.0%
1211
91.7
%Ita
ly1
00.
0%1
00.
0%Iv
ory
Coas
t1
00.
0%Ja
mai
ca11
872
.7%
107
70.0
%21
1152
.4%
3330
90.9
%Ja
pan
61
16.7
%5
360
.0%
2113
61.9
%7
571
.4%
Jord
an2
00.
0%9
444
.4%
82
25.0
%3
266
.7%
Kaza
khst
an1
00.
0%Ke
nya
122
16.7
%5
120
.0%
2210
45.5
%12
758
.3%
Kore
a (N
orth
)2
150
.0%
11
100.
0%1
00.
0%Ko
rea
(Sou
th)
144
8559
.0%
366
221
60.4
%39
525
765
.1%
6438
59.4
%Ky
rgyz
stan
10
0.0%
Latv
ia1
110
0.0%
30
0.0%
Leba
non
75
71.4
%4
375
.0%
129
75.0
%2
210
0.0%
Leso
tho
11
100.
0%Li
beria
41
25.0
%3
133
.3%
40
0.0%
10
0.0%
Lith
uani
a1
00.
0%2
210
0.0%
Mal
awi
11
100.
0%1
110
0.0%
Mal
aysi
a1
110
0.0%
11
100.
0%3
133
.3%
10
0.0%
Mal
ta1
110
0.0%
10
0.0%
Mex
ico
143
21.4
%9
444
.4%
265
19.2
%9
444
.4%
Mol
dova
10
0.0%
20
0.0%
11
100.
0%M
oroc
co1
110
0.0%
Nep
al4
125
.0%
43
75.0
%N
ethe
rland
s1
110
0.0%
22
100.
0%1
110
0.0%
Net
herla
nds
Ant
illes
10
0.0%
New
Zea
land
1210
83.3
%10
880
.0%
99
100.
0%6
610
0.0%
Nic
arag
ua2
00.
0%1
00.
0%N
iger
10
0.0%
10
0.0%
11
100.
0%N
iger
ia73
2737
.0%
6627
40.9
%87
3337
.9%
4617
37.0
%N
orw
ay3
133
.3%
11
100.
0%3
133
.3%
21
50.0
%Ok
inaw
a1
00.
0%2
150
.0%
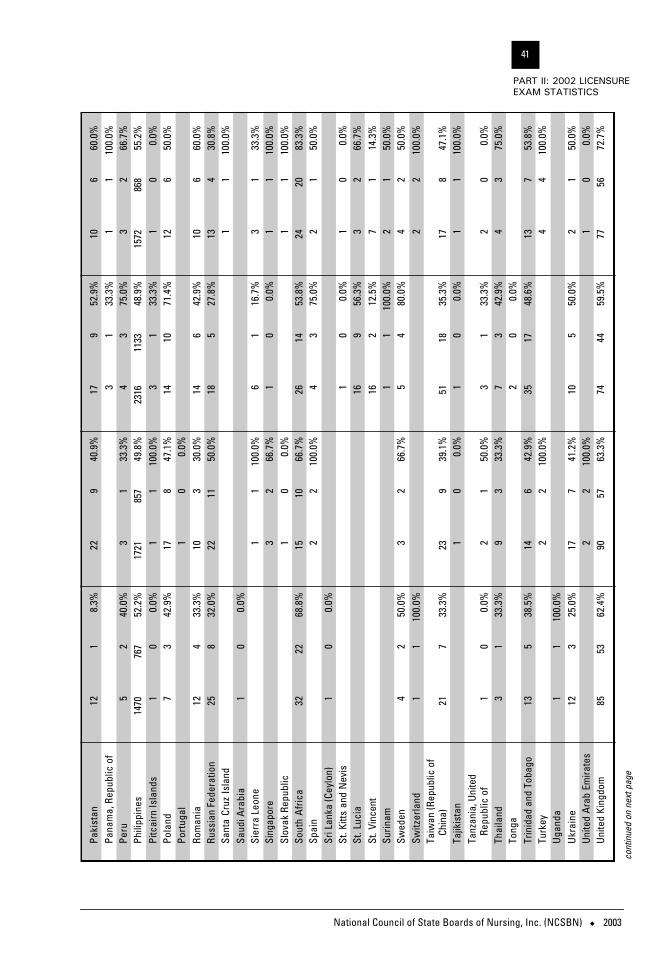
National Council of State Boards of Nursing, Inc. (NCSBN) u 2003
41
PART II: 2002 LICENSUREEXAM STATISTICS
Paki
stan
121
8.3%
229
40.9
%17
952
.9%
106
60.0
%Pa
nam
a, R
epub
lic o
f3
133
.3%
11
100.
0%Pe
ru5
240
.0%
31
33.3
%4
375
.0%
32
66.7
%Ph
ilipp
ines
1470
767
52.2
%17
2185
749
.8%
2316
1133
48.9
%15
7286
855
.2%
Pitc
airn
Isla
nds
10
0.0%
11
100.
0%3
133
.3%
10
0.0%
Pola
nd7
342
.9%
178
47.1
%14
1071
.4%
126
50.0
%Po
rtug
al1
00.
0%Ro
man
ia12
433
.3%
103
30.0
%14
642
.9%
106
60.0
%Ru
ssia
n Fe
dera
tion
258
32.0
%22
1150
.0%
185
27.8
%13
430
.8%
Sant
a Cr
uz Is
land
11
100.
0%Sa
udi A
rabi
a1
00.
0%Si
erra
Leo
ne1
110
0.0%
61
16.7
%3
133
.3%
Sing
apor
e3
266
.7%
10
0.0%
11
100.
0%Sl
ovak
Rep
ublic
10
0.0%
11
100.
0%So
uth
Afr
ica
3222
68.8
%15
1066
.7%
2614
53.8
%24
2083
.3%
Spai
n2
210
0.0%
43
75.0
%2
150
.0%
Sri L
anka
(Cey
lon)
10
0.0%
St. K
itts
and
Nev
is1
00.
0%1
00.
0%St
. Luc
ia16
956
.3%
32
66.7
%St
. Vin
cent
162
12.5
%7
114
.3%
Surin
am1
110
0.0%
21
50.0
%Sw
eden
42
50.0
%3
266
.7%
54
80.0
%4
250
.0%
Switz
erla
nd1
110
0.0%
22
100.
0%Ta
iwan
(Rep
ublic
of
Chin
a)21
733
.3%
239
39.1
%51
1835
.3%
178
47.1
%Ta
jikis
tan
10
0.0%
10
0.0%
11
100.
0%Ta
nzan
ia, U
nite
d Re
publ
ic o
f1
00.
0%2
150
.0%
31
33.3
%2
00.
0%Th
aila
nd3
133
.3%
93
33.3
%7
342
.9%
43
75.0
%To
nga
20
0.0%
Trin
idad
and
Tob
ago
135
38.5
%14
642
.9%
3517
48.6
%13
753
.8%
Turk
ey2
210
0.0%
44
100.
0%U
gand
a1
110
0.0%
Ukr
aine
123
25.0
%17
741
.2%
105
50.0
%2
150
.0%
Unite
d Ar
ab E
mira
tes
22
100.
0%1
00.
0%U
nite
d Ki
ngdo
m85
5362
.4%
9057
63.3
%74
4459
.5%
7756
72.7
%
cont
inue
d on
nex
t pag
e
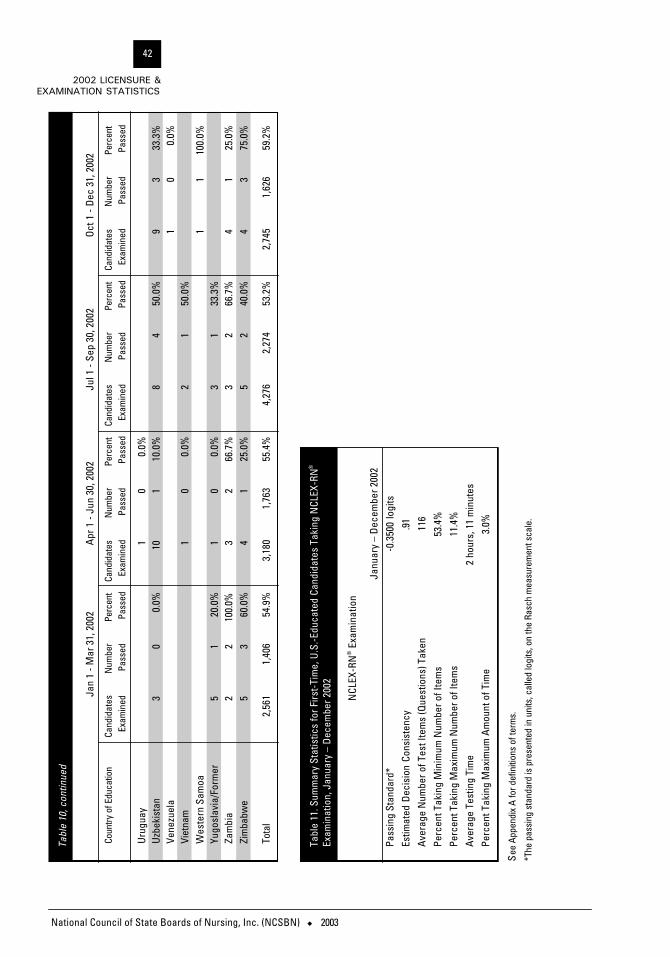
National Council of State Boards of Nursing, Inc. (NCSBN) u 2003
42
2002 LICENSURE &EXAMINATION STATISTICS
Tabl
e 10
, con
tinue
d
Jan
1 - M
ar 3
1, 2
002
Apr
1 -
Jun
30, 2
002
Jul 1
- Se
p 30
, 200
2Oc
t 1 -
Dec
31, 2
002
Coun
try o
f Edu
catio
nCa
ndid
ates
N
umbe
rPe
rcen
tCa
ndid
ates
Num
ber
Perc
ent
Cand
idat
esN
umbe
rPe
rcen
tCa
ndid
ates
Num
ber
Perc
ent
Exam
ined
Pass
edPa
ssed
Exam
ined
Pass
edPa
ssed
Exam
ined
Pass
edPa
ssed
Exam
ined
Pass
edPa
ssed
Uru
guay
10
0.0%
Uzbe
kist
an3
00.
0%10
110
.0%
84
50.0
%9
333
.3%
Vene
zuel
a1
00.
0%Vi
etna
m1
00.
0%2
150
.0%
Wes
tern
Sam
oa1
110
0.0%
Yugo
slav
ia/F
orm
er5
120
.0%
10
0.0%
31
33.3
%Za
mbi
a2
210
0.0%
32
66.7
%3
266
.7%
41
25.0
%Zi
mba
bwe
53
60.0
%4
125
.0%
52
40.0
%4
375
.0%
Tota
l2,
561
1,40
654
.9%
3,18
01,
763
55.4
%4,
276
2,27
453
.2%
2,74
51,
626
59.2
%
Tabl
e 11
. Sum
mar
y St
atis
tics
for F
irst-
Tim
e, U
.S.-E
duca
ted
Cand
idat
es T
akin
g N
CLEX
-RN®
Exam
inat
ion,
Jan
uary
– D
ecem
ber 2
002
NCL
EX-R
N®
Exam
inat
ion
Janu
ary
– D
ecem
ber 2
002
Pass
ing
Stan
dard
*-0
.350
0 lo
gits
Estim
ated
Dec
isio
n Co
nsis
tenc
y.9
1A
vera
ge N
umbe
r of T
est I
tem
s (Q
uest
ions
) Tak
en11
6Pe
rcen
t Tak
ing
Min
imum
Num
ber o
f Ite
ms
53.4
%Pe
rcen
t Tak
ing
Max
imum
Num
ber o
f Ite
ms
11.4
%Av
erag
e Te
stin
g Ti
me
2 ho
urs,
11
min
utes
Perc
ent T
akin
g M
axim
um A
mou
nt o
f Tim
e3.
0%
See
Appe
ndix
A fo
r def
initi
ons
of te
rms.
*The
pas
sing
sta
ndar
d is
pre
sent
ed in
uni
ts, c
alle
d lo
gits
, on
the
Rasc
h m
easu
rem
ent s
cale
.
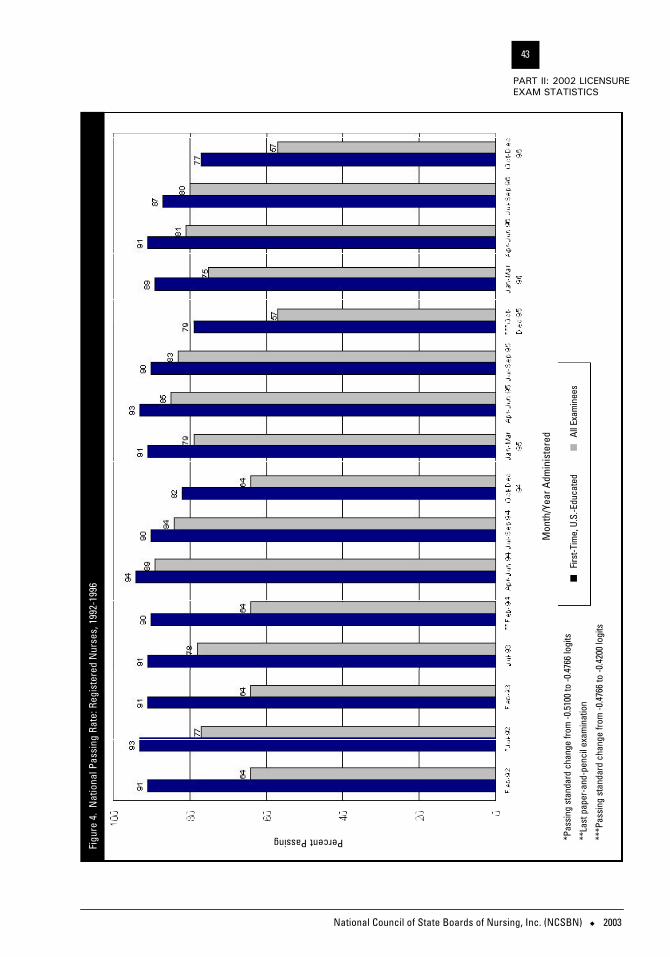
National Council of State Boards of Nursing, Inc. (NCSBN) u 2003
43
PART II: 2002 LICENSUREEXAM STATISTICS
Figu
re 4
. N
atio
nal P
assi
ng R
ate:
Reg
iste
red
Nur
ses,
199
2-19
96
Mon
th/Y
ear A
dmin
iste
red
nFi
rst-T
ime,
U.S
.-Edu
cate
d
nAl
l Exa
min
ees
*Pas
sing
sta
ndar
d ch
ange
from
-0.5
100
to -0
.476
6 lo
gits
**La
st p
aper
-and
-pen
cil e
xam
inat
ion
***P
assi
ng s
tand
ard
chan
ge fr
om -0
.476
6 to
-0.4
200
logi
ts
Percent Passing

National Council of State Boards of Nursing, Inc. (NCSBN) u 2003
44
2002 LICENSURE &EXAMINATION STATISTICS
Figu
re 5
. N
atio
nal P
assi
ng R
ate:
Reg
iste
red
Nur
ses,
199
7-19
99
Mon
th/Y
ear A
dmin
iste
red
nFi
rst-T
ime,
U.S
.-Edu
cate
d
nAl
l Exa
min
ees
*Pas
sing
sta
ndar
d ch
ange
from
-0.4
200
to -0
.350
0 lo
gits
Percent Passing
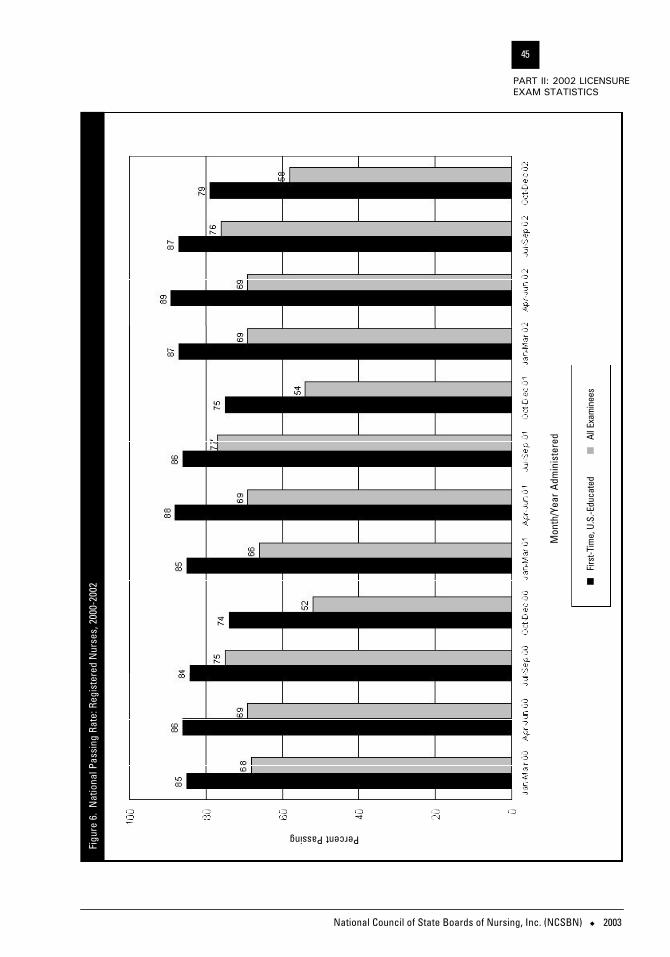
National Council of State Boards of Nursing, Inc. (NCSBN) u 2003
45
PART II: 2002 LICENSUREEXAM STATISTICS
Mon
th/Y
ear
Adm
inis
tere
d
nFi
rst-T
ime,
U.S
.-Edu
cate
d
nAl
l Exa
min
ees
Figu
re 6
. N
atio
nal P
assi
ng R
ate:
Reg
iste
red
Nur
ses,
200
0-20
02
Percent Passing

National Council of State Boards of Nursing, Inc. (NCSBN) u 2003
46
2002 LICENSURE &EXAMINATION STATISTICS
Average Number of Test Items (Questions) Taken The average number of items (questions) on which candidate performance is determined. In avariable-length computerized adapt-ive test (CAT), candidates areadministered items until they satisfyone of the following stopping rules: 1. A candidate’s measure of compe-
tence is known to be above orbelow the passing standard withat least 95 percent confidence (is significantly above or below thestandard) and at least the mini-mum number of questions hasbeen answered.
2. A candidate has taken the maxi-mum number of questions.
3. A candidate has tested for themaximum amount of time.
Computerized Adaptive Testing (CAT)Each candidate is administereditems appropriate for the currentestimated ability level until a confi-dent pass/fail decision can be made,the maximum number of items isanswered or the candidate runs outof time.
Estimated Decision ConsistencyA measure of examination reliabilityappropriate for CAT. It is the propor-tion of pass/fail decisions that wouldremain the same if all candidateswere to be retested with parallelexaminations.
Passing Standard*The minimum ability level a candi-date must demonstrate in order topass the examination. Currently, thepassing standard effective April1998 is -0.3500 logits for the NCLEX-
RN® examination. In April 1999, the passing standard was raised from-0.5100 to -0.4700 logits for theNCLEX-PN® examination. The RN
and PN standards are not directlycomparable because they are basedon different item pools.
*These statistics are presented in units, called logits, on the Rasch measurement scale. There isno inherent meaning of the units; they representan arbitrary scale useful for reporting relative differences. This scale can be used for two purposes: 1. To measure degree of candidate competence
(-2 = low; +2 = high), and 2. To measure degree of item difficulty
(-2 = easy; +2 = hard).
APPENDIX A
Licensure ExaminationSummary Statistics Definitions

2003ISBN: 0-9720273-9-4
N C S B N Research ServicesNational Council of State Boards of Nursing
111 E. Wacker Drive, Suite 2900Chicago, IL 60601-4277312.525.3600312.279.1032 faxwww.ncsbn.org