Embed Size (px)
Citation preview
MONTGOMERY COUNTY FAMILY ANDCHILDREN FIRST COUNCIL
2002 Progress Report
Outcomes, Indicators and Strategic Community Initiatives
Table of Contents
Staff support for the Family and Children First Council is provided by the Office of Family
and Children First: SUSANNE S. DAILY, PH.D. Assistant County Administrator and
Executive Director, Office of Family and Children First ■ TOM KELLEY Assistant Director ■
RUSS ABER Network Operations Engineer ■ KATHLEEN J. BUCKLEY Research Coordinator
■ DENISE BURRIS Confidential Office Clerk ■ ROBERT COOPER Data Systems
Coordinator ■ GAYLE L. INGRAM Assistant I ■ DIANE LUTERAN Program Coordinator ■
EDWARD L. MCNACHTAN AgencyLink, Project Coordinator ■ LEON E. NIECE Secretary ■
ROBERT L. STOUGHTON Research Administrator
STRATEGIC COMMUNITY INITIATIVES School Readiness and Fourth-Grade Success 2 Promoting
Alternative Learning Opportunities 5 Preventing Family Violence 8 COMMUNITY-BASED PROJECTSTeenage Pregnancy Prevention 10 Help Me Grow 11 COMMUNITY SUPPORT/OTHER PROJECTS ANDACTIVITIES AgencyLink 12 Diversity Awareness and Cultural Competency 12 Juvenile Sex Offender
Management 14 Resource Mapping 14 Brother Raymond L. Fitz, S.M. Ph.D. Award 15 OUTCOMESAND INDICATORS What do they really mean? 16 Healthy People 20 Young People Succeeding 23Stable Families 28 Positive Living for Special Populations 31 Safe and Supportive Neighborhoods 33Economic Self-Sufficiency 35

1
2002
PRO
GRES
S RE
PORT
Laurence P. Harkness
Montgomery County Family and Children First Council451 West Third Street
P.O. Box 972Dayton, OH 45422-3100
937-225-4695Fax 937-496-7714
E-mail: [email protected]
December 2002
Dear Community Member,
Four years ago, the Montgomery County Family and Children First Council began
a series of annual reports to the community with the publication of Turning the Curve.
With each report, the Council honors its pledge to inform the community about progress in
achieving the positive results we all desire for children and families. On behalf of the Council,
it is now my pleasure to present our 2002 Progress Report, the fifth in our series.
The positive results that we are seeking have been captured by the Council in a set of
“Desired Community Outcomes” that, together, spell out our vision for the community. Under
each outcome, the Council has identified a small number of measurable indicators for which
annual data are available. The trends that emerge by tracking these indicators provide a means of
gauging our progress as a community. We are happy to report that, overall, a majority of the indi-
cators are in a better position now than when our first Report was issued.
This encouraging news, however, must be put in perspective. For one thing, even though
an indicator is moving in the desired direction, it may still be far from an acceptable level. Even
more distressing are those indicators that are not moving in the desired direction.
Soon after publishing our first Report, the Council recognized the need for action.
In response to some of the negative trends in the data, we launched three Strategic Community
Initiatives. In prior Reports, the Champions leading the initiatives discussed the early work of
their teams and provided updates. This year’s Report highlights some of their accomplishments:
parents and caregivers exposed to the “Easy Steps to Grow Great Kids;” young people benefiting
from the Mentoring Collaborative; court and law enforcement personnel linked via the Family
Violence Multi-Jurisdictional Database; students staying in school because of the “Education—
Think About It” (truancy prevention) public information campaign; diverse agencies working for
a common goal through the Family Violence Coordinating Council; and families enriched by the
“Parents as Teachers” program.
The Council thanks all of the team members for their efforts on behalf of children and
families. Their collaborative attempt to solve tough problems reminds us that the responsibility
to “turn the curve” and to seek better results belongs to all of us.
Sincerely,
Laurence P. Harkness
President and Chief Executive Officer,
The Children’s Medical Center
Chair, Montgomery County Family and
Children First Council

The work of the School Readiness /
School Success / 4th Grade Guarantee
Initiative Team, which began in 1999, is
based on the belief that the early years
are critical to a child’s optimal social,
physical, emotional and cognitive
development. This foundational devel-
opment, furthermore, is the first step in
helping children achieve maximum
readiness for school. The results of the
state-mandated fourth-grade school
proficiency test help to illustrate what a
serious problem the lack of school
readiness is. According to the most
recent information provided by the
Ohio Department of Education, only
53 percent of Montgomery County
children passed the fourth-grade read-
ing proficiency test.
Based on recommendations by the
School Readiness team, programs are
now in place throughout Montgomery
County to teach and emphasize the
importance of parental action during
the early years to maximize child
development and increase the child’s
readiness for school. Following is a
summary of progress made in 2002:
Easy Steps to Grow Great Kids
The Easy Steps to Grow Great Kids
public awareness campaign, now in its
third year, continued in 2002 to remind
parents and caregivers that they are the
first “teachers” of the children in
their care. The message is that every
form of interaction adults have with
children can help prepare them for
success in school.
Through a variety of media—
including billboards, RTA bus ads,
radio & TV spots, and special events—
advice and details related to each of the
six “steps” are being communicated to
our target audience and the community
as a whole. Throughout 2002, a variety
of printed materials were distributed
within the community, including fact
sheets (over 65,000), a brochure (over
200,000), a resource guide (over
150,000) and more. Over 30,000 copies
of the ten-minute Easy Steps video were
distributed, many incorporated into
educational outreach programs.
Numerous newspaper ads were run
and the Easy Steps Web site (www.
easysteps.chisano.com) continued to
support the campaign’s community
outreach component and to allow citi-
zens to place orders for free materials.
2
2002
PRO
GRES
S RE
PORT
Strategic Community Initiatives
School Readiness and Fourth-GradeSuccess
—based on information provided by Thomas G. Breitenbach, President and CEO,
Premier Health Partners, and champion of the Promoting School Readiness and Fourth-grade
Success initiative
Tom Breitenbach,Champion
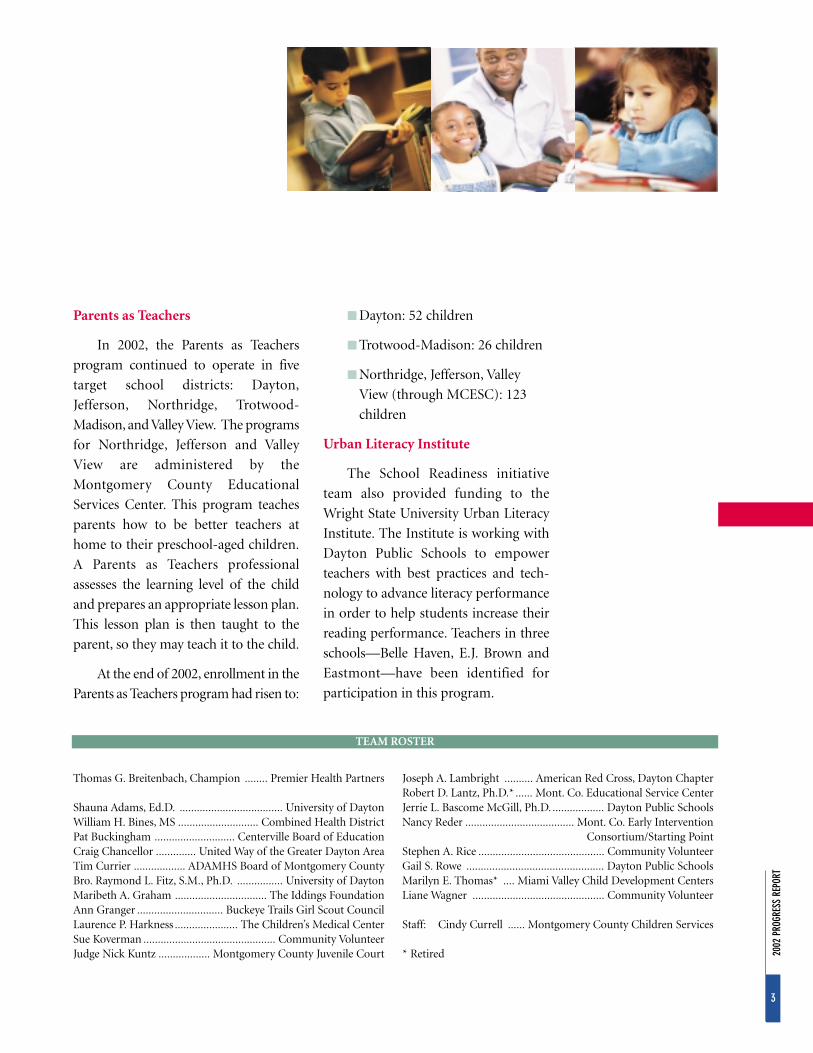
Parents as Teachers
In 2002, the Parents as Teachers
program continued to operate in five
target school districts: Dayton,
Jefferson, Northridge, Trotwood-
Madison, and Valley View. The programs
for Northridge, Jefferson and Valley
View are administered by the
Montgomery County Educational
Services Center. This program teaches
parents how to be better teachers at
home to their preschool-aged children.
A Parents as Teachers professional
assesses the learning level of the child
and prepares an appropriate lesson plan.
This lesson plan is then taught to the
parent, so they may teach it to the child.
At the end of 2002, enrollment in the
Parents as Teachers program had risen to:
■ Dayton: 52 children
■ Trotwood-Madison: 26 children
■ Northridge, Jefferson, Valley
View (through MCESC): 123
children
Urban Literacy Institute
The School Readiness initiative
team also provided funding to the
Wright State University Urban Literacy
Institute. The Institute is working with
Dayton Public Schools to empower
teachers with best practices and tech-
nology to advance literacy performance
in order to help students increase their
reading performance. Teachers in three
schools—Belle Haven, E.J. Brown and
Eastmont—have been identified for
participation in this program.
3
2002
PRO
GRES
S RE
PORT
Thomas G. Breitenbach, Champion ........ Premier Health Partners
Shauna Adams, Ed.D. .................................... University of DaytonWilliam H. Bines, MS ............................ Combined Health DistrictPat Buckingham ............................ Centerville Board of EducationCraig Chancellor .............. United Way of the Greater Dayton AreaTim Currier .................. ADAMHS Board of Montgomery CountyBro. Raymond L. Fitz, S.M., Ph.D. ................ University of DaytonMaribeth A. Graham ................................ The Iddings FoundationAnn Granger .............................. Buckeye Trails Girl Scout CouncilLaurence P. Harkness ...................... The Children’s Medical CenterSue Koverman .............................................. Community VolunteerJudge Nick Kuntz .................. Montgomery County Juvenile Court
Joseph A. Lambright .......... American Red Cross, Dayton ChapterRobert D. Lantz, Ph.D.* ...... Mont. Co. Educational Service CenterJerrie L. Bascome McGill, Ph.D. .................. Dayton Public SchoolsNancy Reder ...................................... Mont. Co. Early Intervention
Consortium/Starting PointStephen A. Rice ............................................ Community VolunteerGail S. Rowe ................................................ Dayton Public SchoolsMarilyn E. Thomas* .... Miami Valley Child Development CentersLiane Wagner .............................................. Community Volunteer
Staff: Cindy Currell ...... Montgomery County Children Services
* Retired
TEAM ROSTER

4
2002
PRO
GRES
S RE
PORT
5
2002
PRO
GRES
S RE
PORT
Attending school regularly and
graduating are keys to a successful future
and lead to many desirable outcomes,
including significantly higher income
and better economic opportunities.
Yet, too many young people in
Montgomery County are not succeed-
ing in school or graduating from high
school. The Alternative Learning
Opportunities Team (A.L.O.T.) accepted
the challenge of helping youth in
Montgomery County overcome barri-
ers to school success, graduation, and
future self-sufficiency in the areas of:
■ Truancy/chronic absenteeism
■ Grade retention
■ Assessment
■ Providing youth with challenges
■ Program choice
■ Adult support
■ Career exploration opportunities
During 2002, the A.L.O.T. continued
truancy prevention efforts through
direct marketing and community out-
reach. More than 2,500 people visited the
newly created Web site for students and
parents, www.SchoolIsWorthIt.org.
The Montgomery County Mentoring
Collaborative continued its efforts to
focus our community on the need for
more mentors throughout Montgomery
County. The A.L.O.T. also issued its
final report in May 2002, which
provided a framework for future work.
Following is a summary of progress made
in 2002 in all these areas:
Truancy Prevention
The award-winning Education—
Think About It public awareness
campaign was successful in reaching
several hundred thousand people
through traditional advertising as well
as numerous targeted community out-
reach activities. These included events
at recreational facilities, teen clubs and
concerts, and cooperative efforts with
600 local schools, libraries, community
centers, and social service agencies.
Over 115,000 teen cards (with phone
numbers of local teen resources),
150,000 campaign brochures (contain-
ing family resource directory), 7,400
posters, 6,000 promotional items, and
1,600 videos were distributed during
the campaign. The videos also were
played on video kiosks at various loca-
tions and events.
The Sinclair Fast Forward Center
estimated that the A.L.O.T.’s Education—
Think About It campaign generated at
least 1,500 contacts with Fast Forward
staff through promotion of the 512-
FAST phone number. The campaign’s
teen TV commercial won the 2002
Hermes Gold Award from the Dayton
Advertising Club and the entire
Education— Think About It campaign
won the 2002 Hermes Silver Award.
Promoting Alternative LearningOpportunities
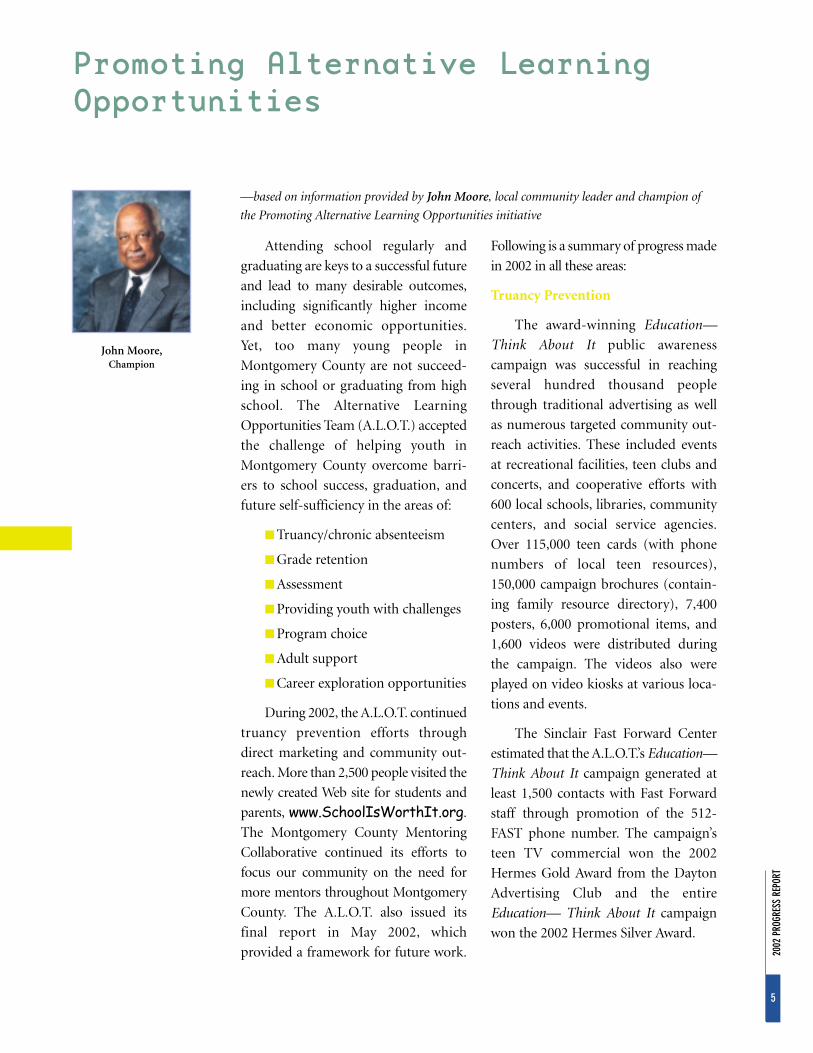
—based on information provided by John Moore, local community leader and champion of
the Promoting Alternative Learning Opportunities initiative
John Moore,Champion

6
2002
PRO
GRES
S RE
PORT
Mentoring Collaborative
The Montgomery County
Mentoring Collaborative continued
helping to link caring adult mentors to
the children who need them. Operated
by the Montgomery County Educational
Service Center, the Mentoring Collabo-
rative is a central resource to 43 local
partner agencies which provide
mentors for youth. During 2002, the
Collaborative provided mentor-focused
activities such as the monthly Partners’
Roundtable, funded background checks
for potential mentors, developed a
Mentor Dividend Card to provide lower
cost activities for mentors and their
mentees, increased the supply of poten-
tial mentors through presentations and
mentor recruitment activities such as
the Riverscape Lite Lunch series, and
helped support and sustain successful
mentoring relationships in
Montgomery County.
Potential mentors can sign
up to be matched with
local mentoring programs
through www.mentoring-
collaborative.org .
A.L.O.T. Final Report
After two and one-half years of
work, the Alternative Learning
Opportunities Team issued its final
report in May 2002. The A.L.O.T.
estimated that up to 15 percent of
children enrolled in public schools in
Montgomery County may be at risk of
school failure and be in need of alterna-
tives, either in the traditional classroom
or in alternative classrooms. Meeting
nontraditional needs of students to

help them succeed could include employing different
teaching methods in the traditional classroom (or
elsewhere in a traditional school) or establishing dif-
ferent settings. The A.L.O.T. found that there are not
enough nontraditional learning opportunities in our
community for those who could benefit from them.
Recommendations. After significant dialogue with
the educational, social services, law enforcement, and
juvenile justice communities, review of successful local
and national best practices, and other input, the
A.L.O.T. recommendations include:
■ Community supports to help students succeed
in school
■ Resources targeted to youth with early warning
signs of school failure
■ The creation of effective assessment tools to
identify learning difficulties and academic
remediation needs as early as possible
■ Training for current and future teachers to
reach nontraditional learners
■ Advocacy for additional funds and alternative-
education-friendly laws to ensure that students
are given the opportunity to learn in the setting
that best meet their needs
■ The Youth Council of the Montgomery County
Workforce Policy Board should continue the
work begun by the Alternative Learning
Opportunities Team
Action by the Youth Council
The Youth Council accepted the A.L.O.T. report in
July 2002. An Ad Hoc Committee worked quickly to
develop a plan to implement the A.L.O.T. recommen-
dations. This plan was accepted by the Youth Council
in November 2002. The A.L.O.T’s recommendations
were divided into three responsibility areas:
■ Responsibility of the Youth Council
■ Responsibility of the Public and Private Schools
in Montgomery County
■ Responsibility of Another Agency or the
Community at Large
The Youth Council’s implementation plan pro-
vides an appropriate course of action for the future,
including continued focus on truancy prevention and
mentoring in our community.
7
2002
PRO
GRES
S RE
PORT
TEAM ROSTER
John E. Moore, Champion . . . . . . . . . . . . . . . Community Leader
Joseph B. Baldasare* . . . . . . . . . . . . United Rehabilitation ServicesSamuel C. Brewer* . . . . . . . . . . . Trotwood-Madison City SchoolsLt. Col. John Compston . . . . . . . . . . . . Dayton Police DepartmentDannetta Graves . . . . . . . . . . . . . . . . . Montgomery County Dept.
of Job and Family ServicesAnn B. Higdon . . . . . Improved Solutions for Urban Systems, Inc.Jeanine Hufford . . . . . . . . . . . . . . . . . . Mathile Family FoundationLearwinson Jackson . . . . . . . . . Trade & Tech Prep Charter SchoolClarence W. Jarboe . . . . . . . . . . . Northridge Local School DistrictCarla L. Lakatos . . . . . . . Miami Valley Regional Transit AuthorityAnn Levett-Lowe* . . . . . . . . . . . . . . . . . . . . Dayton Public Schools Amy Luttrell . . . . . . . . . . . . . . . . . . Goodwill Industries of DaytonJudge Michael B. Murphy . . Montgomery County Juvenile CourtSandra K. Pierce . . . . . . . . . . . . . . . . . . Parker, Carlson & Johnson
Mary D. Pryor, M.D. . . . . . . . . . . Oakwood Health CommissionerCatherine Rauch . . . . . . . . . . . . . . . . Miami Valley Teen CoalitionMargaret Sandberg . . . . . . . . . . . . . . . . . . . Dayton Public SchoolsFrederick C. Smith . . . . . . . . . . . . . . . . . . . . . . . Huffy FoundationJoseph L. Szoke . . . . . . . . . . . . . . . ADAMHS Board of Mont. Co.Donald Thompson . . . . . . . . . . Montgomery County Educational
Service CenterDonald A. Vermillion . . . . . . . . . . . . Sinclair Community College/
University of DaytonJoyce C. Young . . . . . . . . . . . . . . . . . . . . . . Community Volunteer
Staff:Diane Luteran . . . . . . . . . . . . . Office of Family and Children First
*Prior participants

8
2002
PRO
GRES
S RE
PORT
Work continued on the prevention
of family violence in 2002, with the
development and implementation of the
Domestic Violence Database along with
other related activities. The initiative
team worked very hard to develop a
better understanding of family violence
and the factors that make this complex
issue so challenging. The team has iden-
tified four goals:
■ Eliminate repeat violent offenders
■ Promote the “buy in” of the
criminal justice system to the
existing protocols regarding
violence
■ Create a Family Violence
Coordinating Council
■ While zero tolerance is the vision,
we must progress toward that
goal by developing a consistent
message about what’s tolerable in
this community
Domestic Violence Database
This multi-jurisdictional database
will allow law enforcement and the jus-
tice system to be more aware of the
complete family violence history of the
perpetrators they deal with. It will also
act as a repository for evidence so that it
may be more efficiently and effectively
used for court proceedings.
Phase I of this project is well under-
way. It involves court clerks traveling
throughout the court system and
inputting family violence case informa-
tion. The daily input of information
regarding domestic violence incidents
began in the spring of 2002 when Dan
Foley, Clerk of Courts, assigned two
data entry clerks to begin inputting
information from Area Courts 1 and 2
and from the Dayton Municipal Court.
By fall, Kettering, Miamisburg and
Vandalia Municipal Courts joined the
database. To date, approximately 20,000
cases have been input into the system.
Oakwood Municipal Court is now also
a part of the system.
Prosecutors, judges, police agencies
and child welfare workers will begin
training on the database in early 2003.
As the Clerk of Courts, Dan Foley will
continue to work with FCFC to assure
the database’s smooth implementation.
Phase II of this project involves the
“warehousing” of current domestic vio-
lence data from each court’s MIS system
into the domestic violence database.
This phase is expected to be completed
by fall of 2003, allowing the system to
hold up to 10 years worth of data.
Coordinated Community Response
The Initiative Team also met to
discuss how to achieve a coordinated
response from the community regarding
the elimination of family violence.
Conducting training with the criminal
Preventing Family Violence
—based on information provided by Vicki D. Pegg, Montgomery County Commissionerand champion of the Preventing Family Violence initiative
Vicki Pegg,Champion

9
2002
PRO
GRES
S RE
PORT
justice system on the domestic violence
protocols made progress toward this goal.
Family Violence Coordinating
Council
The team began work on the third
goal of creating a Family Violence
Coordinating Council by looking at
the current efforts that exist in
Montgomery County. Ten organiza-
tions were identified as currently being
involved with family violence. Small
groups tackled issues such as how a
coordinating council would function
and, in relation to the fourth goal,
whether there is consensus regarding
the level of violence the community
would tolerate.
With the domestic violence data-
base operational, we will continue in
2003 to move toward our goal of help-
ing to stabilize families by making
homes free from violence. We would
like to offer our sincere thanks to the
public officials who have expressed
commitment to this initiative and to all
those individuals who have worked to
make our community a better place to
live for all citizens.
Vicki D. Pegg, Champion . . . . Montgomery County Commission
Debra Armanini . . . . . . Montgomery County Prosecutor’s OfficeDonna Audette . . . . . . . . . . . . . . . . . . . . . Shelter Services/YWCAThe Honorable Richard Bannister . . . . Vandalia Municipal CourtKen Betz . . . . . . . . . . . . . . Montgomery County Coroner’s OfficeKate Cauley . . . . . . . . . . . . . . . . Center for Healthy CommunitiesThe Honorable Denise Martin Cross . . . . . . Montgomery County
Domestic Relations CourtJames Dare . . . . . . . . . . . . . . . . . . . . . Montgomery County Court
of Common Pleas/Probation Dept.Dr. James H. Davis . . . . . . Montgomery County Coroner’s OfficeRonald A. Eckerle, Ph.D. . . . . . . . . . . . . . . Catholic Social ServicesLars Egede-Nissen . . . . . . . . . . . . . . . . . . . . . Planned ParenthoodDan Foley . . . . . . . . . . . . . . Montgomery County Clerk of CourtsKriss Haren . . . . . . . . . . . . . . . . . . . . . Womanline of Dayton, Inc.Dianne Herman . . . . . . . . . . . . . . . . . . . . . . . Artemis Center, Inc.Lisa Hermans . . . . . . . . . Ombudsman’s Office / Long Term CareCharlie Holderman . . . . . . . . . . . . . . . . . . . .Montgomery County
Adult Protective ServicesKathleen K. Hoyng . . . . . . . . . . . . . . . . . . . . . . . Deloitte & ToucheHelen Jones-Kelley . . . . . Montgomery County Children Services
Judith A. LaMusga . . . . . Montgomery County Board of MR/DDJames Levinson . . . . . . . Montgomery County Prosecutor’s OfficeDeidre Logan . . . . . . City of Dayton Municipal Court ProsecutorPat Mayer . . . . . . . . . . . . . . . . . . . . . . . . . . . Area Agency on AgingDouglas McGarry . . . . . . . . . . . . . . . . . . . . Area Agency on AgingLinda Mercuri-Fischbach . . . . . . . . . . Womanline of Dayton, Inc.Sharon Minturn . . . . . . . . . . . . . . . . Senior Resource ConnectionIdotha Bootsie Neal . . . . . . . . . . . . . . City of Dayton CommissionBonnie Parish . . . . . . . . . . . . . . . . . . . Family Services AssociationChief Deputy Tony Rankin . . . . . . . . . . . . . . Montgomery County
Sheriff ’s OfficeGregory Rozelle . . . . . . . . . . . . . . . . . . . Combined Health DistrictPatti Schwartztrauber . . . . . . . . . . . . . . . . . . . Artemis Center, Inc.Joseph Szoke . . . . . . . . ADAMHS Board of Montgomery CountyDave Vore . . . . . . . . . . . . . . . . . . . . . Montgomery County SheriffDeb Wenig . . . . . . . . . . . . . . . . . . . . . . . . League of Women VotersGary J. Weston . . . . . . . . . . . . . . . . . . Legal Aid Society of Dayton
Staff:Ann Johnson . . . . . . Montgomery County Commission AssistantEd McNachtan . . . . . . . . . . . . Office of Family and Children First
TEAM ROSTER

10
2002
PRO
GRES
S RE
PORT
The Family and Children First Council acts as an agent for the State of Ohio for
several grants to the community. The FCFC uses this role to ensure local collabora-
tive decision-making for these state initiatives. These grants are currently provided to
a variety of community agencies for services including teenage pregnancy prevention
and to provide support for the families of children ages 0 – 3 who have, or are at risk
for, developmental delays or disabilities.
Teenage PregnancyPrevention
FCFC administered various teenage pregnancy prevention efforts in 2002.
There are many statistics that illustrate the effects that teenage pregnancy has on
individuals, families and communities. The aggregate results of teenage pregnancy
are seen in reduced educational attainment, diminished economic resources and
increased chances of involvement with the juvenile court system by both the young
women who become pregnant and the children born of these pregnancies, when
compared to women who were not pregnant as teenagers. Other family members
also feel the ripple effects of teenage pregnancy.
The Family and Children First Council feels that this information is well
founded and is making local decisions with state funding to provide
interventions. Funding is currently focused through the Buckeye Trails
Girl Scout Council, Catholic Social Services, the Dayton Urban
League, Family Services Association and Planned Parenthood to
provide mentoring, life skills development and education on
healthy behaviors.
Community-Based Projects

FCFC continued
to administer the
Help Me Grow
program in 2002.
Funded by the
State of Ohio, Help
Me Grow is a pro-
gram for both
expectant parents and parents of newborns, infants
and toddlers under age three and their families.
Families access these services through one central
intake and referral phone number. By calling Starting
Point at 237-0123, families receive initial support and
information about the available voluntary services.
Services for newborns currently begin with a first
home visit by Fidelity Home Care, Kettering Medical
Center or Southview Maternity Home Health staff to
provide information, answer questions and make an
early assessment of any developmental needs of the
infant. If this visit suggests that further services may be
appropriate, the family is referred to the Montgomery
County Educational Services Center for follow up and
case planning. This case plan is individualized for the
family depending on the level of risk or prevailing
developmental delay or disability. The Greater Dayton
Area Hospital Association’s Brighter Futures program
also provides a counterpart program which begins pre-
natally and includes all services.
Help Me Grow provides valuable information
about child health, wellness, immunizations,
nutrition and developmental delays and
disabilities. Over 3,000 families from
throughout Montgomery County
received services from the Help
Me Grow program in 2002.
11
2002
PRO
GRES
S RE
PORT
TM
IF YOUAre pregnant, have a newborn or have a child under age 3
AND YOU• Want to give your child the best possible start in life
• Have questions or concerns about your child’s:GROWTHDEVELOPMENTMEDICAL, EMOTIONAL or EDUCATIONAL NEEDS
• Have a child with a possible or actual delay or disability
FOR
INFORMATIONANSWERSSERVICES
CALL 237-0123Help Me Grow

The Family and Children First Council provides support to projects that are
designed to enhance the human services system throughout Montgomery County
by improving knowledge, information and service delivery. Staffing for these
activities is provided by the Office of Family and Children First.
AgencyLinkAgencyLink is a technology project which includes a variety of
computer applications that are seamlessly integrated. Its purpose is to link social service
providers throughout Montgomery County to better meet the needs of their clients and
to improve the overall system. AgencyLink will support secure, collaborative and
efficient social service delivery by improving delivery of services, providing better data
for strategic planning, and an improved basis for service needs analysis.
AgencyLink’s infrastructure was put in place and tested in 2002. The .net soft-
ware technology tools will be tested in 2003 through the pilot use of the Resource
Directory and On-line Community modules. This infrastructure also currently
facilitates the Family Violence Database that is in pilot stage and will ultimately
connect other collaborative community activities, including Case Management.
Further AgencyLink information may be gained by visiting www.agencylink.org.
Diversity Awareness andCultural Competency
The Dayton Dialogue on Race Relations is an initiative that began in 2000. Its
goals are to improve race relations, eradicate racism and create a harmonious Miami
Valley community that understands, appreciates and values the diverse strengths
and dreams of its residents. These characteristics, ideally, would be demonstrated in
strong, positive interpersonal and economic relationships. The focus is to provide
long-term solutions to racial division in the form of healing, reconciliation and
understanding through action.
This collaborative initiative has received the support and input from all facets of
the Miami Valley community. The Family and Children First Council has partnered
with the Montgomery County Board of County Commissioners to provide financial
assistance to these efforts.
12
2002
PRO
GRES
S RE
PORT
Community Support/Other Projects and Activities

13
2002
PRO
GRES
S RE
PORT
Juvenile Sex OffenderManagement
The Juvenile Sex Offender Management Steering Committee was formed by the
FCFC to recommend local strategies for enhanced treatment and management of
juvenile sex offenders. Youth who have been found guilty of these offenses have
highly specialized supervision and usually remain on probation for 18 to 24 months.
On January 1, 2002, the Juvenile Sex Offender Registration Notification bill
went into effect in the state of Ohio. The committee has been involved in recom-
mending policies to implement the legislation and in related training. Several activi-
ties were completed in 2002 to respond appropriately to case management require-
ments. Montgomery County Juvenile Court trained a probation officer to manage its
juvenile sex offender caseload. A juvenile sex offender assessment protocol is being
developed in response to requests by community service providers. Committee mem-
bers also continue to train agencies in the use of a “red flag” screening tool that helps
identify youth who may share common characteristics with adjudicated sex offenders.
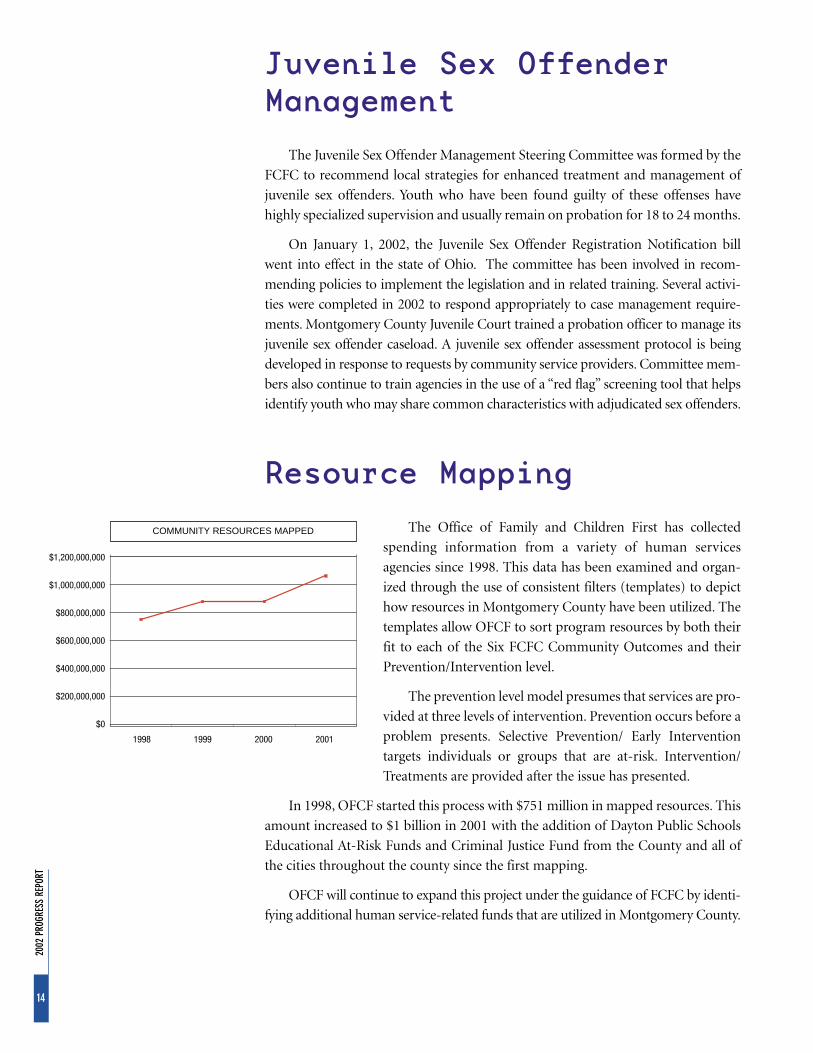
Resource MappingThe Office of Family and Children First has collected
spending information from a variety of human services
agencies since 1998. This data has been examined and organ-
ized through the use of consistent filters (templates) to depict
how resources in Montgomery County have been utilized. The
templates allow OFCF to sort program resources by both their
fit to each of the Six FCFC Community Outcomes and their
Prevention/Intervention level.
The prevention level model presumes that services are pro-
vided at three levels of intervention. Prevention occurs before a
problem presents. Selective Prevention/ Early Intervention
targets individuals or groups that are at-risk. Intervention/
Treatments are provided after the issue has presented.
In 1998, OFCF started this process with $751 million in mapped resources. This
amount increased to $1 billion in 2001 with the addition of Dayton Public Schools
Educational At-Risk Funds and Criminal Justice Fund from the County and all of
the cities throughout the county since the first mapping.
OFCF will continue to expand this project under the guidance of FCFC by identi-
fying additional human service-related funds that are utilized in Montgomery County.
14
2002
PRO
GRES
S RE
PORT
COMMUNITY RESOURCES MAPPED
1998 1999 2000 2001
$1,200,000,000
$1,000,000,000
$800,000,000
$600,000,000
$400,000,000
$200,000,000
$0

15
2002
PRO
GRES
S RE
PORT
Brother Raymond L. Fitz,S.M. Ph.D. Award
The Brother Raymond L. Fitz, S.M. Ph.D. Award was established by the FCFC
in 2001 to honor Brother Raymond L. Fitz, S.M., former president of the University
of Dayton, for his years of leadership and service to the community.
Brother Fitz served as the first chair of the FCFC from 1996 to 1999. He also
served as Chair of the New Futures/Youth and Family Collaborative for the Greater
Dayton Area from 1994 - 1995, and was co-chair of the Child Protection Task Force.
The Award is intended to recognize someone who exemplifies Brother Fitz’s extraor-
dinary dedication to the cause of nurturing and protecting children and families by
his or her everyday efforts in the community.
The winner of the 2002 Brother Raymond L. Fitz, S.M., Ph.D. Award was
Ronald Reigelsperger, an employee of the Montgomery County Juvenile Court for
27 years. After three years as a traditional probation officer, he requested a transfer
into Building Bridges because he believed he could have a greater impact on the lives
of court-involved youth within the advocacy structure of this program. He has been
with Building Bridges/Community-Based Services Program ever since, and is
currently the Supervisor for the Community-Based Services Unit.
Throughout his 25 years working for and supervising the Building Bridges
component of Community-Based Services, Ron never rested on his laurels.
He constantly strove for more for each youth and family. If a youth was
not responding to his direction and plan, he changed the direction.
If the youth was responding, Ron pushed harder to further
engage him/her. Ron thought of and interacted with each of
his probationers the same way he did with each of his own
children. Childhood is a resource Ron will not allow to be
squandered. The refrain heard consistently from proba-
tioners referred to him in the past is: “he stuck with me
through thick and thin … he never gave up on me.”
Ronald Reigelsperger

Outcomes and Indicators
What do they Really Mean?
Simply put, the purpose of the MontgomeryCounty Family and Children First Council is to helpthe community achieve its shared vision—thatMontgomery County is a place where families,children and adults live in safe, supportive neighbor-hoods, care for and respect one another, value eachother, and succeed in school, the workplace and life.
Serving as the lead collaborative for human services,the Council has focused on getting increasingly positiveresults for children and families as we strive to achievethe vision. This means asking a lot of questions:
“How are children and families doing?”
“Are conditions improving or getting worse?”
“How well do the community’s programs and services work?”
“Are we spending our resources in the most effective manner?”
“What can and should we do differently?”
These questions are aimed at maintaining andimproving the overall quality of life for the people wholive here. Asking these questions is easy but answeringthem can be difficult, partly because “quality of life” isa subjective term and there is no easy way to measureit. However, as our shared vision demonstrates, it ispossible to reach consensus on a general description.We can then identify some specific attributes that are measurable.
With the release of Turning the Curve in 1998, theCouncil began this series of annual reports and intro-
duced some tools that not only measure our progressbut also focus our discussion about things we can do aswe strive for better results. The tools—Outcomes,Indicators, Milestones and Targets—are discussed below:
Outcomes are conditions of well-being and are,by their nature, general and descriptive. Across thecountry, many communities have adopted statementsof desired outcomes. Locally, the Montgomery CountyFamily and Children First Council has articulated sixOutcomes:
■ Healthy People
■ Young People Succeeding
■ Stable Families
■ Positive Living for Special Populations
■ Safe and Supportive Neighborhoods
■ Economic Self-Sufficiency
(See Page 19 for a description of each Outcome.)Collectively, these Outcomes can be said to captureour shared vision.
Because of their general nature, Outcomes do notlend themselves to measurement. Therefore, in orderto quantify the achievement of the Outcomes, we haveselected some measurable attributes of the communi-ty to use as Indicators. They serve as proxies for theOutcomes. While there may be hundreds of potentialor available Indicators, in Montgomery County wehave chosen to begin with a small number for eachOutcome. The reasoning is that if these few Indicatorsare moving in the desired direction from year to year,then other related Indicators are also moving in thedesired direction and we are making progress towardachieving that Outcome.
The most useful Indicators are intuitively under-stood, reflect something basic about their associatedOutcome, and are ones for which data are available orobtainable. To make them more useful, we have,whenever possible, assembled data that not only reflectour own history but also enable us to compare
16
2002
PRO
GRES
S RE
PORT
(continued on Page 18)
Family and Children First Council Executive Committee meeting
17
2002
PRO
GRES
S RE
PORT
History
This work had its start in March
1996 when the Council began to operate.
One of the very first things it did was
to embrace results-based accountability
by charging an Outcomes Committee
with examining what other communi-
ties were doing in this area and with
developing a local set of Outcomes and
Indicators. Guided by the Council’s
feedback, the Committee prepared a
working draft that the Council approved
in November 1996.
At that point, the Committee
expanded and intensive data collection
and analysis began. In September 1997,
the Council received a revised working
draft which included trend data. The
Outcomes Committee continued to
revise and refine the document and, in
March 1998, “passed the torch” to
the newly appointed Accountability
Committee.
With the publication of Turning
the Curve later that year, the Council
formally adopted the tools discussed
above as well as the Targets
recommended by the Accountability
Committee. The Council continues to
honor its pledge to issue regular
reports on the community’s progress
in achieving the Outcomes.
How Is Improvement Measured?
1. Articulate Outcomes
2. Identify, track and report Indicator data
3. Set Targets
4. Monitor progress along Milestones

18
2002
PRO
GRES
S RE
PORT
ourselves to other large counties in Ohio, to the state asa whole, and to the nation.
Targets represent the goals for the Indicators inthe near-term future. The ideal Target can be consid-ered a “stretch goal” for an Indicator; in other words, avalue that the Indicator can reach with a fair amount ofintention and effort. Depending on the Indicator, theTarget may be a specific value and/or a relative rank incomparison to Ohio’s other urban counties. TheTargets were set in the inaugural Report (1998) withnext year’s Report (2003) in mind.
Milestones provide an approximate way of deter-mining whether progress toward a given Target is sufficiently aggressive during the reporting periodsprior to the 2003 Report.
How are we doing?Having tracked Indicator data for several years
allows us to suggest some answers to questions like“How are children and families doing?”
We can begin with the short-term trends—thedirection of the change when comparing the mostrecent data with the preceding year’s data. We label atrend as being in the desired direction if either thevalue or the rank (where both are applicable) hasmoved toward the Target, or if the value has remainedunchanged.
Using this definition, we observe that ten trends(out of 17) are in the desired direction. In the 2001report, 11 trends were reported as being in the desireddirection, while eight such trends were reported in the2000 Report and 11 such trends were reported in the1999 Report.
In other words, more than half of the Indicators(on average) have moved in the desired direction inany given year—meaning that almost half of theIndicators do not move in the desired direction in anygiven year. While it would seem from this year-to-yearcomparison that every step forward is matched by astep backward, a slightly different observation can begained with a longer-term perspective.
First we note that some of the Indicators in ourfirst Report are no longer tracked (for example, the12th-grade proficiency tests were discontinued) and
that two current Indicators (those for the PositiveLiving for Special Populations Outcome) were not partof the first Report.
When we look at the remaining Indicators, we seethat one Indicator has moved in the desired directioneach of the four years since the release of Turning theCurve, and another nine Indicators have made a netmove in the desired direction since then. In otherwords, ten of the 14 Indicators that have been trackedsince our first Report have improved over that time.
This is a slightly more encouraging observationthan that reached by the short-term year-to-year com-parison. They both add up to the sobering conclusionthat the conditions facing children and families meritour continued vigilance. This conclusion is reinforcedby the fact that many of the Indicators which haveimproved are still far from an acceptable level.
What has the Councildone?
After publishing Turning the Curve, the Councillooked at these data and other information and identi-fied a number of issues facing the community. Seekingto have a dramatic impact on these issues, the Councillaunched three Strategic Community Initiatives inareas determined to be of the highest priority:
■ Promoting School Readiness and Fourth Grade Success
■ Promoting Alternative Learning Opportunities
■ Preventing Family Violence
Collectively, these Initiatives set an action agendafor the Council. Each Initiative is led by a Champion—a respected community leader who stepped forwardand took charge at the Council’s request. TheChampions recruited broad-based Teams consisting ofCouncil members and others from the community,and have set a simple but ambitious goal: to design,stimulate and promote actions that make a dramaticimpact on the community’s Outcomes.
Each Team’s work has recognized that no Indicatormoves in isolation from a host of other factors, influ-ences and conditions in our society. Each trend needsto be viewed in that context to be better understood.
(continued from Page 16)

19
2002
PRO
GRES
S RE
PORT
Therefore, before discussing any responses or strategies,the Teams considered as much data as possible.
Once again, we have asked each Champion to pro-vide a report on his or her Initiative. (see Pages 2-9)Their work reminds us that Outcomes, Indicators andprograms are interrelated. No single agency or program is solely responsible for the status of any of
the targeted Indicators. In fact, each member of thecommunity has a role to play at some level. We expressour gratitude for your efforts and we renew our invita-tion for your continued help as we seek to turn thecurve and get increasingly positive results for our children, families and community.
Everyone makes choices—for themselves or forthose entrusted to their care—which promote betterhealth. Everyone gets the information and support theyneed to avoid preventable health problems. Both phys-ical and mental wellness are valued. Everyone hasaccess to an adequate level of health care, includingprenatal care, from birth through death.
Children are well prepared for learning whenthey start school and receive support outside of theclassroom for their efforts inside the classroom.Intellectual curiosity, skill development and achieve-ment are valued. Young people receive mentoring,guidance and support as they develop the capacity todifferentiate between positive and negative risk behav-iors. Positive role models are plentiful, and others in thecommunity talk to teenagers with candor and respectabout the difficult choices they face. Students finish highschool ready to compete successfully in the labor marketand/or in continuing education and skills development.
The community respects and supports families,recognizing that family composition in a diverse societyis varied. Family members have healthy relationshipswith each other. Families nurture their members andprovide a sense of well being and safety. Family memberswork together and feel that they also belong to some-thing larger than themselves.
HEALTHY PEOPLE
Outcomes
YOUNG PEOPLE SUCCEEDING
STABLE FAMILIES
POSITIVE LIVING FOR SPECIAL POPULATIONS
The elderly, and people of any age who are dis-abled, are supported (when necessary) with serviceswhich allow them to live in the most appropriate, leastrestrictive environment. With support from the community, everyone has the opportunity to partici-pate in every aspect of community living that he or shedesires. People with disabilities live, learn, work, andparticipate in typical accessible community settings.The community respects and protects their rights andincludes them as contributing members.
People live in safe, affordable housing. They haveaccess to positive educational and cultural experiences.Recreational centers are convenient and provide posi-tive role models, especially for the children. All aspectsof the environment—e.g., air, water, soil— are safe andhealthy. The community values the unique attributes ofeach neighborhood, whether rural or urban.
Residents have access to employment that provides a living wage and benefits. Barriers to employ-ment, including transportation and daycare issues, areminimized. Adequate opportunities for lifelong learn-ing help prepare the workforce for the realities of21st-century jobs. Educational, vocational training, andworker re-training services are readily available to support the needs of residents and employers.
OUR VISION FOR MONTGOMERY COUNTY (see back cover) is captured by these six Outcomes:
SAFE AND SUPPORTIVE NEIGHBORHOODS
ECONOMIC SELF-SUFFICIENCY
20
2002
PRO
GRES
S RE
PORT
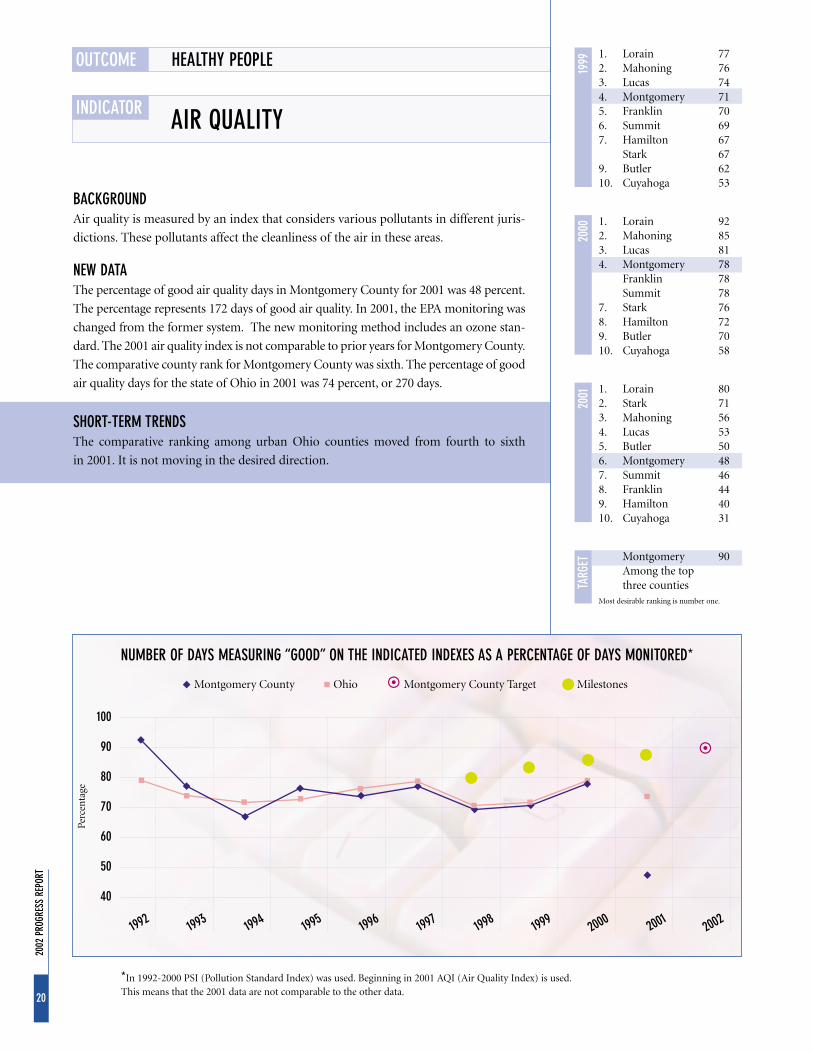
BACKGROUNDAir quality is measured by an index that considers various pollutants in different juris-
dictions. These pollutants affect the cleanliness of the air in these areas.
NEW DATAThe percentage of good air quality days in Montgomery County for 2001 was 48 percent.
The percentage represents 172 days of good air quality. In 2001, the EPA monitoring was
changed from the former system. The new monitoring method includes an ozone stan-
dard. The 2001 air quality index is not comparable to prior years for Montgomery County.
The comparative county rank for Montgomery County was sixth. The percentage of good
air quality days for the state of Ohio in 2001 was 74 percent, or 270 days.
SHORT-TERM TRENDSThe comparative ranking among urban Ohio counties moved from fourth to sixth
in 2001. It is not moving in the desired direction.
OUTCOME HEALTHY PEOPLE
INDICATOR AIR QUALITY
1999
2000
1. Lorain 772. Mahoning 763. Lucas 744. Montgomery 715. Franklin 706. Summit 697. Hamilton 67
Stark 679. Butler 6210. Cuyahoga 53
1. Lorain 922. Mahoning 853. Lucas 814. Montgomery 78
Franklin 78Summit 78
7. Stark 768. Hamilton 729. Butler 7010. Cuyahoga 58
2001 1. Lorain 80
2. Stark 713. Mahoning 564. Lucas 535. Butler 506. Montgomery 487. Summit 468. Franklin 449. Hamilton 4010. Cuyahoga 31
TARG
ET Montgomery 90Among the top three counties
Most desirable ranking is number one.
1992 1993 1994 1995 1996 1997 1998 1999 2000 200
1200
2
100
90
80
70
60
50
40
NUMBER OF DAYS MEASURING “GOOD” ON THE INDICATED INDEXES AS A PERCENTAGE OF DAYS MONITORED*
Montgomery County Ohio Montgomery County Target Milestones
Perc
enta
ge
*In 1992-2000 PSI (Pollution Standard Index) was used. Beginning in 2001 AQI (Air Quality Index) is used.This means that the 2001 data are not comparable to the other data.

21
2002
PRO
GRES
S RE
PORT
BACKGROUNDThe term “low birthweight” is used to describe babies born with a weight of less than
2,500 grams, or 5 lbs., 8 oz. Babies with higher birthweights are more likely to begin life
with a healthy start and to have mothers who had prenatal care and did not smoke or
drink during pregnancy. Strategies to affect birthweight are focused on education and
prevention.
NEW DATAThe provisional value for low birthweight for 2001 was 9.3 percent, less than the 2000
value of 9.5 percent. Montgomery County’s comparative county rank for 2000 was
tenth. The statewide provisional value for 2000 was 7.9 percent.
SHORT-TERM TRENDSThe 2001 value is moving in the desired direction when compared with the 2000 value.
However, Montgomery County’s comparative rank dropped from sixth in 1999 to tenth
in 2000.
OUTCOME HEALTHY PEOPLE
INDICATOR LOW BIRTHWEIGHT
1998
1999
1. Butler 7.4Lorain 7.4
3. Montgomery 7.84. Franklin 8.05. Stark 8.26. Mahoning 8.57. Hamilton 8.88. Summit 9.09. Cuyahoga 9.1
Lucas 9.1
1. Lorain 7.22. Butler 7.33. Lucas 8.1
Summit 8.15. Franklin 8.26. Montgomery 8.67. Stark 9.08. Cuyahoga 9.19. Mahoning 9.410. Hamilton 9.5
2000 1. Lorain 7.6
2. Stark 7.7Summit 7.7
4. Lucas 8.05. Butler 8.26. Hamilton 8.57. Franklin 8.68. Cuyahoga 9.19. Mahoning 9.210. Montgomery 9.5
TARG
ET Montgomery 6.6Among the top five counties
Most desirable ranking is number one.
1986 1987 1988 1989 1990 1991 1992 1993 1994 1995 1996 1997 1998 1999 *2000
*2001
2002
10
9.5
9
8.5
8
7.5
7
6.5
6
NUMBER OF BIRTHS WITH WEIGHTS LESS THAN 2,500 GRAMS (5 LB. 8 OZ.) AS A PERCENT OF TOTAL BIRTHS
Montgomery County Ohio United States Montgomery County Target Milestones
Perc
enta
ge
*2000 and 2001 data are provisional
22
2002
PRO
GRES
S RE
PORT
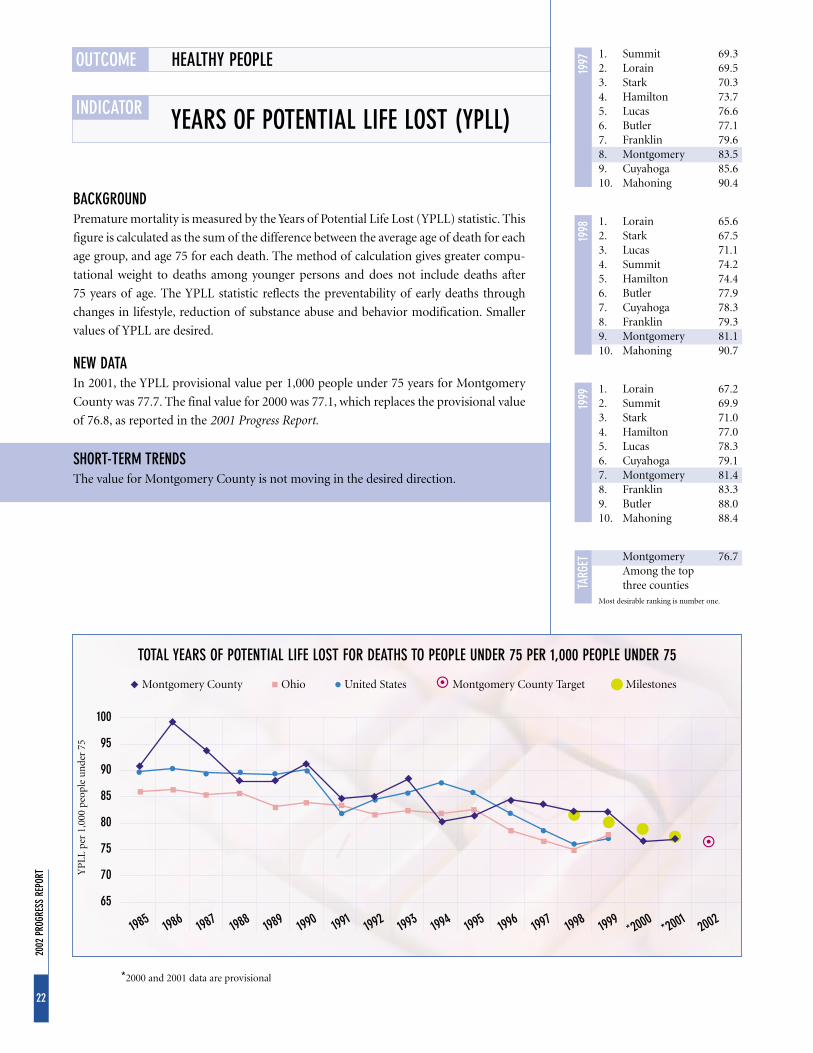
BACKGROUNDPremature mortality is measured by the Years of Potential Life Lost (YPLL) statistic. This
figure is calculated as the sum of the difference between the average age of death for each
age group, and age 75 for each death. The method of calculation gives greater compu-
tational weight to deaths among younger persons and does not include deaths after
75 years of age. The YPLL statistic reflects the preventability of early deaths through
changes in lifestyle, reduction of substance abuse and behavior modification. Smaller
values of YPLL are desired.
NEW DATAIn 2001, the YPLL provisional value per 1,000 people under 75 years for Montgomery
County was 77.7. The final value for 2000 was 77.1, which replaces the provisional value
of 76.8, as reported in the 2001 Progress Report.
SHORT-TERM TRENDSThe value for Montgomery County is not moving in the desired direction.
OUTCOME HEALTHY PEOPLE
INDICATOR YEARS OF POTENTIAL LIFE LOST (YPLL)
1. Summit 69.32. Lorain 69.53. Stark 70.34. Hamilton 73.75. Lucas 76.66. Butler 77.17. Franklin 79.68. Montgomery 83.59. Cuyahoga 85.610. Mahoning 90.4
1998
1999
1997
1. Lorain 65.62. Stark 67.53. Lucas 71.14. Summit 74.25. Hamilton 74.46. Butler 77.97. Cuyahoga 78.38. Franklin 79.39. Montgomery 81.110. Mahoning 90.7
1. Lorain 67.22. Summit 69.93. Stark 71.04. Hamilton 77.05. Lucas 78.36. Cuyahoga 79.17. Montgomery 81.48. Franklin 83.39. Butler 88.010. Mahoning 88.4
TARG
ET Montgomery 76.7Among the top three counties
Most desirable ranking is number one.
1985 1986 1987 1988 1989 1990 1991 1992 1993 1994 1995 1996 1997 1998 1999 *2000
*2001
2002
100
95
90
85
80
75
70
65
TOTAL YEARS OF POTENTIAL LIFE LOST FOR DEATHS TO PEOPLE UNDER 75 PER 1,000 PEOPLE UNDER 75
Montgomery County Ohio United States Montgomery County Target Milestones
YP
LL p
er 1
,000
peo
ple
un
der
75
*2000 and 2001 data are provisional

23
2002
PRO
GRES
S RE
PORT
1994 1995 1996 1997 1998 1999 2000 200
1200
2200
3
70
60
50
40
30
20
PERCENTAGE OF 4th GRADE STUDENTS PASSING ALL TESTS
Montgomery County Ohio Montgomery County Target Milestones
Perc
enta
ge
BACKGROUNDOhio students are currently required to take fourth-grade proficiency tests in several
academic areas. The Family and Children First Council sets targets for the percentage of
students passing all portions of this examination. By convention, data are reported for
the year in which a school year ends. Fourth graders may now, in some cases, be
promoted to the fifth grade although they have scored in the “below basic” range of
performance. In previous years, students who did not pass all portions of the fourth-
grade proficiency test were not promoted.
NEW DATAIn school year 2002, 39.5 percent of Montgomery County students passed all portions
of the fourth-grade exams. Montgomery County ranked eighth among urban Ohio
counties. The percentage of students in the state of Ohio who passed all portions of the
exams in 2002 was 41.1.
SHORT-TERM TRENDSThe value is moving in the right direction. The comparative ranking among counties
remained at eighth, as it was the previous year.
OUTCOME YOUNG PEOPLE SUCCEEDING
INDICATOR STUDENT PROFICIENCY — 4th grade
2000
2001
1. Butler 34.02. Mahoning 33.33. Summit 32.94. Stark 32.85. Cuyahoga 31.2
Franklin 31.27. Hamilton 28.48. Lorain 27.79. Montgomery 26.710. Lucas 21.2
1. Summit 42.82. Butler 42.23. Mahoning 41.94. Stark 38.85. Franklin 35.76. Cuyahoga 35.37. Hamilton 34.98. Montgomery 34.69. Lorain 33.910. Lucas 27.5
2002 1. Butler 47.4
2. Stark 46.13. Mahoning 45.04. Summit 43.25. Lorain 41.66. Franklin 41.27. Hamilton 40.58. Montgomery 39.59. Cuyahoga 39.410. Lucas 34.2
TARG
ET Montgomery 34.4Among the top five counties
Most desirable ranking is number one.
Note: 1995-1998 percentages can be compared. In 1999, the standard for passing was raised.

24
2002
PRO
GRES
S RE
PORT
BACKGROUNDOhio students are currently required to take sixth-grade proficiency tests in several
academic areas. The Family and Children First Council sets targets for the percentage of
students passing all portions of this examination. By convention, data are reported for
the year in which a school year ends.
NEW DATAThe percentage of Montgomery County students who passed all portions of the sixth-
grade proficiency examination in 2002 was 40.7. Montgomery County ranked seventh
among urban Ohio counties in 2002. The state of Ohio value for students passing all
portions of the sixth-grade proficiency test in 2002 was 40.8 percent.
SHORT-TERM TRENDSThe value of this indicator is moving in the desired direction. The comparative county
value for Montgomery County stayed the same with a rank of seventh.
OUTCOME YOUNG PEOPLE SUCCEEDING
INDICATOR STUDENT PROFICIENCY — 6th grade
2000
2001
1. Butler 43.62. Mahoning 39.13. Hamilton 35.9
Stark 35.95. Summit 33.86. Franklin 31.37. Cuyahoga 30.58. Lorain 30.49. Lucas 30.310. Montgomery 29.9
1. Butler 49.82. Mahoning 46.13. Stark 44.34. Hamilton 42.65. Summit 42.36. Lorain 39.97. Montgomery 39.68. Franklin 37.89. Cuyahoga 35.510. Lucas 35.3
2002 1. Butler 51.3
2. Mahoning 46.0Stark 46.0
4. Summit 44.45. Hamilton 42.16. Lorain 41.07. Montgomery 40.78. Franklin 40.19. Cuyahoga 36.110. Lucas 33.2
TARG
ET Montgomery 31.7Among the top five counties
Most desirable ranking is number one.
1995 1996 1997 1998 1999 2000 200
1200
2200
3
60
50
40
30
20
10
PERCENTAGE OF 6th GRADE STUDENTS PASSING ALL TESTS
Montgomery County Ohio Montgomery County Target Milestones
Perc
enta
ge
25
2002
PRO
GRES
S RE
PORT
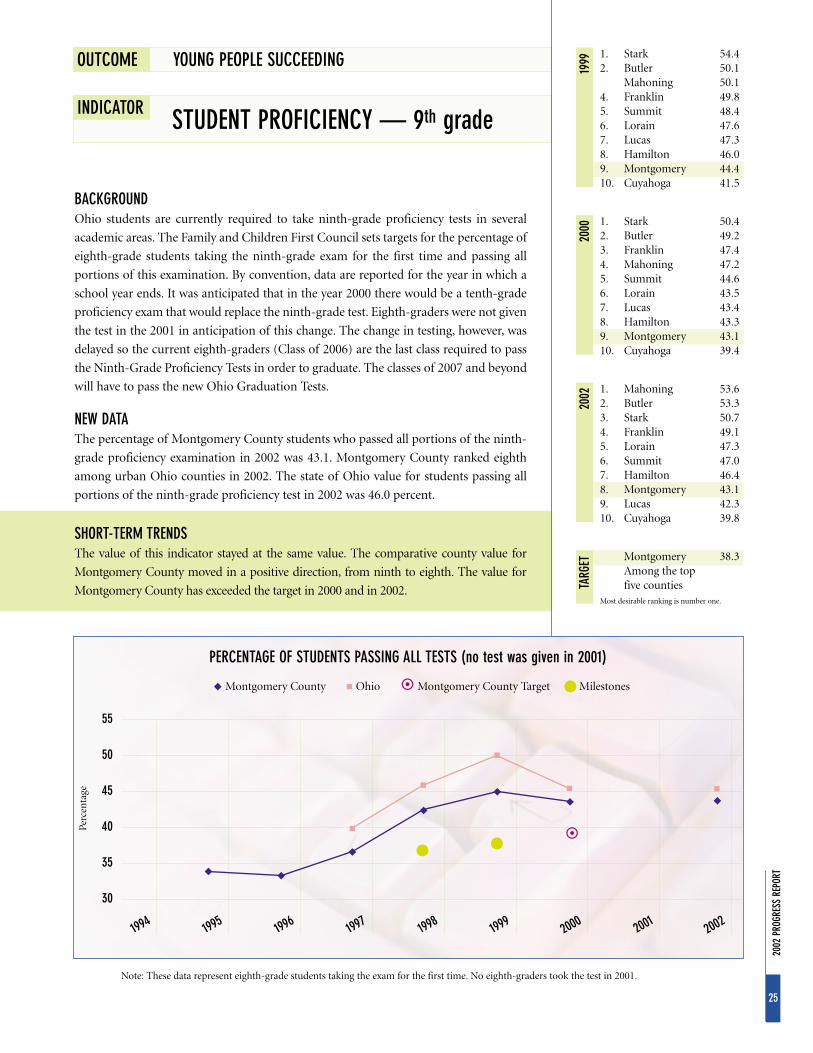
OUTCOME YOUNG PEOPLE SUCCEEDING
INDICATOR STUDENT PROFICIENCY — 9th grade
1. Stark 54.42. Butler 50.1
Mahoning 50.14. Franklin 49.85. Summit 48.46. Lorain 47.67. Lucas 47.38. Hamilton 46.09. Montgomery 44.410. Cuyahoga 41.5
2002
1999
1. Stark 50.42. Butler 49.23. Franklin 47.44. Mahoning 47.25. Summit 44.66. Lorain 43.57. Lucas 43.48. Hamilton 43.39. Montgomery 43.110. Cuyahoga 39.4
2000
1. Mahoning 53.62. Butler 53.33. Stark 50.74. Franklin 49.15. Lorain 47.36. Summit 47.07. Hamilton 46.48. Montgomery 43.19. Lucas 42.310. Cuyahoga 39.8
TARG
ET Montgomery 38.3Among the top five counties
Most desirable ranking is number one.
BACKGROUNDOhio students are currently required to take ninth-grade proficiency tests in several
academic areas. The Family and Children First Council sets targets for the percentage of
eighth-grade students taking the ninth-grade exam for the first time and passing all
portions of this examination. By convention, data are reported for the year in which a
school year ends. It was anticipated that in the year 2000 there would be a tenth-grade
proficiency exam that would replace the ninth-grade test. Eighth-graders were not given
the test in the 2001 in anticipation of this change. The change in testing, however, was
delayed so the current eighth-graders (Class of 2006) are the last class required to pass
the Ninth-Grade Proficiency Tests in order to graduate. The classes of 2007 and beyond
will have to pass the new Ohio Graduation Tests.
NEW DATAThe percentage of Montgomery County students who passed all portions of the ninth-
grade proficiency examination in 2002 was 43.1. Montgomery County ranked eighth
among urban Ohio counties in 2002. The state of Ohio value for students passing all
portions of the ninth-grade proficiency test in 2002 was 46.0 percent.
SHORT-TERM TRENDSThe value of this indicator stayed at the same value. The comparative county value for
Montgomery County moved in a positive direction, from ninth to eighth. The value for
Montgomery County has exceeded the target in 2000 and in 2002.
1994 1995 1996 1997 1998 1999 2000 200
1200
2
55
50
45
40
35
30
PERCENTAGE OF STUDENTS PASSING ALL TESTS (no test was given in 2001)
Montgomery County Ohio Montgomery County Target Milestones
Perc
enta
ge
Note: These data represent eighth-grade students taking the exam for the first time. No eighth-graders took the test in 2001.
26
2002
PRO
GRES
S RE
PORT
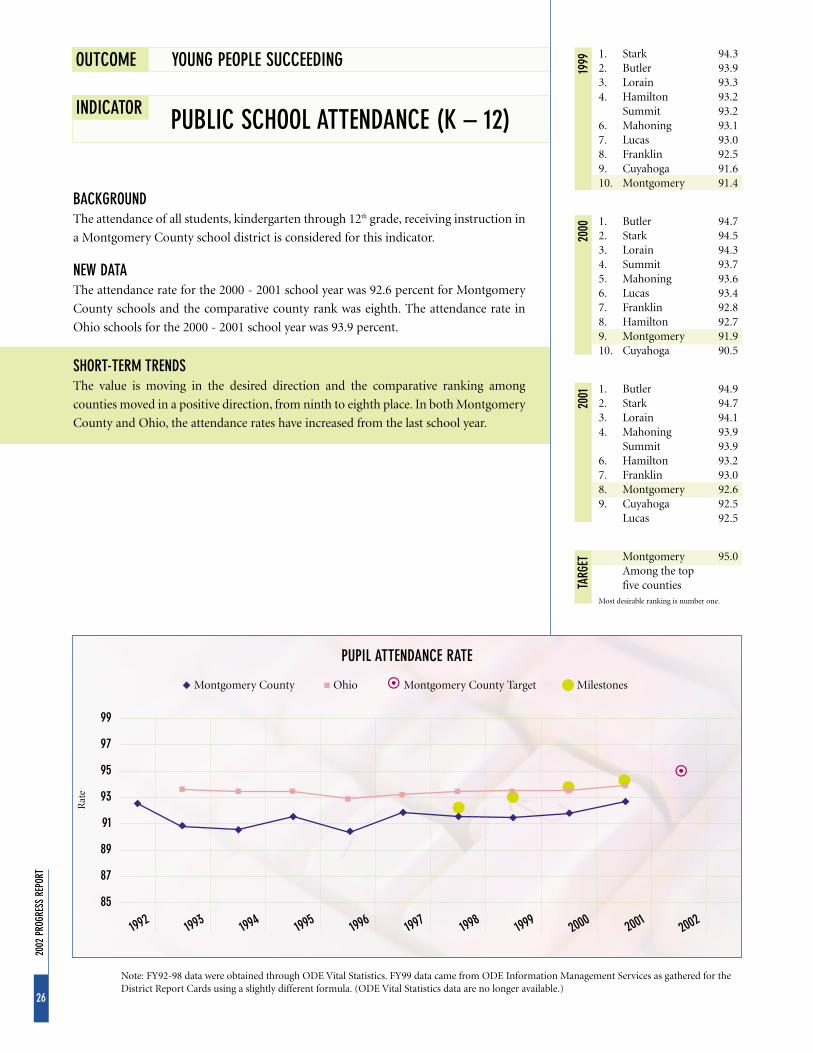
BACKGROUNDThe attendance of all students, kindergarten through 12th grade, receiving instruction in
a Montgomery County school district is considered for this indicator.
NEW DATAThe attendance rate for the 2000 - 2001 school year was 92.6 percent for Montgomery
County schools and the comparative county rank was eighth. The attendance rate in
Ohio schools for the 2000 - 2001 school year was 93.9 percent.
SHORT-TERM TRENDSThe value is moving in the desired direction and the comparative ranking among
counties moved in a positive direction, from ninth to eighth place. In both Montgomery
County and Ohio, the attendance rates have increased from the last school year.
OUTCOME YOUNG PEOPLE SUCCEEDING
INDICATOR PUBLIC SCHOOL ATTENDANCE (K – 12)
1999
2000
1. Stark 94.32. Butler 93.93. Lorain 93.34. Hamilton 93.2
Summit 93.26. Mahoning 93.17. Lucas 93.08. Franklin 92.59. Cuyahoga 91.610. Montgomery 91.4
1. Butler 94.72. Stark 94.53. Lorain 94.34. Summit 93.75. Mahoning 93.66. Lucas 93.47. Franklin 92.88. Hamilton 92.79. Montgomery 91.910. Cuyahoga 90.5
2001 1. Butler 94.9
2. Stark 94.73. Lorain 94.14. Mahoning 93.9
Summit 93.96. Hamilton 93.27. Franklin 93.08. Montgomery 92.69. Cuyahoga 92.5
Lucas 92.5
TARG
ET Montgomery 95.0Among the top five counties
Most desirable ranking is number one.
1992 1993 1994 1995 1996 1997 1998 1999 2000 200
1200
2
99
97
95
93
91
89
87
85
PUPIL ATTENDANCE RATE
Montgomery County Ohio Montgomery County Target Milestones
Rat
e
Note: FY92-98 data were obtained through ODE Vital Statistics. FY99 data came from ODE Information Management Services as gathered for theDistrict Report Cards using a slightly different formula. (ODE Vital Statistics data are no longer available.)

27
2002
PRO
GRES
S RE
PORT
BACKGROUNDThe teen pregnancy value includes the number of teen births, fetal losses and termina-
tions of pregnancy. The child of a teen mother has a greater risk of being premature and
experiencing poverty, child abuse and, if female, premature childbearing.
NEW DATAIn 2000, the value for teen pregnancy for Montgomery County was 4.1 percent.
SHORT-TERM TRENDSThe value is moving in the desired direction.
OUTCOME YOUNG PEOPLE SUCCEEDING
INDICATOR TEEN PREGNANCY
1. Lorain 2.82. Stark 3.53. Summit 3.94. Mahoning 4.45. Butler 4.86. Montgomery 5.37. Hamilton 5.58. Franklin 5.79. Cuyahoga 6.710. Lucas 8.0
1998
1999
1997
1. Lorain 2.22. Mahoning 3.6
Stark 3.64. Butler 4.05. Summit 4.36. Montgomery 4.77. Hamilton 5.18. Franklin 5.49. Cuyahoga 5.910. Lucas 7.1
1. Lorain 2.22. Stark 3.43. Mahoning 3.84. Butler 4.1
Summit 4.16. Montgomery 4.57. Franklin 4.7
Hamilton 4.79. Cuyahoga 5.510. Lucas 6.7
TARG
ET Montgomery 4.7Among the top three counties
Most desirable ranking is number one.
1990 1991 1992 1993 1994 1995 1996 1997 1998 1999 2000 200
1200
2
NUMBER OF PREGNANCIES IN FEMALES AGES 15 – 17 AS A PERCENT OF ALL FEMALES 15 – 17
Montgomery County Ohio Montgomery County Target Milestones
6.5
6.0
5.5
5.0
4.5
4.0
3.5
3.0
Perc
enta
ge
Teen Pregnancy = (Births + Abortions + Fetal Losses)Notes: Calculations made by Combined Health District, Office of Epidemiology.
28
2002
PRO
GRES
S RE
PORT
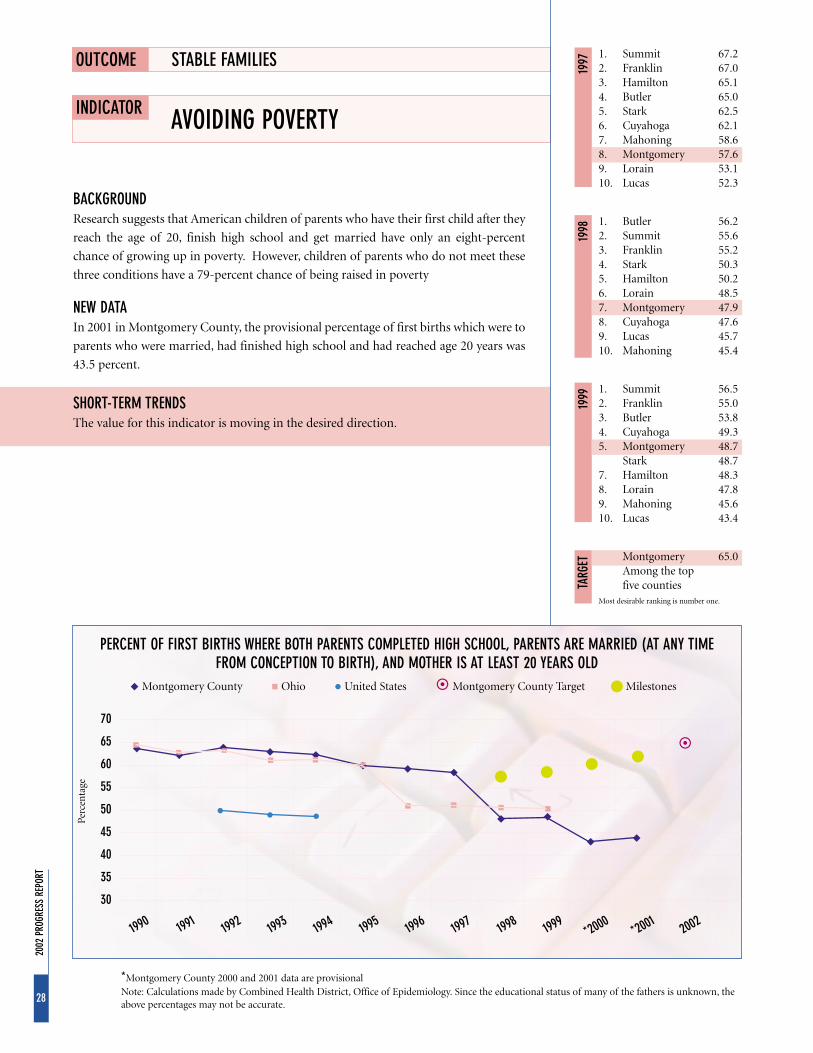
BACKGROUNDResearch suggests that American children of parents who have their first child after they
reach the age of 20, finish high school and get married have only an eight-percent
chance of growing up in poverty. However, children of parents who do not meet these
three conditions have a 79-percent chance of being raised in poverty
NEW DATAIn 2001 in Montgomery County, the provisional percentage of first births which were to
parents who were married, had finished high school and had reached age 20 years was
43.5 percent.
SHORT-TERM TRENDSThe value for this indicator is moving in the desired direction.
OUTCOME STABLE FAMILIES
INDICATOR AVOIDING POVERTY
1. Summit 67.22. Franklin 67.03. Hamilton 65.14. Butler 65.05. Stark 62.56. Cuyahoga 62.17. Mahoning 58.68. Montgomery 57.69. Lorain 53.110. Lucas 52.3
1998
1999
1997
1. Butler 56.22. Summit 55.63. Franklin 55.24. Stark 50.35. Hamilton 50.26. Lorain 48.57. Montgomery 47.98. Cuyahoga 47.69. Lucas 45.710. Mahoning 45.4
1. Summit 56.52. Franklin 55.03. Butler 53.84. Cuyahoga 49.35. Montgomery 48.7
Stark 48.77. Hamilton 48.38. Lorain 47.89. Mahoning 45.610. Lucas 43.4
TARG
ET Montgomery 65.0Among the top five counties
Most desirable ranking is number one.
1990 1991 1992 1993 1994 1995 1996 1997 1998 1999 *2000
*2001
2002
PERCENT OF FIRST BIRTHS WHERE BOTH PARENTS COMPLETED HIGH SCHOOL, PARENTS ARE MARRIED (AT ANY TIME FROM CONCEPTION TO BIRTH), AND MOTHER IS AT LEAST 20 YEARS OLD
Montgomery County Ohio United States Montgomery County Target Milestones
70
65
60
55
50
45
40
35
30
Perc
enta
ge
*Montgomery County 2000 and 2001 data are provisionalNote: Calculations made by Combined Health District, Office of Epidemiology. Since the educational status of many of the fathers is unknown, theabove percentages may not be accurate.

29
2002
PRO
GRES
S RE
PORT
BACKGROUNDThe Family and Children First Council has adopted a target of zero tolerance for domestic violence-related
homicides. The number of domestic violence deaths is a solid indicator of the prevalence of domestic
violence in a community.
NEW DATAIn 2001, there were 10 domestic violence-related deaths in Montgomery County.
SHORT-TERM TRENDSThe value is moving in the desired direction.
OUTCOME STABLE FAMILIES
INDICATOR DOMESTIC VIOLENCE DEATHS
1992 1993 1994 1995 1996 1997 1998 1999 2000 200
1200
2
25
20
15
10
5
0
NUMBER OF DEATHS IN MONTGOMERY COUNTY DUE TO DOMESTIC VIOLENCE
Montgomery County Montgomery County Target Milestones
Nu
mbe
r of
Dea
ths
Note: Data include victims of all ages and genders. Information is not available from other counties.
30
2002
PRO
GRES
S RE
PORT
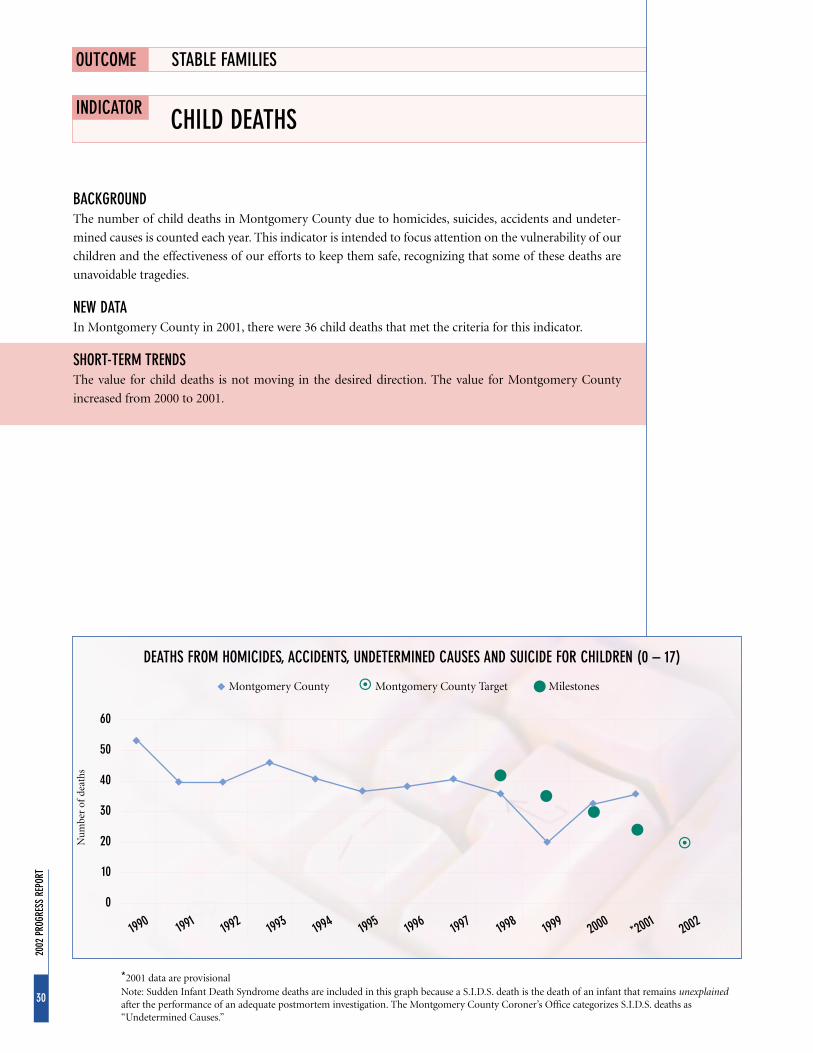
BACKGROUNDThe number of child deaths in Montgomery County due to homicides, suicides, accidents and undeter-
mined causes is counted each year. This indicator is intended to focus attention on the vulnerability of our
children and the effectiveness of our efforts to keep them safe, recognizing that some of these deaths are
unavoidable tragedies.
NEW DATAIn Montgomery County in 2001, there were 36 child deaths that met the criteria for this indicator.
SHORT-TERM TRENDSThe value for child deaths is not moving in the desired direction. The value for Montgomery County
increased from 2000 to 2001.
OUTCOME STABLE FAMILIES
INDICATOR CHILD DEATHS
DEATHS FROM HOMICIDES, ACCIDENTS, UNDETERMINED CAUSES AND SUICIDE FOR CHILDREN (0 – 17)
1990 1991 1992 1993 1994 1995 1996 1997 1998 1999 2000
*2001
2002
Montgomery County Montgomery County Target Milestones
60
50
40
30
20
10
0
Nu
mbe
r of
deat
hs
*2001 data are provisionalNote: Sudden Infant Death Syndrome deaths are included in this graph because a S.I.D.S. death is the death of an infant that remains unexplainedafter the performance of an adequate postmortem investigation. The Montgomery County Coroner’s Office categorizes S.I.D.S. deaths as“Undetermined Causes.”
31
2002
PRO
GRES
S RE
PORT
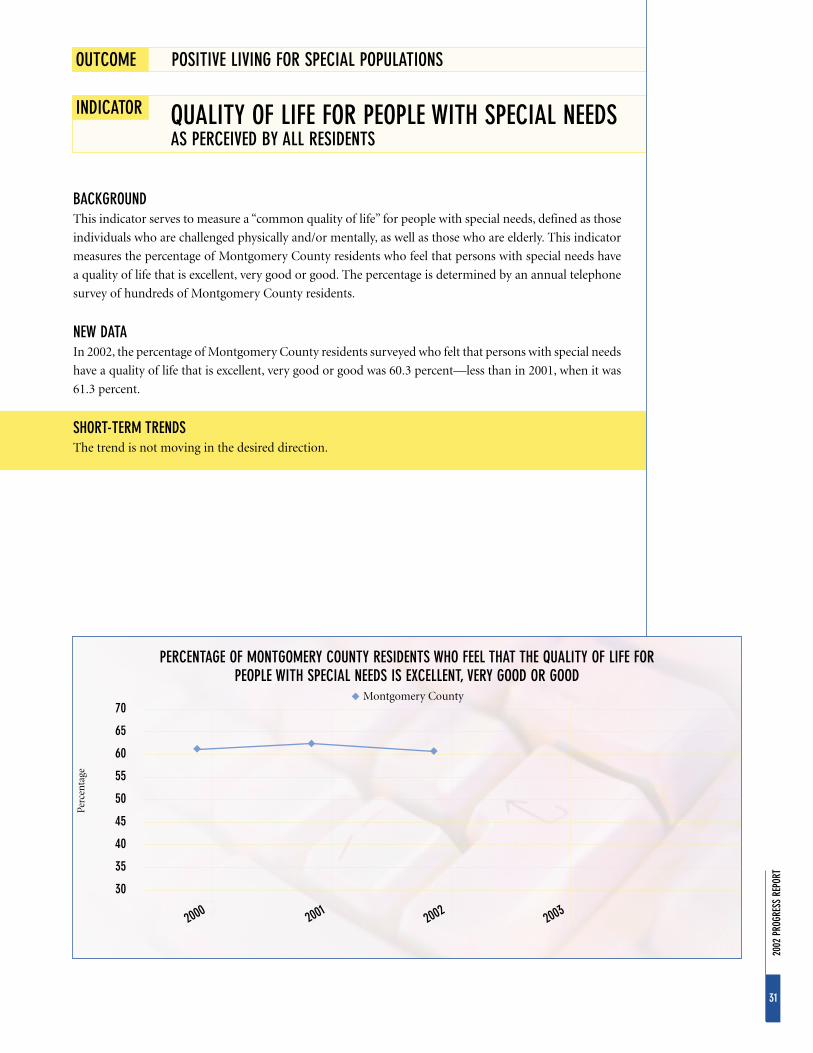
BACKGROUNDThis indicator serves to measure a “common quality of life” for people with special needs, defined as those
individuals who are challenged physically and/or mentally, as well as those who are elderly. This indicator
measures the percentage of Montgomery County residents who feel that persons with special needs have
a quality of life that is excellent, very good or good. The percentage is determined by an annual telephone
survey of hundreds of Montgomery County residents.
NEW DATAIn 2002, the percentage of Montgomery County residents surveyed who felt that persons with special needs
have a quality of life that is excellent, very good or good was 60.3 percent—less than in 2001, when it was
61.3 percent.
SHORT-TERM TRENDSThe trend is not moving in the desired direction.
OUTCOME POSITIVE LIVING FOR SPECIAL POPULATIONS
INDICATOR QUALITY OF LIFE FOR PEOPLE WITH SPECIAL NEEDSAS PERCEIVED BY ALL RESIDENTS
PERCENTAGE OF MONTGOMERY COUNTY RESIDENTS WHO FEEL THAT THE QUALITY OF LIFE FOR PEOPLE WITH SPECIAL NEEDS IS EXCELLENT, VERY GOOD OR GOOD
2000 200
1200
2200
3
70
65
60
55
50
45
40
35
30
Perc
enta
ge
Montgomery County

32
2002
PRO
GRES
S RE
PORT
BACKGROUNDThis Indicator also serves to measure a “common quality of life” for people with special needs, defined as
those individuals who are challenged physically and/or mentally, as well as those who are elderly. This
indicator focuses on those Montgomery County residents who have a household member with
special needs and/or a family member living in Montgomery County with special needs. It measures the
percentage of those residents who feel that persons with special needs have a quality of life that is excellent,
very good or good. The percentage is determined by an annual telephone survey of hundreds of
Montgomery County residents.
NEW DATAIn 2002, of those Montgomery County residents who have a household member with special needs and/or
a family member living in Montgomery County with special needs, 60.5 percent feel the quality of life for
people with special needs is excellent, very good or good, which is less than 61.0 percent in 2001.
SHORT-TERM TRENDSThis trend is not moving in the desired direction.
OUTCOME POSITIVE LIVING FOR SPECIAL POPULATIONS
INDICATOR QUALITY OF LIFE FOR PEOPLE WITH SPECIAL NEEDSAS PERCEIVED BY SELECTED RESIDENTS
OF MONTGOMERY COUNTY RESIDENTS WHO HAVE A HOUSEHOLD MEMBER WITH SPECIAL NEEDS AND/OR A FAMILY MEMBER LIVING IN MONTGOMERY COUNTY WITH SPECIAL NEEDS, PERCENTAGE WHO FEEL THAT
THE QUALITY OF LIFE FOR PEOPLE WITH SPECIAL NEEDS IS EXCELLENT, VERY GOOD OR GOOD
2000* 200
1200
2200
3
70
65
60
55
50
45
40
35
30
Perc
enta
ge
*Survey protocol in 2000 did not identify residents who have a family member with special needs living in Montgomery County. Therefore datafrom the 2000 survey are not comparable.
Montgomery County

33
2002
PRO
GRES
S RE
PORT
BACKGROUNDViolent crime is measured by incidents per 1,000 residents. Violent crimes include mur-
ders, forcible rapes, robberies and aggravated assaults reported in the Uniform Crime
Index published by the FBI.
NEW DATAThe violent crime rate for Montgomery County in 2000 was 6.0%, ranking Montgomery
County seventh among Ohio’s largest counties. In 2000, the value for violent crime for
Ohio was 3.3% and 5.0% for the United States.
SHORT-TERM TRENDSThe value is not moving in the desired direction. The rank remains the same as in 1999.
OUTCOME SAFE AND SUPPORTIVE NEIGHBORHOODS
INDICATOR VIOLENT CRIME
1998
1999
1. Lorain 2.22. Montgomery 4.63. Butler 4.94. Stark 5.15. Franklin 6.46. Lucas 7.07. Mahoning 7.48. Cuyahoga 7.5
Hamilton Ins. dataSummit Ins. data
1. Stark 1.02. Lorain 2.13. Summit 2.34. Butler 3.45. Mahoning 3.56. Hamilton 3.87. Montgomery 4.38. Cuyahoga 4.89. Lucas 5.210. Franklin 6.5
2000 1. Lorain 1.8
2. Summit 2.03. Butler 3.34. Hamilton 4.65. Stark 4.76. Lucas 5.87. Montgomery 6.08. Franklin 6.49. Cuyahoga 6.7
Mahoning Ins. data
TARG
ET Montgomery 5.0Among the top three counties
Most desirable ranking is number one.
VIOLENT CRIME
Montgomery County Ohio United States Montgomery County Target Milestones
1985 1986 1987 1988 1989 1990 1991 1992 1993 1994 1995 1996 1997 1998 1999 2000 200
1
9
8
7
6
5
4
3
2
Cri
mes
per
1,0
00 p
opu
lati
on
Note: Violent crimes represented in this graph are Murder, Forcible Rape, Robbery and Aggravated Assault.
Ins. data = Insufficient Data

34
2002
PRO
GRES
S RE
PORT
BACKGROUNDThe property crime rate is measured by incidents per 1,000 residents. Property crimes
include burglary, larceny and motor vehicle theft and are reported by the Uniform
Crime Index published by the FBI.
NEW DATAIn 2000, the property crime rate for Montgomery County was 56.5, ranking Montgomery
County seventh among Ohio’s largest counties. The property crime rate for Ohio was 37.0
in 2000 and 36.1 for the United States.
SHORT-TERM TRENDSBased on the counties for which sufficient data are available, the rank has moved from
eighth to seventh. The trend is moving in the right direction.
OUTCOME SAFE AND SUPPORTIVE NEIGHBORHOODS
INDICATOR PROPERTY CRIME
1998
1999
1. Lorain 21.32. Stark 35.33. Butler 41.24. Mahoning 42.15. Cuyahoga 42.46. Montgomery 52.17. Lucas 62.88. Franklin 73.9
Hamilton Ins. dataSummit Ins. data
1. Stark 14.02. Lorain 21.03. Mahoning 23.14. Cuyahoga 28.45. Summit 33.66. Hamilton 39.17. Butler 40.78. Montgomery 44.99. Lucas 56.410. Franklin 68.6
2000 1. Lorain 19.8
2. Summit 26.93. Stark 33.94. Cuyahoga 38.65. Hamilton 41.86. Butler 42.67. Montgomery 56.58. Lucas 59.39. Franklin 67.3
Mahoning Ins. data
TARG
ET Montgomery 50.0Among the top five counties
Most desirable ranking is number one.
PROPERTY CRIME
Montgomery County Ohio United States Montgomery County Target Milestones
1985 1986 1987 1988 1989 1990 1991 1992 1993 1994 1995 1996 1997 1998 1999 2000 200
1
Note: Property crimes represented in this graph are Burglary, Larceny and Motor Vehicle Theft.
Ins. data = Insufficient Data
65
60
55
50
45
40
35
30
25
20
Cri
mes
per
1,0
00 p
opu
lati
on

35
2002
PRO
GRES
S RE
PORT
BACKGROUNDThe unemployment rate is a measure of the percentage of the labor force that is unem-
ployed. The unemployment rate reflects the match between the number of people seeking
employment and the number of available jobs. Factors that influence unemployment are
transportation, child care and work skills.
NEW DATAThe value for unemployment in Montgomery County in 2001 was 4.3 percent. The com-
parative rank among counties was fifth for Montgomery County. The unemployment
rate for the state of Ohio in 2001 was 4.3 percent and the United States unemployment
rate in 2001 was 4.8 percent.
SHORT-TERM TRENDSThe trend is not moving in the desired direction. The comparative rank among counties
moved from fourth to fifth. The value did not move in the desired direction from 2000
to 2001.
OUTCOME ECONOMIC SELF-SUFFICIENCY
INDICATOR UNEMPLOYMENT
1999
2000
1. Franklin 2.52. Butler 3.23. Hamilton 3.54. Montgomery 3.85. Summit 4.26. Stark 4.57. Cuyahoga 4.68. Lorain 4.89. Lucas 5.210. Mahoning 5.5
1. Franklin 2.42. Butler 3.03. Hamilton 3.64. Montgomery 3.85. Summit 4.06. Stark 4.17. Cuyahoga 4.68. Lucas 4.99. Lorain 5.110. Mahoning 5.6
2001 1. Franklin 2.8
2. Butler 3.23. Hamilton 3.64. Stark 4.05. Montgomery 4.3
Summit 4.37. Cuyahoga 4.68. Lucas 5.09. Lorain 5.610. Mahoning 5.9
TARG
ET Montgomery County one ofthe three counties with thelowest unemployment ratesMost desirable ranking is number one.
1990 1991 1992 1993 1994 1995 1996 1997 1998 1999 2000 200
1200
2
UNEMPLOYMENT RATE
Montgomery County Ohio United States
8
7
6
5
4
3
2
1
0
Perc
enta
ge
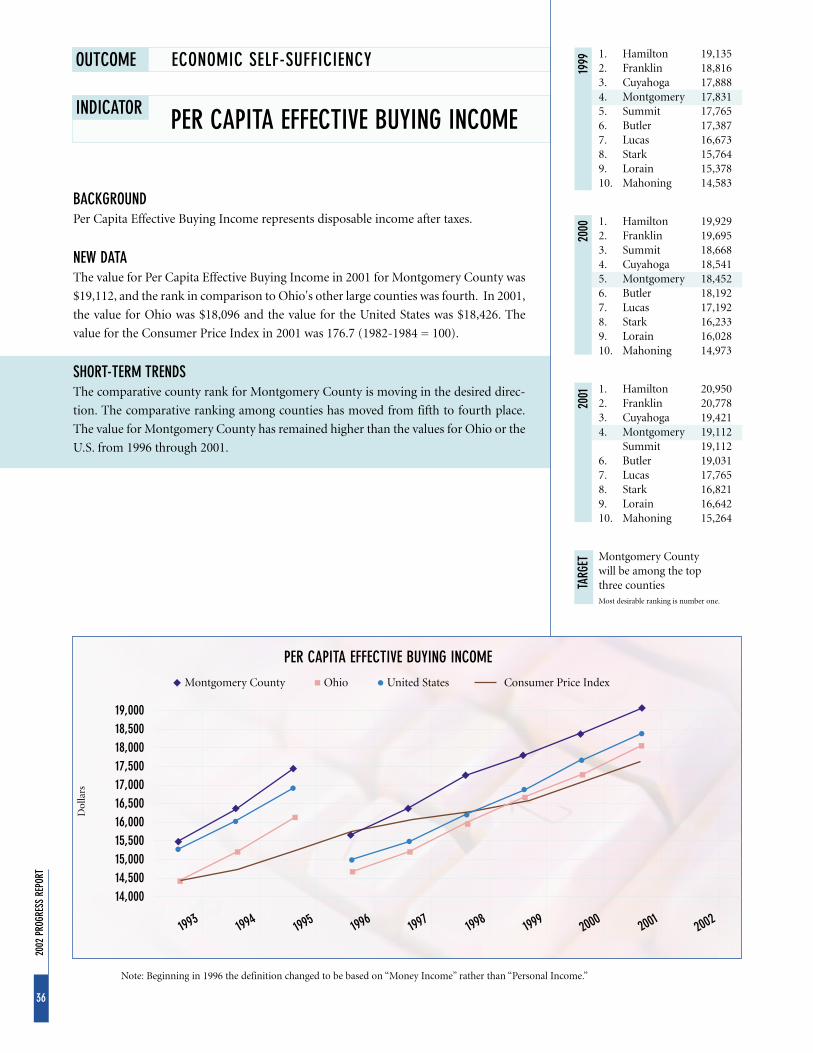
36
2002
PRO
GRES
S RE
PORT
BACKGROUNDPer Capita Effective Buying Income represents disposable income after taxes.
NEW DATAThe value for Per Capita Effective Buying Income in 2001 for Montgomery County was
$19,112, and the rank in comparison to Ohio's other large counties was fourth. In 2001,
the value for Ohio was $18,096 and the value for the United States was $18,426. The
value for the Consumer Price Index in 2001 was 176.7 (1982-1984 = 100).
SHORT-TERM TRENDSThe comparative county rank for Montgomery County is moving in the desired direc-
tion. The comparative ranking among counties has moved from fifth to fourth place.
The value for Montgomery County has remained higher than the values for Ohio or the
U.S. from 1996 through 2001.
OUTCOME ECONOMIC SELF-SUFFICIENCY
INDICATOR PER CAPITA EFFECTIVE BUYING INCOME
1999
2000
1. Hamilton 19,1352. Franklin 18,8163. Cuyahoga 17,8884. Montgomery 17,8315. Summit 17,7656. Butler 17,387 7. Lucas 16,6738. Stark 15,7649. Lorain 15,37810. Mahoning 14,583
1. Hamilton 19,9292. Franklin 19,6953. Summit 18,6684. Cuyahoga 18,5415. Montgomery 18,4526. Butler 18,192 7. Lucas 17,1928. Stark 16,2339. Lorain 16,02810. Mahoning 14,973
2001 1. Hamilton 20,950
2. Franklin 20,7783. Cuyahoga 19,4214. Montgomery 19,112
Summit 19,1126. Butler 19,0317. Lucas 17,7658. Stark 16,8219. Lorain 16,64210. Mahoning 15,264
TARG
ET Montgomery County will be among the top three countiesMost desirable ranking is number one.
PER CAPITA EFFECTIVE BUYING INCOME
Montgomery County Ohio United States Consumer Price Index
19,00018,50018,00017,50017,00016,50016,00015,50015,00014,50014,000
Dol
lars
1993 1994 1995 1996 1997 1998 1999 2000 200
1200
2
Note: Beginning in 1996 the definition changed to be based on “Money Income” rather than “Personal Income.”
THE DATA IN THIS REPORT COME FROM THE FOLLOWING SOURCES:
Center for Disease Control
Center for Urban and Public Affairs, Wright State University
Demographics U.S.A. - County Edition
Montgomery County Child Fatality Review Board
Montgomery County Combined Health District, Office of Epidemiology
Montgomery County Coroner’s Office
Montgomery County Prosecutor’s Office
National Center for Health Statistics
Ohio Bureau of Employment Services
Ohio Department of Education
Ohio Department of Health
U.S. Department of Justice
U.S. Environmental Protection Agency
Montgomery County Family andChildren First Council
Members as of December 2002
Laurence P. Harkness, Chair* . . . . . . . . . . . . . . . . . . . . . . . . . . . The Children’s Medical Center
Donna Audette* . . . . . . . . . . . . . . . . . . . . . . . . . . . . . . . . . . . . . . . . . . . . . . . . . YWCA of DaytonWilliam H. Bines . . . . . . . . . . . . . . . . . . . . . . . . . . . . . . . . . . . . . . . Combined Health DistrictThomas G. Breitenbach . . . . . . . . . . . . . . . . . . . . . . . . . . . . . . . . . . . . . . Premier Health PartnersLt. Col. John Compston . . . . . . . . . . . . . . . . . . . . . . . . . . . . . . . . . . . . Dayton Police DepartmentPeg Conley . . . . . . . . . . . . . . . . . . . . . . . . . . . . . . . . . . . . . . . . . . . . . Help Me Grow ConsortiumCarol Decker . . . . . . . . . . . . . . . . . . . . . . . . . . . . . . . . . . . . . . . . . . Ohio Dept. of Youth ServicesJoyce Ferrar . . . . . . . . . . . . . . . . . . . . . . . . . . . . . . . . . . . . . . . Parent/Family Service AssociationBro. Raymond L. Fitz, S.M., Ph.D.* . . . . . . . . . . . . . . . . . . . . . . . . . The University of DaytonDannetta Graves . . . . . . . . . . . . . . . . . . . . . . . . . . . . . Mont. Co. Dept. of Job and Family ServicesRobin Hecht . . . . . . . . . . . . . . . . . . . . . . . . . . . . . . . . . . . . . . . . . . . . . . . Diversion Team/ICATFranz Hoge* . . . . . . . . . . . . . . . . . . . . . . . Retired Managing Partner, PricewaterhouseCoopersKathleen K. Hoyng* . . . . . . . . . . . . . . . . . . . . . . . . . . . . . . . . . . . . . . . . . . . . Deloitte & ToucheHelen L. Jones-Kelley . . . . . . . . . . . . . . . . . . . . . . . . . . . Montgomery County Children ServicesMarc Levy* . . . . . . . . . . . . . . . . . . . . . . . . . . . . . . . . . . . United Way of the Greater Dayton AreaLaFrancine Lewis . . . . . . . . . . . . . . . . . . . . . . . . . . . . . . . . . . . . . . . . Parent/Edgemont ProjectSherrie Lookner . . . . . . . . . . . . . . . . . . . . . . . . . . . . . . Miami Valley Child Development CentersPercy Mack, Ph. D.* . . . . . . . . . . . . . . . . . . . . . . . . . . . . . . . . . . . . . . . . Dayton Public SchoolsDouglas M. McGarry . . . . . . . . . . . . . . . . . . . . . . . . . . . . . . . . . . . . . . . . Area Agency on AgingRhine McLin* . . . . . . . . . . . . . . . . . . . . . . . . . . . . . . . . . . . . . . . . . . . . . Mayor, City of DaytonBryan Miller, Ph. D. . . . . . . . . . . . . . . . . . . . . . . . . . . . . . . . . . . . . . Mont. Co. Board of MR/DDJohn E. Moore* . . . . . . . . . . . . . . . . . . . . . . . . . . . . . . . . . . . . . . . . . . . . . . . . Community LeaderMichael B. Murphy* . . . . . . . . . . . . . . . . . . . . . . . . . . . . . Montgomery County Juvenile CourtBootsie Neal . . . . . . . . . . . . . . . . . . . . . . . . . . . . . . . . . . . . . . . . . . . . . Dayton City CommissionJohn North . . . . . . . . . . . . . . . . . . . . . . . . . . . . . . . . . . . . . . . . . . . . . . . United Health ServicesVicki D. Pegg* . . . . . . . . . . . . . . . . . . . . . . . . . . . . . . . . . . . . . Montgomery County CommissionMary D. Pryor, M.D. . . . . . . . . . . . . . . . . . . . . . . . . . . . . . . . . Oakwood Health CommissionerNed J. Sifferlen* . . . . . . . . . . . . . . . . . . . . . . . . . . . . . . . . . . . . . . . Sinclair Community CollegeFrederick C. Smith . . . . . . . . . . . . . . . . . . . . . . . . . . . . . . . . . . . . . . . . . . . . . Huffy FoundationJoyce Sutton . . . . . . . . . . . . . . . . . . . . . . . . . . . . . . . . . . . . . . . . . . . . . . . . . . . . . . . . . . . . . ParentJoseph L. Szoke* . . . . . . . . . . . . . . . . . . . . . . . . . . . . . . . . . . . . ADAMHS Board of Mont. Co.Donald R. Thompson, Ph.D. . . . . . . . . . . . . . . . . . . . . Mont. Co. Educational Service CenterRoland L. Turpin . . . . . . . . . . . . . . . . . . . . . . . . . . . Dayton Metropolitan Housing AuthorityDonald A. Vermillion . . . . . . . . . . . . . . . . . . . . . . Sinclair Community College/Univ. of DaytonDave Vore . . . . . . . . . . . . . . . . . . . . . . . . . . . . . . . . . . . . . . . . . . . Montgomery County SheriffJoyce C. Young . . . . . . . . . . . . . . . . . . . . . . . . . . . . . . . . . . . . . . . . . . . . . . . Community Volunteer
* Executive Committee members
The Ohio Department of Health specifically disclaimsresponsibility for any analyses, interpretations or conclusions from the data provided for the charts.
MONTGOMERY COUNTY FAMILY AND CHILDREN FIRST COUNCIL
451 West Third Street • P.O. Box 972 • Dayton, OH 45422-3100
937-225-4695 • Fax 937-496-7714
E-mail: [email protected] • Web site: www.fcfc.montco.org
Our VISION is that Montgomery County is a place where families, children
and adults live in safe, supportive neighborhoods, care for and respect one another,
value each other, and succeed in school, the workplace and life.
The MISSION of the Montgomery County Family and Children First
Council is to serve as a catalyst to foster interdependent solutions among public and
private community partners to achieve the vision for the health and well-being of
families, children and adults.