Embed Size (px)
Citation preview
D AV I D P. L I N D , C E B S
P R E S I D E N T, D AV I D P. L I N D & A S S O C I AT E S L . L . C .
Thank you for your interest in this2003 Iowa Employer Benefits Study©
We at David P. Lind & Associates, L.L.C. (DPL&A) are pleased to provide you with this
copy of the 2003 Iowa Employer Benefits Study©. This fifth annual study conducted
by DPL&A is very useful in analyzing trends in employee benefits for Iowa employers.
We wish to thank every employer that participated in our study, which is the first of its kind covering
the entire state of Iowa. In addition, we wish to thank Data Point Research, Inc. for their statistical
expertise and guidance.
The results of this survey are quite extensive, and because of this, we have summarized some key
areas of interest within this publication. More details are available in the full study which allow
comparisons to be made between the various industries represented.
As we have done with all previous studies, additional questions were included with our core study
questions to elicit responses on various employee benefits topics. For example, this 2003 Study includes
information on employer attitudes on why health care costs are increasing, potential solutions to “fix”
the health care system, and the economic tradeoffs that occur for employers when faced with rising
health insurance costs.
To help Iowa employers benchmark their employee benefit plans with the 2003 Iowa EmployerBenefits Study©, DPL&A has developed a computer program that will compare various benefits
components. This program allows us to provide each of our clients with specific information about how
their benefit plan(s) compare to others in their industry across the state. Clients of DPL&A receive this
information annually as a part of our service at renewal. This extensive benchmarking analysis is also
available to employers not currently in our client base. For more information about benchmarking or to
learn more about what DPL&A can do for you, please contact us at (800) 821-LIND or reach us by
email at [email protected]. At DPL&A we believe employee benefits should be “client driven”
rather than “product driven”. Let us show you the difference!
We welcome any comments or suggestions that you have which could improve this study in
future years.
D a v i d P. L i n d & A s s o c i a t e s 2 0 0 3 I O W A E M P L O Y E R B E N E F I T S S T U D Y2
515.273.5140
T
EMPLOYERSIZE
20-49
50-249
250-999
1000+
TOTAL
# of Employersin Group
6,486
2,581
478
90
9,635
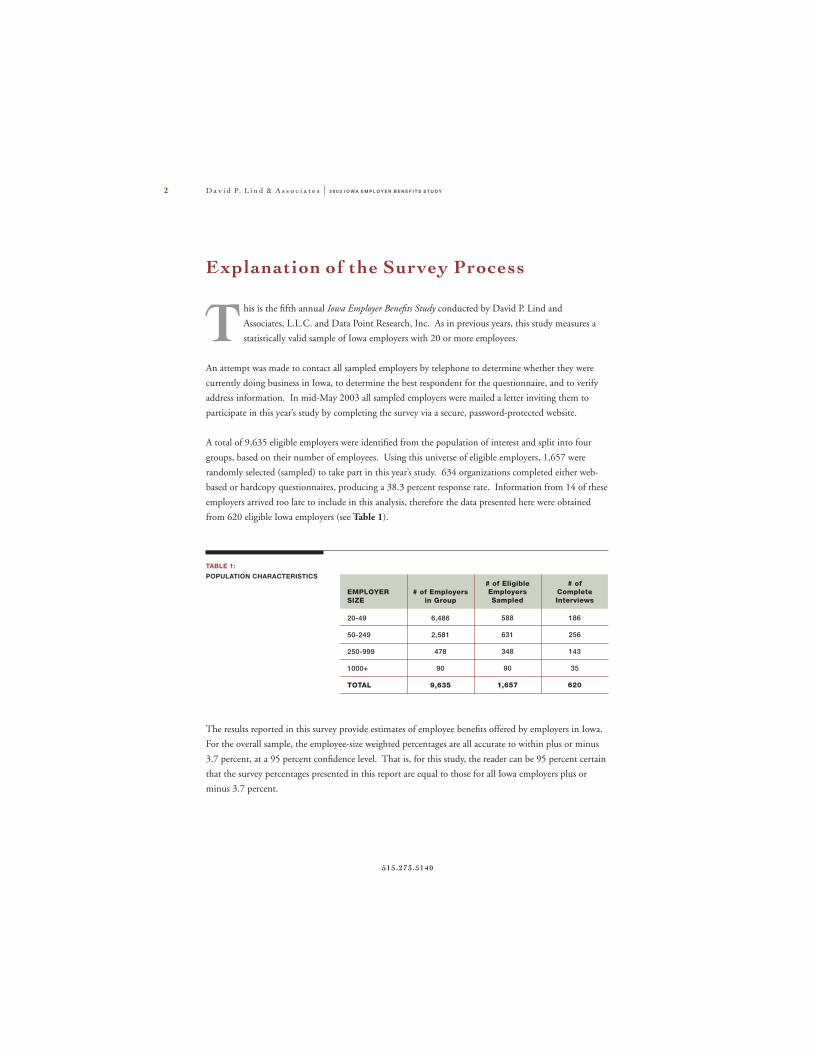
TABLE 1:POPULATION CHARACTERISTICS
his is the fifth annual Iowa Employer Benefits Study conducted by David P. Lind and
Associates, L.L.C. and Data Point Research, Inc. As in previous years, this study measures a
statistically valid sample of Iowa employers with 20 or more employees.
An attempt was made to contact all sampled employers by telephone to determine whether they were
currently doing business in Iowa, to determine the best respondent for the questionnaire, and to verify
address information. In mid-May 2003 all sampled employers were mailed a letter inviting them to
participate in this year’s study by completing the survey via a secure, password-protected website.
A total of 9,635 eligible employers were identified from the population of interest and split into four
groups, based on their number of employees. Using this universe of eligible employers, 1,657 were
randomly selected (sampled) to take part in this year’s study. 634 organizations completed either web-
based or hardcopy questionnaires, producing a 38.3 percent response rate. Information from 14 of these
employers arrived too late to include in this analysis, therefore the data presented here were obtained
from 620 eligible Iowa employers (see Table 1).
Explanation of the Survey Process
# of EligibleEmployersSampled
588
631
348
90
1,657
# ofCompleteInterviews
186
256
143
35
620
The results reported in this survey provide estimates of employee benefits offered by employers in Iowa.
For the overall sample, the employee-size weighted percentages are all accurate to within plus or minus
3.7 percent, at a 95 percent confidence level. That is, for this study, the reader can be 95 percent certain
that the survey percentages presented in this report are equal to those for all Iowa employers plus or
minus 3.7 percent.
2 0 0 3 I O W A E M P L O Y E R B E N E F I T S S T U D Y D a v i d P. L i n d & A s s o c i a t e s 3
www.dplaconsult ing.com
Averages reported for employers within employee size categories are statistically accurate to within plus
or minus 7 percent for each of the three smaller employee sizes, and plus or minus 13 percent for the
largest employers. All precision levels are stated at the 95 percent confidence level.
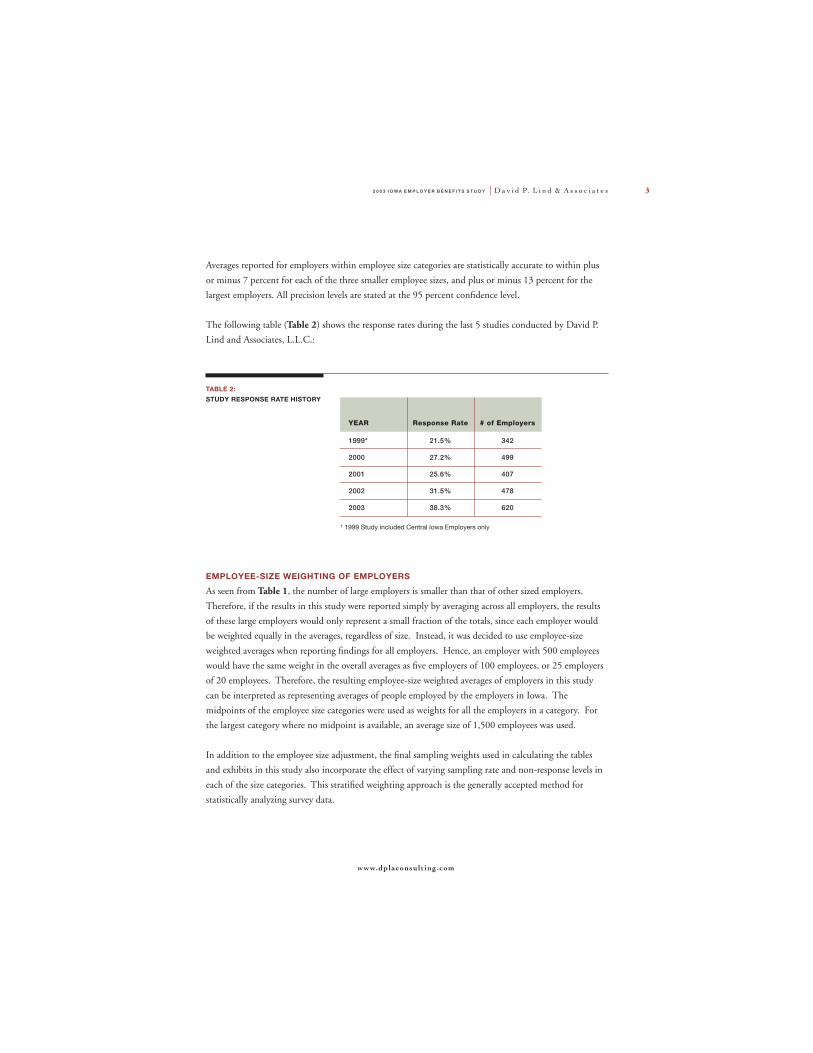
The following table (Table 2) shows the response rates during the last 5 studies conducted by David P.
Lind and Associates, L.L.C.:
EMPLOYEE-SIZE WEIGHTING OF EMPLOYERS
As seen from Table 1, the number of large employers is smaller than that of other sized employers.
Therefore, if the results in this study were reported simply by averaging across all employers, the results
of these large employers would only represent a small fraction of the totals, since each employer would
be weighted equally in the averages, regardless of size. Instead, it was decided to use employee-size
weighted averages when reporting findings for all employers. Hence, an employer with 500 employees
would have the same weight in the overall averages as five employers of 100 employees, or 25 employers
of 20 employees. Therefore, the resulting employee-size weighted averages of employers in this study
can be interpreted as representing averages of people employed by the employers in Iowa. The
midpoints of the employee size categories were used as weights for all the employers in a category. For
the largest category where no midpoint is available, an average size of 1,500 employees was used.
In addition to the employee size adjustment, the final sampling weights used in calculating the tables
and exhibits in this study also incorporate the effect of varying sampling rate and non-response levels in
each of the size categories. This stratified weighting approach is the generally accepted method for
statistically analyzing survey data.
YEAR
1999*
2000
2001
2002
2003
Response Rate
21.5%
27.2%
25.6%
31.5%
38.3%
TABLE 2:STUDY RESPONSE RATE HISTORY
# of Employers
342
499
407
478
620
* 1999 Study included Central Iowa Employers only
D a v i d P. L i n d & A s s o c i a t e s 2 0 0 3 I O W A E M P L O Y E R B E N E F I T S S T U D Y4
515.273.5140
BENEFIT OFFERED
Health Insurance
Paid Holidays
Vacation
Retirement Plans
Group Life Insurance
Dental Insurance
Pre-Tax Premium
Sick Leave
Long Term Disability
Dependent care flexible spending account
Medical care spending account
Short Term Disability
Educational Assist/Tuition Reimbursement
Employee Assistance Program (EAP)
Casual Dress (everyday, not just Fridays)
Vision Coverage
Paid Time Off (PTO)
Retiree Health Insurance (Pre 65 Years)
Flextime
Fitness center or gym subsidy
Retiree health Insurance (65 years +)
Long Term Care Insurance
Telecommuting
Child care assistance (on or off-site)
FULL-TIME
95.0%
92.2%
85.8%
85.3%
85.2%
73.3%
72.3%
68.3%
68.1%
66.1%
62.4%
57.5%
50.3%
45.6%
39.4%
34.7%
25.7%
25.1%
21.9%
20.6%
15.7%
11.4%
6.3%
4.8%
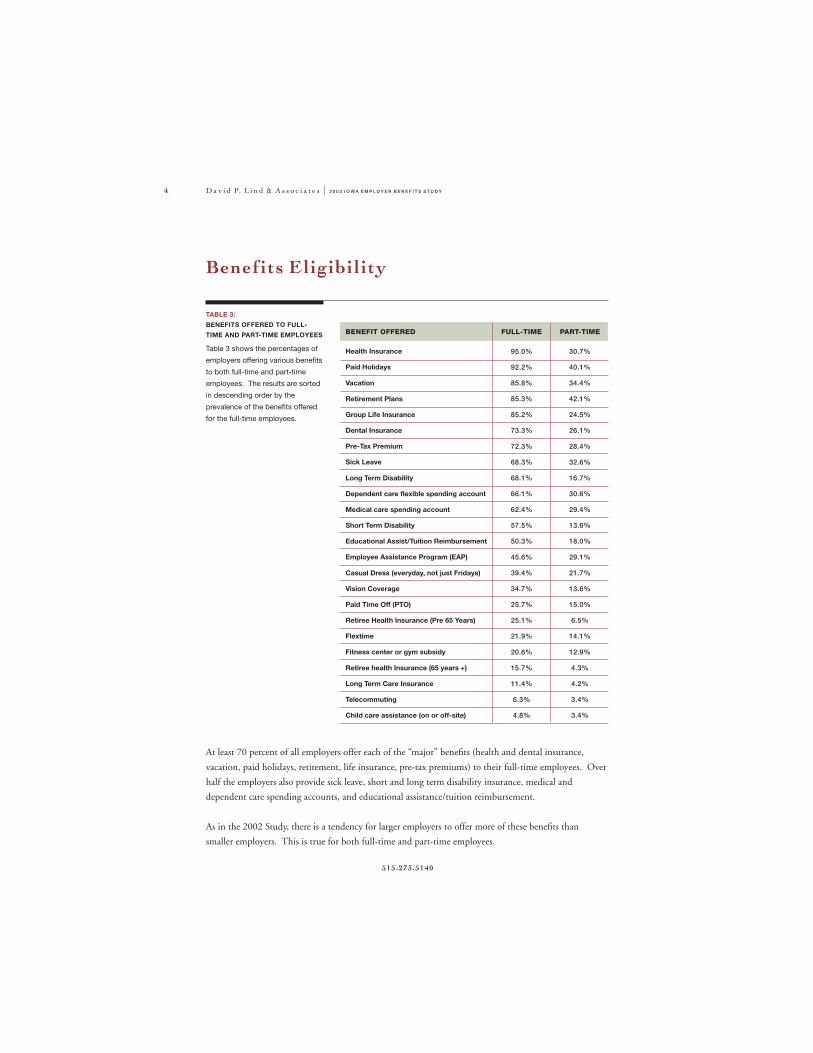
TABLE 3:BENEFITS OFFERED TO FULL-TIME AND PART-TIME EMPLOYEES
Table 3 shows the percentages of
employers offering various benefits
to both full-time and part-time
employees. The results are sorted
in descending order by the
prevalence of the benefits offered
for the full-time employees.
Benefits Eligibility
PART-TIME
30.7%
40.1%
34.4%
42.1%
24.5%
26.1%
28.4%
32.6%
16.7%
30.6%
29.4%
13.6%
18.0%
29.1%
21.7%
13.6%
15.0%
6.5%
14.1%
12.9%
4.3%
4.2%
3.4%
3.4%
At least 70 percent of all employers offer each of the “major” benefits (health and dental insurance,
vacation, paid holidays, retirement, life insurance, pre-tax premiums) to their full-time employees. Over
half the employers also provide sick leave, short and long term disability insurance, medical and
dependent care spending accounts, and educational assistance/tuition reimbursement.
As in the 2002 Study, there is a tendency for larger employers to offer more of these benefits than
smaller employers. This is true for both full-time and part-time employees.
2 0 0 3 I O W A E M P L O Y E R B E N E F I T S S T U D Y D a v i d P. L i n d & A s s o c i a t e s 5
www.dplaconsult ing.com
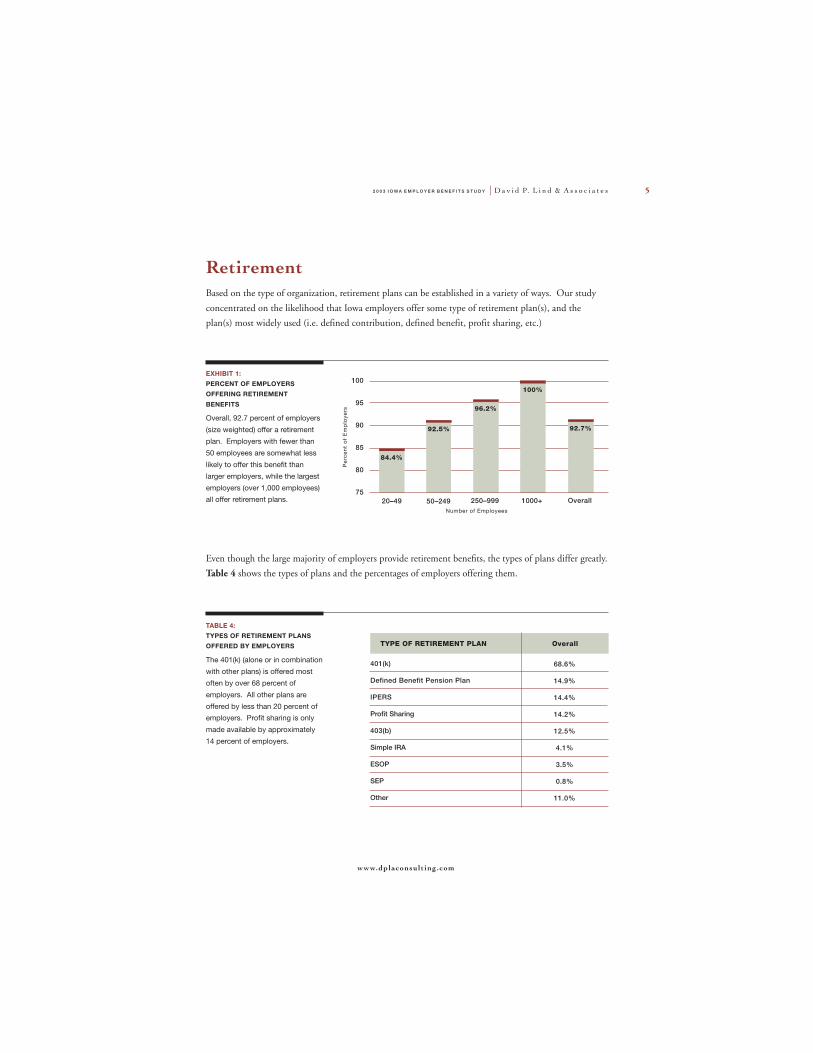
RetirementBased on the type of organization, retirement plans can be established in a variety of ways. Our study
concentrated on the likelihood that Iowa employers offer some type of retirement plan(s), and the
plan(s) most widely used (i.e. defined contribution, defined benefit, profit sharing, etc.)
Even though the large majority of employers provide retirement benefits, the types of plans differ greatly.
Table 4 shows the types of plans and the percentages of employers offering them.
EXHIBIT 1:PERCENT OF EMPLOYERSOFFERING RETIREMENT
BENEFITS
Overall, 92.7 percent of employers
(size weighted) offer a retirement
plan. Employers with fewer than
50 employees are somewhat less
likely to offer this benefit than
larger employers, while the largest
employers (over 1,000 employees)
all offer retirement plans.
100
95
90
85
80
7550–249 250–999 1000+ Overall
Per
cen
t o
f E
mp
loye
rs
Number of Employees
92.5%
96.2%
100%
92.7%
20–49
84.4%
TYPE OF RETIREMENT PLAN Overall
TABLE 4:TYPES OF RETIREMENT PLANSOFFERED BY EMPLOYERS
The 401(k) (alone or in combination
with other plans) is offered most
often by over 68 percent of
employers. All other plans are
offered by less than 20 percent of
employers. Profit sharing is only
made available by approximately
14 percent of employers.
68.6%
14.9%
14.4%
14.2%
12.5%
4.1%
3.5%
0.8%
11.0%
401(k)
Defined Benefit Pension Plan
IPERS
Profit Sharing
403(b)
Simple IRA
ESOP
SEP
Other
D a v i d P. L i n d & A s s o c i a t e s 2 0 0 3 I O W A E M P L O Y E R B E N E F I T S S T U D Y6
515.273.5140
RETIREMENTPLAN 20-49 50-249 250-999 1000+
TABLE 5:
RETIREMENT PLANS BYEMPLOYER SIZE
Table 5 shows what types of
retirement plans are offered by
Iowa employers. The 401(k) is the
most frequently offered plan for all
employer sizes, but especially so
among the larger employers. The
defined benefit plans are more
frequently offered among the larger
employers, with approximately one
third of the largest employers
offering such plans. IPERS is a
retirement plan for career public
employees. The percentage of
employers offering profit sharing
appears to be greater among the
smaller employers.
71.5%
4.5%
9.4%
8.7%
19.3%
1.3%
67.8%
11.0%
9.1%
17.4%
12.0%
2.9%
401(k)
Defined BenefitPension Plan
403(b)
IPERS
Profit Sharing
ESOP
65.2%
18.6%
16.7%
14.6%
17.1%
6.2%
74.3%
34.3%
17.1%
14.3%
5.7%
2.9%
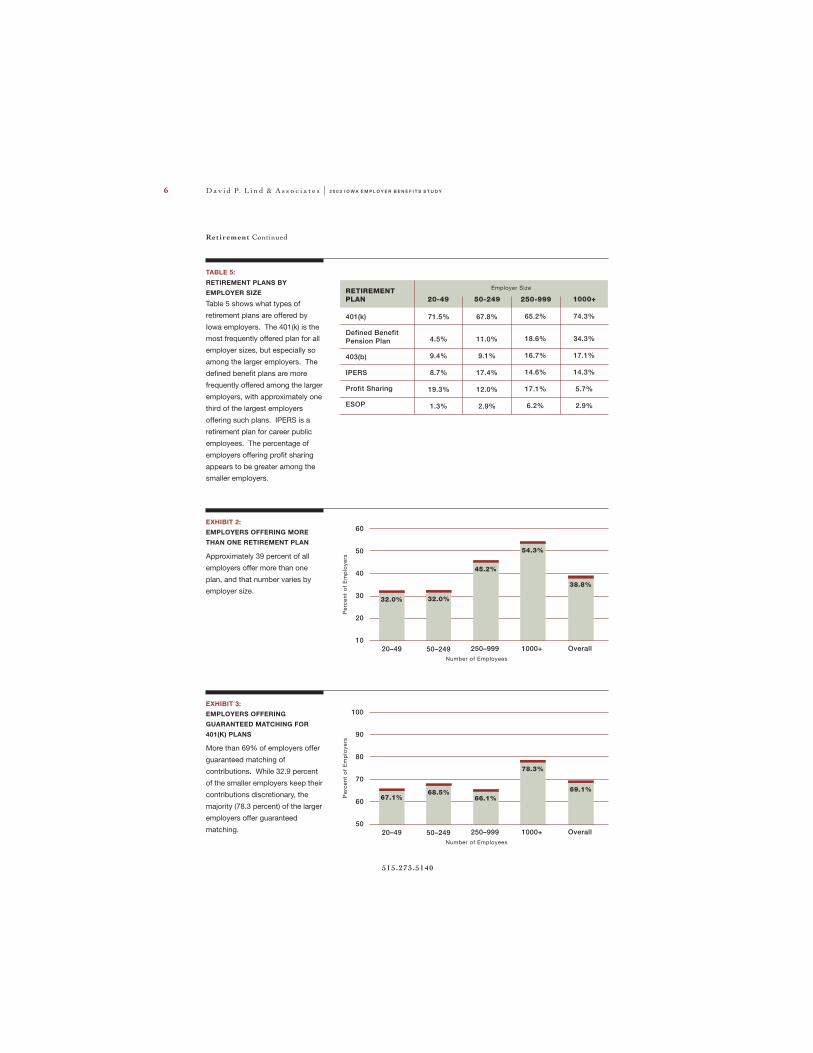
EXHIBIT 2:EMPLOYERS OFFERING MORETHAN ONE RETIREMENT PLAN
Approximately 39 percent of all
employers offer more than one
plan, and that number varies by
employer size.
EXHIBIT 3:EMPLOYERS OFFERINGGUARANTEED MATCHING FOR401(K) PLANS
More than 69% of employers offer
guaranteed matching of
contributions. While 32.9 percent
of the smaller employers keep their
contributions discretionary, the
majority (78.3 percent) of the larger
employers offer guaranteed
matching.
60
50
40
30
20
1050–249 250–999 1000+ Overall
Per
cen
t o
f E
mp
loye
rs
Number of Employees
32.0%
45.2%
54.3%
38.8%
20–49
32.0%
100
90
80
70
60
5050–249 250–999 1000+ Overall
Per
cen
t o
f E
mp
loye
rs
Number of Employees
68.5%66.1%
78.3%
69.1%
20–49
67.1%
Employer Size
Retirement Continued
2 0 0 3 I O W A E M P L O Y E R B E N E F I T S S T U D Y D a v i d P. L i n d & A s s o c i a t e s 7
www.dplaconsult ing.com
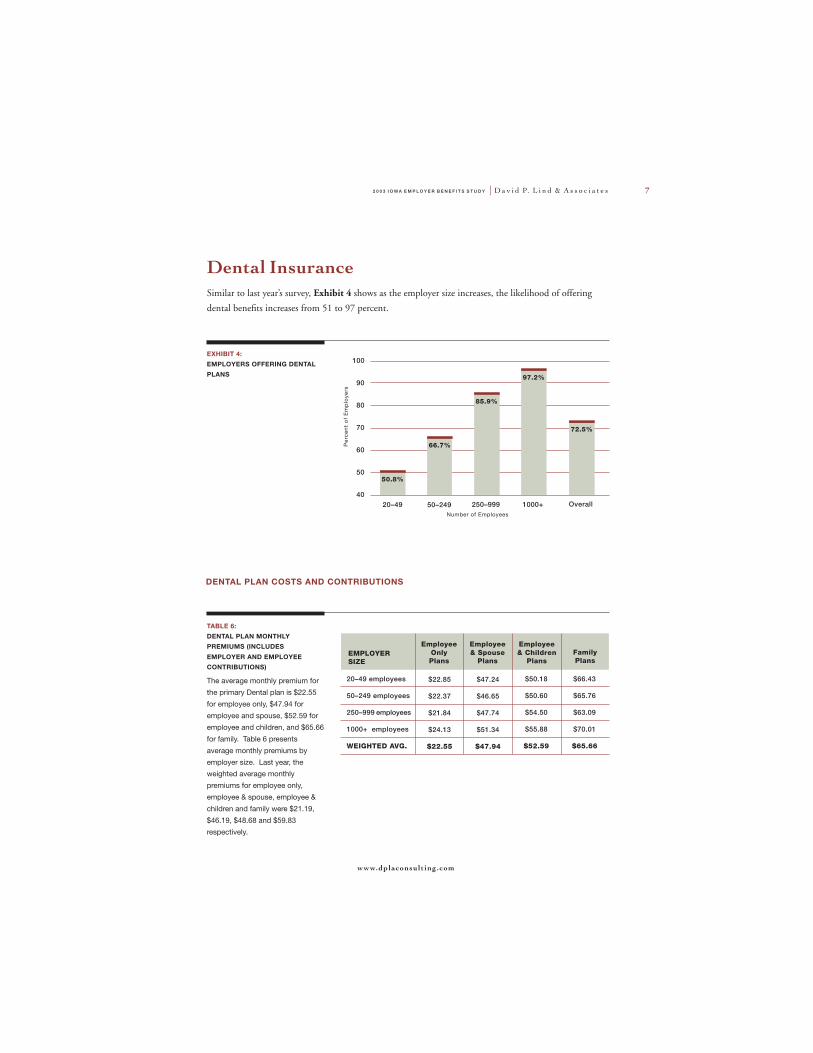
Dental InsuranceSimilar to last year’s survey, Exhibit 4 shows as the employer size increases, the likelihood of offering
dental benefits increases from 51 to 97 percent.
EXHIBIT 4:EMPLOYERS OFFERING DENTALPLANS
DENTAL PLAN COSTS AND CONTRIBUTIONS
EMPLOYERSIZE
Employee& Spouse
Plans
Employee& Children
PlansFamilyPlans
TABLE 6:DENTAL PLAN MONTHLYPREMIUMS (INCLUDES
EMPLOYER AND EMPLOYEECONTRIBUTIONS)
The average monthly premium for
the primary Dental plan is $22.55
for employee only, $47.94 for
employee and spouse, $52.59 for
employee and children, and $65.66
for family. Table 6 presents
average monthly premiums by
employer size. Last year, the
weighted average monthly
premiums for employee only,
employee & spouse, employee &
children and family were $21.19,
$46.19, $48.68 and $59.83
respectively.
$22.85
$22.37
$21.84
$24.13
$22.55
$47.24
$46.65
$47.74
$51.34
$47.94
20–49 employees
50–249 employees
250–999 employees
1000+ employees
WEIGHTED AVG.
$50.18
$50.60
$54.50
$55.88
$52.59
$66.43
$65.76
$63.09
$70.01
$65.66
100
90
80
70
60
50
4050–249 250–999 1000+ Overall
Per
cen
t o
f E
mp
loye
rs
Number of Employees
66.7%
85.9%
97.2%
72.5%
20–49
50.8%
EmployeeOnlyPlans
D a v i d P. L i n d & A s s o c i a t e s 2 0 0 3 I O W A E M P L O Y E R B E N E F I T S S T U D Y8
515.273.5140
Health InsuranceGroup medical coverage is a large part of the employer’s benefits costs. Medical costs can be quite
complex when distinguishing between fully insured, partially self funded, and self funded costs. In
addition, there are various plans available in Iowa, such as Health Maintenance Organizations (HMO),
Point of Service plans (POS), Preferred Provider Organizations (PPO), and Traditional Indemnity (TI).
As with all past studies, this study tracks the premium rates between many of these plans along with the
employer/employee contribution rates. Just as important, the average benefits structure was analyzed by
each corresponding medical plan.
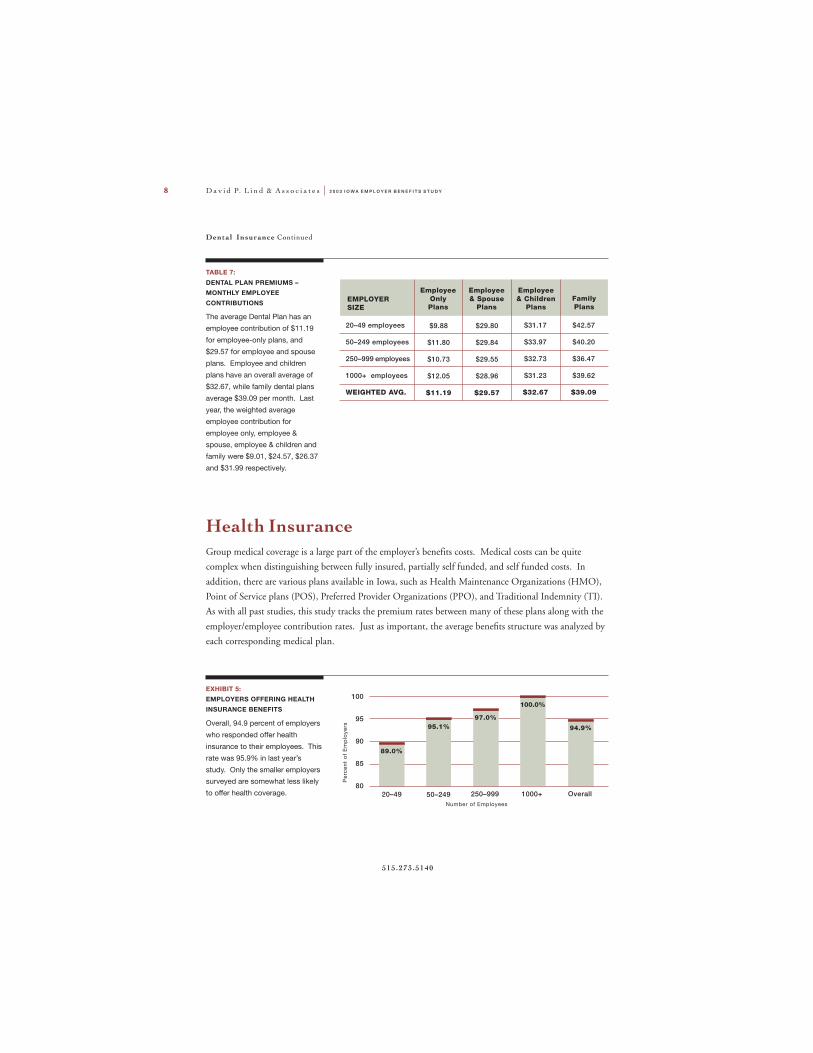
EXHIBIT 5:EMPLOYERS OFFERING HEALTHINSURANCE BENEFITS
Overall, 94.9 percent of employers
who responded offer health
insurance to their employees. This
rate was 95.9% in last year’s
study. Only the smaller employers
surveyed are somewhat less likely
to offer health coverage.
100
95
90
85
8050–249 250–999 1000+ Overall
Per
cen
t o
f E
mp
loye
rs
Number of Employees
95.1%97.0%
100.0%
94.9%
20–49
89.0%
TABLE 7:
DENTAL PLAN PREMIUMS –MONTHLY EMPLOYEECONTRIBUTIONS
The average Dental Plan has an
employee contribution of $11.19
for employee-only plans, and
$29.57 for employee and spouse
plans. Employee and children
plans have an overall average of
$32.67, while family dental plans
average $39.09 per month. Last
year, the weighted average
employee contribution for
employee only, employee &
spouse, employee & children and
family were $9.01, $24.57, $26.37
and $31.99 respectively.
EMPLOYERSIZE
Employee& Spouse
Plans
Employee& Children
PlansFamilyPlans
$9.88
$11.80
$10.73
$12.05
$11.19
$29.80
$29.84
$29.55
$28.96
$29.57
20–49 employees
50–249 employees
250–999 employees
1000+ employees
WEIGHTED AVG.
$31.17
$33.97
$32.73
$31.23
$32.67
$42.57
$40.20
$36.47
$39.62
$39.09
EmployeeOnlyPlans
Dental Insurance Continued
2 0 0 3 I O W A E M P L O Y E R B E N E F I T S S T U D Y D a v i d P. L i n d & A s s o c i a t e s 9
www.dplaconsult ing.com
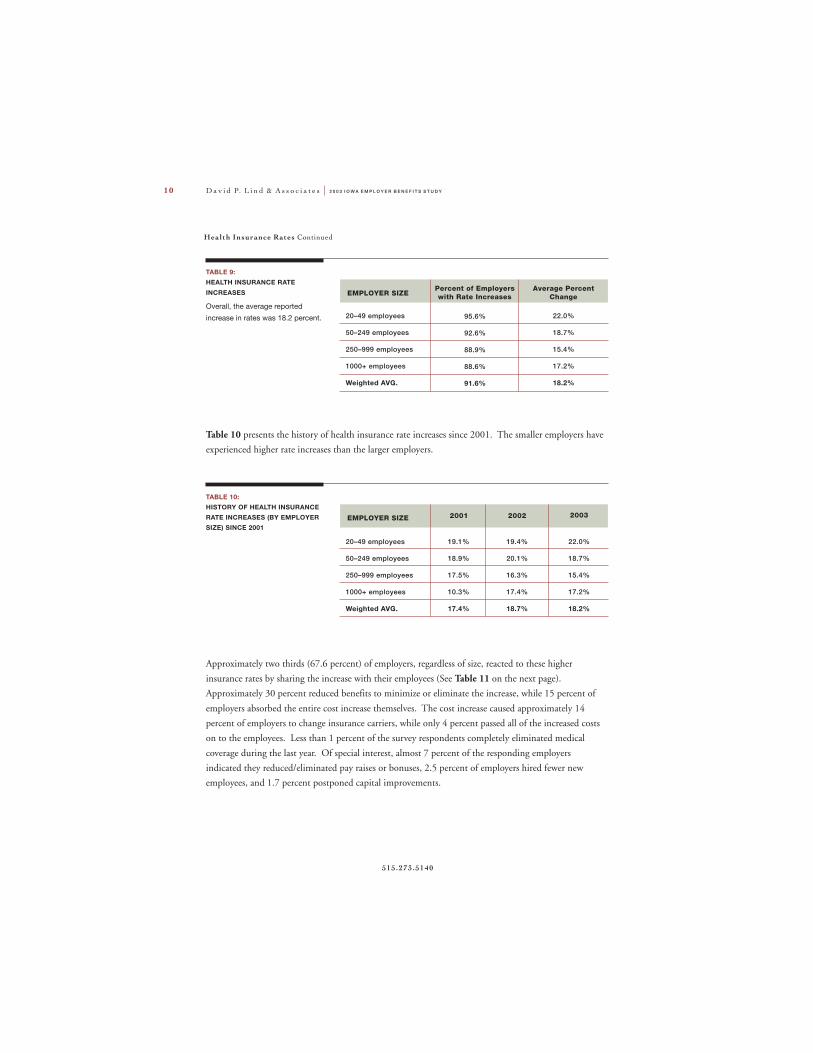
HEALTH INSURANCE RATES
EXHIBIT 6:EMPLOYERS WITH CHANGES INHEALTH INSURANCE RATES
Almost 92 percent of all employers
who responded to the survey
experienced an increase in medical
rates during the last year. Only 2.6
percent reported a decrease.
These numbers are almost
identical to the 2001 and 2002
study results.
These results varied by employer size. The differences in rate increases tend to vary, with smaller
employers experiencing higher rate increases.
Decrease 2.6%
No Change 5.8%
Increase 91.6%
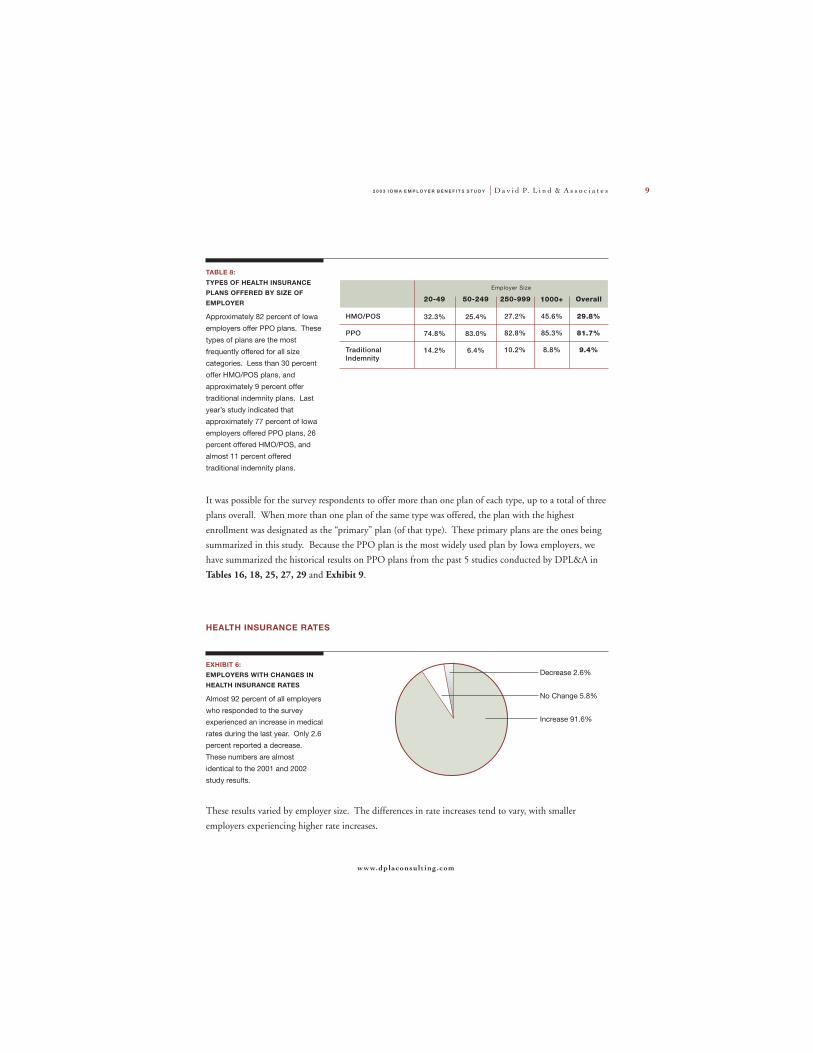
TABLE 8:
TYPES OF HEALTH INSURANCEPLANS OFFERED BY SIZE OFEMPLOYER
Approximately 82 percent of Iowa
employers offer PPO plans. These
types of plans are the most
frequently offered for all size
categories. Less than 30 percent
offer HMO/POS plans, and
approximately 9 percent offer
traditional indemnity plans. Last
year’s study indicated that
approximately 77 percent of Iowa
employers offered PPO plans, 26
percent offered HMO/POS, and
almost 11 percent offered
traditional indemnity plans.
20-49 50-249 250-999 1000+
32.3%
74.8%
14.2%
25.4%
83.0%
6.4%
HMO/POS
PPO
TraditionalIndemnity
27.2%
82.8%
10.2%
45.6%
85.3%
8.8%
Overall
29.8%
81.7%
9.4%
It was possible for the survey respondents to offer more than one plan of each type, up to a total of three
plans overall. When more than one plan of the same type was offered, the plan with the highest
enrollment was designated as the “primary” plan (of that type). These primary plans are the ones being
summarized in this study. Because the PPO plan is the most widely used plan by Iowa employers, we
have summarized the historical results on PPO plans from the past 5 studies conducted by DPL&A in
Tables 16, 18, 25, 27, 29 and Exhibit 9.
Employer Size
D a v i d P. L i n d & A s s o c i a t e s 2 0 0 3 I O W A E M P L O Y E R B E N E F I T S S T U D Y10
515.273.5140
Health Insurance Rates Continued
Approximately two thirds (67.6 percent) of employers, regardless of size, reacted to these higher
insurance rates by sharing the increase with their employees (See Table 11 on the next page).
Approximately 30 percent reduced benefits to minimize or eliminate the increase, while 15 percent of
employers absorbed the entire cost increase themselves. The cost increase caused approximately 14
percent of employers to change insurance carriers, while only 4 percent passed all of the increased costs
on to the employees. Less than 1 percent of the survey respondents completely eliminated medical
coverage during the last year. Of special interest, almost 7 percent of the responding employers
indicated they reduced/eliminated pay raises or bonuses, 2.5 percent of employers hired fewer new
employees, and 1.7 percent postponed capital improvements.
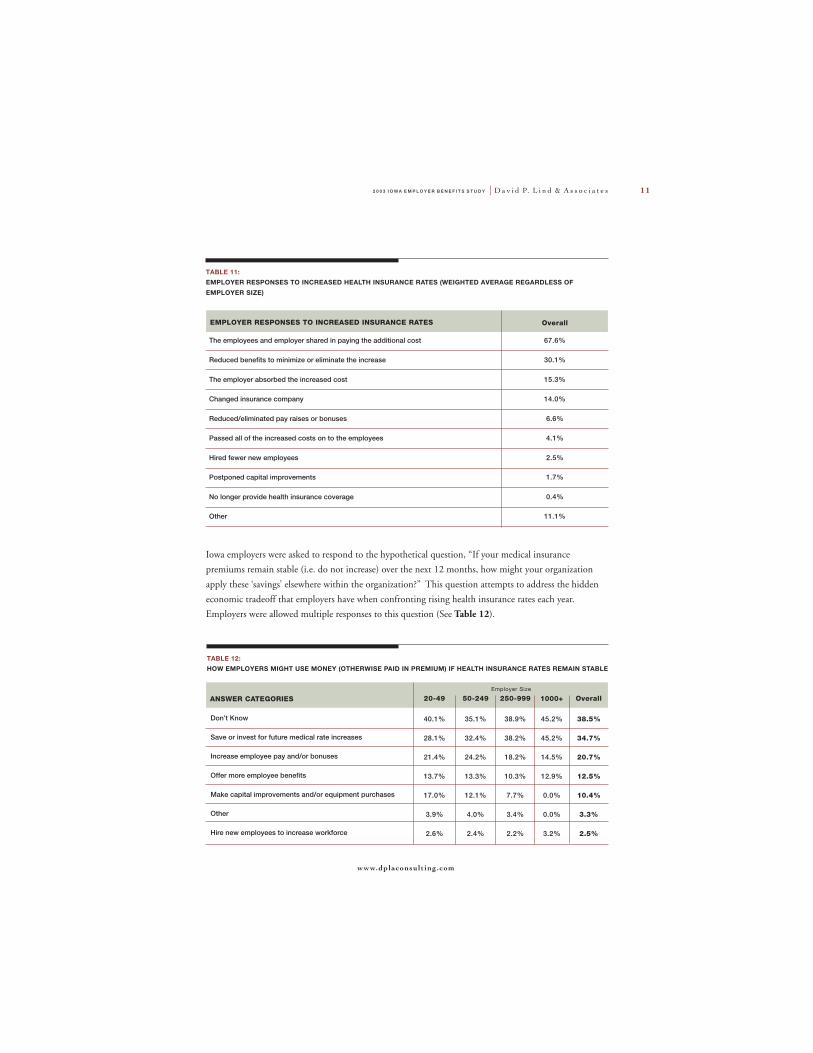
EMPLOYER SIZEPercent of Employerswith Rate Increases
Average PercentChange
TABLE 9:HEALTH INSURANCE RATE
INCREASES
Overall, the average reported
increase in rates was 18.2 percent. 95.6%
92.6%
88.9%
88.6%
91.6%
20–49 employees
50–249 employees
250–999 employees
1000+ employees
Weighted AVG.
22.0%
18.7%
15.4%
17.2%
18.2%
EMPLOYER SIZE 2001 2002
TABLE 10:HISTORY OF HEALTH INSURANCERATE INCREASES (BY EMPLOYERSIZE) SINCE 2001
19.1%
18.9%
17.5%
10.3%
17.4%
20–49 employees
50–249 employees
250–999 employees
1000+ employees
Weighted AVG.
19.4%
20.1%
16.3%
17.4%
18.7%
Table 10 presents the history of health insurance rate increases since 2001. The smaller employers have
experienced higher rate increases than the larger employers.
2003
22.0%
18.7%
15.4%
17.2%
18.2%
2 0 0 3 I O W A E M P L O Y E R B E N E F I T S S T U D Y D a v i d P. L i n d & A s s o c i a t e s 11
www.dplaconsult ing.com
TABLE 12:HOW EMPLOYERS MIGHT USE MONEY (OTHERWISE PAID IN PREMIUM) IF HEALTH INSURANCE RATES REMAIN STABLE
ANSWER CATEGORIES 20-49 50-249 250-999 1000+ OverallEmployer Size
Don’t Know
Save or invest for future medical rate increases
Increase employee pay and/or bonuses
Offer more employee benefits
Make capital improvements and/or equipment purchases
Other
Hire new employees to increase workforce
40.1%
28.1%
21.4%
13.7%
17.0%
3.9%
2.6%
35.1%
32.4%
24.2%
13.3%
12.1%
4.0%
2.4%
38.9%
38.2%
18.2%
10.3%
7.7%
3.4%
2.2%
45.2%
45.2%
14.5%
12.9%
0.0%
0.0%
3.2%
38.5%
34.7%
20.7%
12.5%
10.4%
3.3%
2.5%
TABLE 11:EMPLOYER RESPONSES TO INCREASED HEALTH INSURANCE RATES (WEIGHTED AVERAGE REGARDLESS OF
EMPLOYER SIZE)
EMPLOYER RESPONSES TO INCREASED INSURANCE RATES
The employees and employer shared in paying the additional cost
Reduced benefits to minimize or eliminate the increase
The employer absorbed the increased cost
Changed insurance company
Reduced/eliminated pay raises or bonuses
Passed all of the increased costs on to the employees
Hired fewer new employees
Postponed capital improvements
No longer provide health insurance coverage
Other
Overall
67.6%
30.1%
15.3%
14.0%
6.6%
4.1%
2.5%
1.7%
0.4%
11.1%
Iowa employers were asked to respond to the hypothetical question, “If your medical insurance
premiums remain stable (i.e. do not increase) over the next 12 months, how might your organization
apply these ‘savings’ elsewhere within the organization?” This question attempts to address the hidden
economic tradeoff that employers have when confronting rising health insurance rates each year.
Employers were allowed multiple responses to this question (See Table 12).
D a v i d P. L i n d & A s s o c i a t e s 2 0 0 3 I O W A E M P L O Y E R B E N E F I T S S T U D Y12
515.273.5140
EmployeeOnly Plans
Employee& Spouse
Plans
Employee& Children
PlansFamilyPlans
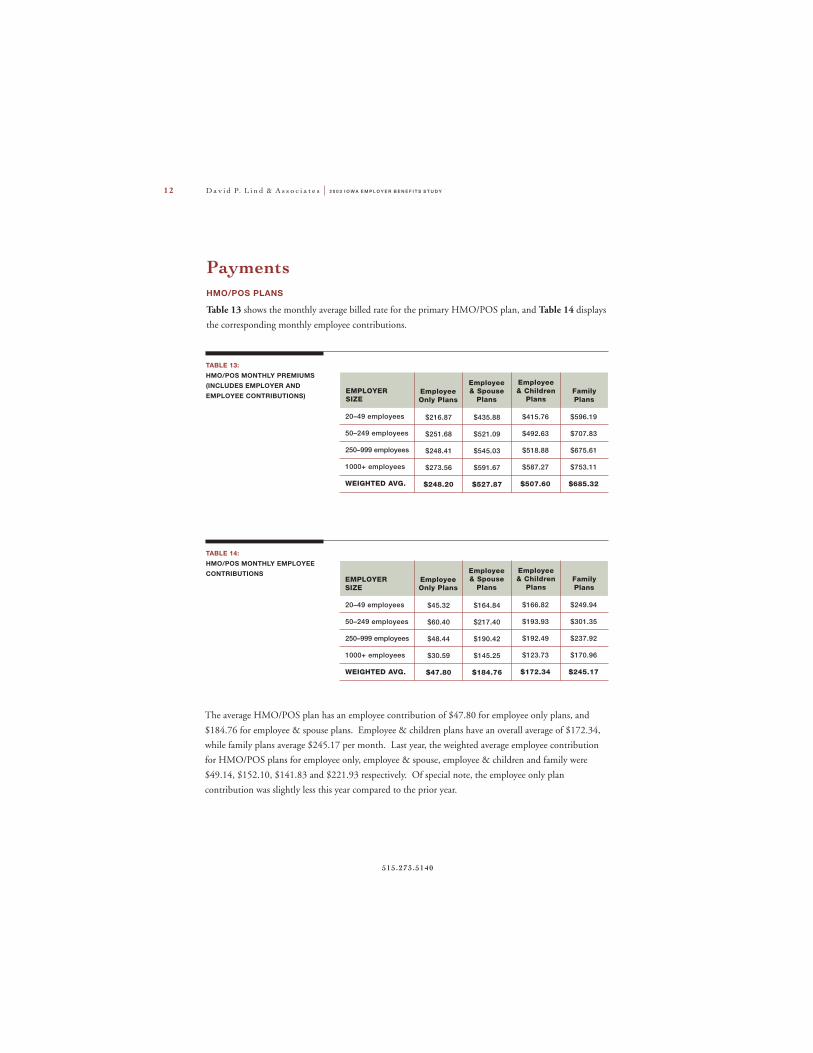
TABLE 13:HMO/POS MONTHLY PREMIUMS(INCLUDES EMPLOYER ANDEMPLOYEE CONTRIBUTIONS)
$216.87
$251.68
$248.41
$273.56
$248.20
$435.88
$521.09
$545.03
$591.67
$527.87
$415.76
$492.63
$518.88
$587.27
$507.60
$596.19
$707.83
$675.61
$753.11
$685.32
TABLE 14:HMO/POS MONTHLY EMPLOYEECONTRIBUTIONS
Table 13 shows the monthly average billed rate for the primary HMO/POS plan, and Table 14 displays
the corresponding monthly employee contributions.
PaymentsHMO/POS PLANS
EMPLOYERSIZE
EmployeeOnly Plans
Employee& Spouse
Plans
Employee& Children
PlansFamilyPlans
$45.32
$60.40
$48.44
$30.59
$47.80
$164.84
$217.40
$190.42
$145.25
$184.76
$166.82
$193.93
$192.49
$123.73
$172.34
$249.94
$301.35
$237.92
$170.96
$245.17
The average HMO/POS plan has an employee contribution of $47.80 for employee only plans, and
$184.76 for employee & spouse plans. Employee & children plans have an overall average of $172.34,
while family plans average $245.17 per month. Last year, the weighted average employee contribution
for HMO/POS plans for employee only, employee & spouse, employee & children and family were
$49.14, $152.10, $141.83 and $221.93 respectively. Of special note, the employee only plan
contribution was slightly less this year compared to the prior year.
20–49 employees
50–249 employees
250–999 employees
1000+ employees
WEIGHTED AVG.
20–49 employees
50–249 employees
250–999 employees
1000+ employees
WEIGHTED AVG.
EMPLOYERSIZE
2 0 0 3 I O W A E M P L O Y E R B E N E F I T S S T U D Y D a v i d P. L i n d & A s s o c i a t e s 13
www.dplaconsult ing.com
TABLE 16:HISTORY OF PPO MONTHLYHEALTH PREMIUMS (SINGLE ANDFAMILY ONLY, INCLUDESEMPLOYER AND EMPLOYEECONTRIBUTIONS)
PPO PLANS
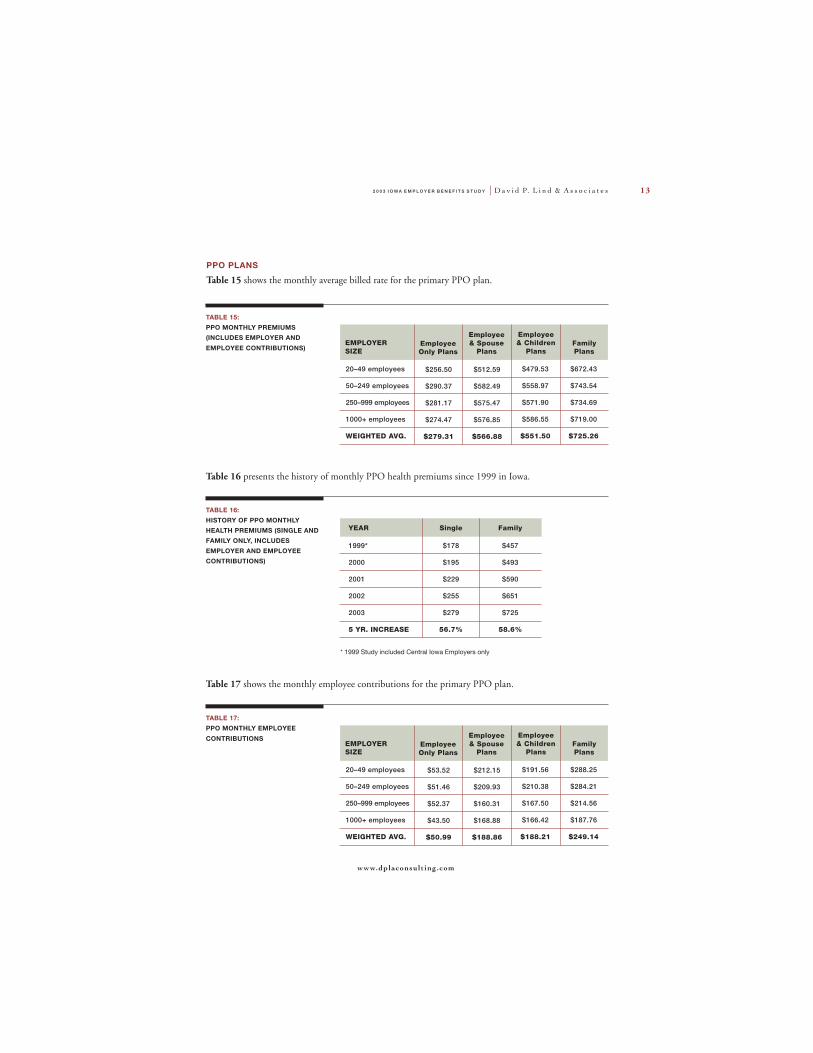
Table 15 shows the monthly average billed rate for the primary PPO plan.
TABLE 15:PPO MONTHLY PREMIUMS(INCLUDES EMPLOYER AND
EMPLOYEE CONTRIBUTIONS)EMPLOYERSIZE
EmployeeOnly Plans
Employee& Spouse
Plans
Employee& Children
PlansFamilyPlans
$256.50
$290.37
$281.17
$274.47
$279.31
$512.59
$582.49
$575.47
$576.85
$566.88
20–49 employees
50–249 employees
250–999 employees
1000+ employees
WEIGHTED AVG.
$479.53
$558.97
$571.90
$586.55
$551.50
$672.43
$743.54
$734.69
$719.00
$725.26
Table 16 presents the history of monthly PPO health premiums since 1999 in Iowa.
YEAR
1999*
2000
2001
2002
2003
5 YR. INCREASE
Single
$178
$195
$229
$255
$279
56.7%
Family
$457
$493
$590
$651
$725
58.6%
* 1999 Study included Central Iowa Employers only
Table 17 shows the monthly employee contributions for the primary PPO plan.
TABLE 17:PPO MONTHLY EMPLOYEE
CONTRIBUTIONSEMPLOYERSIZE
EmployeeOnly Plans
Employee& Spouse
Plans
Employee& Children
PlansFamilyPlans
$53.52
$51.46
$52.37
$43.50
$50.99
$212.15
$209.93
$160.31
$168.88
$188.86
20–49 employees
50–249 employees
250–999 employees
1000+ employees
WEIGHTED AVG.
$191.56
$210.38
$167.50
$166.42
$188.21
$288.25
$284.21
$214.56
$187.76
$249.14
D a v i d P. L i n d & A s s o c i a t e s 2 0 0 3 I O W A E M P L O Y E R B E N E F I T S S T U D Y14
515.273.5140
Your Advocate In Employee Benefits
In the complex and increasingly costly world of employee benefits, finding answers and
making decisions can be difficult — without the right assistance. Insurance rates continue
to climb. Many companies are short staffed and find themselves scrambling to stay
current on issues and benefit alternatives.
Since 1995, David P. Lind & Associates, L.L.C. (DPL&A) has emerged as an employee
benefits consulting firm that is an advocate for employers and their employees. We act in our
clients’ best interest — always. We thoroughly research alternatives to ensure that our clients
get the best value in products and services.
At DPL&A, we are advisors and agents for clients who want to make informed decisions
about their benefits plans.
• We represent clients in all industries — from manufacturing and education to healthcare
and not-for-profit organizations.
• We educate our clients by providing current information on benefit trends and insurance
issues; by compiling benefit and cost comparisons; and by advising them about benefit
risk management.
• We serve our clients by acting as a liaison with insurance companies; by helping them to
communicate benefit changes; by working to resolve claims issues; and by providing
ongoing support.
As brokers, we have access to all insurance products and services, but we do not endorse one
insurance company over another — allowing us to be completely unbiased and objective in
advising you. When you employ DPL&A, we are your advocate in the marketplace and
throughout the plan year.
2 0 0 3 I O W A E M P L O Y E R B E N E F I T S S T U D Y D a v i d P. L i n d & A s s o c i a t e s 15
www.dplaconsult ing.com
• Are you surprised by your employee benefits rate increases each year?
• Are you frustrated with sifting through multiple insurance proposals?
• Are you confused by the various funding options available?
• Are you stressed with the thought of changing insurance carriers every few years?
• Are you in need of someone who always works in your best interest with objectivity and
integrity?
Call DPL&A — where we believe that employee benefits should be “client driven” rather
than “product driven”. Let us show you the difference!
WHY DPL&A CONDUCTS THIS STUDY
DPL&A believes that data regarding employee benefits is an invaluable benchmarking tool
for any employer to determine the competitiveness of his or her own benefits package.
The 2003 Iowa Employer Benefits Study© includes valuable information about health care
benefits, dental insurance, retirement plans and other benefits offered by Iowa employers. In
addition, employer attitudes on the overall health care industry are revealed. The study is an
unbiased, statewide survey of the benefit programs being offered by Iowa employers with 20
or more employees. This survey is useful to all employers in Iowa because it reflects diverse
industries, geographic areas and company size.
Prior to 1999, DPL&A could not find any source of benefits information that exclusively
dealt with Iowa employee benefits. So, in 1999 — seeing the need to become a resource and
informed advisor to Iowa employers by gathering, compiling and presenting meaningful
benefits information specific to Iowa — DPL&A undertook the first Central Iowa Employer
Benefits Study© to help its clients deal with a tight labor market, and to better recruit and
retain qualified employees. DPL&A has conducted annual studies ever since.
FIND OUT MORE ABOUT THIS STUDY
For more information about this study and the many services available through DPL&A,
please call DPL&A at (800) 821-5463 or email us at [email protected]. DPL&A
can also be reached on the Internet at www.dplaconsulting.com. Any comments and/or
suggestions on this and future studies are certainly welcome.
Data Point Research, Inc. provided its statistical expertise and guidance to make this Study possible.
D a v i d P. L i n d & A s s o c i a t e s 2 0 0 3 I O W A E M P L O Y E R B E N E F I T S S T U D Y16
515.273.5140
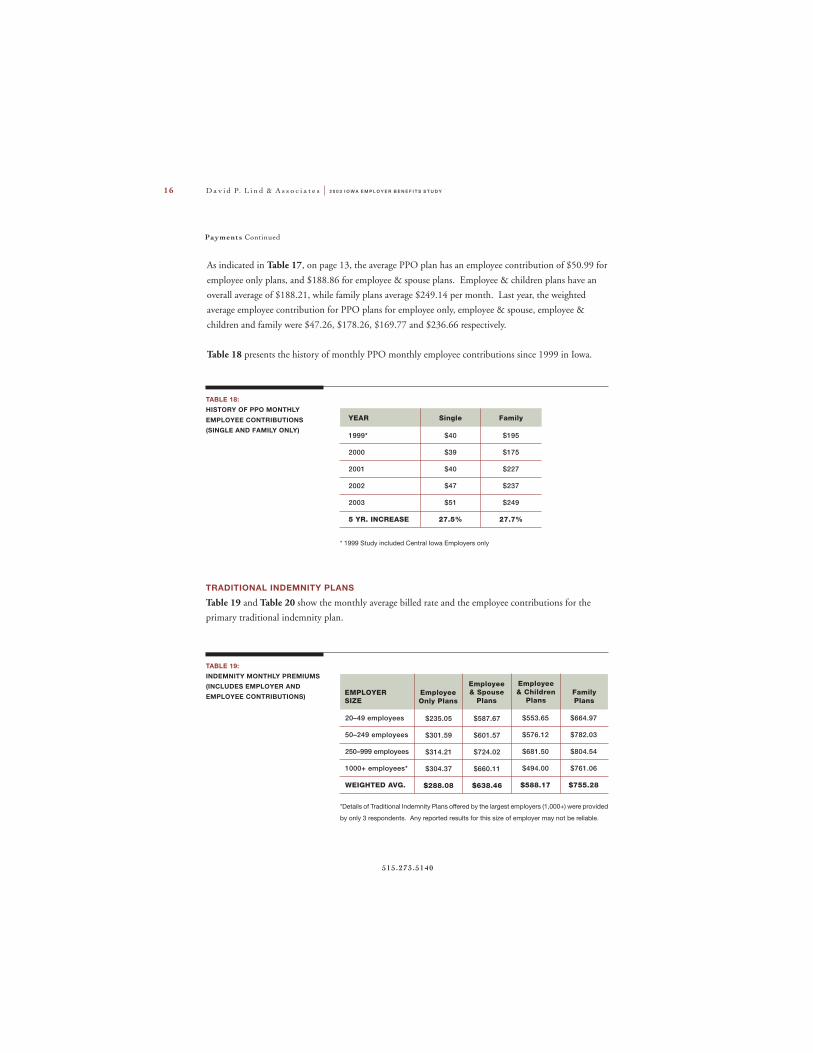
Payments Continued
TRADITIONAL INDEMNITY PLANS
Table 19 and Table 20 show the monthly average billed rate and the employee contributions for the
primary traditional indemnity plan.
TABLE 19:INDEMNITY MONTHLY PREMIUMS(INCLUDES EMPLOYER ANDEMPLOYEE CONTRIBUTIONS) Employee
Only Plans
Employee& Spouse
Plans
Employee& Children
PlansFamilyPlans
$235.05
$301.59
$314.21
$304.37
$288.08
$587.67
$601.57
$724.02
$660.11
$638.46
$553.65
$576.12
$681.50
$494.00
$588.17
$664.97
$782.03
$804.54
$761.06
$755.28
20–49 employees
50–249 employees
250–999 employees
1000+ employees*
WEIGHTED AVG.
EMPLOYERSIZE
As indicated in Table 17, on page 13, the average PPO plan has an employee contribution of $50.99 for
employee only plans, and $188.86 for employee & spouse plans. Employee & children plans have an
overall average of $188.21, while family plans average $249.14 per month. Last year, the weighted
average employee contribution for PPO plans for employee only, employee & spouse, employee &
children and family were $47.26, $178.26, $169.77 and $236.66 respectively.
Table 18 presents the history of monthly PPO monthly employee contributions since 1999 in Iowa.
TABLE 18:HISTORY OF PPO MONTHLY
EMPLOYEE CONTRIBUTIONS(SINGLE AND FAMILY ONLY)
YEAR
1999*
2000
2001
2002
2003
5 YR. INCREASE
Single
$40
$39
$40
$47
$51
27.5%
Family
$195
$175
$227
$237
$249
27.7%
* 1999 Study included Central Iowa Employers only
*Details of Traditional Indemnity Plans offered by the largest employers (1,000+) were provided
by only 3 respondents. Any reported results for this size of employer may not be reliable.
2 0 0 3 I O W A E M P L O Y E R B E N E F I T S S T U D Y D a v i d P. L i n d & A s s o c i a t e s 17
www.dplaconsult ing.com
HMO/POS PLAN BENEFITS
EMPLOYER SIZE Single Family
TABLE 21:HMO/POS IN-NETWORKDEDUCTIBLES BY EMPLOYERSIZE
In-network deductibles average
$340 per employee for single
coverage, and $724 for family
coverage. Last year, the average
deductibles for single and family
coverage were $270 and $535
respectively.
$543
$375
$297
$122
$340
20–49 employees
50–249 employees
250–999 employees
1000+ employees
Weighted AVG.
$1,143
$769
$699
$237
$724
TABLE 20:
INDEMNITY MONTHLY EMPLOYEECONTRIBUTIONS
The average Indemnity plan has an
employee contribution of $53.55
for employee only plans, and
$189.19 for employee & spouse
plans. Employee & children plans
have an overall average of $162.50,
while family plans average $232.52
per month. Last year, the
weighted average employee
contribution for Indemnity plans for
employee only, employee &
spouse, employee & children and
family were $64.60, $196.53,
$190.19 and $238.18 respectively.
EmployeeOnly Plans
Employee& Spouse
Plans
Employee& Children
PlansFamilyPlans
$57.06
$51.30
$50.04
$59.77
$53.55
$164.51
$174.01
$164.42
$308.31
$189.19
$172.53
$179.96
$134.00
$144.00
$162.50
$204.90
$273.39
$224.72
$239.10
$232.52
20–49 employees
50–249 employees
250–999 employees
1000+ employees*
WEIGHTED AVG.
EMPLOYERSIZE
*Details of Traditional Indemnity Plans offered by the largest employers (1,000+) were provided
by only 3 respondents. Any reported results for this size of employer may not be reliable.
EMPLOYER SIZE Single Family
TABLE 22:
HMO/POS MAXIMUM OUT-OF-POCKET EXPENSES FOR SINGLEAND FAMILY COVERAGE
The average maximum out-of-
pocket for single and family
coverage is shown. The weighted
average maximum out-of-pocket
expense for all employers is
$1,350 for single coverage and
$2,794 for family. Last year, the
average maximum out-of-pocket
for single and family coverage was
$1,191 and $2,425 respectively.
$1,415
$1,407
$1,492
$1,006
$1,350
20–49 employees
50–249 employees
250–999 employees
1000+ employees
Weighted AVG.
$2,869
$2,918
$3,134
$2,077
$2,794
D a v i d P. L i n d & A s s o c i a t e s 2 0 0 3 I O W A E M P L O Y E R B E N E F I T S S T U D Y18
515.273.5140
TABLE 24:PPO IN-NETWORK DEDUCTIBLESBY EMPLOYER SIZE
In-network deductibles average
$473 per employee for single
coverage, and $1,022 for family
coverage. Last year, the average
deductibles for single and family
coverage were $384 and $825
respectively.
EMPLOYER SIZE Single Family
$650
$494
$426
$291
$473
20–49 employees
50–249 employees
250–999 employees
1000+ employees
Weighted AVG.
$1,368
$1,080
$893
$706
$1,022
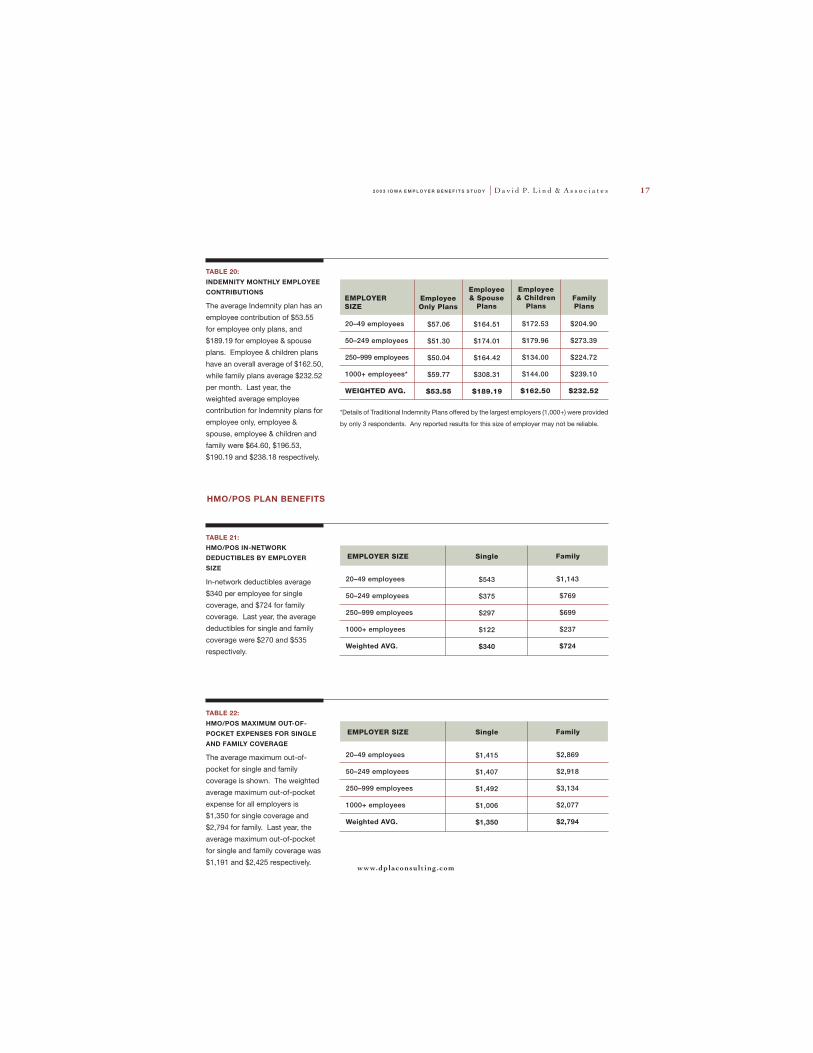
EXHIBIT 7:HMO/POS AVERAGE DOCTOR’S
OFFICE CO-PAY (IN $)
The average doctor’s office co-pay
is $13.54. Last year, this co-pay
averaged $12.52 per visit.
$15.00
$14.50
$14.00
$13.50
$13.00
$12.5050–249 250–999 1000+ Overall
Number of Employees
$12.70
$14.68
$13.97
$13.54
20–49
$12.86
TABLE 23:HMO/POS DRUG CO-PAY BYEMPLOYER SIZE
Table 23 displays the average drug
co-pay for generic, preferred brand
name, and non-preferred brand
name drugs. Last year, the
weighted average co-pays for
generic, preferred brand name,
and non-preferred brand name
drugs were $8.04, $16.58 and
$29.77 respectively.
EMPLOYER SIZE GenericPreferred
Brand-NameNon-preferredBrand-Name
$9.46
$10.74
$8.63
$9.10
$9.56
$21.95
$21.32
$19.24
$17.03
$20.00
20–49 employees
50–249 employees
250–999 employees
1000+ employees
WEIGHTED AVG.
$36.71
$37.98
$35.21
$30.52
$35.40
PPO PLAN BENEFITS
HMO/POS Benefits Continued
2 0 0 3 I O W A E M P L O Y E R B E N E F I T S S T U D Y D a v i d P. L i n d & A s s o c i a t e s 19
www.dplaconsult ing.com
TABLE 25:HISTORY OF PPO IN-NETWORKDEDUCTIBLES
Table 25 presents the history of PPO In-Network Deductibles since 1999.
YEAR
1999*
2000
2001
2002
2003
5 YR. INCREASE
Single
$305
$280
$342
$384
$473
55.1%
Family
$693
$599
$748
$825
$1,022
47.5%
* 1999 Study included Central Iowa Employers only
TABLE 26:PPO MAXIMUM OUT-OF-POCKETEXPENSES FOR SINGLE ANDFAMILY COVERAGE
The weighted average maximum
out-of-pocket expense for all
employers is $1,522 for single
coverage and $3,049 for family.
Last year, the average maximum
out-of-pocket for single and family
coverage was $1,287 and $2,661
respectively.
EMPLOYER SIZE Single Family
$1,849
$1,468
$1,407
$1,519
$1,522
20–49 employees
50–249 employees
250–999 employees
1000+ employees
Weighted AVG.
$3,757
$2,934
$2,849
$2,941
$3,049
TABLE 27:HISTORY OF PPO MAXIMUMOUT-OF-POCKET EXPENSES YEAR
1999*
2000
2001
2002
2003
5 YR. INCREASE
Single
$1,117
$1,001
$1,210
$1,287
$1,522
36.3%
Family
$2,277
$1,943
$2,468
$2,661
$3,049
33.9%
* 1999 Study included Central Iowa Employers only
Table 27 presents the history of PPO Maximum Out-of-Pocket Expenses since 1999.
D a v i d P. L i n d & A s s o c i a t e s 2 0 0 3 I O W A E M P L O Y E R B E N E F I T S S T U D Y20
515.273.5140
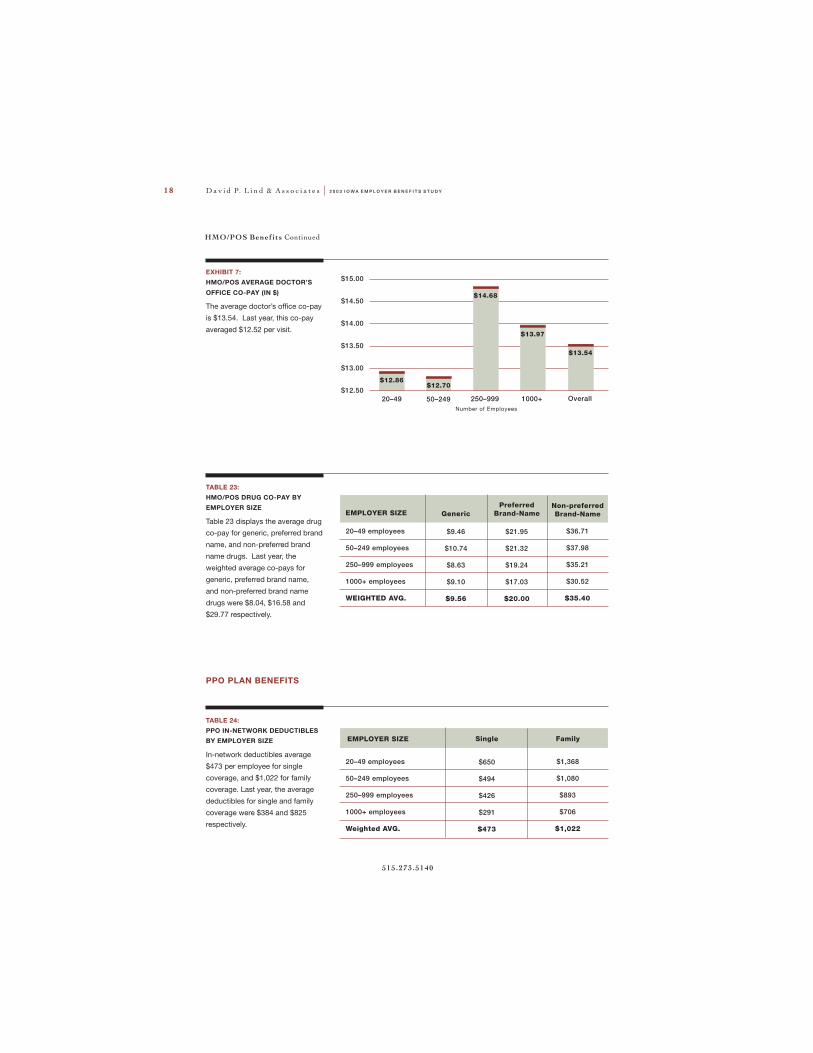
EXHIBIT 8:
PPO AVERAGE DOCTOR’S OFFICECO-PAY (IN $)
The average doctor’s office co-pay
is $14.11. Last year, this co-pay
averaged $13.28 per visit.
$15.00
$14.50
$14.00
$13.50
$13.00
50–249 250–999 1000+ OverallNumber of Employees
$13.40
$14.11
20–49
$13.54
$14.92 $14.90
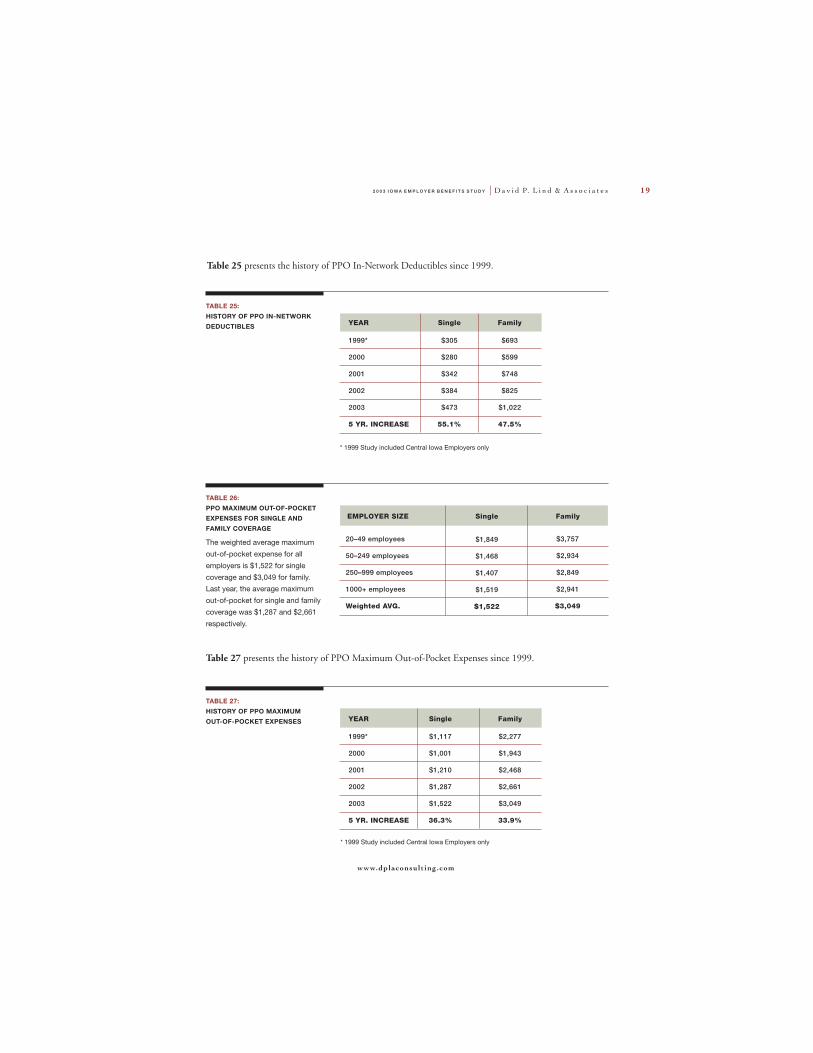
EXHIBIT 9:HISTORY OF PPO AVERAGEDOCTOR’S OFFICE CO-PAYS (IN $)
The PPO average doctor’s office
co-pay has increased 24.5% over
the last 5 years.
$15.00
$14.00
$13.00
$12.00
$10.00
$9.00
2000 2001 2002 2003Number of Employees
$11.32
$14.11
1999*
$11.33
$12.49
$13.28
Exhibit 9 presents the history of PPO average doctor’s office co-pays since 1999.
* 1999 Study included Central Iowa Employers only
TABLE 28:PPO DRUG CO-PAY BY EMPLOYERSIZE
Table 28 displays the average drug
co-pay for generic, preferred brand
name, and non-preferred brand
name drugs. Last year, the
weighted average co-pays for
generic, preferred brand name,
and non-preferred brand name
drugs were $8.45, $16.86 and
$27.42 respectively.
EMPLOYER SIZE GenericPreferred
Brand-NameNon-preferredBrand-Name
$9.75
$9.83
$9.28
$8.69
$9.48
$21.61
$20.67
$19.94
$18.41
$20.29
20–49 employees
50–249 employees
250–999 employees
1000+ employees
WEIGHTED AVG.
$34.77
$35.29
$33.34
$29.00
$33.58
PPO Benefits Continued
2 0 0 3 I O W A E M P L O Y E R B E N E F I T S S T U D Y D a v i d P. L i n d & A s s o c i a t e s 21
www.dplaconsult ing.com
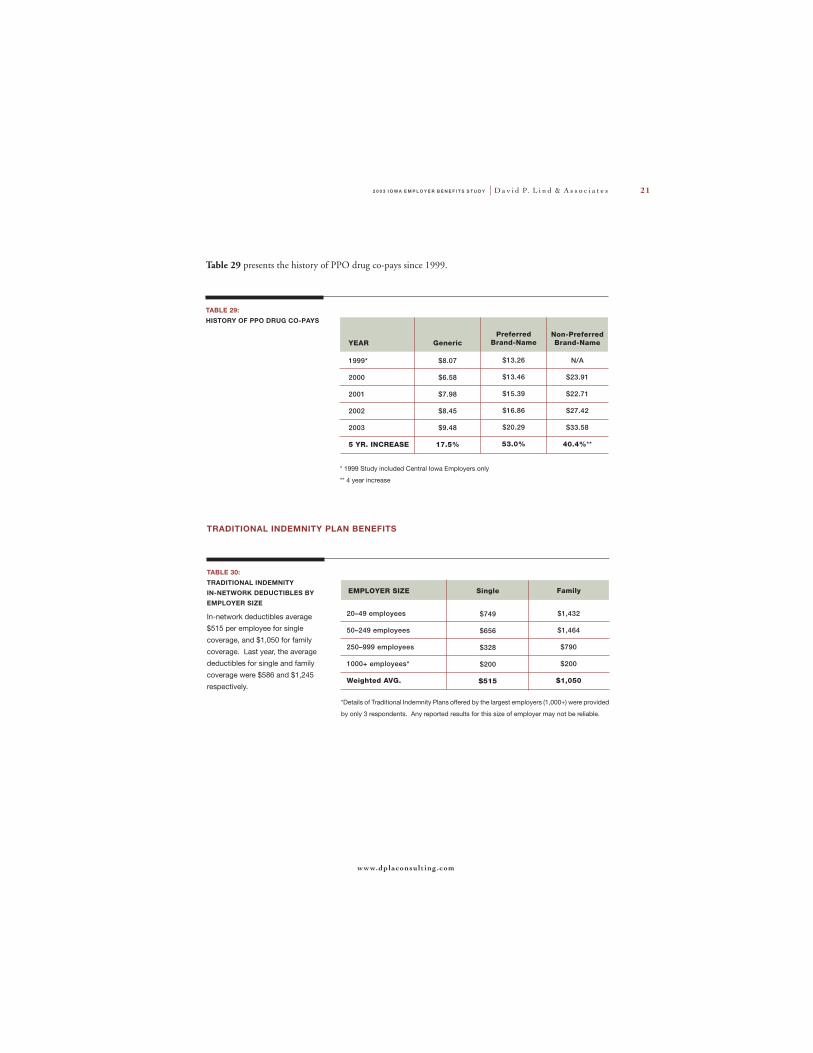
TABLE 29:
HISTORY OF PPO DRUG CO-PAYS
YEAR
1999*
2000
2001
2002
2003
5 YR. INCREASE
Generic
$8.07
$6.58
$7.98
$8.45
$9.48
17.5%
PreferredBrand-Name
$13.26
$13.46
$15.39
$16.86
$20.29
53.0%
* 1999 Study included Central Iowa Employers only
** 4 year increase
Non-PreferredBrand-Name
N/A
$23.91
$22.71
$27.42
$33.58
40.4%**
TRADITIONAL INDEMNITY PLAN BENEFITS
TABLE 30:
TRADITIONAL INDEMNITYIN-NETWORK DEDUCTIBLES BYEMPLOYER SIZE
In-network deductibles average
$515 per employee for single
coverage, and $1,050 for family
coverage. Last year, the average
deductibles for single and family
coverage were $586 and $1,245
respectively.
EMPLOYER SIZE Single Family
$749
$656
$328
$200
$515
20–49 employees
50–249 employees
250–999 employees
1000+ employees*
Weighted AVG.
$1,432
$1,464
$790
$200
$1,050
*Details of Traditional Indemnity Plans offered by the largest employers (1,000+) were provided
by only 3 respondents. Any reported results for this size of employer may not be reliable.
Table 29 presents the history of PPO drug co-pays since 1999.
D a v i d P. L i n d & A s s o c i a t e s 2 0 0 3 I O W A E M P L O Y E R B E N E F I T S S T U D Y22
515.273.5140
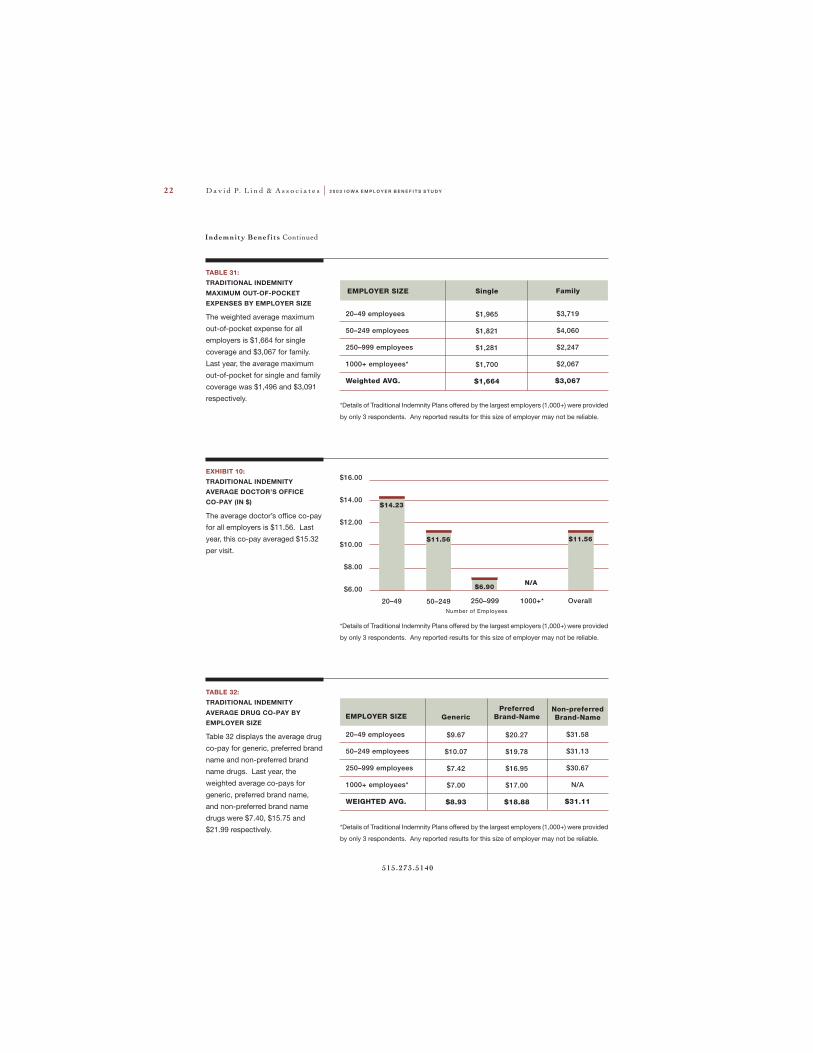
EXHIBIT 10:TRADITIONAL INDEMNITYAVERAGE DOCTOR’S OFFICECO-PAY (IN $)
The average doctor’s office co-pay
for all employers is $11.56. Last
year, this co-pay averaged $15.32
per visit.
$16.00
$14.00
$12.00
$10.00
$8.00
$6.00
50–249 250–999 1000+* OverallNumber of Employees
$11.56 $11.56
20–49
$14.23
$6.90N/A
*Details of Traditional Indemnity Plans offered by the largest employers (1,000+) were provided
by only 3 respondents. Any reported results for this size of employer may not be reliable.
TABLE 32:TRADITIONAL INDEMNITY
AVERAGE DRUG CO-PAY BYEMPLOYER SIZE
Table 32 displays the average drug
co-pay for generic, preferred brand
name and non-preferred brand
name drugs. Last year, the
weighted average co-pays for
generic, preferred brand name,
and non-preferred brand name
drugs were $7.40, $15.75 and
$21.99 respectively. *Details of Traditional Indemnity Plans offered by the largest employers (1,000+) were provided
by only 3 respondents. Any reported results for this size of employer may not be reliable.
EMPLOYER SIZE GenericPreferred
Brand-NameNon-preferredBrand-Name
$9.67
$10.07
$7.42
$7.00
$8.93
$20.27
$19.78
$16.95
$17.00
$18.88
20–49 employees
50–249 employees
250–999 employees
1000+ employees*
WEIGHTED AVG.
$31.58
$31.13
$30.67
N/A
$31.11
TABLE 31:TRADITIONAL INDEMNITY
MAXIMUM OUT-OF-POCKETEXPENSES BY EMPLOYER SIZE
The weighted average maximum
out-of-pocket expense for all
employers is $1,664 for single
coverage and $3,067 for family.
Last year, the average maximum
out-of-pocket for single and family
coverage was $1,496 and $3,091
respectively.
EMPLOYER SIZE Single Family
$1,965
$1,821
$1,281
$1,700
$1,664
20–49 employees
50–249 employees
250–999 employees
1000+ employees*
Weighted AVG.
$3,719
$4,060
$2,247
$2,067
$3,067
*Details of Traditional Indemnity Plans offered by the largest employers (1,000+) were provided
by only 3 respondents. Any reported results for this size of employer may not be reliable.
Indemnity Benefits Continued
2 0 0 3 I O W A E M P L O Y E R B E N E F I T S S T U D Y D a v i d P. L i n d & A s s o c i a t e s 23
www.dplaconsult ing.com
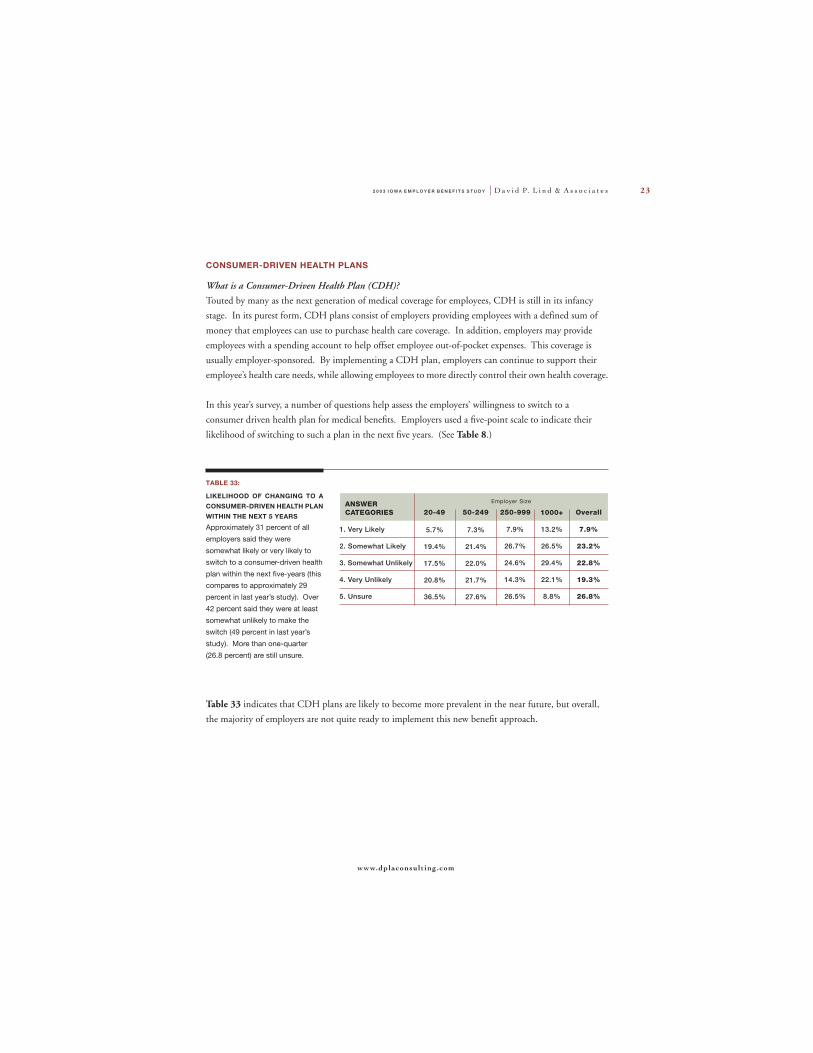
CONSUMER-DRIVEN HEALTH PLANS
What is a Consumer-Driven Health Plan (CDH)?Touted by many as the next generation of medical coverage for employees, CDH is still in its infancy
stage. In its purest form, CDH plans consist of employers providing employees with a defined sum of
money that employees can use to purchase health care coverage. In addition, employers may provide
employees with a spending account to help offset employee out-of-pocket expenses. This coverage is
usually employer-sponsored. By implementing a CDH plan, employers can continue to support their
employee’s health care needs, while allowing employees to more directly control their own health coverage.
In this year’s survey, a number of questions help assess the employers’ willingness to switch to a
consumer driven health plan for medical benefits. Employers used a five-point scale to indicate their
likelihood of switching to such a plan in the next five years. (See Table 8.)
TABLE 33:
LIKELIHOOD OF CHANGING TO ACONSUMER-DRIVEN HEALTH PLANWITHIN THE NEXT 5 YEARS
Approximately 31 percent of all
employers said they were
somewhat likely or very likely to
switch to a consumer-driven health
plan within the next five-years (this
compares to approximately 29
percent in last year’s study). Over
42 percent said they were at least
somewhat unlikely to make the
switch (49 percent in last year’s
study). More than one-quarter
(26.8 percent) are still unsure.
ANSWERCATEGORIES 20-49 50-249 250-999 1000+
5.7%
19.4%
17.5%
20.8%
36.5%
7.3%
21.4%
22.0%
21.7%
27.6%
1. Very Likely
2. Somewhat Likely
3. Somewhat Unlikely
4. Very Unlikely
5. Unsure
7.9%
26.7%
24.6%
14.3%
26.5%
13.2%
26.5%
29.4%
22.1%
8.8%
Overall
7.9%
23.2%
22.8%
19.3%
26.8%
Employer Size
Table 33 indicates that CDH plans are likely to become more prevalent in the near future, but overall,
the majority of employers are not quite ready to implement this new benefit approach.
D a v i d P. L i n d & A s s o c i a t e s 2 0 0 3 I O W A E M P L O Y E R B E N E F I T S S T U D Y24
515.273.5140
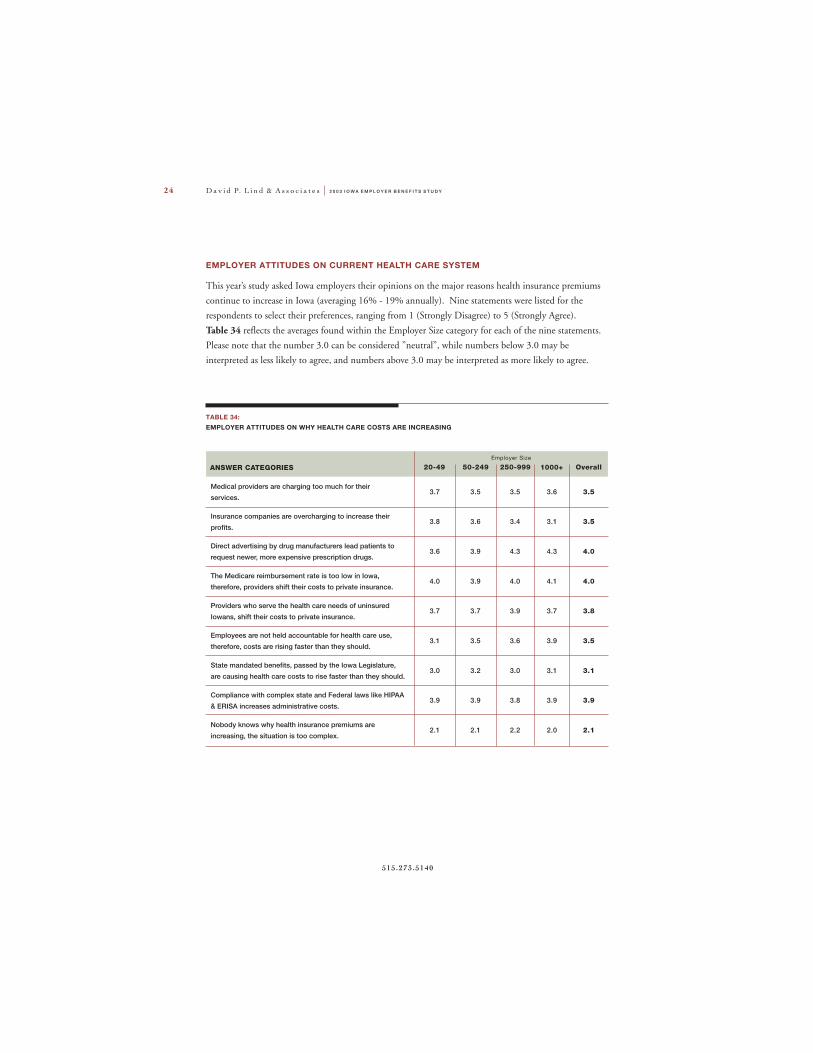
EMPLOYER ATTITUDES ON CURRENT HEALTH CARE SYSTEM
This year’s study asked Iowa employers their opinions on the major reasons health insurance premiums
continue to increase in Iowa (averaging 16% - 19% annually). Nine statements were listed for the
respondents to select their preferences, ranging from 1 (Strongly Disagree) to 5 (Strongly Agree).
Table 34 reflects the averages found within the Employer Size category for each of the nine statements.
Please note that the number 3.0 can be considered ”neutral”, while numbers below 3.0 may be
interpreted as less likely to agree, and numbers above 3.0 may be interpreted as more likely to agree.
TABLE 34:EMPLOYER ATTITUDES ON WHY HEALTH CARE COSTS ARE INCREASING
ANSWER CATEGORIES 20-49 50-249 250-999 1000+ OverallEmployer Size
Medical providers are charging too much for their
services.
Insurance companies are overcharging to increase their
profits.
Direct advertising by drug manufacturers lead patients to
request newer, more expensive prescription drugs.
The Medicare reimbursement rate is too low in Iowa,
therefore, providers shift their costs to private insurance.
Providers who serve the health care needs of uninsured
Iowans, shift their costs to private insurance.
Employees are not held accountable for health care use,
therefore, costs are rising faster than they should.
State mandated benefits, passed by the Iowa Legislature,
are causing health care costs to rise faster than they should.
Compliance with complex state and Federal laws like HIPAA
& ERISA increases administrative costs.
Nobody knows why health insurance premiums are
increasing, the situation is too complex.
3.7
3.8
3.6
4.0
3.7
3.1
3.0
3.9
2.1
3.5
3.6
3.9
3.9
3.7
3.5
3.2
3.9
2.1
3.5
3.4
4.3
4.0
3.9
3.6
3.0
3.8
2.2
3.6
3.1
4.3
4.1
3.7
3.9
3.1
3.9
2.0
3.5
3.5
4.0
4.0
3.8
3.5
3.1
3.9
2.1
2 0 0 3 I O W A E M P L O Y E R B E N E F I T S S T U D Y D a v i d P. L i n d & A s s o c i a t e s 25
www.dplaconsult ing.com
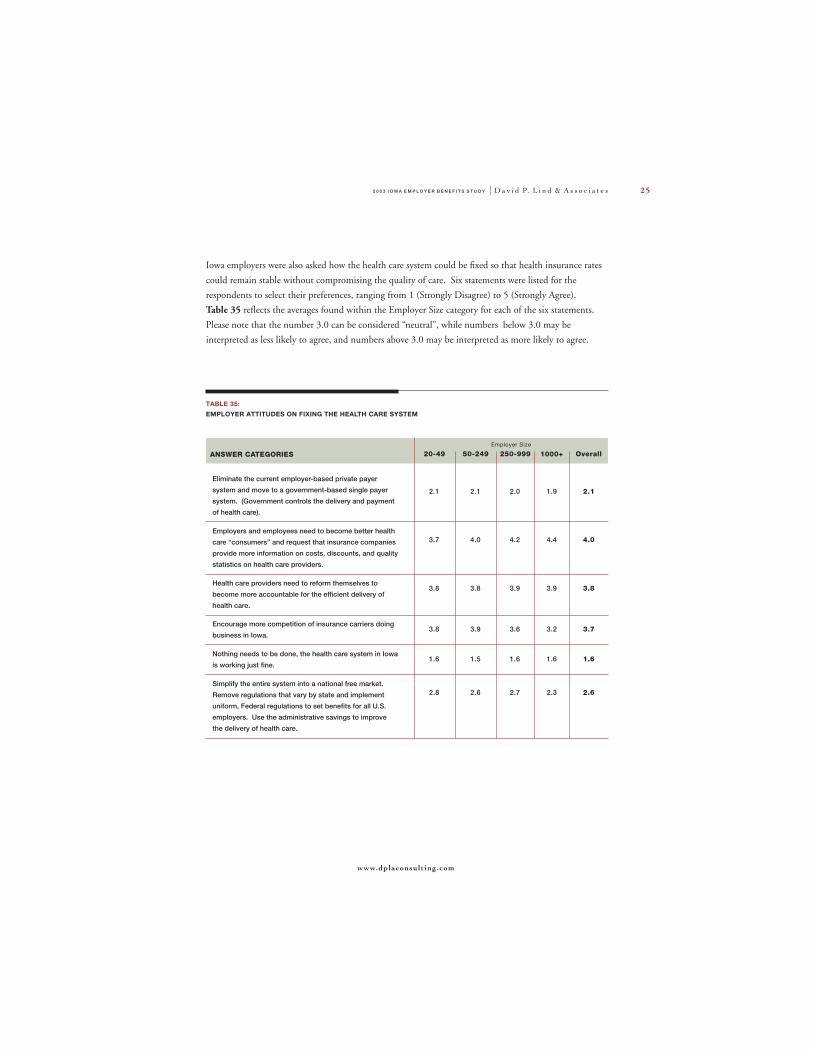
Iowa employers were also asked how the health care system could be fixed so that health insurance rates
could remain stable without compromising the quality of care. Six statements were listed for the
respondents to select their preferences, ranging from 1 (Strongly Disagree) to 5 (Strongly Agree).
Table 35 reflects the averages found within the Employer Size category for each of the six statements.
Please note that the number 3.0 can be considered “neutral”, while numbers below 3.0 may be
interpreted as less likely to agree, and numbers above 3.0 may be interpreted as more likely to agree.
TABLE 35:EMPLOYER ATTITUDES ON FIXING THE HEALTH CARE SYSTEM
ANSWER CATEGORIES 20-49 50-249 250-999 1000+ OverallEmployer Size
Eliminate the current employer-based private payer
system and move to a government-based single payer
system. (Government controls the delivery and payment
of health care).
Employers and employees need to become better health
care “consumers” and request that insurance companies
provide more information on costs, discounts, and quality
statistics on health care providers.
Health care providers need to reform themselves to
become more accountable for the efficient delivery of
health care.
Encourage more competition of insurance carriers doing
business in Iowa.
Nothing needs to be done, the health care system in Iowa
is working just fine.
Simplify the entire system into a national free market.
Remove regulations that vary by state and implement
uniform, Federal regulations to set benefits for all U.S.
employers. Use the administrative savings to improve
the delivery of health care.
2.1
3.7
3.8
3.8
1.6
2.8
2.1
4.0
3.8
3.9
1.5
2.6
2.0
4.2
3.9
3.6
1.6
2.7
1.9
4.4
3.9
3.2
1.6
2.3
2.1
4.0
3.8
3.7
1.6
2.6
D a v i d P. L i n d & A s s o c i a t e s 2 0 0 3 I O W A E M P L O Y E R B E N E F I T S S T U D Y26
515.273.5140
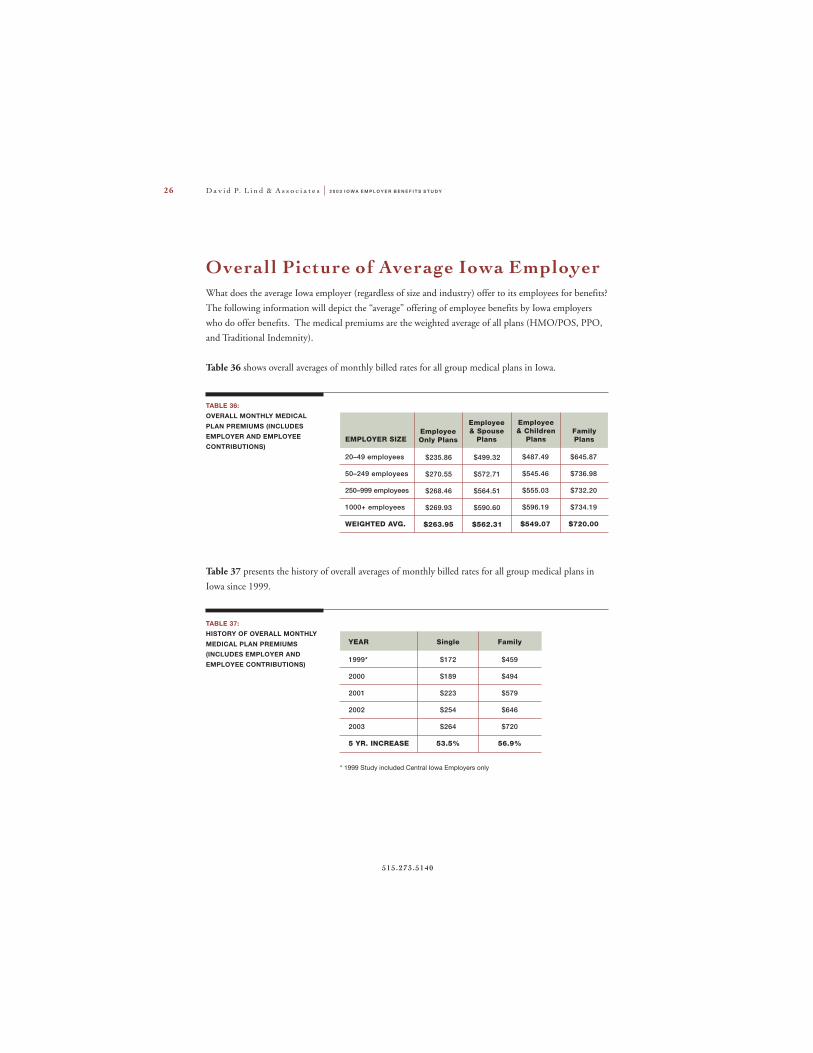
Overall Picture of Average Iowa EmployerWhat does the average Iowa employer (regardless of size and industry) offer to its employees for benefits?
The following information will depict the “average” offering of employee benefits by Iowa employers
who do offer benefits. The medical premiums are the weighted average of all plans (HMO/POS, PPO,
and Traditional Indemnity).
Table 36 shows overall averages of monthly billed rates for all group medical plans in Iowa.
TABLE 36:OVERALL MONTHLY MEDICAL
PLAN PREMIUMS (INCLUDESEMPLOYER AND EMPLOYEECONTRIBUTIONS)
EMPLOYER SIZEEmployeeOnly Plans
Employee& Spouse
Plans
Employee& Children
PlansFamilyPlans
$235.86
$270.55
$268.46
$269.93
$263.95
$499.32
$572.71
$564.51
$590.60
$562.31
$487.49
$545.46
$555.03
$596.19
$549.07
$645.87
$736.98
$732.20
$734.19
$720.00
20–49 employees
50–249 employees
250–999 employees
1000+ employees
WEIGHTED AVG.
TABLE 37:HISTORY OF OVERALL MONTHLY
MEDICAL PLAN PREMIUMS(INCLUDES EMPLOYER ANDEMPLOYEE CONTRIBUTIONS)
YEAR
1999*
2000
2001
2002
2003
5 YR. INCREASE
Single
$172
$189
$223
$254
$264
53.5%
Family
$459
$494
$579
$646
$720
56.9%
* 1999 Study included Central Iowa Employers only
Table 37 presents the history of overall averages of monthly billed rates for all group medical plans in
Iowa since 1999.
2 0 0 3 I O W A E M P L O Y E R B E N E F I T S S T U D Y D a v i d P. L i n d & A s s o c i a t e s 27
www.dplaconsult ing.com
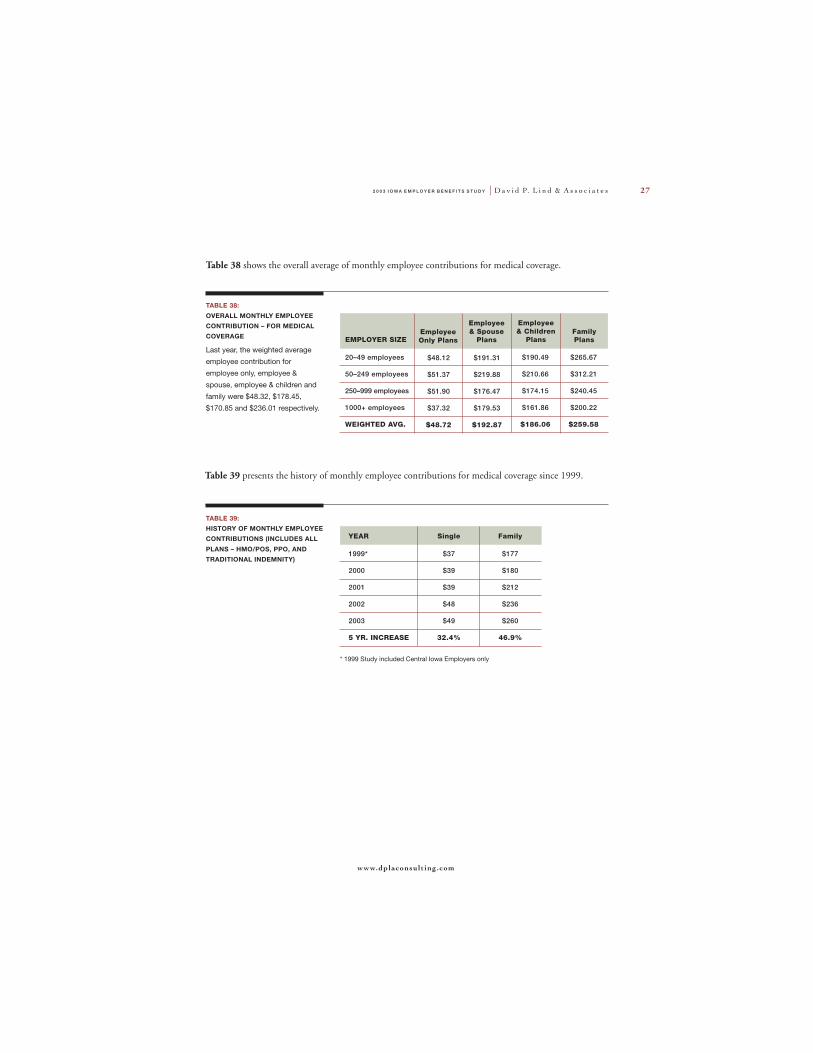
TABLE 38:
OVERALL MONTHLY EMPLOYEECONTRIBUTION – FOR MEDICALCOVERAGE
Last year, the weighted average
employee contribution for
employee only, employee &
spouse, employee & children and
family were $48.32, $178.45,
$170.85 and $236.01 respectively.
EMPLOYER SIZEEmployeeOnly Plans
Employee& Spouse
Plans
Employee& Children
PlansFamilyPlans
$48.12
$51.37
$51.90
$37.32
$48.72
$191.31
$219.88
$176.47
$179.53
$192.87
$190.49
$210.66
$174.15
$161.86
$186.06
$265.67
$312.21
$240.45
$200.22
$259.58
20–49 employees
50–249 employees
250–999 employees
1000+ employees
WEIGHTED AVG.
Table 38 shows the overall average of monthly employee contributions for medical coverage.
Table 39 presents the history of monthly employee contributions for medical coverage since 1999.
TABLE 39:HISTORY OF MONTHLY EMPLOYEECONTRIBUTIONS (INCLUDES ALL
PLANS – HMO/POS, PPO, ANDTRADITIONAL INDEMNITY)
YEAR
1999*
2000
2001
2002
2003
5 YR. INCREASE
Single
$37
$39
$39
$48
$49
32.4%
Family
$177
$180
$212
$236
$260
46.9%
* 1999 Study included Central Iowa Employers only
D a v i d P. L i n d & A s s o c i a t e s 2 0 0 3 I O W A E M P L O Y E R B E N E F I T S S T U D Y28
515.273.5140
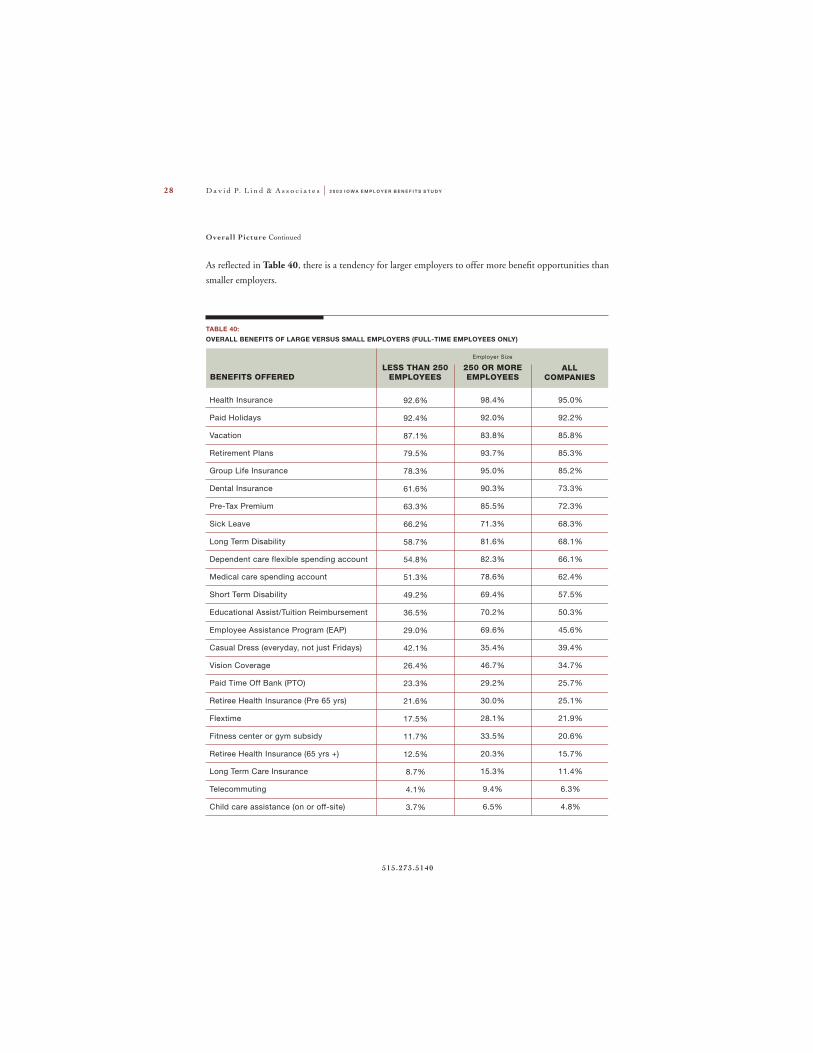
TABLE 40:OVERALL BENEFITS OF LARGE VERSUS SMALL EMPLOYERS (FULL-TIME EMPLOYEES ONLY)
Health Insurance
Paid Holidays
Vacation
Retirement Plans
Group Life Insurance
Dental Insurance
Pre-Tax Premium
Sick Leave
Long Term Disability
Dependent care flexible spending account
Medical care spending account
Short Term Disability
Educational Assist/Tuition Reimbursement
Employee Assistance Program (EAP)
Casual Dress (everyday, not just Fridays)
Vision Coverage
Paid Time Off Bank (PTO)
Retiree Health Insurance (Pre 65 yrs)
Flextime
Fitness center or gym subsidy
Retiree Health Insurance (65 yrs +)
Long Term Care Insurance
Telecommuting
Child care assistance (on or off-site)
LESS THAN 250EMPLOYEES
250 OR MOREEMPLOYEES
ALLCOMPANIES
As reflected in Table 40, there is a tendency for larger employers to offer more benefit opportunities than
smaller employers.
BENEFITS OFFERED
95.0%
92.2%
85.8%
85.3%
85.2%
73.3%
72.3%
68.3%
68.1%
66.1%
62.4%
57.5%
50.3%
45.6%
39.4%
34.7%
25.7%
25.1%
21.9%
20.6%
15.7%
11.4%
6.3%
4.8%
98.4%
92.0%
83.8%
93.7%
95.0%
90.3%
85.5%
71.3%
81.6%
82.3%
78.6%
69.4%
70.2%
69.6%
35.4%
46.7%
29.2%
30.0%
28.1%
33.5%
20.3%
15.3%
9.4%
6.5%
92.6%
92.4%
87.1%
79.5%
78.3%
61.6%
63.3%
66.2%
58.7%
54.8%
51.3%
49.2%
36.5%
29.0%
42.1%
26.4%
23.3%
21.6%
17.5%
11.7%
12.5%
8.7%
4.1%
3.7%
Employer Size
Overal l Picture Continued