Embed Size (px)
Citation preview
8/3/2019 2003 Understanding the Transition to New Fuels and Vehicles Lessons Learned
http://slidepdf.com/reader/full/2003-understanding-the-transition-to-new-fuels-and-vehicles-lessons-learned 1/22
CHAPTER 14
Understanding theTransition to New Fuelsand Vehicles: LessonsLearned from Analysisand Experience ofAlternative Fueland Hybrid Vehicles
Paul Leiby and Jonathan Rubin
Since the energy crisis of 1973, the United States (U.S.) has explicitly soughtto moderate the consumption and importation of oil. Initially the dominantconcerns were energy conservation and energy security. During the 1980sand 1990s, the additional concerns of urban air quality and greenhouse gasestook center stage. The transportation sector represents about 28 percentof total domestic energy use (Davis and Diegel, 2002, Table 2.1). Of the
total amount of transportation energy used in the United States, thedemand is overwhelmingly met by petroleum. As David Greene (1996)points out, the almost complete dependence of the transportation sectoron petroleum persists today despite the market upheavals of the 1970sand early 1980s. In 1973, at the height of the Arab embargo, the U.S. trans-portation sector was 95.6 percent dependent on oil, about 1 percent lessthan today. Given geopolitical developments affecting global oil supply andrenewed concern about the peaking of world oil production (Campbell andLaherrere, 1998), oil dependence is again a major driver of transportationenergy policy.
191
0-12-656881_14 3/25/04 9:20 PM Page 191
8/3/2019 2003 Understanding the Transition to New Fuels and Vehicles Lessons Learned
http://slidepdf.com/reader/full/2003-understanding-the-transition-to-new-fuels-and-vehicles-lessons-learned 2/22
The question remains: How should our transportation system transi-tion itself to be more sustainable and secure? In this chapter we discuss thelessons about transitions that can be learned from past efforts to move toalternative transportation fuels, and what we can learn from the growingintroduction of hybrid electric vehicle (HEV) technology. This is veryimportant, since future policies and tax dollars are driven, in part, by expec-tations regarding the payoffs of emerging fuels and technologies such ashydrogen and fuel cells. Hydrogen fuels and fuel cell vehicles (FCVs) sharemany of the same attributes, promises, and challenges of other alternativefuel vehicles and electric drive vehicles, only perhaps magnified andcompounded.
More particularly, this chapter presents the lessons learned from ourmodeling and analysis of the transition to alternative fuel vehicles (AFVs)
and HEVs. What has worked, or could work, in a market based economywhere economies of scale in vehicle production are significant and endogenousnetwork effects are important? For the most part, the AFV technologies weexamined were mature technologically, though not mature in the market-place. For HEVs, we explicitly examined the role of technological learningto reduce production costs. It is our belief that explicitly evaluating transi-tion paths, as opposed to static equilibrium outcomes, is very importantand leads to compelling insights for a wide variety of economic and envi-ronmental questions. This of course implies that policies designed to guidemarkets must deal explicitly with transitions and not be solely concernedwith future outcomes, which may in fact never occur.
The Goal of Reducing Petroleum Demand in Transportation
There are three ways to reduce the amount of petroleum used by cars andlight trucks: lower the amount of driving per year, increase the average fuelefficiency of the vehicle fleet, or substitute alternative fuels for gasoline.The principal fuel efficiency measure in place in the United States is thecorporate average fuel economy (CAFE) standards for new cars and lighttrucks (U.S. Energy Policy and Conservation Act of 1975). CAFE regulationsspecify minimum fleet average standards for fuel efficiency that vehicle
manufacturers must meet. The Alternative Motor Fuels Act of 1988 (AMFA)provides credits for the manufacture of dedicated alternative and flexiblefuel vehicles. The fuel substitution approach is advocated by Section 502(b)of the Energy Policy Act of 1992 (EPACT) and has been an important impe-tus for research, development, and demonstration (RD&D) projects and forfleet programs to help alternative fuels enter the U.S. transportation market.Other important alternative fuel incentives include gasoline compositionand air quality requirements in the Clean Air Act Amendments of 1990 andlarge tax credits for ethanol.
EPACT also provides incentives to introduce AFVs and requires thatthe U.S. Department of Energy (DOE) estimate the technical and economic
192 The Hydrogen Transition
0-12-656881_14 3/25/04 9:20 PM Page 192
8/3/2019 2003 Understanding the Transition to New Fuels and Vehicles Lessons Learned
http://slidepdf.com/reader/full/2003-understanding-the-transition-to-new-fuels-and-vehicles-lessons-learned 3/22
feasibility of producing sufficient alternative and replacement fuels toreplace, on an energy equivalent basis, at least 10 percent of gasoline use bythe year 2000, and at least 30 percent by the year 2010 (EPACT, 502[a],502[b]). Petroleum is displaced by the use of neat alternative fuels as well asthrough the use of reformulated and oxygenated gasoline that containsnatural gas, hydrogen, and alcohol and ether-oxygenates. Replacementfuels, loosely speaking, are those portions of gasoline that are not gasoline,such as oxygenates, and other nongasoline fuels that are not alternativefuels, such as gasohol, which is a blend of 10 percent ethanol and 90 percentgasoline. The recent strong interest in hydrogen-fueled vehicles reflects itspromise for gasoline substitution, improved end-use fuel efficiency, and aset of diverse domestic supply options.
In 1996, the DOE published the results of their initial analysis of
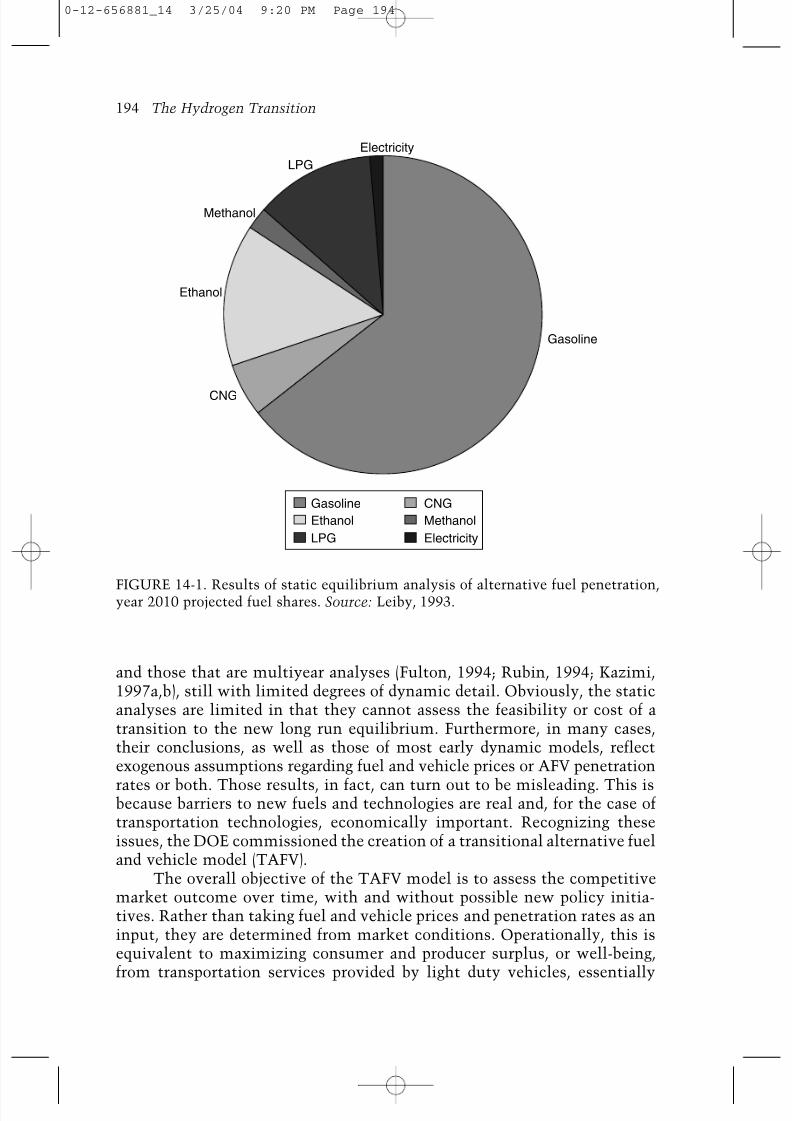
EPACT’s goals, using the Alternative Fuels Trade Model (U.S. Departmentof Energy, 1996; Leiby, 1993). This study determined, among other things,that, “For the year 2000, 10 percent replacement of light-duty motor fueluse with alternative and replacement fuels is feasible and appears likelywith existing practices and policies.” The DOE report further states:“Displacing 30 percent of light-duty motor fuel use by 2010 appears feasible.However, this estimated feasibility is based upon a number of assumptionsthat may not be realized without additional alternative-fuel initiatives.”These results are shown in Figure 14-1.
In contrast to these 1993 estimations of long-run gasoline substitution,in 2001 replacement fuels contributed only 2.6 percent of total on-roadmotor fuel, on a gasoline gallon equivalent (GGE) basis. This is despiteefforts by the DOE to promote alternative fuel use in government fleets andother markets and despite the millions of E85 flexible fuel vehicles (FFVs)on the road (Energy Information Administration [EIA], 2000, 2002). TheseFFVs can either run on straight gasoline or a blend of 85 percent ethanol and15 percent gasoline. As described in detail below, it is also quite unlikelythat the 30 percent displacement goal for the year 2010 will be met. Thisshortfall from the projections based on comparative-static analyses canlargely be attributed to an incomplete understanding of the magnitude andimportance of certain key dynamic or transitional impediments to alternative
fuels. This earlier work provided critical foundations for our transitionalanalysis.
A Transitional Analysis
As recognized by the DOE’s own analyses, past studies of alternative fueland AFV penetration assumed either mature markets with large-scale vehi-cle production and the widespread availability of alternative fuels at retailstations, or immature markets and small scale production. Early studies ofthe AFV market can be grouped into those that are static, single year snap-shots (National Research Council, 1990; U.S. Department of Energy, 1996)
Understanding the Transition to New Fuels and Vehicles 193
0-12-656881_14 3/25/04 9:20 PM Page 193
AQ: Please check the running head
8/3/2019 2003 Understanding the Transition to New Fuels and Vehicles Lessons Learned
http://slidepdf.com/reader/full/2003-understanding-the-transition-to-new-fuels-and-vehicles-lessons-learned 4/22
and those that are multiyear analyses (Fulton, 1994; Rubin, 1994; Kazimi,1997a,b), still with limited degrees of dynamic detail. Obviously, the staticanalyses are limited in that they cannot assess the feasibility or cost of atransition to the new long run equilibrium. Furthermore, in many cases,their conclusions, as well as those of most early dynamic models, reflectexogenous assumptions regarding fuel and vehicle prices or AFV penetration
rates or both. Those results, in fact, can turn out to be misleading. This isbecause barriers to new fuels and technologies are real and, for the case oftransportation technologies, economically important. Recognizing theseissues, the DOE commissioned the creation of a transitional alternative fueland vehicle model (TAFV).
The overall objective of the TAFV model is to assess the competitivemarket outcome over time, with and without possible new policy initia-tives. Rather than taking fuel and vehicle prices and penetration rates as aninput, they are determined from market conditions. Operationally, this isequivalent to maximizing consumer and producer surplus, or well-being,from transportation services provided by light duty vehicles, essentially
194 The Hydrogen Transition
Gasoline
Ethanol
LPG
Methanol
Electricity
CNG
Gasoline
Ethanol
LPG
Methanol
Electricity
CNG
FIGURE 14-1. Results of static equilibrium analysis of alternative fuel penetration,year 2010 projected fuel shares. Source: Leiby, 1993.
0-12-656881_14 3/25/04 9:20 PM Page 194
8/3/2019 2003 Understanding the Transition to New Fuels and Vehicles Lessons Learned
http://slidepdf.com/reader/full/2003-understanding-the-transition-to-new-fuels-and-vehicles-lessons-learned 5/22
cars and light trucks, and a variety of possible fuels. The TAFV model char-acterizes interactions among fuel providers, vehicle producers, fuel retailers,private vehicle purchases, and fleet vehicle programs. Each supply sector isrepresented by a single period cost function defined for each period, region,fuel, and vehicle type. Examples include vehicle production costs, fuelproduction or conversion costs, fuel retailing costs, raw material supplycosts, and sharing or mix costs associated with vehicle and fuel choices.The cost functions summarize the way in which changing levels of activities,inputs, and outputs affect the costs for each supply module, and implicitlydefine the cost minimizing behavioral relationships among the model’svariables.
Benefits in this model come from the satisfaction of final demand fortransportation services as determined from projections of light duty vehicle
fuel use, excluding diesel, for 1996 to 2010 given in the Annual Energy Outlook published by the U.S. Energy Information Administration (EIA).The total demand for light duty fuel is satisfied by the use of existing vehiclesand the purchase and use of new vehicles. The use of older vehicles is limitedby the stock of each vehicle type given a fixed, age-adjusted use profile. Eachyear, some vehicles are scrapped, and, to the extent that existing vehiclestocks are insufficient to satisfy the demand for transportation services, amix of new vehicles is purchased. New vehicles are chosen according to anested multinomial logit (NMNL) choice formulation, whose parameterscome from David Greene’s work (Greene, 1994). Vehicle choice is based onupfront vehicle capital costs, nonprice vehicle attributes, and expected life-time nested fuel choice costs. Fuel choices must be made for the vehiclesthat are dual or flexibly fueled. Since vehicle and fuel choice is endogenous,it is important to specify which fuel and vehicle characteristics are consid-ered in the fuel and vehicle choice submodules and which characteristicsare endogenously determined. A more detailed presentation of assumptionsand data sources can be found in Leiby and Rubin (1997, 2000, 2001).
From preliminary analysis and discussions with experts, we identifiedkey areas that could strongly affect the transition to alternative fuels andvehicles. These include the costs to consumers of limited fuel infrastruc-ture and retail availability of alternative fuels; scale economies for vehicle
production and fuel retailing; the implications for consumer behavior ofinitially limited AFV model choice and diversity; the prospect for techno-logical improvement and cost reduction through learning-by-doing; and anycosts to consumers from being unfamiliar with a new technology. Becauseof their potential importance, all these transitional barriers, except for thoserelated to consumer unfamiliarity, have been explicitly modeled. We didnot model the costs of consumer unfamiliarity for new technologies sincewe had little information to make realistic parameter estimates. As our resultsbelow suggest, omitting this additional possible cost is unlikely to havealtered any of our qualitative results since the AFV market has a difficulttime getting started given the transitional barriers that we do include.
Understanding the Transition to New Fuels and Vehicles 195
0-12-656881_14 3/25/04 9:20 PM Page 195
8/3/2019 2003 Understanding the Transition to New Fuels and Vehicles Lessons Learned
http://slidepdf.com/reader/full/2003-understanding-the-transition-to-new-fuels-and-vehicles-lessons-learned 6/22
Effective Costs of Limited Retail Fuel Availability
Most alternative fuels are currently available at only very few retail stations.
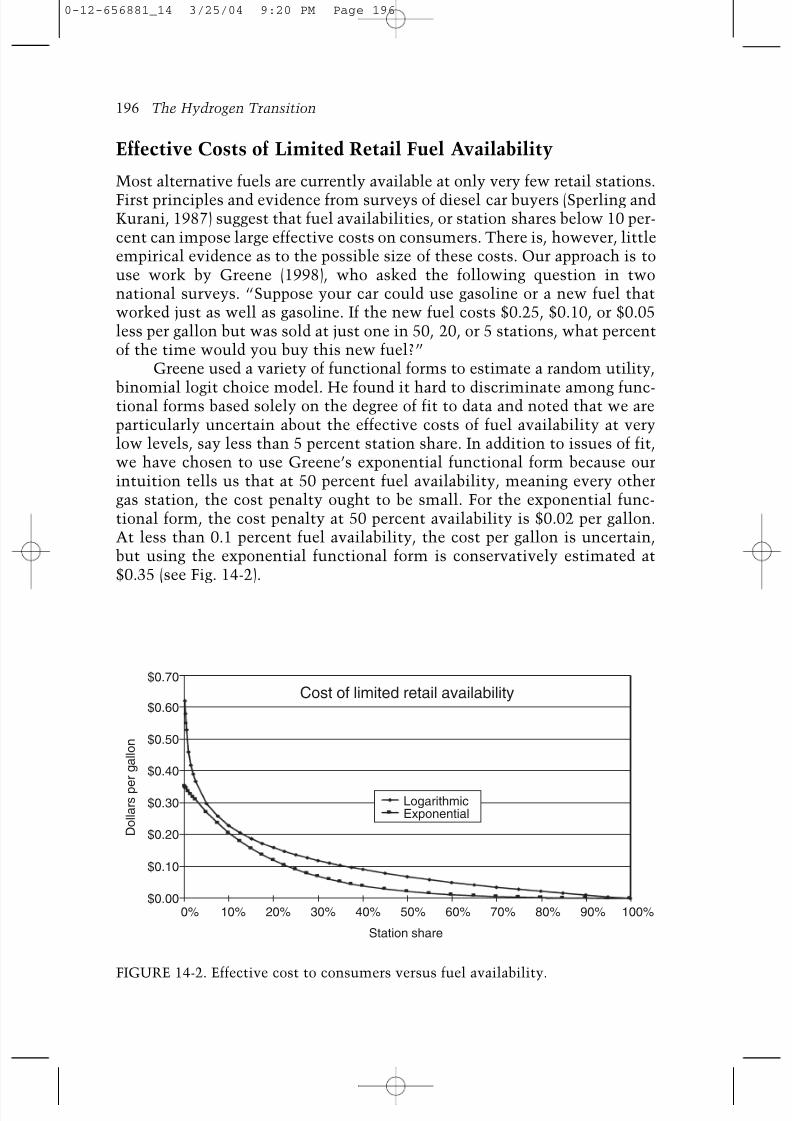
First principles and evidence from surveys of diesel car buyers (Sperling andKurani, 1987) suggest that fuel availabilities, or station shares below 10 per-cent can impose large effective costs on consumers. There is, however, littleempirical evidence as to the possible size of these costs. Our approach is touse work by Greene (1998), who asked the following question in twonational surveys. “Suppose your car could use gasoline or a new fuel thatworked just as well as gasoline. If the new fuel costs $0.25, $0.10, or $0.05less per gallon but was sold at just one in 50, 20, or 5 stations, what percentof the time would you buy this new fuel?”
Greene used a variety of functional forms to estimate a random utility,
binomial logit choice model. He found it hard to discriminate among func-tional forms based solely on the degree of fit to data and noted that we areparticularly uncertain about the effective costs of fuel availability at verylow levels, say less than 5 percent station share. In addition to issues of fit,we have chosen to use Greene’s exponential functional form because ourintuition tells us that at 50 percent fuel availability, meaning every othergas station, the cost penalty ought to be small. For the exponential func-tional form, the cost penalty at 50 percent availability is $0.02 per gallon.At less than 0.1 percent fuel availability, the cost per gallon is uncertain,but using the exponential functional form is conservatively estimated at$0.35 (see Fig. 14-2).
196 The Hydrogen Transition
Logarithmic
Cost of limited retail availability
Station share
D o l l a r s p e
r g a l l o n
Exponential
0%
$0.70
$0.60
$0.50
$0.40
$0.30
$0.20
$0.10
$0.0010% 20% 30% 40% 50% 60% 70% 80% 90% 100%
FIGURE 14-2. Effective cost to consumers versus fuel availability.
0-12-656881_14 3/25/04 9:20 PM Page 196
8/3/2019 2003 Understanding the Transition to New Fuels and Vehicles Lessons Learned
http://slidepdf.com/reader/full/2003-understanding-the-transition-to-new-fuels-and-vehicles-lessons-learned 7/22
Vehicle Manufacturers’ Costs per Modeland Economies of Scale
The TAFV model is designed to estimate the costs of vehicle production forthe following alternative fuels: liquefied petroleum gas (LPG), compressednatural gas (CNG), methanol, ethanol, and electricity. The vehicles areeither dedicated to a particular fuel type or are capable of using both gaso-line and the respective alternative fuel. The one exception is electricity,which is a direct fuel input only to dedicated electric vehicles. AFV costsare calculated from engineering–economic estimates of the incrementalcost of each AFV fuel technology compared to conventional vehicle tech-nology (Energy and Environmental Analysis, 1995). The AFV technologiesthat we model, except for electric vehicles and HEVs, are assumed to be
mature. This means that for a given production scale further productionexperience will not reduce per unit vehicle production costs at a ratesignificantly faster than it would for conventional vehicles.
Substantial economies of scale in vehicle production exist in the auto-motive industry. That is, there are sharp reductions in per unit vehicle costwith larger volume production of any given vehicle model. Significant scaleeconomies for a given vehicle model occur y around 10,000 vehicles producedper year, with full economies achieved at 100,000 vehicles per year. Therefore,we modeled per unit vehicle production costs as a declining functionof average vehicle plant size in each year. The volume of production inany given year is constrained by the level of cumulative investment inproduction capacity less capacity decay. This means that vehicle prices andmanufacturing capacity are endogenous variables. This has the advantage ofadmitting the positive feedback effects from policies that encourage theearly adoption, and hence larger scale production, of AFVs.
Accounting for Vehicle Model Diversity and theEffective Cost of Limited Diversity
Consumers contemplating buying a new gasoline fueled car are offered awide variety of vehicle makes and models with a huge number of features
to choose among. The marketwide attractiveness of an alternative fuel orhybrid electric technology will depend on the diversity of vehicle models forwhich it is made available. Offering, for example, methanol fuel technologyon only a single model will put methanol vehicles at a disadvantage com-pared to gasoline vehicles, all else being equal. At the same time, offeringmethanol capability on several different models is expensive because itlowers plant scale for any overall level of production. Thus, during the tran-sition period for a new vehicle technology, there is an inherent tensionbetween providing model diversity and achieving economies of scale.
Rather than predetermining the number of makes and models offeredwith alternative fuel capability, the TAFV model balances the additional
Understanding the Transition to New Fuels and Vehicles 197
0-12-656881_14 3/25/04 9:20 PM Page 197
8/3/2019 2003 Understanding the Transition to New Fuels and Vehicles Lessons Learned
http://slidepdf.com/reader/full/2003-understanding-the-transition-to-new-fuels-and-vehicles-lessons-learned 8/22
production costs against the additional consumer satisfaction. This isaccomplished by defining a variable that represents the number of makesand models for each vehicle and fuel type produced. On the vehicle produc-tion side, we divide the total industry production capacity for each vehicleand fuel type by this diversity variable to get the average production scalefor that vehicle type; on the consumer side we incorporate the diversityvariable into our multinomial choice framework.
The value of diversity to consumers depends on the order in whichvehicle manufacturers introduce a new fuel or vehicle technology to theirexisting model lines. This is because different models have market pene-trations that vary from a few thousand per year for specialty cars to wellover 100,000 for some popular cars and pickup trucks. If alternative fuelcapability is introduced randomly on different vehicle models, then we
estimate the cost to be initially $2080 per vehicle. If manufacturers add thealternative fuel technology to the most popular model line first, then theeffective cost to consumers of limited model diversity is lower, dropping toan estimated $727 per vehicle. When AFV offerings ultimately have thesame richness of models as gasoline vehicles, then the limited diversity costis nothing. In the simulation model we assume that the alternative fueltechnology is offered on the most popular model first. Thus, the significanceof the initially limited model diversity for new vehicle technology dependson the strategy that manufacturers adopt when introducing the technology.If the technology is introduced on a new, unfamiliar, and made-to-purposevehicle, such as Honda initially did with the Insight HEV, then the deter-rent effect of limited model diversity is far greater than if the manufacturertakes a chance by introducing the technology on its most popular vehicle,such as Honda subsequently did with the Civic Hybrid.
Technological Cost Reduction and Learning-by-Doing
Learning-by-doing (LBD) is the process by which the costs of new technolo-gies decline as a function of cumulative experience. This phenomenon isobserved in various industrial situations where it is described as a learningcurve, progress function, or experience curve. It is important to distinguish
LBD, scale economies, and learning by technological progress, which is closelyrelated to R&D spending.
The theory of LBD was first exposited by Arrow (1968). Empiricalstudies using historical data suggest learning rates in the range of 5 to20 percent per doubling of experience (e.g., Lieberman, 1984; InternationalEnergy Agency, 2000; McDonald and Schrattenholzer, 2001). At the sametime, however, these rates must be used with great caution. This is because,as McDonald and Schrattenholzer note, the empirical literature varies in itsmethodologies and data sources by which learning rates are calculated. Forexample, the literature does not always disaggregate learning from theeffects of scale or R&D expenditures. Sometimes the dependent variable is
198 The Hydrogen Transition
0-12-656881_14 3/25/04 9:20 PM Page 198
8/3/2019 2003 Understanding the Transition to New Fuels and Vehicles Lessons Learned
http://slidepdf.com/reader/full/2003-understanding-the-transition-to-new-fuels-and-vehicles-lessons-learned 9/22
price, rather than cost, and price is influenced by supply and demand factorsnot related to learning. Finally, the period chosen for the empirical analysiscan also affect the calculated learning rate. Notwithstanding these limita-tions, LBD, as documented in the empirical literature, appears to be an impor-tant component of technology change and cost reduction. The existence ofsubstantial learning may also be important for determining good publicpolicies designed to spur new technologies.
A concept related to LBD is learning from R&D. The Partnership for aNew Generation of Vehicles and FreedomCAR programs are classic examplesof this research based approach to advanced automotive design. Public poli-cies to encourage new technologies can encourage both R&D and LBD.However, the prospect of learning from R&D can have significantly differ-ent policy implications than LBD. As Goulder and Mathai (2000) show in
the context of climate change, if knowledge is gained primarily throughR&D, then it may be justifiable to shift abatement to the future and to actlater. If cost reductions are also gained via LBD, then the impact of learningand technological change on the timing of abatement efforts is ambiguous.The same reasoning may be applied to policies for promoting new vehicletechnologies. Depending on the particular technologies and assumptions, itmay be optimal to act sooner and implement technologies, to learn andthereby lower future costs. If the endogenous LBD rate is sufficiently rapid,LBD proponents argue that forcing a sharp divergence from existing tech-nologies by performance mandates could induce otherwise uneconomictechnologies to become economically viable.
For the TAFV modeling results described here, we assumed that theprospects for nonhydrogen AFV cost reduction through LBD were no greaterthan those for conventional vehicles, based on the views expressed by thosewho provided the AFV cost estimates (Energy and Environmental Analysis[EEA], Inc.). This means that the incremental costs for AFVs relative toconventional vehicles did not improve through LBD. For HEVs, on the otherhand, we assumed that given the comparative newness and complexity ofthe technology, a moderate rate of LBD could be gained at a rate of a 10 per-cent reduction in cost per doubling of cumulative production experience.The net effect implied is that by the time HEV production reaches a signif-
icant share of total new vehicles produced, HEV incremental costs for largeplants could decline to about one-half of their initial level.
Lessons Learned about the Transition to New Fuelsand Vehicles
Despite the range of federal, state, and local initiatives to promote alterna-tive fuel use since the 1980s, there has been little progress in developingalternative fuel infrastructure, advancing the alternative fuel transition, orachieving alternative vehicle sales and fuel sales. Apart from the mandatedsales of AFVs to some fleets, the principal exception has been the sale of
Understanding the Transition to New Fuels and Vehicles 199
0-12-656881_14 3/25/04 9:20 PM Page 199
8/3/2019 2003 Understanding the Transition to New Fuels and Vehicles Lessons Learned
http://slidepdf.com/reader/full/2003-understanding-the-transition-to-new-fuels-and-vehicles-lessons-learned 10/22
over 4 million ethanol FFVs. The sale of FFVs, mostly to private consumers,is completely understandable, and was predicted by the TAFV model, as themost profitable response of domestic vehicle manufacturers to the federalprovision of CAFE credits in the AFMA (Rubin and Leiby, 2000). However,as was also anticipated, an associated ethanol supply infrastructure hasnot developed, since these vehicles use little or no ethanol and their FFVproperty is virtually irrelevant to most owners, except in selected states withheavy ethanol subsidies. These historical facts alone provide useful lessonsabout the prospective transition to hydrogen fueled vehicles. The transi-tional analyses done with the TAFV model help to explain these outcomesand allow investigation of possible future outcomes under different policiesand incentives, as well as different market conditions and oil price regimes.
In analyzing the transition to alternative fuels other than hydrogen—
such as ethanol, methanol, CNG, LPG, and electricity—analyses with theTAFV model led to some important conclusions that bear on the proposedhydrogen transition. We find that the transition matters a lot. Furthermore,we can identify some of the most important barriers. For AFVs, the mostimportant barriers seem to be limited fuel availability and vehicle scaleeconomies. For HEVs, incremental vehicle costs are large. As a result, vehiclescale economies matter, but scale cost reductions are more easily attainedby the use of widely shared components—such as batteries, motors, andcontrollers—across multiple vehicle platforms. Similar gains should bepossible for FCVs. For HEVs, the dominant transitional factor is the uncertainprospect for LBD.
Both the real-world experience with federal and state fleet AFV programsover the last decade and modeling analyses of proposed expanded private andlocal fleet mandates indicate that forcing vehicle technology adoption by a fewdoesn’t work unless the technology has private appeal. This does not bode wellfor the strategy of mandated or heavily subsidized niche introduction.
Transitions Matter a Lot
The barriers to new fuels and technologies are real and economically impor-tant. Some barriers are transitional, and some barriers will endure so long
as overall market conditions—including oil prices and environmentalpolicies—do not change fundamentally. We find that static equilibriumanalysis of the prospects for new vehicle technologies can be misleading.
Modeling experiments confirm that transitional barriers, and the par-ticular transition paths pursued, matter a lot for the technology’s ultimatemarket success. Using similar technology and market assumptions asthe original U.S. EIA (1993) study on alternative fuel vehicles, we reesti-mated the likely market penetration of alternative fuels by 2010 using adynamic analysis and incorporating transitional factors. We incorporatedthe transitional factors discussed above, including vehicle and productionscale economies, consumer costs of low retail fuel availability, consumer
200 The Hydrogen Transition
0-12-656881_14 3/25/04 9:20 PM Page 200
8/3/2019 2003 Understanding the Transition to New Fuels and Vehicles Lessons Learned
http://slidepdf.com/reader/full/2003-understanding-the-transition-to-new-fuels-and-vehicles-lessons-learned 11/22
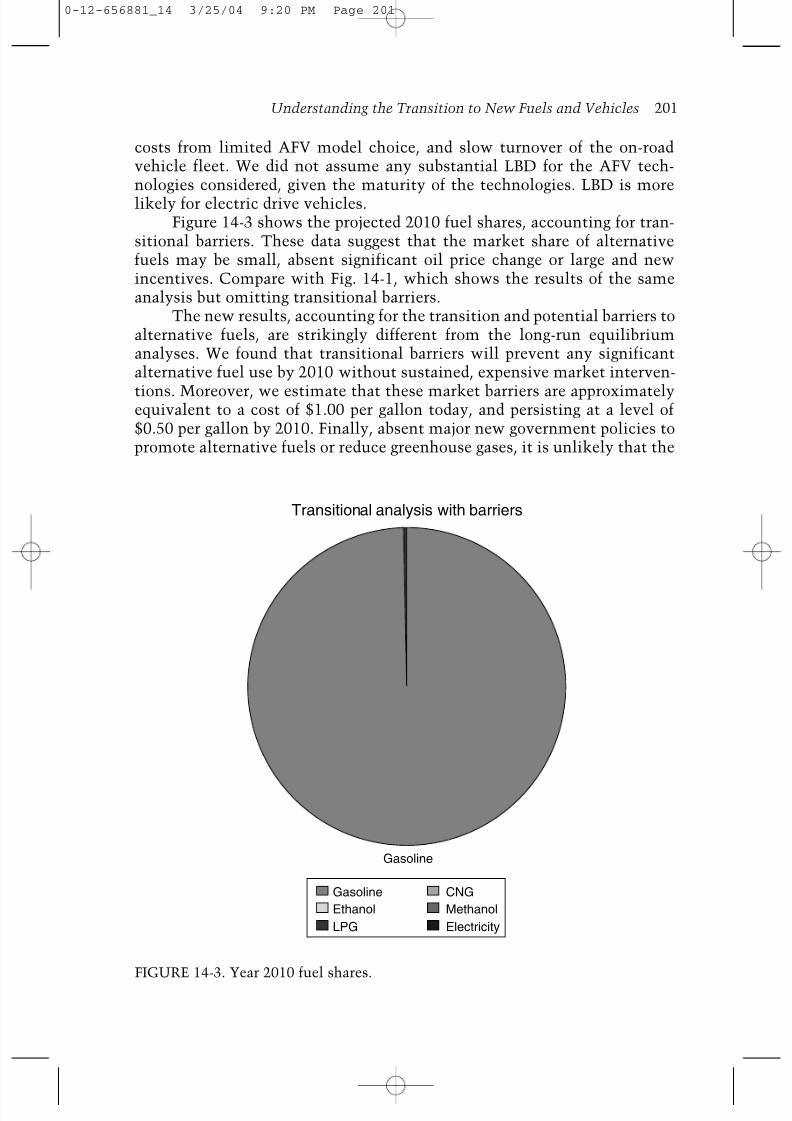
costs from limited AFV model choice, and slow turnover of the on-roadvehicle fleet. We did not assume any substantial LBD for the AFV tech-nologies considered, given the maturity of the technologies. LBD is morelikely for electric drive vehicles.
Figure 14-3 shows the projected 2010 fuel shares, accounting for tran-sitional barriers. These data suggest that the market share of alternativefuels may be small, absent significant oil price change or large and newincentives. Compare with Fig. 14-1, which shows the results of the sameanalysis but omitting transitional barriers.
The new results, accounting for the transition and potential barriers toalternative fuels, are strikingly different from the long-run equilibriumanalyses. We found that transitional barriers will prevent any significantalternative fuel use by 2010 without sustained, expensive market interven-
tions. Moreover, we estimate that these market barriers are approximatelyequivalent to a cost of $1.00 per gallon today, and persisting at a level of$0.50 per gallon by 2010. Finally, absent major new government policies topromote alternative fuels or reduce greenhouse gases, it is unlikely that the
Understanding the Transition to New Fuels and Vehicles 201
Gasoline
Transitional analysis with barriers
Gasoline
Ethanol
LPG
Methanol
Electricity
CNG
FIGURE 14-3. Year 2010 fuel shares.
0-12-656881_14 3/25/04 9:20 PM Page 201
8/3/2019 2003 Understanding the Transition to New Fuels and Vehicles Lessons Learned
http://slidepdf.com/reader/full/2003-understanding-the-transition-to-new-fuels-and-vehicles-lessons-learned 12/22
United States will achieve or even approach EPACT’s 2010 displacementgoals (Leiby and Rubin, 2001). These transitional barriers are likely to havesimilar implications for prospects of hydrogen ICE vehicles and for FCVs.
Coordination, Choice, Scale, Learning
There is a conflict between diversity of choice and cost savings resultingfrom economies of scale in vehicle production and network economies forfuel provision. This means that there is a trade-off between offering theconsumer many vehicle and fuel choices and achieving low cost transporta-tion services. For AFVs, initial vehicle costs at low scales are 10 to 50 percenthigher than their full scale costs, and achieving scale economies quickly isessential for profitability. Taking a broader view, it means that at the level of
the market selection of vehicle and fuel technology, there is a major tensionbetween the merits of producing different AFV technologies for differentcircumstances and for different consumer regions or market segments, andthe substantial scale and network economies associated with producing andfueling a single vehicle-fuel technology.
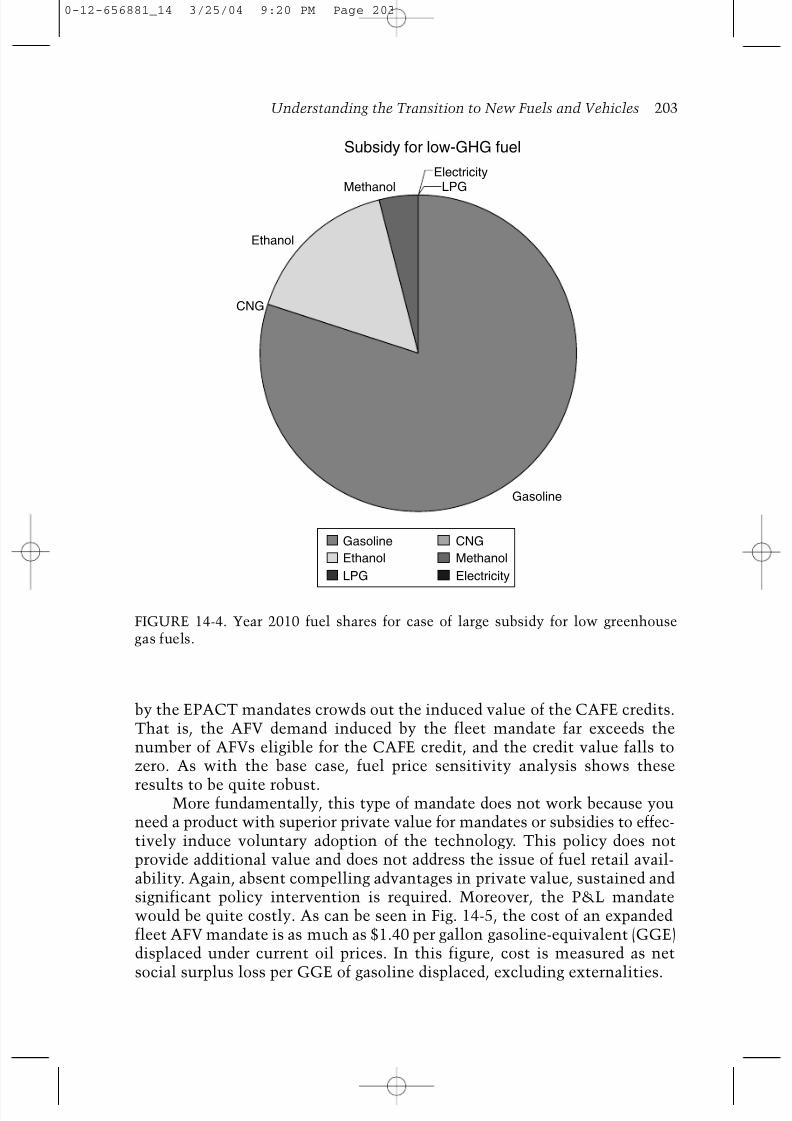
This tension proves to be more important than most would anticipate,particularly when we account for transitional barriers. In the long-runcomparative static analyses of 1993, it was estimated that as many as fivedifferent AFV technologies would compete and contribute simultaneouslyto displace significant fractions of gasoline. The modeling analysis thatincluded transitional issues repeatedly found that it was difficult for anyAFV to gain market share. Moreover, only one or two alternative fuels atmost could simultaneously exist in the market when gasoline was displaced(see Fig. 14-4). This point also has significance for the problematic enterpriseof “picking winners,” in other words choosing particular technologies topromote. If only one or two new technologies can survive in the challengingnetwork of vehicles and fuel, the costs of choosing and promoting whatmight be the wrong one is very high.
Forcing a Relatively Small Market Segment to BuyAFVs Will Not Work
The DOE has the authority under EPACT to require private fleets and thoseof state and local (P&L) governments to purchase AFVs, expanding the fleetAFV sales mandate to about 2 percent of total vehicle sales. We estimate theoutcome of imposing the P&L fleet mandate to be that nonfleet vehicleowners would be induced to purchase an additional 2.9 percent of AFVs by2010. Thus, under this rule a total of 4.9 percent of new vehicle sales wouldbe AFVs by 2010. Thus, the P&L fleet rule could help reduce transitionalbarriers by lowering the cost of AFVs. Unfortunately, the vehicles chosenare mainly alcohol FFVs, which use very little alternative fuel given itshigh cost. Furthermore, the fleet and private demand for AFVs encouraged
202 The Hydrogen Transition
0-12-656881_14 3/25/04 9:20 PM Page 202
8/3/2019 2003 Understanding the Transition to New Fuels and Vehicles Lessons Learned
http://slidepdf.com/reader/full/2003-understanding-the-transition-to-new-fuels-and-vehicles-lessons-learned 13/22
by the EPACT mandates crowds out the induced value of the CAFE credits.That is, the AFV demand induced by the fleet mandate far exceeds thenumber of AFVs eligible for the CAFE credit, and the credit value falls tozero. As with the base case, fuel price sensitivity analysis shows these
results to be quite robust.More fundamentally, this type of mandate does not work because you
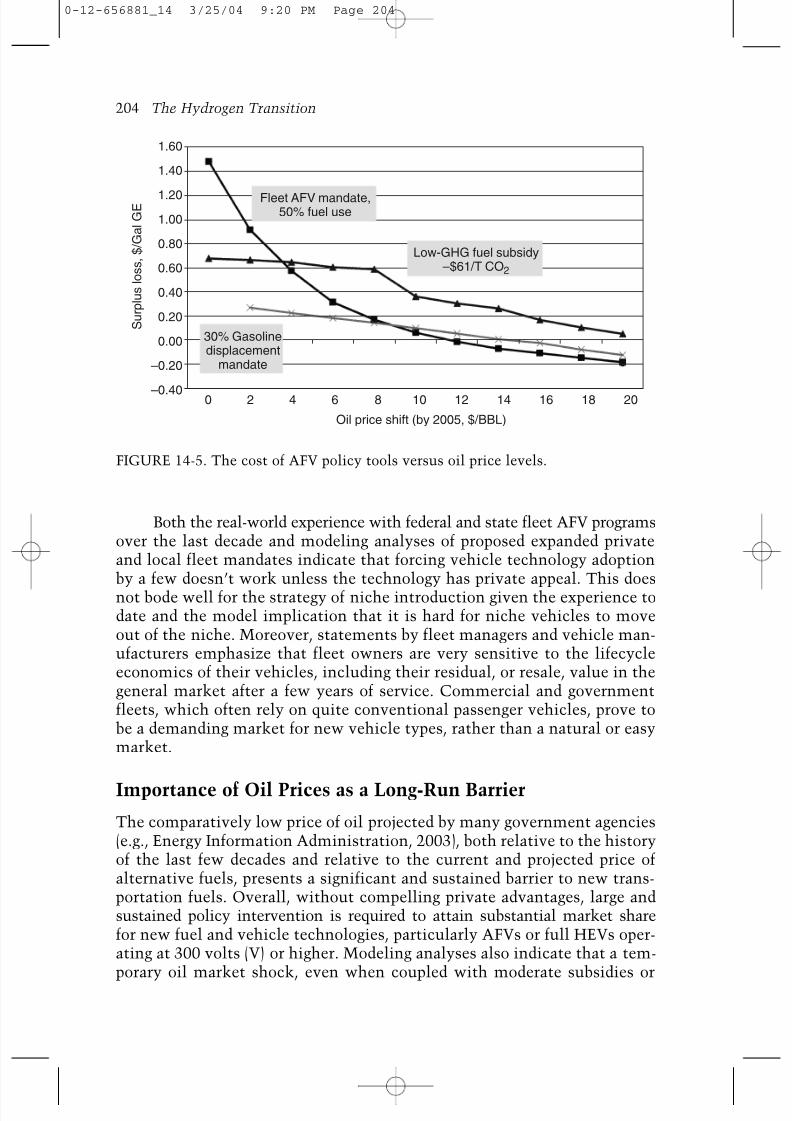
need a product with superior private value for mandates or subsidies to effec-tively induce voluntary adoption of the technology. This policy does notprovide additional value and does not address the issue of fuel retail avail-ability. Again, absent compelling advantages in private value, sustained andsignificant policy intervention is required. Moreover, the P&L mandatewould be quite costly. As can be seen in Fig. 14-5, the cost of an expandedfleet AFV mandate is as much as $1.40 per gallon gasoline-equivalent (GGE)displaced under current oil prices. In this figure, cost is measured as netsocial surplus loss per GGE of gasoline displaced, excluding externalities.
Understanding the Transition to New Fuels and Vehicles 203
Gasoline
Ethanol
CNG
LPGMethanolElectricity
Subsidy for low-GHG fuel
Gasoline
Ethanol
LPG
Methanol
Electricity
CNG
FIGURE 14-4. Year 2010 fuel shares for case of large subsidy for low greenhousegas fuels.
0-12-656881_14 3/25/04 9:20 PM Page 203
8/3/2019 2003 Understanding the Transition to New Fuels and Vehicles Lessons Learned
http://slidepdf.com/reader/full/2003-understanding-the-transition-to-new-fuels-and-vehicles-lessons-learned 14/22
Both the real-world experience with federal and state fleet AFV programsover the last decade and modeling analyses of proposed expanded privateand local fleet mandates indicate that forcing vehicle technology adoptionby a few doesn’t work unless the technology has private appeal. This doesnot bode well for the strategy of niche introduction given the experience todate and the model implication that it is hard for niche vehicles to moveout of the niche. Moreover, statements by fleet managers and vehicle man-ufacturers emphasize that fleet owners are very sensitive to the lifecycleeconomics of their vehicles, including their residual, or resale, value in thegeneral market after a few years of service. Commercial and governmentfleets, which often rely on quite conventional passenger vehicles, prove tobe a demanding market for new vehicle types, rather than a natural or easymarket.
Importance of Oil Prices as a Long-Run Barrier
The comparatively low price of oil projected by many government agencies(e.g., Energy Information Administration, 2003), both relative to the historyof the last few decades and relative to the current and projected price ofalternative fuels, presents a significant and sustained barrier to new trans-portation fuels. Overall, without compelling private advantages, large andsustained policy intervention is required to attain substantial market sharefor new fuel and vehicle technologies, particularly AFVs or full HEVs oper-ating at 300 volts (V) or higher. Modeling analyses also indicate that a tem-porary oil market shock, even when coupled with moderate subsidies or
204 The Hydrogen Transition
Low-GHG fuel subsidy–$61/T CO2
Fleet AFV mandate,50% fuel use
1.60
1.40
1.20
1.00
0.80
0.60
0.40
0.20
0.00
–0.20
–0.40
30% Gasolinedisplacement
mandate
0 42 6 8 10
Oil price shift (by 2005, $/BBL)
S u r p l u s l o s s ,
$ / G a l G E
12 14 16 18 20
FIGURE 14-5. The cost of AFV policy tools versus oil price levels.
0-12-656881_14 3/25/04 9:20 PM Page 204
8/3/2019 2003 Understanding the Transition to New Fuels and Vehicles Lessons Learned
http://slidepdf.com/reader/full/2003-understanding-the-transition-to-new-fuels-and-vehicles-lessons-learned 15/22
vehicle sales mandates, cannot induce significant AFV market share solong as consumers anticipate that the oil price increase will fade away after2 years.
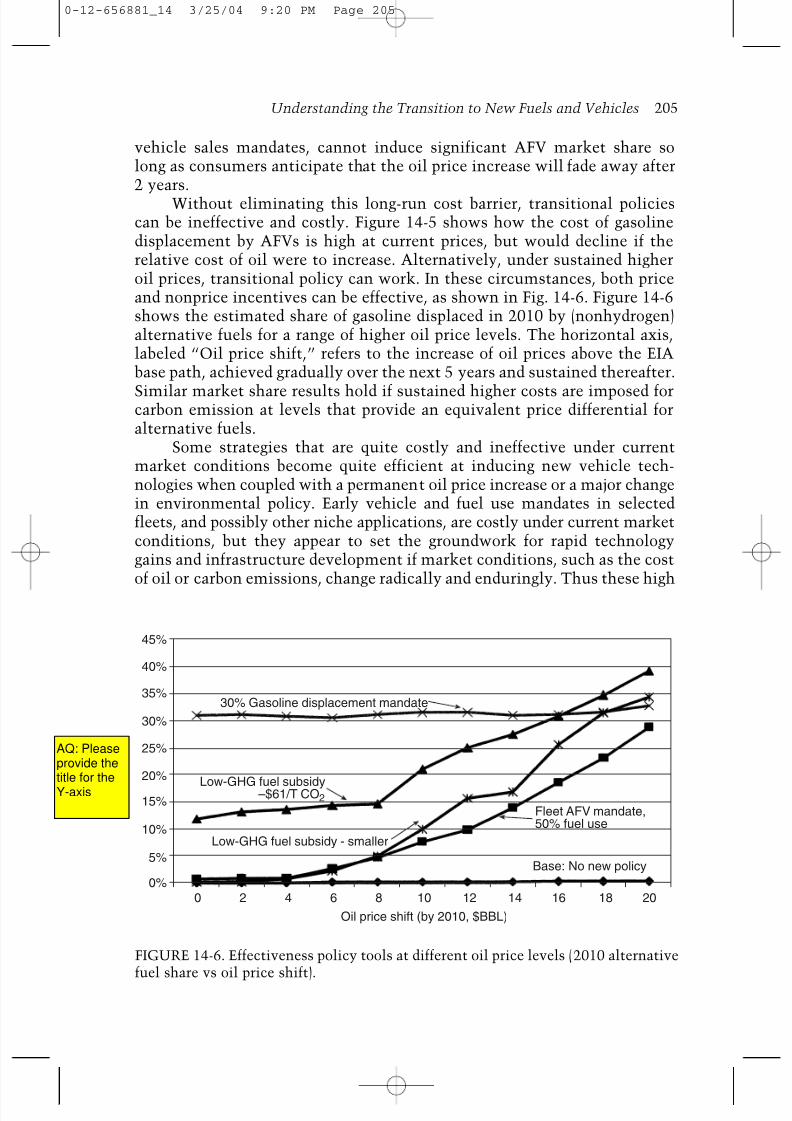
Without eliminating this long-run cost barrier, transitional policiescan be ineffective and costly. Figure 14-5 shows how the cost of gasolinedisplacement by AFVs is high at current prices, but would decline if therelative cost of oil were to increase. Alternatively, under sustained higheroil prices, transitional policy can work. In these circumstances, both priceand nonprice incentives can be effective, as shown in Fig. 14-6. Figure 14-6shows the estimated share of gasoline displaced in 2010 by (nonhydrogen)alternative fuels for a range of higher oil price levels. The horizontal axis,labeled “Oil price shift,” refers to the increase of oil prices above the EIAbase path, achieved gradually over the next 5 years and sustained thereafter.
Similar market share results hold if sustained higher costs are imposed forcarbon emission at levels that provide an equivalent price differential foralternative fuels.
Some strategies that are quite costly and ineffective under currentmarket conditions become quite efficient at inducing new vehicle tech-nologies when coupled with a permanent oil price increase or a major changein environmental policy. Early vehicle and fuel use mandates in selectedfleets, and possibly other niche applications, are costly under current marketconditions, but they appear to set the groundwork for rapid technologygains and infrastructure development if market conditions, such as the costof oil or carbon emissions, change radically and enduringly. Thus these high
Understanding the Transition to New Fuels and Vehicles 205
30% Gasoline displacement mandate
Fleet AFV mandate,50% fuel use
Low-GHG fuel subsidy - smaller
Oil price shift (by 2010, $BBL)
Base: No new policy
Low-GHG fuel subsidy–$61/T CO2
45%
40%
35%
30%
25%
20%
15%
10%
5%
0%0 2 4 6 8 10 12 14 16 18 20
FIGURE 14-6. Effectiveness policy tools at different oil price levels (2010 alternativefuel share vs oil price shift).
0-12-656881_14 3/25/04 9:20 PM Page 205
AQ: Please provide the title for the Y-axis
8/3/2019 2003 Understanding the Transition to New Fuels and Vehicles Lessons Learned
http://slidepdf.com/reader/full/2003-understanding-the-transition-to-new-fuels-and-vehicles-lessons-learned 16/22
cost programs have option value in the face of energy market and environ-mental uncertainty.
Simulations also suggest that a deployment mandate or niche applica-tion can be an effective strategy if one anticipates substantial technologicalLBD. This is relevant for the hydrogen problem.
The Ability of Conventional Technology to AdaptCan Forestall the Transition
The U.S. experience since the 1988 AFMA and the 1990 Clean Air Actamendments has shown how hard the transition to new motor fuels can be.It has also shown that established, conventional technologies and industriescan and will respond to the challenge of a substitute vehicle or fuel. The
pressure for clean, alternative fuels was answered by the development ofreformulated gasoline. Some of the newly formulated conventional fuelsembodied alternative fuel components and blends, providing a path for ameasure of renewable and alternative fuel use in existing vehicles withoutthe need for wholly new fuel distribution infrastructures or markedly newvehicle designs.
Vehicle manufacturers also demonstrated the ability to produceincreasingly clean, gasoline burning engines, sharply reducing the air qualitymotivation for alternative fuel vehicles. Manufacturers ultimately producednear-zero emission vehicles (ZEV) that challenged the need for the ZEVmandates in some states and diminished the pressure to produce electricvehicles. This demonstrated ability of the fuel and vehicle industries torespond by adapting conventional systems has not been included in theTAFV modeling analyses, which considered a range of vehicles but tookvehicle designs as static. However, provision for this natural marketresponse should be made in the planning and analysis of potential futuretransitions.
Technology Change Important, Yet a Poorly Understood Issuefor the Transition to Hydrogen
Learning curves are widely believed to be important and significant formany new technologies. But representing learning is tricky, and its magni-tude and timing is not well understood. In addition, if one accounts for costreductions through LBD when assessing policy for a technology transition,a balanced approach would also consider the potential for two countervail-ing effects. The first is the learning or adaptability of conventional technol-ogy. The second is that the potential for forgetting, the flip-side of learning,can negatively affect future outcomes.
The choice of an index of experience to use for LBD has long been oftopic of research. In TAFV, there are several ways to model cumulativeexperience: as cumulative new production capacity or new vehicles sold, or
206 The Hydrogen Transition
0-12-656881_14 3/25/04 9:20 PM Page 206
8/3/2019 2003 Understanding the Transition to New Fuels and Vehicles Lessons Learned
http://slidepdf.com/reader/full/2003-understanding-the-transition-to-new-fuels-and-vehicles-lessons-learned 17/22
as total installed production capacity or the total stock of vehicles on theroad. Given that production capacity and vehicles are scrapped over time,the latter two methods allow for forgetting as well as learning. Globersonand Levin (1987) have argued that we should incorporate both learning andforgetting into institutional environments. Benkard (2000), drawing ondata from the aircraft industry, showed that in certain industries there isevidence of organizational forgetting, saying that “…production experienceactually depreciates over time, and knowledge gained from building oneproduct doesn’t necessarily spill over to the next generation.” Benkardfound that a model that includes depreciation of experience accounts for thedata much better than the traditional learning model.
We model LBD in terms of total installed vehicle production capacity.This assumption allows both accumulation and depreciation of experience,
and does affect our results. Short lived vehicle subsidies, if they are insuffi-ciently large or long in duration, may be unable to induce a sustainable HEVproduction sector. Such temporary subsidies may only temporarily lowervehicle production costs from learning.
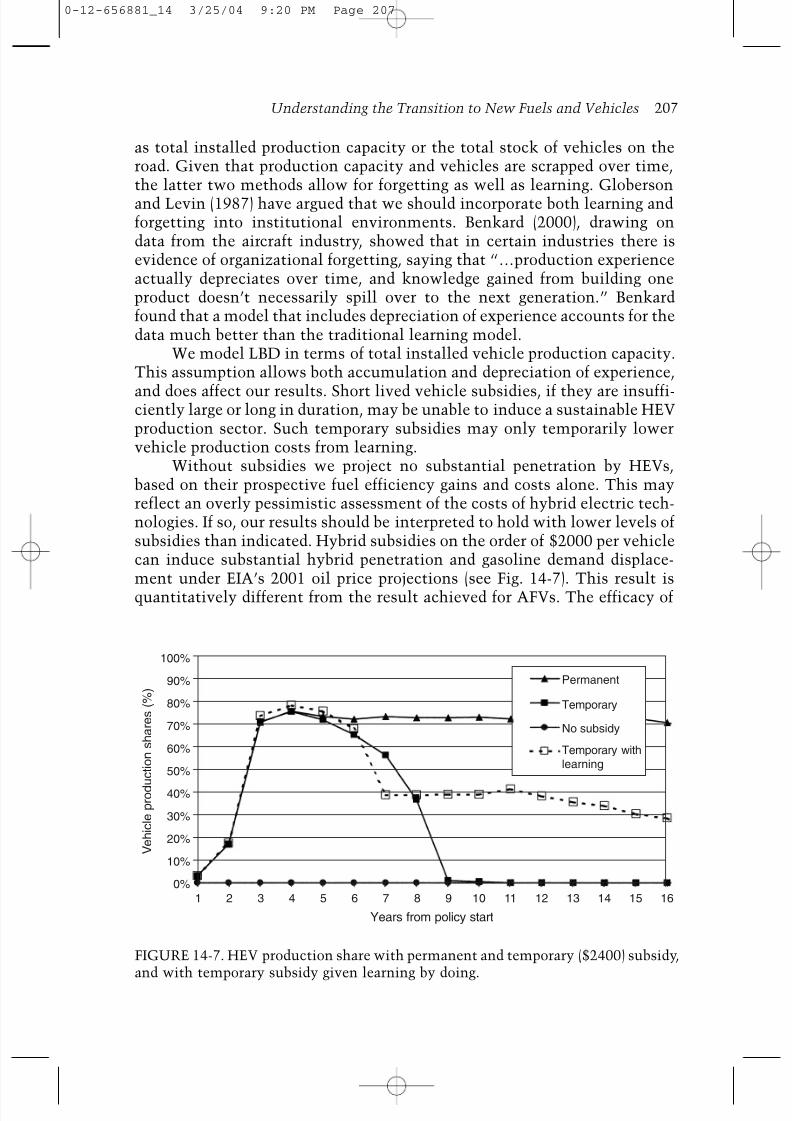
Without subsidies we project no substantial penetration by HEVs,based on their prospective fuel efficiency gains and costs alone. This mayreflect an overly pessimistic assessment of the costs of hybrid electric tech-nologies. If so, our results should be interpreted to hold with lower levels ofsubsidies than indicated. Hybrid subsidies on the order of $2000 per vehiclecan induce substantial hybrid penetration and gasoline demand displace-ment under EIA’s 2001 oil price projections (see Fig. 14-7). This result isquantitatively different from the result achieved for AFVs. The efficacy of
Understanding the Transition to New Fuels and Vehicles 207
Permanent
Temporary
No subsidy
Temporary withlearning
1
100%
90%
80%
70%
60%
50%
40%
30%
20%
10%
0%2 3 4 5 6 7 8 9
Years from policy start
V e h i c l e p r o d u c t i o n s h a r e s ( % )
10 11 12 13 14 15 16
FIGURE 14-7. HEV production share with permanent and temporary ($2400) subsidy,and with temporary subsidy given learning by doing.
0-12-656881_14 3/25/04 9:20 PM Page 207
8/3/2019 2003 Understanding the Transition to New Fuels and Vehicles Lessons Learned
http://slidepdf.com/reader/full/2003-understanding-the-transition-to-new-fuels-and-vehicles-lessons-learned 18/22
HEV subsidies is much greater than for AFVs because of the latter’s hugefuel infrastructural needs. The HEVs sold are primarily of the “mild” hybridtype with 42-V systems that achieve modest fuel efficiency gains of 15 per-cent with greater cost effectiveness than more extensive hybrid designsoperating at much higher voltages. Temporary HEV subsidies are effectiveat inducing HEV penetration but do not have long term effects once they areremoved unless there are cost reductions due to LBD. With LBD we foundthat a high enough temporary subsidy can be effective in assisting HEVs toovercome transitional barriers and become self-sustaining in a competitivemarket.
Clearly LBD is an important factor. Its importance for costs has beenvalidated in the literature and confirmed in empirical studies of manyindustries. Its importance for new vehicle policy was validated again here.
But, while important, learning is very tricky to represent. For this reason,in order to better understand the prospects for transitions to new vehicletechnologies, including AFVs, hybrids, and fuel cell vehicles, further workis needed to refine the estimates of technology costs and learning rates.
Lessons and Challenges for Fuel Cell Vehicles:Is Hydrogen Different?
One might ask whether the challenge of the transition to hydrogen vehiclesis different from that of other alternative fuel or hybrid vehicles. In someways the answer is yes, particularly since there are substantial prospects fornontransportation applications of hydrogen and fuel cells, and the opportu-nity for some synergistic development and efficiency gains between thesectors. Also, FCVs involve a host of new supply, distribution, storage, andvehicle technologies, some of which still have the possibility of markedimprovement and cost reduction.
On the other hand, one could argue that hydrogen FCVs are much thesame as AFVs, facing all of the same challenges, only more so. FCVs facethe same monetary and business plan challenges of new technologies, likeHEVs, and the same fuel system challenges of AFVs, exacerbated by theparticular properties of hydrogen gas. Finally, they face the same doubts
about political sustainability.One clear lesson from our analysis of AFVs and HEVs is that an assess-
ment of hydrogen’s potential as a fuel for FCVs must consider transitionalbarriers. A simple, mature scale cost assessment will be misleading.Although there has been considerable speculation, and some scenario devel-opment, there has been little rigorous analysis of alternative ways thetransition to hydrogen could take place. At present, no modeling system existsthat can integrate the development of infrastructure, motor vehicle produc-tion, and the evolution of demand, as well as the necessary policy context,over time and geographically within the United States. Potentially impor-tant interactions with other energy sectors such as electricity generation
208 The Hydrogen Transition
0-12-656881_14 3/25/04 9:20 PM Page 208
8/3/2019 2003 Understanding the Transition to New Fuels and Vehicles Lessons Learned
http://slidepdf.com/reader/full/2003-understanding-the-transition-to-new-fuels-and-vehicles-lessons-learned 19/22
and the spatial and geographic detail in the location of production, delivery,and demand are very important issues that are clearly essential for a fullysatisfactory representation of the transition to hydrogen. As with hybridvehicles, modeling endogenous LBD and exogenous R&D will be important.
On the hydrogen production side, the existence of multiple potentialsupply pathways and technologies is important to consider in the context ofeconomics. One of the conclusions from the AFV transition analysis is thatcost savings attainable with specialization of vehicle production and fuelinfrastructure outweigh the estimated benefits of diversity of fuel and vehicletypes. This also may be true for hydrogen production pathways. On theother hand, the diversity of potential feedstocks across the United Statesmay allow different regions to specialize in particular supply and demandpathways. One possible issue for consideration is whether early movement
to a small scale on-site production system would advance or impede largerscale hydrogen use over the long term.
Given the magnitude of the costs involved in transitioning to hydrogenFCVs and the possible links to the electricity generating sector, transitionalmodeling may require a general equilibrium framework as is currentlycommon in models evaluating the regional and global effects GHG reductionpolicies (Manne et al., 1995). Such a framework would account not only forthe interactions among many economic activities in multiple sectors, butalso for the aggregate effect of large scale investments in the hydrogensystem on tax flows and on the availability of capital for investment inother important competing economic activities, such as consumer goodsproduction, health care, or environmental management.
On the demand side, an important transitional modeling issue involveshow to account for the additional amenity value of fuel cell vehicles, includingquiet operation, standby electricity generation power, and “green” value. Atthe same time, our AFV modeling work has shown the importance ofrecognizing the “disamenity” of limited vehicle model choice and limitedfuel retail availability. A good characterization of these issues would be ableto indicate which fuel pathways and vehicle technologies provide the greatestvalue to consumers.
Finally, given the magnitude of costs involved in a transition to hydrogen
FCVs, an important consideration not explicitly addressed in the TAFVmodel is likely to be the role of political commitment. Political commit-ment, or perceived lack thereof, will have a direct economic cost in terms ofincreasing uncertainty, raising the costs for fuel and vehicle suppliers whomake investments in equipment that will require use for many years tojustify.
Conclusions
Overall, the market barriers to significant alternative fuel and vehicle useare substantial. We find that in the absence of any new and substantial
Understanding the Transition to New Fuels and Vehicles 209
0-12-656881_14 3/25/04 9:20 PM Page 209
8/3/2019 2003 Understanding the Transition to New Fuels and Vehicles Lessons Learned
http://slidepdf.com/reader/full/2003-understanding-the-transition-to-new-fuels-and-vehicles-lessons-learned 20/22
policy initiatives, it may be difficult for the alternative vehicle and fuelmarkets to get started. Hydrogen FCVs face the same transitional problemsand barriers that are shared by AFVs, only more so.
Our results lead us to several observations. First, in a market economywhere vehicle manufacturers, fuel suppliers, and consumers all make inde-pendent decisions, the efficacy of government policies to reduce the depend-ence of the U.S. transportation sector on petroleum is highly dependent onthe world price of petroleum. Second, the penetration of alternative fuelsand AFVs depends on the fuel retail infrastructure, the ability of AFVsto achieve scale economies, and other transitional barriers. Third, govern-mental policies, if sufficiently large, can effectively reduce these barriersand can allow alternative fuels to compete in the marketplace with gaso-line. However, given the current and expected low price of petroleum in the
world today, doing so would be costly.Given the worldwide nature of energy markets, there is a need to
assess the competition from conventional vehicles and fuels, and considerthe response. Since the marginal production cost of oil is $2 to $5 per barrelin the Middle East, and transportation costs at $1 to $2 per barrel are alsolow, there is a persistent threat that the economics of alternative fuels,including hydrogen, could be undercut by oil supplier actions. If significantquantities of gasoline and diesel are displaced, their prices can and willmost likely decline substantially. This is a natural consequence of themultiproduct nature of the refining process and limits to the flexibility ofproduct mix during refining operations. This may be offset, however, byrising demand for gasoline and petroleum in China and other developingnations.
Lest we appear too definitively negative about the transition towardAFVs and FCVs, we would like to make a few more positive notes. First,there is obviously a large potential role for advances in technology to bringdown the costs and increase the benefits of hydrogen fuel cell vehicles. Inaddition, we have tried to model the existing vehicle market within thecurrent and possible future regulatory context. Growing energy security orenvironmental concerns could motivate sufficiently strong policies to achievethe transition. For example, were the United States to ratify the Kyoto proto-
col and require reductions in greenhouse gases from the transportation sectoron the order of 20 percent by 2010, then the whole price regime for trans-portation would be fundamentally altered, potentially allowing AFVs andFCVs to be much more competitive.
Efforts to pick winning alternative fuel technologies have fared poorly,as demonstrated with California’s experience with methanol. Furthermore,the network nature of the motor fuel and vehicle markets, large economiesof scale, and the prospect for learning through experience indicate that theleast cost and natural market outcome is for a single or few closely relatedvehicle and fuel technologies to dominate. This suggests that policiesfor transitions should address targets, not technologies, since unexpected
210 The Hydrogen Transition
0-12-656881_14 3/25/04 9:20 PM Page 210

8/3/2019 2003 Understanding the Transition to New Fuels and Vehicles Lessons Learned
http://slidepdf.com/reader/full/2003-understanding-the-transition-to-new-fuels-and-vehicles-lessons-learned 21/22
technologies may be superior to meet the goals, and second best technologiesmay have little long term market prospect.
Acknowledgments
We thank the following individuals for their contributions to this work:David Bowman, David Greene, Barry McNutt, David Rodgers, K. G. Duleep,Marie Walsh, and Thomas White. This work was supported in part by theDOE, Office of Energy Efficiency. The opinions and conclusions expressedin this chapter are solely those of the authors and do not represent those ofthe DOE or the authors’ affiliated institutions. Additional information onthe transitional analysis of alternative and hybrid vehicles can be found at:http://pzl1.ed.ornl.gov/altfuels.htm.
References
Arrow, K. J. 1968. “Optimal Capital Policy with Irreversible Investment.” In J. N. Wolfe (ed.),
Value Capital and Growth: Papers in Honor of Sir John Hicks. Edinburgh University Press.Benkard, C. Lanier. 2000. Learning and Forgetting: The Dynamics of Aircraft Production.
American Economic Review , 90(4): 1034–1054.Campbell, C. J., and J. Laherrere. (1998). The End of Cheap Oil. Scientific American, 278(3):
78–83.Davis, Stacy C. and Susan W. Diegel. 2002. Transportation Energy Data Book 22. Oak Ridge,
TN: Center for Transportation Analysis, Energy Division, Oak Ridge National Laboratory,
U.S. Department of Energy.
Energy and Environmental Analysis. 1995. “Specification of a Vehicle Supply Model for TAFVM.”Washington, DC: Energy Information Administration, U.S. Department of Energy, 1994.
Energy Information Administration (EIA). 1999. “Alternatives to Traditional Transportation
Fuels: An Overview1993.” Washington, DC: Energy Information Administration, U.S.Department of Energy.
Energy Information Administration. 2001. “Alternatives to Traditional Transportation Fuels2001.” Washington, DC: Energy Information Administration, U.S. Department of Energy.
U.S. Department of Energy/Energy Information Administration. 2003. Annual Energy
Outlook. Washington, DC: U.S. Department of Energy.
Fulton, Lewis M. 1994. “Alternative-Fuel Vehicles and the Energy Policy Act: A Case Study inTechnology Policy.” Ph.D. Dissertation. University of Pennsylvania,
Globerson, S. and N. Levin. 1987. Incorporating Forgetting into Learning Curves. International
Journal of Operations and Production 7: 80–94.
Goulder, L. H., and K. Mathai. 2000. Optimal CO2 Abatement in the Presence of InducedTechnological Change. Journal of Environmental Economics and Management 39: 1–38.
Greene, David L. 1994. “Alternative Vehicle and Fuel Choice Model.” ORNL/TM-12738
(October).
Greene, David L. 1996.Transportation and Energy . [place]: Eno Transportation Foundation, Inc.Greene, D. L. 1998 Survey Evidence on the Importance of Fuel Availability to the Choice of
Alternative Fuels and Vehicles. Energy Studies Review 8(3): 215–231.International Energy Agency. 2000. Experience Curves for Energy Technology Policy , Paris:
OECD.Kazimi, Camilla. 1997a. Evaluating the Environmental Impact of Alternative-Fuel Vehicles.
Journal of Environmental Economics and Management 33: 163–185.Kazimi, Camilla. 1997b. Valuing Alternative-Fuel Vehicles in Southern California. American
Economic Review 87(2): 265–271.
Understanding the Transition to New Fuels and Vehicles 211
0-12-656881_14 3/25/04 9:20 PM Page 211
AU: Please provide publisher location
AQ: Please provide the further information.
8/3/2019 2003 Understanding the Transition to New Fuels and Vehicles Lessons Learned
http://slidepdf.com/reader/full/2003-understanding-the-transition-to-new-fuels-and-vehicles-lessons-learned 22/22
Leiby, Paul N. 1993. “A Methodology for Assessing the Market Benefits of Alternative MotorFuels.” [place]: Oak Ridge National Laboratory, ORNL-6771, September.
Leiby, Paul N. and J. Rubin. 1997. The Transitional Alternative Fuels and Vehicles Model.
Transportation Research Record 1587: 10–18.Leiby, Paul N. and Jonathan Rubin. 1999. “Sustainable Transportation: Analyzing the
Transition to Alternative Fuel Vehicles” Transportation Research Board Circular,
Transportation, Energy, and Environment No. 492 (August).Leiby, Paul N. and Jonathan Rubin. 2000. “The Alternative Fuel Transition: Results from the
TAFV Model of Alternative Fuel Use in Light-Duty Vehicles 1996–2010.” Final Report -
TAFV Version 1, ORNL/TM-2000/168 (May 4).
Leiby, Paul N. and Jonathan Rubin. 2001. Effectiveness and Efficiency of Policies to PromoteAlternative Fuel Vehicles. Transportation Research Record, 1750: 84–91. Transportation
Research Board, National Research Council.Lieberman, M. 1984. The Learning Curve and Pricing in the Chemical Processing Industries.
Rand Journal of Economics 15: 213–228.Manne, A., R. Mendelsohn, and R. G. Richels. 1995. MERGE: A Model for Evaluating Regional
and Global Effects of GHG Reduction Policies. Energy Policy 23: 17.McDonald, A., and L. Schrattenholzer. 2001. Learning Rates from Energy Technologies. Energy
Policy 29: 255–261.National Research Council. Fuels to Drive Our Future. Washington, DC: National Academy
Press, 1990.Rubin, Jonathan. 1994. Fuel Emission Standards and the Cost Effective Use of Alternative
Fuels in California. Transportation Research Record: 1444, Transportation Research Board,
National Research Council.Rubin, Jonathan and Paul Leiby. 2000. An Analysis of Alternative Fuel Credit Provisions of
U.S. Automotive Fuel Economy Standards. Energy Policy 28(9): 589–602.Sperling, Daniel and Kenneth Kurani. “Refueling and the Vehicle Purchase Decision: The
Diesel Car Case.” SAE Technical Paper Series No. 870644. Warrendale, PA: Society for
Automotive Engineers, 1987.U.S. Department of Energy. 1996. “An Assessment of the Market Benefits of Alternative MotorVehicle Fuel Use in the U.S. Transportation Sector: Technical Report 14, Market Potential
and Impacts of Alternative Fuel Use in Light-Duty Vehicles: A 2000/2010 Analysis.”DOE/PO-0042, Washington, DC:, U.S. Department of Energy, Office of Policy and Office of
Energy Efficiency and Renewable Energy. January 1996.
212 The Hydrogen Transition
0-12-656881_14 3/25/04 9:20 PM Page 212
AQ: Is it OK?