Embed Size (px)
Citation preview

Montréal Mai 2003
© 2003 C. Robert Clark. Tous droits réservés. All rights reserved. Reproduction partielle permise avec citation du document source, incluant la notice ©. Short sections may be quoted without explicit permission, if full credit, including © notice, is given to the source.
Série Scientifique Scientific Series
2003s-30
Advertising Restrictions and Competition in the Children’s
Breakfast Cereal Industry
C. Robert Clark

CIRANO
Le CIRANO est un organisme sans but lucratif constitué en vertu de la Loi des compagnies du Québec. Le financement de son infrastructure et de ses activités de recherche provient des cotisations de ses organisations-membres, d’une subvention d’infrastructure du ministère de la Recherche, de la Science et de la Technologie, de même que des subventions et mandats obtenus par ses équipes de recherche.
CIRANO is a private non-profit organization incorporated under the Québec Companies Act. Its infrastructure and research activities are funded through fees paid by member organizations, an infrastructure grant from the Ministère de la Recherche, de la Science et de la Technologie, and grants and research mandates obtained by its research teams.
Les organisations-partenaires / The Partner Organizations PARTENAIRE MAJEUR . Ministère du développement économique et régional [MDER] PARTENAIRES . Alcan inc. . Axa Canada . Banque du Canada . Banque Laurentienne du Canada . Banque Nationale du Canada . Banque Royale du Canada . Bell Canada . Bombardier . Bourse de Montréal . Développement des ressources humaines Canada [DRHC] . Fédération des caisses Desjardins du Québec . Gaz Métropolitain . Hydro-Québec . Industrie Canada . Ministère des Finances [MF] . Pratt & Whitney Canada Inc. . Raymond Chabot Grant Thornton . Ville de Montréal . École Polytechnique de Montréal . HEC Montréal . Université Concordia . Université de Montréal . Université du Québec à Montréal . Université Laval . Université McGill ASSOCIÉ AU : . Institut de Finance Mathématique de Montréal (IFM2) . Laboratoires universitaires Bell Canada . Réseau de calcul et de modélisation mathématique [RCM2] . Réseau de centres d’excellence MITACS (Les mathématiques des technologies de l’information et des systèmes complexes)
ISSN 1198-8177
Les cahiers de la série scientifique (CS) visent à rendre accessibles des résultats de recherche effectuée au CIRANO afin de susciter échanges et commentaires. Ces cahiers sont écrits dans le style des publications scientifiques. Les idées et les opinions émises sont sous l’unique responsabilité des auteurs et ne représentent pas nécessairement les positions du CIRANO ou de ses partenaires. This paper presents research carried out at CIRANO and aims at encouraging discussion and comment. The observations and viewpoints expressed are the sole responsibility of the authors. They do not necessarily represent positions of CIRANO or its partners.

Advertising Restrictions and Competition in the Children’s Breakfast Cereal Industry*
C. Robert Clark†
Résumé / Abstract
Nous prenons avantage de l’interdiction de diffuser de la publicité à l’intention des enfants au Québec pour étudier l’effet de la publicité dans l’industrie des céréales. La publicité est considérée comme étant anti-concurrentielle si elle augmente la loyauté envers la marque, alors qu’elle est vue comme étant bénéfique pour la concurrence si elle agit comme un substitut à la reconnaissance de la marque. Nous construisons un modèle de marques établies et non-établies sur le marché où la publicité a pour but d’informer les consommateurs sur l’existence des marques. Le modèle prédit que toute prohibition de la publicité a pour conséquence de permettre aux marques établies d’augmenter leur part de marché au détriment de celles qui sont nouvelles et moins connues. Ce résultat est validé par les données. En effet, les marques les plus anciennes et les mieux connues ont des parts de marché plus élevées au Québec que dans les régions où la publicité est permise. L’inverse est vrai pour les marques non-établies. Notre résultat suggère que dans ce marché, la publicité ne peut pas augmenter la différentiation de produit et réduire la concurrence.
Mots clés : réglementation de la publicité, concurrence, marques établies.
This paper takes advantage of the ban on advertising directed at children in the province of Quebec to study the effect of advertising in the children's breakfast cereal industry. Advertising is viewed alternatively as anti-competitive, if it increases brand loyalty, or as pro-competitive, if it acts a substitute for brand recognition. I construct a model of established and non-established brands in which advertising serves to inform consumers about the existence of brands. The model predicts that the effect of prohibiting advertising is to permit established brands to enjoy greater market share at the expense of newer and less well-known brands. This prediction is supported by the data: older, better-known brands have higher market share in Quebec than in regions where advertising is permitted and the opposite is true for non-established brands. This result suggests that in this market the effect of advertising cannot be to increase perceived product differentiation and reduce competition.
Keywords: advertising restrictions, market concentration, established brands. Codes JEL : L0, L1, M3
* I would like to thank Ig Horstmann, Todd Stinebrickner, Arthur Robson, Srihari Govindan, Audra Bowlus, Pierre-Thomas Léger, Benoit Dostie, Désiré Vencatachellum, and Mara Berman for helpful comments. I greatly appreciate the assistance that Sridhar Moorthy and Sean Forbes of the Rotman School of Management gave me in procuring the data used in this project. I am grateful to Frank Mathewson and the Institute for Policy Analysis for their support and hospitality.
† Institute of Applied Economics, HEC Montreal, Université de Montréal, 3000 Côte-Sainte-Catherine, Montréal, Québec, Canada, H3T 2A7 and CIRANO; Email: [email protected].

1 INTRODUCTION
Over the past twenty-five years there has been a growing concern over the effect of
advertising on children. This concern has led countries throughout the world to
enact, or consider enacting, legislation prohibiting advertising directed at children.
Through its Radio and Television Act, Sweden has banned the practice of marketing
to children under the age of 12 on television and radio and does not allow any adver-
tising immediately before or after children’s programming (Advertising Education
Forum). Greece, meanwhile, has banned toy advertising. In the United States,
concern over the effects of advertising has led Senator Hillary Clinton to state the
she would like to put an end to ”unfair” marketing to children (Christopher Brown-
Humes, Financial Times, January 2001).
In Canada, the Quebec Consumer Protection Act has outlawed commercial ad-
vertising directed at persons under the age of thirteen. This legislation came into
being in April of 1980. From that point forward, advertising directed at children
was prohibited under sections 248 and 249 of the Act. Three issues must be consid-
ered in order to determine whether an advertisement is directed at children: i) the
nature and intended purpose of the goods advertised, ii) the manner of presenting
the advertisement and iii) the time and place it is shown. If products are intended
exclusively for the use of children or have a marked appeal for children, then they
cannot be advertised at all on children’s programmes, and can only be advertised
on other programmes if they are treated so as not to appeal to the needs of children.
Reducing the consumption by children of various products is clearly the main
purpose of these advertising restrictions. A comparison of consumption patterns
for children’s products before and after a ban would provide a proper gauge of the
success of the legislation. Unfortunately, in the case of the Quebec prohibition, this
3

is not possible as data going back to the 1970’s are not easily accessible. However,
data collected by the Print Measurement Bureau of Canada (described in further
detail below) allow for an across province comparison and show that, at least in the
case of sweetened cereals and video game systems, the advertising restrictions may
not have had the hoped for results. The proportion of households that reported
purchasing sweetened cereals or owning video game systems that connect to the
television in Quebec is the same as the proportion in the rest of Canada (in 2002,
26% for sweetened cereals and 27% for video game systems).1
In addition, the legislation may have had the unintended consequence of reduc-
ing competition in markets for children’s products. Two broad views of the effect of
advertising exist in the literature. Advertising is viewed alternatively as increasing
or reducing perceived brand differentiation. If advertising increases brand loyalty, it
generates the perception that there are fewer substitutes for advertised brands, and
therefore increases perceived differentiation. As such this view holds advertising
to be anti-competitive. On the other hand, if advertising inspires consumers to
try brands that they know less well, it increases the number of available substitutes
and therefore reduces perceived product differentiation. According to this pro-
competitive view, advertising acts as a substitute for brand experience and brand
recognition. If advertising is anti-competitive, restricting it should reduce the
market shares of older, better-known brands that have used advertising to develop
loyal followings, and may allow new brands access to the market. If advertising
is pro-competitive, an advertising ban could potentially help older, more recogniz-
1In the case of sweetened cereals it is possible that prior to the ban a larger proportion of
households in Quebec purchased presweetened cereals and that 26% represents a significant de-
crease. This argument seems far less likely in the case of video game systems which were not in
wide-spread use before the ban.
4
able brands.2 Without the ability to advertise, new brands may not succeed in
penetrating the market.
Based on the premise that advertising can substitute for brand recognition, I
construct a model in which there are two types of brands–established and non-
established. Established brands differ from non-established brands in that in the
absence of advertising some consumers may still recognize established brands. This
is because older brands have had the opportunity to develop a reputation through
heavy promotional activity. I assume that the only role for advertising in this model
is to inform consumers that are not aware of a brand of its existence. So advertising
acts as a substitute for recognition by informing consumers about existence.3 The
model predicts that established brands should have greater market share in regions
where advertising is prohibited than in regions where it is allowed and the opposite
is true for non-established brands. These predictions lend support to the view that
advertising is pro-competitive. Without the ability to advertise, less established
brands are unable to provide information about their existence and characteristics
to consumers.
I then test these predictions by examining the children’s breakfast cereal market
in Canada. Ready-to-eat cereals are among the most advertised children’s products
in Canada (Caron (1995)). I use a unique data set from the Print Measurement
Bureau of Canada which surveys the purchasing behaviour of some fifteen thousand
Canadian households annually as well as advertising data from AC Nielsen to confirm
the predictions of my model. Brands that have been around longer and that regularly
2If scale economies in advertising exist or if advertising leads to economies of scope in man-
ufacturing by widening markets, then, even if advertising is pro-competitive, leading firms may
be hurt by an advertising ban. So predictions about the overall effect of advertising restrictions
under the pro-competitive theory are not straight-forward.3Alternatively, a brand could be established if it provides consumers with some extra utility
through image or prestige effects. In this case persuasive advertising could act as a substitute.
5

engage in promotion have higher market share in Quebec than in Canadian regions
where advertising is permitted, and the opposite is true for non-established brands.
Similar results on the effect of advertising restrictions on competition in different
industries have been reported. Eckard (1991) studies the cigarette industry through
an examination of the 1971 ban on television advertising in the United States. By
comparing measures of competition in the cigarette industry in the ten years prior
to the ban and in the ten years after, he finds that shares of leading brands were
declining before the ban on advertising, but stable or increasing after its imposition.
He also finds that the ban impedes the entry of new firms into the industry. Holak
and Reddy (1986) report similar results. They find that the effect of past sales
on current purchases is stronger after the ban on cigarette advertising. The only
study that examines restrictions that vary by region is Sass and Saurman (1995).
They study the malt beverages industry and find that advertising restrictions lead
to increases in market concentration.
An important difference between the present study and those mentioned above is
that I explicitly model the mechanism through which established firms gain market
power when advertising is banned. Established brands are recognized in the absence
of advertising. Less established brands are hurt by the ban since they cannot inform
consumers of their existence. Holak and Reddy, Eckard, and Sass and Saurman all
focus on the effect of advertising restrictions on big market-share brands. They do
not model what it is about having a large market share that allows these brands
to grow in the absence of advertising. Holak and Reddy do point out that there
is some evidence that being an early entrant could be important. They show
for some cigarette categories that purchase inertia for earlier entrants is greater
after the ban. Sass and Saurman discuss what it is about big-share brands that
allows them to enjoy greater market share in states where advertising is restricted:
6

big-share brands are produced by large national brewers, while small-share brands
are produced by local brewers. But since these two sets of brewers have very
different marketing capabilities, it is not surprising that the local brewers are at
a disadvantage where advertising is restricted. The national brewers are barely
affected by state restrictions since their marketing campaigns tend to be national.
So the local brewers are the only ones that are really hurt by the ban. In my study
all brands are marketed and sold nationally. My results suggest that brands that
are similarly affected by the advertising prohibition may still enjoy different levels
of market power depending on whether or not they are established.
The results presented here are also consistent with previous work on the breakfast
cereal industry. Shum (2000) looks at the breakfast cereal industry to determine
whether advertising increases or decreases brand loyalty. Consumers that are loyal
to a particular brand will perceive fewer substitutes for it. He shows that the
breakfast cereal market is characterized by considerable brand loyalty and that a
brand’s advertising has a bigger impact on consumers that are not loyal to it– in
other words advertising helps to overcome brand loyalty.
The remainder of the paper proceeds as follows. In the next section I develop the
theoretical model of informative advertising and describe its predictions. Section
3 describes the data. Section 4 outlines the empirical specification and section 5
contains results. Section 6 concludes. Tables containing regression results, a list of
children’s brands, and summary statistics are in the appendix.
7

2 A Model of Informative Advertising and Brand
Awareness
I construct a simple discrete-choice model in which brand recognition plays a role.
The market is populated by a continuum of risk neutral households of mass 1. A
household is composed of a child and a parent who acts as an agent of the child.
Each household purchases at most one unit of one of the j = 1...J varieties. The
indirect utility for a household i from consuming variety j is uij = vj − pj + εij.
The parameter vj represents the systematic value that each household gets from
consuming brand j, while pj is the price they pay for it. εij is household i’s
idiosyncratic valuation for the jth brand.
An outside alternative must also be specified. This is representative of the
option of not buying any of the available brands of children’s cereals. The utility
of the no-purchase alternative is normalized to zero.
I can then determine the discrete choice market shares in the standard way.
Each household purchases one unit of the variety that yields them the highest utility.
Conditional on valuations v. = (v1, ..., vJ) and prices p. = (p1, ..., pJ), a household
i purchases one unit of brand j, if and only if, for every l ≥ 0 and l 6= j, uij =
vj − pj + εij ≥ uil = vl − pl + εil. I can then define the set of unobservables,
εi. = (εi1, ..., εiJ) that induces the choice of brand j:
Aj(v., p.) = {εi.|uij ≥ uil,∀l 6= j} (1)
If ties occur with zero probability, the market share of brand j as a function of the
characteristics of all the brands competing in the market is given by the probability
that εi. falls into the region defined by Aj :
Sj(v., p.) =
∫Aj
dF ∗(ε) (2)
8

The integral is over the set of consumer unobservables defined by Aj and F ∗ is the
distribution of these unobservables in the population.
I assume that the εij are distributed according to a Type I extreme-value distri-
bution, so the market share of brand j can be written as:
Sj =exp(vj − pj)
1 +∑J
h=1 exp(vh − ph)(3)
Firms have access to a single advertising technology. This technology commu-
nicates a message that any given household might either “see” or “not see”. The
message cannot be targeted at specific households (i.e., the firm cannot control
which children hear the message and which do not) and the probability that any
given household hears a message is the same for all households.4 These assumptions
mean that I can define an advertising rate for brand j by a scalar aj ∈ [0, 1] denot-
ing both the fraction of the population that hears a message for brand j and the
probability that any given consumer hears this message.
If the firm advertises, it incurs a variable cost, c(a), should it advertise at rate
a. I assume that c(0) = 0 and that c(·) is increasing and strictly convex. Costs are
normalized such that c′(0) = 0. Advertising costs are the same for all firms. Firms
also incur a constant unit production cost which is normalized to zero. Firms are
risk neutral and each chooses a price and an advertising rate to maximize expected
profits.
I assume that the only role for advertising in this model is to inform households of
a brand’s existence. So advertising acts as a substitute for recognition by informing
households about existence.5 In the absence of advertising, households may be still
be aware of brands. I assume that a fraction gj ∈ (0, 1) of households ‘have heard
4What is being abstraced from here is any notion of the quality of an ad campaign.5As mentioned above, persuasive advertising could act as a substitute if being established
provides consumers with some extra utility through image or prestige effects.
9

of’ brand j. This may be because the brand was advertised in the past or because
households pass on information through word of mouth. I suppose that there are
two types of children’s breakfast cereal brands: established children’s brands, e, and
non-established brands, n, that number Ne and Nn respectively. Established brands
and non-established brands differ in the fraction of households that have heard of
them in the absence of advertising. The normalization I am going to adopt here
is that the fraction of households that have heard of a non-established brand n, gn,
is equal to zero. That is, in the absence of advertising, no household is aware of a
non-established brand.
The timing of moves in the model is as follows: The firms simultaneously choose
prices and advertising rates. A fraction aj of households hear a message from firm
j. Brands about which household i is aware (either through advertising or because
they are established) become part of their ”consideration set”. They chooses the
best available option from this set.
2.1 Consideration Set Formation:
Here I examine how households determine which brands to consider when they make
their purchase decision. Children consider any brands of which they are aware. In
the absence of advertising this is just the established brands they have heard of. If
advertising is permitted, they also consider any brand (established or not) for which
they have seen an ad. If a child has not heard of at least one established brand
and has not seen any ads for any brands, the parent goes to the store and shops
randomly on behalf of the child.
In every case the parent also considers the outside option. The outside option
is the breakfast alternative (family cereal, oatmeal, croissant, etc.) that a parent
might purchase if their child was not asking for specific children’s brands. As a
10

result, the outside alternative is assumed to be in every household’s consideration
set.
A comment is in order about the assumption that households consider randomly
when they are not aware of any brands but do not consider anything other than an
established brand if it is the only one they have heard of. This is basically a limited
rationality assumption. If a parent is pestered by their child about a particular
brand, they view this brand as being acceptable to their child. They compare
this brand to the breakfast alternative they would select and buy whichever yields
higher utility for their child. If a parent is not pestered by their child they will look
around to see if there is some brand that their child might like and compare this to
the outside alternative.
2.2 Equilibrium Market Shares:
In this subsection I study the market shares that result in a monopolistically com-
petitive equilibrium. As described above, households purchase the brand that yields
them the highest utility. Here, this utility comparison involves only those brands
that enter the household’s consideration set, and so the likelihood that a household
purchases a particular brand depends on which other brands the household is aware
of. That is, a brand’s market share is a function of the probability that house-
holds are aware of it and of other brands. This probability depends on whether
advertising is allowed or not. I describe demand in these two cases:
Case 1: Advertising is permitted
When advertising is allowed, households are aware of a brand if they have heard
of it or if they have received an ad for it. So with probability gj + (1 − gj)aj a
given household is aware of brand j (this is also the fraction of households that
are aware of j). The household considers j, along with any other brand they are
11

aware of. All brands that the household considers enter the denominator of (3).
If there are Ne established brands and Nn non-established brands, then there are
z = 2Ne+Nn−1 possible consideration sets, conditional on being aware of brand j.
I define a household’s j-conditional consideration set, K jz , to be the set of brands
they are aware of conditional on being aware of brand j. A K jz set is of the form
K jz = [kz,1, ..., kz,j−1, kz,j+1, ..., kz,Ne+Nn ] where kz,j = {0, 1} : 0 if households are not
aware brand j and 1 if they are.
For example, if Ne = 3 and Nn = 1 and a household is aware of brand e1,
then their e1-conditional consideration set is either Ke11 = [1, 0, 0], Ke1
2 = [0, 1, 0],
Ke13 = [1, 1, 0], Ke1
4 = [0, 0, 0], Ke15 = [1, 0, 1], Ke1
6 = [0, 1, 1], Ke17 = [1, 1, 1] or
Ke18 = [0, 0, 1]. Ke1
1 describes the case where a household is aware of e2 but not
e3 or n1. I define hj to be the probability that a household is aware of brand j.
In the advertising-allowed case, hj = gj + (1 − gj)aj. So the probability that a
household’s e1-conditional consideration set is Ke11 is he2(1− he3)(1− hn1) or [ge2 +
(1−ge2)ae2 ][(1−ge3)(1−ae3)][(1−an1)]. The probabilities of each of the seven other
conditional consideration sets can be determined in similar fashion. Conditional on
being aware of e1, with probability [ge2 + (1 − ge2)ae2 ][(1 − ge3)(1 − ae3)][(1 − an1)]
e1’s market share is:
se1(1) =exp(ve1 − pe1)
1 + exp(ve1 − pe1) + exp(ve2 − pe2)
The sum over these probability weighted shares yields what I will call e1’s conditional
market share (the share of households who purchase e1 conditional on being aware
of e1).
In general, the probability that a household’s j-conditional consideration set is
K jz is:
Πj 6=jhkz,j
j (1 − hj)1−kz,j (4)
12

So conditional on being aware of j, with probability (4) j’s share is:
sj(z) =exp(vj − pj)
1 + exp(vj − pj) + Σm=Ne+Nn
m=1,m6=j(kz,m exp(vm − pm))
(5)
The sum over these probability weighted shares yields j’s conditional market share:
2Ne+Nn−1∑z=1
(Πj 6=jhkz,j
j (1 − hj)1−kz,j)sj(z) (6)
Households that are unaware of j will not consider purchasing it unless they
are unaware of any brands. In this situation households will go to the store and
randomly choose a brand from the shelf and purchase it if it is preferred to the
outside option. Market share for j in this situation is:
1
Ne + Nn
exp(vj − pj)
1 + exp(vj − pj)(7)
Case 2: Advertising is not permitted
If advertising is not allowed, then only e-conditional consideration sets need to
be defined since there is no way for a household to become aware of non-established
brands. That is, kz,n = 0 for all z and n , so there are only z = 2Ne−1 e-conditional
consideration sets. e’s conditional market share is:
2Ne−1∑z=1
(Πj 6=ehkz,j
j (1 − hj)1−kz,j)se(z) (8)
where
se(z) =exp(ve − pe)
1 + exp(ve − pe) + Σm=Ne
m=1,m 6=e(kz,m exp(vm − pm))(9)
and where, in this case, hj = gj.
As in case 1 if a household is unaware of a brand e, they will not consider
purchasing it unless they are unaware of any brands, in which case they will go to
13

the store and randomly choose a brand from the shelf and purchase it if it is preferred
to the outside option. This is also the situation faced by any non-established brand,
n.
2.3 Predictions:
The theoretical model generates predictions about the market shares of established
and non-established brands in markets where advertising is allowed versus in markets
where it is prohibited. The first proposition states that if enough people have
heard of the established brands, then they do better in markets where advertising
is restricted. If most people have heard of an established brand, e, then, since
advertising is strictly informative, it gains little market share from advertising. At
the same time, if they are allowed to advertise, non-established brands become
competition for e by adding themselves to households’ consideration sets.
Proposition 1. If a large fraction of the population has heard of brand e, then e’s
market share, Se, is bigger in markets where advertising is prohibited
Proof. I show that at ge = 1, Se(no ad) > Se(a∗e), and since g is continuous around
1, the claim is true.
At ge = 1 all consumers are aware of brand e. If advertising is not allowed then
demand for it is given by:
Se(no ad) =2Ne−1∑z=1
(Πj 6=ehkz,j
j (1 − hj)1−kz,j)se(z)
and if it is allowed demand is given, by:
Se(a∗e) =
2Ne+Nn−1∑z=1
(Πj 6=jhkz,j
j (1 − hj)1−kz,j)sj(z)
14

Se(a∗e) < Se(no ad) since sj(z) =
exp(vj−pj)
1+exp(vj−pj)+∑m=Ne+Nn
m=1,m6=j(kz,m exp(vm−pm))
is decreas-
ing in each of the kz,j. That is, the more other brands a consumer is aware of, the
smaller will be demand for e. kz,j = 1 with probability hj which is bigger when
advertising is allowed. he is equal to ge when advertising is not allowed and to
ge +(1− ge)ae ≥ ge when it is. hn is equal to 0 when advertising is not allowed and
to an ≥ 0 when it is.
The second proposition states that if enough people have heard of at least one
established brand, then non-established brands do better in markets where adver-
tising is permitted. If advertising is not allowed, only those people who have not
heard of the established brand consider any non-established brands–so their market
share will be small.
Proposition 2. If a large fraction of the population has heard of at least one estab-
lished brand, then market share for a non-established brand n is bigger in markets
where advertising is allowed
Proof. If ge = 1 for any brand e, then market share for any non-established brand
is 0 if advertising is not allowed.
Both of these propositions are shown for ge’s in the neighborhood of one. In
the context of the breakfast cereal market, ge near one implies that most people
in the population have heard of an established breakfast cereal. Harris Interactive,
a market research firm, constructs a brand equity measurement tool that ranks
over one thousand different brands according to their equity (measured in terms of
salience and quality). A number of cereals make the list of top one thousand brands
suggesting that it is reasonable to assume that a large fraction of the population
have heard of established cereal brands.
15

3 Data
In order to estimate the model, the following variables are necessary: market shares,
prices, brand characteristics, and advertising expenditures.
The market shares are calculated using Category Reports from the Print Mea-
surement Bureau. Each year the PMB surveys approximately 15 000 Canadian
households. The PMB study design includes weighting to match Statistics Canada
household and individual population data. There are two weighting processes: (i)
design weights that compensate for over or under sampling, (ii) projection to match
the population estimates of Statistics Canada. Questionnaires are left behind by
interviewers and contain questions about the household’s product usage. Respon-
dents are asked to report on the brands of cold cereal used in their household in the
previous year. PMB reports in its survey on the number of households that used
a brand at least once. So a brand’s market share represents its fraction of cereal
use as opposed to its fraction of cereal purchases, and as a result lacks any notion
of intensity of usage.
I have four years of PMB reports, 1998-2001. Each year’s PMB report provides
results from a survey taken in the previous year (so my data cover 1997-2000).
Usage is reported for six Canadian regions: Atlantic Canada, Quebec, Ontario,
Manitoba/Saskatchewan, Alberta and British Columbia. For 1997, 55 cereals are
reported on, out of which 15 are children’s brands. For 1998, 17 out of 57 are
children’s brands. For 1999, 17 out of 67 are children’s brands. For 2000, 17 out of
74 are children’s brands. My classification of breakfast cereals into children’s cereals
and non-children’s cereals is based on classifications by Nevo and Shum. (See table
1 in the appendix for a list of which children’s brands were reported on each year).
The price data are collected by AC Nielsen.6 I have prices for each brand in
6These data were used for academic purposes only and the results obtained do not necessarily
16

each of the four years in each of the six regions. They are calculated using samples
or aggregate census data for grocery supermarket banners as follows: total revenue
from boxes of all sizes divided by total quantity. This measure is not ideal as it
does not represent a properly weighted average. I can construct a somewhat better
measure of price for 1999 and 2000 since I have information on the average price per
box of different sizes. For each brand I choose the box size closest to 400 grams and
I calculate the average price per 100 grams. I test the effect of using these prices
on results.
Brand characteristics come from the Nutrient Database for Standard Reference
compiled by the Agricultural Research Service of the United States Department
of Agriculture. Nevo (2000) includes total calories, dietary fiber and sodium as
characteristics in his breakfast cereals study. I include fiber and sodium along
with sugar rather than calories. Sugar and fiber are measured in grams per 100
gram serving, while sodium is measured in milligrams per 100 gram serving. Brand
characteristics do not vary over time or across regions.
Advertising data come from the AC Nielsen Media Services annual estimates
of Advertising Expenditures in Canada. Annual national advertising expenditure
is reported for each brand. Only advertising spending that originates in Canada
is included, anything spilling over from the United States is omitted. The data
are collected through the following sources: television, radio, daily newspapers,
magazines and out-of-home. Almost all of the advertising for ready-to-eat breakfast
cereals is done through the television. The following networks are included in AC
Nielsen’s estimates: TVA, Radio Canada, TQS, CBC, CTV, BBS Ontario, Global,
MITV, TSN, Musique Plus, MuchMusic and Newsworld.
See table 2 in the appendix for summary statistics.
reflect the views of AC Nielsen.
17

4 Empirical Specification
In this section I describe the empirical specification that will be used to test the
predictions from the theoretical model of informative advertising using the data
described above. The main predictions are that market shares for established brands
should be higher in regions where advertising is restricted than in regions where it
is permitted and that the opposite should be true for non-established brands. I
take advantage of the fact that advertising is prohibited in Quebec to test whether
market shares for established brands are higher in Quebec than in the rest of Canada
and whether market shares for non-established brands are lower.
What does it mean for a brand to be established? As described in the theoretical
model, established brands, unlike non-established brands, are recognized even in the
absence of current advertising. So my classification of brands must capture the fact
that consumers are aware of established brands even if they do not see ads for them
during the purchasing period. One possible classification involves denoting a brand
established if it has been around for a long time. But since longevity does not
necessarily imply recognition, this is not enough. There exist brands that have
been around for some time, but that have little brand equity and regularly very low
market share (for instance Post Pebbles). So the classification must involve some
indication of the manner in which awareness is generated. Therefore, I classify
brands as established if they have been around for a long time and if they regularly
engage in heavy promotional activity. I do not have data on all of the types of
promotion that firms have engaged in and so attempt to capture a brand’s typical
promotional activity by its recent expenditure on advertising. I denote a brand
established if it has been around since at least 1983 and it has spent more than two
hundred thousand dollars on advertising nationally in at least two of the four years
18

of the sample.7 Although somewhat ad hoc, I think that this definition captures
the essence of what it means to be established. Even in Quebec where advertising is
banned, recent national advertising expenditure should proxy for recent unrestricted
promotional activity and for past advertising.
In section 5.1 below I test the robustness of my results to the definition of
established. I present results from two other possible classifications. Definition 2
maintains the importance of heavy promotional activity. Brands are established
if they have been around since at least 1983 and if they have spent a minimum of
two hundred thousand dollars on national advertising in each of the two previous
years. Definition 3 examines how important heavy promotional activity is to being
established and classifies a brand as established simply if it has been around for a
long time. So brands are established if they have been around since at least 1983.
In addition to depending on whether or not it is established, a brand’s market
share is influenced by its price, its expenditure on advertising and its characteristics.
I include annual national brand-specific advertising expenditure as my advertising
variable. National expenditure allows me to capture the variation in advertising
intensity from one cereal brand to another. Although the actual amount of adver-
tising that is viewed by individuals in different provinces may vary in magnitude,
the brand variation should be roughly similar and so units should not matter. In
using this as my advertising variable I am allowing for the fact that despite the ban
there is some spillover of advertising into Quebec.8 The amount of advertising that
spills over into Quebec is some fraction of the national amount. As long as it spills
over in the same way for all of the brands in the sample, then it does not matter
71983 is as far back as I could find information on brand introduction.8In 1992, advertising expenditures on children’s breakfast cereal in Quebec were $1.3 million
(Caron (1995)). This represents 14.6% of the total spent in Canada (Quebec expenditures on all
types of cereals represented 20.2% of the Canadian total).
19

what the actual amount spilling over is.
To examine the market share outcomes of established and non-established brands
in Quebec, I construct an indicator variable for this province in order to capture
the effect of the advertising restriction. For this approach to be valid, consump-
tion patterns in Quebec and the rest of Canada must be similar in the absence of
advertising restrictions. In other words, the Quebec variable must only capture
the effect of the ban and not other factors which are specific to Quebec. In its
Window on Quebec 2001, AC Nielsen reports that consumers in Quebec are similar
to their counterparts in the rest of Canada in many regards. Most importantly,
they do not seem to be more brand loyal in Quebec than in the rest of Canada
on average. Using its Homescan Consumer Panel AC Nielsen measures ongoing
product acceptance and retention. It seems that Quebec consumers are no less
likely to spread their purchases in a product category across brands. Were this not
the case, then it could be argued that a result that indicated that established cereal
brands do better in Quebec is caused by the fact that Quebec consumers are more
brand loyal in general. In addition, the Window on Quebec reports that people in
Quebec watch approximately the same amount of television (22.5 hours per week
in Quebec vs. 21.5 hours per week in Canada) and spend approximately the same
amount on food ($114.9 per week in Quebec vs. $112.09 per week in Canada) and
on baked goods/cereals in particular ($13.42 per week in Quebec vs. $12.47 per
week in Canada). Moreover Quebec consumers do not have a bias against presweet-
ened cereals. The Print Measurement Bureau data show that in 1999, twenty-five
per cent of cereal usage in Quebec was of presweetened cereals, versus twenty-six
percent nationally. The Print Measurement Bureau also reports that the fraction
of households in Quebec with children under the age of twelve is not much different
than in Canada as a whole (in 2000, 25.5% in Quebec vs. 27% nationally).
20

Likely the biggest difference between Quebec and the rest of Canada is in terms
of language. Only 43% of the population of Quebec can speak English (defined by
Statistics Canada as being able to carry on a conversation, 1996 Census). Given
this, one possible interpretation of any result suggesting that established brands
have bigger market share in Quebec is that people that speak only French have a
preference for established brands. National advertising, if it is mostly in English,
would have little effect on people that speak only French and they would simply
purchase brands that had been around for a long time because those are the ones
they have heard of. This would be particularly problematic if established only
meant old. However, I have defined established brands to be those that have
been around for a long time and that advertise nationally regularly. Therefore,
a result suggesting that established brands have bigger market share in Quebec
implies that regular national advertising does have an effect on French speaking
people. Moreover, although Statistics Canada reports that such a small fraction of
the population are able to speak in English this does not mean that a much larger
fraction understand enough English to make sense of breakfast cereal commercials.
Children in Quebec begin learning English in Grade 3 (Grade 4 prior to 1999).
I regress observed market share of each of the brands on price, national advertis-
ing, brand characteristics (sugar, fiber and sodium), and the established indicator.9
9A logit model of demand in which advertising simply appears in the utility function would
yield a different dependent variable–the difference between the log of each brand’s observed share
and the log of the share of the outside alternative. Although the specification I have suggested is
not derived structurally from the model, is does stem directly from the predictions that arise. In
order to use ln(Sjrt)− ln(So) as the dependent variable the theoretical model must say something
about the relationship between market shares for children‘s cereals and the share of the outside
good. Although the model can predict that the share of the outside good is higher in markets
where advertising is restricted, it cannot make predictions about relative share without making
assumptions about the relative valuations of consumers for the different products.
That having been said, the main results do not change if ln(Sjrt)−ln(So) is used as the dependent
21

To test the predictions of the theoretical model I include an interaction between es-
tablished and the Quebec indicator, Established∗Quebec, and an interaction between
non-established and the Quebec indicator, Non-established∗Quebec. A positive co-
efficient on the Established∗Quebec interaction term and a negative coefficient on
the Non-established∗Quebec interaction term would indicate that the ban helps es-
tablished brands and hurts non-established brands. More specifically, I estimate
the following reduced form equation:
Sharejrt = β0 +β1pjrt +β2ajt +β3xj +β4Ejt +β5 ∗Q∗Ej +β6 ∗Q∗NEj +εjrt (10)
where Sharejrt is brand j’s share in region r in year t, pjrt is brand j’s price in region
r in year t, ajt is brand j’s national advertising expenditure in year t and xj is a vector
of observed characteristics for brand j. Q is an indicator that equals 1 if the region
is Quebec while Ej is an indicator that equals 1 if brand j is considered established
and NEj is an indicator that equals 1 if brand j is considered non-established.
The primary parameters of interest are β5 and β6, which are intended to capture
the effects of being established and non-established in Quebec relative to (being
established and non-established in) the rest of Canada respectively. Regressions
will also include year dummies to control for any systematic shocks to demand.
5 Estimation Results
Before estimating (10) it is important to account for the possibility that εjrt is cor-
related with certain explanatory variables. Failure to do so could result in biased
and inconsistent estimates. Endogeneity bias may exist if unobserved determinants
of a brand’s market share also affect its price or advertising expenditure. For in-
stance, unobservable promotional activity such as in-store displays and sponsorships
variable.
22

of sporting/schooling events could affect market shares directly but also influence
prices and expenditures on traditional means of advertising. Systematic shocks
to demand such as those generated by health warnings (announcements about the
increasing obesity of children) can also affect market share as well as advertising
and pricing strategies. Furthermore, brand equity might further compromise the
exogeneity of the price and advertising expenditure variables.
In an attempt to deal with this issue I start by adding firm dummies to the
model. There are clearly unobservables at the firm level that affect market share
directly as well as advertising budgets. In other words, firms have general marketing
strategies that they apply to all of their brands. For instance Kelloggs may decide
to pay for premium shelf space at the super market for its brands. This might
increase market share directly and could be part of an overall promotional strategy
that sees the firm spending more on television advertising as well. Results from
the estimation of (10) with firm dummies are reported in table 3. Mean market
share in the sample is .015. If price increases by one dollar, market share falls
by .0047. An extra million dollars spent on advertising improves market share by
.0034, while being established improves market share by .013. These coefficients
are all significant at the 5% level. Being established in Quebec increases market
share relative to being established in the rest of Canada by .0032 (significant at the
10% level), while the effect of being non-established in Quebec is not significantly
different from zero.
However, controlling for firm specific unobservables is not enough to resolve all
endogeneity problems. While firm dummies should control for any unobserved
heterogeneity stemming from the manufacturer that affects a brand’s market share
and that influences its price and the amount spent promoting it, there is also brand-
specific unobserved heterogeneity. To deal with this I adopt a fixed effects model.
23

Results from the fixed effects estimation are reported in table 4 under the heading
FE(1). Including fixed effects means that the firm dummies, the Established variable
and the observed characteristics that make up xj are dropped from the model since
they do not vary from one market to another. However I can still estimate my
coefficients of interest since they do vary across markets. Being established in
Quebec increases market share relative to being established in the rest of Canada
by .0032, while being non-established in Quebec reduces market share relative to
non-established brands in the rest of Canada by .0014. These coefficients are
both significant at the 5% level. Also an increase in price of one dollar reduces
market share by .0021 (significant at the 5% level) and a one million dollar increase
in advertising expenditure improves market share by .0012 (significant at the 10%
level).
As noted in Nevo (2000), once brand effects are included, the error term is the un-
observed region-year deviation from the overall mean valuation of the brand. Firms
are assumed to be able to observe this deviation and account for it when choosing
their marketing strategies. While advertising strategies may be determined at the
firm level or the brand level, it seems likely that when setting their prices in each
market (region-year) firms take the deviation from the mean valuation into account.
To deal with this, I adopt and instrumental variables approach. A common set of
instruments employed to deal with the endogeneity of price in discrete choice mod-
els (Nevo (2000), Rekkas(2001), Berry, Levinsohn and Pakes(1995)) includes the
observed brand characteristics, the sums of the values of the same characteristics of
other brands sold by that firm, and the sums of the values of the same characteristics
of the brands offered by other firms. These variables are meant to proxy for the
closeness of the competition in the market. I do not adopt this approach here since
in my case there is almost no variation between markets in these instruments. This
24

is because there is little variation over time and no variation across regions in the
brands available for sale in my data and so this amounts to little more than adding
brand dummies.
Another approach used by Nevo (2000) to deal with the potential endogeneity of
price in his breakfast cereal study, is an instrumental variable method proposed by
Hausman. This method relies on the assumption that region-specific valuations of
brands are independent across regions controlling for brand-specific intercepts. So
prices of a brand in other regions are valid instruments. This is because prices of
a particular brand in two regions are correlated due to the common marginal cost
of producing the brand but uncorrelated with the market-specific valuation of the
brand. Therefore, as an instrument I use regional yearly average prices (not includ-
ing the region being instrumented) in all four years. The assumption that valuations
are independent across regions will not hold in a number of circumstances. For in-
stance if there is some national shock then all regions will be affected. The inclusion
of time dummies should help to alleviate this concern. Also if local advertising or
in-store promotions are correlated across regions, then the independence assumption
will be violated. Nevo points out that the larger the regions, the less likely it is
that there will be correlation across borders. In my case regions are entire Cana-
dian provinces (or multiple provinces in the cases of Manitoba/Saskatchewan and
Atlantic Canada) and it is therefore doubtful that in-store promotional strategies
are coordinated across such vast distances.
Results from the fixed effects model with the instrument for price are reported in
table 5 under the heading FIV(1). The coefficient on price is -.007 and the coefficient
on advertising is .0016 and both are significant at the 5% level. The coefficients on
Established∗Quebec and Non-established∗Quebec are .0032 and -.0016 respectively,
and both are significant at the 5% level.
25

These results suggest that the predictions of the theoretical model are supported
by the data. Established brands have higher market shares in regions where ad-
vertising is restricted and the opposite is true for non-established brands. These
results lend support to the pro-competitive view of advertising. If advertising is
pro-competitive, it should help to overcome brand loyalty by providing a means
for new and less established brands to pass on information about their existence
or characteristics. Restricting advertising in this case prevents these brands from
competing with those that are already established. The lower market shares for the
non-established brands in Quebec suggest that this may be what is in fact occurring.
Without the ability to advertise, new, less established brands are at a competitive
disadvantage relative to established brands.
5.1 Robustness:
I first test the robustness of my results to the way in which brands are classified as
established or non-established. As mentioned above, I test two other definitions.
Definition 2 classifies a brand as established if it has been around since at least 1983
and has spent a minimum of two hundred thousand dollars on national advertising
in the two previous years. Under this definition brands can switch from being
established to not over the four year sample (although only one, General Mills
Golden Grahams, actually does). Definition 3 considers a brand established if it
has been around for a long time–at least since 1983.
The classification due to Definition 2 is not very different from the one due to
the main definition of established and results are essentially unchanged. Results are
reported in table 4 (FE(2)), and table 5 (FIV(2)). Established is no longer dropped
in the fixed effects model since a brand’s classification can change from year to
26

year. However its effect on market share is not significantly different from zero.
Being established in Quebec increases market share relative to being established in
the rest of Canada by .0029, while being non-established in Quebec reduces market
share relative to non-established brands in the rest of Canada by .0014. These
coefficients are significant at the 5% level. Results from the fixed effects instru-
mental variables regression show that the coefficients on Established∗Quebec and
Non-established∗Quebec are .0032 and -.0016 respectively, and both are significant
at the 5% level.
The classification generated by Definition 3 is quite different than the ones gen-
erated by Definitions 1 and 2. Results are reported in tables 4, and 5 under the
headings FE(3) and FIV(3) respectively. In the fixed effects model, the coefficient
on Established∗Quebec is .0013 and is significant at the 5% level and the coeffi-
cient on Non-established∗Quebec is -.0015 and is just barely significant at the 10%
level. Results from the fixed effects instrumental variables regression show that the
coefficient on Established∗Quebec is .0012 (significant at the 10% level) while the
coefficient on Non-established∗Quebec is not significantly different from zero.
I also test the robustness of my results to the quality of my price data. I run
the same specifications using just the final two years of data. For these two years
I have price data that represent a properly constructed weighted average. In the
fixed effects model increasing price by one dollar per hundred grams causes market
share to fall by .0084 and is significant at the 5% level. Being established in
Quebec increases market share by .0026 (significant at the 5% level). Once price is
instrumented for as well the coefficient on price is no longer significantly different
from zero. The coefficient on Established∗Quebec is .0027 and is significant at
the 5% level. Both with and without the instrument for price, the coefficient on
Non-established∗Quebec is no longer significantly different from zero.
27

In the two year sample, definition 2 yields the same classification of brands as Def-
inition 1. Using Definition 3, neither Established∗Quebec or Non-established∗Quebec
are significant (table 4 FE(5), table 5 FIV(5)).
Brands that are old and have engaged in heavy promotional activity do better
in Quebec than in the rest of the country. In the four year sample, this result
holds even for brands that are simply old. For the two year sample the effect of
being old in Quebec is not significantly different from zero. For these two years
of the sample more accurate price data are available. More accurate data mean
less measurement error. However this comes at a cost, since these data are only
available for 1999 and 2000. This smaller sample means less variation and so is bad
from an efficiency stand point. There is also no significant effect from being new in
the two year sample and in the full sample the effect is only significant at the 10%
level (fixed effects model without the price instrument).
The two definitions that classify a brand as established if it has been around for
some time and heavily engages in promotion lead to similar results, and suggest that
established brands, by virtue of the fact that they are recognizable, do better when
advertising is prohibited. There is evidence that just being old is important, but
it is not conclusive that in the absence of current advertising old brands do better
and new brands do worse.
6 Conclusions
In this paper I have examined the possibility that an unintended consequence of the
ban on advertising directed at children in Quebec is to hinder competition. I con-
struct a theoretical model of informative advertising that predicts that older, better-
known brands have bigger market share in regions where advertising is prohibited
28

than in regions where it is allowed, and that the opposite is true for non-established
brands.
Empirical analysis of the children’s breakfast cereal market supports these pre-
dictions. Established brands-those that have been around for a long time and that
advertise regularly-have bigger market share in the province of Quebec where ad-
vertising is banned than they do in the rest of Canada. Non-established brand do
better in the rest of Canada.
To the extent that informative advertising can be viewed as pro-competitive,
this paper has demonstrated that restricting advertising may hinder competition.
New, less established brands are unable to inform consumers about their existence
and as a result find themselves at a competitive disadvantage relative to established
brands in Quebec.
7 References
Ackerberg, D. (2002): “Empirically Distinguishing Between Informative and
Prestige Effects of Advertising,” Rand Journal of Economics, 33, 316-333.
——– (1998): “Advertising, Learning, and Consumer Choice in Experience Good
Markets: A Structural Empirical Examination,” Boston University, mimeo.
AC Nielsen Company of Canada (1995-2000): Market Track-Grocery Banner.
——– (2001): Window on Quebec.
AdAge website: www.adage.com.
Advertising Education Forum website: www.aeforum.org.
29

Anand, B., and Shacher, R. (2001): “Advertising, the Matchmaker,” Harvard
Business School Working Paper 02-057.
Anderson, S., de Palma, A., and Thisse, J.-F. (1992): Discrete Choice The-
ory of Product Differentiation, The M.I.T. Press, Cambridge, MA.
Baltagi, B. (1995): Econometric Analysis of Panel Data, John Wiley & Sons,
New York, NY.
Benham, L. (1972): “The Effect of Advertising on the Price of Eyeglasses,” Journal
of Law and Economics, 15, 337-352.
Berry, S., and Levinsohn, J., and Pakes, A. (1995): “Automobile Prices in
Market Equilibrium,” Econometrica, 63, 841-890.
Besanko, D., Perry, M., and Spady, R. (1990): “The Logit Model of Monopo-
listic Competition: Brand Diversity,” Journal of Industrial Economics, 38, 397-415.
Brown-Humes, C. (2001): “Creative Business: Advertising and Children,” Fi-
nancial Times.
Butters, G. (1977): “Equilibrium Distributions of Sales and Advertising Prices,”
The Review of Economic Studies, 44, 465-491.
Caron, A. and Martin, C. (1995) Les impacts de la reglementation quebecoise
de la publicite destinee aux enfants sur les ventes de temps et d’espace publicitaires,
Laboratoire d‘economie industrielle des medias et Groupe de recherche sur les jeunes
et les medias, Universite de Montreal, Montreal, PQ.
Eckard, W. Jr. (1991): “Competition and the Cigarette TV Advertising Ban,”
Economic Inquiry, 29, 119-133.
30

Gale Research Group: Companies and their Brands.
Grossman, G., and Shapiro, C. (1984): “Informative Advertising with Differ-
entiated Products,” The Review of Economic Studies, 51, 63-81.
Goeree, M. (2002): “Advertising in the U.S. Personal Computer industry”, Uni-
versity of Virginia, mimeo.
Harris Interactive (2001): Equitrend.
Holak, S., and Reddy, S. (1986): “Effects of a Television and Radio Advertising
Ban: A Study of the Cigarette Industry,” Journal of Marketing, 50, 219-227.
Jordan, A. (1996): The State of Children’s Television: An Examination of Quan-
tity, Quality, and Industry Beliefs [Report No. 2], Annenberg Public Policy Center,
University of Pennsylvania, Philadelphia, PA.
Kessides, I. (1986): “Advertising, Sunk Costs, and Barriers to Entry,” The Review
of Economic Studies, 68, 84-95.
Nevo, A. (2001): “Measuring Market Power in the Ready-to-Eat Cereal Industry,”
Econometrica, 69, 307-342.
——– (2000): “A Practitioner’s Guide to Estimation of Random-Coefficients Logit
Models of Demand,” Journal of Economics and Management Strategy, 9, 513-548.
——– (2000): “Mergers with Differentiated Products: The Case of the Ready-to-
Eat Cereal Industry,” RAND Journal of Economics, 31, 395-421.
Nielsen Media Services (1995-2001): Annual Summary of Advertising Expendi-
tures in Canada, Nielsen Marketing Research, Markham, ON.
31

Petrin, A. (2001): “Quantifying the Benefits of New Products: The Case of the
Minivan”, University of Michigan, mimeo.
Print Measurement Bureau (1997-2001): PMB Category Reports.
Rekkas, M. (2001): “Estimation of a Structural Model of Multiparty Elections:
Canadian Evidence”, University of Toronto, mimeo.
Sass, T., and Saurman, D. (1995): “Advertising Restrictions and Concentration:
The Case of Malt Beverages,” The Review of Economics and Statistics, 77, 66-81.
Shum, M. (2000): “Does Advertising Overcome Brand Loyalty? Evidence from the
Breakfast Cereals Market”, Johns Hopkins University, mimeo.
United States Department of Agriculture USDA Nutrient Database for
Standard Reference, Release 14. Nutrient Data Laboratory.
Woodard, E. (1999): The 1999 State of Children’s Television Report: Program-
ming for Children Over Broadcast and Cable Television [Report No. 28], Annenberg
Public Policy Center, University of Pennsylvania, Philadelphia, PA.
Wooldridge, J. (2002): Econometric Analysis of Cross Section and Panel Data,
The M.I.T. Press, Cambridge, MA.
32

8 Appendix:
Table 1:
Brandsin
PMB 98
existed
in 1983
advertised in at
least 2 of 4 years
(¿ $200 000)
GM Cinnamon Toast Crunch y n y
GM Count Chocula y y n
GM French Toast Crunch n n y
GM Golden Grahams y y n
GM Lucky Charms y y y
GM Nesquick n n y
GM Reese’s Puffs y n n
GM Trix y y n
Kellogg’s Cinnamon Mini Buns y n n
Kellogg’s Corn Pops y y y
Kellogg’s Froot Loops y y y
Kellogg’s Frosted Flakes y y y
Post Alphabits y y y
Post Honeycombs y y y
Post Pebbles y y n
Post Sugar Crisp y y y
Quaker Cap’n Crunch y y n
33
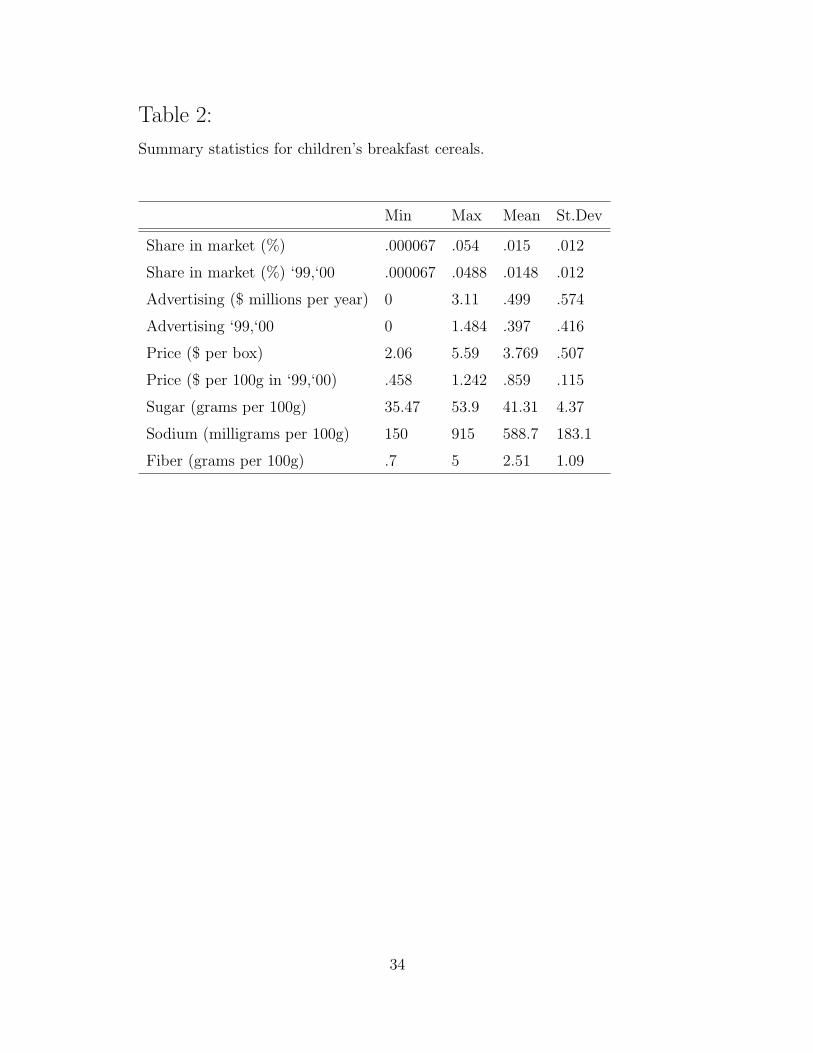
Table 2:
Summary statistics for children’s breakfast cereals.
Min Max Mean St.Dev
Share in market (%) .000067 .054 .015 .012
Share in market (%) ‘99,‘00 .000067 .0488 .0148 .012
Advertising ($ millions per year) 0 3.11 .499 .574
Advertising ‘99,‘00 0 1.484 .397 .416
Price ($ per box) 2.06 5.59 3.769 .507
Price ($ per 100g in ‘99,‘00) .458 1.242 .859 .115
Sugar (grams per 100g) 35.47 53.9 41.31 4.37
Sodium (milligrams per 100g) 150 915 588.7 183.1
Fiber (grams per 100g) .7 5 2.51 1.09
34

Table 3:Results from estimation of (10) with firm dummies :
# of observations: 396
Coef.
Price−.0047∗∗
(.0016
Advertising.0034∗∗
(.0015)
Established.013∗∗
(.0033
Established*Quebec.0032∗
(.0018)
Non-established*Quebec−.0015
(.0011)
(robust standard errors are reported in parentheses)
(*coefficient significant at 10% level; **coefficient significant at 5% level)
35

Table 4:Results from fixed effects estimation of (10) :
# of observations: 396 FE(1), FE(2), FE(3)–4 years
# of observations: 204 FE(4), FE(5)–1999 and 2000
in FE(1), FE(4): Established Def 1
in FE(2): Established Def 2
in FE(3), FE(5): Established Def 3
Established Def 1 and 2 yield the same resulst for 2 year data (FE(4))
FE(1) FE(2) FE(3) FE(4) FE(5)
Coef. Coef. Coef. Coef. Coef.
Price−.0021∗∗
(.0005)
−.0021∗∗
(.0005)
−.0020∗∗
(.0005)
−.0084∗∗
(.0038)
−.0082∗∗
(.0039)
Advertising.0012∗
(.00069)
.0012∗
(.00069)
.0012∗
(.0007)
.0027
(.0022)
.0027
(.0022)
Established−.0001
(.0014)
Est*Qu.0032∗∗
(.0007)
.0029∗∗
(.0007)
.0013∗∗
(.00057)
.0026∗∗
(.0011)
.0011
(.0008)
Nonest*Qu−.0014∗∗
(.0006)
−.0014∗∗
(.0006)
−.0015∗
(.0009)
−.0011
(.0009)
−.0012
(.0013)
(*coefficient significant at 10% level; **coefficient significant at 5% level)
36

Table 5:Results from fixed effects estimation with price IV of (10) :
# of observations: 396 FIV(1), FIV(2), FIV(3)–4 years
# of observations: 204 FIV(4), FIV(5)–1999 and 2000
in FIV(1), FIV(4): Established Def 1
in FIV(2): Established Def 2
in FIV(3), FIV(5): Established Def 3
Established Def 1 and 2 yield the same resulst for 2 year data (FIV(4))
FIV(1) FIV(2) FIV(3) FIV(4) FIV(5)
Coef. Coef. Coef. Coef. Coef.
Price−.007∗∗
(.0026)
−.007∗∗
(.0026
−.007∗∗
(.0026)
−.011
(.009)
−.0011
(.009)
Advertising.0016∗∗
(.0008)
.0016∗∗
(.0008)
.0016
(.0008)
.0027
(.0022)
.0027
(.0022)
Established−.0005
(.002)
Est*Qu.0032∗∗
(.0008)
.0028∗∗
(.0008)
.0012∗
(.0006)
.0027∗∗
(.001)
.0011
(.0008)
Nonest*Qu−.0016∗∗
(.0007)
−.0015∗∗
(.0007)
−.0015
(.001)
−.0011
(.0009)
−.0012
(.0013)
(*coefficient significant at 10% level; **coefficient significant at 5% level)
37