Embed Size (px)
Citation preview

Required Report - public distribution
Date: 6/16/2005
GAIN Report Number: CH5607
CH4605
China, Peoples Republic ofFood Processing Ingredients SectorFood Processing2005
Approved by:Keith Schneller
Prepared by:Daniel Taylor
Report Highlights:The food processing industry in China continues to grow rapidly. In 2003 revenue for the industry was over USD$122 billion. Strong economic growth combined and higher disposable incomes are increasing demands from Chinese consumers for high quality processed foods at home and in restaurants. China is also becoming a profitable base for export oriented food processing. The industry in China should continue to see year-on-year growth in the double-digit range for the foreseeable future and there will continue to be a market for certain high quality American ingredients.
Includes PSD Changes: NoIncludes Trade Matrix: No
Annual ReportGuangzhou [CH3]
[CH]
USDA Foreign Agricultural Service
GAIN ReportGlobal Agriculture Information Network
Template Version 2.09

GAIN Report – CH5607 Page 2 of 29
Table of Contents
Section II: Executive Summary Page 3 of 30
Section II: Market Summary Page 5 of 30
A. Sector Size Page 5 of 30
B. Sector Geographic Distribution Page 6 of 30
C. Sector Growth Page 7 of 30
D. Consumer Trends and Sales Patterns Page 9 of 30
E. Challenges and Opportunities Page 14 of 30
Section III: Road Map for Market Entry Page 16 of 30
A. Entry Strategy Page 16 0f 30
B. Distribution Page 19 of 30
C. Company Profiles Page 21 of 30
Section IV: Competition Page 23 of 30
A. Domestic Competition Page 23 of 30
B. Non-US Competition Page 24 of 30
Section V: Best Product Prospects Page 28 of 30
Section VI: Post Contact Information Page 30 of 30
UNCLASSIFIED USDA Foreign Agricultural Service
GAIN Report – CH5607 Page 3 of 29
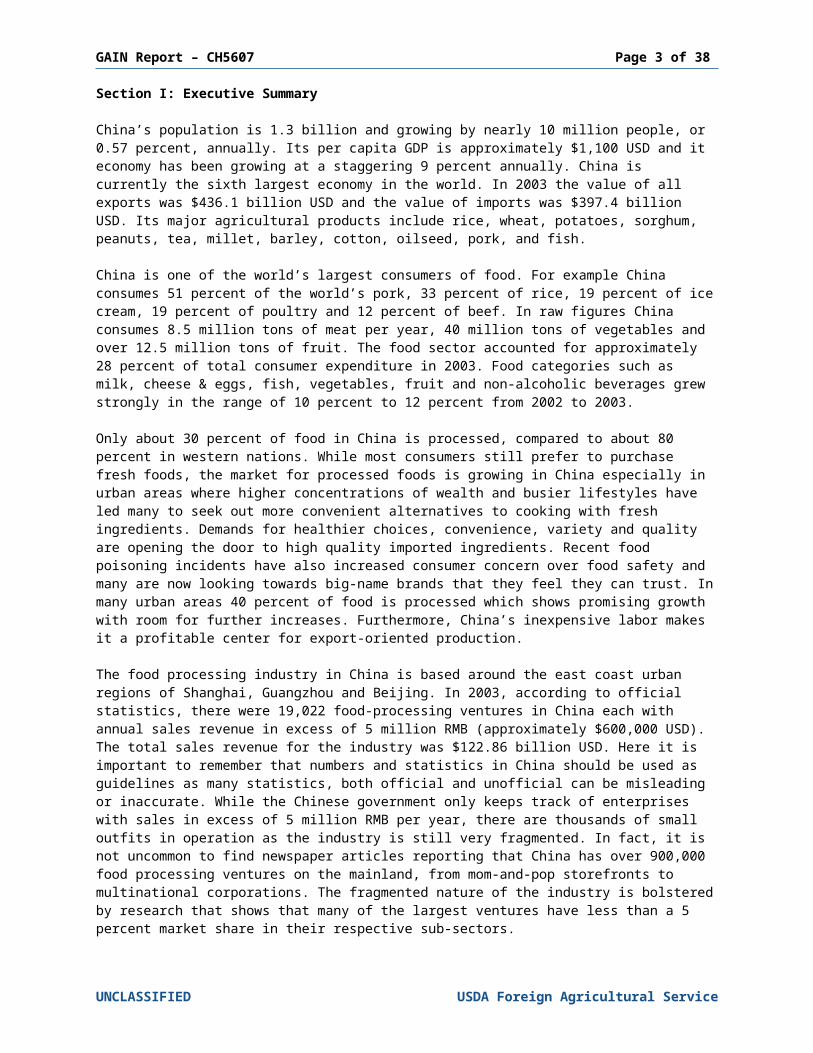
Section I: Executive Summary
China’s population is 1.3 billion and growing by nearly 10 million people, or 0.57 percent, annually. Its per capita GDP is approximately $1,100 USD and it economy has been growing at a staggering 9 percent annually. China is currently the sixth largest economy in the world. In 2003 the value of all exports was $436.1 billion USD and the value of imports was $397.4 billion USD. Its major agricultural products include rice, wheat, potatoes, sorghum, peanuts, tea, millet, barley, cotton, oilseed, pork, and fish.
China is one of the world’s largest consumers of food. For example China consumes 51 percent of the world’s pork, 33 percent of rice, 19 percent of ice cream, 19 percent of poultry and 12 percent of beef. In raw figures China consumes 8.5 million tons of meat per year, 40 million tons of vegetables and over 12.5 million tons of fruit. The food sector accounted for approximately 28 percent of total consumer expenditure in 2003. Food categories such as milk, cheese & eggs, fish, vegetables, fruit and non-alcoholic beverages grew strongly in the range of 10 percent to 12 percent from 2002 to 2003.
Only about 30 percent of food in China is processed, compared to about 80 percent in western nations. While most consumers still prefer to purchase fresh foods, the market for processed foods is growing in China especially in urban areas where higher concentrations of wealth and busier lifestyles have led many to seek out more convenient alternatives to cooking with fresh ingredients. Demands for healthier choices, convenience, variety and quality are opening the door to high quality imported ingredients. Recent food poisoning incidents have also increased consumer concern over food safety and many are now looking towards big-name brands that they feel they can trust. In many urban areas 40 percent of food is processed which shows promising growth with room for further increases. Furthermore, China’s inexpensive labor makes it a profitable center for export-oriented production.
The food processing industry in China is based around the east coast urban regions of Shanghai, Guangzhou and Beijing. In 2003, according to official statistics, there were 19,022 food-processing ventures in China each with annual sales revenue in excess of 5 million RMB (approximately $600,000 USD). The total sales revenue for the industry was $122.86 billion USD. Here it is important to remember that numbers and statistics in China should be used as guidelines as many statistics, both official and unofficial can be misleading or inaccurate. While the Chinese government only keeps track of enterprises with sales in excess of 5 million RMB per year, there are thousands of small outfits in operation as the industry is still very fragmented. In fact, it is not uncommon to find newspaper articles reporting that China has over 900,000 food processing ventures on the mainland, from mom-and-pop storefronts to multinational corporations. The fragmented nature of the industry is bolstered by research that shows that many of the largest ventures have less than a 5 percent market share in their respective sub-sectors.
Official statistics report that the industry grew 16 percent between 2001-2002 and 23 percent for 2002-2003. These numbers are staggering but many industry insiders feel that it is safer to assume double-digit growth in excess of 10 percent. The president of the China Food Industry Association was recently quoted as expecting 10 percent-12 percent annual growth for the food processing sector. While this outlook is less than the official numbers of 16 percent and 23 percent it still shows strong growth with excellent potential. In fact, some estimates believe that the output of the food industry by the year 2010 may double from that of the year 2000, when it was valued at about 800 billion RMB ($102.7 billion USD).
Retail sales of processed food as well as the restaurant and catering industries have also shown impressive growth in the double-digit range over the last few years. Packaged foods, especially baked goods, dairy products, oils and fats, baby food and ice cream have all demonstrated exceptional growth in recent years. Fast-food chains such as KFC and McDonald's are all expanding in China as they look to the Chinese market as their main source of growth. Institutional catering is also on the rise as the number of factor workers skyrockets and companies outsource feeding their employees.
In the upcoming years the industry will focus on the development of corn and wheat goods, dairy products, food additives and seasoning essentials. Demands for imported poultry, cereals, fish, nuts, soybeans are expected to continue while US exporters may find new markets in baking ingredients and fruit flavorings. Good prospects include: almonds, pistachios, prunes, raisins, oranges, hazelnuts, macadamia nuts, cherries, poultry, pork, potato flour, frozen potato products, corn, juices and concentrates, seafood--lobsters, scallops, salmon, pollock --infant formula, baking ingredients (nuts, whey powder, flours), fruit
UNCLASSIFIED USDA Foreign Agricultural Service
GAIN Report – CH5607 Page 4 of 29
flavorings (blueberry), stabilizers and table grapes. As soon as the BSE issue is resolved and the embargo on US beef is lifted, US exporters will find a healthy market for beef products.
UNCLASSIFIED USDA Foreign Agricultural Service
GAIN Report – CH5607 Page 5 of 29
Section II: Market Summary
· The food processing industry had combined sales of $122.86 billion USD in 2003.· The industry is based in Shanghai, Guangdong and Shandong.· Industry is very fragmented with many small-scale operations but there is slow growth of larger
firms as consolidation begins.· Double-digit growth is a safe assumption based on current industrial and retail statistics.· The primary processing sector has demonstrated the highest consistent growth in both sales
revenue and number of players.· Although the beverage industry has fewer players, revenue is still growing, appearing to have
recovered from slow growth in 2002.· Expect strongest growth rate in baby food, oils and fats, dairy, baked goods, and dried foods.· Expect strong growth in all sub-sectors.
A. Sector Size
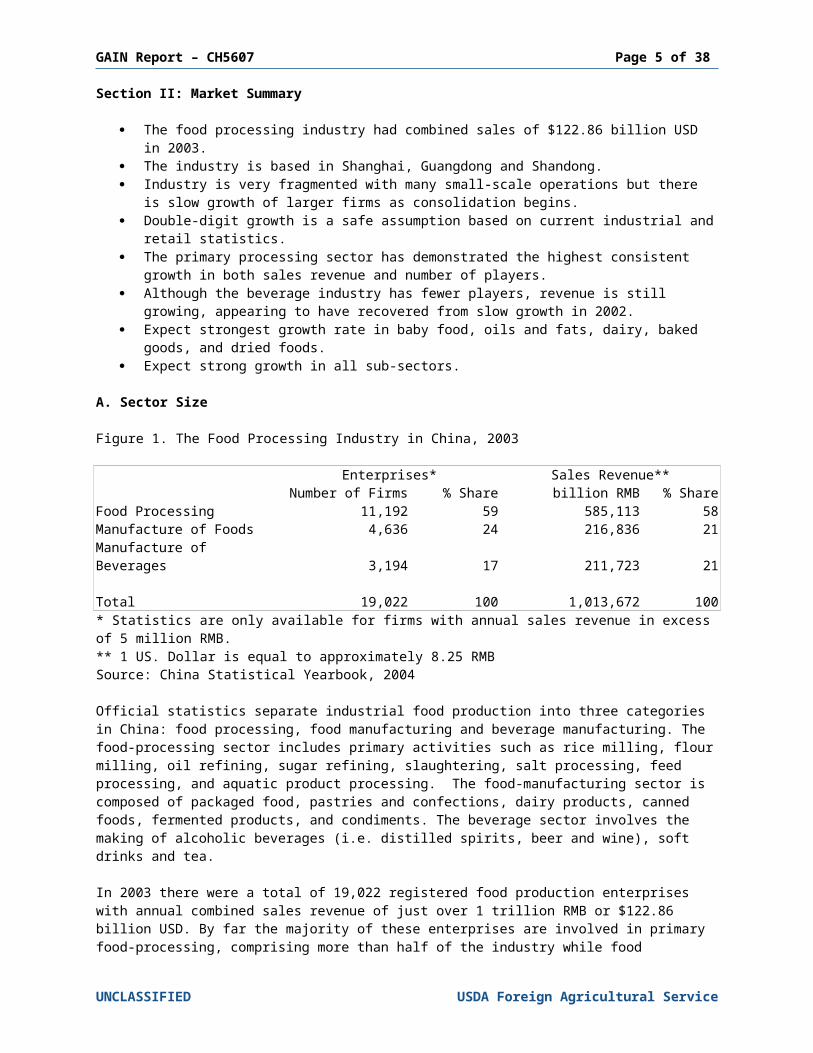
Figure 1. The Food Processing Industry in China, 2003
Enterprises* Sales Revenue**Number of Firms % Share billion RMB % Share
Food Processing 11,192 59 585,113 58Manufacture of Foods 4,636 24 216,836 21Manufacture of Beverages 3,194 17 211,723 21
Total 19,022 100 1,013,672 100* Statistics are only available for firms with annual sales revenue in excess of 5 million RMB.** 1 US. Dollar is equal to approximately 8.25 RMBSource: China Statistical Yearbook, 2004
Official statistics separate industrial food production into three categories in China: food processing, food manufacturing and beverage manufacturing. The food-processing sector includes primary activities such as rice milling, flour milling, oil refining, sugar refining, slaughtering, salt processing, feed processing, and aquatic product processing. The food-manufacturing sector is composed of packaged food, pastries and confections, dairy products, canned foods, fermented products, and condiments. The beverage sector involves the making of alcoholic beverages (i.e. distilled spirits, beer and wine), soft drinks and tea.
In 2003 there were a total of 19,022 registered food production enterprises with annual combined sales revenue of just over 1 trillion RMB or $122.86 billion USD. By far the majority of these enterprises are involved in primary food-processing, comprising more than half of the industry while food manufacturing and beverage manufacturing account for approximately 20 percent each. (Again, one must keep in mind that statistics are only kept for operations that have annual revenue of more than 5 million RMB per year. China does not publish statistics for industrial enterprises, state-owned or private with sales below the 5 million RMB mark.)
The industry is still very fragmented. While there may be a few giants and mergers and acquisitions continue, the bulk of food processing is done by medium-sized outfits. For example Statistics from China’s Dairy Industry Association show that there are over 1,500 dairy producers in China and that 90 to 95 percent are small and medium-sized enterprises. In retail sales of packaged food the largest market share belongs to Ting Hsin International Group and its share is only 4 percent. This is most likely because the industry is still very young. Furthermore, with disparate incomes between urban and rural residents, regional variations in taste and, most importantly, lack of infrastructure it will take some time for the industry to consolidate and capitalize on economies of scale.
B. Sector Geographic Distribution
UNCLASSIFIED USDA Foreign Agricultural Service
GAIN Report – CH5607 Page 6 of 29
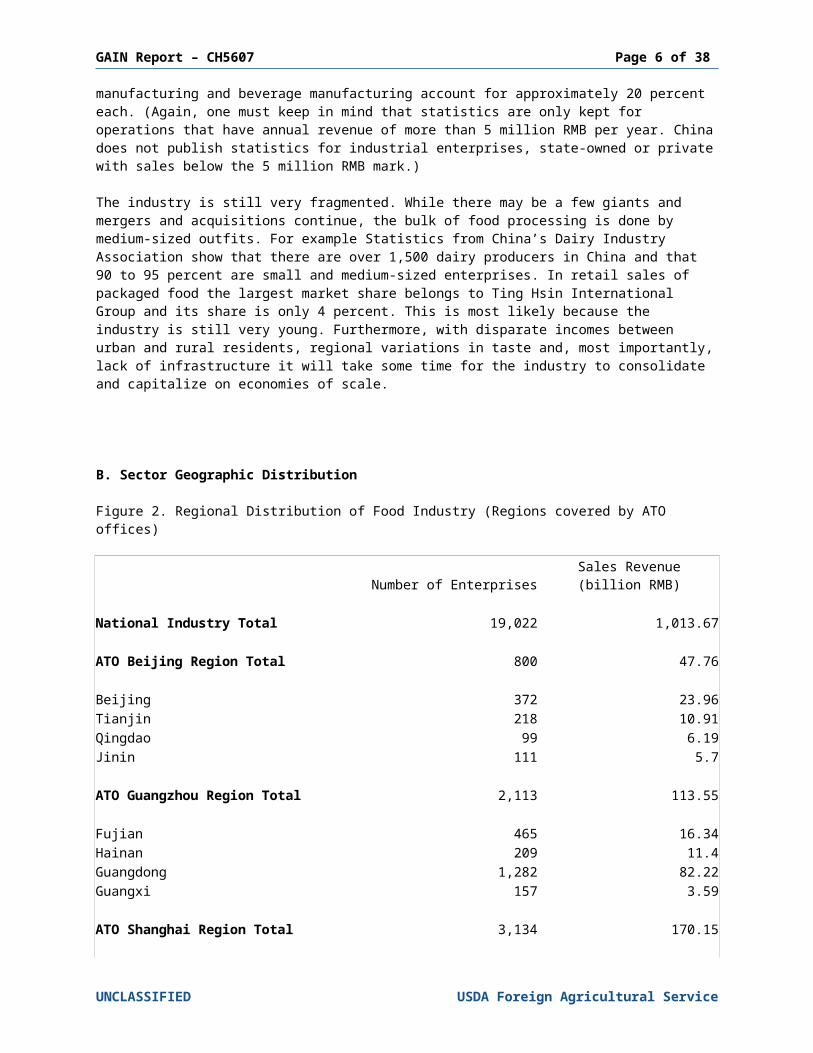
Figure 2. Regional Distribution of Food Industry (Regions covered by ATO offices)
Number of EnterprisesSales Revenue(billion RMB)
National Industry Total 19,022 1,013.67
ATO Beijing Region Total 800 47.76
Beijing 372 23.96Tianjin 218 10.91Qingdao 99 6.19Jinin 111 5.7
ATO Guangzhou Region Total 2,113 113.55
Fujian 465 16.34Hainan 209 11.4Guangdong 1,282 82.22Guangxi 157 3.59
ATO Shanghai Region Total 3,134 170.15
Shanghai 641 35.46Jiangsu 1,353 78.48Zhejiang 1,140 56.21
China’s food processing industry is concentrated in the three coastal regions of Shanghai, Guangdong Province and Shandong Province. These areas have access to seaports, domestic logistics and imported technology. Furthermore, east coast consumers have benefited the most from economic development and are the wealthiest consumers, comprising the largest market for processed and imported food.
Guangdong is the second largest food-processing center in China with a total of 1,282 enterprises and is a major center for seafood processing. It is also, according to industry insiders, the center for distribution of imported ingredients and processed goods. While many imported goods enter directly through Guangdong's capital of Guangzhou, the city also handles a large amount of goods that are shipped via Hong Kong. Guangdong also has a large restaurant/catering business as Guangdong consumers spend more per capita in both real terms and as a percentage of income on dining out than anywhere else in China. Guangzhou is known for its diverse cuisine as exemplified by a common saying that the Cantonese will eat anything with four legs except the table. Owing to this, many processors and importers feel that Guangzhou is a good place to test out foreign foods as they will likely find early acceptance here allowing a foothold in the Chinese market.
Income, population and growth have all made the Yangtze river delta a major center for the food processing industry, and an important market for U.S. food ingredients. In 2003 the food processing industry for the region, including both food and beverage manufacturers, included some 3,134 enterprises with a total sales value of RMB170 billion ($20.5 billion). Although Shanghai’s industry remains large (at $4.3 billion), many food processors have moved to lower-cost areas in neighboring Jiangsu and Zhejiang provinces, and the food processing industries in these areas are now larger than Shanghai. Jiangsu is the largest of the three, with a 2003 sales value of $9.5 billion in an industry that employs over 214,000 people. The key cities for Jiangsu’s food manufacturing industry include Zhanjiagang, Kunshan and Suzhou. Provincial statistics indicate that profit margins are tight, particularly for food processing (margins for beverage manufacturers a considerably higher). As a result, manufacturers in the Shanghai region are looking for ways to improve or otherwise distinguish their products from the competition. Many are turning to imported ingredients.
UNCLASSIFIED USDA Foreign Agricultural Service
GAIN Report – CH5607 Page 7 of 29
C. Sector Growth
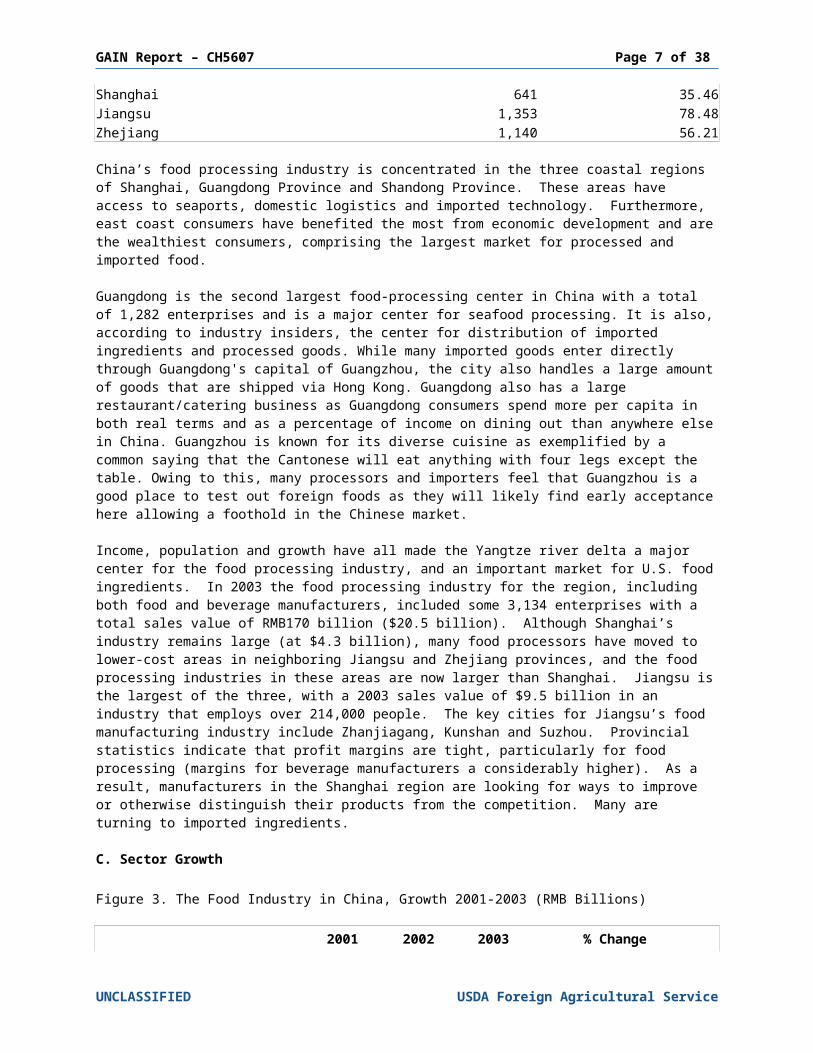
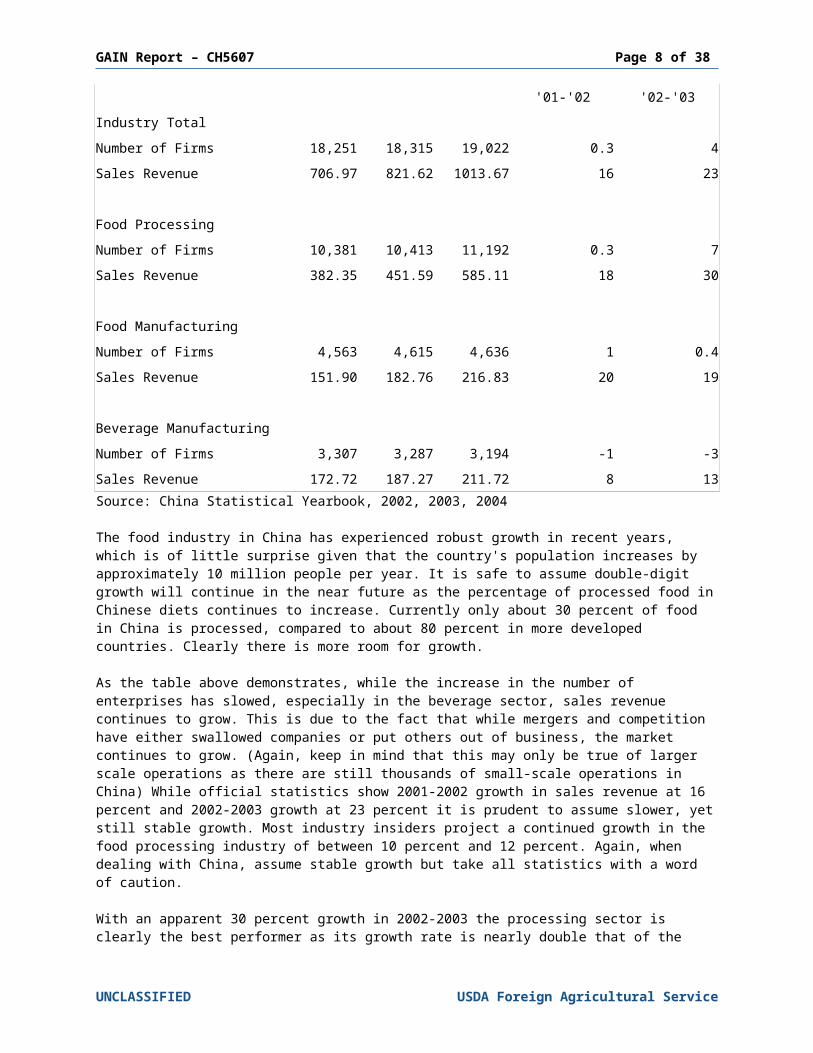
Figure 3. The Food Industry in China, Growth 2001-2003 (RMB Billions)
2001 2002 2003 % Change'01-'02 '02-'03
Industry Total
Number of Firms 18,251 18,315 19,022 0.3 4
Sales Revenue 706.97 821.62 1013.67 16 23
Food Processing
Number of Firms 10,381 10,413 11,192 0.3 7
Sales Revenue 382.35 451.59 585.11 18 30
Food Manufacturing
Number of Firms 4,563 4,615 4,636 1 0.4
Sales Revenue 151.90 182.76 216.83 20 19
Beverage Manufacturing
Number of Firms 3,307 3,287 3,194 -1 -3
Sales Revenue 172.72 187.27 211.72 8 13Source: China Statistical Yearbook, 2002, 2003, 2004
The food industry in China has experienced robust growth in recent years, which is of little surprise given that the country's population increases by approximately 10 million people per year. It is safe to assume double-digit growth will continue in the near future as the percentage of processed food in Chinese diets continues to increase. Currently only about 30 percent of food in China is processed, compared to about 80 percent in more developed countries. Clearly there is more room for growth.
As the table above demonstrates, while the increase in the number of enterprises has slowed, especially in the beverage sector, sales revenue continues to grow. This is due to the fact that while mergers and competition have either swallowed companies or put others out of business, the market continues to grow. (Again, keep in mind that this may only be true of larger scale operations as there are still thousands of small-scale operations in China) While official statistics show 2001-2002 growth in sales revenue at 16 percent and 2002-2003 growth at 23 percent it is prudent to assume slower, yet still stable growth. Most industry insiders project a continued growth in the food processing industry of between 10 percent and 12 percent. Again, when dealing with China, assume stable growth but take all statistics with a word of caution.
With an apparent 30 percent growth in 2002-2003 the processing sector is clearly the best performer as its growth rate is nearly double that of the manufacturing and beverage industries. Although the figures may be inflated, the disparity between the sub-sectors seems justified given the fact that the food processing industry in China is young and that initial growth should be in the primary sector of the industry.
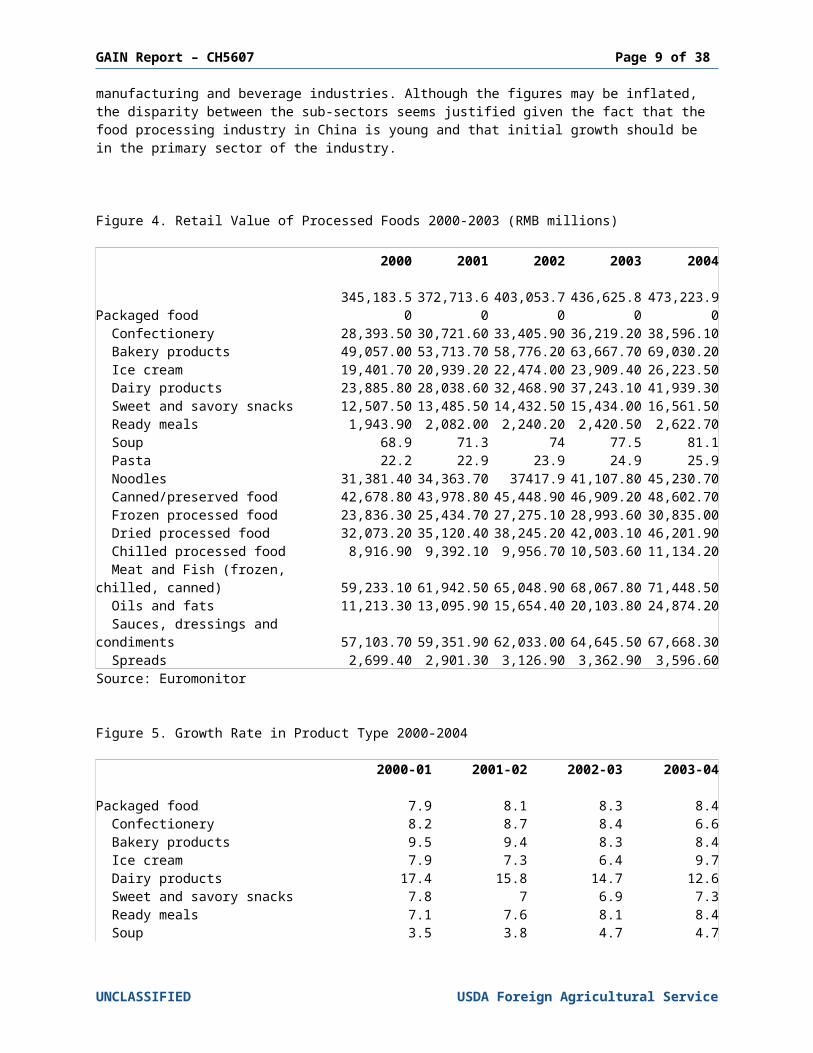
Figure 4. Retail Value of Processed Foods 2000-2003 (RMB millions)
2000 2001 2002 2003 2004
UNCLASSIFIED USDA Foreign Agricultural Service
GAIN Report – CH5607 Page 8 of 29
Packaged food 345,183.50 372,713.60 403,053.70 436,625.80 473,223.90 Confectionery 28,393.50 30,721.60 33,405.90 36,219.20 38,596.10 Bakery products 49,057.00 53,713.70 58,776.20 63,667.70 69,030.20 Ice cream 19,401.70 20,939.20 22,474.00 23,909.40 26,223.50 Dairy products 23,885.80 28,038.60 32,468.90 37,243.10 41,939.30 Sweet and savory snacks 12,507.50 13,485.50 14,432.50 15,434.00 16,561.50 Ready meals 1,943.90 2,082.00 2,240.20 2,420.50 2,622.70 Soup 68.9 71.3 74 77.5 81.1 Pasta 22.2 22.9 23.9 24.9 25.9 Noodles 31,381.40 34,363.70 37417.9 41,107.80 45,230.70 Canned/preserved food 42,678.80 43,978.80 45,448.90 46,909.20 48,602.70 Frozen processed food 23,836.30 25,434.70 27,275.10 28,993.60 30,835.00 Dried processed food 32,073.20 35,120.40 38,245.20 42,003.10 46,201.90 Chilled processed food 8,916.90 9,392.10 9,956.70 10,503.60 11,134.20 Meat and Fish (frozen, chilled, canned) 59,233.10 61,942.50 65,048.90 68,067.80 71,448.50 Oils and fats 11,213.30 13,095.90 15,654.40 20,103.80 24,874.20 Sauces, dressings and condiments 57,103.70 59,351.90 62,033.00 64,645.50 67,668.30 Spreads 2,699.40 2,901.30 3,126.90 3,362.90 3,596.60Source: Euromonitor
Figure 5. Growth Rate in Product Type 2000-2004
2000-01 2001-02 2002-03 2003-04
Packaged food 7.9 8.1 8.3 8.4 Confectionery 8.2 8.7 8.4 6.6 Bakery products 9.5 9.4 8.3 8.4 Ice cream 7.9 7.3 6.4 9.7 Dairy products 17.4 15.8 14.7 12.6 Sweet and savory snacks 7.8 7 6.9 7.3 Ready meals 7.1 7.6 8.1 8.4 Soup 3.5 3.8 4.7 4.7 Pasta 3.6 4.1 4.1 4.4 Noodles 9.5 8.9 9.9 10 Canned/preserved food 3 3.3 3.2 3.6 Frozen processed food 6.7 7.2 6.3 6.4 Dried processed food 9.5 8.9 9.8 10 Chilled processed food 5.3 6 5.5 6 Meat and Fish (frozen, chilled, canned) 4.6 5 4.7 5 Oils and fats 16.8 19.5 28.4 23.7 Sauces, dressings and condiments 3.9 4.5 4.2 4.7 Baby food 12.8 10.5 11.3 15.1 Spreads 7.5 7.8 7.5 6.9Source: Euromonitor
The total retail value of packaged food has showed consistent 8 percent growth since 2000. Baby food, oils and fats, dairy, ice cream, and dried foods all show higher than average growth, although the average rate of 8 percent is very strong. Using the growth rate of the retail value of processed foods should provide a reasonable estimate of the growth rate for the entire industry. In fact, many industry insiders feel that the above listed growth rates are accurate for the industry as a whole. However, with more and more companies using China as a platform for export oriented processing, these numbers may increase.
UNCLASSIFIED USDA Foreign Agricultural Service
GAIN Report – CH5607 Page 9 of 29
D. Consumer Trends and Sales Patterns
· Overall expenditure on food shows consistent growth.· There is a large urban and rural divide. Urban centers will still be the largest market for processed
food until rural incomes increase and market penetration and distribution logistics improve.· Urban areas show the most growth and the highest growth in expensive value-added items.· Urban areas show strong growth in milk, yogurt, milk powder, baby food products, oils and fats,
meat and poultry, and seafood.· While unprocessed grain consumption decreases, baked goods and processed cereals increases.· Fish, poultry, baked goods, milk and yogurt show parallel increases with income.· Watch for increasing trends in convenience, health foods, low fat, fortified foods.· Safety is still a concern.· The organic market is fledgling but being promoted by the government and is bolstered by health
and safety concerns.· Watch for increasing organic exports.· More and more food is purchased in supermarkets and hypermarkets, which have increasingly
large proportions of processed food and much more than traditional markets.· The number of restaurants increases as more people eat out, especially in urban areas.
Figure 6. Consumer Expenditure on Food 1998-2002 (RMB billion)
1999 2000 2001 2002 2003
Amount 1442.8 1438.9 1521.9 1541.6 1601.4Source: China Statistical Yearbook
Figure 7: The Urban-Rural Divide: Per Capita Income and Food Expenditure in China (RMB)
% Change2001 2002 2003 2002 2003
UrbanDisposable Income 6,859.60 7,702.80 8,472.20 12.2 9.9Food Expenditure 2,014.00 2,271.80 2,416.90 12.8 6.3
RuralDisposable Income 2,366.40 2,475.60 2,622.20 4.6 5.9Food Expediture 830.70 872.40 886.00 1.5 1.6
Source: China Statistical Yearbook 2002, 2003, 2004.
According to the tables above, per capita expenditure on food in urban areas increased by about 6 percent between 2002 and 2003 while in rural areas the increase was about 1.6 percent. In urban areas, the yearly growth for 2003 was only half of that recorded in 2002 while rural areas showed increasing growth. What is important to recognize here though is that while growth in food expenditure is strong in both urban and rural areas, rural disposable income and food expenditure is roughly one-third of the urban counterpart. Also notice that in urban areas growth in food expenditure is on par with growth in income while in rural areas increased income is not being used on food. One of the reasons behind this is that rural residents still spend money on inexpensive, unprocessed foods. Therefore the strength of the processed food market and the drivers for tastes and products still reside in urban areas.
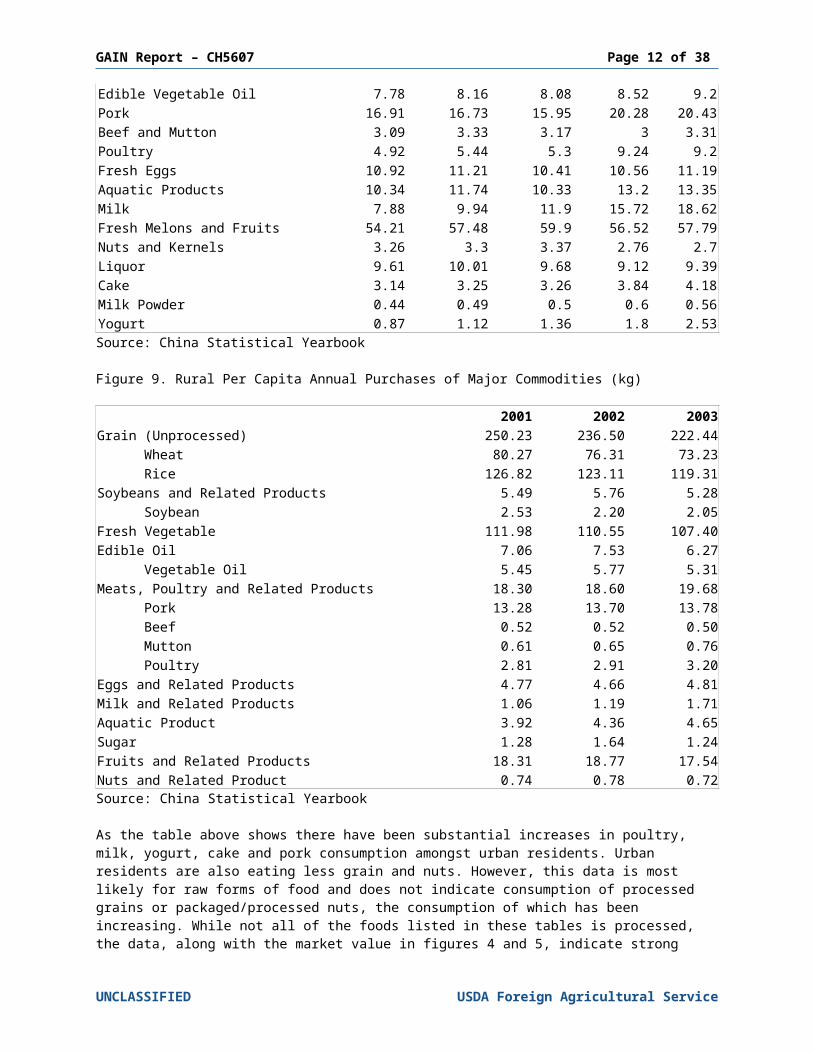
Figure 8. Urban Per Capita Annual Purchases of Major Commodities (kg)
1999 2000 2001 2002 2003Grain 84.91 82.31 79.69 78.48 79.52
UNCLASSIFIED USDA Foreign Agricultural Service

GAIN Report – CH5607 Page 10 of 29
Fresh Vegetables 114.94 114.74 115.86 116.52 118.34Edible Vegetable Oil 7.78 8.16 8.08 8.52 9.2Pork 16.91 16.73 15.95 20.28 20.43Beef and Mutton 3.09 3.33 3.17 3 3.31Poultry 4.92 5.44 5.3 9.24 9.2Fresh Eggs 10.92 11.21 10.41 10.56 11.19Aquatic Products 10.34 11.74 10.33 13.2 13.35Milk 7.88 9.94 11.9 15.72 18.62Fresh Melons and Fruits 54.21 57.48 59.9 56.52 57.79Nuts and Kernels 3.26 3.3 3.37 2.76 2.7Liquor 9.61 10.01 9.68 9.12 9.39Cake 3.14 3.25 3.26 3.84 4.18Milk Powder 0.44 0.49 0.5 0.6 0.56Yogurt 0.87 1.12 1.36 1.8 2.53Source: China Statistical Yearbook
Figure 9. Rural Per Capita Annual Purchases of Major Commodities (kg)
2001 2002 2003Grain (Unprocessed) 250.23 236.50 222.44
Wheat 80.27 76.31 73.23Rice 126.82 123.11 119.31
Soybeans and Related Products 5.49 5.76 5.28Soybean 2.53 2.20 2.05
Fresh Vegetable 111.98 110.55 107.40Edible Oil 7.06 7.53 6.27
Vegetable Oil 5.45 5.77 5.31Meats, Poultry and Related Products 18.30 18.60 19.68
Pork 13.28 13.70 13.78Beef 0.52 0.52 0.50Mutton 0.61 0.65 0.76Poultry 2.81 2.91 3.20
Eggs and Related Products 4.77 4.66 4.81Milk and Related Products 1.06 1.19 1.71Aquatic Product 3.92 4.36 4.65Sugar 1.28 1.64 1.24Fruits and Related Products 18.31 18.77 17.54Nuts and Related Product 0.74 0.78 0.72Source: China Statistical Yearbook
As the table above shows there have been substantial increases in poultry, milk, yogurt, cake and pork consumption amongst urban residents. Urban residents are also eating less grain and nuts. However, this data is most likely for raw forms of food and does not indicate consumption of processed grains or packaged/processed nuts, the consumption of which has been increasing. While not all of the foods listed in these tables is processed, the data, along with the market value in figures 4 and 5, indicate strong preferences for certain types of food that will affect the food processing industry.
Growth in overall food consumption in rural areas remains limited with emphasis on meats, dairy and fish products while other foods such as edible oils actually declined. There is very little data for processed
UNCLASSIFIED USDA Foreign Agricultural Service

GAIN Report – CH5607 Page 11 of 29
food consumption in rural areas, which is indicative, of how little is consumed.
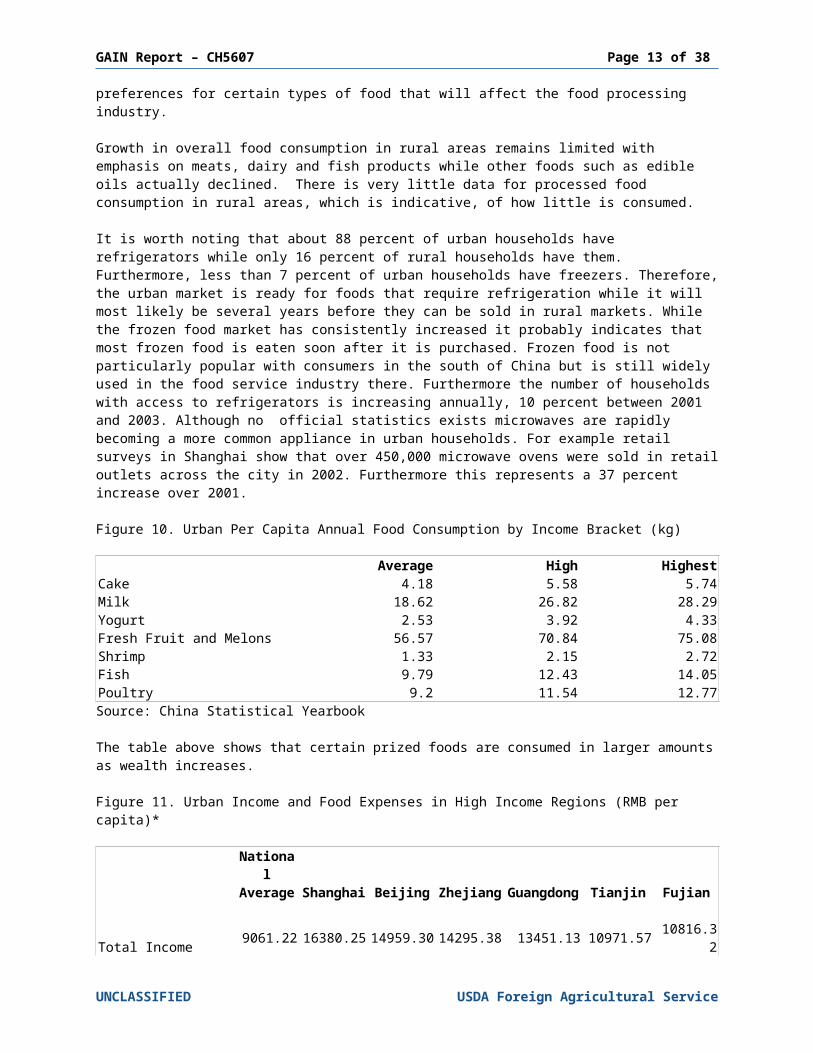
It is worth noting that about 88 percent of urban households have refrigerators while only 16 percent of rural households have them. Furthermore, less than 7 percent of urban households have freezers. Therefore, the urban market is ready for foods that require refrigeration while it will most likely be several years before they can be sold in rural markets. While the frozen food market has consistently increased it probably indicates that most frozen food is eaten soon after it is purchased. Frozen food is not particularly popular with consumers in the south of China but is still widely used in the food service industry there. Furthermore the number of households with access to refrigerators is increasing annually, 10 percent between 2001 and 2003. Although no official statistics exists microwaves are rapidly becoming a more common appliance in urban households. For example retail surveys in Shanghai show that over 450,000 microwave ovens were sold in retail outlets across the city in 2002. Furthermore this represents a 37 percent increase over 2001.
Figure 10. Urban Per Capita Annual Food Consumption by Income Bracket (kg)
Average High HighestCake 4.18 5.58 5.74Milk 18.62 26.82 28.29Yogurt 2.53 3.92 4.33Fresh Fruit and Melons 56.57 70.84 75.08Shrimp 1.33 2.15 2.72Fish 9.79 12.43 14.05Poultry 9.2 11.54 12.77Source: China Statistical Yearbook
The table above shows that certain prized foods are consumed in larger amounts as wealth increases.
Figure 11. Urban Income and Food Expenses in High Income Regions (RMB per capita)*
National Average Shanghai Beijing Zhejiang Guangdong Tianjin Fujian
Total Income 9061.22 16380.25 14959.30 14295.38 13451.13 10971.57 10816.32Disposable Income 8472.20 14867.49 13882.62 13179.53 12380.43 10312.91 9999.54Living Expenditure 6510.94 11040.34 11123.84 9712.89 9636.27 7867.53 7356.26Food 2416.92 4102.65 3522.69 3558.41 3583.72 2963.85 3104.80
Grain 194.15 195.77 224.11 182.99 230.24 217.41 248.98Starches and Tubers 17.08 23.26 26.12 12.62 11.45 24.71 17.22Beans/Bean Products 31.40 56.63 38.15 45.10 25.89 28.05 37.48Oil and Fats 78.46 84.27 81.63 63.42 86.17 79.46 83.28Meat and Poultry 473.19 618.80 575.01 474.87 846.22 479.36 662.66Eggs 60.97 65.73 71.80 47.89 44.85 93.27 71.91Aquatic Products 170.31 534.09 160.94 547.10 359.79 271.92 581.56Vegetables 236.44 336.30 266.62 311.38 287.91 249.97 271.53Condiments 35.22 49.59 67.06 36.33 36.21 56.18 44.37Sugar 26.51 54.21 44.56 28.42 36.32 24.24 21.91 Beverages 120.11 212.17 246.46 173.46 106.87 170.61 131.54Dried/Fresh Fruits 174.89 294.26 313.01 255.48 225.50 241.72 207.43Nuts and Kernels 26.14 49.93 64.42 39.21 28.20 55.12 24.71Cake 53.46 118.82 125.94 62.58 73.05 84.08 49.23Dairy Products 124.70 241.82 255.99 139.17 124.01 139.08 153.00
UNCLASSIFIED USDA Foreign Agricultural Service
GAIN Report – CH5607 Page 12 of 29
National Average Shanghai Beijing Zhejiang Guangdong Tianjin Fujian
Dining Out 438.24 896.85 829.68 827.63 924.09 612.07 346.64* Bold figures indicate notably high amountsSource: China Statistical Yearbook
Regional variations must be accounted for in the food processing industry. While China may have 1.3 billion people there is a great urban/rural divide and further variations among urban consumers. For example, While Guangdong may rank 4th among the wealthiest areas it spends far more on meat and poultry and dining out than its wealthier counterparts. In fact, demand for meat in Guangdong far outstrips supply--it can only supply 60 percent of its meat demands—making it a coveted market for meat processing enterprises.
Take as further examples seafood consumption in Fujian or egg consumption in Tianjin, which is much higher than in other more wealthy areas. Fujian's seafood consumption is roughly triple that of Beijing even though its disposable income is only 70 percent of its wealthier counterpart. In short, agricultural exporters must be aware of significant regional variations and not see China as one big market. Exporters should be aware of where in China their products will have the most impact and educate themselves about the Chinese market. One of the biggest complaints from Chinese importers and distributors of food ingredients is that American exporters often know very little about the Chinese market.
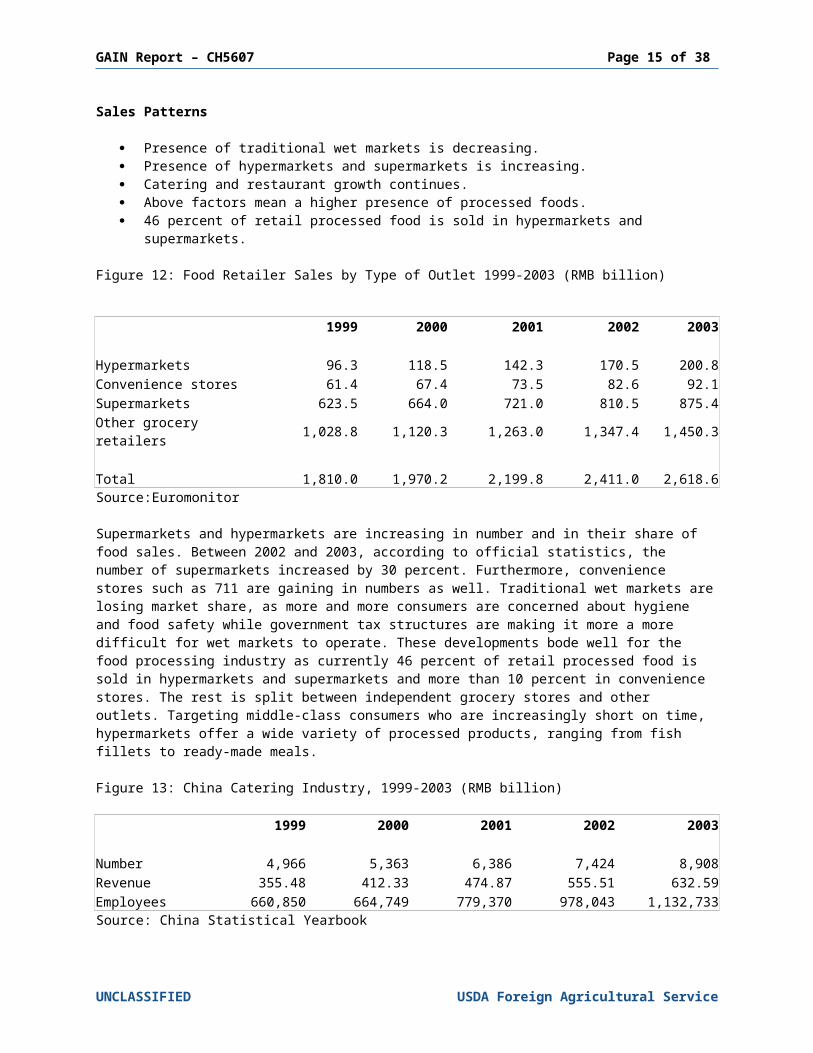
Sales Patterns
· Presence of traditional wet markets is decreasing.· Presence of hypermarkets and supermarkets is increasing.· Catering and restaurant growth continues.· Above factors mean a higher presence of processed foods.· 46 percent of retail processed food is sold in hypermarkets and supermarkets.
Figure 12: Food Retailer Sales by Type of Outlet 1999-2003 (RMB billion)
1999 2000 2001 2002 2003
Hypermarkets 96.3 118.5 142.3 170.5 200.8Convenience stores 61.4 67.4 73.5 82.6 92.1Supermarkets 623.5 664.0 721.0 810.5 875.4Other grocery retailers 1,028.8 1,120.3 1,263.0 1,347.4 1,450.3
Total 1,810.0 1,970.2 2,199.8 2,411.0 2,618.6Source:Euromonitor
Supermarkets and hypermarkets are increasing in number and in their share of food sales. Between 2002 and 2003, according to official statistics, the number of supermarkets increased by 30 percent. Furthermore, convenience stores such as 711 are gaining in numbers as well. Traditional wet markets are losing market share, as more and more consumers are concerned about hygiene and food safety while government tax structures are making it more a more difficult for wet markets to operate. These developments bode well for the food processing industry as currently 46 percent of retail processed food is sold in hypermarkets and supermarkets and more than 10 percent in convenience stores. The rest is split between independent grocery stores and other outlets. Targeting middle-class consumers who are increasingly short on time, hypermarkets offer a wide variety of processed products, ranging from fish fillets to ready-made meals.
Figure 13: China Catering Industry, 1999-2003 (RMB billion)
1999 2000 2001 2002 2003
UNCLASSIFIED USDA Foreign Agricultural Service
GAIN Report – CH5607 Page 13 of 29
Number 4,966 5,363 6,386 7,424 8,908Revenue 355.48 412.33 474.87 555.51 632.59Employees 660,850 664,749 779,370 978,043 1,132,733Source: China Statistical Yearbook
China's catering sector witnessed revenues of more than 600 billion RMB ($ 72.5 billion USD) in 2003, up by about 15 percent compared with the year before. Eating out is very popular among Chinese consumers and has become a regular occurrence for most in recent years due to the strength of the economy. Most Chinese meals are still prepared at home, but this figure is in decline. The growth in the number of working women and dual-income households, particularly dual-income households without children, has led to an overall improvement in the disposable incomes of Chinese consumers. This has resulted in considerable growth for restaurants, cafés, and fast food and home delivery businesses across the country. With increased purchasing power, Chinese consumers have also become more sophisticated. They are spending more on eating out, demanding a wider variety of food options, and expecting high-quality food.
The most popular type of catering outlets are small, cheap, full-service restaurants. These usually provide a range of local dishes, often seasonal in nature, although economic development is reducing seasonal variations in availability of produce. However, the expanding middle class is developing a taste for fast food and quick service restaurants—many office workers buy breakfast snacks on the way to work and eat out for lunch, often more than 3 times a week. Fast food restaurants are rapidly gaining in popularity, especially amongst younger consumers. US-based Yum! Brands Inc, which owns KFC, Pizza Hut and Taco Bell, is the market leader, with 2004 revenue of 9.4 billion RMB ($ 1.1 billion USD) in its 1,130 outlets throughout the country, an increase of 31 per cent over the previous year. McDonald's also has over 600 outlets in China. However, fast-food chains must compete with local restaurants that have competitive prices. A typical Chinese take-away lunch box with rice, meat and vegetables costs about $1 USD.
The surge in the popularity of eating out along with the influx of foreign food has had a substantial impact on retail sales of processed food. Consumers often to go supermarkets in search of new foods they have tried in restaurants. The growing number of cafés selling gourmet sandwiches has contributed to an increase in supermarket sales of specialty breads and cheeses. Furthermore, manufacturers have responded to the popularity of ethnic food by creating ready-made sauces and meals and many supermarkets now have specific sections for imported Western, Japanese, Korean and other Asian foods.
Not to be overlooked is the rapid rise of institutional catering in China. The recent surge in foreign investment into China has kick-started an industry devoted to feeding hungry workers. The institutional catering industry in China is only in its first stage of development, but it is a fast growing industry.
Take for example Fu Ji Food and Catering Services Holdings Limited. Fu Ji Foods is the largest institutional service provider in Shanghai and the third largest in China after rivals Compass Group and French giant Sodexho. Many of Fu Ji Foods clients are foreign corporations setting up in China who prefer to outsource their catering. Their clients include Panasonic, Delphi, BenQ, Amkor Technology and the Suzhou Industrial Park are some of Fu Ji Foods' clients. Services include running in-house catering, on-site dining, business lunch deliveries and event-based operations.
Fu Ji Foods' major development has been the establishment of processing centers that allow for bulk purchasing. Previously, catering was organized from the company's network of restaurants, but the centers allow for a degree of consolidation that streamlines management and purchasing outlay. Currently, Fu Ji Foods has two such centers, one in Shanghai and another in Suzhou. By January 2006 they will have four more in Shenzhen, Songjiang, Kunshan and Wuxi. Each of these processing centers has a daily production capacity of approximately 100,000 meals per day.E. Challenges and Opportunities
Figure 14: Market Challenges and Opportunities
Opportunity ChallengeWorld’s largest food market; food sector growth in the double digits. China’s economy large enough to
Fragmented market; 65- 70% of people are scattered in the countryside. Poor logistics and
UNCLASSIFIED USDA Foreign Agricultural Service

GAIN Report – CH5607 Page 14 of 29
Opportunity Challengesurvive setbacks that hurt others. infrastructure hamper producers, processors,
distributors.
Food is an essential part of Chinese culture and social life.
The Chinese have very strong taste preferences. While they are willing to experiment, they are less willing to incorporate foreign tastes into their daily life without product information.
China is incomprehensibly large. Though many consumers still lack the income to purchase imports, millions join the middle class every year.
Regional differences in culture and taste can be quite stark. Promotions with limited budgets must target specific groups.
Chinese consumers spend nearly half of their disposable income on food and beverages. Higher living standards, health education drive consumers to demand better quality, more variety in new diets.
Chinese consumers are price-sensitive: imported products have difficulty competing with domestic substitutes on price.
Changes in urban living styles favor consumption of more processed food.
Basic agricultural production is not well integrated with commercial food processing sector.
Undeveloped agriculture means processors may need to import even basic ingredients to develop their food businesses.
Competition among foreign firms in China is heavy.
Imported goods are generally regarded as high in quality. Many U.S. brands, such as Budweiser, Coca- Cola, M&Ms, Snickers, Campbell’s, Heinz, Wrigley’s, and Pringles are widely recognized in China.
Imports are regarded as luxury goods: the vast majority of consumers do not believe they can afford them.
China is new to food processing, open to foreign processes and technologies.
Intellectual property issues. Successful products are quickly counterfeited and innovative processes may be stolen.
Foreign-invested companies on leading edge of industry, more likely to use imported ingredients.
Local producers catch up quickly; market life of new product may be short.
Low wage structure makes China a good base for value-added processing.
Chinese firms looking for investment, marketing, packaging, management support.
New markets for imported products are appearing in fast-growing cities throughout China.
Transportation and logistics for these cities remains difficult, and many lack the presence of a qualified distributor for imports.
Overseas fast-food chains are extremely popular, and provide exposure for foreign foods. Overseas retail chains are growing quickly, and carry more imported products than domestic counterparts.
Foreign fast-food chains source most of their products locally. Few of these chains import directly from overseas, working instead through distributors. Many charge high listing fees to promote new products.
Overseas retail chains and convenience chains are increasingly interested in establishing house brands. This is creating opportunities for bulk shipment of quality foods.
Although interested in quality for their house labels, these chains are tough negotiators, and will leave suppliers with little room for profit.
Food safety concerns favor imported products, especially for health food products including fresh fruit and baby food.
Registering food labels on imported products is a lengthy bureaucratic process. Counterfeiting has a negative impact on perceived quality and safety of foreign brands.
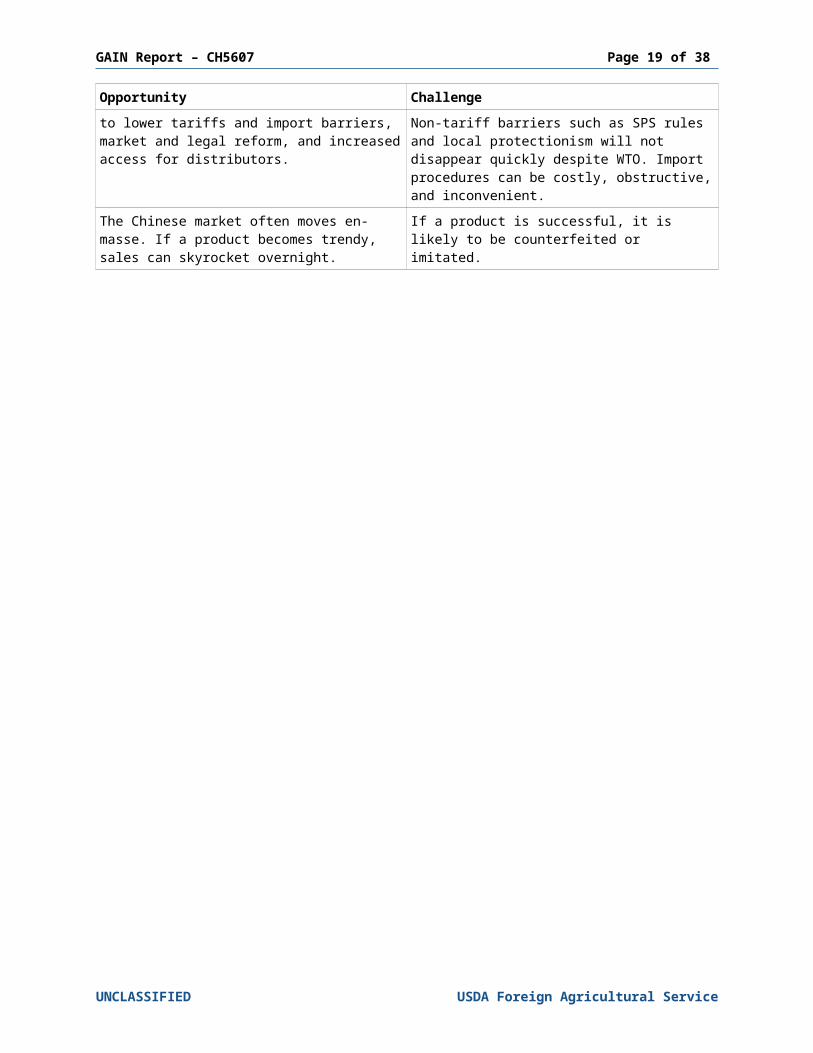
Under WTO, China’s duties on imported foods have fallen, and more products are shipped directly to China, instead of through Hong Kong. WTO entry leads to lower tariffs and import barriers, market and
Increased access for imports has resulted in greater competition from other exporting countries for products like beef, seafood and pistachios. Non-tariff barriers such as SPS rules and local
UNCLASSIFIED USDA Foreign Agricultural Service
GAIN Report – CH5607 Page 15 of 29
Opportunity Challengelegal reform, and increased access for distributors. protectionism will not disappear quickly despite
WTO. Import procedures can be costly, obstructive, and inconvenient.
The Chinese market often moves en-masse. If a product becomes trendy, sales can skyrocket overnight.
If a product is successful, it is likely to be counterfeited or imitated.
UNCLASSIFIED USDA Foreign Agricultural Service

GAIN Report – CH5607 Page 16 of 29
Section III: Road Map for Market Entry
· Economic reform and market liberalization, removal of price controls and foreign exchange controls and movement toward removal of import licensing have enhanced the possibilities for exports to China.
· Regional inconsistency is still a problem.· Although import rules are changing most still use an agent.· Logistics are modernizing but still need a lot of improvement.· Cold storage still limited.· Shrink still a problem, especially for fresh ingredients.
A. Entry Strategy
Chine's food processing market is extremely diverse and fragmented which makes it nearly impossible to suggest one model for getting US products into the market. However there are certain factors that all exporters should consider such as the tantamount value of relationships and market knowledge.
China has an ancient business culture that, like its American counterpart, values efficiency and profit. However, there are considerable differences that exporters must take into account. Personal relationships are extremely important as is respect for hierarchy. Do not be surprised if the more economic option is usurped by a long-standing relationship. It is essential to understand the Chinese concept of face and orientation towards groups and not individuals. The Chinese obsession with food extends into business practices as well. Dinners and lunches are an essential and informal way to cement relationships. On the ground work and regular visits to China are essential.
As mentioned above, the food market in China is incredibly diverse and varies between urban and rural and from region to region. One should not think of China as a single market of 1.3 billion people but rather as several markets that are loosely connected. It is essential to conduct targeted research on a specific consumer groups and ensure that there will be a market for processed food that needs your exports. Try and figure out how your product can be used in, or add innovation to, typical Chinese food products. Do not make the same mistakes that many dairy companies made in their early entries into China. As mentioned below, many of these companies misjudged the Chinese market and made, for example, crucial mistakes regarding product pricing. In fact, one of the biggest complaints from Chinese distributors about American exporters is their lack of knowledge about the Chinese market.
When looking for a distributor try to find one that not only has established wholesale and retail outlets but one that has relationships in your target market. Its one thing to accept orders for your product, its another thing to make sure your product is penetrating the market and ensuring future growth. Look for distributors that have technicians on staff and experience working with other exporters. Make sure you visit their facilities and warehouses especially if you are shipping through the cold chain and beware of any company claiming they can ship throughout China. You are better off dealing with individual distributors in different regions. Be prepared to offer technical assistance and support.
All exporters should take full advantage of ATO assistance and producer associations as they have on-the-ground experience and relationships with both Chinese and American agricultural interests. Furthermore it is highly recommended that exporters visit the various agricultural and food industry trade-shows that are held throughout China. Contact one of the three ATO offices in China for more information about the most successful trade shows.
B. Distribution
The system for importing agricultural products into China is improving but still remains a rather confusing mix of transport modes and authorities. Once an informal system dominated by Hong Kong and Chinese entrepreneurs, the distribution channel has become more open and more formal where Western ideas, capital and management have greater influence. As more foreign retailers set up operations in China, international standards of logistics have been introduced into the country. For example, fast food chains like McDonald’s and KFC have set up cold chain systems that service nearly 200 outlets throughout China.Further change and improvement is still needed to cope with increasing imports. For example, distribution accounts for up to 30 percent of a product’s cost in China, while the figure is as low as 10 percent in the
UNCLASSIFIED USDA Foreign Agricultural Service

GAIN Report – CH5607 Page 17 of 29
United States. Cold storage is still limited and shrink remains a problem for distributors. While the system is more transparent and tariffs on imported goods are dropping there still remain many roadblocks to smooth and easy importing of foreign agricultural products. In fact, over 70 percent of importers still use an import agent to help navigate the Chinese bureaucracy.
Importers have historically been limited to a small number of state-owned companies that do not make purchasing decisions but rather have official import rights, handle customs and logistics documentation, facilitate government inspection and certification processes and remit payment for the imported products. Purchase decisions are generally made by distributors who do not have import licenses but often handle import logistics, themselves or through a contracted agent, and have an established network of retail customers. However, this is scheduled to change as China, as of April 6th 2004, revamped the import-export license system. By the end of 2005, any company will be allowed to start an import-export activity in China, with no need to get an official license whatsoever. Bear in mind that this change in regulation may sound good in theory but it will no doubt take at least a few years for the change in legislation to have an effect on the practice of importing.
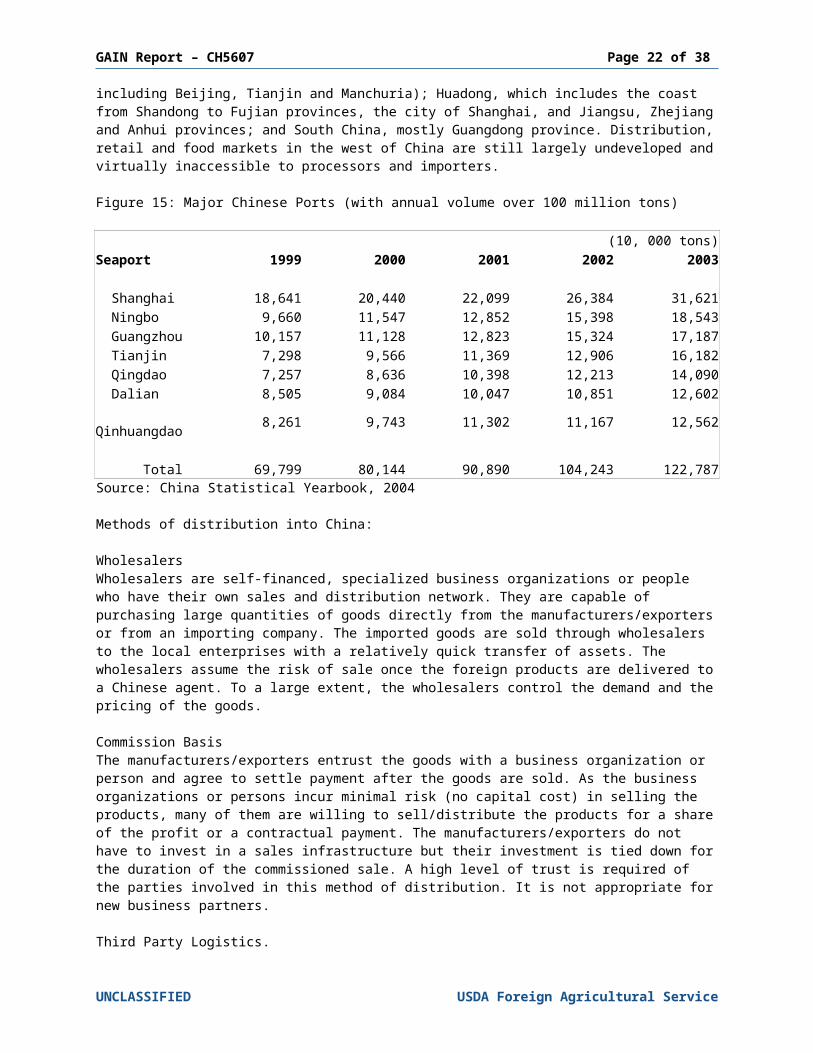
For purposes of food ingredients distribution, China is generally divided into three regions: North China (China north and east of the Yellow River, including Beijing, Tianjin and Manchuria); Huadong, which includes the coast from Shandong to Fujian provinces, the city of Shanghai, and Jiangsu, Zhejiang and Anhui provinces; and South China, mostly Guangdong province. Distribution, retail and food markets in the west of China are still largely undeveloped and virtually inaccessible to processors and importers.
Figure 15: Major Chinese Ports (with annual volume over 100 million tons)
(10, 000 tons)Seaport 1999 2000 2001 2002 2003
Shanghai 18,641 20,440 22,099 26,384 31,621 Ningbo 9,660 11,547 12,852 15,398 18,543 Guangzhou 10,157 11,128 12,823 15,324 17,187 Tianjin 7,298 9,566 11,369 12,906 16,182 Qingdao 7,257 8,636 10,398 12,213 14,090 Dalian 8,505 9,084 10,047 10,851 12,602 Qinhuangdao 8,261 9,743 11,302 11,167 12,562
Total 69,799 80,144 90,890 104,243 122,787Source: China Statistical Yearbook, 2004
Methods of distribution into China:
WholesalersWholesalers are self-financed, specialized business organizations or people who have their own sales and distribution network. They are capable of purchasing large quantities of goods directly from the manufacturers/exporters or from an importing company. The imported goods are sold through wholesalers to the local enterprises with a relatively quick transfer of assets. The wholesalers assume the risk of sale once the foreign products are delivered to a Chinese agent. To a large extent, the wholesalers control the demand and the pricing of the goods.
Commission BasisThe manufacturers/exporters entrust the goods with a business organization or person and agree to settle payment after the goods are sold. As the business organizations or persons incur minimal risk (no capital cost) in selling the products, many of them are willing to sell/distribute the products for a share of the profit or a contractual payment. The manufacturers/exporters do not have to invest in a sales infrastructure but their investment is tied down for the duration of the commissioned sale. A high level of trust is required of the parties involved in this method of distribution. It is not appropriate for new business partners.
Third Party Logistics.
UNCLASSIFIED USDA Foreign Agricultural Service

GAIN Report – CH5607 Page 18 of 29
A small group of foreign-managed companies have been established in ports and free trade zones offering customs clearance, foreign exchange conversion, bonded warehousing and shipment. This channel often requires the supplier to establish a representative office to handle sales and technical support. WTO reforms should enable third party logistics to increase the scope and geographical reach of their work.
Gray Channel The Gray Channel refers to shipments via Hong Kong through local import agents with distribution connections on the mainland. This channel has historically been cheaper than mainland channels as goods are often shipped from Hong Kong outside of official channels or using various methods to evade customs and VAT payments. Here, the US supplier has little control over their product after it reaches Hong Kong and technical support and supplies are not reliable. Furthermore, non-US products may often be “mislabeled” by Hong Kong agents as being US products.
Many importers report that importing through the same port at different times of the day will result in different tariffs and procedures as the staff has changed. For this reason some find Hong Kong a more consistent port to import through.
While authorities are attempting to gain some control of the gray channel, many estimate that 90 percent of goods destined for south China still travel through Hong Kong. Lower tariffs reduced the cost advantage of moving products through the Hong Kong “gray channel,” and more northerly ports like Shanghai and Qinhuangdao are beefing up infrastructure in hopes of grabbing some of the business. Despite the anticipation, importers and distributors are cautious about the changing shape of the industry. For example, Beijing-based fruit distributors are already importing 90 percent of their fruit directly, with only 10 percent coming via Guangdong through the gray channel. On the other hand Shanghai distributors say they are still buying about 70 percent of their fruit from wholesale markets in Guangzhou, which is the central hub of the gray channel market for imported fruit. So while lower tariffs may allow importers near port cities to displace gray channel imports, it may take a while for newer ports to displace the power of the gray channel in certain areas.
Direct DistributionThe manufacturers/exporters set up their sales outlet and sell their products directly in China rather than through a local business organization or person. The advantage is that the manufacturers/exporters can meet the consumers face to face and learn the market condition and trends. They can also reap the benefits of their sales promptly. The drawback is the need to invest in developing a sales network and the high cost of learning to operate in a foreign market This method should be made easier with China’s revamping of the import-export system.
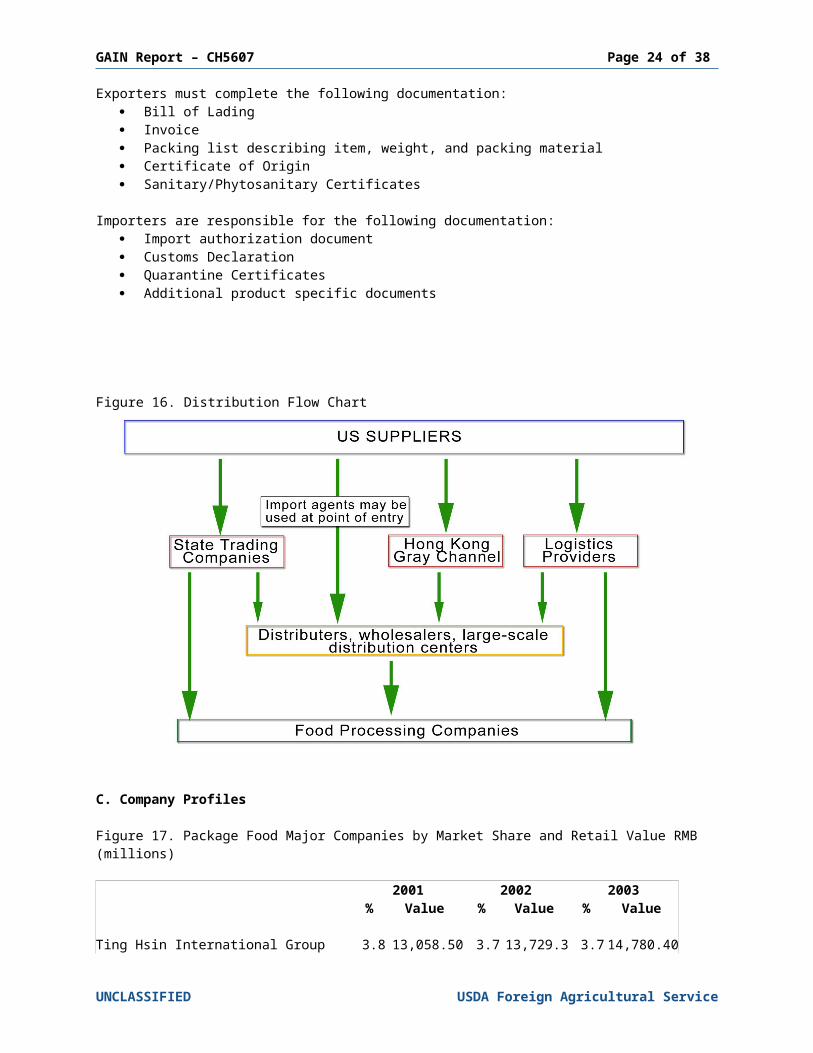
Exporters must complete the following documentation:· Bill of Lading· Invoice· Packing list describing item, weight, and packing material· Certificate of Origin· Sanitary/Phytosanitary Certificates
Importers are responsible for the following documentation:· Import authorization document· Customs Declaration· Quarantine Certificates· Additional product specific documents
Figure 16. Distribution Flow Chart
UNCLASSIFIED USDA Foreign Agricultural Service
GAIN Report – CH5607 Page 19 of 29
C. Company Profiles
Figure 17. Package Food Major Companies by Market Share and Retail Value RMB (millions)
2001 2002 2003% Value % Value % Value
Ting Hsin International Group 3.8 13,058.50 3.7 13,729.30 3.7 14,780.40Kuok Oils & Grains Pte Ltd 1.2 4,245.20 1.3 4,855.70 1.9 7,780.90Inner Mongolia Yili Industrial Group 1.1 3,831.00 1.5 5,547.50 1.8 7,147.00Shineway Group 1.2 4,303.10 1.7 6,263.80 1.7 6,872.20Nestlé SA 1.4 4,939.80 1.5 5,569.80 1.5 6,160.90Lee Kum Kee Co Ltd 1.3 4,647.40 1.4 5,114.90 1.5 5,909.60Bright Dairy & Food Co Ltd - - - - 1.4 5,478.90Foshan Haitian Flavouring & Food Ltd 1.4 4,920.50 1.3 4,837.70 1.3 5,341.10Jiangsu Yurun Food Industry Group 1.3 4,483.40 1.3 4,837.80 1.3 5,267.70Uni-President Enterprises Corp 1.2 4,068.20 1.1 4,216.10 1.2 4,644.40Hai Pa Wang International Food Group 1.1 3,826.60 1.1 3,986.80 1 4,207.60China National Cereals, Oils & Foodstuffs Imp & Exp Corp 0.8 2,727.10 0.8 3,161.40 1 4,133.00Hebei Hua Long Food Co Ltd 0.6 2,036.60 0.8 2,956.80 0.9 3,823.00Danone, Groupe 0.9 2,951.20 0.9 3,456.90 0.9 3,794.20Inner Mongolia Mengniu Group 0.3 1,010.60 0.6 2,155.20 0.9 3,765.80Unilever Group 0.8 2,706.20 0.9 3,290.50 0.9 3,583.50Shijiazhuang Sanlu Group 0.6 2,068.40 0.8 2,888.30 0.8 3,137.60Long Fong Group 0.9 3,225.00 0.9 3,294.10 0.7 2,974.90McCormick & Co Inc 0.5 1,888.00 0.7 2,495.00 0.7 2,726.50Source: Euromonitor Market DatabaseAs the above table shows, the food processing industry in China is still very fragmented, a fact confirmed by many in the industry. While retail sales of processed food in the United States is typically a two-horse
UNCLASSIFIED USDA Foreign Agricultural Service
GAIN Report – CH5607 Page 20 of 29
race between products such as Coca-Cola and Pepsi, this is clearly not the case in China. The leading retail food processing company only has a total market share of 3.7 percent while the rest in the top twenty have between .7 and 1.9 percent. In fact, 40 percent of the market is shared by over 80 companies, while a tiny portion of the market is taken by artisanal labels with the bulk being in the hands of many small-scale operations. Furthermore, as the table below demonstrates, while there is some stratification in sub-sectors with single entities having a greater share, fragmentation remains.
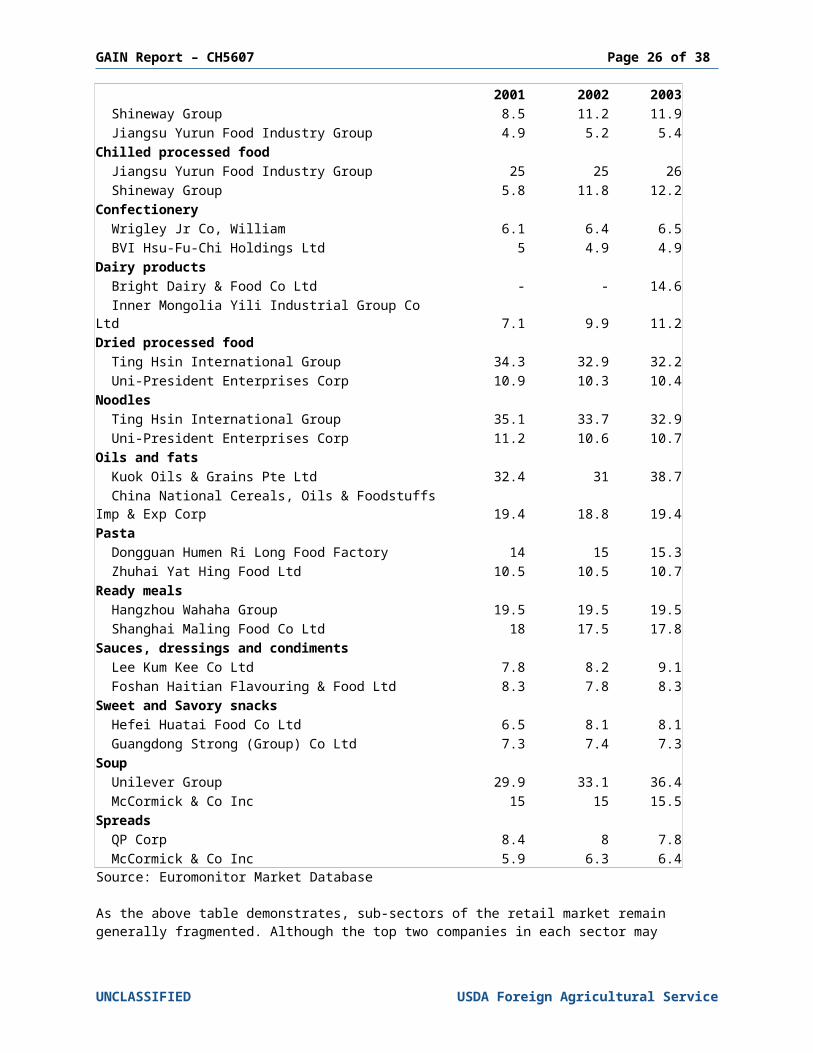
Figure 17. Processed Food Retail Sub-Sector Market Share (%)
2001 2002 2003Baby food Nestlé SA 17.2 18.5 18.3 Bristol-Myers Squibb Co 11.4 11.4 11.5Bakery products Ting Hsin International Group 1.7 1.7 1.8 Kraft Foods Inc 0.8 1.5 1.5Canned/preserved food Shineway Group 8.5 11.2 11.9 Jiangsu Yurun Food Industry Group 4.9 5.2 5.4Chilled processed food Jiangsu Yurun Food Industry Group 25 25 26 Shineway Group 5.8 11.8 12.2Confectionery Wrigley Jr Co, William 6.1 6.4 6.5 BVI Hsu-Fu-Chi Holdings Ltd 5 4.9 4.9Dairy products Bright Dairy & Food Co Ltd - - 14.6 Inner Mongolia Yili Industrial Group Co Ltd 7.1 9.9 11.2Dried processed food Ting Hsin International Group 34.3 32.9 32.2 Uni-President Enterprises Corp 10.9 10.3 10.4Noodles Ting Hsin International Group 35.1 33.7 32.9 Uni-President Enterprises Corp 11.2 10.6 10.7Oils and fats Kuok Oils & Grains Pte Ltd 32.4 31 38.7 China National Cereals, Oils & Foodstuffs Imp & Exp Corp 19.4 18.8 19.4Pasta Dongguan Humen Ri Long Food Factory 14 15 15.3 Zhuhai Yat Hing Food Ltd 10.5 10.5 10.7Ready meals Hangzhou Wahaha Group 19.5 19.5 19.5 Shanghai Maling Food Co Ltd 18 17.5 17.8Sauces, dressings and condiments Lee Kum Kee Co Ltd 7.8 8.2 9.1 Foshan Haitian Flavouring & Food Ltd 8.3 7.8 8.3Sweet and Savory snacks Hefei Huatai Food Co Ltd 6.5 8.1 8.1 Guangdong Strong (Group) Co Ltd 7.3 7.4 7.3Soup Unilever Group 29.9 33.1 36.4 McCormick & Co Inc 15 15 15.5
UNCLASSIFIED USDA Foreign Agricultural Service

GAIN Report – CH5607 Page 21 of 29
2001 2002 2003Spreads QP Corp 8.4 8 7.8 McCormick & Co Inc 5.9 6.3 6.4Source: Euromonitor Market Database
As the above table demonstrates, sub-sectors of the retail market remain generally fragmented. Although the top two companies in each sector may account for over 50 percent of the market there are usually more than 20 other enterprises in the sector with shares between .1 and 10 percent. More often than not 20 to 70 percent of the market share goes to companies too small to list. As the industry is further broken down in smaller and smaller sub-sectors, clear leaders prevail in some cases but not all. For example, while Kraft Foods may have the retail market lead in biscuits it only has a 6.2 percent share and the top 13 companies only have 24 percent of the market.
D. Sector Trends
Figure 18. Foreign Funded Food Industry, 2003
Number Sales Revenue (billion RMB) Food Processing 1,589 161.7Manufacture of Foods 1,081 85.86Manufacture of Beverages 512 67.26 Total 3,182 314.82Source: China Statistical Yearbook 2004
According to official statistics there are currently 3182 foreign funded ventures with total combined sales revenue of approximately 314.7 billion RMB ($38.14 billion USD) This represents a 22 percent increase over 2001 as foreign investment in China continues to grow and the number of state-owned ventures decreases. Foreign-funded ventures typically have more technology and size than Chinese counterparts, process for the domestic market or re-export and are more likely to use foreign ingredients to attain higher quality and consistent input. Big players in the market include, Danone, Cadbury, Cargill, Hormell, Purdue, Nestle, Kraft, Pilsbury, Yum!, Chaeron, Campbell’s, Kellogs, Smithfield, and Heinz. Foreign companies have high hopes for China, such as Heinz, which expects 20 percent-30 percent of its ketchup supply to come from China and is the market leader in baby cereal. American companies are not the only one's getting into the market though. Asian companies from Japan and Korea play a dominant role in foreign investment while EU investment continues to increase. For example, Nippon Suisan Kaisha recently built its largest plant in Qingdao to process for export to Japan.
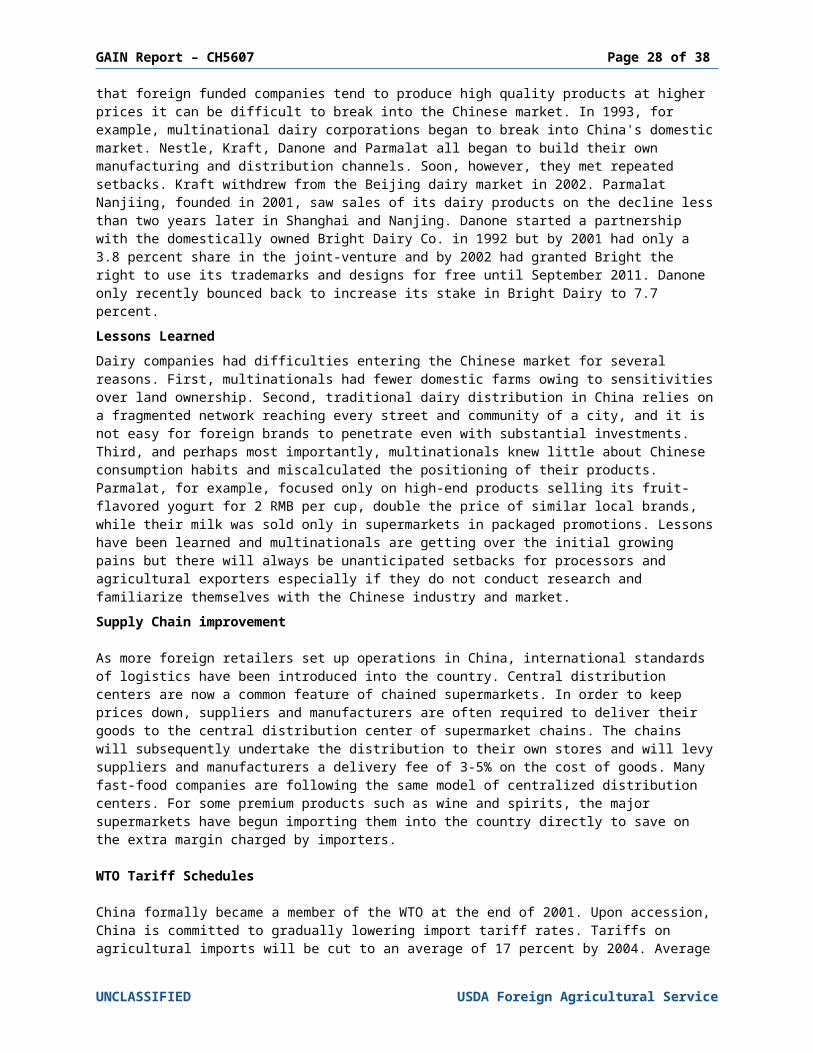
HeadachesAs the number of foreign-funded enterprises continues grow there have been, and will continue to be, certain difficulties, especially for production geared toward the domestic market. Many foreign companies are not familiar with the Chinese market or sensitive enough to the importance of price, even among the more affluent and growing middle class. While more and more consumers are looking towards quality and choice, most, probably more than 80 percent, view price as the most important factor in purchasing processed foods, while less than 20 percent view quality as the primary factor. Given that foreign funded companies tend to produce high quality products at higher prices it can be difficult to break into the Chinese market. In 1993, for example, multinational dairy corporations began to break into China's domestic market. Nestle, Kraft, Danone and Parmalat all began to build their own manufacturing and distribution channels. Soon, however, they met repeated setbacks. Kraft withdrew from the Beijing dairy market in 2002. Parmalat Nanjiing, founded in 2001, saw sales of its dairy products on the decline less than two years later in Shanghai and Nanjing. Danone started a partnership with the domestically owned Bright Dairy Co. in 1992 but by 2001 had only a 3.8 percent share in the joint-venture and by 2002 had granted Bright the right to use its trademarks and designs for free until September 2011. Danone only recently bounced back to increase its stake in Bright Dairy to 7.7 percent.
UNCLASSIFIED USDA Foreign Agricultural Service
GAIN Report – CH5607 Page 22 of 29
Lessons LearnedDairy companies had difficulties entering the Chinese market for several reasons. First, multinationals had fewer domestic farms owing to sensitivities over land ownership. Second, traditional dairy distribution in China relies on a fragmented network reaching every street and community of a city, and it is not easy for foreign brands to penetrate even with substantial investments. Third, and perhaps most importantly, multinationals knew little about Chinese consumption habits and miscalculated the positioning of their products. Parmalat, for example, focused only on high-end products selling its fruit-flavored yogurt for 2 RMB per cup, double the price of similar local brands, while their milk was sold only in supermarkets in packaged promotions. Lessons have been learned and multinationals are getting over the initial growing pains but there will always be unanticipated setbacks for processors and agricultural exporters especially if they do not conduct research and familiarize themselves with the Chinese industry and market.
Supply Chain improvement
As more foreign retailers set up operations in China, international standards of logistics have been introduced into the country. Central distribution centers are now a common feature of chained supermarkets. In order to keep prices down, suppliers and manufacturers are often required to deliver their goods to the central distribution center of supermarket chains. The chains will subsequently undertake the distribution to their own stores and will levy suppliers and manufacturers a delivery fee of 3-5% on the cost of goods. Many fast-food companies are following the same model of centralized distribution centers. For some premium products such as wine and spirits, the major supermarkets have begun importing them into the country directly to save on the extra margin charged by importers.
WTO Tariff Schedules
China formally became a member of the WTO at the end of 2001. Upon accession, China is committed to gradually lowering import tariff rates. Tariffs on agricultural imports will be cut to an average of 17 percent by 2004. Average tariffs will be even lower, at 14.5 percent, for US priority products such as wine, cheese, beef, citrus, pork and poultry. Non-tariff measures, such as most of the import licensing arrangements and import quotas, will also be abolished in phases. China has also committed to liberalizing and allowing greater foreign participation in distribution, telecommunication, finance, and professional services.
UNCLASSIFIED USDA Foreign Agricultural Service

GAIN Report – CH5607 Page 23 of 29
Section IV: Competition
A. Domestic Competition
· Meat production is expanding but not rapidly enough to keep up with demand. · Cereal output is in decline and may continue to be displaced by high-value fruits and vegetables.· Even the skyrocketing production of fruits is not likely to match domestic demand.· Milk production has skyrocketed but still lags behind demand. Technology is helping to improve
domestic output with many feeling that China will be able to satisfy most of its demand through domestic production.
As a matter of national security, the government aims to cap bulk agricultural imports at just 5 percent of all food consumed in China. Given rising incomes, population growth, shrinking arable land and trade liberalization, this target will be hard to meet. In fact, most insiders feel it is an impossible goal without a complete restructuring of the farming industry. In fact, for the first time in many years, China ran an agricultural deficit in 2003. It is expected to maintain a deficit for many years to come.
Figure 19: Domestic Agricultural Output, Yield of Farm Crops (10 000 tons)
1999 2000 2001 2002 2003 Grain 50,838.6 46,217.5 45,263.7 45,705.8 43,069.5
Cereal 45,304.1 40,522.4 39,648.2 39,798.7 37,428.7Rice 19,848.7 18,790.8 17,758.0 17,453.9 16,065.6Wheat 11,388.0 9,963.6 9,387.3 9,029.0 8,648.8Corn 12,808.6 10,600.0 11,408.8 12,130.8 1,1583
Beans 1,894.0 2,010.0 2,052.8 2,241.2 2,127.5Tubers 3,640.6 3,685.2 3,563.1 3,665.9 3,513.3
Oil-bearing Crops 2,601.2 2,954.8 2,864.9 2,897.2 2,811.0Peanuts 1,263.9 1,443.7 1,441.6 1,481.8 1,342.0Rapeseeds 1,013.2 1,138.1 1,133.1 1,055.2 1,142.0Sesame 74.3 81.1 80.4 89.5 59.3Other 249.8 291.9 209.8 270.7 267.7
Fruits 6237.6 6225.1 6658.0 6952.0 14517.4
Meat 5,820.7 6,125.4 6,333.9 6,586.5 6,932.9 Pork Beef and Mutton 4,647.4 4,838.2 5,026.0 5,227.9 5,506.3
Pork 3,890.7 4,031.4 4,184.5 4,326.6 4,518.6Beef 505.4 532.8 548.8 584.6 630.4Mutton 251.3 274.0 292.7 316.7 357.2
Milk 806.9 919.1 1,122.9 1,400.4 1,848.6Poultry Eggs 2,134.7 2,243.3 2,336.7 2,462.7 2,606.7
Total Aquatic Products 4,122.4 4,278.5 4,381.3 4,564.5 4,704.6 Seawater Products 2,471.9 2,538.7 2,571.7 2,646.3 2,685.8 Freshwater Products 1,650.5 1,739.7 1,09.6 1,918.2 2,018.8Source: China Statistical Yearbook, 2004
UNCLASSIFIED USDA Foreign Agricultural Service
GAIN Report – CH5607 Page 24 of 29
With China’s grain production no longer under heavy government control, many Chinese farmers are switching to production of more profitable high-value commodities, such as fruits and vegetables. Domestic grain production is in decline while fruit production is skyrocketing. While the sudden surge in fruit output is remarkable given that Chinese farmers are known to quickly change their crops in reaction to market prices and demand. Production of oilseeds is also in decline and the gradual rise in meat production is not likely to match demand. Furthermore, China’s domestic fishing industry has been severely strained by over fishing in recent years while aquaculture production continues to increase. China now produces over 70 percent of the world’s aquaculture products.
B. Non-US Competition
Disclaimer: The following information is based on Chinese customs data for calendar year 2004 which may not include trans-shipments of products from Hong Kong.
Beef· Currently US and Canada are out of the market owing to BSE which has allowed Australia and
New Zealand to capitalize on exports of beef and live cattle· New Zealand is currently exporting maximum capacity of live dairy cattle· BSE situation has been a boon to domestic beef industry
Total value of imports (USD): $7,109,957
The current major supply sources for imported beef are Australia, New Zealand and Brazil who have 60, 26 and 13 percent market shares respectively. Prior to BSE, the United States had 71 percent of the market in imported beef. For comparison, note that the value of imported meat in 2002 was $ 11,909,979 USD and that the value of imports from the United States was more than $8.6 million USD
PorkTotal value of imports (USD): $ 54,451,507Total value of US imports (USD): $21,455,025
The current major suppliers of pork are the United States, Canada and Denmark who have 39, 39 and 21 percent market shares respectively. In 2004 China imported 70,645 tons of pork which is 50 percent less than in 2003.
Poultry
Total value of imports (USD): $ 153,412,927Total value of US imports (USD): $62,305,284
The current major suppliers of poultry are the United States, Brazil and Argentina who have 41, 35 and 24 percent shares respectively. However, imports from Brazil have increased from 8,397 tons to more than 61,000 tons between 2003 and 2004 while imports from Argentina have gone from 4,236 tons to 42,586 tons. Imports from the United States have dropped from over 600,000 tons to just under 80,000 tons. China was closed to US poultry during much of 2004 due to Avian Influenza concerns. A new protocol was established in November of 2004 but the first US containers did not start shipping until February of 2005.
Cereals
Total value of imports (USD): $ 2,218,542,636Total value of US imports (USD): $648,505,294
The current major suppliers of cereals are Canada, the United States and Australia who have 31, 29 and 27 percent market shares. It is important to note that in 2003 the total value of cereal imports from the United States was $39,220,267 and that in 2004 the total value was $648,505,294, which represents a 1,522 percent increase. Wheat imports are expected to grow in the coming years to meet the needs of the burgeoning bakery sector and its demand for high quality wheat flour.
Dairy Products
UNCLASSIFIED USDA Foreign Agricultural Service

GAIN Report – CH5607 Page 25 of 29
· Australia and New Zealand remain the biggest non-us competitors· US still dominates imports of whey (39%)· Chinese milk labeling regulations will help US exports of milk powder
Total value of imports (USD): $447,814,136Total value of US imports (USD): $41,291,899
The current major suppliers of dairy products are New Zealand, Australia, the United States and France each with 52, 12, 9 and 9 percent market shares. It is important to note that the value of imports from both New Zealand and the United States has increased by over 30 percent between 2003 and 2004. While the value of whey imports from the Unites States is small, it has increased over 15 percent between 2003 and 2004. New Zealand dominates milk powder imports with over 70 percent of the market.
China is currently introducing new laws that will exclude any pasteurized milk from bearing the label “fresh milk.” This means that regular pasteurized milk will no longer be as distinguished from UHT milk or milk made from milk powder. This will give exporters of milk powder a potential advantage.
Seafood
· Competition from Norway, Australia, New Zealand, Canada and Russia.· Shanghai and Qingdao processing centers for re-export also use Russian fish.
Frozen Fish
Total value of imports (USD): $1,516,574,524Total value of US imports (USD): $200,844,677
Major suppliers of whole frozen fish are Russia and the United States. Russia has 45 percent of the market while the United States claims 10 percent. It is worth noting that the United States has made small but steady gains in the market of about a 2 percent increase in market share per year over the past 3 years while Russian imports have been in decline. Other suppliers such as the Netherlands, Norway and Japan have between 5 and 7 percent each.
Frozen Fish Fillets and Meat
Total value of imports (USD): $45,556,256Total value of US imports (USD): $14,389,678
For frozen fish fillets and fish meat, the United States and Vietnam are the market leaders with 34 and 16 percent shares. Both countries have taken increasing market shares over the past few years while competition from Norway and Thailand has been in decline.
CrustaceansTotal value of imports (USD): $312,035,531Total value of US imports (USD): $11,521,992
For crustaceans, the United States is not a significant supplier having only a 4 percent share of the market compared to Canada and North Korea which have 27 and 23 percent. The total value of imports in 2004 was approximately $312 million USD.
MolluscsTotal value of imports (USD): $ 332,462,177Total value of US imports (USD): $15,135,895
The current major suppliers of molluscs are North Korea, South Korea and Peru, having 39, 14, 9 percent market shares. The United States is not a significant supplier.Vegetables
UNCLASSIFIED USDA Foreign Agricultural Service
GAIN Report – CH5607 Page 26 of 29
Total value of imports (USD): $404,742,772Total value of US imports (USD): $15,623,126
The market is generally dominated by Thailand and Vietnam who have 67 and 12 percent of the market. The United States has 4 a percent share.
Oilseeds
Total value of imports (USD): $7,348,907,028Total value of US imports (USD): $3,391,296,534
China has become the world’s largest importer of oilseed products. The major suppliers of oilseeds to China are the United States, Brazil and Argentina who each have 46, 28 and 21 percent of the market. The bulk of these imports consist of soybeans. It is worth noting that United States exports to China increased 50 percent between 2003 and 2004 while Brazil's increased by 22 percent over the same period. Furthermore, Canadian exports of food grade soybeans are increasing.
Frozen Potatoes
Total value of imports (USD): $51,484,593Total value of US imports (USD): $41,559,603
The United States dominates the market for imports of frozen potatos having over 80 percent of the market in 2004 with a 30 percent increase in value over 2003. Howver, there is rising competition from domestic sources and lower-cost imports from New Zealand, Canada and the EU. The majority of these products are used in Western style fast food chains.
Fruits and Nuts Total value of imports (USD): $ 619,295,343Total value of US imports (USD): $ 99,367,747
In terms of volume, Philippines, Thailand, and Vietnam are the market leaders. Each country has about 25 percent of the market while the United States has 9 percent. In terms of value though, Thailand is the leader with nearly 30 percent of the market and the United States has the next highest share with over 16 percent, indicating that the United States is exporting more high value fruit and nut products.
As mentioned above in the section on the gray channel, a large amount of US fruit is still shipped via Hong Kong into the Pearl River Delta. Chinese customs data show the value of US fruit imports as $ 99,367,747 and the value of imports from Hong Kong as $ 2,364. On the other hand, US customs data reports that the value of exports to Hong Kong in 2004 was $191,272,287. The data appear to indicate that a substantial amount of US fruit is trans-shipped through Hong Kong and unrecorded.
Nuts
· The United States is the predominant supplier of shelled almonds to China, with 516 of the 548 tons imported in MY 2002/03.
· Although Turkey surpassed the United States in hazelnut exports to China in 2003, the United States regained top position, taking 71% of the market
· Iran outnumbers the U.S. on market share of imported pistachios in China for the past two years owing to cheaper prices. In the first three quarters of t2004, Iran exported 5,817 MT (72%) of pistachios to China, and the U.S. shipped 2,153 MT (27%).
· Vietnam is the largest supplier of cashews (in-shell and shelled) to China. · Australia remains the largest exporter of macadamia nuts, but Kenya is catching up. · There are new macadamia nut orchards in South China that should start producing nuts in the next
few years.
UNCLASSIFIED USDA Foreign Agricultural Service

GAIN Report – CH5607 Page 27 of 29
Section V: Best Product Prospects
In the upcoming years the industry will focus on the development of corn and wheat goods, dairy products, food additives and seasoning essentials.
· Developing corn and wheat goods will suit US exporters particularly well. · China’s consumers are demanding more and more fish and seafood. At the same time, domestic
seafood production is limited by new limits on fishing. · China’s entry into the World Trade Organization should provide further support for imports, with
tariffs scheduled to fall to 14 percent or less by the end of 2005 and most non-tariff measures to be eliminated completely by 2007.
· Greater urban affluence altering consumer tastes for varied foods should assure rising demand for nuts and other imported products.
· Sophisticated baked goods are becoming more popular and bakeries need high quality imported ingredients. More and more bakeries are also using innovative ingredients in traditional products such as moon cakes.
· China’s appetite for edible oil and meal continues to rise at impressive rates as the economy expands. Per capita edible oil consumption in the last two years has increased at an annual average rate of over 9 percent and with limited domestic soybean production has led to over 20mmt of soybean imports per year.
Good product prospects include: almonds, beef, cereals, cherries, corn, crustaceans, fish products, frozen potato products, blueberries, hazelnuts, infant formula, juices and concentrates, lobsters, macadamias, mollusks, oranges, pistachios, pollock, pork, poultry, prunes, raisins, salmon, scallops, soybeans, soy flour, thickeners, table grapes, and wine.
Figure 20. Best Products Prospects: Value and Growth
Item Total Value of Imports (USD) 5 Year Growth Factor
1999 2004 (2004 as multiple a of 1999)
Almonds 1,465,875 4,047,718 2.76Beef 5,734,699 7,109,957 1.24Cereals 497,047,510 2,218,542,636 4.46Cherries 19,437 2,333,765 120.07Crustaceans 122,874,032 312,035,531 2.54Blueberries 323,824 1,163,013 3.59Fish - whole (chilled, frozen) 408,383,686 1,516,574,524 3.71Fish - fillets (chilled, frozen) 14,983,029 45,556,256 3.04Frozen Potato/French Fries 3,491,266 51,484,593 14.75Grapes 23,577,944 67,546,114 2.86Hazelnuts 1,021,299 2,296,623 2.25Infant Formula 26,319,528 88,821,019 3.37Juices and Concentrates 13,394,370 61,001,369 4.55Lobsters (uncooked) 1,119 131,185 117.23Mollusks 102,221,765 332,462,177 3.25Oranges 9,460,914 36,994,455 3.91Pistachios 6,477,384 17,432,173 2.69Pollock 1 1,139,638 1,250,250 1.10Pork 2 24,348,589 54,451,507 2.24Poultry 3 409,895,603 153,412,927 0.37
UNCLASSIFIED USDA Foreign Agricultural Service
GAIN Report – CH5607 Page 28 of 29
Item Total Value of Imports (USD) 5 Year Growth FactorPrunes 4 175,396 921,664 5.25Raisins 410,408 14,666,366 35.74Salmon 2,313,383 26,612,317 11.50Scallops 3,908,402 8,022,977 2.05Soybeans 890,303,816 6,956,653,547 7.81Soy Flour 1,319,983 1,758,052 1.33Thickeners 6,350,226 12,603,501 1.98Whey Powder 57,965,310 119,744,400 2.07Wine (containers less than 2L) 6,695,561 25,246,505 3.77Wine (containers more than 2L) 27,044,673 24,435,609 0.901. 2001 high was $ 2,560,8902. 2001 high was $ 81,365,4133. 2002 peak was $ 461,774,5424. 2002 peak was $ 2,573,138Source: Chinese customs data
UNCLASSIFIED USDA Foreign Agricultural Service

GAIN Report – CH5607 Page 29 of 29
Section VI: Post Contact and Further Information
For further market information, please contact the appropriate ATO office. FAS/China has ATOs inBeijing, Shanghai and Guangzhou. E-mail and fax numbers are as follows:
ATO Beijing: [email protected], (8610) 8529-9962
ATO Shanghai: [email protected], (8621) 6279-8336
ATO Guangzhou: [email protected], (8620) 8667-0773
For policy issues, please contact the Agricultural Affairs Office in the US Embassy in Beijing at:
AAO Beijing: [email protected], (8610) 6532-2962
Further information is also available on the USDA China website at http://www.usdachina.org.
UNCLASSIFIED USDA Foreign Agricultural Service