Embed Size (px)
Citation preview

7/30/2019 2004 _ jim hogg county _ jim hogg county isd _ 2004 texas school survey of drug and alcohol use _ elementary re…
http://slidepdf.com/reader/full/2004-jim-hogg-county-jim-hogg-county-isd-2004-texas-school-survey-of 1/41

7/30/2019 2004 _ jim hogg county _ jim hogg county isd _ 2004 texas school survey of drug and alcohol use _ elementary re…
http://slidepdf.com/reader/full/2004-jim-hogg-county-jim-hogg-county-isd-2004-texas-school-survey-of 2/41
Jim Hogg CountySpring 2004
________________________________________________________________________________
Table T-1: How recently, if ever, have you used...
Ever School Not Past NeverUsed Year Year Used
________________________________________________________________________________Any tobacco product All 2.1% 1.6% 0.5% 97.9%
Grade 4 3.0% 2.0% 1.0% 97.0%Grade 5 1.1% 1.1% * % 98.9%
________________________________________________________________________________Cigarettes All 1.6% 1.0% 0.5% 98.4%
Grade 4 3.0% 2.0% 1.0% 97.0%Grade 5 * % * % * % 100.0%
________________________________________________________________________________Smokeless tobacco All 1.1% 1.1% * % 98.9%
Grade 4 1.0% 1.0% * % 99.0%Grade 5 1.2% 1.2% * % 98.8%
________________________________________________________________________________
Table T-2: Average number of times selected tobacco products were used by thosewho reported use of ..
Any tobacco product
School LifetimeYear
All 2.0 1.5Grade 4 * *Grade 5 * *
Cigarettes
School LifetimeYear
All 1.5 1.5Grade 4 * *Grade 5 * *
Smokeless tobacco
School LifetimeYear
All * *Grade 4 * *Grade 5 * *
________________________________________________________________________________
Table T-3: Average age of first use of tobacco:
Grade 4 Grade 5
Tobacco * *

7/30/2019 2004 _ jim hogg county _ jim hogg county isd _ 2004 texas school survey of drug and alcohol use _ elementary re…
http://slidepdf.com/reader/full/2004-jim-hogg-county-jim-hogg-county-isd-2004-texas-school-survey-of 3/41
Jim Hogg CountySpring 2004
________________________________________________________________________________
Table T-4: Average age of first use of tobacco by family situation:
Two Parent Family
Never 7/Under 8 9 10 11 12/Over
All 97.7% 0.8% * % * % 0.8% 0.8% * %Grade 4 97.3% 1.3% * % * % 1.3% * % * %Grade 5 98.2% * % * % * % * % 1.8% * %
Other Family Situation
Never 7/Under 8 9 10 11 12/Over
All 98.0% * % * % 2.0% * % * % * %Grade 4 100.0% * % * % * % * % * % * %Grade 5 96.6% * % * % 3.4% * % * % * %
________________________________________________________________________________
Table T-5: About how many of your close friends use ...
Any tobacco product?
NeverHeard of None Some Most
All 3.8% 84.2% 11.5% 0.6%Grade 4 4.2% 89.5% 6.3% * %Grade 5 3.4% 78.7% 16.9% 1.1%
Cigarettes?
Never
Heard of None Some Most
All 5.5% 82.9% 11.1% 0.6%Grade 4 6.5% 87.1% 6.5% * %Grade 5 4.5% 78.7% 15.7% 1.1%
Smokeless tobacco?
NeverHeard of None Some Most
All 5.9% 92.9% 1.2% * %Grade 4 5.8% 93.0% 1.2% * %Grade 5 6.0% 92.9% 1.2% * %

7/30/2019 2004 _ jim hogg county _ jim hogg county isd _ 2004 texas school survey of drug and alcohol use _ elementary re…
http://slidepdf.com/reader/full/2004-jim-hogg-county-jim-hogg-county-isd-2004-texas-school-survey-of 4/41
Jim Hogg CountySpring 2004
________________________________________________________________________________
Table T-6: Have you ever been offered ...
Any tobacco product?
NeverHeard of Yes No
All 6.5% 12.0% 81.5%Grade 4 8.4% 9.5% 82.1%Grade 5 4.5% 14.6% 80.9%
Cigarettes?
NeverHeard of Yes No
All 8.4% 11.3% 80.3%Grade 4 9.7% 9.7% 80.6%
Grade 5 7.1% 12.9% 80.0%
Smokeless tobacco?
NeverHeard of Yes No
All 9.5% 3.6% 86.9%Grade 4 12.9% 4.7% 82.4%Grade 5 6.1% 2.4% 91.5%
________________________________________________________________________________
Table T-7: How dangerous do you think it is for kids your age to use ...
Any tobacco product?
Never Very Not at All Do NotHeard of Dangerous Dangerous Dangerous Know
All 7.1% 79.8% 8.2% 1.1% 3.8%Grade 4 6.2% 79.2% 10.4% 0.0% 4.2%Grade 5 8.0% 80.5% 5.7% 2.3% 3.4%
Cigarettes?
Never Very Not at All Do NotHeard of Dangerous Dangerous Dangerous Know
All 10.6% 72.1% 11.2% 1.7% 4.5%Grade 4 12.0% 69.6% 12.0% 1.1% 5.4%Grade 5 9.2% 74.7% 10.3% 2.3% 3.4%
Smokeless tobacco?
Never Very Not at All Do NotHeard of Dangerous Dangerous Dangerous Know
All 8.0% 66.5% 13.6% 1.7% 10.2%Grade 4 7.6% 63.0% 15.2% 0.0% 14.1%Grade 5 8.3% 70.2% 11.9% 3.6% 6.0%

7/30/2019 2004 _ jim hogg county _ jim hogg county isd _ 2004 texas school survey of drug and alcohol use _ elementary re…
http://slidepdf.com/reader/full/2004-jim-hogg-county-jim-hogg-county-isd-2004-texas-school-survey-of 5/41

7/30/2019 2004 _ jim hogg county _ jim hogg county isd _ 2004 texas school survey of drug and alcohol use _ elementary re…
http://slidepdf.com/reader/full/2004-jim-hogg-county-jim-hogg-county-isd-2004-texas-school-survey-of 6/41
Jim Hogg CountySpring 2004
________________________________________________________________________________
Table A-1: How recently, if ever, have you used..
Ever School Not Past NeverUsed Year Year Used
________________________________________________________________________________Any alcohol product All 11.0% 7.1% 3.8% 89.0%
Grade 4 9.4% 6.3% 3.1% 90.6%Grade 5 12.6% 8.0% 4.6% 87.4%
________________________________________________________________________________Beer All 7.1% 3.8% 3.3% 92.9%
Grade 4 9.5% 5.3% 4.2% 90.5%Grade 5 4.6% 2.3% 2.3% 95.4%
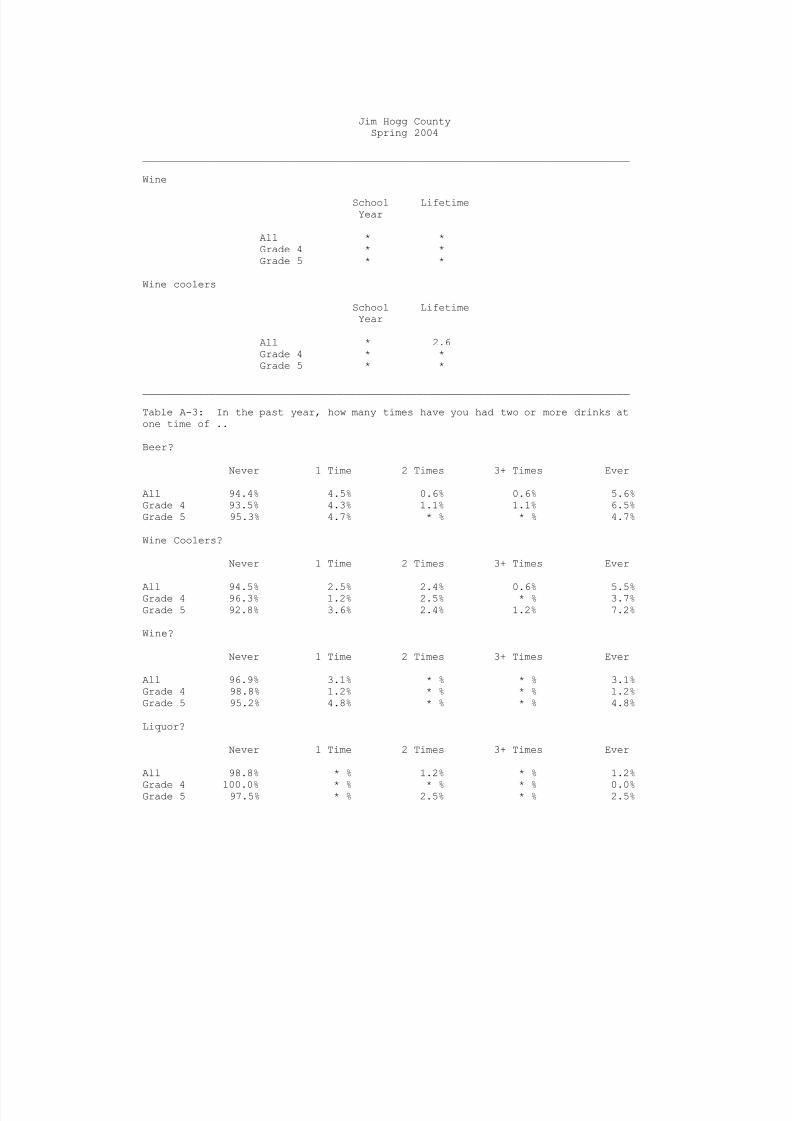
________________________________________________________________________________Wine coolers All 5.6% 3.4% 2.2% 94.4%
Grade 4 4.3% 2.1% 2.1% 95.7%Grade 5 7.0% 4.7% 2.3% 93.0%
________________________________________________________________________________Wine All 5.0% 3.4% 1.7% 95.0%
Grade 4 4.3% 2.1% 2.1% 95.7%Grade 5 5.8% 4.7% 1.2% 94.2%________________________________________________________________________________Liquor All 1.7% 1.7% * % 98.3%
Grade 4 1.1% 1.1% * % 98.9%Grade 5 2.3% 2.3% * % 97.7%
________________________________________________________________________________
Table A-2: Average number of times selected alcohol products were used by thosewho reported use of ..
Any alcohol product
School LifetimeYear
All 2.9 3.9Grade 4 3.3 6.3Grade 5 2.6 2.6
Beer
School LifetimeYear
All * *Grade 4 * *Grade 5 * *
Liquor
School LifetimeYear
All * *Grade 4 * *Grade 5 * *
7/30/2019 2004 _ jim hogg county _ jim hogg county isd _ 2004 texas school survey of drug and alcohol use _ elementary re…
http://slidepdf.com/reader/full/2004-jim-hogg-county-jim-hogg-county-isd-2004-texas-school-survey-of 7/41
Jim Hogg CountySpring 2004
________________________________________________________________________________
Wine
School LifetimeYear
All * *Grade 4 * *Grade 5 * *
Wine coolers
School LifetimeYear
All * 2.6Grade 4 * *Grade 5 * *
________________________________________________________________________________
Table A-3: In the past year, how many times have you had two or more drinks atone time of ..
Beer?
Never 1 Time 2 Times 3+ Times Ever
All 94.4% 4.5% 0.6% 0.6% 5.6%Grade 4 93.5% 4.3% 1.1% 1.1% 6.5%Grade 5 95.3% 4.7% * % * % 4.7%
Wine Coolers?
Never 1 Time 2 Times 3+ Times Ever
All 94.5% 2.5% 2.4% 0.6% 5.5%Grade 4 96.3% 1.2% 2.5% * % 3.7%Grade 5 92.8% 3.6% 2.4% 1.2% 7.2%
Wine?
Never 1 Time 2 Times 3+ Times Ever
All 96.9% 3.1% * % * % 3.1%Grade 4 98.8% 1.2% * % * % 1.2%Grade 5 95.2% 4.8% * % * % 4.8%
Liquor?
Never 1 Time 2 Times 3+ Times Ever
All 98.8% * % 1.2% * % 1.2%
Grade 4 100.0% * % * % * % 0.0%Grade 5 97.5% * % 2.5% * % 2.5%

7/30/2019 2004 _ jim hogg county _ jim hogg county isd _ 2004 texas school survey of drug and alcohol use _ elementary re…
http://slidepdf.com/reader/full/2004-jim-hogg-county-jim-hogg-county-isd-2004-texas-school-survey-of 8/41
Jim Hogg CountySpring 2004
________________________________________________________________________________
Table A-4: Average age of first use of alcohol:
Grade 4 Grade 5
Alcohol * 9.7Beer * *Wine Coolers * *Wine * *Liquor * *
________________________________________________________________________________
Table A-5: Average age of first use of alcohol by family situation:
Two Parent Family
Never 7/Under 8 9 10 11 12/Over
All 89.4% 3.0% 2.2% 1.5% 1.5% 2.3% * %Grade 4 90.8% 5.3% 2.6% 1.3% * % * % * %Grade 5 87.7% * % 1.8% 1.8% 3.5% 5.3% * %
Other Family Situation
Never 7/Under 8 9 10 11 12/Over
All 91.3% 2.1% 2.2% * % 2.2% 2.2% * %Grade 4 95.0% 5.0% * % * % * % * % * %Grade 5 88.5% * % 3.8% * % 3.8% 3.8% * %
________________________________________________________________________________
Table A-6 : Lifetime prevalence of use of alcohol by reported conduct problemsthis school year:
No Absences or Cut Sent toConduct Problems School Principal Both
Alcohol 7.2% 33.3% 16.1% 100.0%
________________________________________________________________________________
Table A-7: When you drink alcohol, do you get it from ..
Home?
Don'tDrink Yes No
All 84.7% 1.7% 13.6%Grade 4 84.8% 2.2% 13.0%
Grade 5 84.7% 1.2% 14.1%
Friends?
Don'tDrink Yes No
All 85.0% 1.2% 13.8%Grade 4 87.1% * % 12.9%Grade 5 82.9% 2.4% 14.6%

7/30/2019 2004 _ jim hogg county _ jim hogg county isd _ 2004 texas school survey of drug and alcohol use _ elementary re…
http://slidepdf.com/reader/full/2004-jim-hogg-county-jim-hogg-county-isd-2004-texas-school-survey-of 9/41
Jim Hogg CountySpring 2004
________________________________________________________________________________
Somewhere else?
Don'tDrink Yes No
All 84.9% 2.4% 12.7%Grade 4 89.2% 1.2% 9.6%Grade 5 80.7% 3.6% 15.7%
________________________________________________________________________________
Table A-8: About how many of your close friends use ..
Any alcohol product?
NeverHeard of None Some Most
All 2.8% 88.0% 8.0% 1.2%Grade 4 4.5% 89.9% 5.6% * %Grade 5 1.2% 86.0% 10.5% 2.3%
Beer?
NeverHeard of None Some Most
All 3.5% 89.5% 7.0% * %Grade 4 4.7% 90.7% 4.7% * %Grade 5 2.3% 88.4% 9.3% * %
Wine coolers?
NeverHeard of None Some Most
All 9.8% 86.1% 2.9% 1.2%Grade 4 14.0% 84.9% 1.2% * %Grade 5 5.8% 87.2% 4.7% 2.3%
Wine?
NeverHeard of None Some Most
All 5.9% 90.0% 4.1% * %Grade 4 5.9% 91.8% 2.4% * %Grade 5 5.9% 88.2% 5.9% * %
Liquor?
Never
Heard of None Some Most
All 19.3% 77.1% 3.6% * %Grade 4 31.8% 64.7% 3.5% * %Grade 5 7.1% 89.3% 3.6% * %

7/30/2019 2004 _ jim hogg county _ jim hogg county isd _ 2004 texas school survey of drug and alcohol use _ elementary re…
http://slidepdf.com/reader/full/2004-jim-hogg-county-jim-hogg-county-isd-2004-texas-school-survey-of 10/41
Jim Hogg CountySpring 2004
________________________________________________________________________________
Table A-9: Have you ever been offered ..
Any alcohol product?
NeverHeard of Yes No
All 7.9% 13.1% 79.0%Grade 4 8.8% 12.1% 79.1%Grade 5 7.1% 14.1% 78.8%
Beer?
NeverHeard of Yes No
All 6.7% 10.9% 82.4%Grade 4 7.1% 11.8% 81.2%
Grade 5 6.2% 10.0% 83.8%
Wine coolers?
NeverHeard of Yes No
All 16.9% 3.6% 79.5%Grade 4 22.9% 3.6% 73.5%Grade 5 11.0% 3.7% 85.4%
Wine?
NeverHeard of Yes No
All 8.5% 4.9% 86.6%
Grade 4 9.5% 4.8% 85.7%Grade 5 7.5% 5.0% 87.5%
Liquor?
NeverHeard of Yes No
All 20.7% 3.0% 76.3%Grade 4 27.6% 1.1% 71.3%Grade 5 13.6% 4.9% 81.5%
________________________________________________________________________________
Table A-10: How do your parents feel about kids your age drinking beer?
Don't Don't Think Don't
Like It Care It's OK Know
All 80.4% 1.7% 0.5% 17.3%Grade 4 81.5% 1.1% 1.1% 16.3%Grade 5 79.3% 2.3% * % 18.4%

7/30/2019 2004 _ jim hogg county _ jim hogg county isd _ 2004 texas school survey of drug and alcohol use _ elementary re…
http://slidepdf.com/reader/full/2004-jim-hogg-county-jim-hogg-county-isd-2004-texas-school-survey-of 11/41
Jim Hogg CountySpring 2004
________________________________________________________________________________
Table A-11: How dangerous do you think it is for kids your age to use ..
Any alcohol product?
Never Very Not at All Do NotHeard of Dangerous Dangerous Dangerous Know
All 6.2% 69.3% 17.8% 0.6% 6.1%Grade 4 4.2% 67.4% 20.0% 0.0% 8.4%Grade 5 8.3% 71.4% 15.5% 1.2% 3.6%
Beer?
Never Very Not at All Do NotHeard of Dangerous Dangerous Dangerous Know
All 5.8% 53.5% 28.7% 2.9% 9.2%Grade 4 3.3% 52.2% 33.3% 0.0% 11.1%
Grade 5 8.3% 54.8% 23.8% 6.0% 7.1%
Wine coolers?
Never Very Not at All Do NotHeard of Dangerous Dangerous Dangerous Know
All 15.2% 49.7% 21.7% 0.6% 12.8%Grade 4 15.7% 49.4% 20.2% 0.0% 14.6%Grade 5 14.6% 50.0% 23.2% 1.2% 11.0%
Wine?
Never Very Not at All Do NotHeard of Dangerous Dangerous Dangerous Know
All 8.8% 56.4% 22.1% 1.8% 11.0%
Grade 4 6.8% 55.7% 22.7% 1.1% 13.6%Grade 5 10.7% 57.1% 21.4% 2.4% 8.3%
Liquor?
Never Very Not at All Do NotHeard of Dangerous Dangerous Dangerous Know
All 15.9% 63.0% 14.2% 0.0% 7.0%Grade 4 17.4% 59.3% 11.6% 0.0% 11.6%Grade 5 14.3% 66.7% 16.7% 0.0% 2.4%

7/30/2019 2004 _ jim hogg county _ jim hogg county isd _ 2004 texas school survey of drug and alcohol use _ elementary re…
http://slidepdf.com/reader/full/2004-jim-hogg-county-jim-hogg-county-isd-2004-texas-school-survey-of 12/41
Jim Hogg CountySpring 2004
________________________________________________________________________________
Table D-1: How recently, if ever, have you used..
Ever School Not Past NeverUsed Year Year Used
________________________________________________________________________________Marijuana All * % * % * % 100.0%
Grade 4 * % * % * % 100.0%Grade 5 * % * % * % 100.0%
________________________________________________________________________________
Table D-2: Average number of times marijuana was used by those reporting usage:
School LifetimeYear
All * *Grade 4 * *
Grade 5 * *
________________________________________________________________________________
Table D-3: Average age of first use of marijuana:
Grade 4 Grade 5
Marijuana * *
________________________________________________________________________________
Table D-4: Average age of first use of marijuana by family situation:
Two Parent Family
Never 7/Under 8 9 10 11 12/Over
All 99.2% 0.8% * % * % * % * % * %Grade 4 98.6% 1.4% * % * % * % * % * %Grade 5 100.0% * % * % * % * % * % * %
Other Family Situation
Never 7/Under 8 9 10 11 12/Over
All 100.0% * % * % * % * % * % * %Grade 4 100.0% * % * % * % * % * % * %Grade 5 100.0% * % * % * % * % * % * %

7/30/2019 2004 _ jim hogg county _ jim hogg county isd _ 2004 texas school survey of drug and alcohol use _ elementary re…
http://slidepdf.com/reader/full/2004-jim-hogg-county-jim-hogg-county-isd-2004-texas-school-survey-of 13/41
Jim Hogg CountySpring 2004
________________________________________________________________________________
Table D-5 : Lifetime prevalence of use of marijuana by reported conduct
problems this school year:
No Absences or Cut Sent toConduct Problems School Principal Both
Marijuana * % * % * % * %
________________________________________________________________________________
Table D-6: About how many of your close friends use marijuana?
NeverHeard of None Some Most
All 18.7% 78.4% 2.3% 0.6%Grade 4 29.1% 67.4% 3.5% * %Grade 5 8.3% 89.3% 1.2% 1.2%
________________________________________________________________________________
Table D-7: Have you ever been offered marijuana?
NeverHeard of Yes No
All 19.6% 3.6% 76.8%Grade 4 28.2% 4.7% 67.1%Grade 5 11.0% 2.4% 86.6%
________________________________________________________________________________
Table D-8: How do your parents feel about kids your age smoking marijuana?
Don't Don't Think Don't
Like It Care It's OK Know
All 77.4% 1.1% * % 21.4%Grade 4 74.7% 1.1% * % 24.2%Grade 5 80.2% 1.2% * % 18.6%
________________________________________________________________________________
Table D-9: How dangerous do you think it is for kids your age to use marijuana?
Never Very Not at All Do NotHeard of Dangerous Dangerous Dangerous Know
All 16.0% 70.2% 7.5% 1.7% 4.6%Grade 4 21.3% 62.9% 7.9% 1.1% 6.7%Grade 5 10.6% 77.6% 7.1% 2.4% 2.4%

7/30/2019 2004 _ jim hogg county _ jim hogg county isd _ 2004 texas school survey of drug and alcohol use _ elementary re…
http://slidepdf.com/reader/full/2004-jim-hogg-county-jim-hogg-county-isd-2004-texas-school-survey-of 14/41
Jim Hogg CountySpring 2004
________________________________________________________________________________
Table I-1: How recently, if ever, have you used..
Ever School Not Past NeverUsed Year Year Used
________________________________________________________________________________Inhalants All 7.2% * % 7.2% 92.8%
Grade 4 8.5% * % 8.5% 91.5%Grade 5 5.8% * % 5.8% 94.2%
________________________________________________________________________________
Table I-2: Have you ever sniffed any of the following inhalants to get high?
Correction Fluid/Whiteout
Not Used Used
All 98.3% 1.7%
Grade 4 97.7% 2.3%Grade 5 98.8% 1.2%
Gasoline
Not Used Used
All 98.9% 1.1%Grade 4 97.8% 2.2%Grade 5 100.0% * %
Glue
Not Used Used
All 98.3% 1.7%Grade 4 97.7% 2.3%
Grade 5 98.8% 1.2%
Paint Thinner
Not Used Used
All 97.1% 2.9%Grade 4 97.7% 2.3%Grade 5 96.5% 3.5%
Spray Paint
Not Used Used
All 98.9% 1.1%Grade 4 97.8% 2.2%Grade 5 100.0% * %
Other Inhalants
Not Used Used
All 96.0% 4.0%Grade 4 95.6% 4.4%Grade 5 96.4% 3.6%

7/30/2019 2004 _ jim hogg county _ jim hogg county isd _ 2004 texas school survey of drug and alcohol use _ elementary re…
http://slidepdf.com/reader/full/2004-jim-hogg-county-jim-hogg-county-isd-2004-texas-school-survey-of 15/41
Jim Hogg CountySpring 2004
________________________________________________________________________________
Table I-3: Average number of times inhalants were used by those reporting usage:
School LifetimeYear
All * *Grade 4 * *Grade 5 * *
________________________________________________________________________________
Table I-4: Number of different kinds of inhalants used:
0 1 2-3 4+
All 93.2% 3.7% 2.6% 0.5%Grade 4 92.1% 4.0% 3.0% 1.0%Grade 5 94.4% 3.3% 2.2% * %
________________________________________________________________________________
Table I-5: Average age of first use of inhalants:
Grade 4 Grade 5
Inhalants * *
________________________________________________________________________________
Table I-6: Average age of first use of inhalants by family situation:
Two Parent Family
Never 7/Under 8 9 10 11 12/Over
All 98.4% 0.8% * % * % 0.8% * % * %Grade 4 98.6% 1.4% * % * % * % * % * %Grade 5 98.2% * % * % * % 1.8% * % * %
Other Family Situation
Never 7/Under 8 9 10 11 12/Over
All 97.7% * % * % * % * % 2.3% * %Grade 4 100.0% * % * % * % * % * % * %Grade 5 96.2% * % * % * % * % 3.8% * %
________________________________________________________________________________
Table I-7: Lifetime prevalence of use of inhalants by reported conductproblems this school year:
No Absences or Cut Sent toConduct Problems School Principal Both
Inhalants 1.7% 19.7% 5.0% 100.0%
7/30/2019 2004 _ jim hogg county _ jim hogg county isd _ 2004 texas school survey of drug and alcohol use _ elementary re…
http://slidepdf.com/reader/full/2004-jim-hogg-county-jim-hogg-county-isd-2004-texas-school-survey-of 16/41
Jim Hogg CountySpring 2004
________________________________________________________________________________
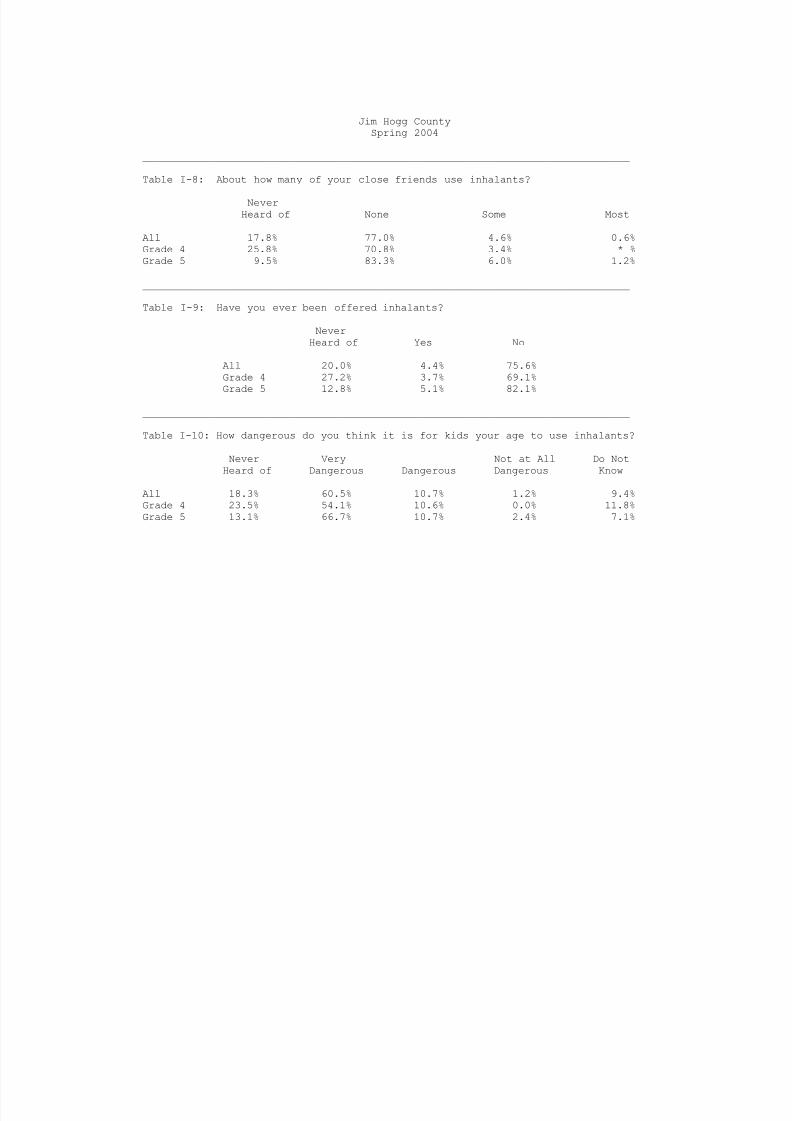
Table I-8: About how many of your close friends use inhalants?
NeverHeard of None Some Most
All 17.8% 77.0% 4.6% 0.6%Grade 4 25.8% 70.8% 3.4% * %Grade 5 9.5% 83.3% 6.0% 1.2%
________________________________________________________________________________
Table I-9: Have you ever been offered inhalants?
NeverHeard of Yes No
All 20.0% 4.4% 75.6%Grade 4 27.2% 3.7% 69.1%
Grade 5 12.8% 5.1% 82.1%
________________________________________________________________________________
Table I-10: How dangerous do you think it is for kids your age to use inhalants?
Never Very Not at All Do NotHeard of Dangerous Dangerous Dangerous Know
All 18.3% 60.5% 10.7% 1.2% 9.4%Grade 4 23.5% 54.1% 10.6% 0.0% 11.8%Grade 5 13.1% 66.7% 10.7% 2.4% 7.1%

7/30/2019 2004 _ jim hogg county _ jim hogg county isd _ 2004 texas school survey of drug and alcohol use _ elementary re…
http://slidepdf.com/reader/full/2004-jim-hogg-county-jim-hogg-county-isd-2004-texas-school-survey-of 17/41

7/30/2019 2004 _ jim hogg county _ jim hogg county isd _ 2004 texas school survey of drug and alcohol use _ elementary re…
http://slidepdf.com/reader/full/2004-jim-hogg-county-jim-hogg-county-isd-2004-texas-school-survey-of 18/41
Jim Hogg CountySpring 2004
________________________________________________________________________________
Table X-1: Since school began in the fall, have you gotten information on drugs
or alcohol from ..
An Assembly Program?
No Yes
All 16.9% 83.1%Grade 4 23.3% 76.7%Grade 5 10.1% 89.9%
Guidance Counselor?
No Yes
All 43.4% 56.6%Grade 4 54.0% 46.0%Grade 5 31.6% 68.4%
Visitor to Class?
No Yes
All 17.4% 82.6%Grade 4 21.2% 78.8%Grade 5 13.6% 86.4%
Someone Else at School?
No Yes
All 56.3% 43.7%Grade 4 62.5% 37.5%Grade 5 49.4% 50.6%
Your Teacher?
No Yes
All 30.8% 69.2%Grade 4 30.7% 69.3%Grade 5 30.9% 69.1%
Any School Source?
No Yes
All 9.2% 90.8%Grade 4 12.2% 87.8%Grade 5 5.8% 94.2%

7/30/2019 2004 _ jim hogg county _ jim hogg county isd _ 2004 texas school survey of drug and alcohol use _ elementary re…
http://slidepdf.com/reader/full/2004-jim-hogg-county-jim-hogg-county-isd-2004-texas-school-survey-of 19/41

7/30/2019 2004 _ jim hogg county _ jim hogg county isd _ 2004 texas school survey of drug and alcohol use _ elementary re…
http://slidepdf.com/reader/full/2004-jim-hogg-county-jim-hogg-county-isd-2004-texas-school-survey-of 20/41
Jim Hogg CountySpring 2004
Table B1: Prevalence and recency of use of selected substances by grade--> All Students
Ever School Not Past Never
Used Year Year Used________________________________________________________________________________Tobacco All 2.1% 1.6% 0.5% 97.9%
Grade 4 3.0% 2.0% 1.0% 97.0%Grade 5 1.1% 1.1% * % 98.9%
________________________________________________________________________________Alcohol All 11.0% 7.1% 3.8% 89.0%
Grade 4 9.4% 6.3% 3.1% 90.6%Grade 5 12.6% 8.0% 4.6% 87.4%
________________________________________________________________________________Inhalants All 7.2% * % 7.2% 92.8%
Grade 4 8.5% * % 8.5% 91.5%Grade 5 5.8% * % 5.8% 94.2%
________________________________________________________________________________Marijuana All 0.0% * % * % 100.0%
Grade 4 0.0% * % * % 100.0%Grade 5 0.0% * % * % 100.0%
________________________________________________________________________________
Table B2: Prevalence and recency of use of selected substances by grade--> Male Students
Ever School Not Past NeverUsed Year Year Used
________________________________________________________________________________Tobacco All 4.1% 3.1% 1.0% 95.9%
Grade 4 5.7% 3.8% 1.9% 94.3%Grade 5 2.3% 2.3% * % 97.7%
________________________________________________________________________________Alcohol All 12.9% 7.5% 5.4% 87.1%
Grade 4 15.4% 9.6% 5.8% 84.6%Grade 5 9.8% 4.9% 4.9% 90.2%
________________________________________________________________________________
Inhalants All 7.8% * % 7.8% 92.2%Grade 4 10.2% * % 10.2% 89.8%Grade 5 5.0% * % 5.0% 95.0%
________________________________________________________________________________Marijuana All 0.0% * % * % 100.0%
Grade 4 0.0% * % * % 100.0%Grade 5 0.0% * % * % 100.0%
________________________________________________________________________________
7/30/2019 2004 _ jim hogg county _ jim hogg county isd _ 2004 texas school survey of drug and alcohol use _ elementary re…
http://slidepdf.com/reader/full/2004-jim-hogg-county-jim-hogg-county-isd-2004-texas-school-survey-of 21/41
Jim Hogg CountySpring 2004
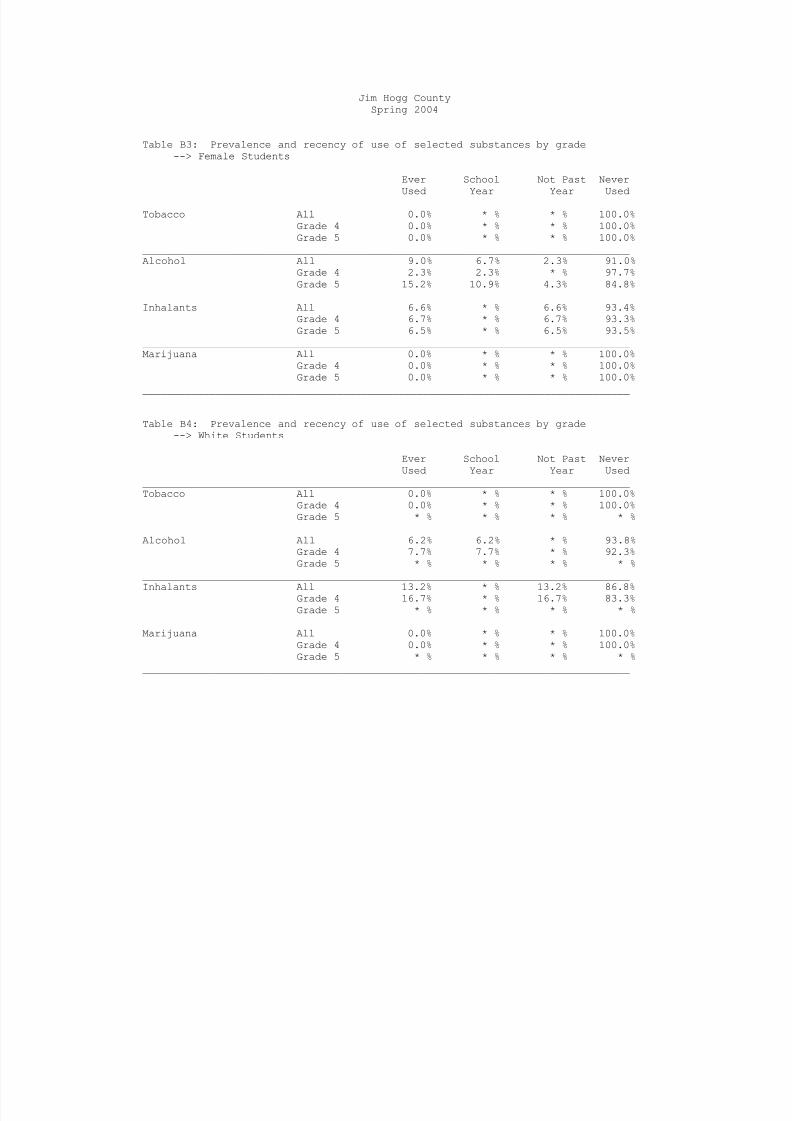
Table B3: Prevalence and recency of use of selected substances by grade--> Female Students
Ever School Not Past Never
Used Year Year Used________________________________________________________________________________Tobacco All 0.0% * % * % 100.0%
Grade 4 0.0% * % * % 100.0%Grade 5 0.0% * % * % 100.0%
________________________________________________________________________________Alcohol All 9.0% 6.7% 2.3% 91.0%
Grade 4 2.3% 2.3% * % 97.7%Grade 5 15.2% 10.9% 4.3% 84.8%
________________________________________________________________________________Inhalants All 6.6% * % 6.6% 93.4%
Grade 4 6.7% * % 6.7% 93.3%Grade 5 6.5% * % 6.5% 93.5%
________________________________________________________________________________Marijuana All 0.0% * % * % 100.0%
Grade 4 0.0% * % * % 100.0%Grade 5 0.0% * % * % 100.0%
________________________________________________________________________________
Table B4: Prevalence and recency of use of selected substances by grade--> White Students
Ever School Not Past NeverUsed Year Year Used
________________________________________________________________________________Tobacco All 0.0% * % * % 100.0%
Grade 4 0.0% * % * % 100.0%Grade 5 * % * % * % * %
________________________________________________________________________________Alcohol All 6.2% 6.2% * % 93.8%
Grade 4 7.7% 7.7% * % 92.3%Grade 5 * % * % * % * %
________________________________________________________________________________
Inhalants All 13.2% * % 13.2% 86.8%Grade 4 16.7% * % 16.7% 83.3%Grade 5 * % * % * % * %
________________________________________________________________________________Marijuana All 0.0% * % * % 100.0%
Grade 4 0.0% * % * % 100.0%Grade 5 * % * % * % * %
________________________________________________________________________________

7/30/2019 2004 _ jim hogg county _ jim hogg county isd _ 2004 texas school survey of drug and alcohol use _ elementary re…
http://slidepdf.com/reader/full/2004-jim-hogg-county-jim-hogg-county-isd-2004-texas-school-survey-of 22/41
Jim Hogg CountySpring 2004
Table B5: Prevalence and recency of use of selected substances by grade--> African/American Students
Ever School Not Past Never
Used Year Year Used________________________________________________________________________________Tobacco All * % * % * % * %
Grade 4 * % * % * % * %________________________________________________________________________________Alcohol All * % * % * % * %
Grade 4 * % * % * % * %________________________________________________________________________________Inhalants All * % * % * % * %
Grade 4 * % * % * % * %________________________________________________________________________________Marijuana All * % * % * % * %
Grade 4 * % * % * % * %________________________________________________________________________________
Table B6: Prevalence and recency of use of selected substances by grade
--> Mexican/American Students
Ever School Not Past NeverUsed Year Year Used
________________________________________________________________________________Tobacco All 2.1% 1.4% 0.7% 97.9%
Grade 4 3.4% 1.7% 1.7% 96.6%Grade 5 1.2% 1.2% * % 98.8%
________________________________________________________________________________Alcohol All 11.7% 8.0% 3.7% 88.3%
Grade 4 8.8% 7.0% 1.8% 91.2%Grade 5 13.7% 8.7% 5.0% 86.3%
________________________________________________________________________________Inhalants All 7.4% * % 7.4% 92.6%
Grade 4 8.9% * % 8.9% 91.1%Grade 5 6.3% * % 6.3% 93.7%
________________________________________________________________________________
Marijuana All 0.0% * % * % 100.0%Grade 4 0.0% * % * % 100.0%Grade 5 0.0% * % * % 100.0%
________________________________________________________________________________

7/30/2019 2004 _ jim hogg county _ jim hogg county isd _ 2004 texas school survey of drug and alcohol use _ elementary re…
http://slidepdf.com/reader/full/2004-jim-hogg-county-jim-hogg-county-isd-2004-texas-school-survey-of 23/41
Jim Hogg CountySpring 2004
Table B7: Prevalence and recency of use of selected substances by grade--> Students Reporting A and B Grades
Ever School Not Past Never
Used Year Year Used________________________________________________________________________________Tobacco All 2.7% 2.0% 0.7% 97.3%
Grade 4 3.7% 2.5% 1.2% 96.3%Grade 5 1.5% 1.5% * % 98.5%
________________________________________________________________________________Alcohol All 10.5% 9.1% 1.4% 89.5%
Grade 4 10.4% 7.8% 2.6% 89.6%Grade 5 10.6% 10.6% * % 89.4%
________________________________________________________________________________Inhalants All 7.7% * % 7.7% 92.3%
Grade 4 9.2% * % 9.2% 90.8%Grade 5 6.1% * % 6.1% 93.9%
________________________________________________________________________________Marijuana All 0.0% * % * % 100.0%
Grade 4 0.0% * % * % 100.0%Grade 5 0.0% * % * % 100.0%
________________________________________________________________________________
Table B8: Prevalence and recency of use of selected substances by grade--> Students Reporting C, D, and F Grades
Ever School Not Past NeverUsed Year Year Used
________________________________________________________________________________Tobacco All 0.0% * % * % 100.0%
Grade 4 0.0% * % * % 100.0%Grade 5 0.0% * % * % 100.0%
________________________________________________________________________________Alcohol All 11.9% * % 11.9% 88.1%
Grade 4 0.0% * % * % 100.0%Grade 5 20.0% * % 20.0% 80.0%
________________________________________________________________________________
Inhalants All 3.2% * % 3.2% 96.8%Grade 4 0.0% * % * % 100.0%Grade 5 5.3% * % 5.3% 94.7%
________________________________________________________________________________Marijuana All 0.0% * % * % 100.0%
Grade 4 0.0% * % * % 100.0%Grade 5 0.0% * % * % 100.0%
________________________________________________________________________________

7/30/2019 2004 _ jim hogg county _ jim hogg county isd _ 2004 texas school survey of drug and alcohol use _ elementary re…
http://slidepdf.com/reader/full/2004-jim-hogg-county-jim-hogg-county-isd-2004-texas-school-survey-of 24/41
Jim Hogg CountySpring 2004
Table B9: Prevalence and recency of use of selected substances by grade--> Students Living With 2 Parents
Ever School Not Past Never
Used Year Year Used________________________________________________________________________________Tobacco All 2.2% 1.5% 0.7% 97.8%
Grade 4 2.6% 1.3% 1.3% 97.4%Grade 5 1.7% 1.7% * % 98.3%
________________________________________________________________________________Alcohol All 9.8% 6.8% 3.0% 90.2%
Grade 4 10.5% 6.6% 3.9% 89.5%Grade 5 8.8% 7.0% 1.8% 91.2%
________________________________________________________________________________Inhalants All 7.6% * % 7.6% 92.4%
Grade 4 9.5% * % 9.5% 90.5%Grade 5 5.3% * % 5.3% 94.7%
________________________________________________________________________________Marijuana All 0.0% * % * % 100.0%
Grade 4 0.0% * % * % 100.0%Grade 5 0.0% * % * % 100.0%
________________________________________________________________________________
Table B10: Prevalence and recency of use of selected substances by grade--> Students Not Living With 2 Parents
Ever School Not Past NeverUsed Year Year Used
________________________________________________________________________________Tobacco All 1.9% 1.9% * % 98.1%
Grade 4 4.5% 4.5% * % 95.5%Grade 5 0.0% * % * % 100.0%
________________________________________________________________________________Alcohol All 10.5% 6.3% 4.2% 89.5%
Grade 4 5.0% 5.0% * % 95.0%Grade 5 14.3% 7.1% 7.1% 85.7%
________________________________________________________________________________
Inhalants All 6.4% * % 6.4% 93.6%Grade 4 5.0% * % 5.0% 95.0%Grade 5 7.4% * % 7.4% 92.6%
________________________________________________________________________________Marijuana All 0.0% * % * % 100.0%
Grade 4 0.0% * % * % 100.0%Grade 5 0.0% * % * % 100.0%
________________________________________________________________________________

7/30/2019 2004 _ jim hogg county _ jim hogg county isd _ 2004 texas school survey of drug and alcohol use _ elementary re…
http://slidepdf.com/reader/full/2004-jim-hogg-county-jim-hogg-county-isd-2004-texas-school-survey-of 25/41
Jim Hogg CountySpring 2004
Table B11: Prevalence and recency of use of selected substances by grade--> Students Living in Town More Than 3 Years
Ever School Not Past Never
Used Year Year Used________________________________________________________________________________Tobacco All 2.5% 1.9% 0.6% 97.5%
Grade 4 3.8% 2.5% 1.3% 96.2%Grade 5 1.2% 1.3% * % 98.8%
________________________________________________________________________________Alcohol All 11.7% 7.8% 3.9% 88.3%
Grade 4 10.5% 7.9% 2.6% 89.5%Grade 5 12.8% 7.7% 5.1% 87.2%
________________________________________________________________________________Inhalants All 6.6% * % 6.6% 93.4%
Grade 4 9.5% * % 9.5% 90.5%Grade 5 3.9% * % 3.9% 96.1%
________________________________________________________________________________Marijuana All 0.0% * % * % 100.0%
Grade 4 0.0% * % * % 100.0%Grade 5 0.0% * % * % 100.0%
________________________________________________________________________________
Table B12: Prevalence and recency of use of selected substances by grade--> Students Living in Town 3 Years or Less
Ever School Not Past NeverUsed Year Year Used
________________________________________________________________________________Tobacco All 0.0% * % * % 100.0%
Grade 4 * % * % * % * %Grade 5 * % * % * % * %
________________________________________________________________________________Alcohol All 0.0% * % * % 100.0%
Grade 4 * % * % * % * %Grade 5 * % * % * % * %
________________________________________________________________________________
Inhalants All 0.0% * % * % 100.0%Grade 4 * % * % * % * %Grade 5 * % * % * % * %
________________________________________________________________________________Marijuana All 0.0% * % * % 100.0%
Grade 4 * % * % * % * %Grade 5 * % * % * % * %
________________________________________________________________________________

7/30/2019 2004 _ jim hogg county _ jim hogg county isd _ 2004 texas school survey of drug and alcohol use _ elementary re…
http://slidepdf.com/reader/full/2004-jim-hogg-county-jim-hogg-county-isd-2004-texas-school-survey-of 26/41
Jim Hogg CountySpring 2004
The FREQ Procedure
GENDER
Q1 Frequency Percent
_______________________________Female 93.07148 48.73Male 97.92852 51.27
GRADE LEVEL
Q2 Frequency Percent________________________________Grade 4 99.43814 52.06Grade 5 91.56186 47.94
DO YOU LIVE WITH BOTH PARENTS?
Q3 Frequency Percent___________________________________
No 53.16495 28.13Yes 135.8003 71.87
Frequency Missing = 2.0347079038
AGE
Q4 Frequency Percent______________________________________8 or younger 1.017354 0.539 59.07216 30.9310 50.73643 26.5611 71.01787 37.1812 9.156186 4.79
ETHNICITY
Q5 Frequency Percent_________________________________________African/American 5.907216 3.39Asian/American 1.017354 0.58Mexican/American 142.528 81.80Native/American 1.969072 1.13Other 6.957388 3.99White 15.85103 9.10
Frequency Missing = 16.769931271
The frequencies have been weighted so that theanalysis reflects the distribution of students by grade
level in the district

7/30/2019 2004 _ jim hogg county _ jim hogg county isd _ 2004 texas school survey of drug and alcohol use _ elementary re…
http://slidepdf.com/reader/full/2004-jim-hogg-county-jim-hogg-county-isd-2004-texas-school-survey-of 27/41
Jim Hogg CountySpring 2004
The FREQ Procedure
WHAT GRADES DO YOU USUALLY GET
Q6 Frequency Percent
___________________________________Mostly A's 40.07062 21.77Mostly B's 107.8067 58.58Mostly C's 31.20979 16.96Mostly D's 3.970962 2.16Mostly F's 0.984536 0.53
Frequency Missing = 6.9573883162
LIVED IN THIS TOWN FOR MORE THAN 3 YEARS
Q7 Frequency Percent___________________________________Don't Know 19.82199 10.43No 10.00945 5.27Yes 160.184 84.30
Frequency Missing = 0.9845360825
EITHER PARENT GRADUATE FROM COLLEGE
Q8 Frequency Percent___________________________________Don't Know 84.89983 45.15No 39.15172 20.82Yes 63.99485 34.03
Frequency Missing = 2.9536082474
QUALIFY FOR A FREE/REDUCED PRICE LUNCH?
Q9 Frequency Percent___________________________________Don't Know 51.98351 28.70No 21.79107 12.03Yes 107.3473 59.27
Frequency Missing = 9.8781786942
PARENTS ATTEND PTA MEETINGS?
Q10 Frequency Percent___________________________________No 81.94622 45.25Yes 99.14278 54.75
Frequency Missing = 9.9109965636
The frequencies have been weighted so that theanalysis reflects the distribution of students by grade
level in the district

7/30/2019 2004 _ jim hogg county _ jim hogg county isd _ 2004 texas school survey of drug and alcohol use _ elementary re…
http://slidepdf.com/reader/full/2004-jim-hogg-county-jim-hogg-county-isd-2004-texas-school-survey-of 28/41
Jim Hogg CountySpring 2004
The FREQ Procedure
EVER INHALED GASOLINE TO GET HIGH?
Q11a Frequency Percent
_________________________________Not Used 178.1354 98.91Used 1.969072 1.09
Frequency Missing = 10.895532646
EVER INHALED PAINT THINNER TO GET HIGH?
Q11b Frequency Percent_________________________________Not Used 168.0931 97.10Used 5.021134 2.90
Frequency Missing = 17.885738832
EVER INHALED GLUE TO GET HIGH? Q11c Frequency Percent_________________________________Not Used 169.1105 98.26Used 2.986426 1.74
Frequency Missing = 18.903092784
EVER INHALED WHITEOUT TO GET HIGH?
Q11d Frequency Percent_________________________________Not Used 168.0931 98.25Used 2.986426 1.75
Frequency Missing = 19.920446735
EVER INHALED SPRAY PAINT TO GET HIGH?
Q11e Frequency Percent_________________________________Not Used 170.095 98.86Used 1.969072 1.14
Frequency Missing = 18.935910653
EVER USED OTHER INHALANTS TO GET HIGH?
Q11f Frequency Percent_________________________________
Not Used 166.0584 95.96Used 6.990206 4.04
Frequency Missing = 17.95137457
The frequencies have been weighted so that theanalysis reflects the distribution of students by grade
level in the district

7/30/2019 2004 _ jim hogg county _ jim hogg county isd _ 2004 texas school survey of drug and alcohol use _ elementary re…
http://slidepdf.com/reader/full/2004-jim-hogg-county-jim-hogg-county-isd-2004-texas-school-survey-of 29/41
Jim Hogg CountySpring 2004
The FREQ Procedure
CIGARETTE USE DURING LIFETIME
Q12a Frequency Percent
_______________________________________Never heard of 20.87216 11.28Never used 162.1531 87.651-2 times 1.969072 1.06
Frequency Missing = 6.0056701031
SNUFF/CHEWING TOBACCO USE IN LIFETIME
Q12b Frequency Percent_______________________________________Never heard of 21.92234 12.59Never used 151.1263 86.821-2 times 1.017354 0.58
Frequency Missing = 16.934020619
BEER USE DURING LIFETIME
Q12c Frequency Percent_______________________________________Never heard of 8.00756 4.55Never used 158.0509 89.781-2 times 7.023024 3.993-10 times 2.953608 1.68
Frequency Missing = 14.964948454
WINE COOLER USE DURING LIFETIME
Q12d Frequency Percent
_______________________________________Never heard of 23.89141 13.57Never used 143.0859 81.281-2 times 7.055842 4.013-10 times 2.00189 1.14
Frequency Missing = 14.964948454
WINE USE DURING LIFETIME
Q12e Frequency Percent_______________________________________Never heard of 12.93024 7.43Never used 153.0625 87.951-2 times 8.040378 4.62
Frequency Missing = 16.966838488
The frequencies have been weighted so that theanalysis reflects the distribution of students by grade
level in the district

7/30/2019 2004 _ jim hogg county _ jim hogg county isd _ 2004 texas school survey of drug and alcohol use _ elementary re…
http://slidepdf.com/reader/full/2004-jim-hogg-county-jim-hogg-county-isd-2004-texas-school-survey-of 30/41
Jim Hogg CountySpring 2004
The FREQ Procedure
LIQUOR USE DURING LIFETIME
Q12f Frequency Percent
_______________________________________Never heard of 50.57234 29.39Never used 120.5072 70.021-2 times 1.017354 0.59
Frequency Missing = 18.903092784
INHALANT USE DURING LIFETIME
Q12h Frequency Percent_______________________________________Never heard of 34.85258 20.25Never used 133.2077 77.401-2 times 4.036598 2.35
Frequency Missing = 18.903092784
MARIJUANA USE DURING LIFETIME
Q12i Frequency Percent_______________________________________Never heard of 46.56856 27.06Never used 125.4955 72.94
Frequency Missing = 18.935910653
CIGARETTE USE IN PAST SCHOOL YEAR
Q13a Frequency Percent_______________________________________Never heard of 19.92045 10.65
Never used 165.1067 88.291-2 times 1.969072 1.05
Frequency Missing = 4.0037800687
SNUFF/CHEWING TOBACCO USE IN PAST YEAR
Q13b Frequency Percent_______________________________________Never heard of 24.94158 14.25Never used 148.1399 84.611-2 times 2.00189 1.14
Frequency Missing = 15.916666667
The frequencies have been weighted so that theanalysis reflects the distribution of students by grade
level in the district

7/30/2019 2004 _ jim hogg county _ jim hogg county isd _ 2004 texas school survey of drug and alcohol use _ elementary re…
http://slidepdf.com/reader/full/2004-jim-hogg-county-jim-hogg-county-isd-2004-texas-school-survey-of 31/41
Jim Hogg CountySpring 2004
The FREQ Procedure
BEER USE IN PAST SCHOOL YEAR
Q13c Frequency Percent
_______________________________________Never heard of 12.01134 6.74Never used 159.1338 89.351-2 times 6.957388 3.91
Frequency Missing = 12.89742268
WINE COOLER USE IN PAST SCHOOL YEAR
Q13d Frequency Percent_______________________________________Never heard of 28.91254 16.51Never used 140.1651 80.041-2 times 6.038488 3.45
Frequency Missing = 15.883848797
WINE USE IN PAST SCHOOL YEAR
Q13e Frequency Percent_______________________________________Never heard of 19.00155 10.91Never used 149.0588 85.621-2 times 6.038488 3.47
Frequency Missing = 16.901202749
LIQUOR USE IN PAST SCHOOL YEAR
Q13f Frequency Percent_______________________________________
Never heard of 48.63608 28.42Never used 119.4899 69.821-2 times 2.034708 1.193-10 times 0.984536 0.58
Frequency Missing = 19.854810997
INHALANT USE IN PAST SCHOOL YEAR
Q13h Frequency Percent_______________________________________Never heard of 41.80997 23.88Never used 133.3062 76.12
Frequency Missing = 15.883848797
The frequencies have been weighted so that theanalysis reflects the distribution of students by grade
level in the district

7/30/2019 2004 _ jim hogg county _ jim hogg county isd _ 2004 texas school survey of drug and alcohol use _ elementary re…
http://slidepdf.com/reader/full/2004-jim-hogg-county-jim-hogg-county-isd-2004-texas-school-survey-of 32/41
Jim Hogg CountySpring 2004
The FREQ Procedure
MARIJUANA USE IN PAST SCHOOL YEAR
Q13i Frequency Percent
_______________________________________Never heard of 45.61684 26.05Never used 129.4665 73.95
Frequency Missing = 15.916666667
AGE WHEN FIRST USED CIGARETTES
Q14a Frequency Percent_________________________________________9 years old 1.017354 0.56
Never heard/used 180.006 99.44
Frequency Missing = 9.9766323024
AGE WHEN FIRST USED SNUFF/CHEW TOBACCO Q14b Frequency Percent
_________________________________________7 or younger 0.984536 0.57
10 years old 0.984536 0.5711 years old 1.017354 0.59Never heard/used 169.0777 98.26
Frequency Missing = 18.935910653
AGE WHEN FIRST USED BEER
Q14c Frequency Percent_________________________________________7 or younger 4.92268 2.83
8 years old 1.969072 1.139 years old 2.00189 1.15
10 years old 1.017354 0.5811 years old 2.034708 1.17Never heard/used 162.1531 93.14
Frequency Missing = 16.901202749
AGE WHEN FIRST USED WINE COOLERS
Q14d Frequency Percent_________________________________________7 or younger 2.00189 1.178 years old 1.017354 0.59
10 years old 2.034708 1.1911 years old 3.052062 1.78
Never heard/used 162.9735 95.26
Frequency Missing = 19.920446735
The frequencies have been weighted so that theanalysis reflects the distribution of students by grade
level in the district

7/30/2019 2004 _ jim hogg county _ jim hogg county isd _ 2004 texas school survey of drug and alcohol use _ elementary re…
http://slidepdf.com/reader/full/2004-jim-hogg-county-jim-hogg-county-isd-2004-texas-school-survey-of 33/41
Jim Hogg CountySpring 2004
The FREQ Procedure
AGE WHEN FIRST USED WINE
Q14e Frequency Percent
_________________________________________7 or younger 0.984536 0.588 years old 1.017354 0.599 years old 1.017354 0.59
10 years old 3.052062 1.78Never heard/used 165.0411 96.45
Frequency Missing = 19.887628866
AGE WHEN FIRST USED LIQUOR
Q14f Frequency Percent_________________________________________7 or younger 0.984536 0.59
11 years old 2.034708 1.21Never heard/used 165.0411 98.20
Frequency Missing = 22.939690722
AGE WHEN FIRST USED INHALANTS
Q14h Frequency Percent_________________________________________7 or younger 0.984536 0.57
10 years old 1.017354 0.5911 years old 1.017354 0.59Never heard/used 170.0622 98.26
Frequency Missing = 17.918556701
AGE WHEN FIRST USED MARIJUANA
Q14i Frequency Percent
_________________________________________7 or younger 0.984536 0.58
Never heard/used 170.095 99.42
Frequency Missing = 19.920446735
CLOSE FRIENDS USE CIGARETTES
Q15a Frequency Percent_______________________________________Never heard of 9.976632 5.48None 150.9622 82.90Some 20.15017 11.07Most 1.017354 0.56
Frequency Missing = 8.8936426117
The frequencies have been weighted so that theanalysis reflects the distribution of students by grade
level in the district

7/30/2019 2004 _ jim hogg county _ jim hogg county isd _ 2004 texas school survey of drug and alcohol use _ elementary re…
http://slidepdf.com/reader/full/2004-jim-hogg-county-jim-hogg-county-isd-2004-texas-school-survey-of 34/41
Jim Hogg CountySpring 2004
The FREQ Procedure
CLOSE FRIENDS USE SNUFF/CHEWING TOBACCO
Q15b Frequency Percent
_______________________________________Never heard of 10.00945 5.88None 158.1165 92.94Some 2.00189 1.18
Frequency Missing = 20.872164948
CLOSE FRIENDS USE BEER
Q15c Frequency Percent_______________________________________Never heard of 5.972852 3.47None 154.1127 89.52Some 12.07698 7.01
Frequency Missing = 18.837457045
CLOSE FRIENDS USE WINE COOLERS
Q15d Frequency Percent_______________________________________Never heard of 16.9012 9.82None 148.1727 86.07Some 5.053952 2.94Most 2.034708 1.18
Frequency Missing = 18.837457045
CLOSE FRIENDS USE WINE
Q15e Frequency Percent
_______________________________________Never heard of 10.00945 5.88None 153.0954 89.97Some 7.055842 4.15
Frequency Missing = 20.839347079
CLOSE FRIENDS USE LIQUOR
Q15f Frequency Percent_______________________________________Never heard of 32.6866 19.32None 130.451 77.12Some 6.00567 3.55
Frequency Missing = 21.856701031
The frequencies have been weighted so that theanalysis reflects the distribution of students by grade
level in the district

7/30/2019 2004 _ jim hogg county _ jim hogg county isd _ 2004 texas school survey of drug and alcohol use _ elementary re…
http://slidepdf.com/reader/full/2004-jim-hogg-county-jim-hogg-county-isd-2004-texas-school-survey-of 35/41
Jim Hogg CountySpring 2004
The FREQ Procedure
CLOSE FRIENDS USE INHALANTS
Q15h Frequency Percent
_______________________________________Never heard of 30.78316 17.79None 133.2405 76.98Some 8.040378 4.65Most 1.017354 0.59
Frequency Missing = 17.918556701
CLOSE FRIENDS USE MARIJUANA
Q15i Frequency Percent_______________________________________Never heard of 31.73488 18.65None 133.4046 78.41Some 3.970962 2.33Most 1.017354 0.60
Frequency Missing = 20.872164948
EVER BEEN OFFERED CIGARETTES
Q16a Frequency Percent_______________________________________Never heard of 14.96495 8.41No 143.0203 80.33Yes 20.05172 11.26
Frequency Missing = 12.963058419
EVER BEEN OFFERED SNUFF/CHEWING TOBACCO
Q16b Frequency Percent_______________________________________Never heard of 15.91667 9.52No 145.2191 86.90Yes 5.972852 3.57
Frequency Missing = 23.891408935
EVER BEEN OFFERED BEER
Q16c Frequency Percent_______________________________________Never heard of 10.99399 6.66No 136.0957 82.45Yes 17.98419 10.89
Frequency Missing = 25.926116838
The frequencies have been weighted so that theanalysis reflects the distribution of students by grade
level in the district

7/30/2019 2004 _ jim hogg county _ jim hogg county isd _ 2004 texas school survey of drug and alcohol use _ elementary re…
http://slidepdf.com/reader/full/2004-jim-hogg-county-jim-hogg-county-isd-2004-texas-school-survey-of 36/41
Jim Hogg CountySpring 2004
The FREQ Procedure
EVER BEEN OFFERED WINE COOLERS
Q16d Frequency Percent
_______________________________________Never heard of 27.86237 16.87No 131.2715 79.49Yes 6.00567 3.64
Frequency Missing = 25.8604811
EVER BEEN OFFERED WINE
Q16e Frequency Percent_______________________________________Never heard of 13.98041 8.52No 142.1014 86.60Yes 8.00756 4.88
Frequency Missing = 26.910652921
EVER BEEN OFFERED LIQUOR
Q16f Frequency Percent_______________________________________Never heard of 34.81976 20.72No 128.1866 76.27Yes 5.053952 3.01
Frequency Missing = 22.939690722
EVER BEEN OFFERED INHALANTS
Q16h Frequency Percent_______________________________________
Never heard of 31.83333 20.01No 120.2447 75.58Yes 7.023024 4.41
Frequency Missing = 31.898969072
EVER BEEN OFFERED MARIJUANA
Q16i Frequency Percent_______________________________________Never heard of 32.78505 19.62No 128.3507 76.81Yes 5.972852 3.57
Frequency Missing = 23.891408935
The frequencies have been weighted so that theanalysis reflects the distribution of students by grade
level in the district

7/30/2019 2004 _ jim hogg county _ jim hogg county isd _ 2004 texas school survey of drug and alcohol use _ elementary re…
http://slidepdf.com/reader/full/2004-jim-hogg-county-jim-hogg-county-isd-2004-texas-school-survey-of 37/41
Jim Hogg CountySpring 2004
The FREQ Procedure
IS ALCOHOL OBTAINED FROM HOME
Q17a Frequency Percent
_____________________________________Do Not Drink 150.0433 84.75No 24.02268 13.57Yes 2.986426 1.69
Frequency Missing = 13.947594502
IS ALCOHOL OBTAINED FROM FRIENDS
Q17b Frequency Percent_____________________________________Do Not Drink 142.0357 85.00No 23.03814 13.79Yes 2.034708 1.22
Frequency Missing = 23.891408935
IS ALCOHOL OBTAINED SOMEWHERE ELSE
Q17c Frequency Percent_____________________________________Do Not Drink 141.0184 84.87No 21.10189 12.70Yes 4.036598 2.43
Frequency Missing = 24.843127148
DANGEROUS FOR KIDS TO USE CIGARETTES
Q18a Frequency Percent_______________________________________
Very dangerous 129.1383 72.11Dangerous 19.98608 11.16Not at all 3.019244 1.69Don't know 7.974742 4.45Never heard of 18.96873 10.59
Frequency Missing = 11.912886598
DANGEROUS TO USE SNUFF/CHEWING TOBACCO
Q18b Frequency Percent_______________________________________Very dangerous 117.127 66.54Dangerous 23.95704 13.61Not at all 3.052062 1.73Don't know 17.88574 10.16
Never heard of 14.01323 7.96
Frequency Missing = 14.964948454
The frequencies have been weighted so that theanalysis reflects the distribution of students by grade
level in the district

7/30/2019 2004 _ jim hogg county _ jim hogg county isd _ 2004 texas school survey of drug and alcohol use _ elementary re…
http://slidepdf.com/reader/full/2004-jim-hogg-county-jim-hogg-county-isd-2004-texas-school-survey-of 38/41
Jim Hogg CountySpring 2004
The FREQ Procedure
DANGEROUS FOR KIDS TO USE BEER
Q18c Frequency Percent
_______________________________________Very dangerous 93.07148 53.47Dangerous 49.88316 28.66Not at all 5.08677 2.92Don't know 15.94948 9.16Never heard of 10.07509 5.79
Frequency Missing = 16.934020619
DANGEROUS FOR KIDS TO USE WINE COOLERS
Q18d Frequency Percent_______________________________________Very dangerous 85.0311 49.71Dangerous 37.05137 21.66Not at all 1.017354 0.59
Don't know 21.95515 12.84Never heard of 25.99175 15.20
Frequency Missing = 19.953264605
DANGEROUS FOR KIDS TO USE WINE
Q18e Frequency Percent_______________________________________Very dangerous 97.07526 56.41Dangerous 38.00309 22.08Not at all 3.019244 1.75Don't know 18.93591 11.00Never heard of 15.0634 8.75
Frequency Missing = 18.903092784
DANGEROUS FOR KIDS TO USE LIQUOR
Q18f Frequency Percent_______________________________________Very dangerous 107.1832 63.00Dangerous 24.08832 14.16Don't know 11.88007 6.98Never heard of 26.97629 15.86
Frequency Missing = 20.872164948
The frequencies have been weighted so that theanalysis reflects the distribution of students by grade
level in the district

7/30/2019 2004 _ jim hogg county _ jim hogg county isd _ 2004 texas school survey of drug and alcohol use _ elementary re…
http://slidepdf.com/reader/full/2004-jim-hogg-county-jim-hogg-county-isd-2004-texas-school-survey-of 39/41
Jim Hogg CountySpring 2004
The FREQ Procedure
DANGEROUS FOR KIDS TO USE INHALANTS
Q18h Frequency Percent
_______________________________________Very dangerous 102.2605 60.46Dangerous 18.01701 10.65Not at all 2.034708 1.20Don't know 15.94948 9.43Never heard of 30.88162 18.26
Frequency Missing = 21.856701031
DANGEROUS FOR KIDS TO USE MARIJUANA
Q18i Frequency Percent_______________________________________Very dangerous 122.2794 70.24Dangerous 12.99588 7.46Not at all 3.019244 1.73
Don't know 7.941924 4.56Never heard of 27.86237 16.00
Frequency Missing = 16.901202749
DRUG/ALCOHOL INFO FROM TEACHER
Q19a Frequency Percent___________________________________No 52.01632 30.77Yes 117.0285 69.23
Frequency Missing = 21.955154639
DRUG/ALC INFO FROM VISITOR TO CLASS
Q19b Frequency Percent___________________________________No 28.91254 17.41Yes 137.1787 82.59
Frequency Missing = 24.908762887
DRUG/ALC INFO FROM ASSEMBLY PROGRAM
Q19c Frequency Percent___________________________________No 27.82955 16.86Yes 137.2115 83.14
Frequency Missing = 25.958934708
The frequencies have been weighted so that theanalysis reflects the distribution of students by grade
level in the district

7/30/2019 2004 _ jim hogg county _ jim hogg county isd _ 2004 texas school survey of drug and alcohol use _ elementary re…
http://slidepdf.com/reader/full/2004-jim-hogg-county-jim-hogg-county-isd-2004-texas-school-survey-of 40/41
Jim Hogg CountySpring 2004
The FREQ Procedure
DRUG/ALC INFO FROM GUIDE COUNSELOR
Q19d Frequency Percent
___________________________________No 70.68969 43.37Yes 92.28385 56.63
Frequency Missing = 28.026460481
DRUG/ALC INF FROM SOMEONE ELSE AT SCHOOL
Q19e Frequency Percent___________________________________No 92.80893 56.26Yes 72.16649 43.74
Frequency Missing = 26.024570447
BEER, TWO OR MORE AT ONE TIME Q20a Frequency Percent
_________________________________Never 168.0603 94.401 time 8.00756 4.502 times 0.984536 0.553+ times 0.984536 0.55
Frequency Missing = 12.963058419
WINE COOLERS, TWO OR MORE AT ONE TIME
Q20b Frequency Percent_________________________________Never 155.1301 94.48
1 time 4.036598 2.462 times 4.00378 2.443+ times 1.017354 0.62
Frequency Missing = 26.812199313
WINE, TWO OR MORE AT ONE TIME
Q20c Frequency Percent_________________________________Never 160.1184 96.941 time 5.053952 3.06
Frequency Missing = 25.82766323
The frequencies have been weighted so that theanalysis reflects the distribution of students by grade
level in the district

7/30/2019 2004 _ jim hogg county _ jim hogg county isd _ 2004 texas school survey of drug and alcohol use _ elementary re…
http://slidepdf.com/reader/full/2004-jim-hogg-county-jim-hogg-county-isd-2004-texas-school-survey-of 41/41
Jim Hogg CountySpring 2004
The FREQ Procedure
LIQUOR, TWO OR MORE AT ONE TIME
Q20d Frequency Percent
_________________________________Never 163.072 98.772 times 2.034708 1.23
Frequency Missing = 25.893298969
MISSED SCHOOL WITHOUT PARENT'S CONSENT
Q21 Frequency Percent___________________________________No 178.9887 96.75Yes 6.00567 3.25
Frequency Missing = 6.0056701031
SENT TO PRINCIPAL/DEAN SINCE SEPTEMBER Q22 Frequency Percent___________________________________No 136.8177 74.35Yes 47.1921 25.65
Frequency Missing = 6.9902061856
PARENTS FEEL ABOUT KIDS DRINKING BEER
Q23 Frequency Percent________________________________________Don't like it 144.0376 80.43Don't care 3.019244 1.69Think it's O.K. 0.984536 0.55
Don't know 31.0457 17.34
Frequency Missing = 11.912886598
PARENTS FEEL ABOUT KIDS USING MARIJUANA
Q24 Frequency Percent________________________________________Don't like it 137.1459 77.45Don't care 2.00189 1.13Don't know 37.93746 21.42
Frequency Missing = 13.914776632
The frequencies have been weighted so that theanalysis reflects the distribution of students by grade