Embed Size (px)
Citation preview

Crime in New York State
2013 Final Data This report and the attached appendices provide the most recent information available on the number of Index crimes and rates per 100,000 population for each county in New York State. County population data are provided every year by the FBI based on U.S. Census estimates and are used to calculate crime rates. Crime counts are based on official crime reports submitted to DCJS through the Uni-form Crime Reporting (UCR) and Incident Based Reporting (IBR) programs. Index crimes include the violent crimes of murder, forcible rape, robbery and aggravated assault, and the property crimes of burglary, larceny and motor vehicle theft. Because of their seriousness and frequency, these crimes are used by DCJS and the FBI as indicators of overall crime trends.
The summary includes information on crimes re-ported in New York State for the last 10 years. These figures include all reports received by DCJS as of November 4, 2014. They differ slightly from those published by the FBI; the FBI reports include estimations for agencies with incomplete reporting, and exclude data submitted after FBI deadlines.
Detailed information on crime data for each report-ing agency from 2009 through 2013 is available on the DCJS website: www.criminaljustice.ny.gov/crimnet/ojsa/stats.htm
New York State has experienced significant declines in both the crime rate—or the number of Index crimes per capita—and the crime volume—the total number of Index crimes reported over the past decade.
Over the past 10 years, the overall rate of Index crimes per 100,000 residents declined 15%. The rate of violent crimes (murder, rape, robbery and aggravated assault) fell 11% and property crimes (burglary, larceny and motor vehicle theft) were down 16%. The largest reductions in crime rates were reported for motor vehi-cle theft, murder and forcible rape (see Appendix 1 for a statewide, annualized comparison of crime rates).
Change in Crime Rates: 2004 vs. 2013
Office of Justice Research and Performance Theresa E. Salo, Deputy Commissioner
Division of Criminal Justice Services
New York State Crime Report
Andrew M. Cuomo Michael C. Green
Governor Executive Deputy Commissioner
www.criminaljustice.ny.gov November 2014
-15%
-11%
-30% -28%
-20%
-3%
-16%-21%
-9%
-63%-70%
-60%
-50%
-40%
-30%
-20%
-10%
0%
Percentage Change in Crime Rates2004 vs. 2013

November 2014
Office of Justice Research & Performance 2 NYS Division of Criminal Justice Services
While New York State’s crime rate has de-creased over the past 10 years, New York has also reported a significant reduction in the ac-tual number of crimes reported. The number of Index crimes reached the lowest levels ever recorded statewide in 2013, when there were 68,297 fewer crimes reported than in 2004. The state’s population increased by approxi-mately 270,000 residents during the same time period.
Change in Crime Volume: 2004 vs. 2013
Trends in Regional Crime: 2004 to 2013
Counties in the state’s two regions—New York City (five counties) and non-New York City (57 counties)—experienced similar de-clines in Index crime over the last 10 years.
The number of Index crimes reported in New York City fell 14.3% between 2004 and 2013, while the rate of decline was 13.1% in the rest of the state. The counties outside of New York City accounted for 55% of the re-ported crime statewide, and almost 60% of the property crime reported in 2013.
The decline in violent crime over the last 10 years was nearly three times greater outside New York City (-15.8%) than in New York City (-5.9%).
Counties outside New York City have re-ported a steady decline in violent crime since 2006. New York City reported increases in violent crime between 2009 and 2012 but re-ported a slight decline in 2013. New York City now accounts for 68.5% of the violent crime reported in New York State (See Appendix 2).
500,651
432,354
400,000
450,000
500,000
550,000
2004 2005 2006 2007 2008 2009 2010 2011 2012 2013
New York State Index Crime Counts
-13.6%
226,876
194,355
273,775
237,998
150,000
200,000
250,000
300,000
2004 2005 2006 2007 2008 2009 2010 2011 2012 2013
Regional Trends in Index Crime
New York City Non-New York City
-14.3%
-13.1%
55,688
52,38428,587
24,067
0
20,000
40,000
60,000
80,000
2004 2005 2006 2007 2008 2009 2010 2011 2012 2013
Regional Trends in Violent Crime
New York City Non-New York City
-5.9%
-15.8%
Office of Justice Research & Performance 3 NYS Division of Criminal Justice Services
November 2014
Statewide Crime Trends: 2012 vs. 2013
The final 2013 crime data show that crime volume in New York State declined 4.4% between 2012 and 2013.
In 2013, New York State reported a decline in all seven Index crime categories as compared to 2012.
Violent crime declined 3.6% while property crime declined 4.6%. The largest declines were reported in burglary (-12.4%) and motor vehicle theft (-10.1%).
The total number of Index crimes in New York City remained mostly unchanged between 2012 and 2013. There were slight increases in aggravated assault (+1.8%) and larceny (+1.7%) during the period. In the violent crime catego-ry, murders dropped significantly (-20%) and there were large decreases in two property crime categories: burglary (-10.9%) and motor vehicle theft (-9.2%).
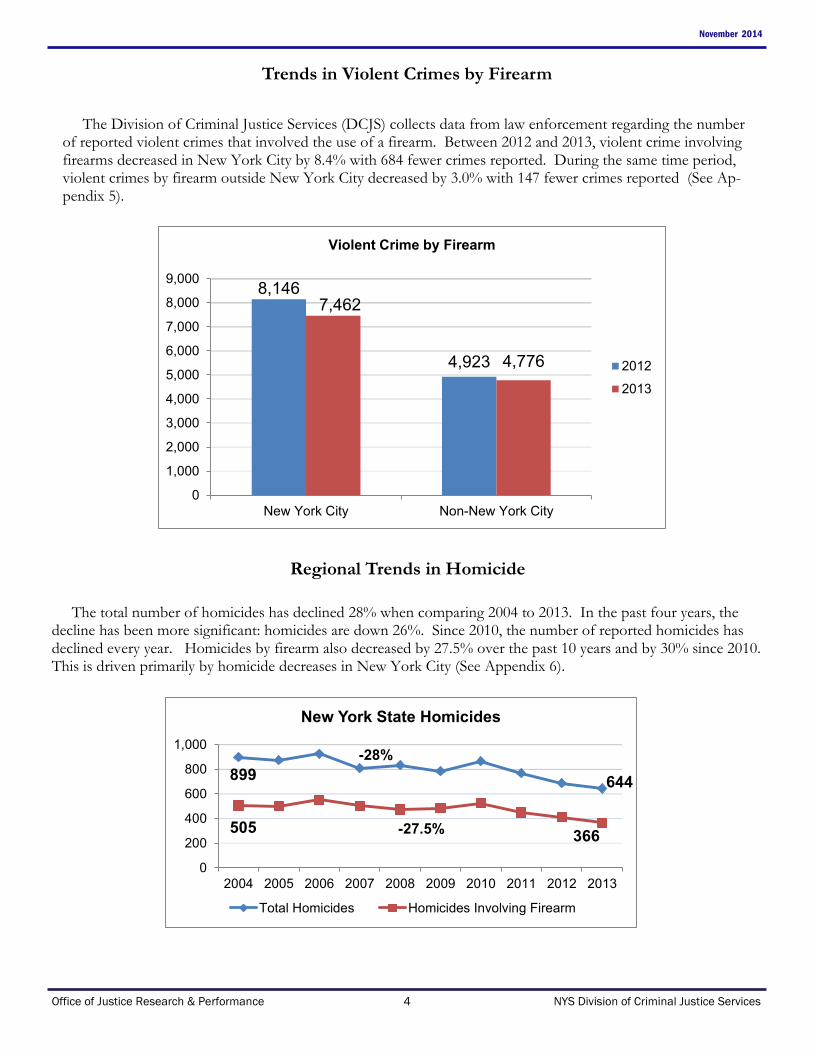
Reported crime outside of New York City decreased by 7.2% between 2012 and 2013. Decreases were reported in all crime categories except for murder, which increased by 14.9% during the period. Crime counts for 2012 and 2013 are presented for each county in Appen-dix 3; county crime rates for 2013 are detailed in Appendix 4.
-4.4%-3.6%
-6.4%
-8.0%
-4.8%
-2.6%-4.6%
-12.4%
-2.5%
-10.1%
-15%
-10%
-5%
0%
5%
Percentage Change in Crime Volume2012 vs. 2013
NEW YORK STATE
-0.7% -1.1%
-20.0%
-4.3% -5.1%
1.8%
-0.6%
-10.9%
1.7%
-9.2%
-25%
-20%
-15%
-10%
-5%
0%
5%
10%
NEW YORK CITY
-7.2%-8.5%
14.9%
-10.6%
-4.2%
-11.0%
-7.0%
-13.0%
-5.3%
-10.9%
-20%
-15%
-10%
-5%
0%
5%
10%
15%
20%
NON-NEW YORK CITY
November 2014
Office of Justice Research & Performance 4 NYS Division of Criminal Justice Services
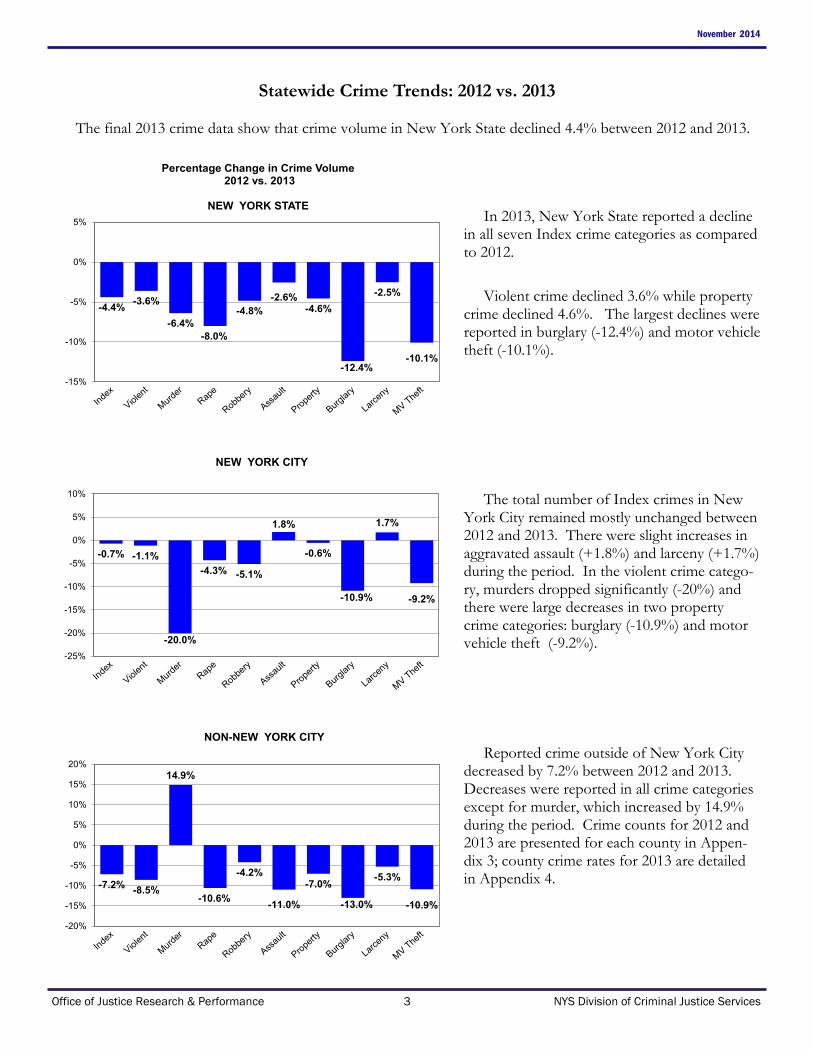
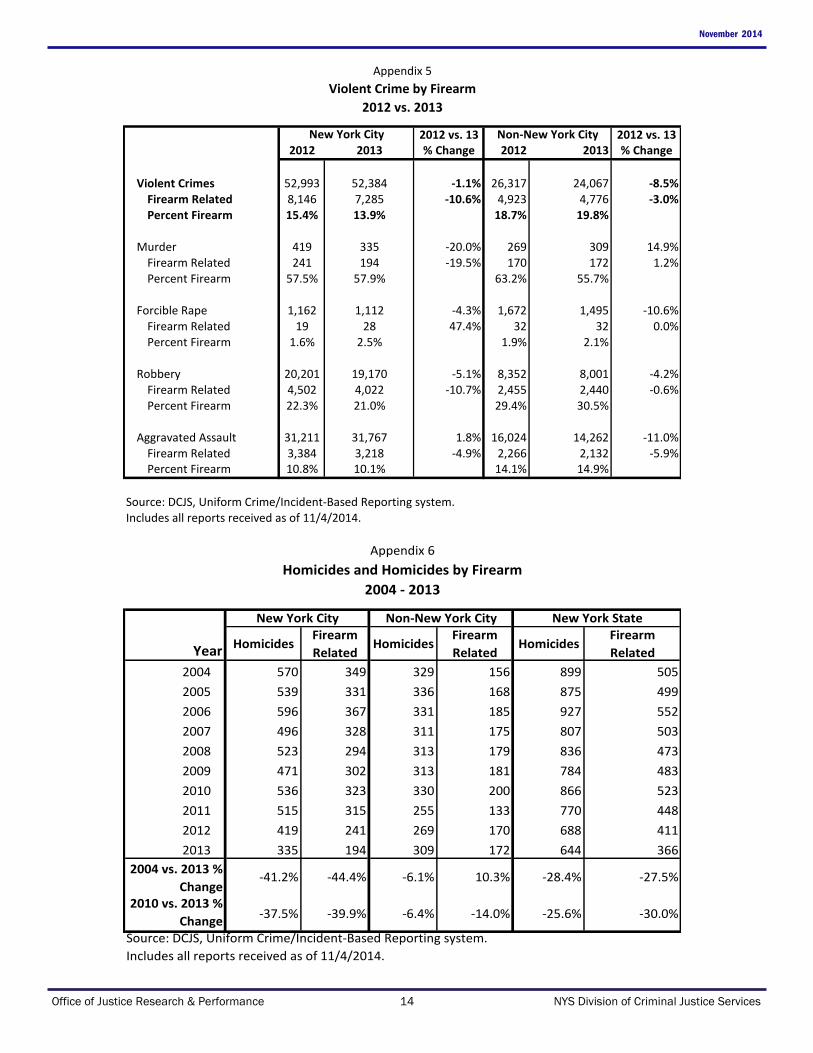
Trends in Violent Crimes by Firearm
The Division of Criminal Justice Services (DCJS) collects data from law enforcement regarding the number of reported violent crimes that involved the use of a firearm. Between 2012 and 2013, violent crime involving firearms decreased in New York City by 8.4% with 684 fewer crimes reported. During the same time period, violent crimes by firearm outside New York City decreased by 3.0% with 147 fewer crimes reported (See Ap-pendix 5).
Regional Trends in Homicide
The total number of homicides has declined 28% when comparing 2004 to 2013. In the past four years, the decline has been more significant: homicides are down 26%. Since 2010, the number of reported homicides has declined every year. Homicides by firearm also decreased by 27.5% over the past 10 years and by 30% since 2010. This is driven primarily by homicide decreases in New York City (See Appendix 6).
8,146
4,923
7,462
4,776
0
1,000
2,000
3,000
4,000
5,000
6,000
7,000
8,000
9,000
New York City Non-New York City
Violent Crime by Firearm
2012
2013
899 644
505366
0
200
400
600
800
1,000
2004 2005 2006 2007 2008 2009 2010 2011 2012 2013
New York State Homicides
Total Homicides Homicides Involving Firearm
-27.5%
-28%

Office of Justice Research & Performance 5 NYS Division of Criminal Justice Services
November 2014
Since 2004, the total number of homicides in New York City has decreased by 41%. In 2013, the percentage of homicides by firearm in the region was 58%, which was relatively consistent when compared to prior years over the past decade. Since 2010, the number of total homicides and homicides by firearm have declined sharp-ly: 38% and 40% respectively.
There was little change in the total number of homicides outside of New York City between 2004 and 2010. A sharp decline occurred between 2010 and 2011, followed by a two-year increase. The percentage of homicides involving firearms has been relatively consistent, between 50% and 60%, during the 10-year period.
.
Regional Trends in Homicide (Continued)
570
335
349
1940
200
400
600
800
2004 2005 2006 2007 2008 2009 2010 2011 2012 2013
New York City Homicides
Total Homicides Homicides Involving Firearm
-44%
-41%
329 309
156172
0
100
200
300
400
2004 2005 2006 2007 2008 2009 2010 2011 2012 2013
Non-New York City Homicides
Total Homicides Homicides Involving Firearm
-6%
+10%

November 2014
Office of Justice Research & Performance 6 NYS Division of Criminal Justice Services
NEW YORK CITY 2004 2005 2006 2007 2008 2009 2010 2011 2012 2013 2012-13 2004-13
Index Crime 226,876 217,132 205,522 199,941 198,419 188,357 188,104 191,666 195,753 194,355 -0.7% -14.3% Violent Crime 55,688 54,623 52,086 50,453 48,430 46,357 48,489 51,209 52,993 52,384 -1.1% -5.9% Murder 570 539 596 496 523 471 536 515 419 335 -20.0% -41.2% Forcible Rape 1,428 1,412 1,071 875 890 832 1,036 1,092 1,162 1,112 -4.3% -22.1% Robbery 24,373 24,722 23,511 21,787 22,186 18,597 19,608 19,773 20,201 19,170 -5.1% -21.3% Agg. Assault 29,317 27,950 26,908 27,295 24,831 26,457 27,309 29,829 31,211 31,767 1.8% 8.4% Property Crime 171,188 162,509 153,436 149,488 149,989 142,000 139,615 140,457 142,760 141,971 -0.6% -17.1% Burglary 26,100 23,210 22,137 20,914 19,867 18,780 17,926 18,159 18,635 16,606 -10.9% -36.4% Larceny 124,016 120,918 115,363 115,318 117,682 112,526 111,370 112,864 115,935 117,931 1.7% -4.9% MV Theft 21,072 18,381 15,936 13,256 12,440 10,694 10,319 9,434 8,190 7,434 -9.2% -64.7%
NON-NEW YORK CITY 2004 2005 2006 2007 2008 2009 2010 2011 2012 2013 2012-13 2004-13
Index Crime 273,775 272,267 272,345 261,050 266,268 261,615 262,308 257,165 256,474 237,998 -7.2% -13.1% Violent Crime 28,587 30,902 31,730 29,364 29,009 28,476 27,342 26,249 26,317 24,067 -8.5% -15.8% Murder 329 336 331 311 313 313 330 255 269 309 14.9% -6.1% Forcible Rape 2,133 2,203 2,094 2,049 1,897 1,735 1,729 1,680 1,672 1,495 -10.6% -29.9% Robbery 8,977 10,282 10,870 9,249 9,557 9,467 8,796 8,576 8,352 8,001 -4.2% -10.9% Agg. Assault 17,148 18,081 18,435 17,755 17,242 16,961 16,487 15,738 16,024 14,262 -11.0% -16.8% Property Crime 245,188 241,365 240,615 231,686 237,259 233,139 234,966 230,916 230,157 213,931 -7.0% -12.7% Burglary 43,829 44,592 46,350 43,919 45,646 43,898 46,762 46,909 45,430 39,514 -13.0% -9.8% Larceny 181,651 179,619 178,113 173,050 178,958 178,154 178,116 174,782 175,732 166,400 -5.3% -8.4% MV Theft 19,708 17,154 16,152 14,717 12,655 11,087 10,088 9,225 8,995 8,017 -10.9% -59.3%
Source: DCJS, Uniform Crime/Incident-Based Reporting system.
Includes all reports received as of 11/4/2014.
Appendix 2
% change
New York State Index Crime Summary by Region: 2004 - 2013
% change
Counts 2004 2005 2006 2007 2008 2009 2010 2011 2012 2013 2012-13 2004-13
Index Crime 500,651 489,399 477,867 460,991 464,687 449,972 450,412 448,831 452,228 432,354 -4.4% -13.6% Violent Crime 84,275 85,525 83,816 79,817 77,439 74,833 75,831 77,458 79,310 76,451 -3.6% -9.3% Murder 899 875 927 807 836 784 866 770 688 644 -6.4% -28.4% Forcible Rape 3,561 3,615 3,165 2,924 2,787 2,567 2,765 2,772 2,834 2,607 -8.0% -26.8% Robbery 33,350 35,004 34,381 31,036 31,743 28,064 28,404 28,349 28,553 27,171 -4.8% -18.5% Agg. Assault 46,465 46,031 45,343 45,050 42,073 43,418 43,796 45,567 47,235 46,029 -2.6% -0.9% Property Crime 416,376 403,874 394,051 381,174 387,248 375,139 374,581 371,373 372,918 355,903 -4.6% -14.5% Burglary 69,929 67,802 68,487 64,833 65,513 62,678 64,688 65,068 64,065 56,120 -12.4% -19.7% Larceny 305,667 300,537 293,476 288,368 296,640 290,680 289,486 287,646 291,668 284,332 -2.5% -7.0% MV Theft 40,780 35,535 32,088 27,973 25,095 21,781 20,407 18,659 17,185 15,451 -10.1% -62.1%
Rates per 100,000 Pop. 2004 2005 2006 2007 2008 2009 2010 2011 2012 2013 2012-13 2004-13
Index Crime 2,603.9 2,541.7 2,475.7 2,389.3 2,384.7 2,303.1 2,324.8 2,306.3 2,311.3 2,200.6 -4.8% -15.5% Violent Crime 438.3 444.2 434.2 413.7 397.4 383.0 391.4 398.0 405.4 389.1 -4.0% -11.2% Murder 4.7 4.5 4.8 4.2 4.3 4.0 4.5 4.0 3.5 3.3 -6.8% -29.9% Forcible Rape 18.5 18.8 16.4 15.2 14.3 13.1 14.3 14.2 14.5 13.3 -8.4% -28.4% Robbery 173.5 181.8 178.1 160.9 162.9 143.6 146.6 145.7 145.9 138.3 -5.2% -20.3% Agg. Assault 241.7 239.1 234.9 233.5 215.9 222.2 226.1 234.1 241.4 234.3 -3.0% -3.1% Property Crime 2,165.6 2,097.5 2,041.5 1,975.7 1,987.3 1,920.1 1,933.4 1,908.3 1,906.0 1,811.5 -5.0% -16.3% Burglary 363.7 352.1 354.8 336.0 336.2 320.8 333.9 334.4 327.4 285.6 -12.8% -21.5% Larceny 1,589.8 1,560.9 1,520.4 1,494.6 1,522.3 1,487.8 1,494.2 1,478.1 1,490.7 1,447.2 -2.9% -9.0% MV Theft 212.1 184.6 166.2 145.0 128.8 111.5 105.3 95.9 87.8 78.6 -10.5% -62.9%
Source: DCJS, Uniform Crime/Incident-Based Reporting system.
Includes all reports received as of 11/4/2014.
Appendix 1
New York State Index Crime Counts and Rates per 100,000 Population: 2004 - 2013
% change
% change

Office of Justice Research & Performance 7 NYS Division of Criminal Justice Services
November 2014
Forcible Agg. MVCounty Year Total Violent Murder Rape Robbery Assault Property Burglary Larceny Theft
Albany 2012 9,976 1,013 6 67 314 626 8,963 1,503 7,198 262
2013 9,465 1,004 9 47 292 656 8,461 1,206 7,004 251
% change -5.1% -0.9% 50.0% -29.9% -7.0% 4.8% -5.6% -19.8% -2.7% -4.2%
Allegany 2012 856 65 2 9 2 52 791 211 561 192013 795 54 0 9 4 41 741 194 533 14
% change -7.1% -16.9% -100.0% 0.0% 100.0% -21.2% -6.3% -8.1% -5.0% -26.3%
Bronx 2012 35,962 12,801 114 220 4,731 7,736 23,161 3,058 18,454 1,649
2013 36,280 13,020 83 189 4,456 8,292 23,260 2,795 19,016 1,449
% change 0.9% 1.7% -27.2% -14.1% -5.8% 7.2% 0.4% -8.6% 3.0% -12.1%
Broome 2012 6,894 601 7 59 133 402 6,293 1,253 4,899 141
2013 6,703 510 7 51 153 299 6,193 1,162 4,901 130
% change -2.8% -15.1% 0.0% -13.6% 15.0% -25.6% -1.6% -7.3% 0.0% -7.8%
Cattaraugus 2012 2,079 149 1 20 17 111 1,930 432 1,462 36
2013 1,761 115 0 13 11 91 1,646 309 1,275 62
% change -15.3% -22.8% -100.0% -35.0% -35.3% -18.0% -14.7% -28.5% -12.8% 72.2%
Cayuga 2012 1,808 141 1 13 21 106 1,667 305 1,316 46
2013 1,515 128 2 26 23 77 1,387 269 1,108 10
% change -16.2% -9.2% 100.0% 100.0% 9.5% -27.4% -16.8% -11.8% -15.8% -78.3%
Chautauqua 2012 3,846 308 2 30 60 216 3,538 818 2,634 86
2013 3,636 274 2 30 65 177 3,362 775 2,540 47
% change -5.5% -11.0% 0.0% 0.0% 8.3% -18.1% -5.0% -5.3% -3.6% -45.3%
Chemung 2012 2,434 222 4 2 46 170 2,212 398 1,768 46
2013 2,201 151 0 7 37 107 2,050 351 1,672 27
% change -9.6% -32.0% -100.0% 250.0% -19.6% -37.1% -7.3% -11.8% -5.4% -41.3%
Chenango 2012 1,024 58 0 17 10 31 966 184 757 25
2013 927 48 2 13 4 29 879 164 703 12
% change -9.5% -17.2% NA -23.5% -60.0% -6.5% -9.0% -10.9% -7.1% -52.0%
Clinton 2012 1,684 90 0 15 7 68 1,594 274 1,282 38
2013 1,665 111 3 21 9 78 1,554 261 1,254 39
% change -1.1% 23.3% NA 40.0% 28.6% 14.7% -2.5% -4.7% -2.2% 2.6%
Columbia 2012 1,428 102 0 16 15 71 1,326 263 1,051 12
2013 1,125 76 0 8 17 51 1,049 207 828 14
% change -21.2% -25.5% NA -50.0% 13.3% -28.2% -20.9% -21.3% -21.2% 16.7%
Cortland 2012 1,105 64 1 11 19 33 1,041 249 772 20
2013 1,064 51 0 12 9 30 1,013 210 791 12
% change -3.7% -20.3% -100.0% 9.1% -52.6% -9.1% -2.7% -15.7% 2.5% -40.0%
New York State Index Crime Summary by County2012 vs. 2013
Appendix 3
November 2014
Office of Justice Research & Performance 8 NYS Division of Criminal Justice Services
Forcible Agg. MVCounty Year Total Violent Murder Rape Robbery Assault Property Burglary Larceny Theft
Delaware 2012 765 63 1 11 7 44 702 175 507 20
2013 805 56 2 7 5 42 749 172 560 17
% change 5.2% -11.1% 100.0% -36.4% -28.6% -4.5% 6.7% -1.7% 10.5% -15.0%
Dutchess 2012 5,889 677 5 30 162 480 5,212 897 4,168 147
2013 5,067 582 12 28 149 393 4,485 767 3,619 99
% change -14.0% -14.0% 140.0% -6.7% -8.0% -18.1% -13.9% -14.5% -13.2% -32.7%
Erie 2012 31,468 4,227 50 211 1,604 2,362 27,241 6,026 19,734 1,481
2013 29,305 4,087 55 204 1,503 2,325 25,218 5,222 18,740 1,256
% change -6.9% -3.3% 10.0% -3.3% -6.3% -1.6% -7.4% -13.3% -5.0% -15.2%
Essex 2012 517 43 1 7 3 32 474 130 331 13
2013 450 43 0 8 2 33 407 121 267 19
% change -13.0% 0.0% -100.0% 14.3% -33.3% 3.1% -14.1% -6.9% -19.3% 46.2%
Franklin 2012 1,041 57 1 15 6 35 984 213 745 26
2013 874 61 1 10 3 47 813 179 606 28
% change -16.0% 7.0% 0.0% -33.3% -50.0% 34.3% -17.4% -16.0% -18.7% 7.7%
Fulton 2012 1,559 52 0 5 12 35 1,507 301 1,162 44
2013 1,527 62 1 13 11 37 1,465 262 1,164 39
% change -2.1% 19.2% NA 160.0% -8.3% 5.7% -2.8% -13.0% 0.2% -11.4%
Genesee 2012 1,453 92 0 12 8 72 1,361 266 1,061 34
2013 1,466 109 0 22 22 65 1,357 294 1,044 19
% change 0.9% 18.5% NA 83.3% 175.0% -9.7% -0.3% 10.5% -1.6% -44.1%
Greene 2012 721 88 0 7 6 75 633 194 419 20
2013 716 58 1 8 6 43 658 212 420 26
% change -0.7% -34.1% NA 14.3% 0.0% -42.7% 3.9% 9.3% 0.2% 30.0%
Hamilton 2012 78 1 0 0 0 1 77 30 43 4
2013 62 4 0 0 0 4 58 21 37 0
% change -20.5% 300.0% NA NA NA 300.0% -24.7% -30.0% -14.0% -100.0%
Herkimer 2012 1,308 124 2 9 3 110 1,184 271 883 30
2013 1,192 126 4 15 7 100 1,066 246 804 16
% change -8.9% 1.6% 100.0% 66.7% 133.3% -9.1% -10.0% -9.2% -8.9% -46.7%
Jefferson 2012 2,915 213 1 15 25 172 2,702 460 2,088 154
2013 2,398 139 1 15 16 107 2,259 338 1,841 80
% change -17.7% -34.7% 0.0% 0.0% -36.0% -37.8% -16.4% -26.5% -11.8% -48.1%
Kings 2012 60,690 18,673 149 358 7,295 10,871 42,017 6,585 32,752 2,680
2013 59,056 18,258 147 401 6,854 10,856 40,798 5,635 32,557 2,606
% change -2.7% -2.2% -1.3% 12.0% -6.0% -0.1% -2.9% -14.4% -0.6% -2.8%
Appendix 3
New York State Index Crime Summary by County
2012 vs. 2013
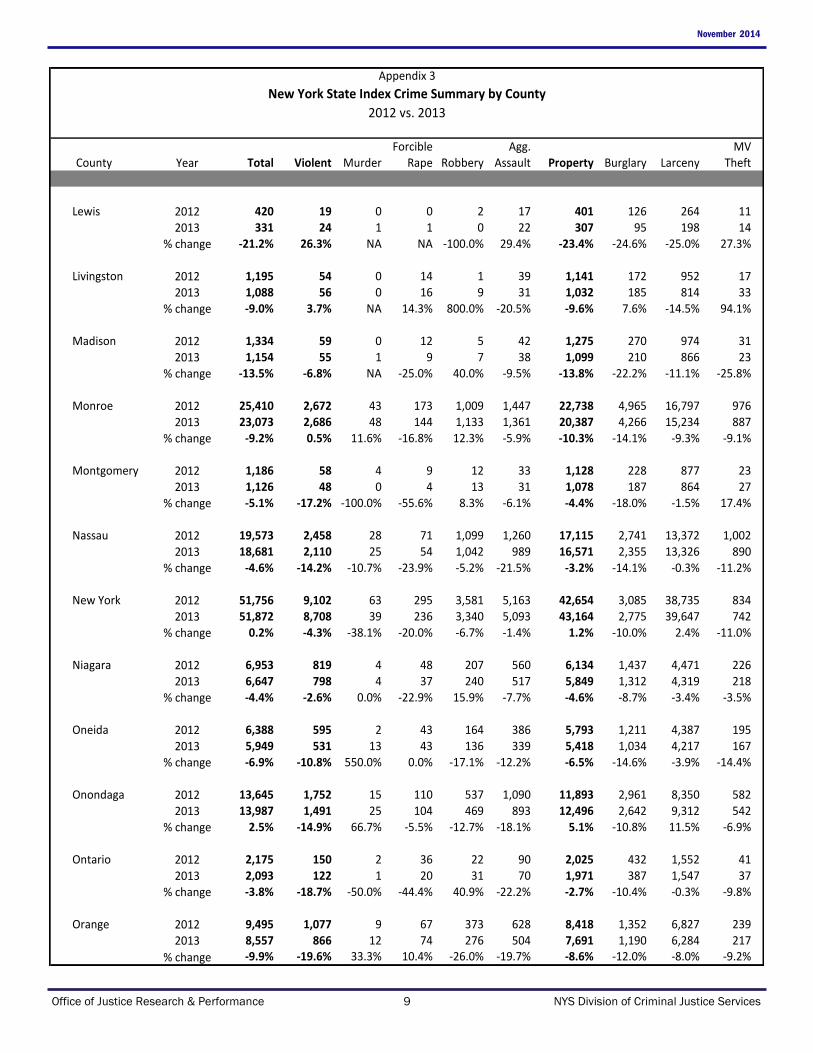
Office of Justice Research & Performance 9 NYS Division of Criminal Justice Services
November 2014
Forcible Agg. MVCounty Year Total Violent Murder Rape Robbery Assault Property Burglary Larceny Theft
Lewis 2012 420 19 0 0 2 17 401 126 264 11
2013 331 24 1 1 0 22 307 95 198 14
% change -21.2% 26.3% NA NA -100.0% 29.4% -23.4% -24.6% -25.0% 27.3%
Livingston 2012 1,195 54 0 14 1 39 1,141 172 952 17
2013 1,088 56 0 16 9 31 1,032 185 814 33
% change -9.0% 3.7% NA 14.3% 800.0% -20.5% -9.6% 7.6% -14.5% 94.1%
Madison 2012 1,334 59 0 12 5 42 1,275 270 974 31
2013 1,154 55 1 9 7 38 1,099 210 866 23
% change -13.5% -6.8% NA -25.0% 40.0% -9.5% -13.8% -22.2% -11.1% -25.8%
Monroe 2012 25,410 2,672 43 173 1,009 1,447 22,738 4,965 16,797 976
2013 23,073 2,686 48 144 1,133 1,361 20,387 4,266 15,234 887
% change -9.2% 0.5% 11.6% -16.8% 12.3% -5.9% -10.3% -14.1% -9.3% -9.1%
Montgomery 2012 1,186 58 4 9 12 33 1,128 228 877 23
2013 1,126 48 0 4 13 31 1,078 187 864 27
% change -5.1% -17.2% -100.0% -55.6% 8.3% -6.1% -4.4% -18.0% -1.5% 17.4%
Nassau 2012 19,573 2,458 28 71 1,099 1,260 17,115 2,741 13,372 1,002
2013 18,681 2,110 25 54 1,042 989 16,571 2,355 13,326 890
% change -4.6% -14.2% -10.7% -23.9% -5.2% -21.5% -3.2% -14.1% -0.3% -11.2%
New York 2012 51,756 9,102 63 295 3,581 5,163 42,654 3,085 38,735 834
2013 51,872 8,708 39 236 3,340 5,093 43,164 2,775 39,647 742
% change 0.2% -4.3% -38.1% -20.0% -6.7% -1.4% 1.2% -10.0% 2.4% -11.0%
Niagara 2012 6,953 819 4 48 207 560 6,134 1,437 4,471 226
2013 6,647 798 4 37 240 517 5,849 1,312 4,319 218
% change -4.4% -2.6% 0.0% -22.9% 15.9% -7.7% -4.6% -8.7% -3.4% -3.5%
Oneida 2012 6,388 595 2 43 164 386 5,793 1,211 4,387 195
2013 5,949 531 13 43 136 339 5,418 1,034 4,217 167
% change -6.9% -10.8% 550.0% 0.0% -17.1% -12.2% -6.5% -14.6% -3.9% -14.4%
Onondaga 2012 13,645 1,752 15 110 537 1,090 11,893 2,961 8,350 582
2013 13,987 1,491 25 104 469 893 12,496 2,642 9,312 542
% change 2.5% -14.9% 66.7% -5.5% -12.7% -18.1% 5.1% -10.8% 11.5% -6.9%
Ontario 2012 2,175 150 2 36 22 90 2,025 432 1,552 41
2013 2,093 122 1 20 31 70 1,971 387 1,547 37
% change -3.8% -18.7% -50.0% -44.4% 40.9% -22.2% -2.7% -10.4% -0.3% -9.8%
Orange 2012 9,495 1,077 9 67 373 628 8,418 1,352 6,827 239
2013 8,557 866 12 74 276 504 7,691 1,190 6,284 217
% change -9.9% -19.6% 33.3% 10.4% -26.0% -19.7% -8.6% -12.0% -8.0% -9.2%
Appendix 3
New York State Index Crime Summary by County
2012 vs. 2013
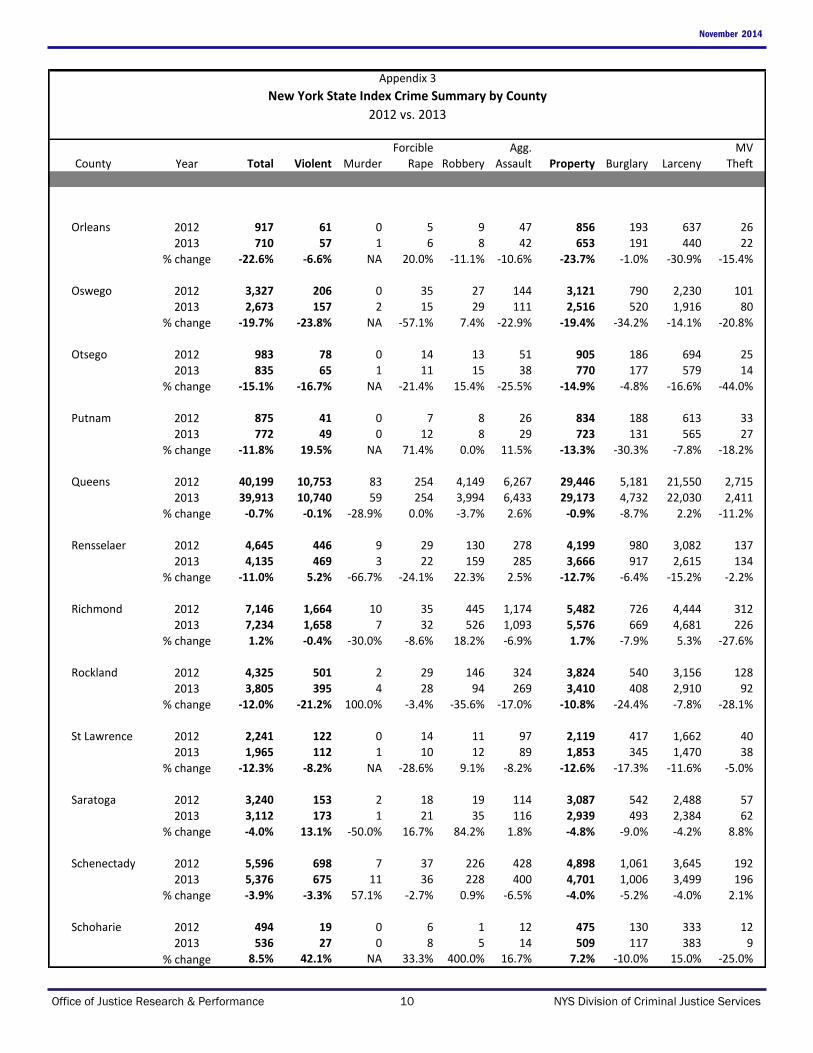
November 2014
Office of Justice Research & Performance 10 NYS Division of Criminal Justice Services
Forcible Agg. MVCounty Year Total Violent Murder Rape Robbery Assault Property Burglary Larceny Theft
Orleans 2012 917 61 0 5 9 47 856 193 637 26
2013 710 57 1 6 8 42 653 191 440 22
% change -22.6% -6.6% NA 20.0% -11.1% -10.6% -23.7% -1.0% -30.9% -15.4%
Oswego 2012 3,327 206 0 35 27 144 3,121 790 2,230 101
2013 2,673 157 2 15 29 111 2,516 520 1,916 80
% change -19.7% -23.8% NA -57.1% 7.4% -22.9% -19.4% -34.2% -14.1% -20.8%
Otsego 2012 983 78 0 14 13 51 905 186 694 25
2013 835 65 1 11 15 38 770 177 579 14
% change -15.1% -16.7% NA -21.4% 15.4% -25.5% -14.9% -4.8% -16.6% -44.0%
Putnam 2012 875 41 0 7 8 26 834 188 613 33
2013 772 49 0 12 8 29 723 131 565 27
% change -11.8% 19.5% NA 71.4% 0.0% 11.5% -13.3% -30.3% -7.8% -18.2%
Queens 2012 40,199 10,753 83 254 4,149 6,267 29,446 5,181 21,550 2,715
2013 39,913 10,740 59 254 3,994 6,433 29,173 4,732 22,030 2,411
% change -0.7% -0.1% -28.9% 0.0% -3.7% 2.6% -0.9% -8.7% 2.2% -11.2%
Rensselaer 2012 4,645 446 9 29 130 278 4,199 980 3,082 137
2013 4,135 469 3 22 159 285 3,666 917 2,615 134
% change -11.0% 5.2% -66.7% -24.1% 22.3% 2.5% -12.7% -6.4% -15.2% -2.2%
Richmond 2012 7,146 1,664 10 35 445 1,174 5,482 726 4,444 312
2013 7,234 1,658 7 32 526 1,093 5,576 669 4,681 226
% change 1.2% -0.4% -30.0% -8.6% 18.2% -6.9% 1.7% -7.9% 5.3% -27.6%
Rockland 2012 4,325 501 2 29 146 324 3,824 540 3,156 128
2013 3,805 395 4 28 94 269 3,410 408 2,910 92
% change -12.0% -21.2% 100.0% -3.4% -35.6% -17.0% -10.8% -24.4% -7.8% -28.1%
St Lawrence 2012 2,241 122 0 14 11 97 2,119 417 1,662 40
2013 1,965 112 1 10 12 89 1,853 345 1,470 38
% change -12.3% -8.2% NA -28.6% 9.1% -8.2% -12.6% -17.3% -11.6% -5.0%
Saratoga 2012 3,240 153 2 18 19 114 3,087 542 2,488 57
2013 3,112 173 1 21 35 116 2,939 493 2,384 62
% change -4.0% 13.1% -50.0% 16.7% 84.2% 1.8% -4.8% -9.0% -4.2% 8.8%
Schenectady 2012 5,596 698 7 37 226 428 4,898 1,061 3,645 192
2013 5,376 675 11 36 228 400 4,701 1,006 3,499 196
% change -3.9% -3.3% 57.1% -2.7% 0.9% -6.5% -4.0% -5.2% -4.0% 2.1%
Schoharie 2012 494 19 0 6 1 12 475 130 333 12
2013 536 27 0 8 5 14 509 117 383 9
% change 8.5% 42.1% NA 33.3% 400.0% 16.7% 7.2% -10.0% 15.0% -25.0%
Appendix 3
New York State Index Crime Summary by County
2012 vs. 2013

Office of Justice Research & Performance 11 NYS Division of Criminal Justice Services
November 2014
Forcible Agg. MVCounty Year Total Violent Murder Rape Robbery Assault Property Burglary Larceny Theft
Schuyler 2012 185 21 1 4 1 15 164 40 115 9
2013 165 14 0 0 1 13 151 33 111 7
% change -10.8% -33.3% -100.0% -100.0% 0.0% -13.3% -7.9% -17.5% -3.5% -22.2%
Seneca 2012 852 59 0 5 3 51 793 119 664 10
2013 794 62 2 8 5 47 732 123 599 10
% change -6.8% 5.1% NA 60.0% 66.7% -7.8% -7.7% 3.4% -9.8% 0.0%
Steuben 2012 1,835 156 0 40 15 101 1,679 348 1,277 54
2013 1,528 123 1 21 13 88 1,405 265 1,116 24
% change -16.7% -21.2% NA -47.5% -13.3% -12.9% -16.3% -23.9% -12.6% -55.6%
Suffolk 2012 28,875 2,131 23 51 757 1,300 26,744 4,359 21,200 1,185
2013 26,373 1,931 27 53 691 1,160 24,442 3,610 19,654 1,178
% change -8.7% -9.4% 17.4% 3.9% -8.7% -10.8% -8.6% -17.2% -7.3% -0.6%
Sullivan 2012 1,931 181 1 34 29 117 1,750 569 1,140 41
2013 1,719 172 1 18 22 131 1,547 484 1,023 40
% change -11.0% -5.0% 0.0% -47.1% -24.1% 12.0% -11.6% -14.9% -10.3% -2.4%
Tioga 2012 667 35 0 0 7 28 632 151 466 15
2013 649 27 1 4 5 17 622 166 431 25
% change -2.7% -22.9% NA NA -28.6% -39.3% -1.6% 9.9% -7.5% 66.7%
Tompkins 2012 2,736 114 0 16 36 62 2,622 402 2,168 52
2013 2,899 110 1 14 29 66 2,789 459 2,292 38
% change 6.0% -3.5% NA -12.5% -19.4% 6.5% 6.4% 14.2% 5.7% -26.9%
Ulster 2012 3,942 279 1 31 38 209 3,663 731 2,853 79
2013 3,578 294 3 31 52 208 3,284 591 2,638 55
% change -9.2% 5.4% 200.0% 0.0% 36.8% -0.5% -10.3% -19.2% -7.5% -30.4%
Warren 2012 1,422 125 3 18 9 95 1,297 172 1,099 26
2013 1,292 54 1 11 7 35 1,238 157 1,073 8
% change -9.1% -56.8% -66.7% -38.9% -22.2% -63.2% -4.5% -8.7% -2.4% -69.2%
Washington 2012 969 77 7 11 7 52 892 236 624 32
2013 880 71 1 5 6 59 809 187 599 23
% change -9.2% -7.8% -85.7% -54.5% -14.3% 13.5% -9.3% -20.8% -4.0% -28.1%
Wayne 2012 1,846 132 1 21 19 91 1,714 458 1,216 40
2013 1,842 153 4 21 29 99 1,689 468 1,183 38
% change -0.2% 15.9% 300.0% 0.0% 52.6% 8.8% -1.5% 2.2% -2.7% -5.0%
Westchester 2012 14,969 2,448 20 72 924 1,432 12,521 1,883 10,005 633
2013 14,032 2,186 11 58 841 1,276 11,846 1,667 9,565 614
% change -6.3% -10.7% -45.0% -19.4% -9.0% -10.9% -5.4% -11.5% -4.4% -3.0%
Appendix 3
New York State Index Crime Summary by County
2012 vs. 2013

November 2014
Office of Justice Research & Performance 12 NYS Division of Criminal Justice Services
Forcible Agg. MVCounty Year Total Violent Murder Rape Robbery Assault Property Burglary Larceny Theft
Wyoming 2012 552 51 0 5 6 40 501 76 408 17
2013 510 41 0 3 2 36 469 82 379 8
% change -7.6% -19.6% NA -40.0% -66.7% -10.0% -6.4% 7.9% -7.1% -52.9%
Yates 2012 428 20 0 6 0 14 408 111 293 4
2013 413 14 0 6 1 7 399 112 284 3
% change -3.5% -30.0% NA 0.0% NA -50.0% -2.2% 0.9% -3.1% -25.0%
Note: NA indicates that the percentage change is not applicable because the count in 2012 was zero.
Source: DCJS, Uniform Crime/Incident-Based Reporting system.
Includes all reports received as of 11/4/2014.
Appendix 3
New York State Index Crime Summary by County
2012 vs. 2013
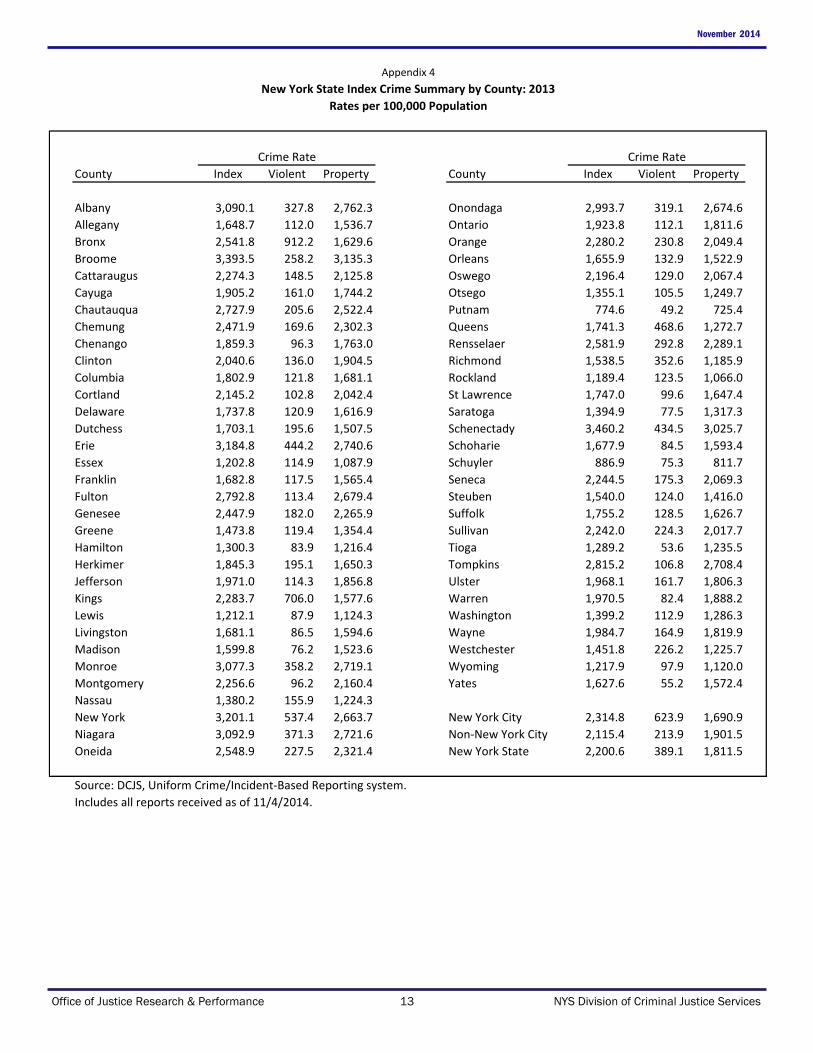
Office of Justice Research & Performance 13 NYS Division of Criminal Justice Services
November 2014
County Index Violent Property County Index Violent Property
Albany 3,090.1 327.8 2,762.3 Onondaga 2,993.7 319.1 2,674.6
Allegany 1,648.7 112.0 1,536.7 Ontario 1,923.8 112.1 1,811.6
Bronx 2,541.8 912.2 1,629.6 Orange 2,280.2 230.8 2,049.4
Broome 3,393.5 258.2 3,135.3 Orleans 1,655.9 132.9 1,522.9
Cattaraugus 2,274.3 148.5 2,125.8 Oswego 2,196.4 129.0 2,067.4
Cayuga 1,905.2 161.0 1,744.2 Otsego 1,355.1 105.5 1,249.7
Chautauqua 2,727.9 205.6 2,522.4 Putnam 774.6 49.2 725.4
Chemung 2,471.9 169.6 2,302.3 Queens 1,741.3 468.6 1,272.7
Chenango 1,859.3 96.3 1,763.0 Rensselaer 2,581.9 292.8 2,289.1
Clinton 2,040.6 136.0 1,904.5 Richmond 1,538.5 352.6 1,185.9
Columbia 1,802.9 121.8 1,681.1 Rockland 1,189.4 123.5 1,066.0
Cortland 2,145.2 102.8 2,042.4 St Lawrence 1,747.0 99.6 1,647.4
Delaware 1,737.8 120.9 1,616.9 Saratoga 1,394.9 77.5 1,317.3
Dutchess 1,703.1 195.6 1,507.5 Schenectady 3,460.2 434.5 3,025.7
Erie 3,184.8 444.2 2,740.6 Schoharie 1,677.9 84.5 1,593.4
Essex 1,202.8 114.9 1,087.9 Schuyler 886.9 75.3 811.7
Franklin 1,682.8 117.5 1,565.4 Seneca 2,244.5 175.3 2,069.3
Fulton 2,792.8 113.4 2,679.4 Steuben 1,540.0 124.0 1,416.0
Genesee 2,447.9 182.0 2,265.9 Suffolk 1,755.2 128.5 1,626.7
Greene 1,473.8 119.4 1,354.4 Sullivan 2,242.0 224.3 2,017.7
Hamilton 1,300.3 83.9 1,216.4 Tioga 1,289.2 53.6 1,235.5
Herkimer 1,845.3 195.1 1,650.3 Tompkins 2,815.2 106.8 2,708.4
Jefferson 1,971.0 114.3 1,856.8 Ulster 1,968.1 161.7 1,806.3
Kings 2,283.7 706.0 1,577.6 Warren 1,970.5 82.4 1,888.2
Lewis 1,212.1 87.9 1,124.3 Washington 1,399.2 112.9 1,286.3
Livingston 1,681.1 86.5 1,594.6 Wayne 1,984.7 164.9 1,819.9
Madison 1,599.8 76.2 1,523.6 Westchester 1,451.8 226.2 1,225.7
Monroe 3,077.3 358.2 2,719.1 Wyoming 1,217.9 97.9 1,120.0
Montgomery 2,256.6 96.2 2,160.4 Yates 1,627.6 55.2 1,572.4
Nassau 1,380.2 155.9 1,224.3
New York 3,201.1 537.4 2,663.7 New York City 2,314.8 623.9 1,690.9
Niagara 3,092.9 371.3 2,721.6 Non-New York City 2,115.4 213.9 1,901.5
Oneida 2,548.9 227.5 2,321.4 New York State 2,200.6 389.1 1,811.5
Source: DCJS, Uniform Crime/Incident-Based Reporting system.
Includes all reports received as of 11/4/2014.
Crime Rate Crime Rate
Appendix 4
New York State Index Crime Summary by County: 2013
Rates per 100,000 Population
November 2014
Office of Justice Research & Performance 14 NYS Division of Criminal Justice Services
2012 vs. 13 2012 vs. 132012 2013 % Change 2012 2013 % Change
Violent Crimes 52,993 52,384 -1.1% 26,317 24,067 -8.5%Firearm Related 8,146 7,285 -10.6% 4,923 4,776 -3.0%Percent Firearm 15.4% 13.9% 18.7% 19.8%
Murder 419 335 -20.0% 269 309 14.9%Firearm Related 241 194 -19.5% 170 172 1.2%Percent Firearm 57.5% 57.9% 63.2% 55.7%
Forcible Rape 1,162 1,112 -4.3% 1,672 1,495 -10.6%Firearm Related 19 28 47.4% 32 32 0.0%Percent Firearm 1.6% 2.5% 1.9% 2.1%
Robbery 20,201 19,170 -5.1% 8,352 8,001 -4.2%Firearm Related 4,502 4,022 -10.7% 2,455 2,440 -0.6%Percent Firearm 22.3% 21.0% 29.4% 30.5%
Aggravated Assault 31,211 31,767 1.8% 16,024 14,262 -11.0%Firearm Related 3,384 3,218 -4.9% 2,266 2,132 -5.9%Percent Firearm 10.8% 10.1% 14.1% 14.9%
Source: DCJS, Uniform Crime/Incident-Based Reporting system.Includes all reports received as of 11/4/2014.
Appendix 5
Violent Crime by Firearm
2012 vs. 2013
New York City Non-New York City
HomicidesFirearm
RelatedHomicides
Firearm
RelatedHomicides
Firearm
Related
2004 570 349 329 156 899 505
2005 539 331 336 168 875 499
2006 596 367 331 185 927 552
2007 496 328 311 175 807 503
2008 523 294 313 179 836 473
2009 471 302 313 181 784 483
2010 536 323 330 200 866 523
2011 515 315 255 133 770 448
2012 419 241 269 170 688 411
2013 335 194 309 172 644 366
2004 vs. 2013 %
Change-41.2% -44.4% -6.1% 10.3% -28.4% -27.5%
2010 vs. 2013 %
Change-37.5% -39.9% -6.4% -14.0% -25.6% -30.0%
Source: DCJS, Uniform Crime/Incident-Based Reporting system.
Includes all reports received as of 11/4/2014.
Appendix 6
Homicides and Homicides by Firearm
2004 - 2013
Year
New York City Non-New York City New York State