Embed Size (px)
Citation preview

2005 Annual Results 2005 Annual Results PresentationPresentation
Member of Li & Fung GroupMember of Li & Fung Group 9 March 20069 March 2006
2005 Annual Result Presentation2005 Annual Result PresentationAgendaAgenda
Overall Hong Kong & Guangzhou Retail MarketsOverall Hong Kong & Guangzhou Retail Markets
2005 Financial Results Highlights2005 Financial Results Highlights
2006 Update & Outlook2006 Update & Outlook
Questions & AnswersQuestions & Answers
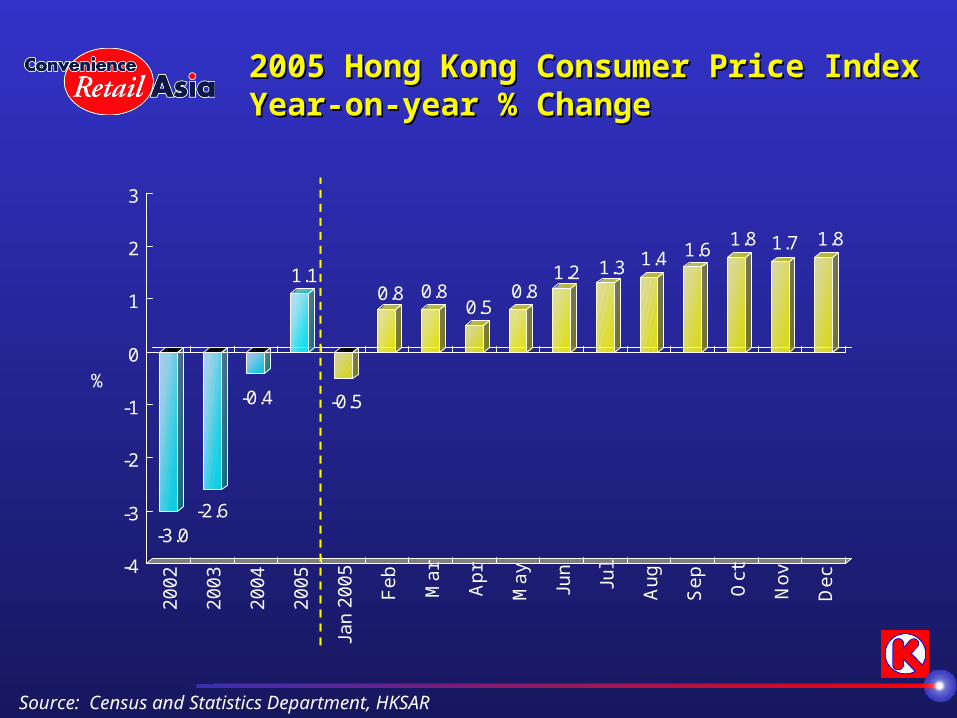
2005 Hong Kong Consumer Price Index2005 Hong Kong Consumer Price IndexYear-on-year % ChangeYear-on-year % Change
-3.0-2.6
-0.4
1.1
-0.5
0.8 0.80.5
0.81.2 1.3 1.4 1.6
1.8 1.7 1.8
-4
-3
-2
-1
0
1
2
3
%
20
02
20
03
20
04
20
05
Jan
20
05
Fe
b
Ma
r
Ap
r
Ma
y
Jun
Jul
Au
g
Se
p
Oct
No
v
De
c
Source: Census and Statistics Department, HKSAR
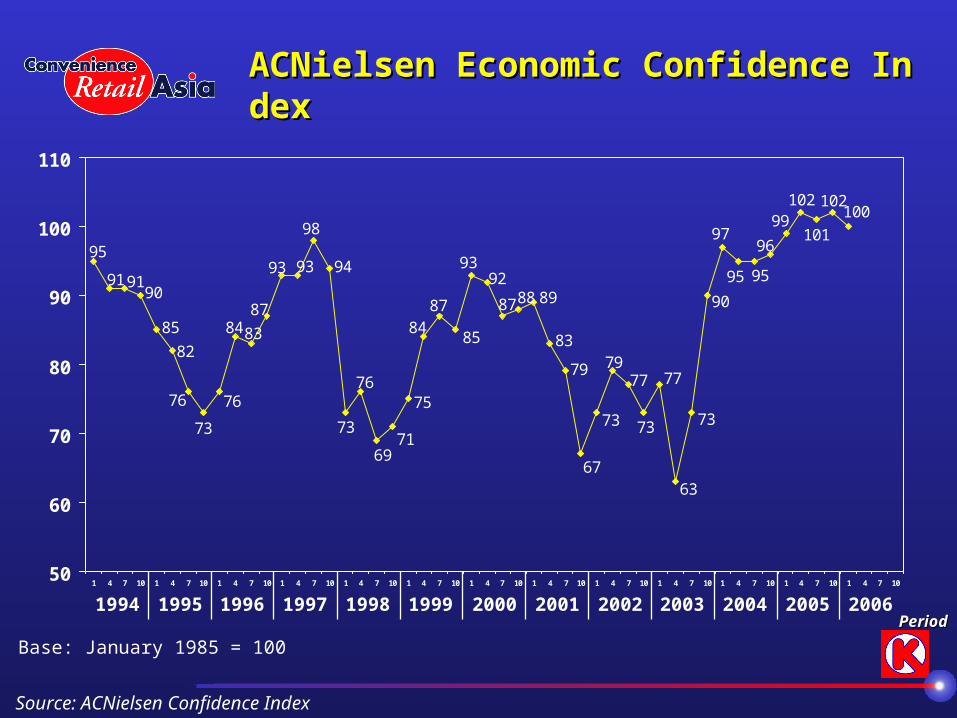
ACNielsen Economic Confidence IndexACNielsen Economic Confidence Index
9595
63
77
73
83
89
7169
76
100102
101
102
73
67
79
99
9697
90
73
7779
9293
87
98
90
949393
87
8384
73
7676
82
85
9191
95
75
85
8784
88
73
50
60
70
80
90
100
110
1 4 7 10 1 4 7 10 1 4 7 10 1 4 7 10 1 4 7 10 1 4 7 10 1 4 7 10 1 4 7 10 1 4 7 10 1 4 7 10 1 4 7 10 1 4 7 10 1 4 7 10
PeriodPeriod1994 1995 1996 1997 19991998 2000 2001 2002 2003 2004 2005 2006
Base: January 1985 = 100
Source: ACNielsen Confidence Index
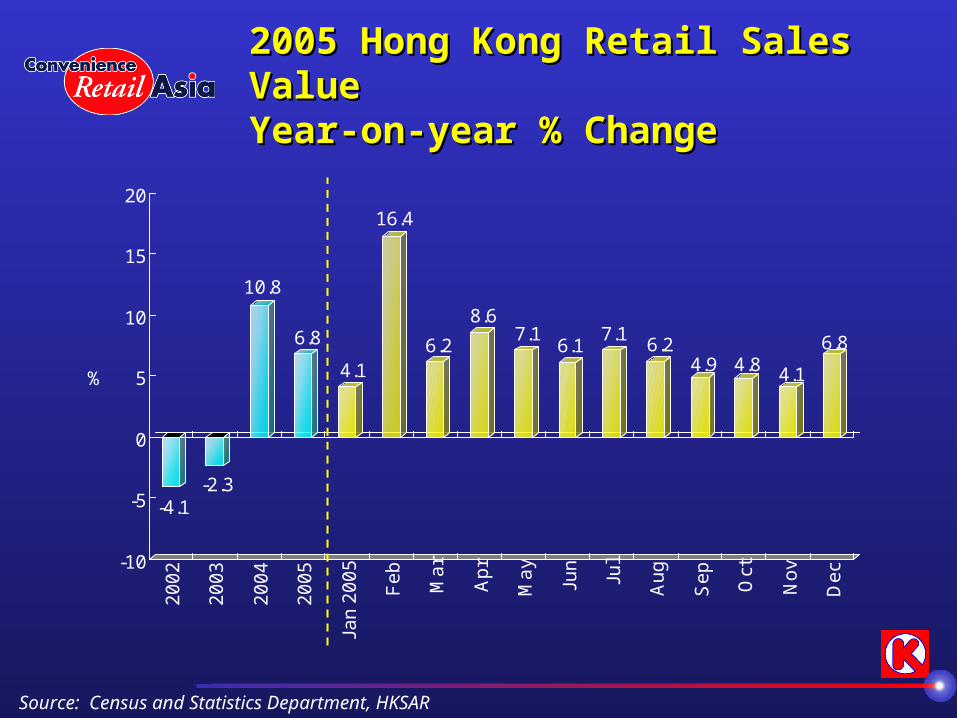
2005 Hong Kong Retail Sales Value2005 Hong Kong Retail Sales ValueYear-on-year % ChangeYear-on-year % Change
-4.1-2.3
10.8
6.8
4.1
16.4
6.2
8.67.1
6.17.1
6.24.9 4.8 4.1
6.8
-10
-5
0
5
10
15
20
%
20
02
20
03
20
04
20
05
Jan
20
05
Fe
b
Ma
r
Ap
r
Ma
y
Jun
Jul
Au
g
Se
p
Oct
No
v
De
c
Source: Census and Statistics Department, HKSAR
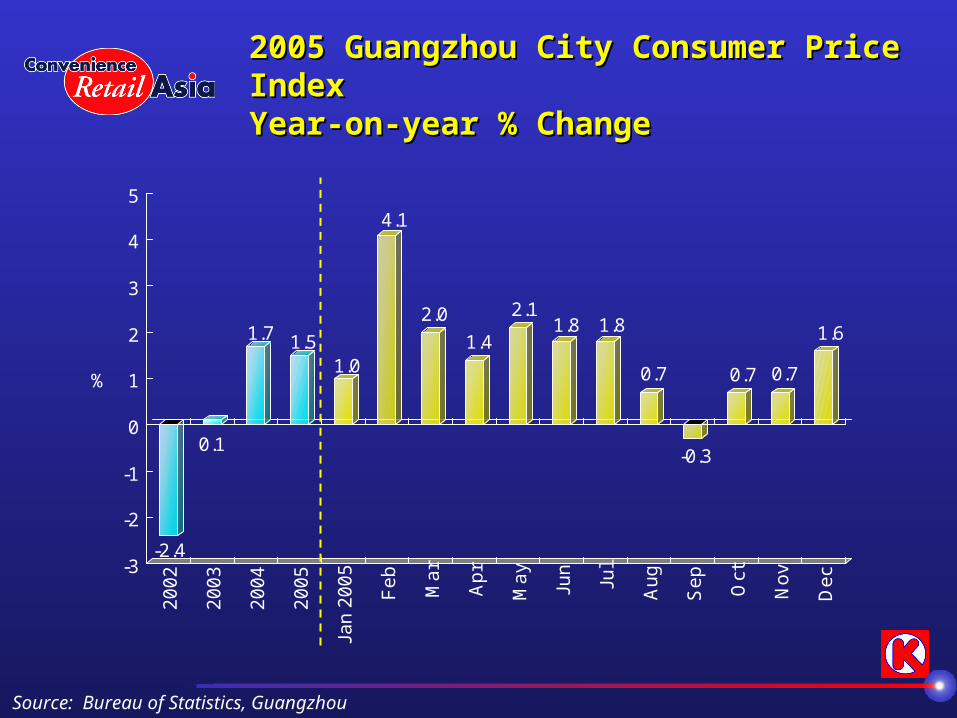
2005 Guangzhou City Consumer Price Index2005 Guangzhou City Consumer Price IndexYear-on-year % ChangeYear-on-year % Change
-2.4
0.1
1.7 1.51.0
4.1
2.0
1.4
2.11.8 1.8
0.7
-0.3
0.7 0.7
1.6
-3
-2
-1
0
1
2
3
4
5
%
20
02
20
03
20
04
20
05
Jan
20
05
Fe
b
Ma
r
Ap
r
Ma
y
Jun
Jul
Au
g
Se
p
Oct
No
v
De
c
Source: Bureau of Statistics, Guangzhou
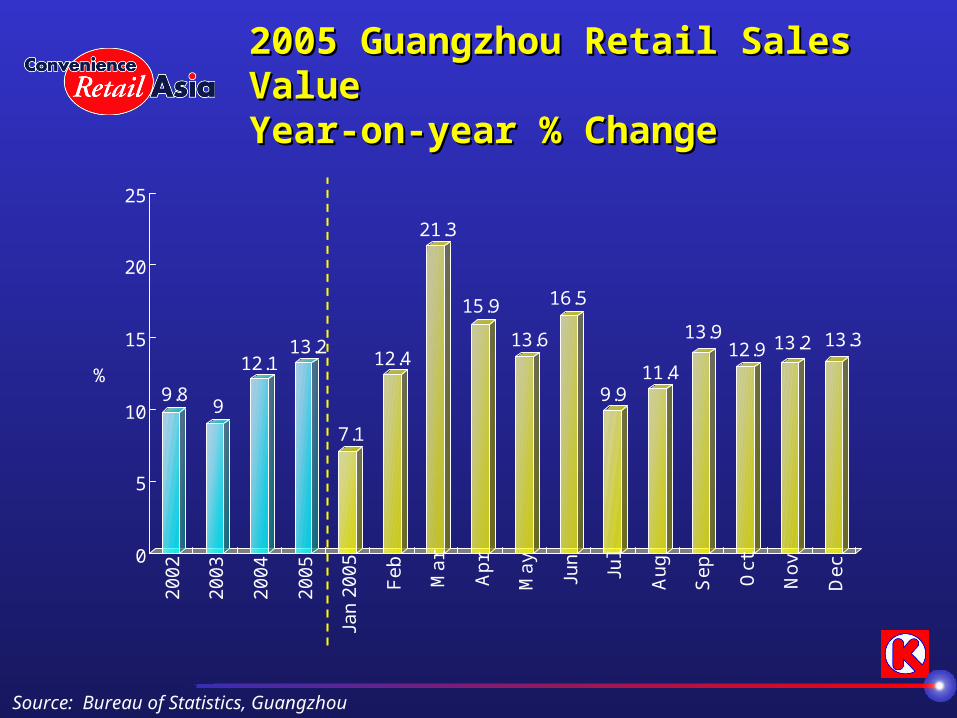
2005 Guangzhou Retail Sales Value2005 Guangzhou Retail Sales ValueYear-on-year % ChangeYear-on-year % Change
9.89
12.113.2
7.1
12.4
21.3
15.9
13.6
16.5
9.911.4
13.912.9 13.2 13.3
0
5
10
15
20
25
%
20
02
20
03
20
04
20
05
Jan
20
05
Fe
b
Ma
r
Ap
r
Ma
y
Jun
Jul
Au
g
Se
p
Oct
No
v
De
c
Source: Bureau of Statistics, Guangzhou

2005 Financial Results Highlights2005 Financial Results HighlightsGroup TurnoverGroup Turnover
1,383.61,515.8
1,736.5
1,995.2
0
500
1,000
1,500
2,000
2,500
HK
$ M
illio
n
2002 2003 2004 2005
No. of store – HKNo. of store – HK 166166 186186 205205 230230
No. of store - ChinaNo. of store - China 22 77 2020 4545
+15%+15%
* Restated
***
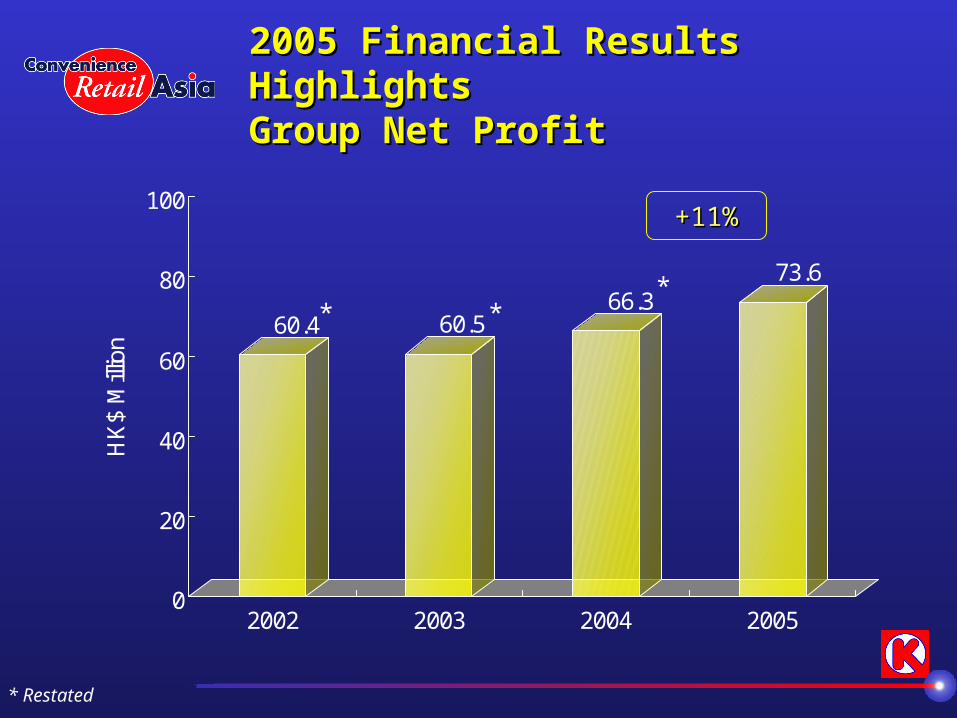
60.4 60.566.3
73.6
0
20
40
60
80
100
HK
$ M
illio
n
2002 2003 2004 2005
2005 Financial Results Highlights2005 Financial Results HighlightsGroup Net ProfitGroup Net Profit
+11%+11%
* Restated
***
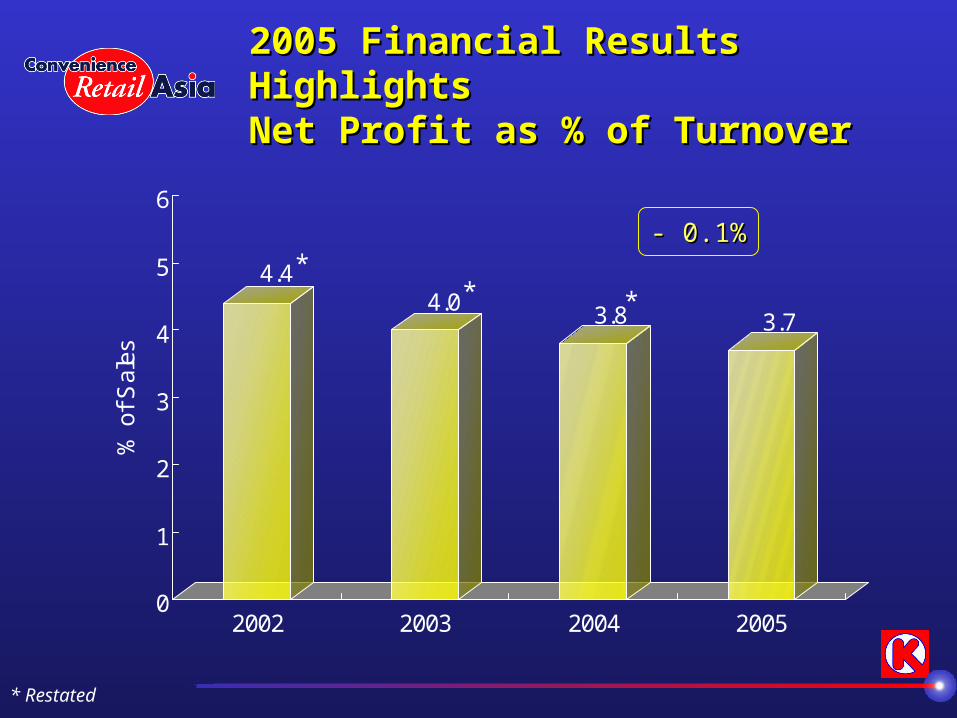
2005 Financial Results Highlights2005 Financial Results HighlightsNet Profit as % of TurnoverNet Profit as % of Turnover
4.44.0 3.8 3.7
0
1
2
3
4
5
6
% o
f S
ales
2002 2003 2004 2005
- 0.1%- 0.1%
* Restated
***
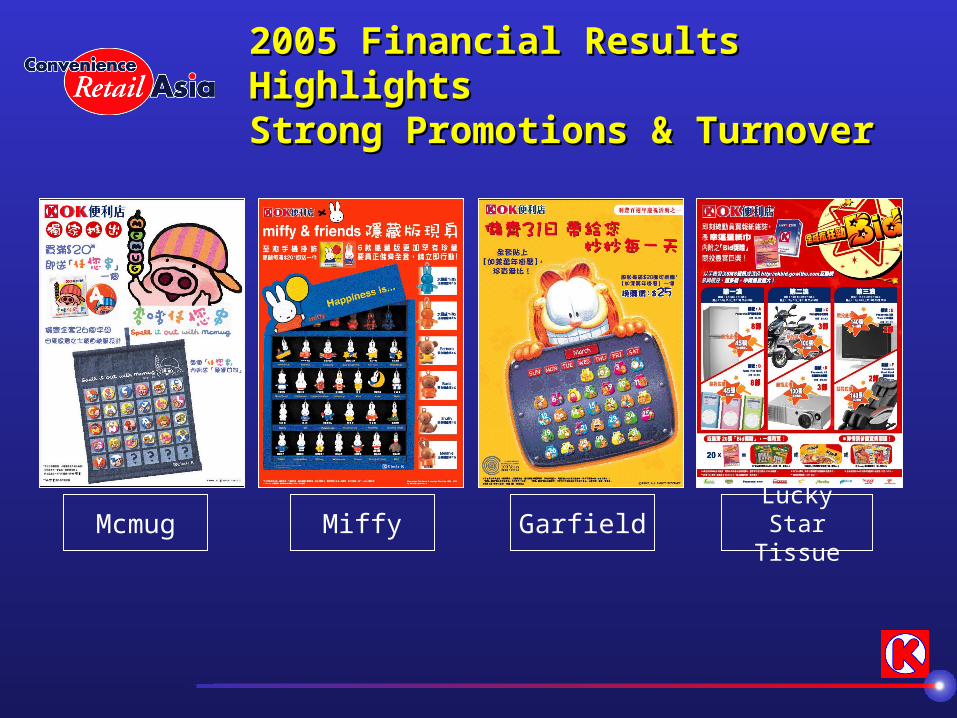
2005 Financial Results Highlights2005 Financial Results HighlightsStrong Promotions & TurnoverStrong Promotions & Turnover
Mcmug MiffyLucky Star
TissueGarfield
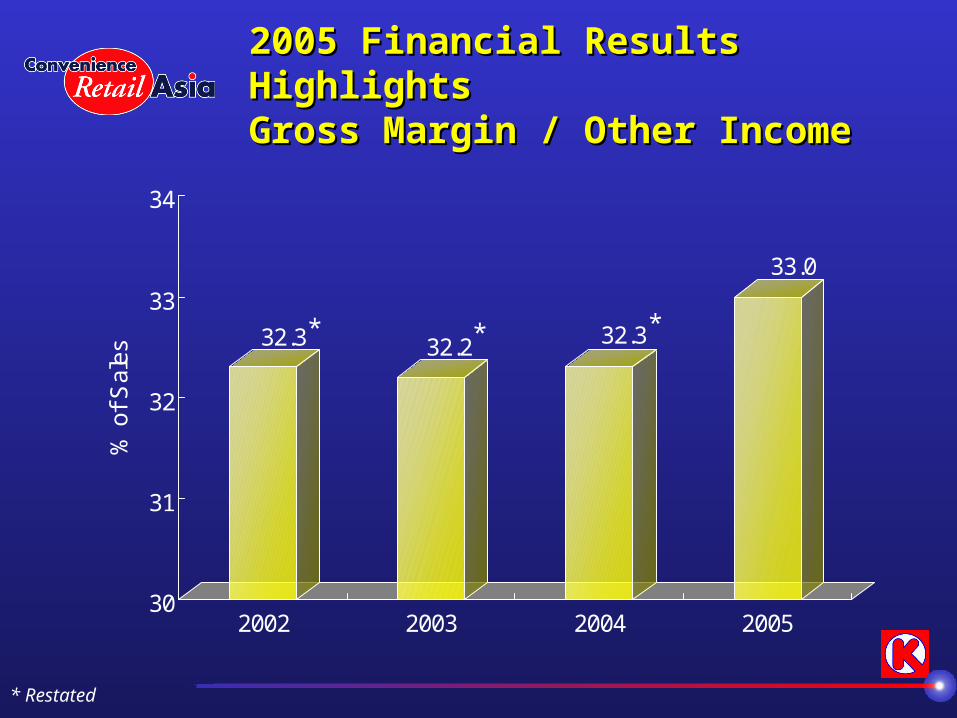
2005 Financial Results Highlights2005 Financial Results HighlightsGross Margin / Other IncomeGross Margin / Other Income
32.3 32.2 32.3
33.0
30
31
32
33
34
% o
f S
ales
2002 2003 2004 2005
* Restated
* * *
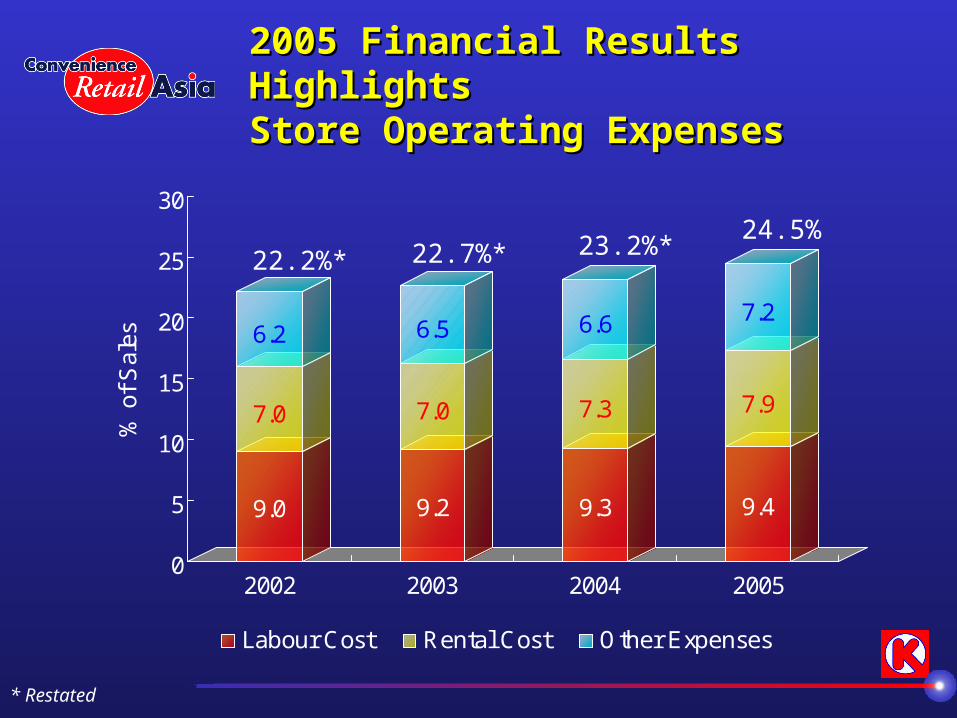
2005 Financial Results Highlights2005 Financial Results HighlightsStore Operating ExpensesStore Operating Expenses
9.0
7.0
6.2
9.2
7.0
6.5
9.3
7.3
6.6
9.4
7.9
7.2
0
5
10
15
20
25
30
% o
f S
ales
2002 2003 2004 2005
Labour Cost Rental Cost Other Expenses
22.2%*23.2%*22.7%*
24.5%
* Restated
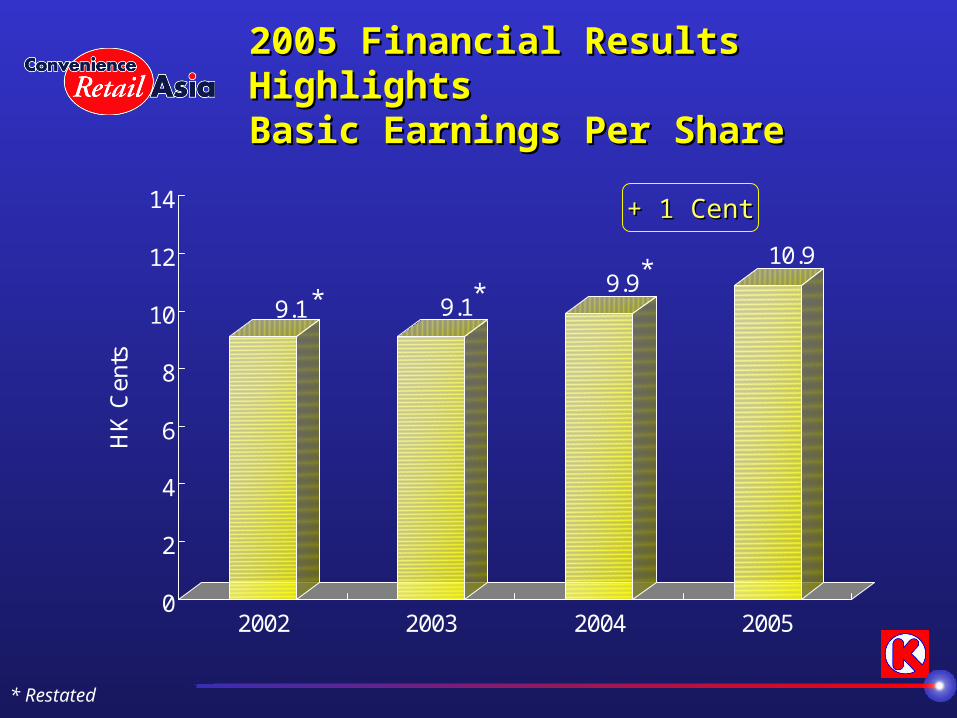
2005 Financial Results Highlights2005 Financial Results HighlightsBasic Earnings Per ShareBasic Earnings Per Share
9.1 9.19.9
10.9
0
2
4
6
8
10
12
14
HK
Cen
ts
2002 2003 2004 2005
+ 1 Cent+ 1 Cent
* Restated
**
*

2005 Financial Results Highlights2005 Financial Results Highlights
2005 2004 Change
Number of StoresNumber of Stores 275275 225225 + 50+ 50
Group Turnover (HK$M)Group Turnover (HK$M) 1,995.21,995.2 1,736.5*1,736.5* + 15%+ 15%
Group Net Profit (HK$M)Group Net Profit (HK$M) 73.673.6 66.3*66.3* + 11%+ 11%
Net Profit as % of TurnoverNet Profit as % of Turnover 3.7%3.7% 3.8%*3.8%* - 0.1%- 0.1%
Basic Earnings Per ShareBasic Earnings Per Share 10.9 Cents10.9 Cents 9.9 Cents*9.9 Cents* + 1 Cent+ 1 Cent
Total Dividend Per ShareTotal Dividend Per Share Paid Mid YearPaid Mid Year To Be PaidTo Be Paid
1.5 Cents1.5 Cents
4.5 Cents4.5 Cents
1.25 Cents1.25 Cents
3.75 Cents3.75 Cents
* Restated
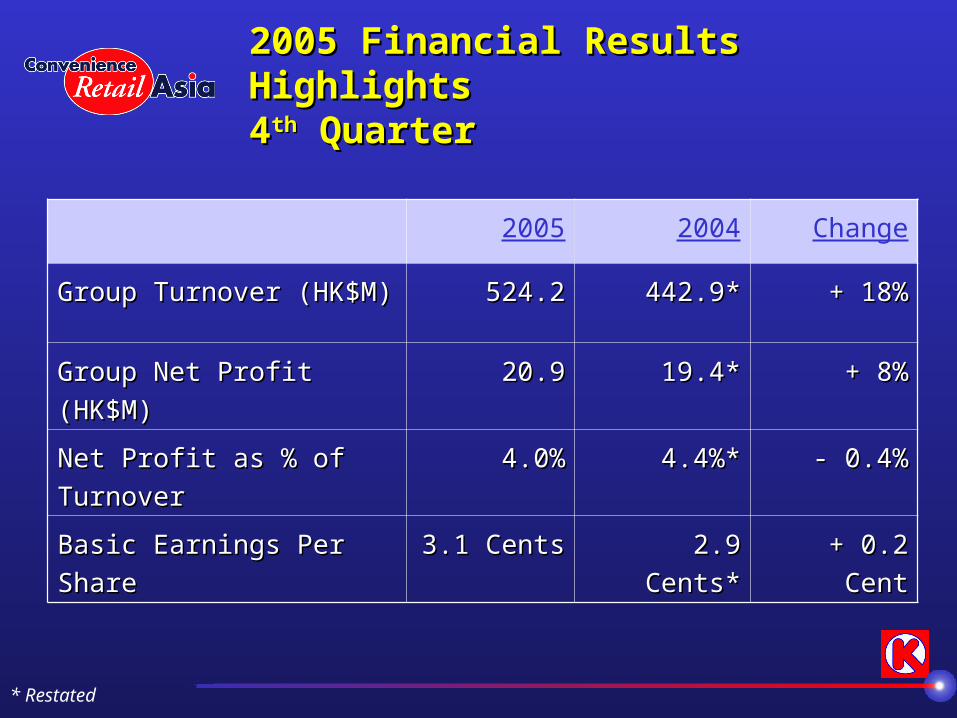
2005 Financial Results Highlights2005 Financial Results Highlights44thth Quarter Quarter
2005 2004 Change
Group Turnover (HK$M)Group Turnover (HK$M) 524.2524.2 442.9*442.9* + 18%+ 18%
Group Net Profit (HK$M)Group Net Profit (HK$M) 20.920.9 19.4*19.4* + 8%+ 8%
Net Profit as % of TurnoverNet Profit as % of Turnover 4.0%4.0% 4.4%*4.4%* - 0.4%- 0.4%
Basic Earnings Per ShareBasic Earnings Per Share 3.1 Cents3.1 Cents 2.9 Cents*2.9 Cents* + 0.2 Cent+ 0.2 Cent
* Restated
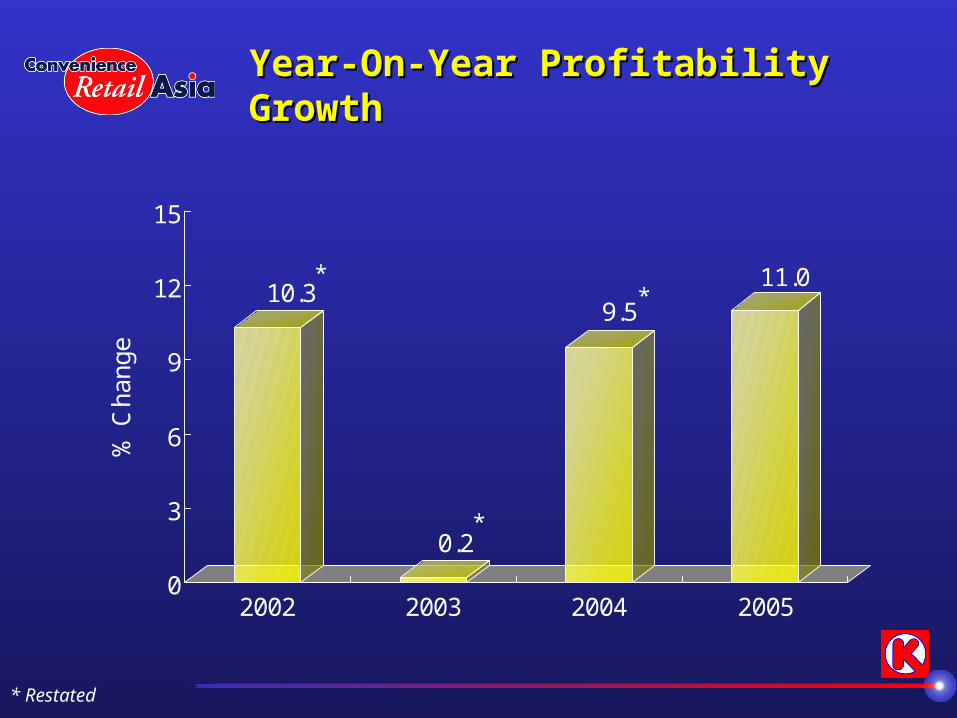
Year-On-Year Profitability GrowthYear-On-Year Profitability Growth
10.3
0.2
9.511.0
0
3
6
9
12
15
% C
hang
e
2002 2003 2004 2005
*
* Restated
*
*
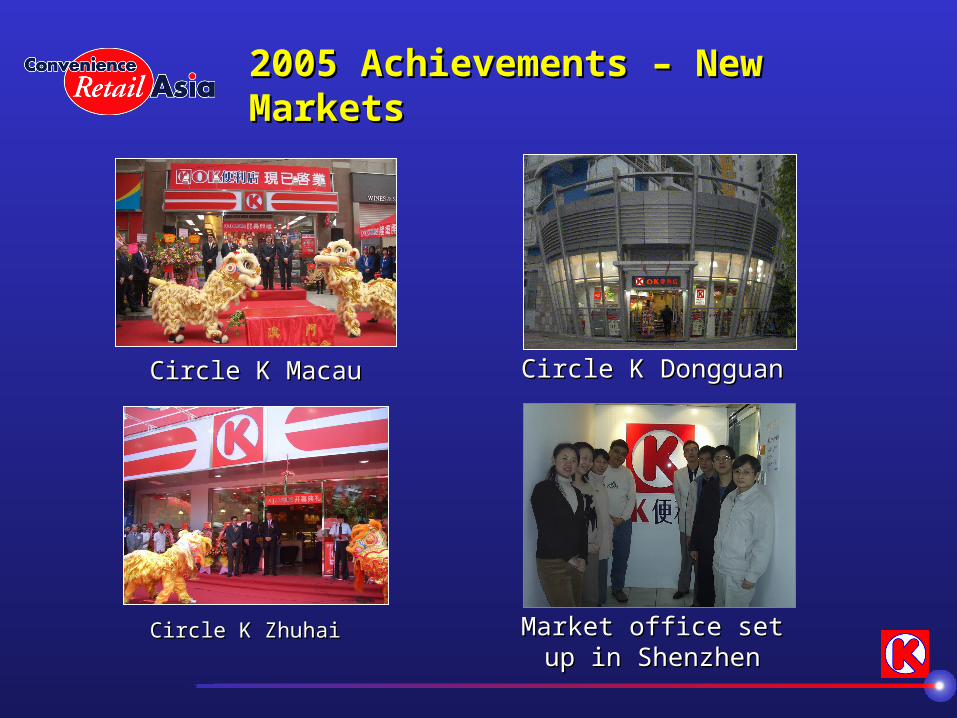
2005 Achievements – New Markets2005 Achievements – New Markets
Circle K MacauCircle K Macau
Circle K ZhuhaiCircle K Zhuhai
Circle K DongguanCircle K Dongguan
Market office set up Market office set up in Shenzhenin Shenzhen

2005 Achievements2005 Achievements
Caring Company Award 2005/2006Caring Company Award 2005/2006
Best Employers in Asia 2005 by Best Employers in Asia 2005 by
Hewitt Associates LLCHewitt Associates LLC

2006 Update & Outlook2006 Update & Outlook
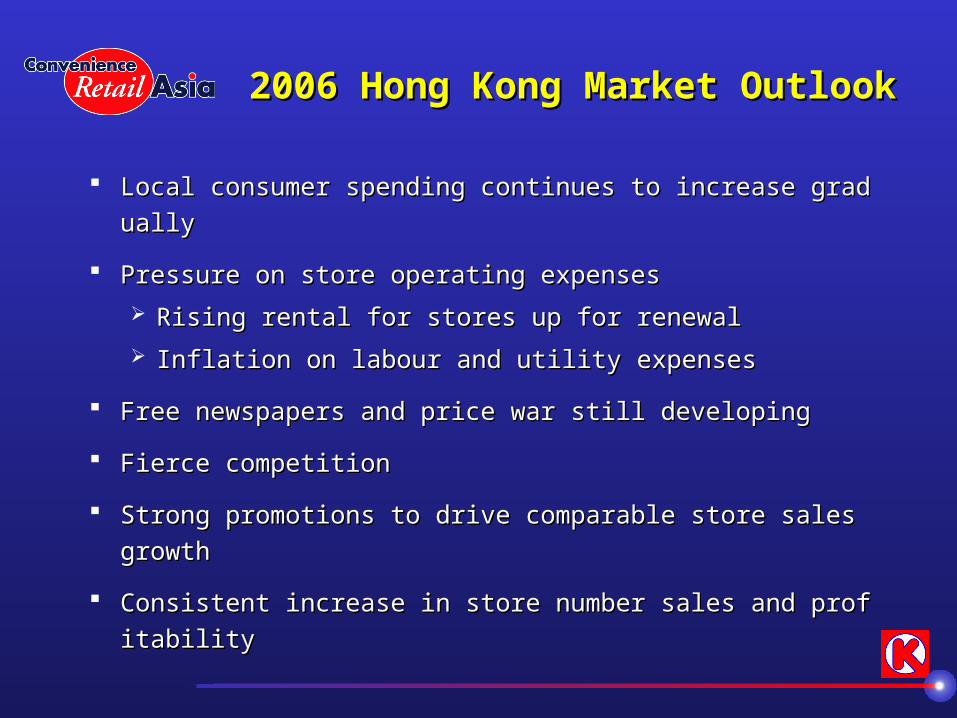
2006 Hong Kong Market Outlook2006 Hong Kong Market Outlook
Local consumer spending continues to increase graduallyLocal consumer spending continues to increase gradually
Pressure on store operating expensesPressure on store operating expenses
Rising rental for stores up for renewalRising rental for stores up for renewal
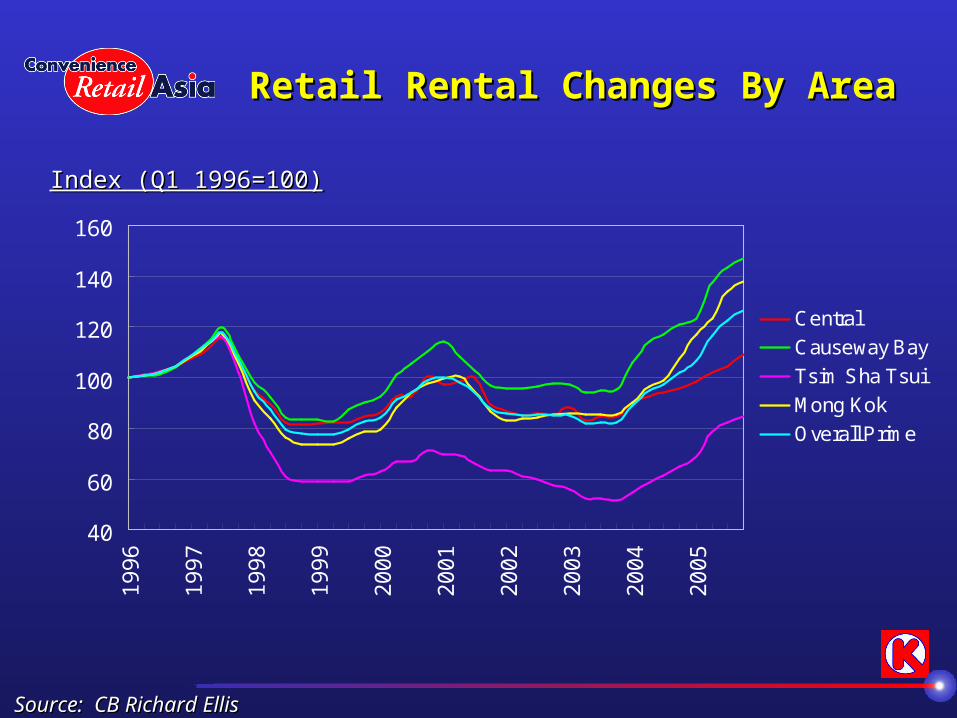
Retail Rental Changes By AreaRetail Rental Changes By Area
40
60
80
100
120
140
160
19
96
19
97
19
98
19
99
20
00
20
01
20
02
20
03
20
04
20
05
Central
Causeway Bay
Tsim Sha Tsui
Mong Kok
Overall Prime
Index (Q1 1996=100)Index (Q1 1996=100)
Source: CB Richard EllisSource: CB Richard Ellis
2006 Hong Kong Market Outlook2006 Hong Kong Market Outlook
Local consumer spending continues to increase graduallyLocal consumer spending continues to increase gradually
Pressure on store operating expensesPressure on store operating expenses
Rising rental for stores up for renewalRising rental for stores up for renewal
Inflation on labour and utility expensesInflation on labour and utility expenses
Free newspapers and price war still developingFree newspapers and price war still developing
Fierce competitionFierce competition
Strong promotions to drive comparable store sales growthStrong promotions to drive comparable store sales growth
Consistent increase in store number sales and profitabilityConsistent increase in store number sales and profitability
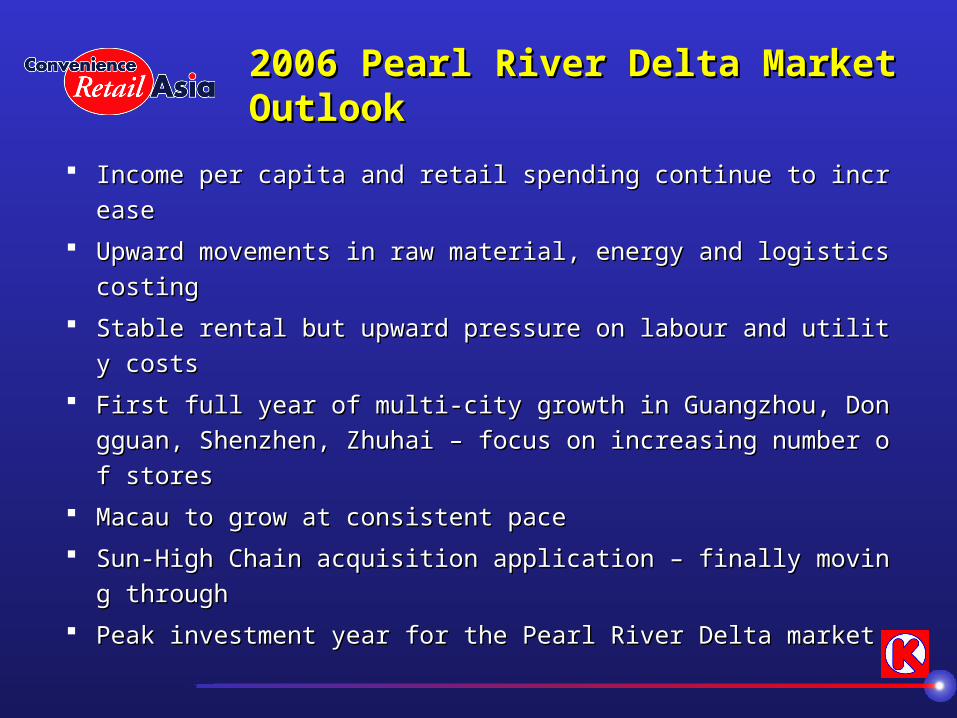
2006 Pearl River Delta Market Outlook2006 Pearl River Delta Market Outlook
Income per capita and retail spending continue to increaseIncome per capita and retail spending continue to increase
Upward movements in raw material, energy and logistics cosUpward movements in raw material, energy and logistics cos
tingting
Stable rental but upward pressure on labour and utility costsStable rental but upward pressure on labour and utility costs
First full year of multi-city growth in Guangzhou, Dongguan, First full year of multi-city growth in Guangzhou, Dongguan,
Shenzhen, Zhuhai – focus on increasing number of storesShenzhen, Zhuhai – focus on increasing number of stores
Macau to grow at consistent paceMacau to grow at consistent pace
Sun-High Chain acquisition application – finally moving throuSun-High Chain acquisition application – finally moving throu
ghgh
Peak investment year for the Pearl River Delta marketPeak investment year for the Pearl River Delta market
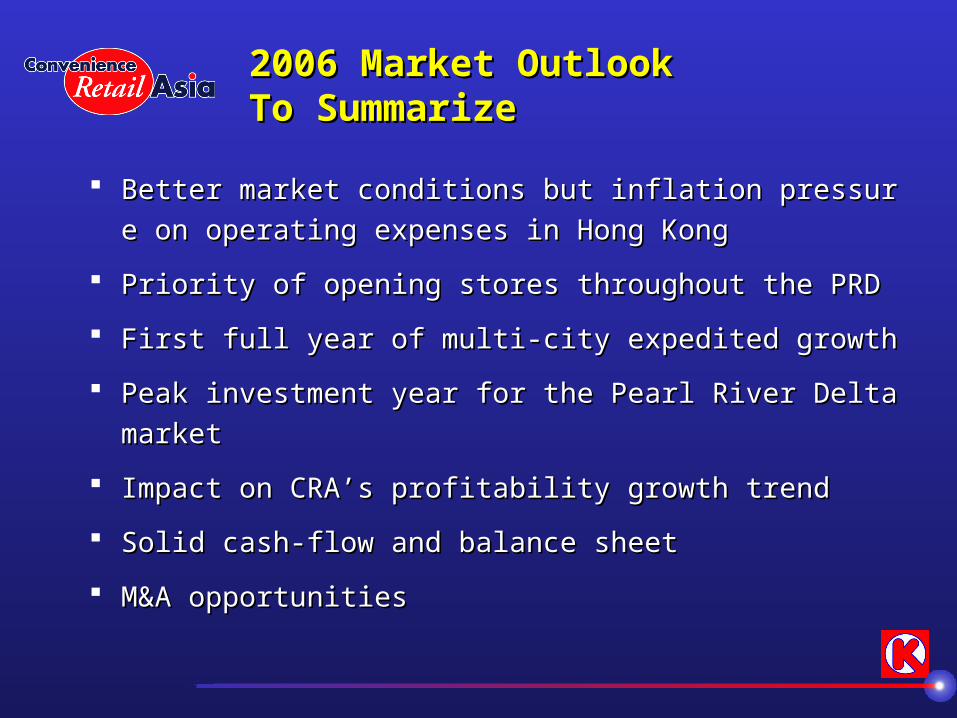
2006 Market Outlook2006 Market OutlookTo SummarizeTo Summarize
Better market conditions but inflation pressure on operBetter market conditions but inflation pressure on oper
ating expenses in Hong Kongating expenses in Hong Kong
Priority of opening stores throughout the PRDPriority of opening stores throughout the PRD
First full year of multi-city expedited growthFirst full year of multi-city expedited growth
Peak investment year for the Pearl River Delta marketPeak investment year for the Pearl River Delta market
Impact on CRA’s profitability growth trendImpact on CRA’s profitability growth trend
Solid cash-flow and balance sheetSolid cash-flow and balance sheet
M&A opportunitiesM&A opportunities
2005 Annual Results 2005 Annual Results PresentationPresentation
Member of Li & Fung GroupMember of Li & Fung Group 9 March 20069 March 2006