Embed Size (px)
Citation preview
8/8/2019 2005 Disaster in Numbers
http://slidepdf.com/reader/full/2005-disaster-in-numbers 1/2
8/8/2019 2005 Disaster in Numbers
http://slidepdf.com/reader/full/2005-disaster-in-numbers 2/2
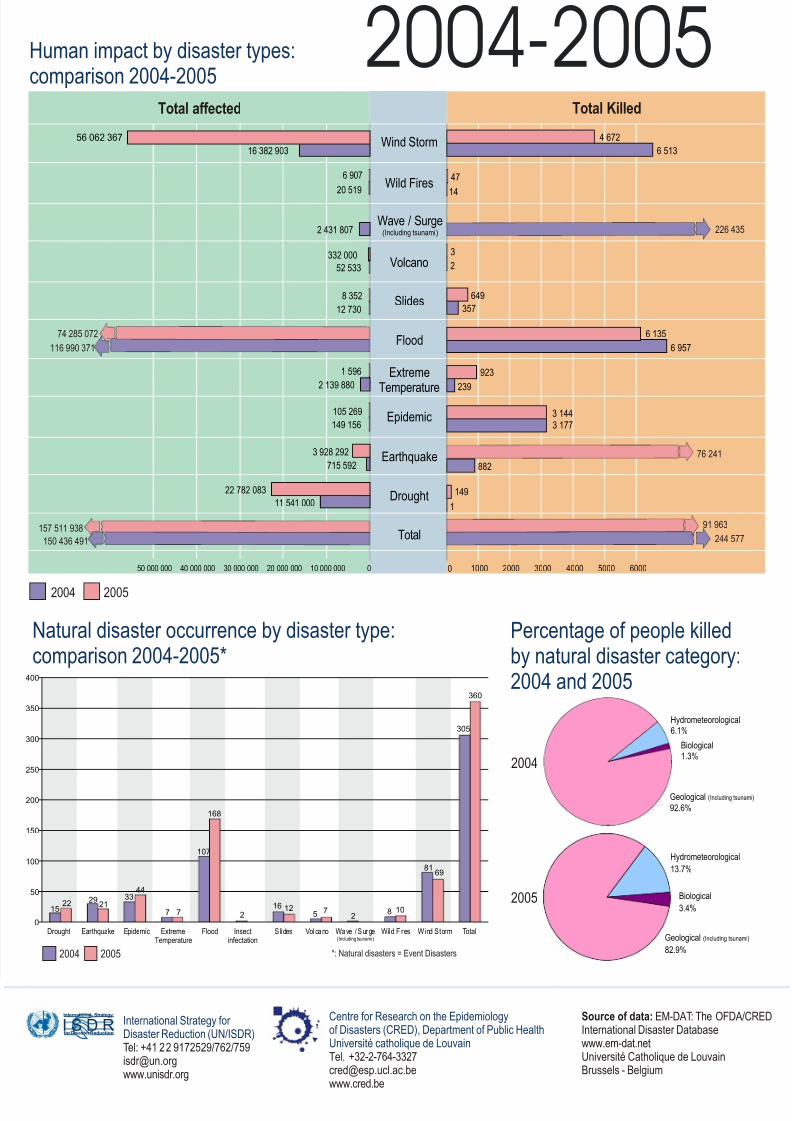
2004-2005
2005
2004
Natural disaster occurrence by disaster type:comparison 2004-2005*
Hydrometeorological6.1%
Biological1.3%
Geological Including tsunami( )
92.6%
Hydrometeorological13.7%
Biological3.4%
Geological Including tsunami( )
82.9%
357
2
14
649
3
47
12 730
52 533
2 431 807
20 519
16 382 903
8 352
332 000
6 907
56 062 367
Total affected Total Killed
226 435
1
882
3 177
239
149
3 144
923
6 135
11 541 000
715 592
149 156
2 139 880
22 782 083
3 928 292
105 269
1 596
6 957116 990 37174 285 072
76 241
244 57791 963
Human impact by disaster types:comparison 2004-2005
6 5134 672
150 436 491157 511 938 Total
Drought
Earthquake
Epidemic
Flood
Slides
Volcano
Wave / SurgeIncluding tsunami( )
Wild Fires
Wind Storm
Extreme
Temperature
I S D RInternational Strategy
for Disaster Reduction
Centre for Research on the Epidemiologyof Disasters (CRED), Department of Public HealthUniversité catholique de LouvainTel. [email protected]
1529 33
7
107
216
5 2 8
81
305
22 21
44
7
168
12 7 10
69
360
0
50
100
150
200
250
300
350
400
Slides Volcano Wave / SurgeIncluding tsunami( )
Wild Fires Wind StormDrought Earthquake Epidemic Flood TotalExtremeTemperature
Insectinfectation
International Strategy for Disaster Reduction (UN/ISDR)Tel: +41 22 9172529/762/[email protected]
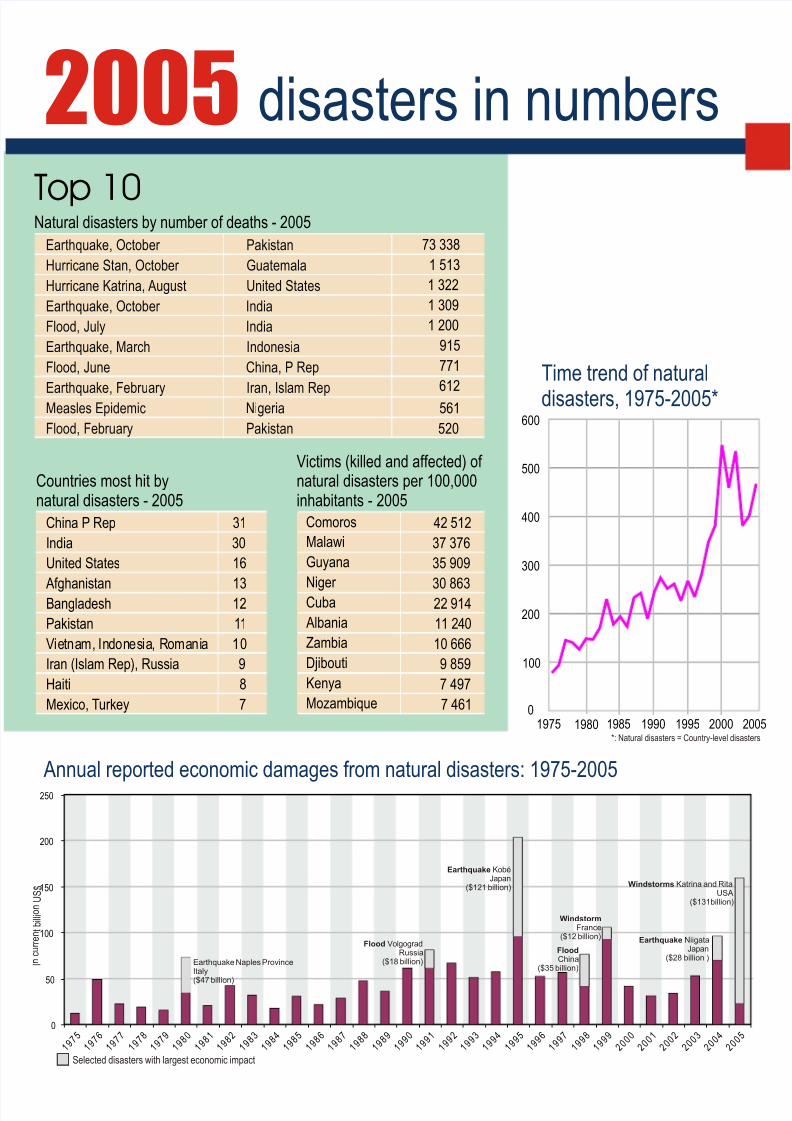
2005
2005
2004
2004
0 1000 2000 3000 4000 5000 6000010 000 00020 000 00030 000 00040 000 00050 000 000
Percentage of people killedby natural disaster category:2004 and 2005
Source of data: EM-DAT: The OFDA/CREDInternational Disaster Databasewww.em-dat.netUniversité Catholique de LouvainBrussels - Belgium
*: Natural disasters = Event Disasters