Embed Size (px)
Citation preview
2 0 0 5 P u b l i c O p i n i o n S u r v e y on Education in Indiana
Jonathan A. Plucker Terry E. Spradlin
Jason S. ZapfRosanne W. ChienRose A. Jackson
January 4, 2006
Prepared by the Center for Evaluation and Education Policy
Indiana UniversityBloomington, Indiana

2005 Public Opinion Survey onEducation in Indiana
Jonathan A. Plucker Terry E. Spradlin
Jason S. ZapfRosanne W. ChienRose A. Jacksonand Associates
January 4, 2006
Prepared by theCenter for Evaluation & Education Policy
Indiana UniversityBloomington, Indiana
Center for Evaluation& Education Policy
509 East Third StreetBloomington, IN 47401
812-855-4438Toll-Free in North America: 800-511-6575
Fax: 812-856-5890E-mail CEEP: [email protected] Site: http://ceep.indiana.edu/
Center for Evaluation and Education Policy
Acknowledgements
The Center for Evaluation and Education
Policy appreciates the individuals who pro-
vided insight and feedback on the develop-
ment and refinement of the questions
included in the 2005 Public Opinion Survey
on Education in Indiana. In particular, we are
grateful to John Ellis, Executive Director,
Indiana Association of Public School Super-
intendents; Stan Jones, Commissioner, Indi-
ana Commission for Higher Education;
Cheryl Orr, Administrator, Indiana’s Edu-
cation Roundtable; Bill Riley, Senior Fiscal
Analyst, Indiana Department of Education;
Lowell Rose, Executive Director Emeritus,
Phi Delta Kappa International; and David
Shane, Executive Assistant for Education
and Workforce Issues, Office of Governor
Mitch Daniels, for their assistance. Many of
the questions included in the 2005 Survey
were retained from the previous two public
opinion surveys, which in turn were also
based on input received from a number of
policymakers and education stakeholder
groups.

Center for Evaluation and Education Policy
Center for Evaluation and Education Policy
Table of Contents
Acknowledgements
I. Introduction . . . . . . . . . . . . . . . . . . . . . . . . . . . . . . . . . . . . . . . . . . . . . . . . . . . . . . . . . . . . . . . . 1
II. Methodology . . . . . . . . . . . . . . . . . . . . . . . . . . . . . . . . . . . . . . . . . . . . . . . . . . . . . . . . . . . . . . . 3
III. Summary of Key Findings . . . . . . . . . . . . . . . . . . . . . . . . . . . . . . . . . . . . . . . . . . . . . . . . . . . . 7
IV. Detailed Results . . . . . . . . . . . . . . . . . . . . . . . . . . . . . . . . . . . . . . . . . . . . . . . . . . . . . . . . . . . 13
A. Overall Evaluation of Public Schools in Indiana . . . . . . . . . . . . . . . . . . . . . . . . . . . . . 13
B. School Funding and Taxation Matters . . . . . . . . . . . . . . . . . . . . . . . . . . . . . . . . . . . . . 16
C. Pre-School and Kindergarten Issues . . . . . . . . . . . . . . . . . . . . . . . . . . . . . . . . . . . . . . 20
D. High School Drop-Out Rate Issues . . . . . . . . . . . . . . . . . . . . . . . . . . . . . . . . . . . . . . . 23
E. ISTEP+ and School Accountability . . . . . . . . . . . . . . . . . . . . . . . . . . . . . . . . . . . . . . . 25
F. School Choice, Vouchers, and Charter Schools . . . . . . . . . . . . . . . . . . . . . . . . . . . . . . 29
G. Teacher Quality and Pay. . . . . . . . . . . . . . . . . . . . . . . . . . . . . . . . . . . . . . . . . . . . . . . . 33
H. No Child Left Behind Act and PL 221 . . . . . . . . . . . . . . . . . . . . . . . . . . . . . . . . . . . . . 35
I. Achievement Gap . . . . . . . . . . . . . . . . . . . . . . . . . . . . . . . . . . . . . . . . . . . . . . . . . . . . . 38
Appendix A
Summary Tables for Open-ended Question 3B . . . . . . . . . . . . . . . . . . . . . . . . . . . . . . . A1
Appendix B
Demographic Results by Question . . . . . . . . . . . . . . . . . . . . . . . . . . . . . . . . . . . . . . . . . .B1
i of i

Center for Evaluation and Education Policy
Center for Evaluation and Education Policy 1 of 42
I In troduct ion
In November 2004, Mitch Daniels was
elected as Indiana’s first Republican gover-
nor since Governor Robert Orr’s term ended
in 1988. Upon taking office, Governor
Daniels stated his intent to bring new per-
spectives and priorities to state government.
This approach prompted many stakeholders
to ponder what the future would hold for K-
12 public education. Would the governor
sustain past initiatives focused on standards,
assessment, and accountability, or would he
chart a new course to reform public educa-
tion? As the governor enters his second year
in office, his views on education policy are
beginning to crystallize. These views, and
the governor’s positions on education issues
such as school funding, testing, and account-
ability, have the potential to sway public
opinion.
In addition to how the actions of the gover-
nor impact the K-12 education landscape, the
legislature continues to grapple with many
education issues, including school funding.
State budget cuts and delayed payments to
schools that were initiated in 2002 have not
yet been restored. Districts continue to con-
sider program reductions and limitations, in
addition to teacher layoffs, in an effort to
make ends meet. Educators are faced with
tighter budgets at a time when the demands
and expectations for high student achieve-
ment are increasing — in large part due to
the accountability provisions of the No Child
Left Behind Act of 2001. Therefore, educa-
tion will remain among the top policy priori-
ties for the state of Indiana for the
foreseeable future.
To gauge the level of public awareness,
understanding, and support for a number of
K-12 education issues, the Center for Evalu-
ation and Education Policy (CEEP) con-
ducted the 2003 Public Opinion Survey on
Education in Indiana (referred to as the
“Benchmark Survey” in this report). The for-
mat and structure of the 2003 Survey pro-
vided a research methodology that facilitated
replication and allows for longitudinal com-
parison of results.
Subsequently, the 2004 Public Opinion Sur-
vey on Education in Indiana (referred to as
the “Year 2 Survey” in this report) was con-
ducted in November of 2004. The results of
both the Benchmark Survey and Year 2 Sur-
vey generally reflected trends of positive
attitudes and perceptions for Indiana citizens
concerning K-12 education. The Year 3 Sur-
vey provided the opportunity to see if these
trends would continue, or whether changes
in the education policy climate have led to
less favorable views about public education.
2 of 42 Center for Evaluation and Education Policy
In preparing this survey, many questions
were retained from the Benchmark and Year
2 Surveys. Other questions were modified or
added to ensure that the primary education
policy issues confronting Indiana were
addressed (e.g., school funding, P-16 initia-
tives, ISTEP+ testing, vouchers, and teacher
salaries) or to improve the quality of the sur-
vey questions. The 2005 Public Opinion Sur-
vey on Education in Indiana examined public
perceptions on the following issues:
A. Overall Evaluation of Public Schools in Indiana
B. School Funding and Taxation Matters
C. Pre-school and Kindergarten Issues
D. High School Drop-out Rate Issues
E. ISTEP+ and School Accountability
F. School Choice, Vouchers, and Charter Schools
G. Teacher Quality and Pay
H. The No Child Left Behind Act and PL 221
I. The Achievement Gap in Indiana
This report summarizes the findings of the
Year 3 Survey. Where comparisons were
possible, Year 3 Survey results were com-
pared with those from the Benchmark and
Year 2 Surveys to identify trends in public
attitudes and perceptions. Results are
reported in summary for Indiana overall (see
Section III), and then, for comparison pur-
poses, are shown disaggregated by northern,
central, and southern Indiana regions, as well
as by demographic categories (see Section
IV).
Center for Evaluation and Education Policy 3 of 42
I I Methodology
The Public Opinion Survey on Education in
Indiana is a longitudinal effort to identify
and monitor Indiana residents’ attitudes
toward and perceptions of public education
issues. The study reports public opinion on
issues of major importance concerning pub-
lic schools and K-12 education policy. The
Benchmark Survey was conducted in
November 2003 and reflects the responses
from 1,001 telephone interviews conducted
from a random sample of Indiana house-
holds. As was the case with the previous
two surveys, the Year 3 Survey was con-
ducted in late fall 2005. Results of the Year
3 Survey, the second follow-up survey to
the Benchmark Survey, consist of the opin-
ions of 605 completed telephone interviews
of a random sample of Indiana households.
Questionnaire
The Center for Evaluation and Education
Policy developed a 31-item questionnaire
for the Year 3 Survey. Questions were based
on current and pressing issues in Indiana
education. Before formulating the ques-
tions, CEEP project staff consulted various
education polls conducted in other states
and the 37th Annual Phi Delta Kappa/Gal-
lup Poll of the Public’s Attitudes Toward
the Public Schools. In addition, in order to
ensure objectivity, project members sought
feedback regarding the draft questions from
a wide range of individuals with diverse
political and professional backgrounds.
New questions concerning opinions of how
to balance the state budget, P-16 initiatives,
ISTEP+ testing, and teacher salaries were
added for Year 3 along with selected word-
ing changes to some questions from the
Year 2 Survey. Questions for the Year 3
Survey were subjected to several rounds of
revision. Finally, questions were reviewed
for clarity, brevity, and potential bias by
Stone Research Services, the market
research company hired to conduct the
interviews, which also provided suggestions
for the questionnaire introduction, screen-
ing, qualifying questions, and demographic
questions.
Sampling Methodology
Participant households were selected from
an RDD (random digit dialing) sample pre-
pared by Survey Sampling, Inc. The sample
was drawn from all area codes and tele-
phone exchanges serving Indiana. RDD
sampling allows for the inclusion of both
published and non-published telephone
numbers. Non-published numbers include
new assignments, those that have not yet
4 of 42 Center for Evaluation and Education Policy
been published in telephone directories, as
well as numbers requested to be unlisted.
Year 3 Survey sampling also included the
use of a directory-listed sample targeted
toward African American- and Hispanic-ori-
gin households to augment the RDD sample.
The targeted sample was used to complete
approximately one-half of the two minority
quotas which were established for the Year 3
Survey. Race/ethnicity quotas were not
employed in the Benchmark or Year 2 Sur-
vey.
Participants were screened to be 18 years of
age or older and a resident of Indiana. One
adult per household was eligible to partici-
pate. Minimum and maximum quotas for
county of residence, age, and gender were
used to ensure the mix of respondents was
representative of Indiana’s population. In
order to ensure random selection within the
household, interviewers asked to speak with
the adult household member who had the
most recent birthday. A different adult in the
household became eligible if the designated
member represented a county, age, or gender
quota already completed.
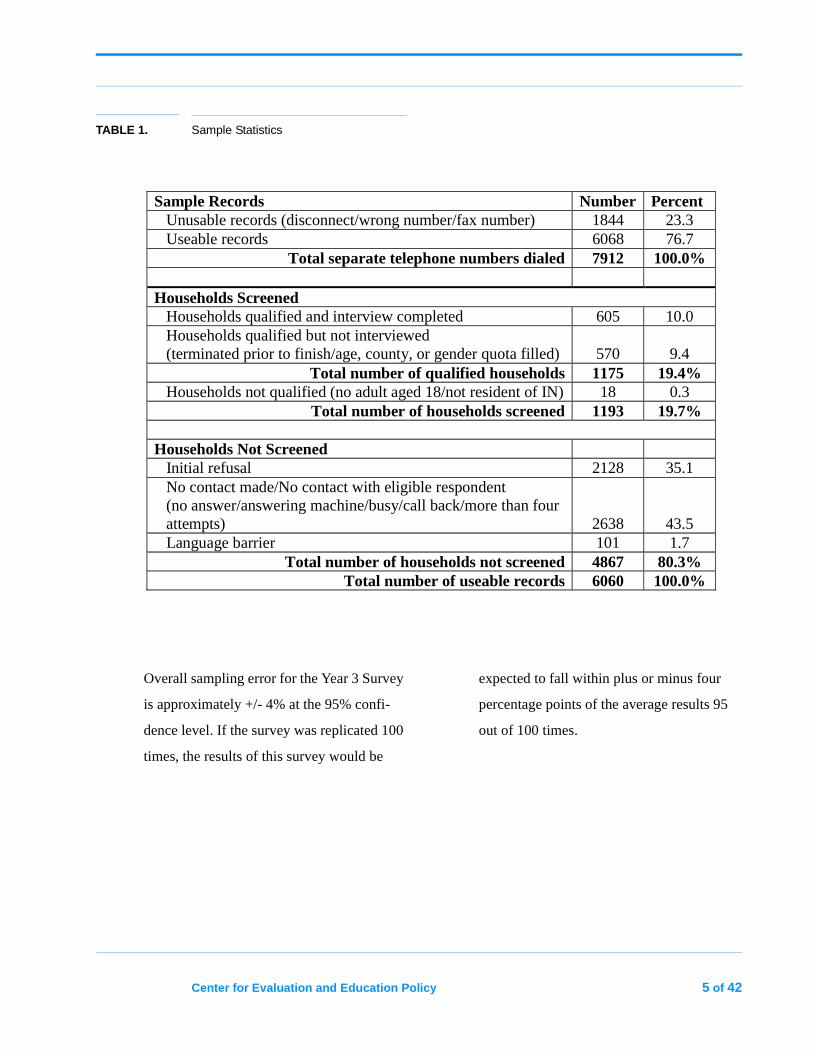
Screening interviews were completed with
1,193 households (see Table 1 for sampling
statistics). A total of 18 households did not
qualify (i.e., were not residents of Indiana or
no adult aged 18 or over) resulting in 1,175
households qualified to complete a survey.
Surveys were completed with 605 house-
holds. The remaining 570 qualified house-
holds were not used due to quota controls for
age, county, or gender. The ratio of initial
refusals to households screened (2,128/
1,193) was 1.8:1, which is lower (i.e., better)
than average for RDD samples.
Center for Evaluation and Education Policy 5 of 42
TABLE 1. Sample Statistics
Overall sampling error for the Year 3 Survey
is approximately +/- 4% at the 95% confi-
dence level. If the survey was replicated 100
times, the results of this survey would be
expected to fall within plus or minus four
percentage points of the average results 95
out of 100 times.
Sample Records Number Percent Unusable records (disconnect/wrong number/fax number) 1844 23.3 Useable records 6068 76.7
Total separate telephone numbers dialed 7912 100.0% Households Screened Households qualified and interview completed 605 10.0 Households qualified but not interviewed (terminated prior to finish/age, county, or gender quota filled)
570
9.4
Total number of qualified households 1175 19.4% Households not qualified (no adult aged 18/not resident of IN) 18 0.3
Total number of households screened 1193 19.7%
Households Not Screened Initial refusal 2128 35.1 No contact made/No contact with eligible respondent (no answer/answering machine/busy/call back/more than four attempts)
2638
43.5 Language barrier 101 1.7
Total number of households not screened 4867 80.3% Total number of useable records 6060 100.0%
6 of 42 Center for Evaluation and Education Policy
Demographic Information
Those surveyed in Year 3 were comprised of
45% male and 55% female, which is close to
the gender distribution within Indiana for the
2000 U.S. Census. The majority of respon-
dents (79%) lived in Indiana for 21 years or
more; 11% lived in the state for 11-20 years;
5% lived in Indiana for 6-10 years; and 5%
lived in the state for five years or less.
Approximately 48% of respondents had chil-
dren under the age of 18, 28% had children
in pre-school or kindergarten, 57% had chil-
dren in grade school, and 37% had children
in high school. The majority of respondents,
83%, indicated their primary race/ethnicity
as white, 8% as African American, and 3%
as Hispanic. Approximately 4% identified
their race/ethnicity as American Indian,
Asian, or Other. The remaining 2% either
refused to indicate a primary race/ethnicity
or did not know their primary race/ethnicity.
The racial/ethnic composition of Year 3 sur-
vey respondents is comparable to the racial/
ethnic distribution within Indiana for the
2000 U.S. Census. Additional demographic
information is available upon request.
State and regional results were weighted pro-
portionately to the Indiana population for
gender and race. Weighting adjusts for dif-
ferences between sample proportions and
population data and is accomplished by
assigning gender and race weight factors to
each response based on the individual
respondent’s demography. Men account for
48% of the Indiana population and 45% of
the Year 3 sample. Therefore, Year 3 Survey
males were weighted by a state factor of
1.0576 so that the combined responses for
men would account for 48% of total survey
responses.
Interviewing
In order to minimize bias, interviews were
conducted by professional market research
interviewers employed and managed by
Stone Research Services. Interviewing was
conducted from the Stone Research Services
call center in Bloomington, Indiana. Com-
puter Assisted Telephone Interviewing
(CATI) software was utilized to maintain
consistency of field procedures, including
questionnaire administration and sample
management, throughout the project.
Stone Research Services coded verbatim
responses for Question 3B and tabulated sur-
vey results. Results were tabulated in total for
Indiana and were also disaggregated for
northern, central, and southern Indiana
regions. Overall, the methodology used by
Stone Research Services provided a standard-
ized approach for reliable measurement of
public opinion on education issues in Indiana.
Center for Evaluation and Education Policy 7 of 42
I I I S u m m a r y o f K e y F i n d i n g s
Review of 2003 Benchmark Survey Results
Results from the 2003 Benchmark Survey
indicated that more than half of Hoosiers
have positive attitudes about public educa-
tion statewide. Considerably more citizens
express favorable views about the public
schools within their own communities. How-
ever, Indiana residents indicate that they are
generally unfamiliar with the initiatives
being implemented at the federal, state, and
local levels to improve academic perfor-
mance and increase school accountability.
Residents state a clear belief that the level of
funding makes a difference in school quality
and schools in the state are not receiving
enough funding to meet student needs.
Finally, Hoosiers continue to express strong,
positive attitudes about many of the educa-
tion initiatives being considered in the P-16
Plan for Improving Student Achievement
developed by the Indiana Education Round-
table.
Review of Year 2 (2004) Survey Results
The Year 2 Survey results reflected little
change from the Benchmark Survey, with a
few exceptions in the attitudes and percep-
tions of Hoosiers. Attitudes about the overall
performance of the public education system
in Indiana were slightly improved, with
nearly 6 in 10 residents saying that Indiana’s
public schools were excellent or good. More
significantly, 65% of Hoosiers responded
that schools in their community were excel-
lent or good and only 29% said their commu-
nity schools were fair or poor. Somewhat
surprisingly, the level of satisfaction with
Indiana’s public education system was quite
similar for households without children in
school compared to those with school-age
children. The level of public satisfaction was
even higher when residents were asked about
teacher quality. A total of 72% of the respon-
dents said that teachers were excellent or
good and only 24% rated the quality of Indi-
ana’s educators as fair or poor. Finally, a
majority of respondents indicated that they
believed public schools were underfunded,
that they would support a tax increase to
fund full-day kindergarten, that ISTEP+
holds schools accountable for student
achievement, and that closing the academic
achievement gap between groups of students
is important.
8 of 42 Center for Evaluation and Education Policy
Overall Attitudes Toward Public Schools and Teachers in 2005
With a few exceptions, the Year 3 Survey
results reflect little change statistically from
the Benchmark and Year 2 Surveys. Never-
theless, this information, coupled with the
polling results for the many new questions
posed in the Year 3 Survey, provides mean-
ingful information to policymakers and edu-
cators concerning public perceptions about
their programs and initiatives. Fifty-six per-
cent of respondents indicated they perceive
public schools in Indiana, on the whole, as
excellent or good, 30% said that public
schools in Indiana are fair, and approximately
7% percent said that public schools in Indi-
ana are poor. A higher percentage of resi-
dents (64%) said the schools in their
community, compared to schools in Indiana
on the whole, provide an excellent or good
education and only 30% percent said their
community schools are fair or poor. Similar
to the findings of the previous surveys, the
level of satisfaction with Indiana’s public
education system is quite similar for house-
holds without children in school compared to
those with school-age children. However,
unlike the findings of the previous surveys,
the level of satisfaction with Indiana’s public
education system is higher for men than
women. Furthermore, the level of public sat-
isfaction is even higher when residents were
asked about teacher quality. About 69% of
residents indicate that teachers are excellent
or good (a 3% decline from Year 2), and only
28% rate the quality of Indiana’s educators as
fair or poor (a 5% increase from Year 2).
Views on Whether Indiana’s Public Schools are Heading in the Right Direction
Although a majority of Indiana residents rate
local public schools favorably, 40% feel
schools have not changed for better or worse
over the past five years. Thirty-two percent
of respondents believe that schools have
improved, compared to 16% who indicate
that public schools have declined. For those
who express positive comments about the
direction of public education during the past
five years (see Appendix A for the coded
responses to Question 3B), the most fre-
quently cited reasons are: better curriculum
and general efforts to improve schools; an
increased level of academic achievement as a
result of ISTEP+; new or improved school
facilities and equipment; computers in
schools; and teachers doing a better job in
the classroom. The most frequently
expressed concerns about the direction of
public education are: fewer teachers and
larger classes; reduced funding for schools;
an insufficient emphasis on education and
students not learning enough; poor discipline
Center for Evaluation and Education Policy 9 of 42
in the classroom and school safety; and,
ISTEP+ scores that were too low. The
responses about the direction of public
schools have not significantly changed over
the three years of the Public Opinion Survey
on Education in Indiana.
Significant Changes in Public Perception and Attitudes from 2003 to 2005
A handful of changes in attitude or percep-
tion from the Benchmark Survey to the Year
3 Survey are noteworthy. Again, signifi-
cantly more respondents would oppose
reductions to K-12 public school funding,
and more citizens would be willing to pay
higher taxes so that school funding could be
increased. Additionally, the number of
respondents from Year 2 to Year 3 who
believe that spending on school facilities
and equipment is sufficient declined by 8
percentage points, though the percentage
change was split for those who feel too much
was spent on facilities and equipment and
those who believe that too little was spent in
this area. Support for full-day kindergarten,
if taxes had to increase to pay for this pro-
gram, increased from 46% in 2003 to 61% in
2005.
One surprising decline that occurred from
the Year 2 to the Year 3 Survey and merits
further scrutiny is public support for charter
schools. Since 2003, the percentage of
respondents that support the continued cre-
ation of more charter schools declined by
four percentage points from 54% to 50%.
Even more significant was the decline in
Hoosier support for charter school expansion
from 56% in Year 2 to 50% in the Year 3
Survey; conversely, those who stated opposi-
tion increased from 19% to 27% over the
same time period.
Finally, Indiana residents claiming to know a
little to a lot about the federal No Child Left
Behind Act increased from 62% in the
Benchmark Survey to 76% in the Year 3 Sur-
vey. However, the percentage of Hoosiers
that believe that the federal government’s
involvement in schools is helping improve
performance decreased from 43% to 31%
over the same time period.
School Funding and Taxation Matters
Public school finance remains a matter of
considerable public discourse in 2005. Dur-
ing his first year in office, Governor Daniels
advocated for greater efficiencies of school
corporation operations and more money for
“instruction rather than construction.” When
asked about their views of funding for public
schools, Indiana citizens once again express
10 of 42 Center for Evaluation and Education Policy
the sentiment that schools are underfunded
and indicate strong opposition to any reduc-
tions in K-12 funding that are intended to
help balance the state budget. In fact, the per-
centage of respondents who indicate that
they would oppose reductions in K-12 public
education spending increased by 16 percent-
age points to 76% from the Year 2 Survey,
reflecting the greatest percentage change for
all responses between the Year 2 and the
Year 3 Surveys. Additionally, 77% of Hoo-
siers believe the level of spending on public
schools does affect the quality of education
students receive, either somewhat or a lot,
and are willing to pay higher taxes (59%) so
that school funding can be increased. Lastly,
20% of respondents say that far too much or
more than a sufficient amount is spent for
facilities and equipment in their community,
43% say spending on facilities and equip-
ment is sufficient, and 18% say that less than
a sufficient amount or far too little is spent
on facilities and equipment.
Pre-School and Kindergarten Issues
The Year 3 Survey included a new question
concerning public support for pre-school
programs due to the increased discussion
surrounding these programs at the state and
national levels. Specifically, 78% of respon-
dents indicate that they would support state
funding for voluntary pre-school for at-risk
children. Interestingly, when this same pro-
gram option was provided toward the end of
the questionnaire as a strategy to close the
achievement gap between groups of stu-
dents, 72% indicate favorable support. Con-
cerning kindergarten issues, 83% of the
public support requiring kindergarten atten-
dance for students. A majority (53%) also
indicate that if the state were to implement
full-day kindergarten, they prefer the pro-
gram to be state funded and mandatory for
schools to offer and parents to enroll their
children. As previously mentioned, 61% of
respondents indicate that they would support
tax increases to fund full-day kindergarten.
High School Drop-Out Rates
In 2005, educators and policymakers in Indi-
ana extensively discussed high school gradu-
ation and drop-out issues while addressing
high school reform initiatives. Estimates
vary widely about the number of high school
students who do not complete high school on
time and drop out of school in Indiana, but
they are high enough by any estimate to gen-
erate a high level of public concern. A total
of 89% of respondents either strongly agree
or somewhat agree that Indiana’s high school
drop-out rates are significant and merit fur-
ther attention by educators and policymak-
Center for Evaluation and Education Policy 11 of 42
ers. One law change that 75% of Hoosiers
indicate they support would be raising the
drop-out age for high school from 16 to 18;
and 67% of residents would support the
withholding or revocation of students’
driver’s licenses and employment certificates
as a deterrent to dropping out of school.
ISTEP+ and School Accountability
As with the first two years of the Public
Opinion Survey on Education in Indiana, a
wide majority of residents (77% in the
Benchmark Survey; 74% in the Year 2 Sur-
vey; and 74% in the Year 3 Survey) indicate
that they are either somewhat or very familiar
with Indiana’s statewide standardized test,
ISTEP+. Also consistent with previous sur-
veys, respondents in the Year 3 Survey
believe that ISTEP+ has contributed to some
extent to improvements in the quality of edu-
cation in Indiana. They also agree that
ISTEP+ holds schools accountable for stu-
dent achievement and gives parents helpful
information about a school’s performance.
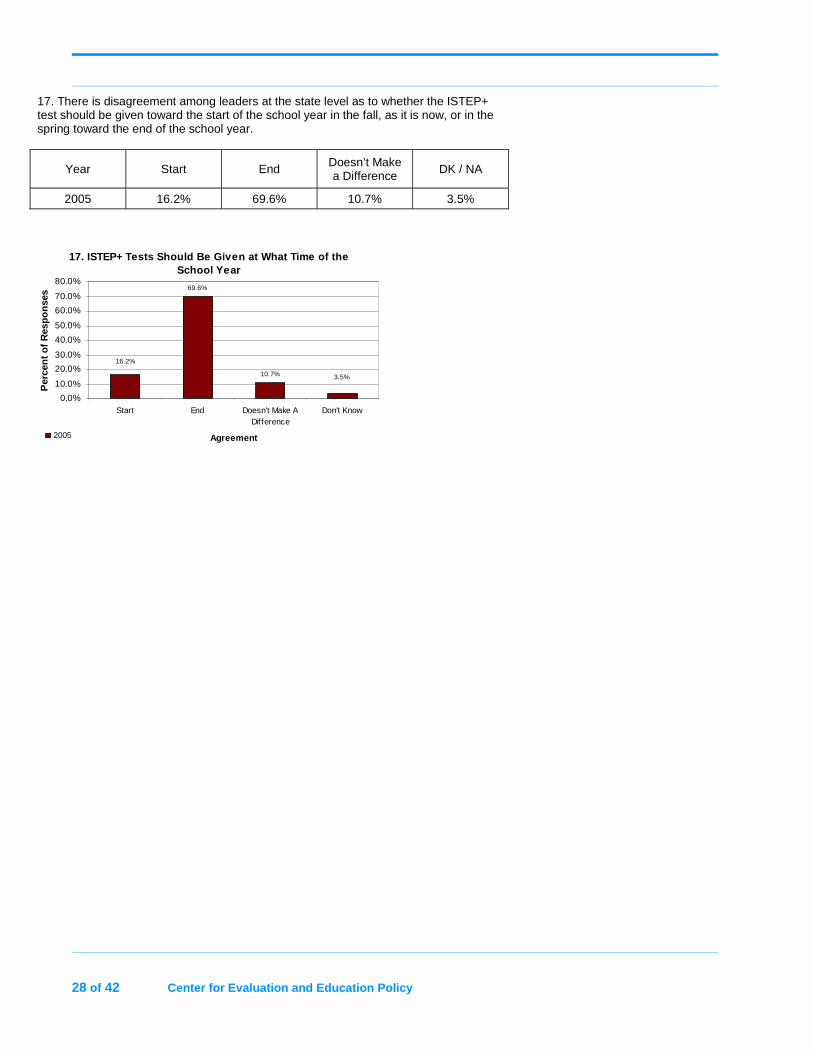
Finally, a new question posed on the Year 3
Survey addressed the time of the school year
that ISTEP+ is given. There is disagreement
among leaders at the state level as to whether
ISTEP+ tests should be given toward the start
of the school year in the fall, as it is now, or
in the spring toward the end of the school
year. A total of 70% of respondents indicate a
preference for spring testing, 16% indicate
fall, and 11% indicate that it did not make a
difference. Interestingly, respondents with
school-aged children are almost half as likely
to favor fall testing as people without school-
aged children (11% vs. 20%, respectively).
School Choice, Vouchers, and Charter Schools
The Year 3 Survey included questions about
school choice and other market-based educa-
tion reforms such as tuition vouchers and
charter schools. Seventy-nine percent of resi-
dents indicate a preference that efforts
should first be made to provide additional
assistance to students in low-performing
schools rather than transfer students to
another public school. When asked about
familiarity with taxpayer-funded credits, or
vouchers, that allow parent to pay tuition for
their children at a public or private school of
their choice, 65% say that they are not very
familiar with or have never heard of vouch-
ers. Slightly more respondents indicate that
they favor rather than oppose (48% to 44%)
the use of vouchers to permit students at a
low-performing school to attend a different
public or private school. Of those respon-
dents that indicate support for vouchers, 73%
express support for public and private school
options, 23% for public school enrollment
12 of 42 Center for Evaluation and Education Policy
options only, and 12% for private school
enrollment options only. Finally, Hoosiers
were asked two questions about charter
schools (see Section IV for a definition of
charter schools). Thirty-eight percent of
respondents say they are somewhat or very
familiar with charter schools and 62% report
that they are not very familiar or not familiar
at all with charter schools. When asked if
they favor or oppose the continued creation
of charter schools beyond the 30 schools in
operation during the 2005-06 school year,
50% of those who had some knowledge of
charter schools express support for the cre-
ation of additional charter schools, 27%
oppose more charter schools, and 23% say
that they don’t know or didn’t have a posi-
tion. The results of both charter school ques-
tions are an indication of public indecision
about charter schools.
Achievement Gap
Consistent with the Year 2 Survey, several
questions were posed to Indiana citizens in
the Year 3 Survey about the achievement
gaps that exist between racial/ethnic groups
of students, and between students from low
and high income families. Questions from
the Year 2 and Year 3 Surveys were similar
to questions presented on the 2004 and 2005
Phi Delta Kappa/Gallup Polls conducted
nationally. Indiana polling results closely
mirror the results in the national polls. In
Indiana, 94% of citizens respond that closing
the achievement gap is important to some
extent (67% very important; 27% somewhat
important) compared to 90% nationally.
Indiana residents agree with the national
respondents that the achievement gap prob-
lem is a product of societal factors such as
family income or the education attainment of
parents, not the quality of schooling received
in public schools. As with the Year 2 Survey,
increased parental participation and addi-
tional instructional time for low-performing
students are the options most frequently sup-
ported as strategies to close the achievement
gap in the Year 3 Survey.
Center for Evaluation and Education Policy 13 of 42
I V D e ta i l e d R e s u l ts
A. Overall Evaluation of Public Schools in Indiana
A total of 56% of respondents indicate they
perceive public schools in Indiana, on the
whole, as excellent or good, 30% say public
schools in Indiana are fair, and 7% say pub-
lic schools in Indiana are poor. A majority of
residents (64%) say the schools in their com-
munity provide an excellent or good educa-
tion, 23% say their community schools are
fair, and only 7% percent say their commu-
nity schools provide a poor education. Like
the findings of the previous surveys, the
level of satisfaction with Indiana’s public
education system is quite similar for house-
holds without children in school compared to
those with school-age children. However,
unlike the findings of the previous surveys,
the levels of satisfaction with Indiana’s pub-
lic education system and schools in the
respondents’ communities are higher for
men than women. A total of 57% of men
indicate that public schools in Indiana pro-
vide an excellent or good education com-
pared to 55% of women who feel similarly.
Even more significantly, 67% of men say the
schools in their community provide an excel-
lent or good education compared to 61% of
women who respond likewise. Furthermore,
satisfaction with public education is higher
in northern and southern Indiana compared
to central Indiana, as well as for respondents
that are college graduates, have annual
incomes between $50,000-$75,000, and are
white.
Although a majority of Indiana residents rate
local public schools favorably, 40% feel
schools have not changed for better or worse
over the past five years. Thirty-two percent
of respondents believe that schools have
improved over the past five years, compared
to 16% who indicate that public schools have
declined. Respondents that most frequently
express the belief that schools have
improved included: men; individuals 45-54
years of age or 65 and older; college gradu-
ates; adults without school-age children; and
white residents.
For those who express positive comments
about the direction of public education dur-
ing the past five years (see Appendix A for
the coded responses to Question 3B), the
most frequently cited reasons are: better cur-
riculum and general efforts to improve
schools; an increased level of academic
achievement as a result of ISTEP+; new or
improved school facilities and equipment;
computers in schools; and teachers doing a
better job in the classroom. The most fre-
quently expressed concerns about the direc-
14 of 42 Center for Evaluation and Education Policy
tion of public education are: fewer teachers and
larger classes; reduced funding for schools; an
insufficient emphasis on education and students
not learning enough; poor discipline in the class-
room and school safety; and, ISTEP+ scores that
were too low. The responses about the direction of
public schools have not significantly changed
over the three years of the Public Opinion Survey
on Education in Indiana.
Question by Question Results
(Percentages may not sum to 100% due to rounding.)
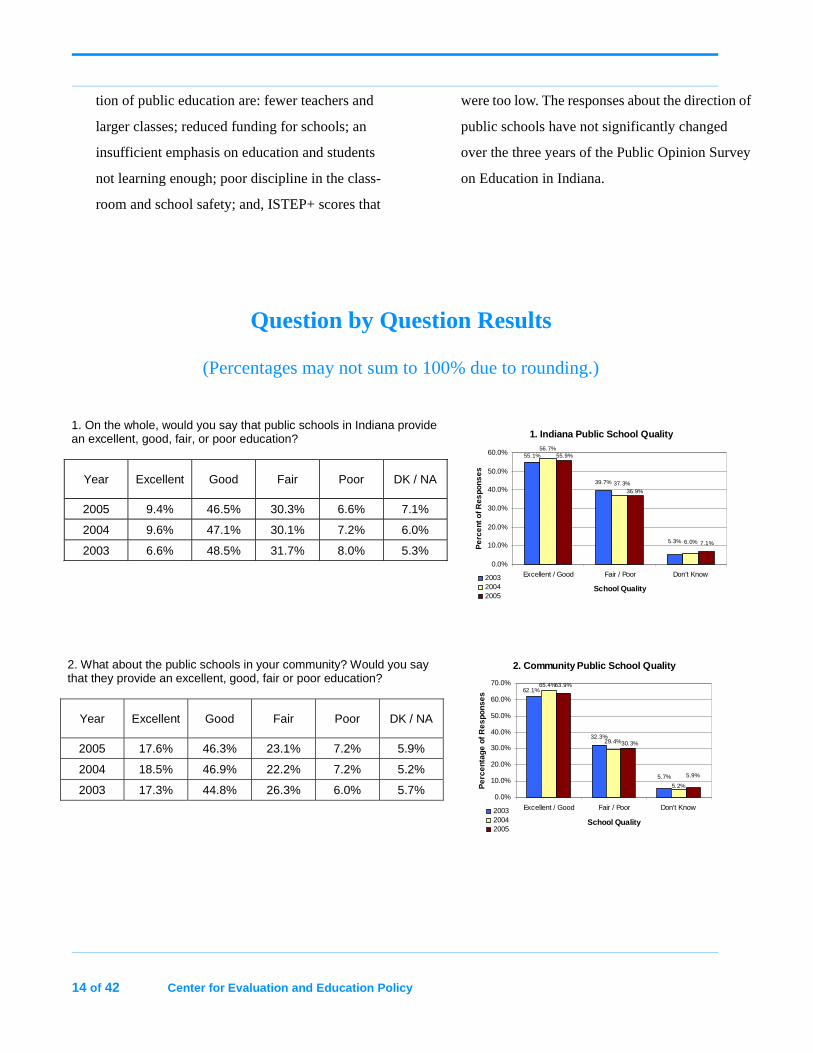
1. On the whole, would you say that public schools in Indiana provide an excellent, good, fair, or poor education?
Year Excellent Good Fair Poor DK / NA
2005 9.4% 46.5% 30.3% 6.6% 7.1%
2004 9.6% 47.1% 30.1% 7.2% 6.0%
2003 6.6% 48.5% 31.7% 8.0% 5.3%
1. Indiana Public School Quality
39.7%
7.1%5.3%
55.1%
37.3%
56.7%
6.0%
55.9%
36.9%
0.0%
10.0%
20.0%
30.0%
40.0%
50.0%
60.0%
Excellent / Good Fair / Poor Don't Know
School Quality
Pe
rce
nt o
f Res
pon
ses
200320042005
2. What about the public schools in your community? Would you say that they provide an excellent, good, fair or poor education?
Year Excellent Good Fair Poor DK / NA
2005 17.6% 46.3% 23.1% 7.2% 5.9%
2004 18.5% 46.9% 22.2% 7.2% 5.2%
2003 17.3% 44.8% 26.3% 6.0% 5.7%
2. Community Public School Quality
32.3%
63.9%
5.7%
62.1%
29.4%
5.2%
65.4%
5.9%
30.3%
0.0%
10.0%
20.0%
30.0%
40.0%
50.0%
60.0%
70.0%
Excellent / Good Fair / Poor Don't Know
School Quality
Per
cent
age
of R
espo
nses
200320042005
Center for Evaluation and Education Policy 15 of 42
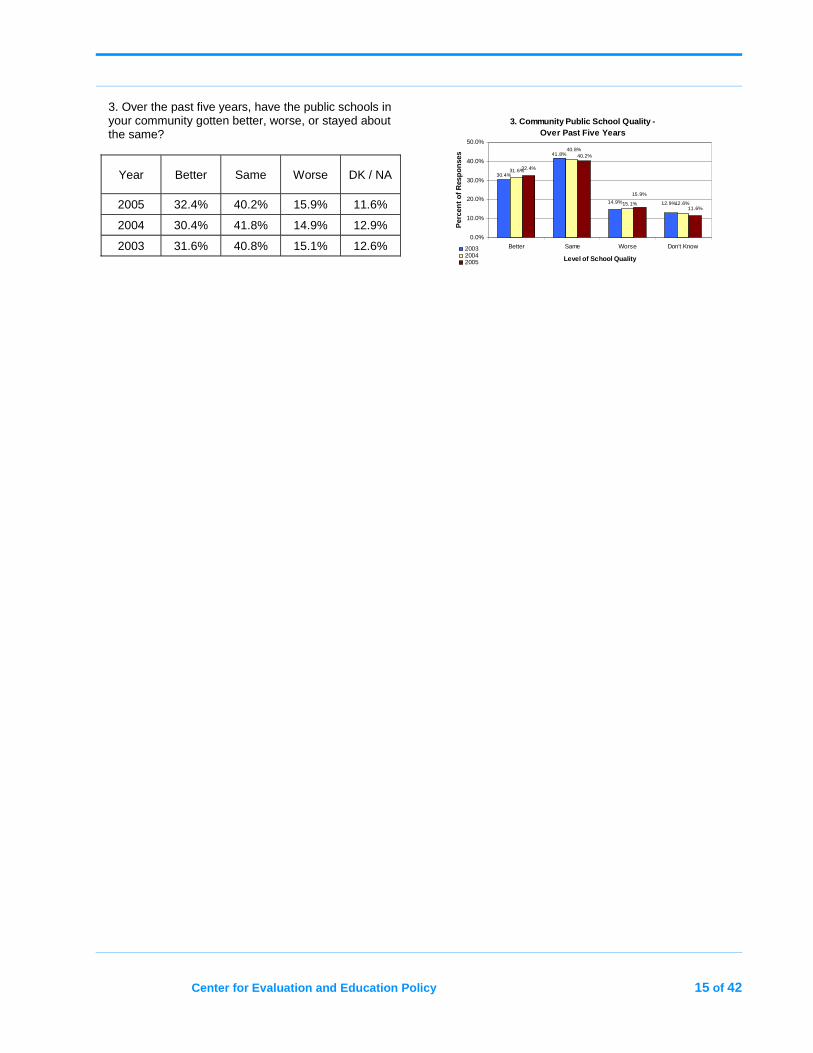
3. Over the past five years, have the public schools in your community gotten better, worse, or stayed about the same?
Year Better Same Worse DK / NA
2005 32.4% 40.2% 15.9% 11.6%
2004 30.4% 41.8% 14.9% 12.9%
2003 31.6% 40.8% 15.1% 12.6%
3. Community Public School Quality - Over Past Five Years
14.9%
32.4%
11.6%
30.4%
12.9%
41.8%
12.6%15.1%
40.8%
31.6%
15.9%
40.2%
0.0%
10.0%
20.0%
30.0%
40.0%
50.0%
Better Same Worse Don't Know
Level of School Quality
Per
cen
t o
f R
esp
on
ses
200320042005
16 of 42 Center for Evaluation and Education Policy
B. School Funding and Taxation Matters
Public school finance remained a significant
education policy issue in 2005. During his
first year in office, Governor Daniels advo-
cated for greater efficiencies of school cor-
poration operations and for more money for
“instruction rather than construction.” 2005
also marked a budget year for the Indiana
General Assembly and the development of a
new school funding formula that changed
how schools are funded. When asked about
their views of funding for public schools,
Indiana citizens once again expressed the
sentiment that schools are underfunded and
indicated strong opposition to any reductions
in K-12 funding that are intended to help bal-
ance the state budget.
A total of 77% of Hoosiers feel the level of
spending on public schools does affect the
quality of education students receive, either
somewhat or a lot, compared to 17% of
respondents who say “a little or not at all.”
When asked whether funding for public
schools in Indiana is enough to meet needs,
62% of citizens say school funding levels are
not enough to meet needs, compared to 32%
of citizens who indicate that funding levels
are sufficient. If further actions, such as
spending cuts, were necessary to ensure a
balanced state budget, 77% of respondents
indicate that they would oppose reductions in
K-12 public education spending. The
response to this question reflected the great-
est percentage change for all responses
between the Year 2 and the Year 3 Surveys
— an increase of 16 percentage points. Fur-
thermore, a majority of citizens remain will-
ing to pay higher taxes (59%) so that school
funding can be increased, up from 49% in
the Benchmark Survey. Lastly, 20% of
respondents say that far too much or more
than a sufficient amount is spent for facilities
and equipment in their community, 43% say
spending on facilities and equipment is suffi-
cient, and 18% say that less than a sufficient
amount or far too little is spent on facilities
and equipment.
Demographic differences (see Appendix B
for demographic results by question) for the
questions concerning school funding and
taxation matters are apparent. Respondents
age 18-34, college graduates, those earning
$50,000-$75,000, and minority residents are
most likely to say that the amount of money
spent on public education affects the quality
of education students receive. When asked
whether funding levels for schools are suffi-
cient or not, men, individuals 65 and older,
respondents with incomes at $75,000 or
above, residents in southern Indiana, and
white respondents are the most likely to say
funding levels are sufficient. On the other
hand, women, those with some college,
Center for Evaluation and Education Policy 17 of 42
respondents with incomes between $35,000-
$50,000, residents in central Indiana, and
minority citizens are the most likely to say
funding levels are insufficient. Respondents
most willing to pay higher taxes so that
school funding can be increased are females,
adults ages 18-34, college graduates, individ-
uals with incomes above $75,000, adults
with children in school, and central Indiana
residents. Conversely, men, adults ages 65
and older, citizens with incomes between
$35,000-$50,000, and residents in northern
Indiana are the least willing to pay higher
taxes to increase funding for schools.
Finally, minority residents are far more
likely than any other demographic group to
indicate that the expenditure of funds on
facilities and equipment is “less than a suffi-
cient amount or far too little.”
Question by Question Results
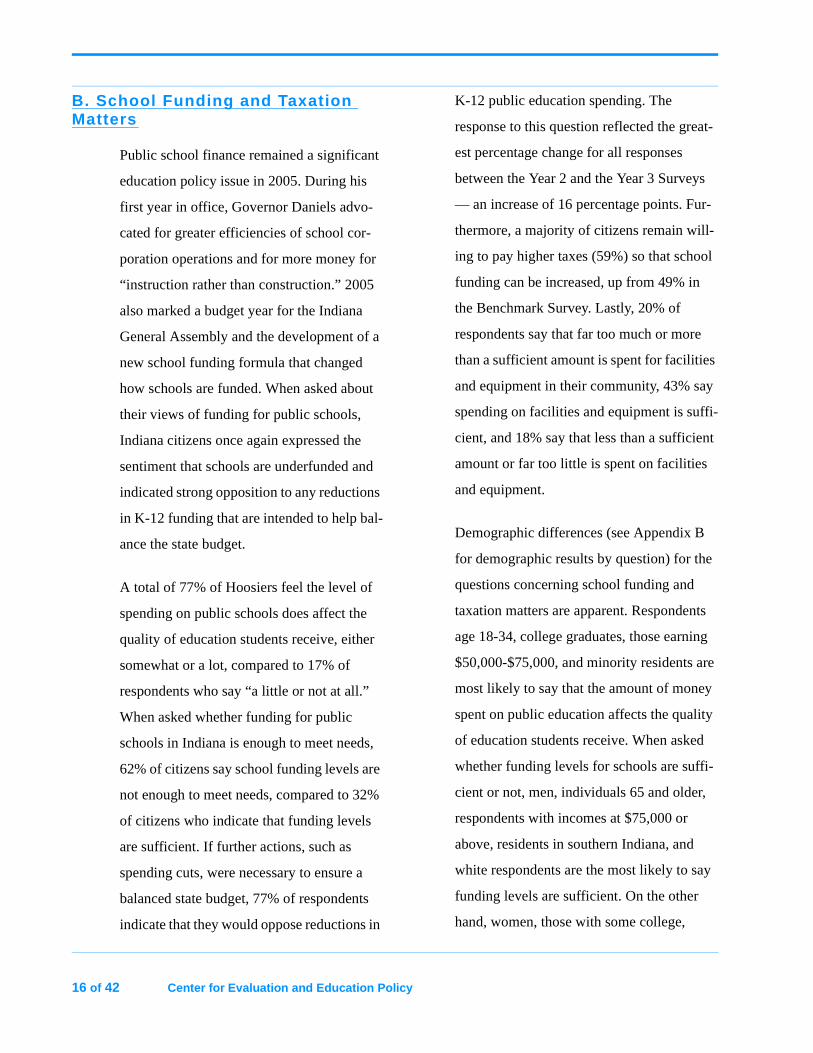
4. In your opinion, how much does the amount of money spent on the public schools affect the quality of students’ education? Would you say a lot, somewhat, a little, or not at all?
Year A Lot Some-what A Little Not At
All DK / NA
2005 48.4% 28.1% 13.2% 3.6% 6.7%
2004 47.4% 33.0% 9.2% 5.1% 5.4%
2003 48.0% 28.6% 12.9% 5.2% 5.4%
4. Impact of Money Spent on Schools on Quality of Students' Education
76.6%
18.1%
76.5%
16.8%
6.7%5.4% 5.4%
80.4%
14.3%
0.0%
10.0%
20.0%
30.0%
40.0%
50.0%
60.0%
70.0%
80.0%
90.0%
A Lot / Somew hat A Little / Not At All Don't Know
Impact
Per
cent
of R
espo
nses
200320042005
5. Overall, do you think the funding for public schools in Indiana is enough to meet their needs, or not enough to meet their needs?
Year Enough Not Enough
DK / NA
2005 32.3% 61.9% 5.8%
2004 28.1% 64.2% 7.7%
2003 31.0% 59.3% 9.7%
5. Is Public School Funding Enough to Meet Schools' Needs?
31.0%
59.3%
9.7%
28.1%
7.7%
32.3%
61.9%64.2%
5.8%
0.0%
10.0%
20.0%
30.0%
40.0%
50.0%
60.0%
70.0%
Enough Not Enough Don't Know
Amount of Funding
Per
cen
t o
f R
esp
on
ses
200320042005
18 of 42 Center for Evaluation and Education Policy
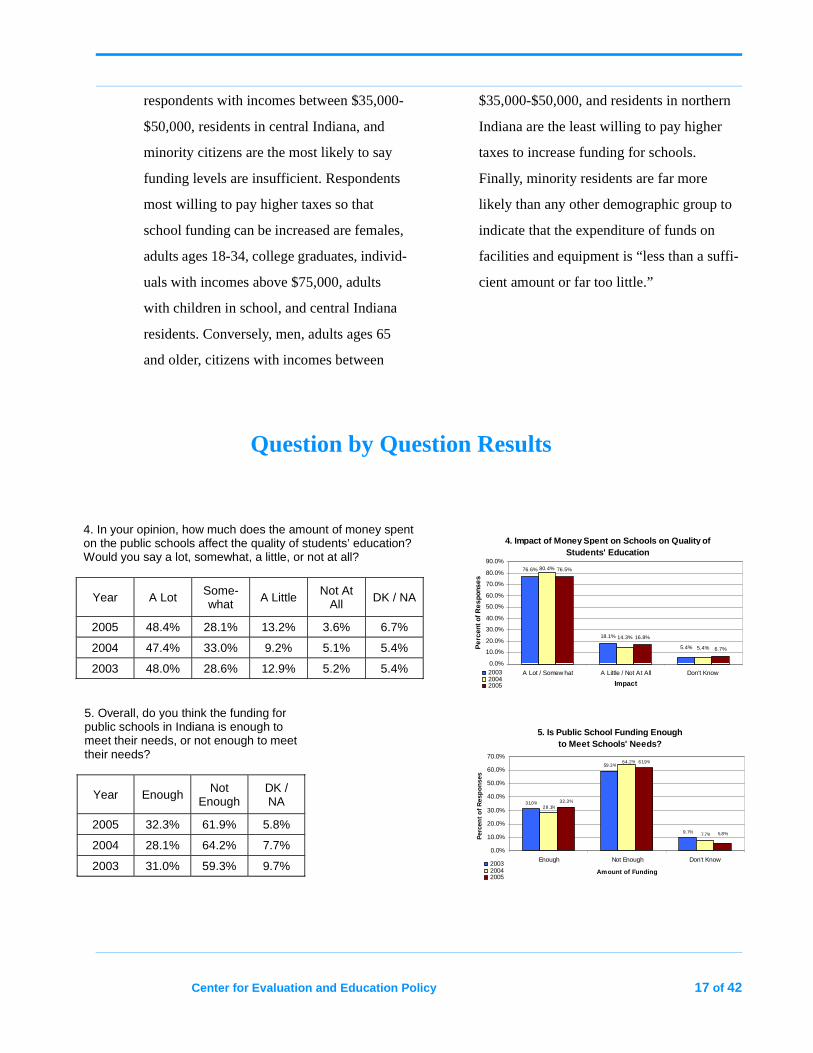
6A. To ensure a balanced state budget, which of these options would you support?
Year Combi-nation
Efficient Gov’t
Cut Spend-
ing
Raise Taxes
None of the
Above DK / NA
2005 52.7% 34.0% 6.2% 2.8% 2.0% N/A
2004 54.4% N/A 28.9% 6.7% 3.6% 6.0%
6A. Options to Balance Budget
28.9%
2.0%
6.0%6.7%
3.6%
54.4%
6.2%
2.8%
52.7%
34.0%
0.0%
10.0%
20.0%
30.0%
40.0%
50.0%
60.0%
Ef f icient
Gov 't
Cut Spending Raise Taxes Combination None of the
Abov e
Don't Know
Options
Per
cent
of R
espo
nses
2004
2005
6C. What kind of tax increase do you think would be best – sales tax, income tax, real estate property tax, or personal property tax, or business corporate tax?
Year Business
Corp Tax
Sales Tax
Income Tax
Real Estate
Property Tax
Personal Property
Tax DK / NA
2005 45.9% 31.8% 6.0% 2.5% 2.4% 11.5%
2004 40.5% 35.1% 6.0% 2.6% 2.6% 13.1%
2003 N/A 51.0% 14.1% 12.9% 13.1% 8.8%
6C. Best Type of Tax Increase
51.0%
40.5%
12.9% 13.1%8.8%
14.1% 13.1%
2.6%2.6%
6.0%
35.1%
2.5%6.0%
31.8%
2.4%
11.5%
45.9%
0.0%
10.0%
20.0%
30.0%
40.0%
50.0%
60.0%
Sales Income Real EstateProperty
PersonalProperty
BusinessCorporate
Don't Know
Types of Taxes
Per
cent
of R
espo
nses
200320042005
6B. If spending cuts were necessary, would you be willing to support reductions in spending on K-12 public education?
Year Would
Support Reductions
Would Not Support
Reductions
Don’t Know Refused
2005 19.2% 76.6% 4.3% N/A
2004 32.4% 60.3% 7.2% 0.2%
6B. Support Reductions in Spending on K-12 Public Education
7.2%
19.2%
76.6%
60.3%
0.2%
32.4%
4.3%
0.0%
10.0%
20.0%
30.0%
40.0%
50.0%
60.0%
70.0%
80.0%
90.0%
Would Support Would Not Support Don't Know Refused
Support
Per
cent
of R
espo
nses
20042005
Center for Evaluation and Education Policy 19 of 42
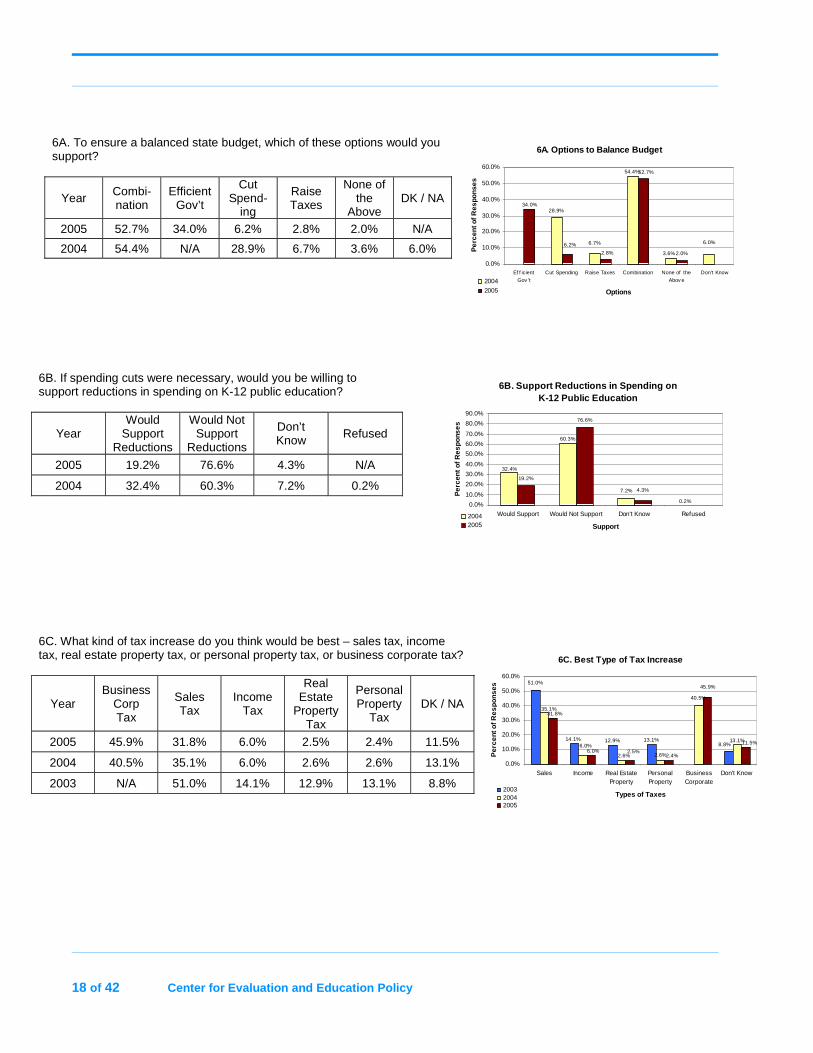
6D. Would you be willing to pay higher taxes so that school funding could be increased?
Year Willing Not Willing DK / NA
2005 58.9% 37.4% 3.6%
2004 58.2% 34.6% 7.2%
2003 48.8% 44.7% 6.6%
6D. Willingness to Pay Higher Taxes to Increase School Funding
48.8%
58.2%
7.2%
58.9%
37.4%
6.6%
44.7%
34.6%
3.6%
0.0%
10.0%
20.0%
30.0%
40.0%
50.0%
60.0%
70.0%
Willing Not Willing Don't Know
Willingness
Per
cent
of R
espo
nses
200320042005
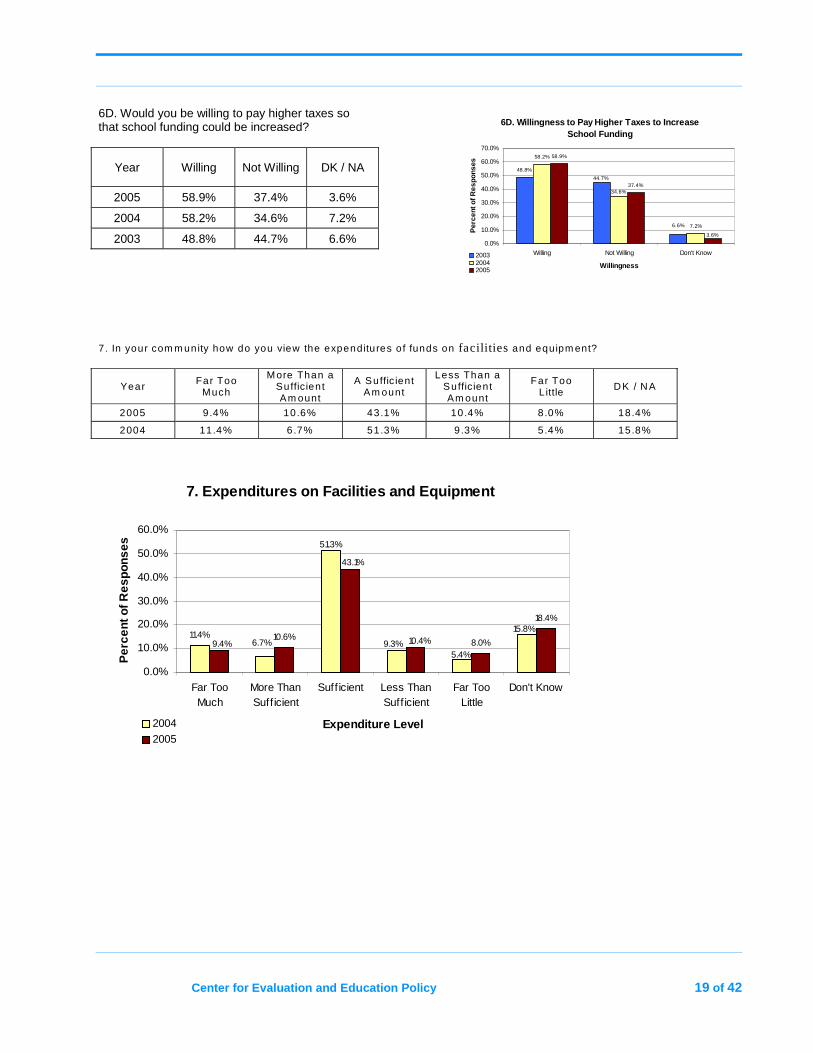
7 . In your com m unity how do you view the expenditures o f funds on facilities and equipm ent?
Year Far Too Much
More Than a Sufficient Am ount
A Suffic ient Am ount
Less Than a Sufficient Am ount
Far Too L ittle DK / NA
2005 9.4% 10.6% 43.1% 10.4% 8.0% 18.4%
2004 11.4% 6.7% 51.3% 9.3% 5.4% 15.8%
7. Expenditures on Facilities and Equipment
11.4% 10.6%8.0%
18.4%
51.3%
9.3%5.4%
6.7%
15.8%
9.4% 10.4%
43.1%
0.0%
10.0%
20.0%
30.0%
40.0%
50.0%
60.0%
Far TooMuch
More ThanSuff icient
Suff icient Less ThanSuff icient
Far TooLittle
Don't Know
Expenditure Level
Per
cent
of R
espo
nses
2004
2005
20 of 42 Center for Evaluation and Education Policy
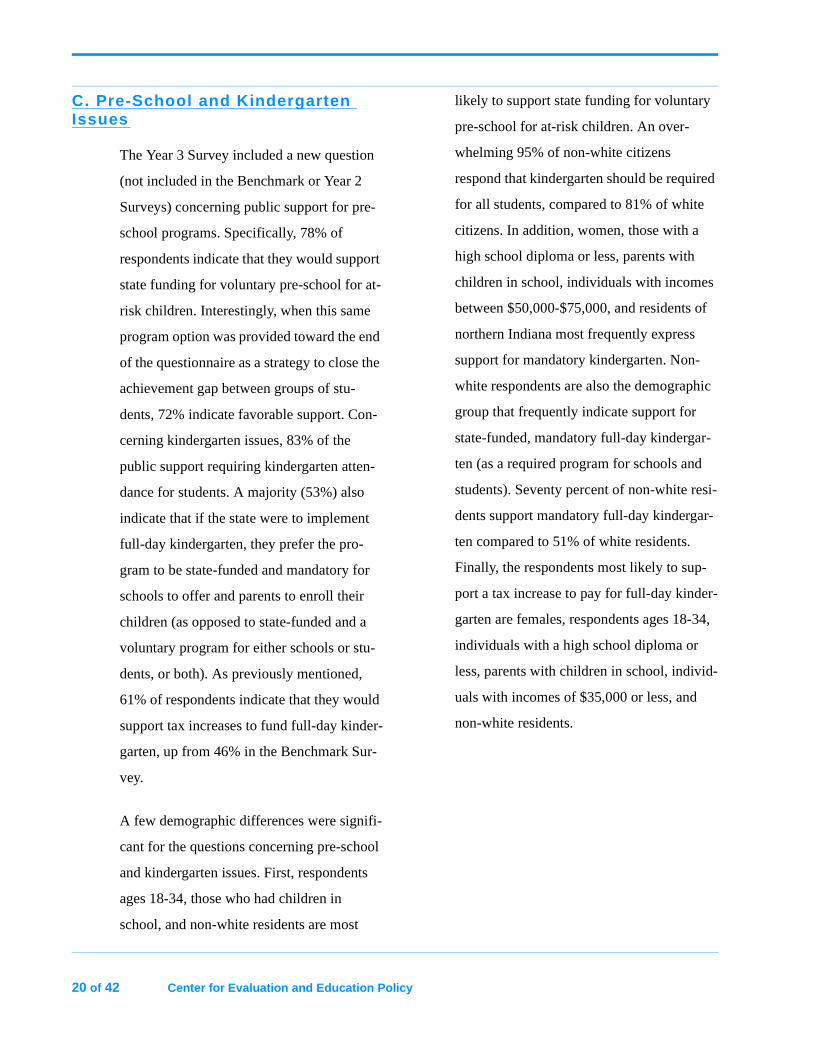
C. Pre-School and Kindergarten Issues
The Year 3 Survey included a new question
(not included in the Benchmark or Year 2
Surveys) concerning public support for pre-
school programs. Specifically, 78% of
respondents indicate that they would support
state funding for voluntary pre-school for at-
risk children. Interestingly, when this same
program option was provided toward the end
of the questionnaire as a strategy to close the
achievement gap between groups of stu-
dents, 72% indicate favorable support. Con-
cerning kindergarten issues, 83% of the
public support requiring kindergarten atten-
dance for students. A majority (53%) also
indicate that if the state were to implement
full-day kindergarten, they prefer the pro-
gram to be state-funded and mandatory for
schools to offer and parents to enroll their
children (as opposed to state-funded and a
voluntary program for either schools or stu-
dents, or both). As previously mentioned,
61% of respondents indicate that they would
support tax increases to fund full-day kinder-
garten, up from 46% in the Benchmark Sur-
vey.
A few demographic differences were signifi-
cant for the questions concerning pre-school
and kindergarten issues. First, respondents
ages 18-34, those who had children in
school, and non-white residents are most
likely to support state funding for voluntary
pre-school for at-risk children. An over-
whelming 95% of non-white citizens
respond that kindergarten should be required
for all students, compared to 81% of white
citizens. In addition, women, those with a
high school diploma or less, parents with
children in school, individuals with incomes
between $50,000-$75,000, and residents of
northern Indiana most frequently express
support for mandatory kindergarten. Non-
white respondents are also the demographic
group that frequently indicate support for
state-funded, mandatory full-day kindergar-
ten (as a required program for schools and
students). Seventy percent of non-white resi-
dents support mandatory full-day kindergar-
ten compared to 51% of white residents.
Finally, the respondents most likely to sup-
port a tax increase to pay for full-day kinder-
garten are females, respondents ages 18-34,
individuals with a high school diploma or
less, parents with children in school, individ-
uals with incomes of $35,000 or less, and
non-white residents.
Center for Evaluation and Education Policy 21 of 42
Question by Question Results
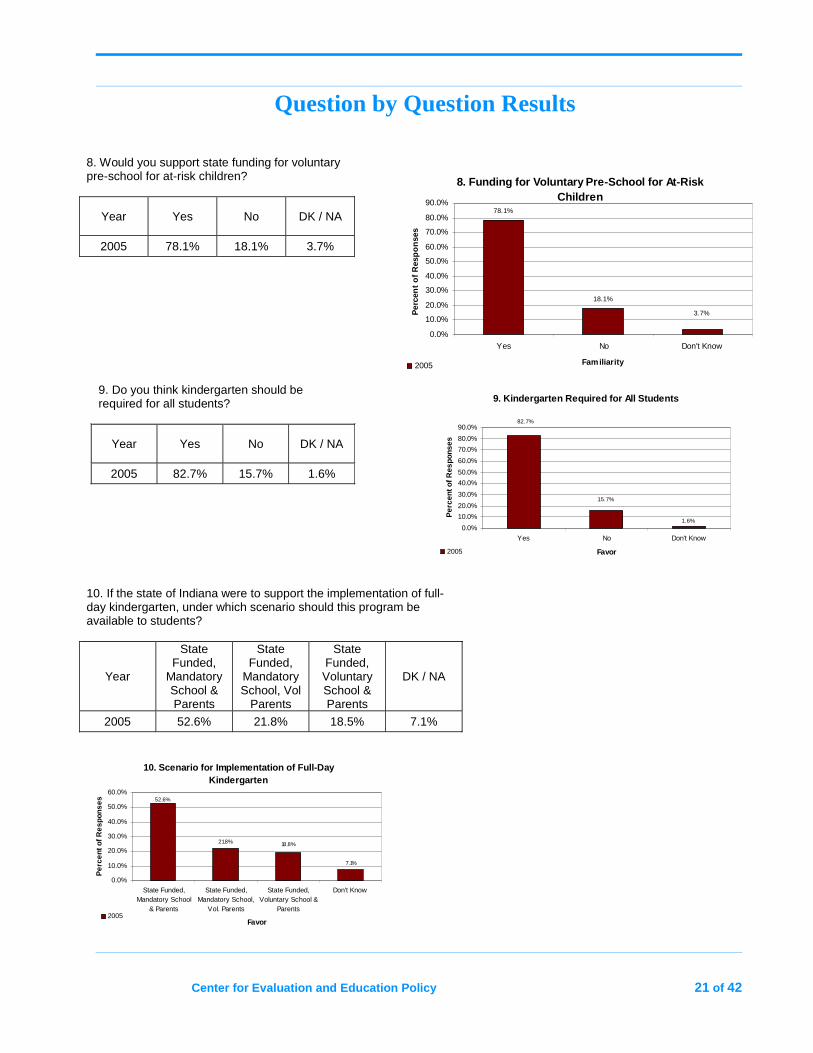
9. Do you think kindergarten should be required for all students?
Year Yes No DK / NA
2005 82.7% 15.7% 1.6%
9. Kindergarten Required for All Students
1.6%
82.7%
15.7%
0.0%
10.0%
20.0%
30.0%
40.0%
50.0%
60.0%
70.0%
80.0%
90.0%
Yes No Don't Know
Favor
Per
cent
of R
espo
nses
2005
8. Would you support state funding for voluntary pre-school for at-risk children?
Year Yes No DK / NA
2005 78.1% 18.1% 3.7%
8. Funding for Voluntary Pre-School for At-Risk Children
78.1%
3.7%
18.1%
0.0%
10.0%
20.0%
30.0%
40.0%
50.0%
60.0%
70.0%
80.0%
90.0%
Yes No Don't Know
Familiarity
Per
cen
t o
f R
esp
on
ses
2005
10. If the state of Indiana were to support the implementation of full-day kindergarten, under which scenario should this program be available to students?
Year
State Funded,
Mandatory School & Parents
State Funded,
Mandatory School, Vol
Parents
State Funded, Voluntary School & Parents
DK / NA
2005 52.6% 21.8% 18.5% 7.1%
10. Scenario for Implementation of Full-Day Kindergarten
21.8%
7.1%
18.8%
52.6%
0.0%
10.0%
20.0%
30.0%
40.0%
50.0%
60.0%
State Funded,Mandatory School
& Parents
State Funded,Mandatory School,
Vol. Parents
State Funded,Voluntary School &
Parents
Don't Know
Favor
Per
cent
of R
espo
nses
2005
22 of 42 Center for Evaluation and Education Policy
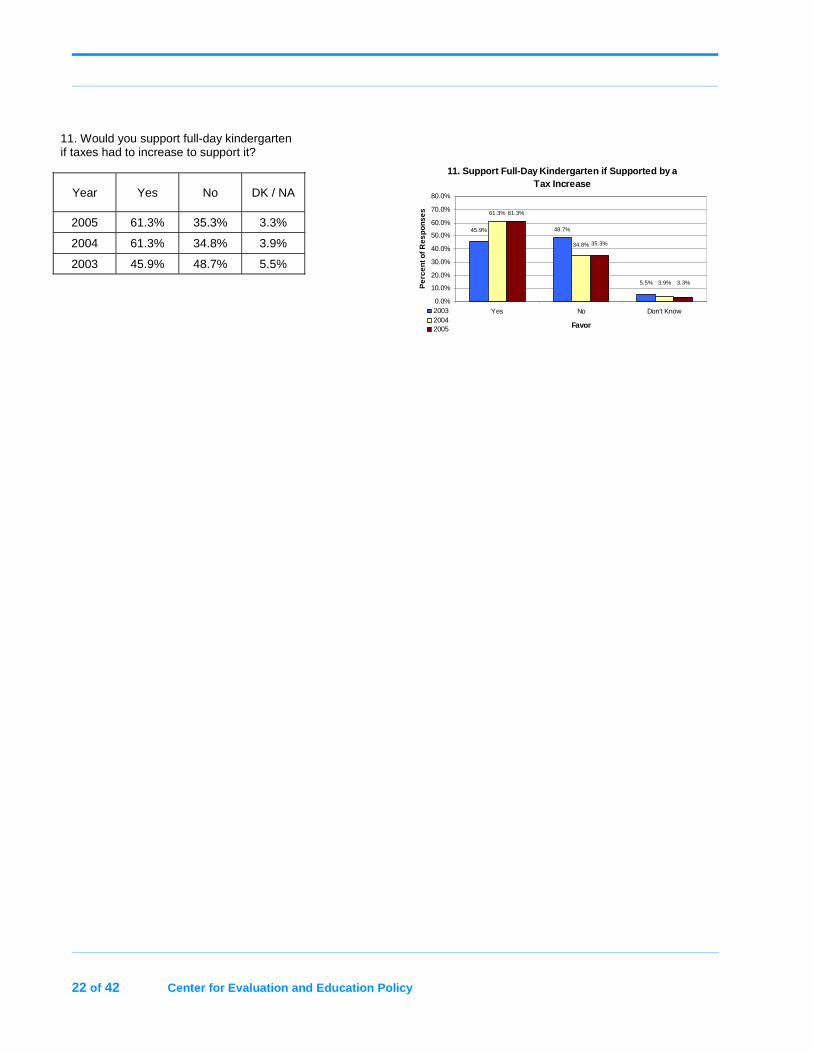
11. Would you support full-day kindergarten if taxes had to increase to support it?
Year Yes No DK / NA
2005 61.3% 35.3% 3.3%
2004 61.3% 34.8% 3.9%
2003 45.9% 48.7% 5.5%
11. Support Full-Day Kindergarten if Supported by a Tax Increase
48.7%
61.3% 61.3%
5.5%
45.9%
3.9%
34.8%
3.3%
35.3%
0.0%
10.0%
20.0%
30.0%
40.0%
50.0%
60.0%
70.0%
80.0%
Yes No Don't Know
Favor
Per
cent
of R
espo
nses
200320042005
Center for Evaluation and Education Policy 23 of 42
D. High School Drop-Out Rate Issues
In 2005, educators and policymakers in Indi-
ana extensively discussed high school gradu-
ation and drop-out issues while addressing
high school reform initiatives. Estimates
vary widely, from a low of 10-15% to as
high as 25-30%, about the number of Hoo-
sier students who do not complete high
school on time and drop out of school, but
they are high enough by any number to gen-
erate a high level of public concern. A total
of 89% of respondents either strongly agree
or somewhat agree that Indiana’s high school
drop-out rates are significant and merit fur-
ther action by educators and policymakers.
One law change that 75% of Hoosiers indi-
cate they support would be raising the drop-
out age for high school from 16 to 18; and
67% of residents indicate they would support
the withholding or revocation of students’
driver’s licenses and employment certificates
as a deterrent to dropping out of school.
Responses to the questions concerning high
school drop-out issues are fairly consistent
demographically. Respondents that indicate
the highest levels of support for increasing
the drop-out age to 18, and the withholding
or revocation of driver’s license and work
permit, are females, individuals with a high
school diploma or less, citizens with incomes
of $35,000 or less, and non-white residents.
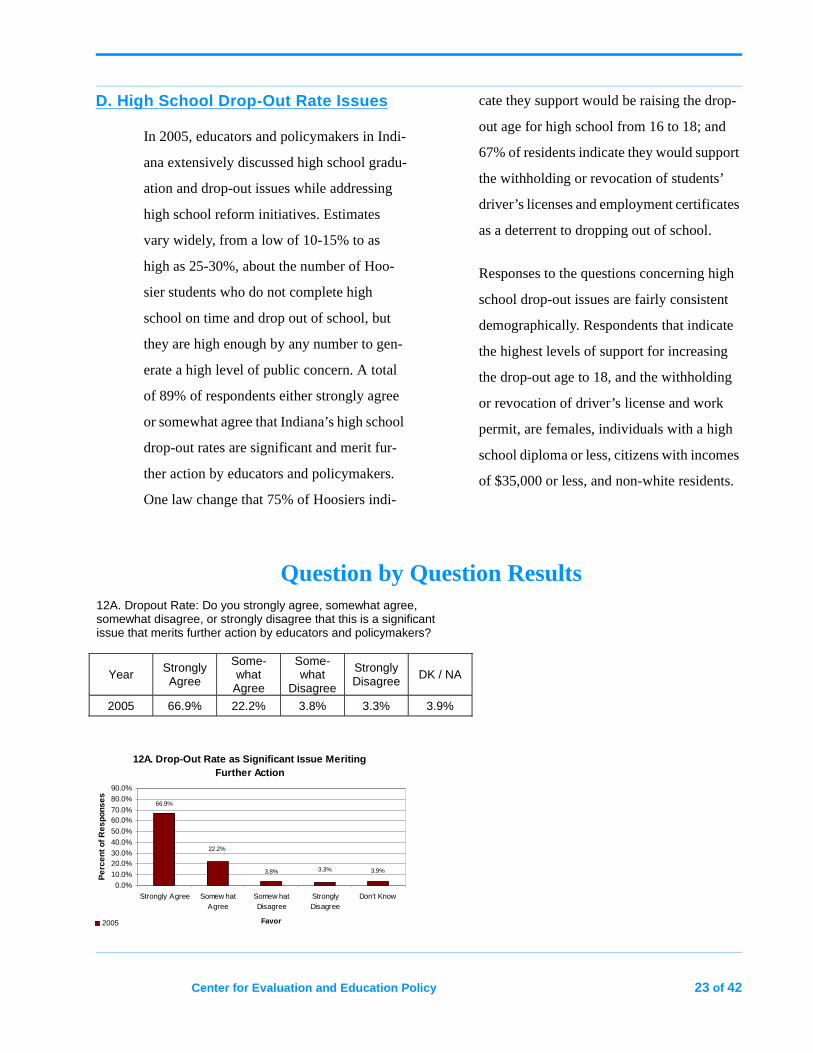
Question by Question Results12A. Dropout Rate: Do you strongly agree, somewhat agree, somewhat disagree, or strongly disagree that this is a significant issue that merits further action by educators and policymakers?
Year Strongly Agree
Some-what
Agree
Some-what
Disagree
Strongly Disagree DK / NA
2005 66.9% 22.2% 3.8% 3.3% 3.9%
12A. Drop-Out Rate as Significant Issue Meriting
Further Action
3.9%3.3%3.8%
22.2%
66.9%
0.0%
10.0%
20.0%30.0%
40.0%
50.0%
60.0%70.0%
80.0%
90.0%
Strongly Agree Somew hatAgree
Somew hatDisagree
StronglyDisagree
Don't Know
Favor
Pe
rcen
t of R
espo
nse
s
2005
24 of 42 Center for Evaluation and Education Policy
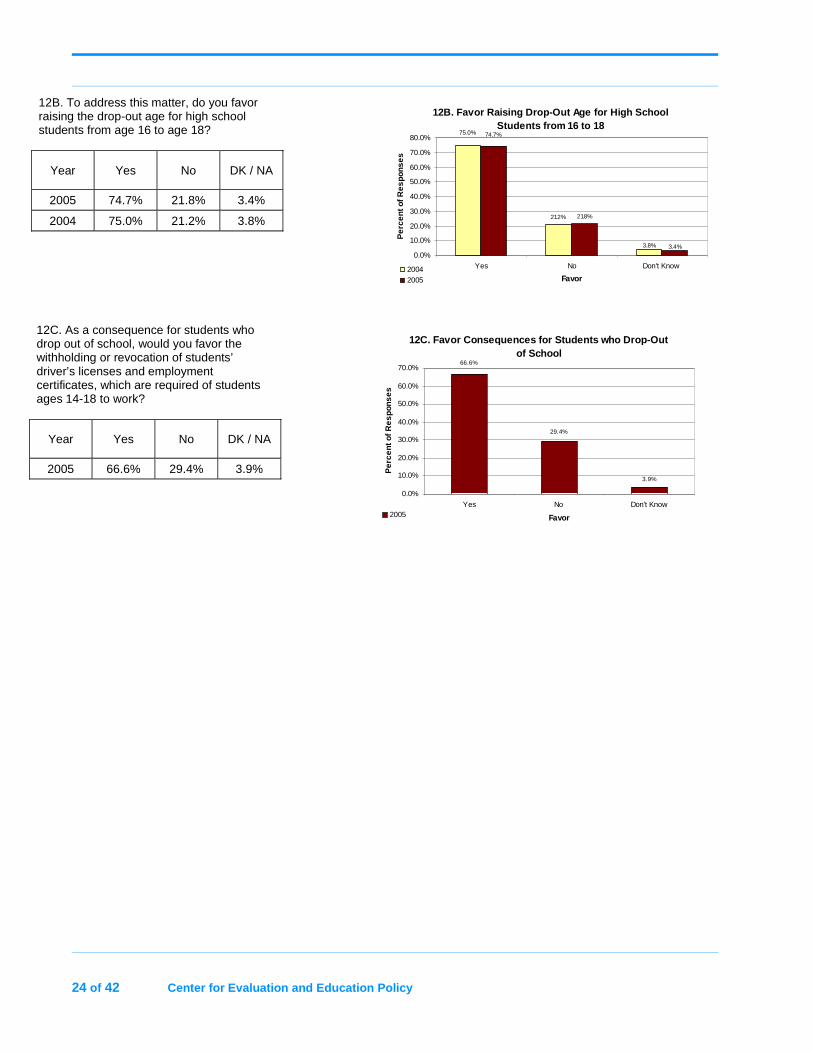
12B. To address this matter, do you favor raising the drop-out age for high school students from age 16 to age 18?
Year Yes No DK / NA
2005 74.7% 21.8% 3.4%
2004 75.0% 21.2% 3.8%
12B. Favor Raising Drop-Out Age for High School Students from 16 to 18
21.2% 21.8%
3.8%
75.0% 74.7%
3.4%
0.0%
10.0%
20.0%
30.0%
40.0%
50.0%
60.0%
70.0%
80.0%
Yes No Don't Know
Favor
Per
cent
of R
espo
nses
20042005
12C. As a consequence for students who drop out of school, would you favor the withholding or revocation of students’ driver’s licenses and employment certificates, which are required of students ages 14-18 to work?
Year Yes No DK / NA
2005 66.6% 29.4% 3.9%
12C. Favor Consequences for Students who Drop-Out of School
3.9%
29.4%
66.6%
0.0%
10.0%
20.0%
30.0%
40.0%
50.0%
60.0%
70.0%
Yes No Don't Know
Favor
Per
cent
of R
espo
nses
2005
Center for Evaluation and Education Policy 25 of 42
E. ISTEP+ and School Accountability
The Indiana Statewide Testing for Education
Progress-Plus Program, commonly referred
to as ISTEP+, is an important part of the
state’s efforts to increase student achieve-
ment and school accountability. The annual
release of ISTEP+ scores continues to gener-
ate extensive media attention, and, perhaps
as a result, public awareness about this pro-
gram is quite high. Additionally, media cov-
erage regarding the ISTEP+ Program was
heightened in 2005 as Governor Daniels
advocated his position to move the adminis-
tration of the tests from the fall to near the
end of the school year in the spring. As with
the first two years of the Public Opinion Sur-
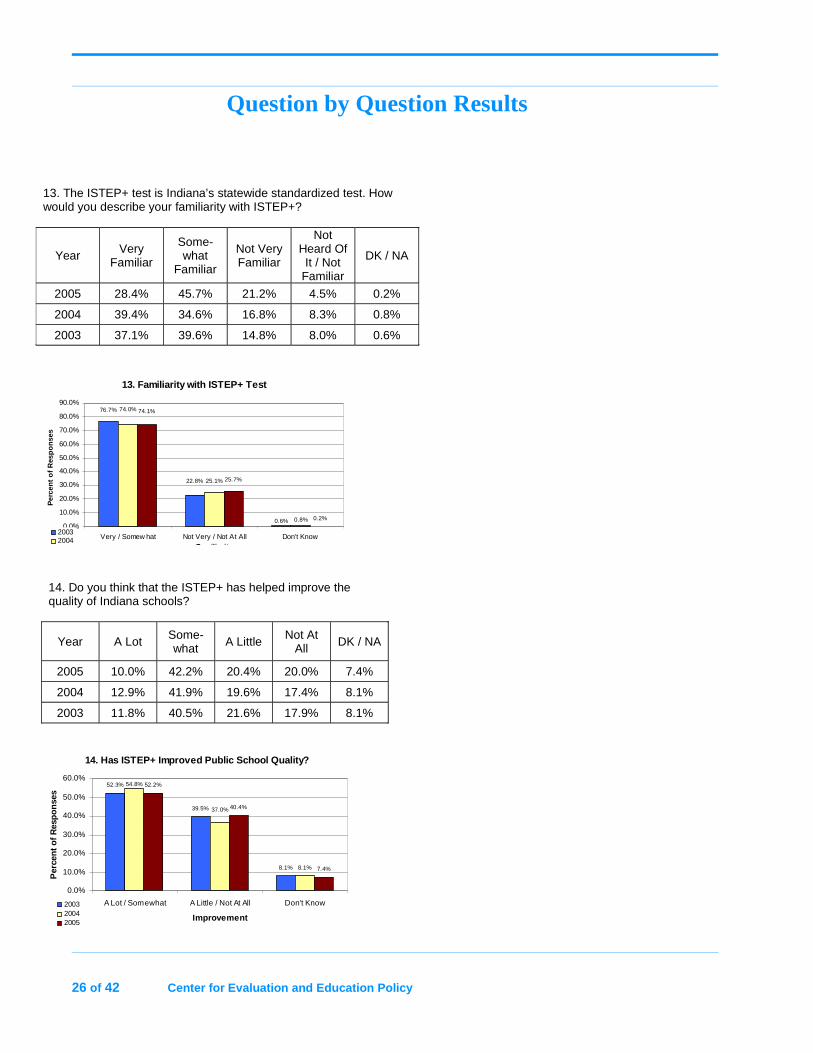
vey on Education in Indiana, a wide majority
of residents (77% in the Benchmark Survey;
74% in the Year 2 Survey; and 74% in the
Year 3 Survey) indicate that they are either
somewhat or very familiar with Indiana’s
statewide standardized tests.
Also consistent with previous surveys, 73%
of respondents who had some level of famil-
iarity with ISTEP+ in the Year 3 Survey
state a belief that this testing program has
contributed to some extent to improvements
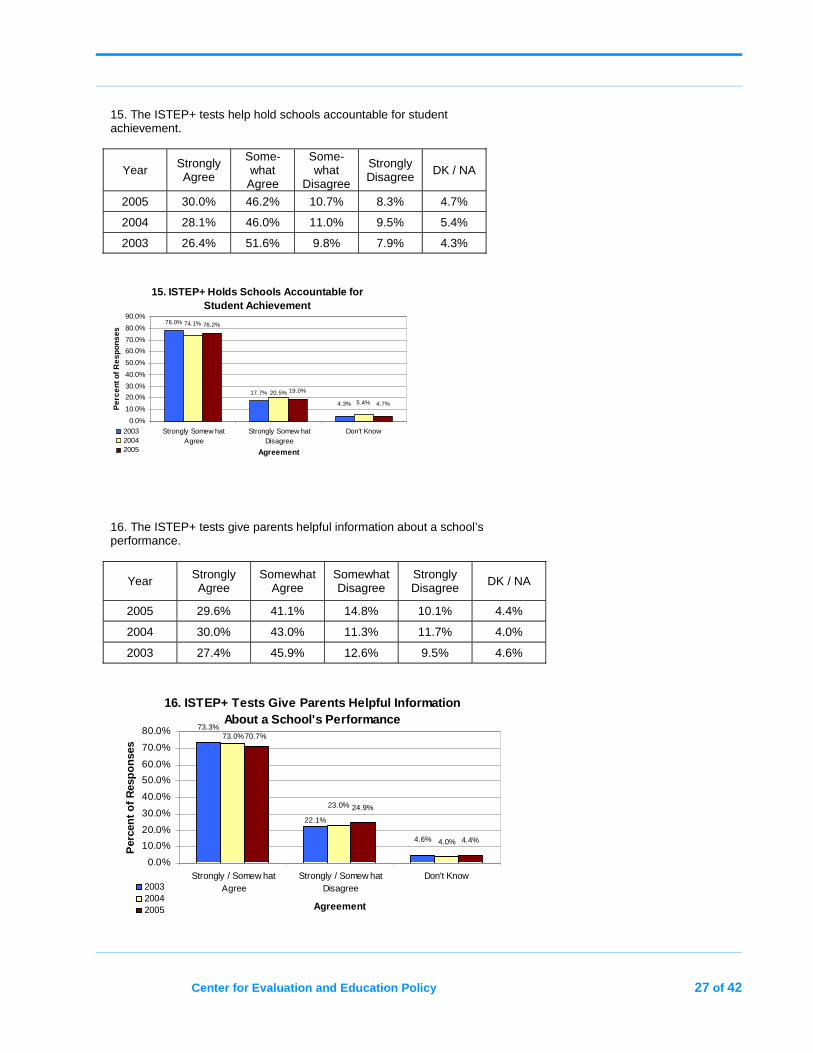
in the quality of education in Indiana. A total
of 76% of respondents agree that ISTEP+
holds schools accountable for student
achievement, and 71% feel ISTEP+ provides
parents helpful information about a school’s
performance. Finally, a new question posed
on the Year 3 Survey addressed the time of
the school year that ISTEP+ is given. There
is disagreement among leaders at the state
level as to whether ISTEP+ tests should be
given toward the start of the school year in
the fall, as it is now, or toward the end of the
school year in the spring. Based on what they
knew of the issue, regardless of how much or
how little, respondents were asked their
opinion on this matter. A total of 70% or
respondents indicate a preference for spring
testing, 16% indicate fall, and 11% indicate
that it did not make a difference. The authors
of this report acknowledge that the polling
results for this question would potentially
and likely be different if background infor-
mation was provided on the purposes of fall
and spring testing. Furthermore, a limitation
of the Survey was that follow-up questions
that provided more details about the merits
of each testing period were not provided to
further gauge public attitudes on this educa-
tion policy issue.
26 of 42 Center for Evaluation and Education Policy
Question by Question Results
13. The ISTEP+ test is Indiana’s statewide standardized test. How would you describe your familiarity with ISTEP+?
Year Very Familiar
Some-what
Familiar
Not Very Familiar
Not Heard Of It / Not
Familiar
DK / NA
2005 28.4% 45.7% 21.2% 4.5% 0.2%
2004 39.4% 34.6% 16.8% 8.3% 0.8%
2003 37.1% 39.6% 14.8% 8.0% 0.6%
13. Familiarity with ISTEP+ Test
0.2%
76.7%
22.8%
0.6%
74.0%
25.1%
0.8%
25.7%
74.1%
0.0%
10.0%
20.0%
30.0%
40.0%
50.0%
60.0%
70.0%
80.0%
90.0%
Very / Somew hat Not Very / Not At All Don't KnowFamiliarity
Per
cen
t o
f R
esp
on
ses
200320042005
14. Do you think that the ISTEP+ has helped improve the quality of Indiana schools?
Year A Lot Some-what A Little Not At
All DK / NA
2005 10.0% 42.2% 20.4% 20.0% 7.4%
2004 12.9% 41.9% 19.6% 17.4% 8.1%
2003 11.8% 40.5% 21.6% 17.9% 8.1%
14. Has ISTEP+ Improved Public School Quality?
52.3%
39.5%
8.1% 8.1%
52.2%
40.4%
7.4%
37.0%
54.8%
0.0%
10.0%
20.0%
30.0%
40.0%
50.0%
60.0%
A Lot / Somewhat A Little / Not At All Don't Know
Improvement
Per
cen
t o
f R
esp
on
ses
200320042005
Center for Evaluation and Education Policy 27 of 42
15. The ISTEP+ tests help hold schools accountable for student achievement.
Year Strongly Agree
Some-what
Agree
Some-what
Disagree
Strongly Disagree DK / NA
2005 30.0% 46.2% 10.7% 8.3% 4.7%
2004 28.1% 46.0% 11.0% 9.5% 5.4%
2003 26.4% 51.6% 9.8% 7.9% 4.3%
15. ISTEP+ Holds Schools Accountable for
Student Achievement78.0%
17.7%
76.2%
19.0%
4.3% 5.4%
20.5%
74.1%
4.7%
0.0%
10.0%
20.0%
30.0%
40.0%
50.0%
60.0%
70.0%
80.0%
90.0%
Strongly Somew hatAgree
Strongly Somew hatDisagree
Don't Know
Agreement
Per
cent
of R
espo
nses
200320042005
16. The ISTEP+ tests give parents helpful information about a school’s performance.
Year Strongly Agree
Somewhat Agree
Somewhat Disagree
Strongly Disagree DK / NA
2005 29.6% 41.1% 14.8% 10.1% 4.4%
2004 30.0% 43.0% 11.3% 11.7% 4.0%
2003 27.4% 45.9% 12.6% 9.5% 4.6%
16. ISTEP+ Tests Give Parents Helpful Information About a School's Performance
70.7%
4.6%
22.1%
73.3%
4.0%
23.0%
73.0%
24.9%
4.4%
0.0%
10.0%
20.0%
30.0%
40.0%
50.0%
60.0%
70.0%
80.0%
Strongly / Somew hatAgree
Strongly / Somew hatDisagree
Don't Know
Agreement
Per
cen
t o
f R
esp
on
ses
200320042005
28 of 42 Center for Evaluation and Education Policy
17. There is disagreement among leaders at the state level as to whether the ISTEP+ test should be given toward the start of the school year in the fall, as it is now, or in the spring toward the end of the school year.
Year Start End Doesn’t Make a Difference DK / NA
2005 16.2% 69.6% 10.7% 3.5%
17. ISTEP+ Tests Should Be Given at What Time of the
School Year
3.5%10.7%
69.6%
16.2%
0.0%
10.0%
20.0%
30.0%
40.0%
50.0%
60.0%
70.0%
80.0%
Start End Doesn't Make ADifference
Don't Know
Agreement
Per
cen
t o
f R
esp
on
ses
2005
Center for Evaluation and Education Policy 29 of 42
F. School Choice, Vouchers, and Charter Schools
Under school accountability systems estab-
lished by the state and federal governments,
schools are placed in performance categories
that are based on the level of student
achievement in their school. In the federal
system, low-performing schools are identi-
fied as schools “in need of improvement.”
Any school identified as in need of improve-
ment for two consecutive years must provide
parents with a choice option to enroll their
children in another public school within the
school district, or in another school district,
if possible. The choice provisions of the No
Child Left Behind Act have sparked a debate
about whether adequate choice opportunities
exist for parents and their children. The Year
3 Survey included questions about school
choice and other market-based education
reforms such as tuition vouchers and charter
schools.
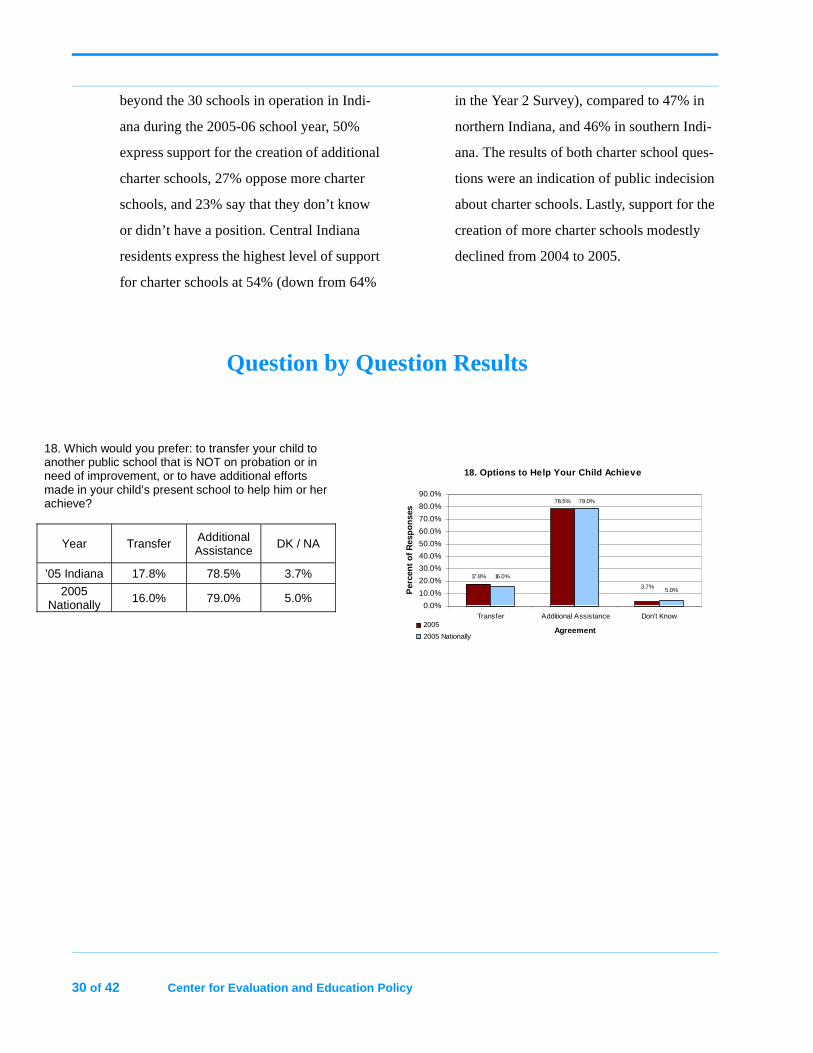
Concerning school choice, a total of 79% of
Hoosiers indicate a preference that efforts
should first be made to provide additional
assistance to students in low-performing
schools rather than transfer students to
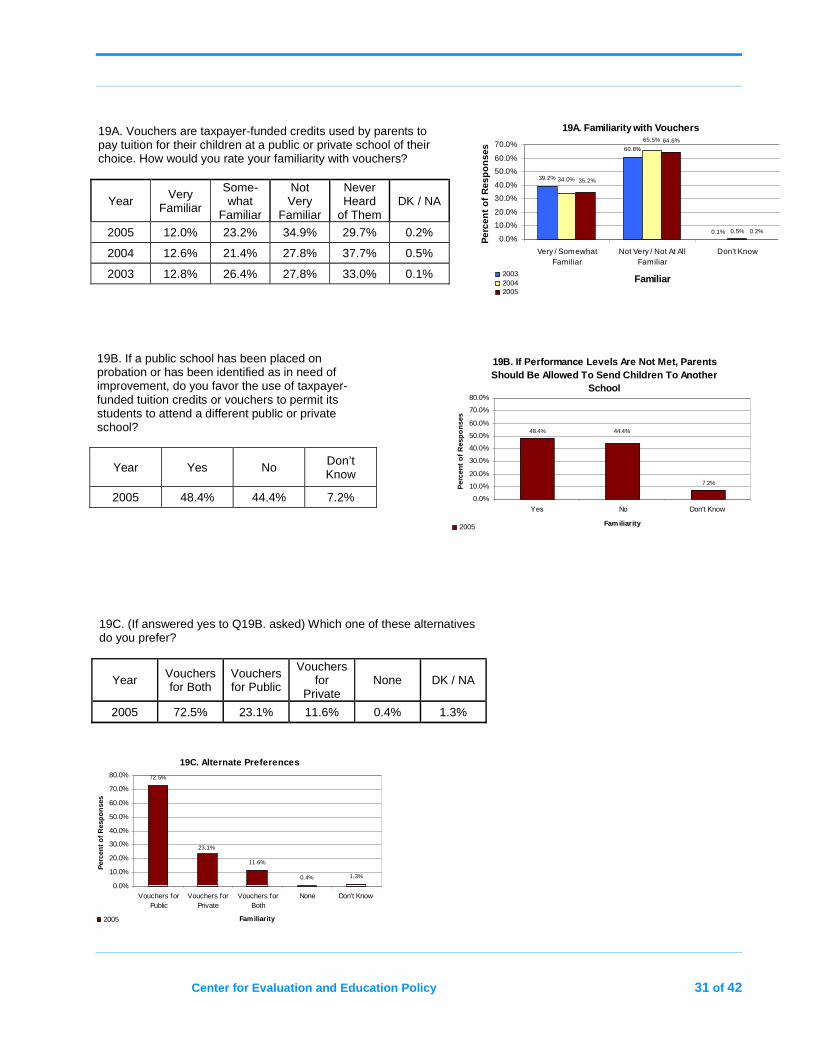
another public school. When asked about
familiarity with taxpayer-funded credits, or
vouchers, that allow parent to pay tuition for
their children at a public or private school of
their choice, 65% said that they are not very
familiar or have never heard of vouchers. For
those familiar with vouchers to some extent,
slightly more respondents indicate that they
favored rather than opposed (48% to 44%)
the use of vouchers to permit students at a
low-performing school to attend a different
public or private school. An examination of
the demographic results for this question
reveals that men, respondents ages 18-34,
parents of school-aged children, and non-
white residents are the Hoosiers more
inclined to support the use of vouchers, but
not by wide margins. Of the respondents that
indicate support for vouchers, 73% express
support for public and private school
options, 23% for public school enrollment
options only, and 12% for private school
enrollment options only.
Finally, Hoosiers were asked two questions
about charter schools. Charter schools are
public schools that are open to all students,
are free of many of the regulations placed on
traditional public schools, and are intended
to provide innovative programs to students.
Thirty-eight percent of respondents say they
are somewhat or very familiar with charter
schools and 62% report that they are not very
familiar or not familiar at all with charter
schools. However, when given some infor-
mation about the concept of a charter school,
and asked if they would favor or oppose the
continued expansion of charter schools
30 of 42 Center for Evaluation and Education Policy
beyond the 30 schools in operation in Indi-
ana during the 2005-06 school year, 50%
express support for the creation of additional
charter schools, 27% oppose more charter
schools, and 23% say that they don’t know
or didn’t have a position. Central Indiana
residents express the highest level of support
for charter schools at 54% (down from 64%
in the Year 2 Survey), compared to 47% in
northern Indiana, and 46% in southern Indi-
ana. The results of both charter school ques-
tions were an indication of public indecision
about charter schools. Lastly, support for the
creation of more charter schools modestly
declined from 2004 to 2005.
Question by Question Results
18. Which would you prefer: to transfer your child to another public school that is NOT on probation or in need of improvement, or to have additional efforts made in your child’s present school to help him or her achieve?
Year Transfer Additional Assistance
DK / NA
’05 Indiana 17.8% 78.5% 3.7%
2005 Nationally 16.0% 79.0% 5.0%
18. Options to Help Your Child Achieve
79.0%
17.8%
78.5%
3.7% 5.0%
16.0%
0.0%
10.0%
20.0%
30.0%
40.0%
50.0%
60.0%
70.0%
80.0%
90.0%
Transfer Additional Assistance Don't Know
Agreement
Per
cen
t o
f R
esp
on
ses
2005
2005 Nationally
Center for Evaluation and Education Policy 31 of 42
19A. Vouchers are taxpayer-funded credits used by parents to pay tuition for their children at a public or private school of their choice. How would you rate your familiarity with vouchers?
Year Very Familiar
Some-what
Familiar
Not Very
Familiar
Never Heard
of Them DK / NA
2005 12.0% 23.2% 34.9% 29.7% 0.2%
2004 12.6% 21.4% 27.8% 37.7% 0.5%
2003 12.8% 26.4% 27.8% 33.0% 0.1%
19A. Familiarity with Vouchers
39.2%
60.8%
0.2%0.1%
34.0%
65.5%
0.5%
35.2%
64.6%
0.0%
10.0%
20.0%
30.0%
40.0%
50.0%
60.0%
70.0%
Very / SomewhatFamiliar
Not Very / Not At AllFamiliar
Don't Know
Familiar
Per
cen
t o
f R
esp
on
ses
200320042005
19B. If a public school has been placed on probation or has been identified as in need of improvement, do you favor the use of taxpayer-funded tuition credits or vouchers to permit its students to attend a different public or private school?
Year Yes No Don’t Know
2005 48.4% 44.4% 7.2%
19B. If Performance Levels Are Not Met, Parents Should Be Allowed To Send Children To Another
School
48.4%
7.2%
44.4%
0.0%
10.0%
20.0%
30.0%
40.0%
50.0%
60.0%
70.0%
80.0%
Yes No Don't Know
Familiarity
Per
cen
t o
f R
esp
on
ses
2005
19C. (If answered yes to Q19B. asked) Which one of these alternatives do you prefer?
Year Vouchers for Both
Vouchers for Public
Vouchers for
Private None DK / NA
2005 72.5% 23.1% 11.6% 0.4% 1.3%
19C. Alternate Preferences
72.5%
11.6%
0.4% 1.3%
23.1%
0.0%
10.0%
20.0%
30.0%
40.0%
50.0%
60.0%
70.0%
80.0%
Vouchers forPublic
Vouchers forPrivate
Vouchers forBoth
None Don't Know
Familiarity
Per
cen
t o
f R
esp
on
ses
2005
32 of 42 Center for Evaluation and Education Policy
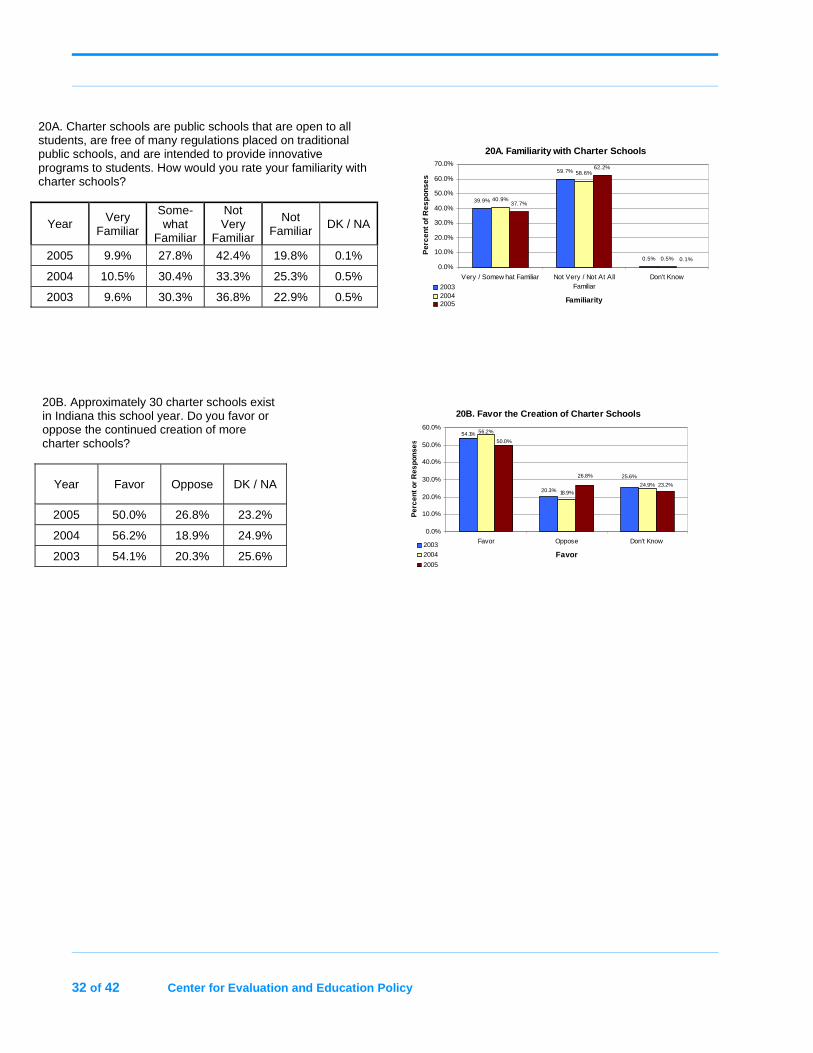
20A. Charter schools are public schools that are open to all students, are free of many regulations placed on traditional public schools, and are intended to provide innovative programs to students. How would you rate your familiarity with charter schools?
Year Very Familiar
Some-what
Familiar
Not Very
Familiar
Not Familiar
DK / NA
2005 9.9% 27.8% 42.4% 19.8% 0.1%
2004 10.5% 30.4% 33.3% 25.3% 0.5%
2003 9.6% 30.3% 36.8% 22.9% 0.5%
20A. Familiarity with Charter Schools
39.9%
59.7%
0.5%
40.9%
58.6%
0.5%
37.7%
62.2%
0.1%0.0%
10.0%
20.0%
30.0%
40.0%
50.0%
60.0%
70.0%
Very / Somew hat Familiar Not Very / Not At AllFamiliar
Don't Know
Familiarity
Per
cen
t of
Res
pon
ses
200320042005
20B. Approximately 30 charter schools exist in Indiana this school year. Do you favor or oppose the continued creation of more charter schools?
Year Favor Oppose DK / NA
2005 50.0% 26.8% 23.2%
2004 56.2% 18.9% 24.9%
2003 54.1% 20.3% 25.6%
20B. Favor the Creation of Charter Schools
20.3% 18.9%23.2%
25.6%
54.1%
24.9%
56.2%
26.8%
50.0%
0.0%
10.0%
20.0%
30.0%
40.0%
50.0%
60.0%
Favor Oppose Don't Know
Favor
Per
cent
or
Res
pons
es
2003
2004
2005
Center for Evaluation and Education Policy 33 of 42
G. Teacher Quality and Pay
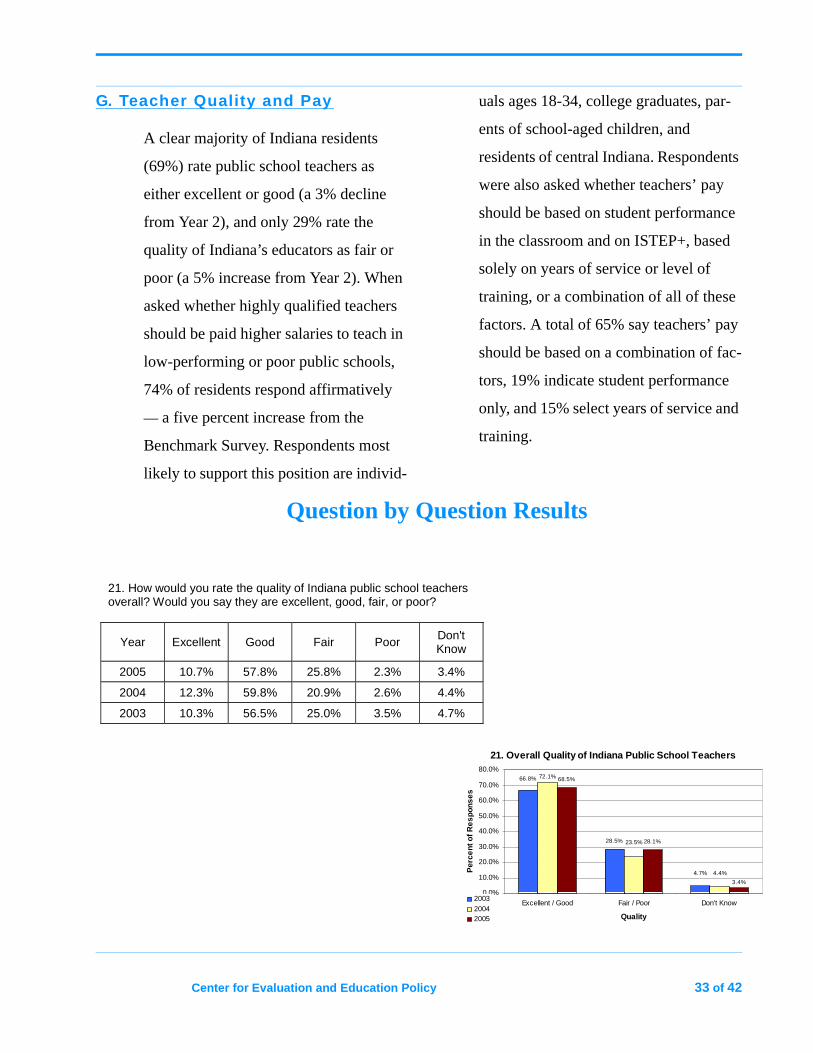
A clear majority of Indiana residents
(69%) rate public school teachers as
either excellent or good (a 3% decline
from Year 2), and only 29% rate the
quality of Indiana’s educators as fair or
poor (a 5% increase from Year 2). When
asked whether highly qualified teachers
should be paid higher salaries to teach in
low-performing or poor public schools,
74% of residents respond affirmatively
— a five percent increase from the
Benchmark Survey. Respondents most
likely to support this position are individ-
uals ages 18-34, college graduates, par-
ents of school-aged children, and
residents of central Indiana. Respondents
were also asked whether teachers’ pay
should be based on student performance
in the classroom and on ISTEP+, based
solely on years of service or level of
training, or a combination of all of these
factors. A total of 65% say teachers’ pay
should be based on a combination of fac-
tors, 19% indicate student performance
only, and 15% select years of service and
training.
Question by Question Results
21. How would you rate the quality of Indiana public school teachers overall? Would you say they are excellent, good, fair, or poor?
Year Excellent Good Fair Poor Don't Know
2005 10.7% 57.8% 25.8% 2.3% 3.4%
2004 12.3% 59.8% 20.9% 2.6% 4.4%
2003 10.3% 56.5% 25.0% 3.5% 4.7%
21. Overall Quality of Indiana Public School Teachers
28.5%
68.5%
28.1%
66.8%
4.7% 4.4%
23.5%
72.1%
3.4%
0.0%
10.0%
20.0%
30.0%
40.0%
50.0%
60.0%
70.0%
80.0%
Excellent / Good Fair / Poor Don't Know
Quality
Per
cent
of R
espo
nses
200320042005
34 of 42 Center for Evaluation and Education Policy
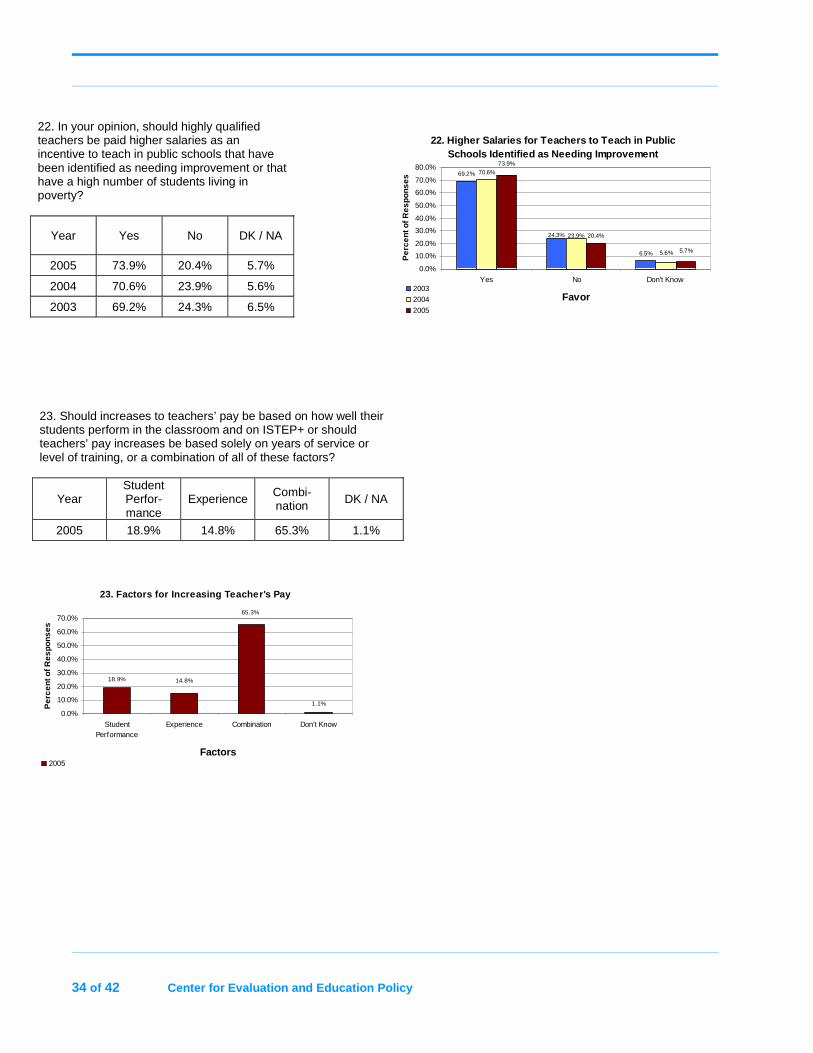
22. In your opinion, should highly qualified teachers be paid higher salaries as an incentive to teach in public schools that have been identified as needing improvement or that have a high number of students living in poverty?
Year Yes No DK / NA
2005 73.9% 20.4% 5.7%
2004 70.6% 23.9% 5.6%
2003 69.2% 24.3% 6.5%
22. Higher Salaries for Teachers to Teach in Public Schools Identified as Needing Improvement
69.2%
6.5%
70.6%
20.4%24.3%
5.6%
23.9%
5.7%
73.9%
0.0%
10.0%
20.0%
30.0%
40.0%
50.0%
60.0%
70.0%
80.0%
Yes No Don't Know
Favor
Per
cent
of R
espo
nses
2003
2004
2005
23. Should increases to teachers’ pay be based on how well their students perform in the classroom and on ISTEP+ or should teachers’ pay increases be based solely on years of service or level of training, or a combination of all of these factors?
Year Student Perfor-mance
Experience Combi-nation DK / NA
2005 18.9% 14.8% 65.3% 1.1%
23. Factors for Increasing Teacher's Pay
18.9%
1.1%
65.3%
14.8%
0.0%
10.0%
20.0%
30.0%
40.0%
50.0%
60.0%
70.0%
StudentPerformance
Experience Combination Don't Know
Factors
Per
cent
of R
espo
nses
2005
Center for Evaluation and Education Policy 35 of 42
H. The No Child Left Behind Act and PL 221
One of the handful of questions reflect-
ing significant change in response rates
from the Benchmark Survey was the per-
cent of Indiana residents claiming to
know a little to a lot about the federal No
Child Left Behind Act. Awareness of this
federal law increased from 62% in the
Benchmark Survey to 76% in the Year 3
Survey. Perhaps as important, the per-
centage of Hoosiers that believe that the
federal government’s involvement in
schools is helping improve performance,
decreased from 43% to 31% over the
same time period.
One difference between the state and
federal school accountability systems is
how they evaluate performance. The
State of Indiana’s system takes into con-
sideration student performance each year
and improvement from one year to the
next to judge schools; whereas, the fed-
eral system focuses on annual achieve-
ment levels against an annual
performance target. A new question
included in the Year 3 Survey asked
Hoosiers their opinions on which
accountability method they prefer. A
total of 78% of respondents favor a com-
bination of fixed standards and the
improvement in the number of students
passing ISTEP+ to judge school perfor-
mance.
Though there is an increased level of
awareness about the federal accountabil-
ity system, there continued to be an over-
whelming number of residents (76%)
who indicate a total lack of awareness
about the state’s accountability law.
However, this may change in 2006, as all
public schools will be placed for the first
time in a category of performance under
the state’s system, and these school rat-
ings will be released to the public some-
time between the months of March and
May.
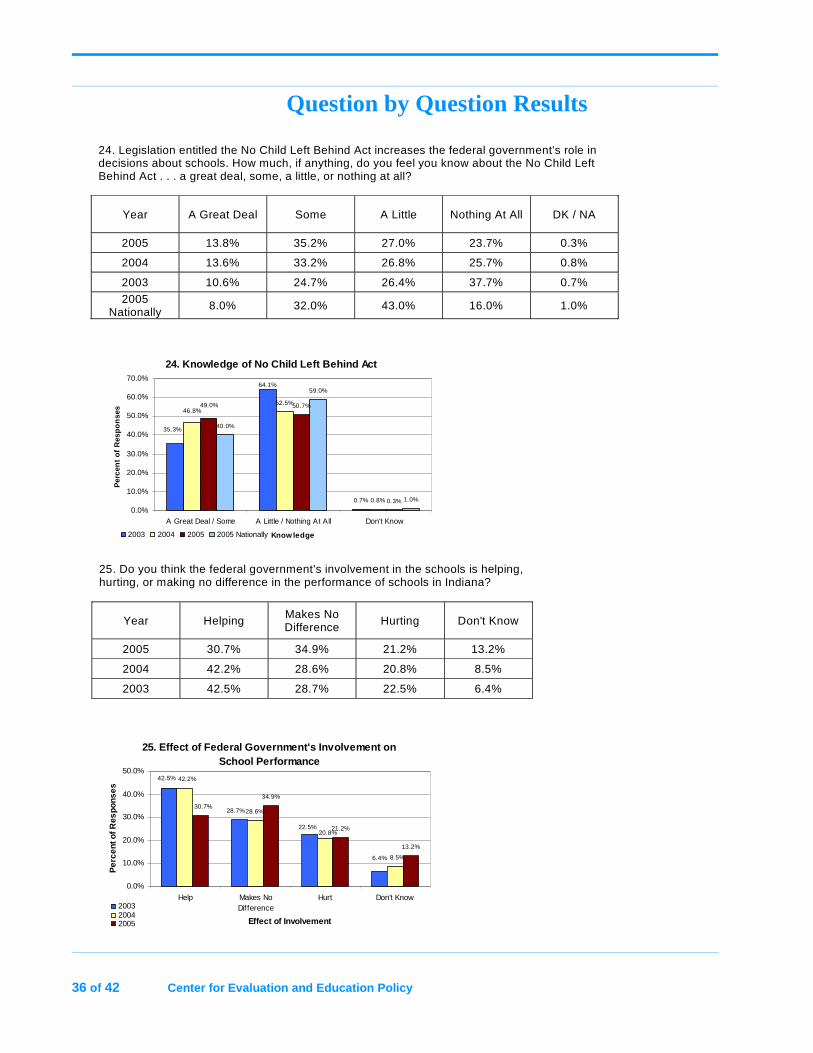
36 of 42 Center for Evaluation and Education Policy
Question by Question Results
24. Knowledge of No Child Left Behind Act
0.7%
52.5%
0.8%
50.7%
0.3%
40.0%
59.0%
1.0%
35.3%
64.1%
46.8%49.0%
0.0%
10.0%
20.0%
30.0%
40.0%
50.0%
60.0%
70.0%
A Great Deal / Some A Little / Nothing At All Don't Know
Know ledge
Per
cen
t o
f R
esp
on
ses
2003 2004 2005 2005 Nationally
25. Do you think the federal government’s involvement in the schools is helping, hurting, or making no difference in the performance of schools in Indiana?
Year Helping Makes No Difference Hurting Don't Know
2005 30.7% 34.9% 21.2% 13.2%
2004 42.2% 28.6% 20.8% 8.5%
2003 42.5% 28.7% 22.5% 6.4%
25. Effect of Federal Government's Involvement on School Performance
28.6%
34.9%
13.2%
6.4%
22.5%
28.7%
42.5%
8.5%
20.8%
42.2%
21.2%
30.7%
0.0%
10.0%
20.0%
30.0%
40.0%
50.0%
Help Makes NoDifference
Hurt Don't Know
Effect of Involvement
Per
cent
of R
espo
nses
200320042005
24. Legislation entitled the No Child Left Behind Act increases the federal government’s role in decisions about schools. How much, if anything, do you feel you know about the No Child Left Behind Act . . . a great deal, some, a little, or nothing at all?
Year A Great Deal Some A Little Nothing At All DK / NA
2005 13.8% 35.2% 27.0% 23.7% 0.3%
2004 13.6% 33.2% 26.8% 25.7% 0.8%
2003 10.6% 24.7% 26.4% 37.7% 0.7%
2005 Nationally 8.0% 32.0% 43.0% 16.0% 1.0%
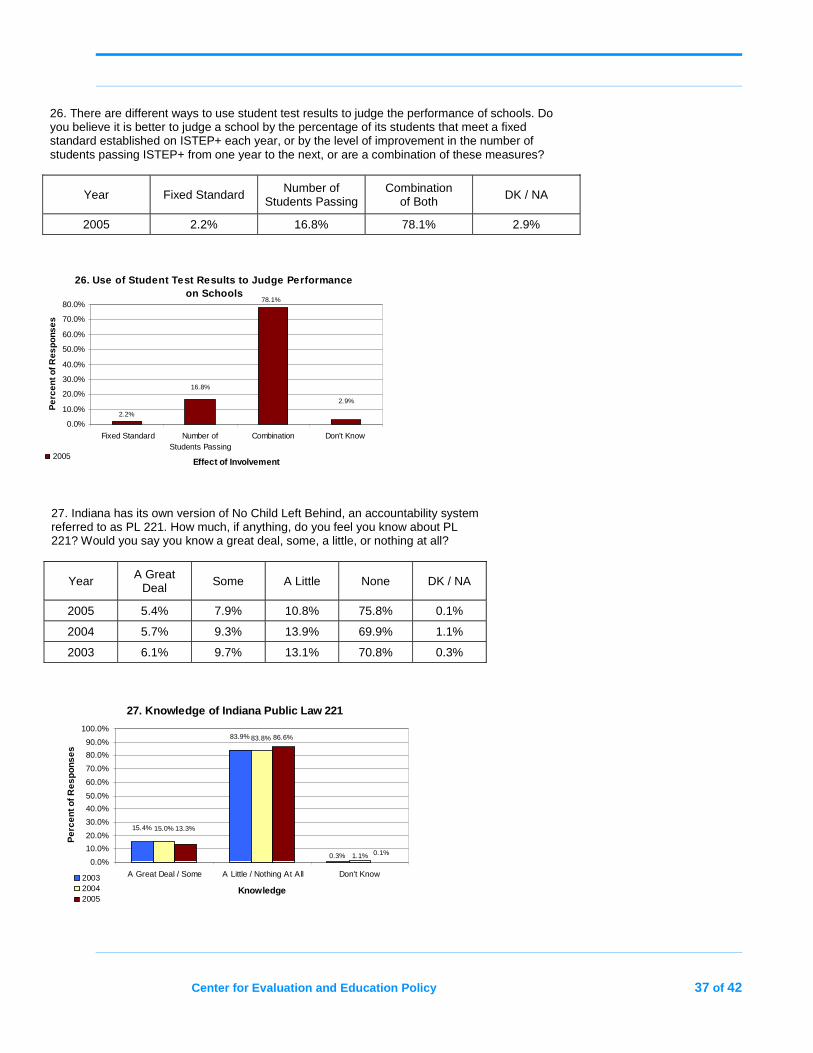
Center for Evaluation and Education Policy 37 of 42
26. There are different ways to use student test results to judge the performance of schools. Do you believe it is better to judge a school by the percentage of its students that meet a fixed standard established on ISTEP+ each year, or by the level of improvement in the number of students passing ISTEP+ from one year to the next, or are a combination of these measures?
Year Fixed Standard Number of Students Passing
Combination of Both DK / NA
2005 2.2% 16.8% 78.1% 2.9%
26. Use of Student Test Results to Judge Performance
on Schools
2.2%
16.8%
78.1%
2.9%
0.0%
10.0%
20.0%
30.0%
40.0%
50.0%
60.0%
70.0%
80.0%
Fixed Standard Number ofStudents Passing
Combination Don't Know
Effect of Involvement
Pe
rcen
t of R
esp
onse
s
2005
27. Indiana has its own version of No Child Left Behind, an accountability system referred to as PL 221. How much, if anything, do you feel you know about PL 221? Would you say you know a great deal, some, a little, or nothing at all?
Year A Great Deal Some A Little None DK / NA
2005 5.4% 7.9% 10.8% 75.8% 0.1%
2004 5.7% 9.3% 13.9% 69.9% 1.1%
2003 6.1% 9.7% 13.1% 70.8% 0.3%
27. Knowledge of Indiana Public Law 221
86.6%
0.1%
15.4%
0.3%
83.9%
15.0%
1.1%
83.8%
13.3%
0.0%
10.0%
20.0%
30.0%
40.0%
50.0%
60.0%
70.0%
80.0%
90.0%
100.0%
A Great Deal / Some A Little / Nothing At All Don't Know
Knowledge
Per
cen
t of
Res
pon
ses
200320042005
38 of 42 Center for Evaluation and Education Policy
I. Achievement Gap
Consistent with the Year 2 Survey, sev-
eral questions were posed to Indiana citi-
zens in the Year 3 Survey about the
achievement gaps that exist between
racial/ethnic groups of students, and
between students from low and high
income families. Questions from the
Year 2 and Year 3 Surveys were similar
to questions presented on the 2004 and
2005 Phi Delta Kappa/Gallup Polls con-
ducted nationally. Indiana polling results
closely mirrored the results in the
national polls. In Indiana, 94% of citi-
zens respond that closing the achieve-
ment gap is important to some extent
(67% important; 27% somewhat impor-
tant) compared to 90% nationally. A total
of 78% of Indiana residents agree that
the achievement gap problem is a prod-
uct of societal factors such as family
income or the education attainment of
parents, not the quality of schooling
received in public schools as 12% of
Hoosiers responded. Next, 52% of Hoo-
siers indicate that it is the responsibility
of public schools to close the achieve-
ment gaps, and 40% of respondents indi-
cate that it is not the responsibility of
schools to close the achievement gaps.
As with the Year 2 Survey, increased
parental participation and additional
instructional time for low-performing
students are the options most frequently
supported as strategies to close the
achievement gap in the Year 3 Survey.
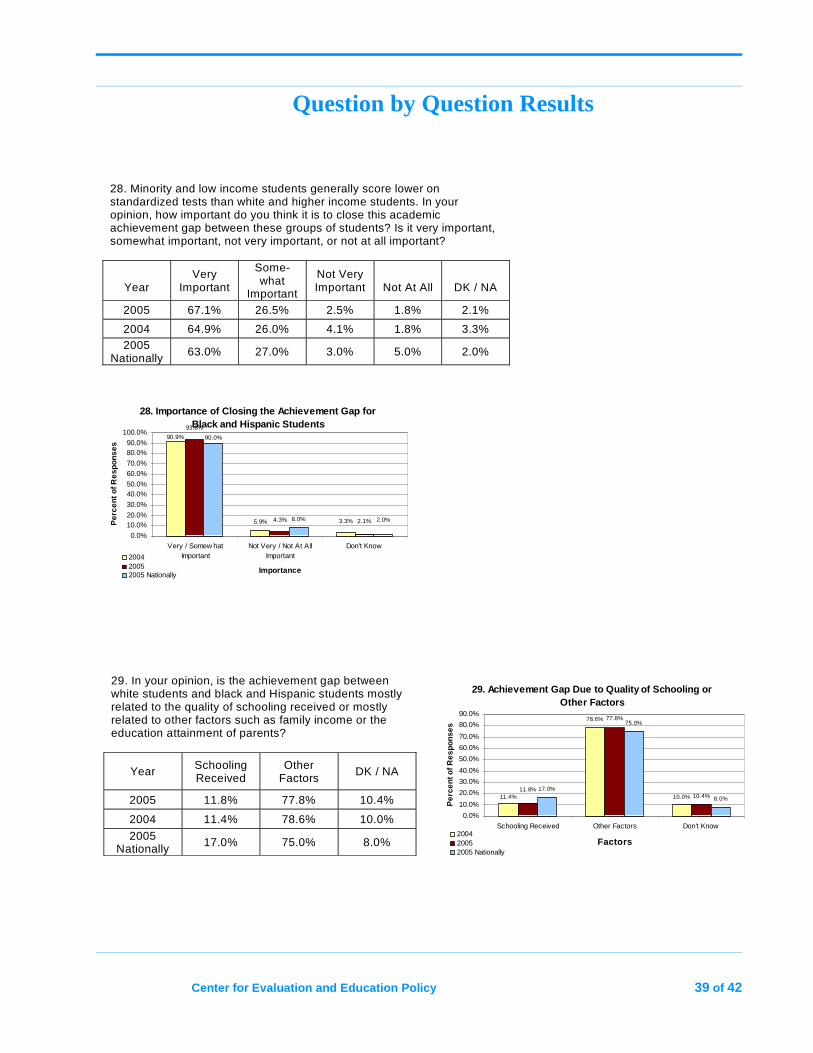
Center for Evaluation and Education Policy 39 of 42
Question by Question Results
28. Minority and low income students generally score lower on standardized tests than white and higher income students. In your opinion, how important do you think it is to close this academic achievement gap between these groups of students? Is it very important, somewhat important, not very important, or not at all important?
Year
Very Important
Some-what
Important
Not Very Important
Not At All
DK / NA
2005 67.1% 26.5% 2.5% 1.8% 2.1%
2004 64.9% 26.0% 4.1% 1.8% 3.3% 2005
Nationally 63.0% 27.0% 3.0% 5.0% 2.0%
28. Importance of Closing the Achievement Gap for Black and Hispanic Students
5.9% 8.0% 3.3%
90.9%
93.6%
2.1%4.3%
90.0%
2.0%
0.0%
10.0%20.0%
30.0%
40.0%50.0%
60.0%70.0%
80.0%90.0%
100.0%
Very / Somew hatImportant
Not Very / Not At AllImportant
Don't Know
Importance
Per
cent
of R
espo
nses
200420052005 Nationally
29. In your opinion, is the achievement gap between white students and black and Hispanic students mostly related to the quality of schooling received or mostly related to other factors such as family income or the education attainment of parents?
Year Schooling Received
Other Factors
DK / NA
2005 11.8% 77.8% 10.4%
2004 11.4% 78.6% 10.0%
2005 Nationally 17.0% 75.0% 8.0%
29. Achievement Gap Due to Quality of Schooling or Other Factors
78.6%
10.0% 10.4%17.0%
75.0%
8.0%11.4%11.8%
77.8%
0.0%
10.0%
20.0%
30.0%
40.0%
50.0%
60.0%
70.0%
80.0%
90.0%
Schooling Received Other Factors Don't Know
Factors
Per
cent
of R
espo
nses
200420052005 Nationally
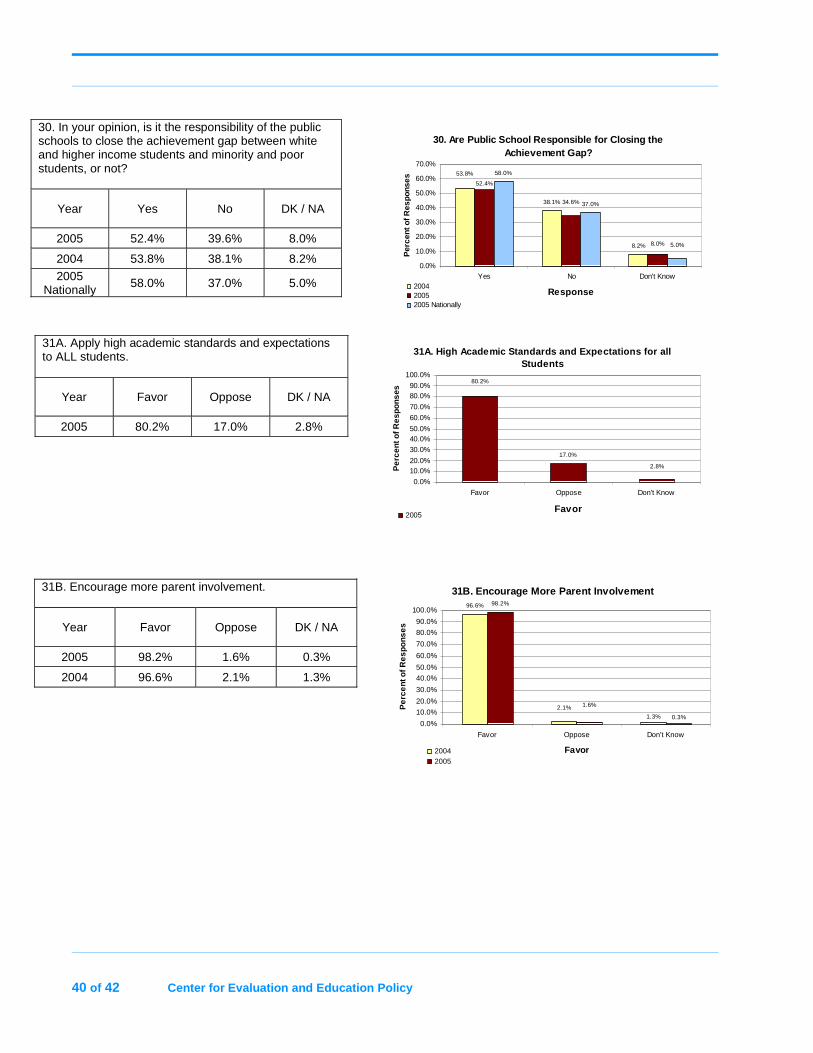
40 of 42 Center for Evaluation and Education Policy
30. In your opinion, is it the responsibility of the public schools to close the achievement gap between white and higher income students and minority and poor students, or not?
Year Yes No DK / NA
2005 52.4% 39.6% 8.0%
2004 53.8% 38.1% 8.2%
2005 Nationally 58.0% 37.0% 5.0%
30. Are Public School Responsible for Closing the Achievement Gap?
38.1%
8.2%
58.0%
37.0%
53.8%
34.6%
8.0%
52.4%
5.0%
0.0%
10.0%
20.0%
30.0%
40.0%
50.0%
60.0%
70.0%
Yes No Don't Know
Response
Per
cent
of R
espo
nses
200420052005 Nationally
31A. Apply high academic standards and expectations to ALL students.
Year Favor Oppose DK / NA
2005 80.2% 17.0% 2.8%
31A. High Academic Standards and Expectations for all Students
17.0%
2.8%
80.2%
0.0%
10.0%20.0%
30.0%
40.0%50.0%
60.0%
70.0%
80.0%90.0%
100.0%
Favor Oppose Don't Know
Favor
Per
cent
of R
espo
nses
2005
31B. Encourage more parent involvement.
Year Favor Oppose DK / NA
2005 98.2% 1.6% 0.3%
2004 96.6% 2.1% 1.3%
31B. Encourage More Parent Involvement96.6% 98.2%
1.3%
2.1%
0.3%
1.6%
0.0%
10.0%
20.0%
30.0%
40.0%
50.0%
60.0%
70.0%
80.0%
90.0%
100.0%
Favor Oppose Don't Know
Favor
Per
cent
of R
espo
nses
20042005
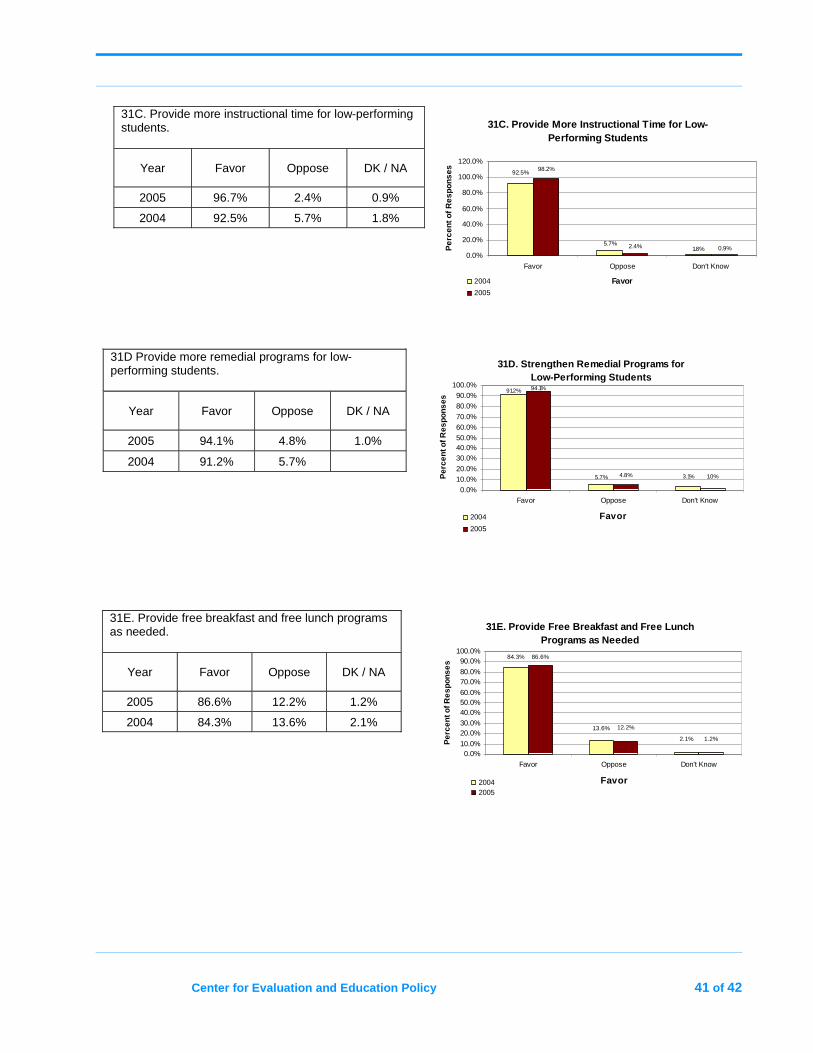
Center for Evaluation and Education Policy 41 of 42
31C. Provide more instructional time for low-performing students.
Year Favor Oppose DK / NA
2005 96.7% 2.4% 0.9%
2004 92.5% 5.7% 1.8%
31C. Provide More Instructional Time for Low-
Performing Students
5.7% 2.4% 1.8%
92.5%
0.9%
98.2%
0.0%
20.0%
40.0%
60.0%
80.0%
100.0%
120.0%
Favor Oppose Don't Know
Favor
Per
cent
of R
espo
nses
2004
2005
31D Provide more remedial programs for low-performing students.
Year Favor Oppose DK / NA
2005 94.1% 4.8% 1.0%
2004 91.2% 5.7%
31D. Strengthen Remedial Programs for Low-Performing Students
5.7% 3.1%
91.2%
4.8% 1.0%
94.1%
0.0%10.0%20.0%
30.0%40.0%50.0%60.0%70.0%
80.0%90.0%
100.0%
Favor Oppose Don't Know
Favor
Per
cen
t of R
espo
nses
2004
2005
31E. Provide free breakfast and free lunch programs as needed.
Year Favor Oppose DK / NA
2005 86.6% 12.2% 1.2%
2004 84.3% 13.6% 2.1%
31E. Provide Free Breakfast and Free Lunch Programs as Needed
2.1%
13.6%
84.3%
1.2%
12.2%
86.6%
0.0%10.0%
20.0%30.0%40.0%50.0%60.0%
70.0%80.0%
90.0%100.0%
Favor Oppose Don't Know
Favor
Per
cen
t of R
esp
onse
s
20042005
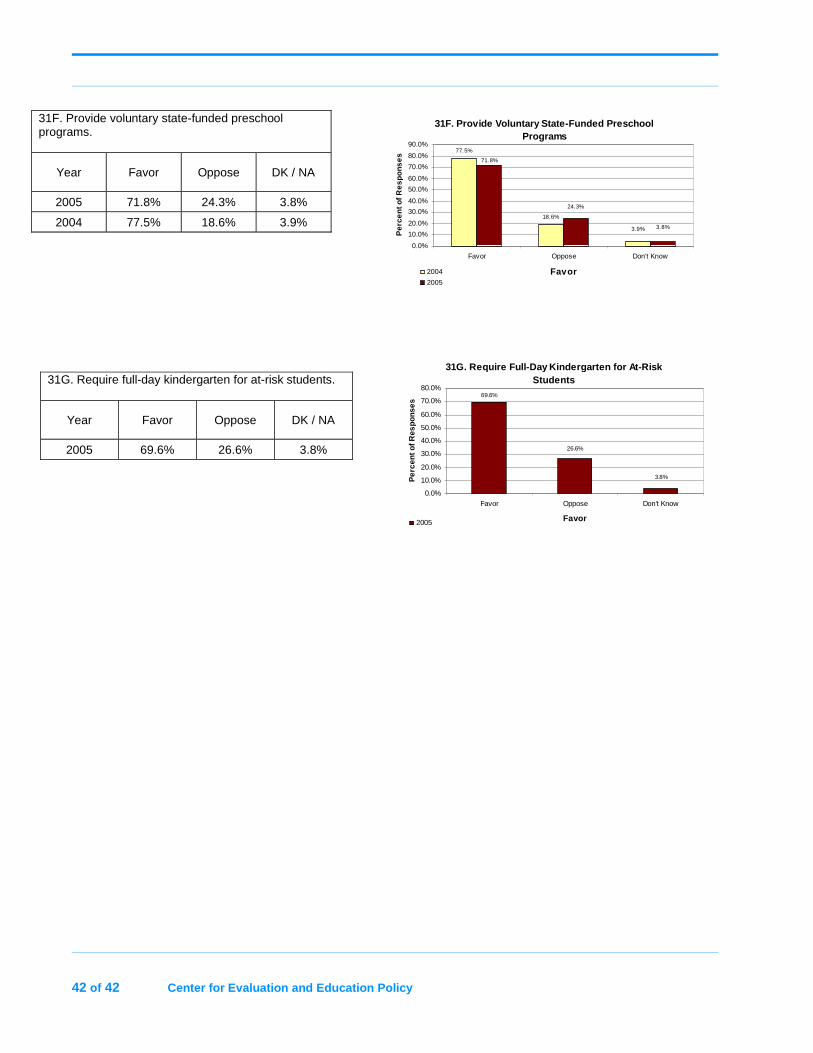
42 of 42 Center for Evaluation and Education Policy
31G. Require full-day kindergarten for at-risk students.
Year Favor Oppose DK / NA
2005 69.6% 26.6% 3.8%
31G. Require Full-Day Kindergarten for At-Risk Students
69.6%
26.6%
3.8%
0.0%
10.0%
20.0%
30.0%
40.0%
50.0%
60.0%
70.0%
80.0%
Favor Oppose Don’t Know
Favor
Per
cent
of R
espo
nses
2005
31F. Provide voluntary state-funded preschool programs.
Year Favor Oppose DK / NA
2005 71.8% 24.3% 3.8%
2004 77.5% 18.6% 3.9%
31F. Provide Voluntary State-Funded Preschool Programs
77.5%
18.6%
3.9%
24.3%
71.8%
3.8%
0.0%
10.0%
20.0%
30.0%
40.0%
50.0%
60.0%
70.0%
80.0%
90.0%
Favor Oppose Don't Know
Favor
Per
cen
t of
Re
spo
nse
s
2004
2005
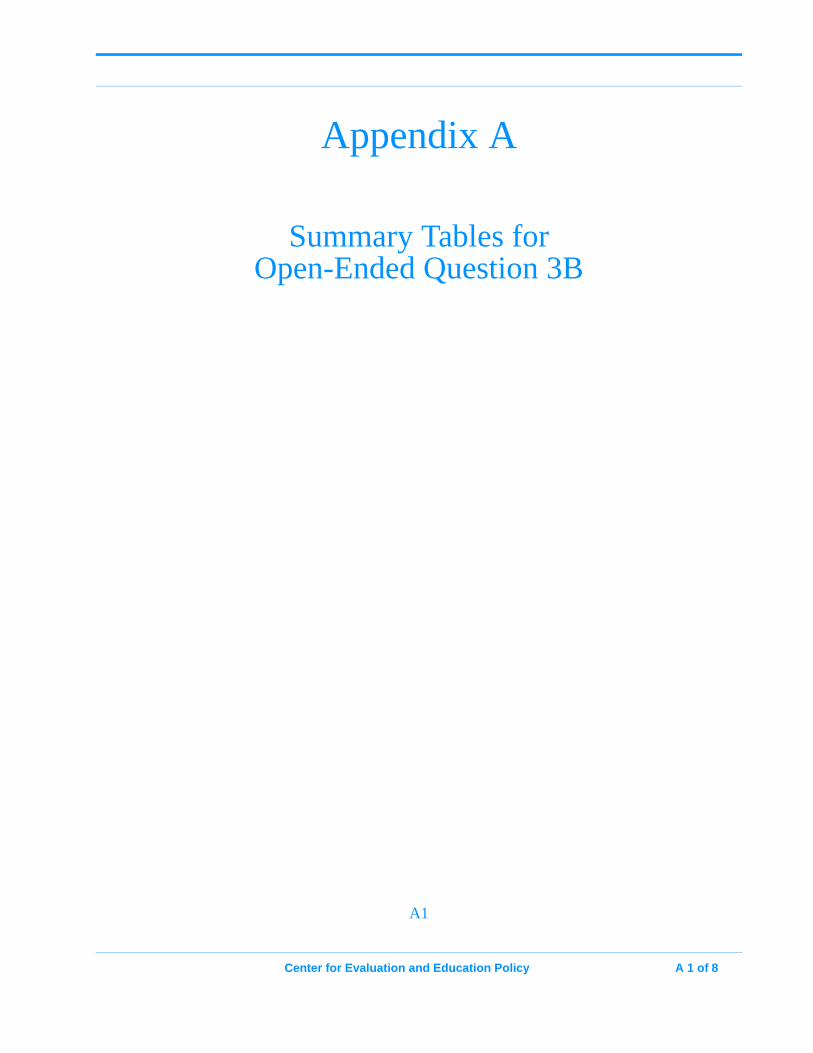
Center for Evaluation and Education Policy A 1 of 8
Appendix A
Summary Tables for Open-Ended Question 3B
A1

A2 of 8 Center for Evaluation and Education Policy
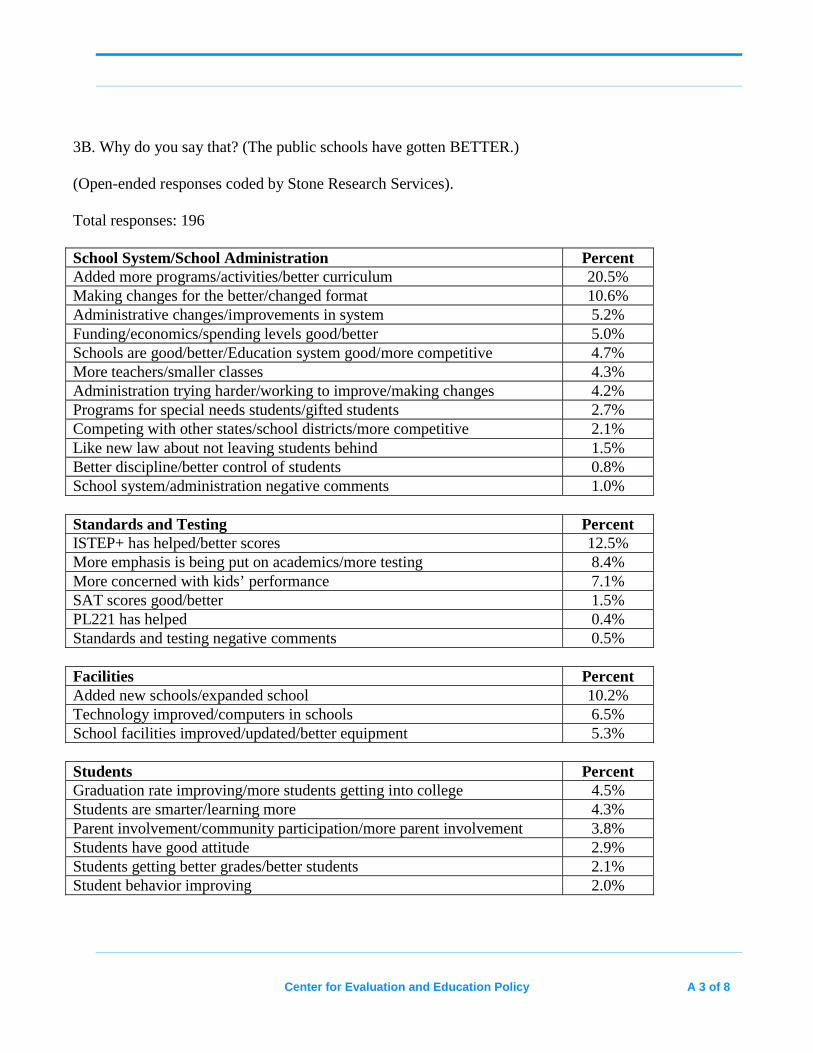
Center for Evaluation and Education Policy A 3 of 8
3B. Why do you say that? (The public schools have gotten BETTER.) (Open-ended responses coded by Stone Research Services). Total responses: 196 School System/School Administration Percent Added more programs/activities/better curriculum 20.5% Making changes for the better/changed format 10.6% Administrative changes/improvements in system 5.2% Funding/economics/spending levels good/better 5.0% Schools are good/better/Education system good/more competitive 4.7% More teachers/smaller classes 4.3% Administration trying harder/working to improve/making changes 4.2% Programs for special needs students/gifted students 2.7% Competing with other states/school districts/more competitive 2.1% Like new law about not leaving students behind 1.5% Better discipline/better control of students 0.8% School system/administration negative comments 1.0% Standards and Testing Percent ISTEP+ has helped/better scores 12.5% More emphasis is being put on academics/more testing 8.4% More concerned with kids’ performance 7.1% SAT scores good/better 1.5% PL221 has helped 0.4% Standards and testing negative comments 0.5% Facilities Percent Added new schools/expanded school 10.2% Technology improved/computers in schools 6.5% School facilities improved/updated/better equipment 5.3% Students Percent Graduation rate improving/more students getting into college 4.5% Students are smarter/learning more 4.3% Parent involvement/community participation/more parent involvement 3.8% Students have good attitude 2.9% Students getting better grades/better students 2.1% Student behavior improving 2.0%
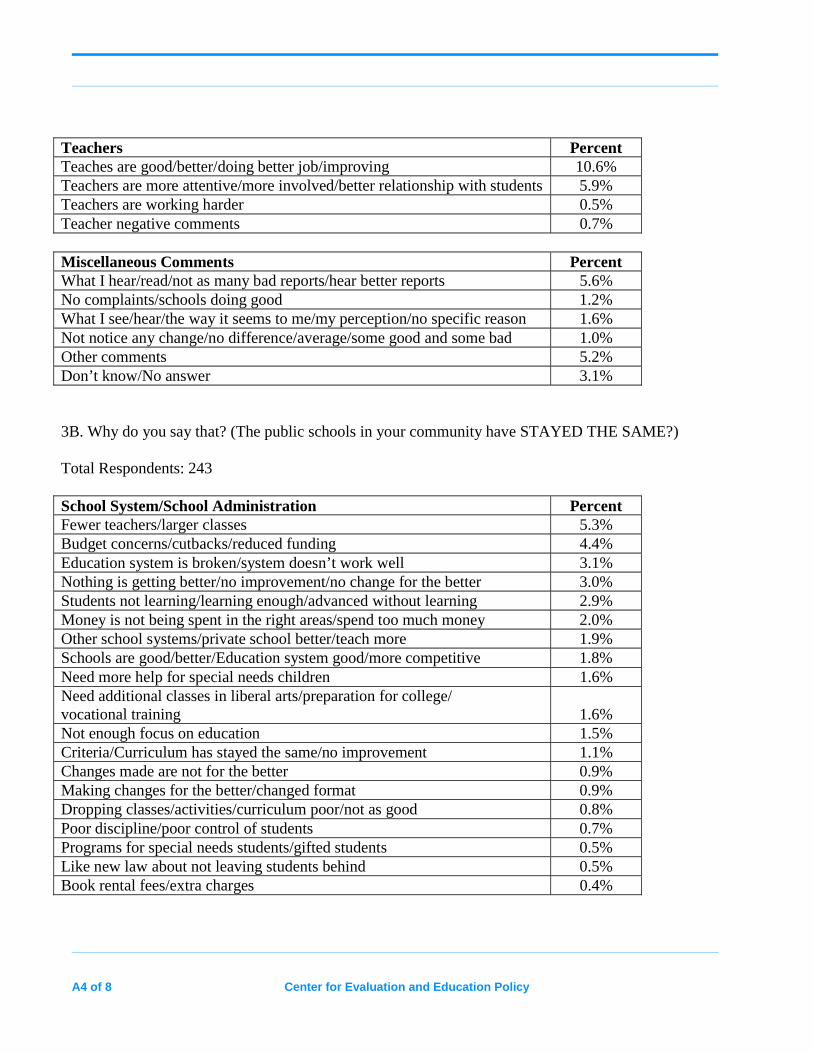
A4 of 8 Center for Evaluation and Education Policy
Teachers Percent Teaches are good/better/doing better job/improving 10.6% Teachers are more attentive/more involved/better relationship with students 5.9% Teachers are working harder 0.5% Teacher negative comments 0.7% Miscellaneous Comments Percent What I hear/read/not as many bad reports/hear better reports 5.6% No complaints/schools doing good 1.2% What I see/hear/the way it seems to me/my perception/no specific reason 1.6% Not notice any change/no difference/average/some good and some bad 1.0% Other comments 5.2% Don’t know/No answer 3.1% 3B. Why do you say that? (The public schools in your community have STAYED THE SAME?) Total Respondents: 243 School System/School Administration Percent Fewer teachers/larger classes 5.3% Budget concerns/cutbacks/reduced funding 4.4% Education system is broken/system doesn’t work well 3.1% Nothing is getting better/no improvement/no change for the better 3.0% Students not learning/learning enough/advanced without learning 2.9% Money is not being spent in the right areas/spend too much money 2.0% Other school systems/private school better/teach more 1.9% Schools are good/better/Education system good/more competitive 1.8% Need more help for special needs children 1.6% Need additional classes in liberal arts/preparation for college/ vocational training
1.6%
Not enough focus on education 1.5% Criteria/Curriculum has stayed the same/no improvement 1.1% Changes made are not for the better 0.9% Making changes for the better/changed format 0.9% Dropping classes/activities/curriculum poor/not as good 0.8% Poor discipline/poor control of students 0.7% Programs for special needs students/gifted students 0.5% Like new law about not leaving students behind 0.5% Book rental fees/extra charges 0.4%
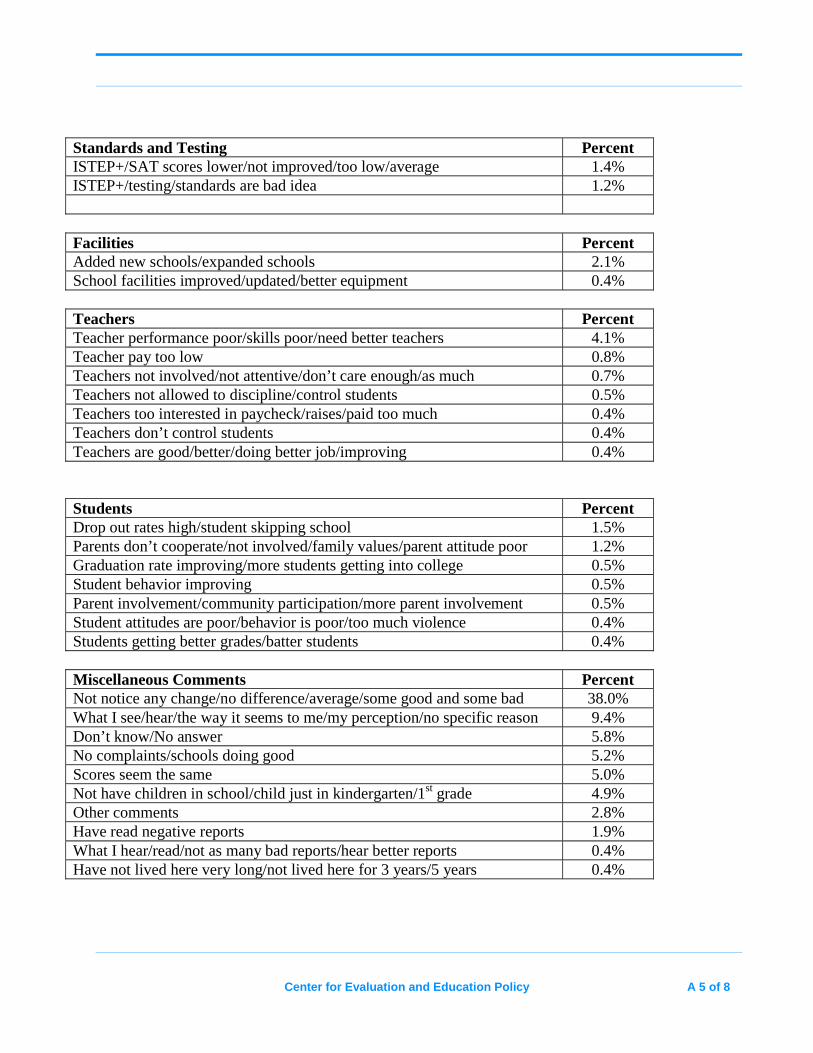
Center for Evaluation and Education Policy A 5 of 8
Standards and Testing Percent ISTEP+/SAT scores lower/not improved/too low/average 1.4% ISTEP+/testing/standards are bad idea 1.2% Facilities Percent Added new schools/expanded schools 2.1% School facilities improved/updated/better equipment 0.4% Teachers Percent Teacher performance poor/skills poor/need better teachers 4.1% Teacher pay too low 0.8% Teachers not involved/not attentive/don’t care enough/as much 0.7% Teachers not allowed to discipline/control students 0.5% Teachers too interested in paycheck/raises/paid too much 0.4% Teachers don’t control students 0.4% Teachers are good/better/doing better job/improving 0.4% Students Percent Drop out rates high/student skipping school 1.5% Parents don’t cooperate/not involved/family values/parent attitude poor 1.2% Graduation rate improving/more students getting into college 0.5% Student behavior improving 0.5% Parent involvement/community participation/more parent involvement 0.5% Student attitudes are poor/behavior is poor/too much violence 0.4% Students getting better grades/batter students 0.4% Miscellaneous Comments Percent Not notice any change/no difference/average/some good and some bad 38.0% What I see/hear/the way it seems to me/my perception/no specific reason 9.4% Don’t know/No answer 5.8% No complaints/schools doing good 5.2% Scores seem the same 5.0% Not have children in school/child just in kindergarten/1st grade 4.9% Other comments 2.8% Have read negative reports 1.9% What I hear/read/not as many bad reports/hear better reports 0.4% Have not lived here very long/not lived here for 3 years/5 years 0.4%
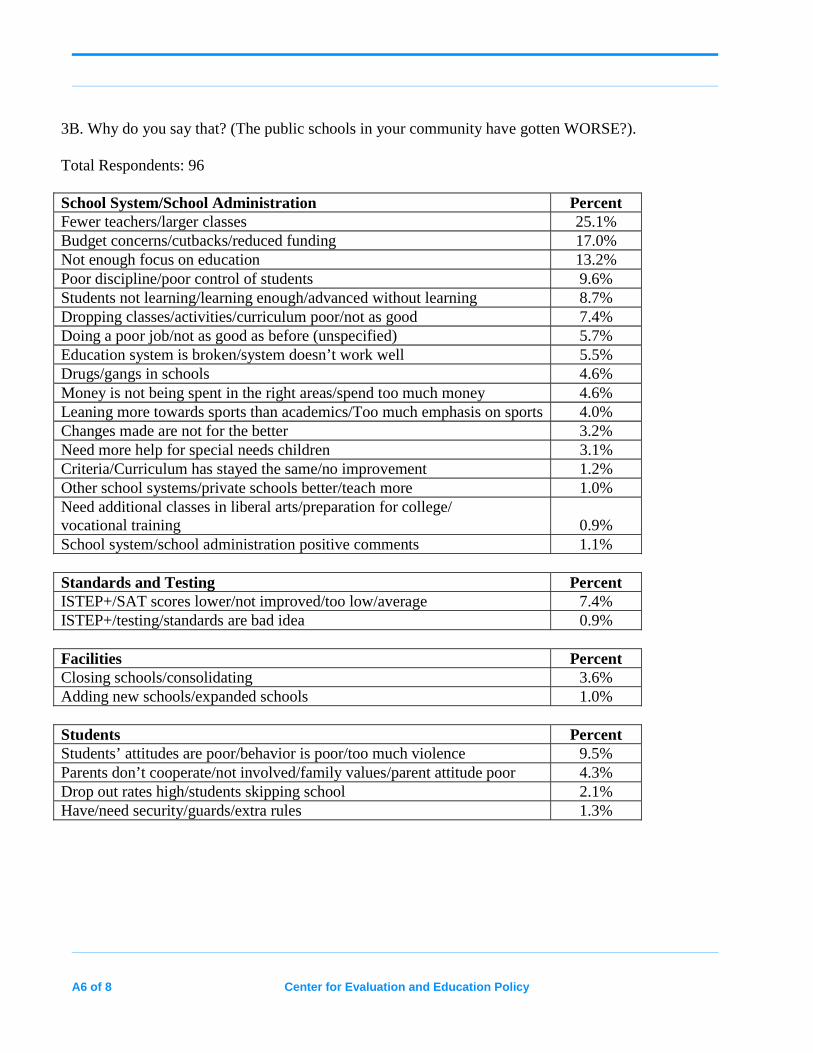
A6 of 8 Center for Evaluation and Education Policy
3B. Why do you say that? (The public schools in your community have gotten WORSE?). Total Respondents: 96 School System/School Administration Percent Fewer teachers/larger classes 25.1% Budget concerns/cutbacks/reduced funding 17.0% Not enough focus on education 13.2% Poor discipline/poor control of students 9.6% Students not learning/learning enough/advanced without learning 8.7% Dropping classes/activities/curriculum poor/not as good 7.4% Doing a poor job/not as good as before (unspecified) 5.7% Education system is broken/system doesn’t work well 5.5% Drugs/gangs in schools 4.6% Money is not being spent in the right areas/spend too much money 4.6% Leaning more towards sports than academics/Too much emphasis on sports 4.0% Changes made are not for the better 3.2% Need more help for special needs children 3.1% Criteria/Curriculum has stayed the same/no improvement 1.2% Other school systems/private schools better/teach more 1.0% Need additional classes in liberal arts/preparation for college/ vocational training
0.9%
School system/school administration positive comments 1.1% Standards and Testing Percent ISTEP+/SAT scores lower/not improved/too low/average 7.4% ISTEP+/testing/standards are bad idea 0.9% Facilities Percent Closing schools/consolidating 3.6% Adding new schools/expanded schools 1.0% Students Percent Students’ attitudes are poor/behavior is poor/too much violence 9.5% Parents don’t cooperate/not involved/family values/parent attitude poor 4.3% Drop out rates high/students skipping school 2.1% Have/need security/guards/extra rules 1.3%
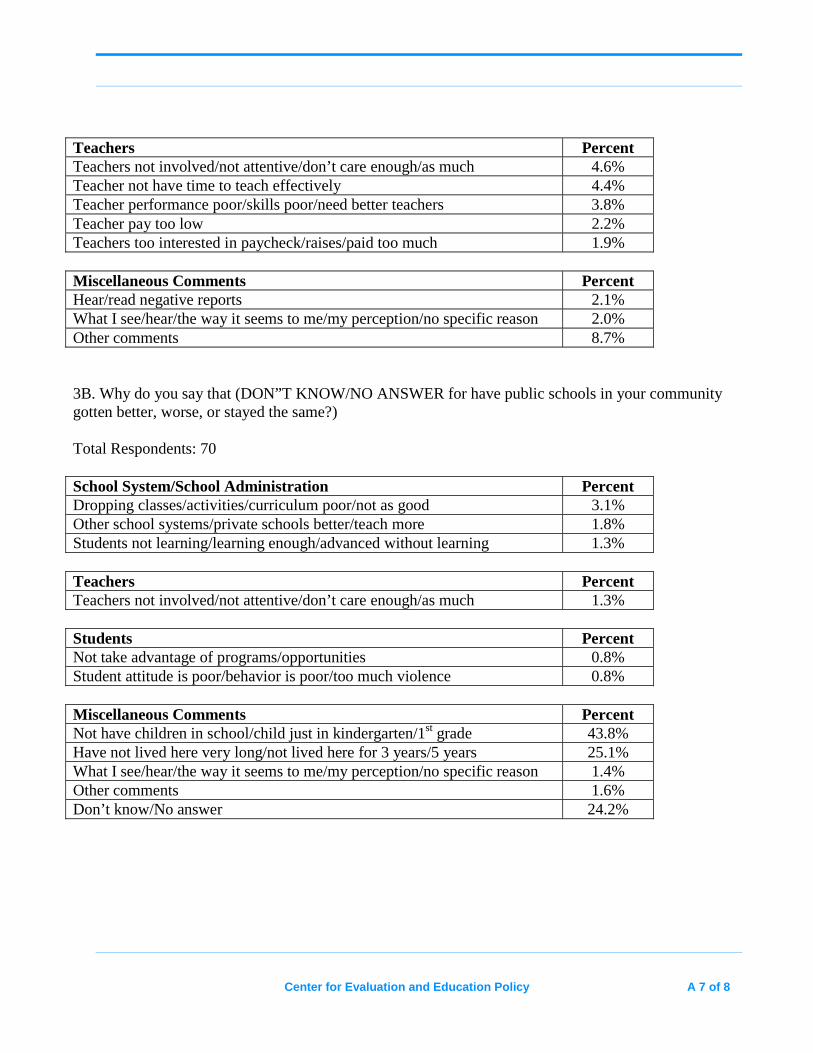
Center for Evaluation and Education Policy A 7 of 8
Teachers Percent Teachers not involved/not attentive/don’t care enough/as much 4.6% Teacher not have time to teach effectively 4.4% Teacher performance poor/skills poor/need better teachers 3.8% Teacher pay too low 2.2% Teachers too interested in paycheck/raises/paid too much 1.9% Miscellaneous Comments Percent Hear/read negative reports 2.1% What I see/hear/the way it seems to me/my perception/no specific reason 2.0% Other comments 8.7% 3B. Why do you say that (DON”T KNOW/NO ANSWER for have public schools in your community gotten better, worse, or stayed the same?) Total Respondents: 70 School System/School Administration Percent Dropping classes/activities/curriculum poor/not as good 3.1% Other school systems/private schools better/teach more 1.8% Students not learning/learning enough/advanced without learning 1.3% Teachers Percent Teachers not involved/not attentive/don’t care enough/as much 1.3% Students Percent Not take advantage of programs/opportunities 0.8% Student attitude is poor/behavior is poor/too much violence 0.8% Miscellaneous Comments Percent Not have children in school/child just in kindergarten/1st grade 43.8% Have not lived here very long/not lived here for 3 years/5 years 25.1% What I see/hear/the way it seems to me/my perception/no specific reason 1.4% Other comments 1.6% Don’t know/No answer 24.2%

A8 of 8 Center for Evaluation and Education Policy
Center for Evaluation and Education Policy B1 of 48
Appendix B
Demographic Results by Question

B2 of 48 Center for Evaluation and Education Policy
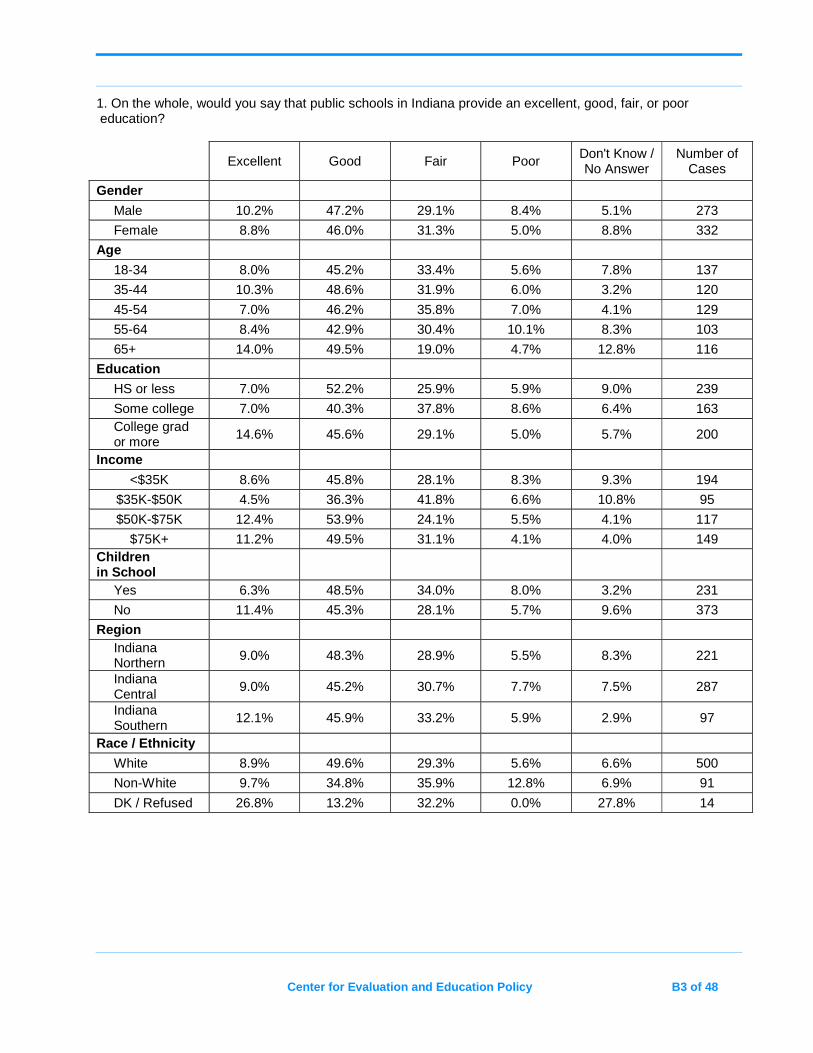
Center for Evaluation and Education Policy B3 of 48
1. On the whole, would you say that public schools in Indiana provide an excellent, good, fair, or poor education?
Excellent Good Fair Poor Don't Know / No Answer
Number of Cases
Gender
Male 10.2% 47.2% 29.1% 8.4% 5.1% 273
Female 8.8% 46.0% 31.3% 5.0% 8.8% 332
Age
18-34 8.0% 45.2% 33.4% 5.6% 7.8% 137
35-44 10.3% 48.6% 31.9% 6.0% 3.2% 120
45-54 7.0% 46.2% 35.8% 7.0% 4.1% 129
55-64 8.4% 42.9% 30.4% 10.1% 8.3% 103
65+ 14.0% 49.5% 19.0% 4.7% 12.8% 116
Education
HS or less 7.0% 52.2% 25.9% 5.9% 9.0% 239
Some college 7.0% 40.3% 37.8% 8.6% 6.4% 163 College grad or more
14.6% 45.6% 29.1% 5.0% 5.7% 200
Income
<$35K 8.6% 45.8% 28.1% 8.3% 9.3% 194
$35K-$50K 4.5% 36.3% 41.8% 6.6% 10.8% 95
$50K-$75K 12.4% 53.9% 24.1% 5.5% 4.1% 117
$75K+ 11.2% 49.5% 31.1% 4.1% 4.0% 149 Children in School
Yes 6.3% 48.5% 34.0% 8.0% 3.2% 231
No 11.4% 45.3% 28.1% 5.7% 9.6% 373
Region Indiana Northern 9.0% 48.3% 28.9% 5.5% 8.3% 221
Indiana Central
9.0% 45.2% 30.7% 7.7% 7.5% 287
Indiana Southern
12.1% 45.9% 33.2% 5.9% 2.9% 97
Race / Ethnicity
White 8.9% 49.6% 29.3% 5.6% 6.6% 500
Non-White 9.7% 34.8% 35.9% 12.8% 6.9% 91
DK / Refused 26.8% 13.2% 32.2% 0.0% 27.8% 14
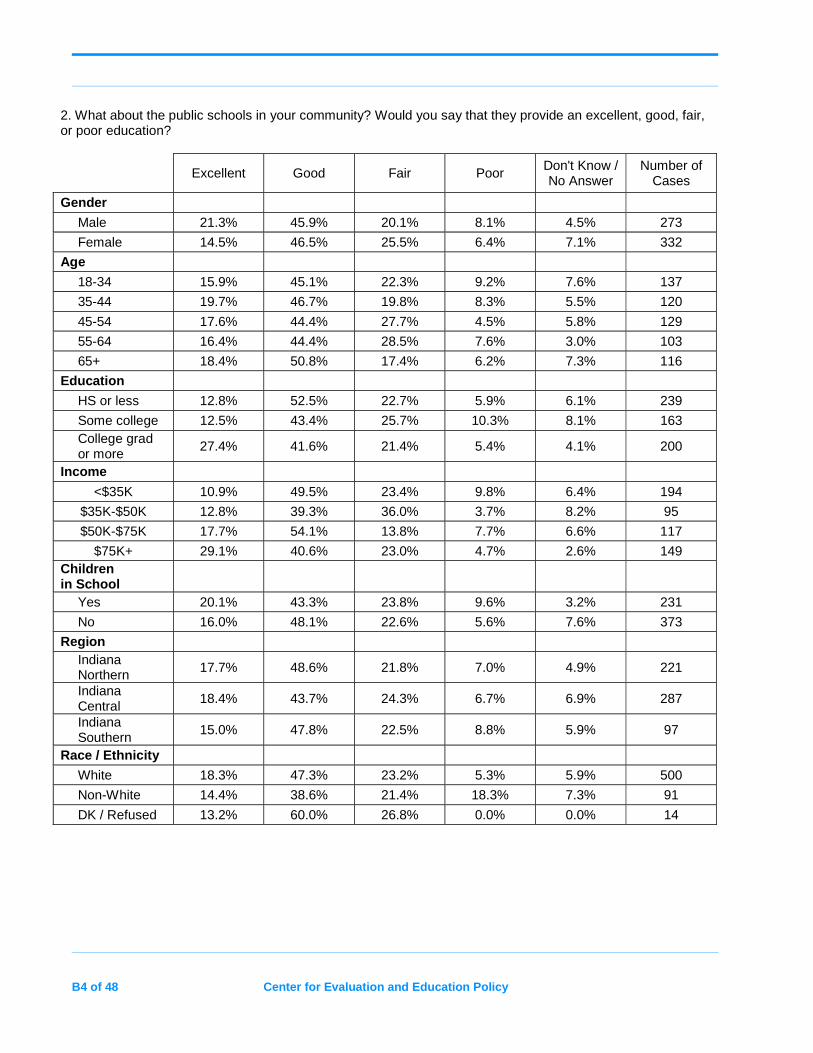
B4 of 48 Center for Evaluation and Education Policy
2. What about the public schools in your community? Would you say that they provide an excellent, good, fair, or poor education?
Excellent Good Fair Poor Don't Know / No Answer
Number of Cases
Gender
Male 21.3% 45.9% 20.1% 8.1% 4.5% 273
Female 14.5% 46.5% 25.5% 6.4% 7.1% 332
Age
18-34 15.9% 45.1% 22.3% 9.2% 7.6% 137
35-44 19.7% 46.7% 19.8% 8.3% 5.5% 120
45-54 17.6% 44.4% 27.7% 4.5% 5.8% 129
55-64 16.4% 44.4% 28.5% 7.6% 3.0% 103
65+ 18.4% 50.8% 17.4% 6.2% 7.3% 116
Education
HS or less 12.8% 52.5% 22.7% 5.9% 6.1% 239
Some college 12.5% 43.4% 25.7% 10.3% 8.1% 163 College grad or more
27.4% 41.6% 21.4% 5.4% 4.1% 200
Income
<$35K 10.9% 49.5% 23.4% 9.8% 6.4% 194
$35K-$50K 12.8% 39.3% 36.0% 3.7% 8.2% 95
$50K-$75K 17.7% 54.1% 13.8% 7.7% 6.6% 117
$75K+ 29.1% 40.6% 23.0% 4.7% 2.6% 149 Children in School
Yes 20.1% 43.3% 23.8% 9.6% 3.2% 231
No 16.0% 48.1% 22.6% 5.6% 7.6% 373
Region Indiana Northern 17.7% 48.6% 21.8% 7.0% 4.9% 221
Indiana Central
18.4% 43.7% 24.3% 6.7% 6.9% 287
Indiana Southern
15.0% 47.8% 22.5% 8.8% 5.9% 97
Race / Ethnicity
White 18.3% 47.3% 23.2% 5.3% 5.9% 500
Non-White 14.4% 38.6% 21.4% 18.3% 7.3% 91
DK / Refused 13.2% 60.0% 26.8% 0.0% 0.0% 14
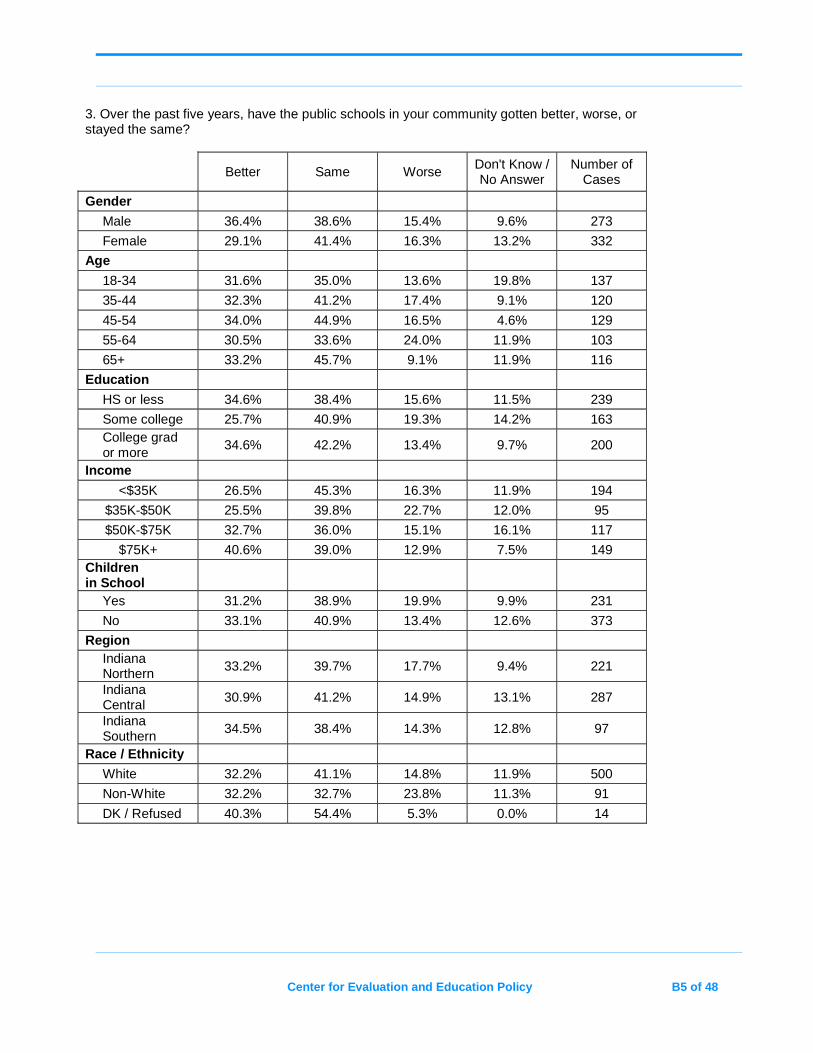
Center for Evaluation and Education Policy B5 of 48
3. Over the past five years, have the public schools in your community gotten better, worse, or stayed the same?
Better Same Worse Don't Know / No Answer
Number of Cases
Gender
Male 36.4% 38.6% 15.4% 9.6% 273
Female 29.1% 41.4% 16.3% 13.2% 332
Age
18-34 31.6% 35.0% 13.6% 19.8% 137
35-44 32.3% 41.2% 17.4% 9.1% 120
45-54 34.0% 44.9% 16.5% 4.6% 129
55-64 30.5% 33.6% 24.0% 11.9% 103
65+ 33.2% 45.7% 9.1% 11.9% 116
Education
HS or less 34.6% 38.4% 15.6% 11.5% 239
Some college 25.7% 40.9% 19.3% 14.2% 163 College grad or more
34.6% 42.2% 13.4% 9.7% 200
Income
<$35K 26.5% 45.3% 16.3% 11.9% 194
$35K-$50K 25.5% 39.8% 22.7% 12.0% 95
$50K-$75K 32.7% 36.0% 15.1% 16.1% 117
$75K+ 40.6% 39.0% 12.9% 7.5% 149 Children in School
Yes 31.2% 38.9% 19.9% 9.9% 231
No 33.1% 40.9% 13.4% 12.6% 373
Region Indiana Northern 33.2% 39.7% 17.7% 9.4% 221
Indiana Central
30.9% 41.2% 14.9% 13.1% 287
Indiana Southern
34.5% 38.4% 14.3% 12.8% 97
Race / Ethnicity
White 32.2% 41.1% 14.8% 11.9% 500
Non-White 32.2% 32.7% 23.8% 11.3% 91
DK / Refused 40.3% 54.4% 5.3% 0.0% 14
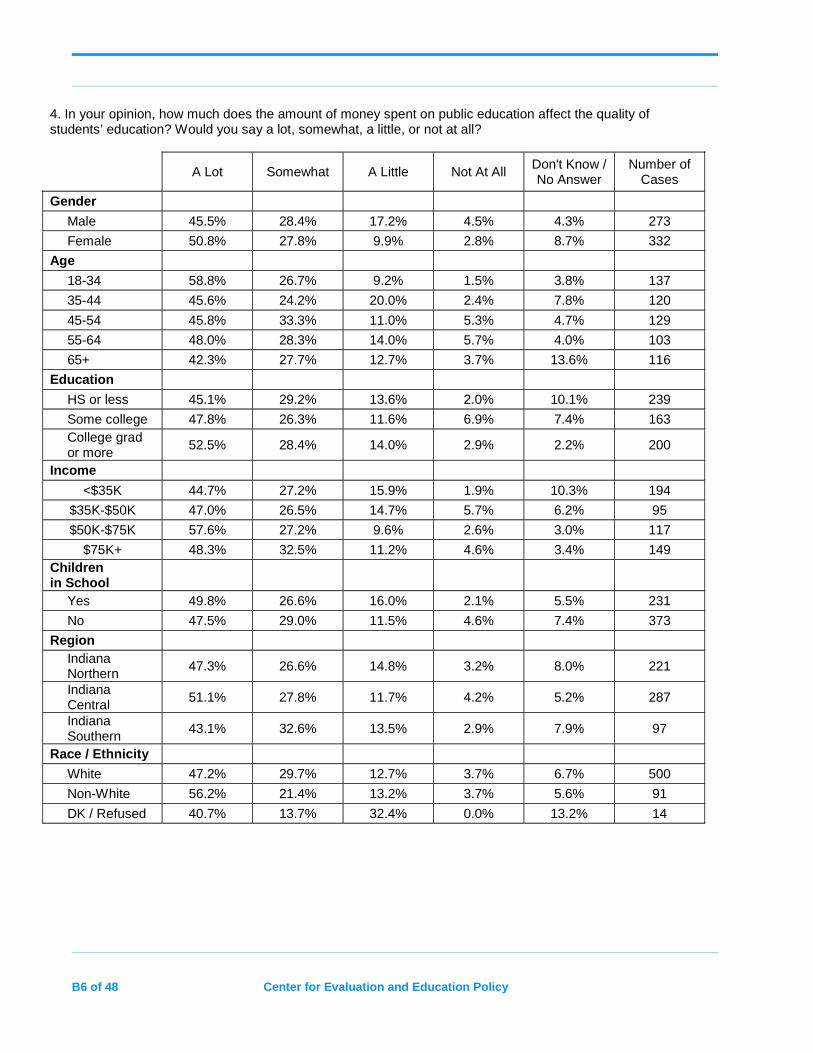
B6 of 48 Center for Evaluation and Education Policy
4. In your opinion, how much does the amount of money spent on public education affect the quality of students’ education? Would you say a lot, somewhat, a little, or not at all?
A Lot Somewhat A Little Not At All Don't Know / No Answer
Number of Cases
Gender
Male 45.5% 28.4% 17.2% 4.5% 4.3% 273
Female 50.8% 27.8% 9.9% 2.8% 8.7% 332
Age
18-34 58.8% 26.7% 9.2% 1.5% 3.8% 137
35-44 45.6% 24.2% 20.0% 2.4% 7.8% 120
45-54 45.8% 33.3% 11.0% 5.3% 4.7% 129
55-64 48.0% 28.3% 14.0% 5.7% 4.0% 103
65+ 42.3% 27.7% 12.7% 3.7% 13.6% 116
Education
HS or less 45.1% 29.2% 13.6% 2.0% 10.1% 239
Some college 47.8% 26.3% 11.6% 6.9% 7.4% 163 College grad or more
52.5% 28.4% 14.0% 2.9% 2.2% 200
Income
<$35K 44.7% 27.2% 15.9% 1.9% 10.3% 194
$35K-$50K 47.0% 26.5% 14.7% 5.7% 6.2% 95
$50K-$75K 57.6% 27.2% 9.6% 2.6% 3.0% 117
$75K+ 48.3% 32.5% 11.2% 4.6% 3.4% 149 Children in School
Yes 49.8% 26.6% 16.0% 2.1% 5.5% 231
No 47.5% 29.0% 11.5% 4.6% 7.4% 373
Region Indiana Northern 47.3% 26.6% 14.8% 3.2% 8.0% 221
Indiana Central
51.1% 27.8% 11.7% 4.2% 5.2% 287
Indiana Southern
43.1% 32.6% 13.5% 2.9% 7.9% 97
Race / Ethnicity
White 47.2% 29.7% 12.7% 3.7% 6.7% 500
Non-White 56.2% 21.4% 13.2% 3.7% 5.6% 91
DK / Refused 40.7% 13.7% 32.4% 0.0% 13.2% 14
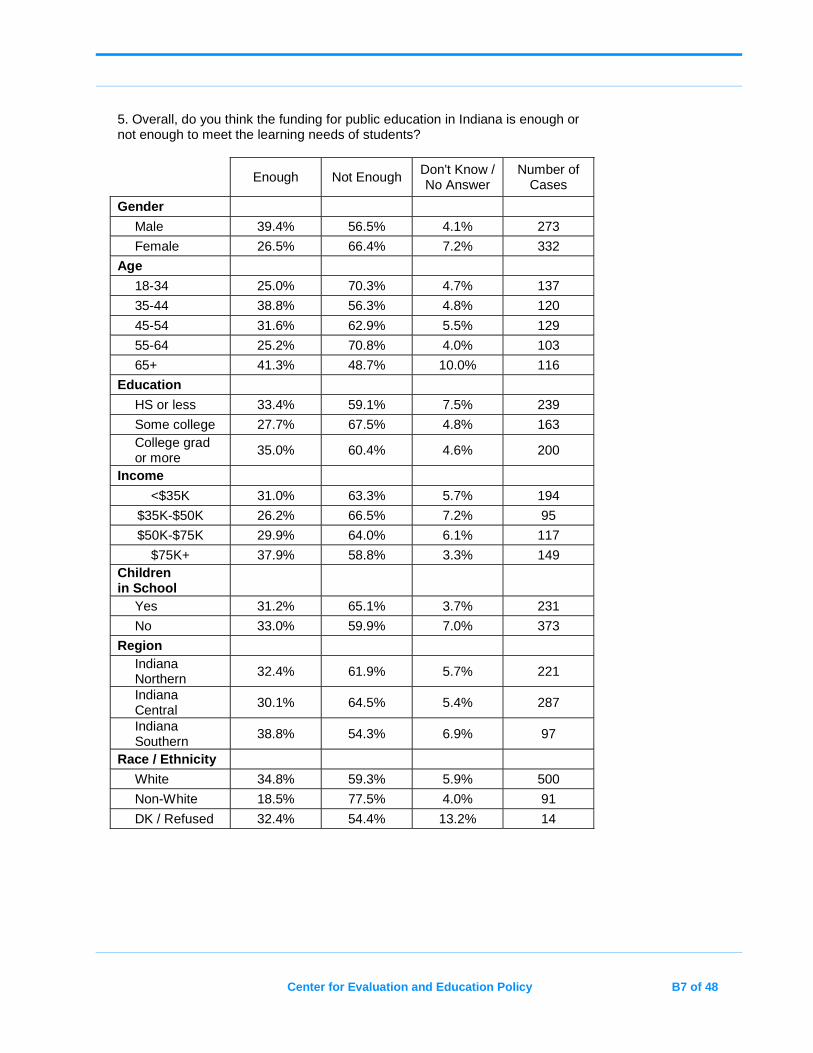
Center for Evaluation and Education Policy B7 of 48
5. Overall, do you think the funding for public education in Indiana is enough or not enough to meet the learning needs of students?
Enough Not Enough Don't Know / No Answer
Number of Cases
Gender
Male 39.4% 56.5% 4.1% 273
Female 26.5% 66.4% 7.2% 332
Age
18-34 25.0% 70.3% 4.7% 137
35-44 38.8% 56.3% 4.8% 120
45-54 31.6% 62.9% 5.5% 129
55-64 25.2% 70.8% 4.0% 103
65+ 41.3% 48.7% 10.0% 116
Education
HS or less 33.4% 59.1% 7.5% 239
Some college 27.7% 67.5% 4.8% 163 College grad or more
35.0% 60.4% 4.6% 200
Income
<$35K 31.0% 63.3% 5.7% 194
$35K-$50K 26.2% 66.5% 7.2% 95
$50K-$75K 29.9% 64.0% 6.1% 117
$75K+ 37.9% 58.8% 3.3% 149 Children in School
Yes 31.2% 65.1% 3.7% 231
No 33.0% 59.9% 7.0% 373
Region Indiana Northern 32.4% 61.9% 5.7% 221
Indiana Central
30.1% 64.5% 5.4% 287
Indiana Southern
38.8% 54.3% 6.9% 97
Race / Ethnicity
White 34.8% 59.3% 5.9% 500
Non-White 18.5% 77.5% 4.0% 91
DK / Refused 32.4% 54.4% 13.2% 14
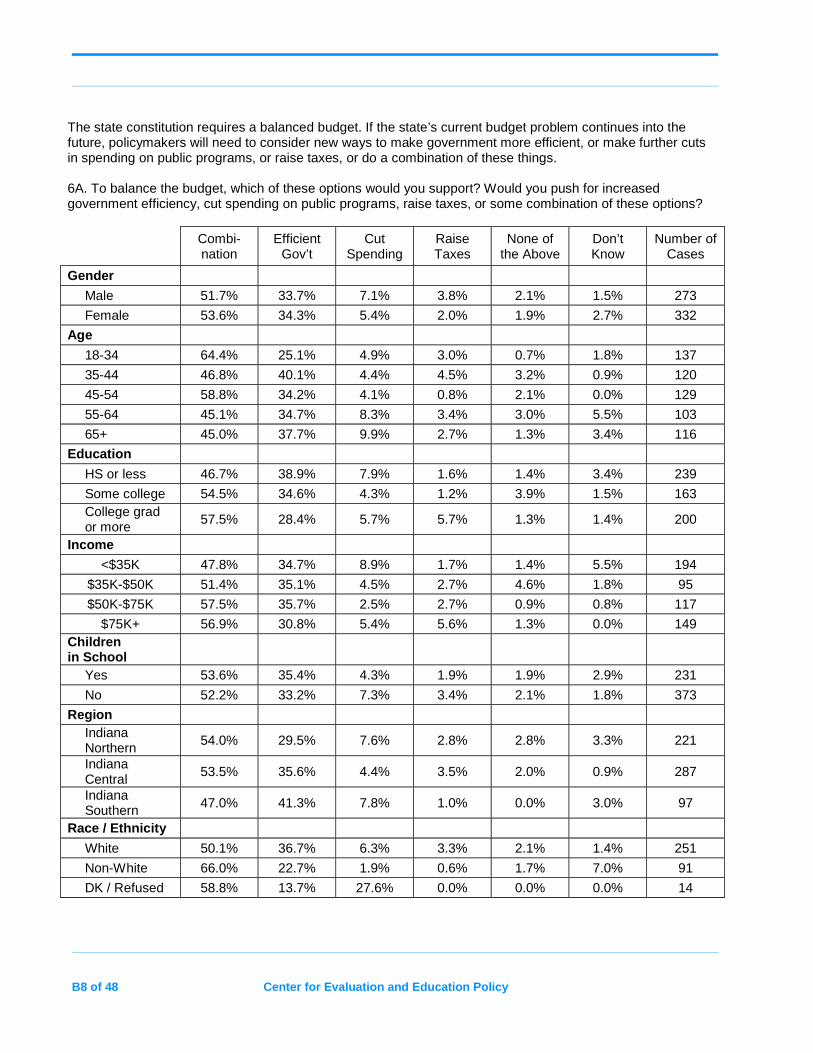
B8 of 48 Center for Evaluation and Education Policy
The state constitution requires a balanced budget. If the state’s current budget problem continues into the future, policymakers will need to consider new ways to make government more efficient, or make further cuts in spending on public programs, or raise taxes, or do a combination of these things. 6A. To balance the budget, which of these options would you support? Would you push for increased government efficiency, cut spending on public programs, raise taxes, or some combination of these options?
Combi-nation
Efficient Gov’t
Cut Spending
Raise Taxes
None of the Above
Don’t Know
Number of Cases
Gender
Male 51.7% 33.7% 7.1% 3.8% 2.1% 1.5% 273
Female 53.6% 34.3% 5.4% 2.0% 1.9% 2.7% 332
Age
18-34 64.4% 25.1% 4.9% 3.0% 0.7% 1.8% 137
35-44 46.8% 40.1% 4.4% 4.5% 3.2% 0.9% 120
45-54 58.8% 34.2% 4.1% 0.8% 2.1% 0.0% 129
55-64 45.1% 34.7% 8.3% 3.4% 3.0% 5.5% 103
65+ 45.0% 37.7% 9.9% 2.7% 1.3% 3.4% 116
Education
HS or less 46.7% 38.9% 7.9% 1.6% 1.4% 3.4% 239
Some college 54.5% 34.6% 4.3% 1.2% 3.9% 1.5% 163 College grad or more
57.5% 28.4% 5.7% 5.7% 1.3% 1.4% 200
Income
<$35K 47.8% 34.7% 8.9% 1.7% 1.4% 5.5% 194
$35K-$50K 51.4% 35.1% 4.5% 2.7% 4.6% 1.8% 95
$50K-$75K 57.5% 35.7% 2.5% 2.7% 0.9% 0.8% 117
$75K+ 56.9% 30.8% 5.4% 5.6% 1.3% 0.0% 149 Children in School
Yes 53.6% 35.4% 4.3% 1.9% 1.9% 2.9% 231
No 52.2% 33.2% 7.3% 3.4% 2.1% 1.8% 373
Region Indiana Northern
54.0% 29.5% 7.6% 2.8% 2.8% 3.3% 221
Indiana Central
53.5% 35.6% 4.4% 3.5% 2.0% 0.9% 287
Indiana Southern 47.0% 41.3% 7.8% 1.0% 0.0% 3.0% 97
Race / Ethnicity
White 50.1% 36.7% 6.3% 3.3% 2.1% 1.4% 251
Non-White 66.0% 22.7% 1.9% 0.6% 1.7% 7.0% 91
DK / Refused 58.8% 13.7% 27.6% 0.0% 0.0% 0.0% 14
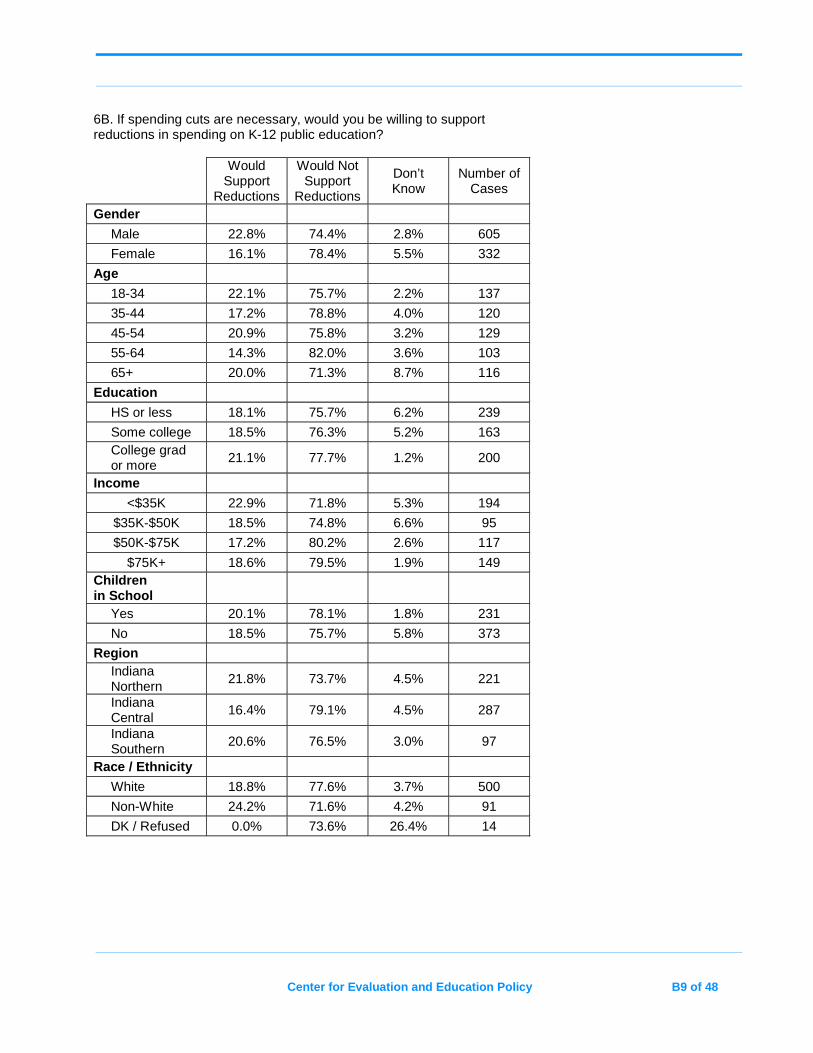
Center for Evaluation and Education Policy B9 of 48
6B. If spending cuts are necessary, would you be willing to support reductions in spending on K-12 public education?
Would
Support Reductions
Would Not Support
Reductions
Don’t Know
Number of Cases
Gender
Male 22.8% 74.4% 2.8% 605
Female 16.1% 78.4% 5.5% 332
Age
18-34 22.1% 75.7% 2.2% 137
35-44 17.2% 78.8% 4.0% 120
45-54 20.9% 75.8% 3.2% 129
55-64 14.3% 82.0% 3.6% 103
65+ 20.0% 71.3% 8.7% 116
Education
HS or less 18.1% 75.7% 6.2% 239
Some college 18.5% 76.3% 5.2% 163 College grad or more
21.1% 77.7% 1.2% 200
Income
<$35K 22.9% 71.8% 5.3% 194
$35K-$50K 18.5% 74.8% 6.6% 95
$50K-$75K 17.2% 80.2% 2.6% 117
$75K+ 18.6% 79.5% 1.9% 149 Children in School
Yes 20.1% 78.1% 1.8% 231
No 18.5% 75.7% 5.8% 373
Region Indiana Northern
21.8% 73.7% 4.5% 221
Indiana Central
16.4% 79.1% 4.5% 287
Indiana Southern
20.6% 76.5% 3.0% 97
Race / Ethnicity
White 18.8% 77.6% 3.7% 500
Non-White 24.2% 71.6% 4.2% 91
DK / Refused 0.0% 73.6% 26.4% 14
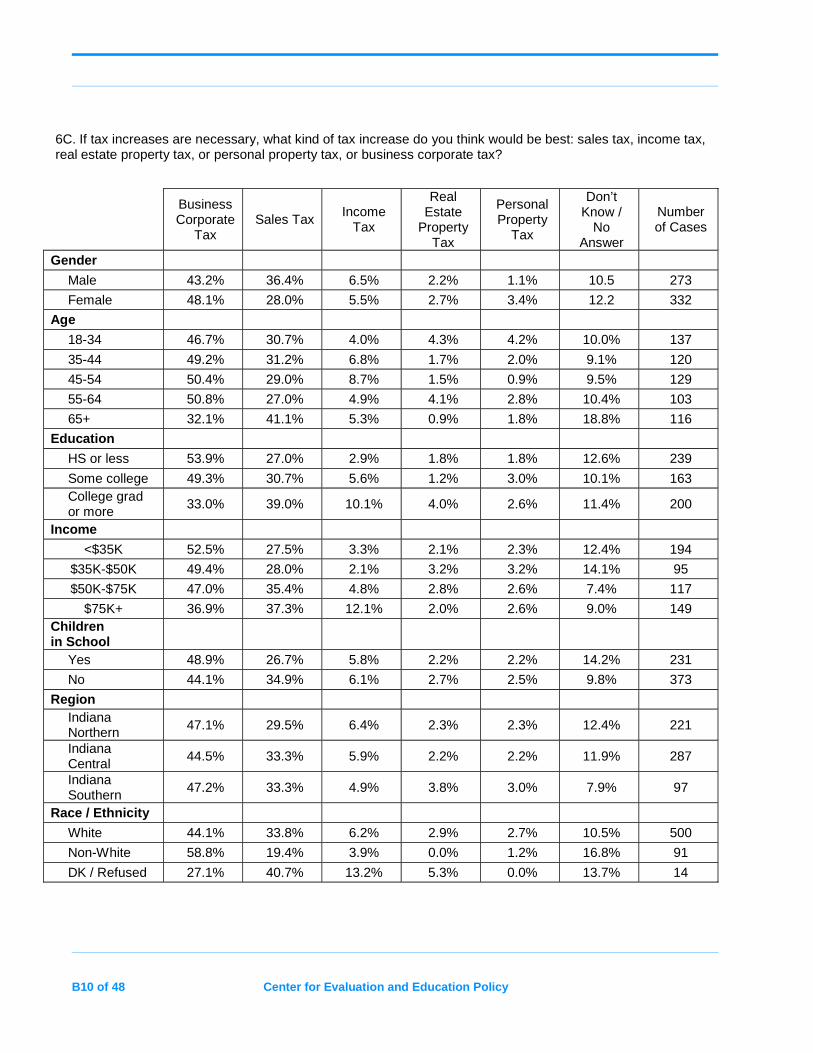
B10 of 48 Center for Evaluation and Education Policy
6C. If tax increases are necessary, what kind of tax increase do you think would be best: sales tax, income tax, real estate property tax, or personal property tax, or business corporate tax?
Business Corporate
Tax Sales Tax
Income Tax
Real Estate
Property Tax
Personal Property
Tax
Don’t Know /
No Answer
Number of Cases
Gender
Male 43.2% 36.4% 6.5% 2.2% 1.1% 10.5 273
Female 48.1% 28.0% 5.5% 2.7% 3.4% 12.2 332
Age
18-34 46.7% 30.7% 4.0% 4.3% 4.2% 10.0% 137
35-44 49.2% 31.2% 6.8% 1.7% 2.0% 9.1% 120
45-54 50.4% 29.0% 8.7% 1.5% 0.9% 9.5% 129
55-64 50.8% 27.0% 4.9% 4.1% 2.8% 10.4% 103
65+ 32.1% 41.1% 5.3% 0.9% 1.8% 18.8% 116
Education
HS or less 53.9% 27.0% 2.9% 1.8% 1.8% 12.6% 239
Some college 49.3% 30.7% 5.6% 1.2% 3.0% 10.1% 163 College grad or more
33.0% 39.0% 10.1% 4.0% 2.6% 11.4% 200
Income
<$35K 52.5% 27.5% 3.3% 2.1% 2.3% 12.4% 194
$35K-$50K 49.4% 28.0% 2.1% 3.2% 3.2% 14.1% 95
$50K-$75K 47.0% 35.4% 4.8% 2.8% 2.6% 7.4% 117
$75K+ 36.9% 37.3% 12.1% 2.0% 2.6% 9.0% 149 Children in School
Yes 48.9% 26.7% 5.8% 2.2% 2.2% 14.2% 231
No 44.1% 34.9% 6.1% 2.7% 2.5% 9.8% 373
Region Indiana Northern 47.1% 29.5% 6.4% 2.3% 2.3% 12.4% 221
Indiana Central
44.5% 33.3% 5.9% 2.2% 2.2% 11.9% 287
Indiana Southern
47.2% 33.3% 4.9% 3.8% 3.0% 7.9% 97
Race / Ethnicity
White 44.1% 33.8% 6.2% 2.9% 2.7% 10.5% 500
Non-White 58.8% 19.4% 3.9% 0.0% 1.2% 16.8% 91
DK / Refused 27.1% 40.7% 13.2% 5.3% 0.0% 13.7% 14
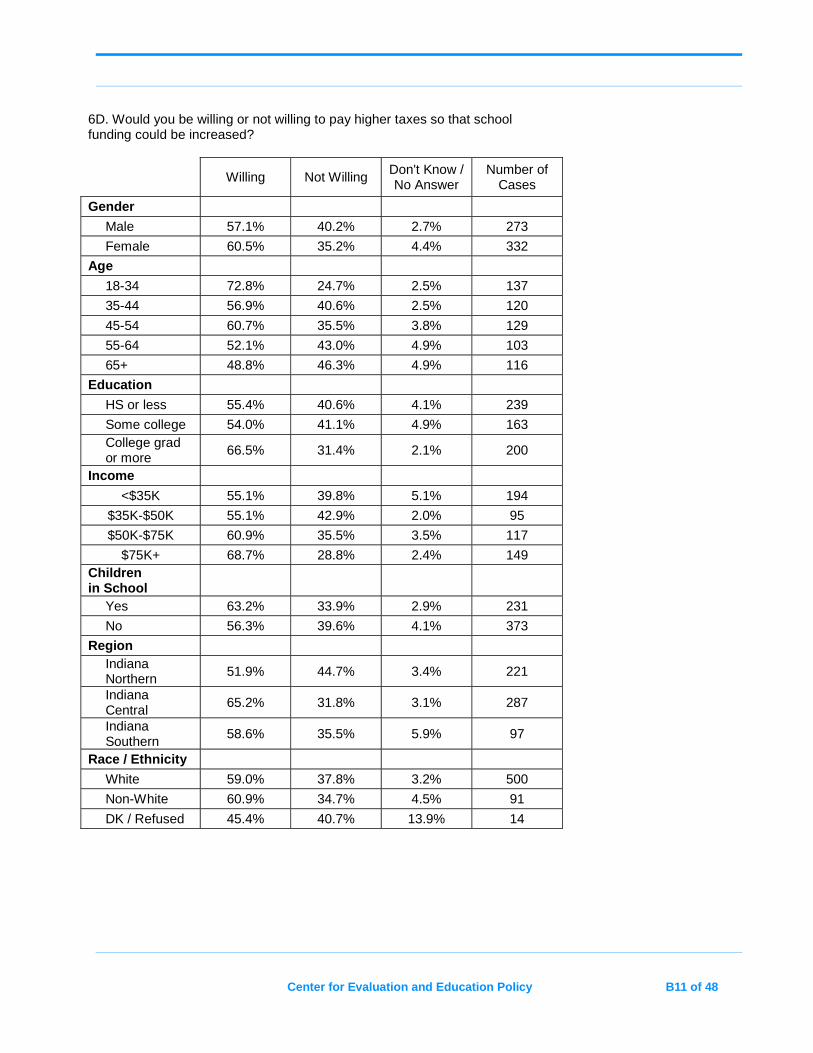
Center for Evaluation and Education Policy B11 of 48
6D. Would you be willing or not willing to pay higher taxes so that school funding could be increased?
Willing Not Willing Don't Know / No Answer
Number of Cases
Gender
Male 57.1% 40.2% 2.7% 273
Female 60.5% 35.2% 4.4% 332
Age
18-34 72.8% 24.7% 2.5% 137
35-44 56.9% 40.6% 2.5% 120
45-54 60.7% 35.5% 3.8% 129
55-64 52.1% 43.0% 4.9% 103
65+ 48.8% 46.3% 4.9% 116
Education
HS or less 55.4% 40.6% 4.1% 239
Some college 54.0% 41.1% 4.9% 163 College grad or more
66.5% 31.4% 2.1% 200
Income
<$35K 55.1% 39.8% 5.1% 194
$35K-$50K 55.1% 42.9% 2.0% 95
$50K-$75K 60.9% 35.5% 3.5% 117
$75K+ 68.7% 28.8% 2.4% 149 Children in School
Yes 63.2% 33.9% 2.9% 231
No 56.3% 39.6% 4.1% 373
Region Indiana Northern 51.9% 44.7% 3.4% 221
Indiana Central
65.2% 31.8% 3.1% 287
Indiana Southern
58.6% 35.5% 5.9% 97
Race / Ethnicity
White 59.0% 37.8% 3.2% 500
Non-White 60.9% 34.7% 4.5% 91
DK / Refused 45.4% 40.7% 13.9% 14
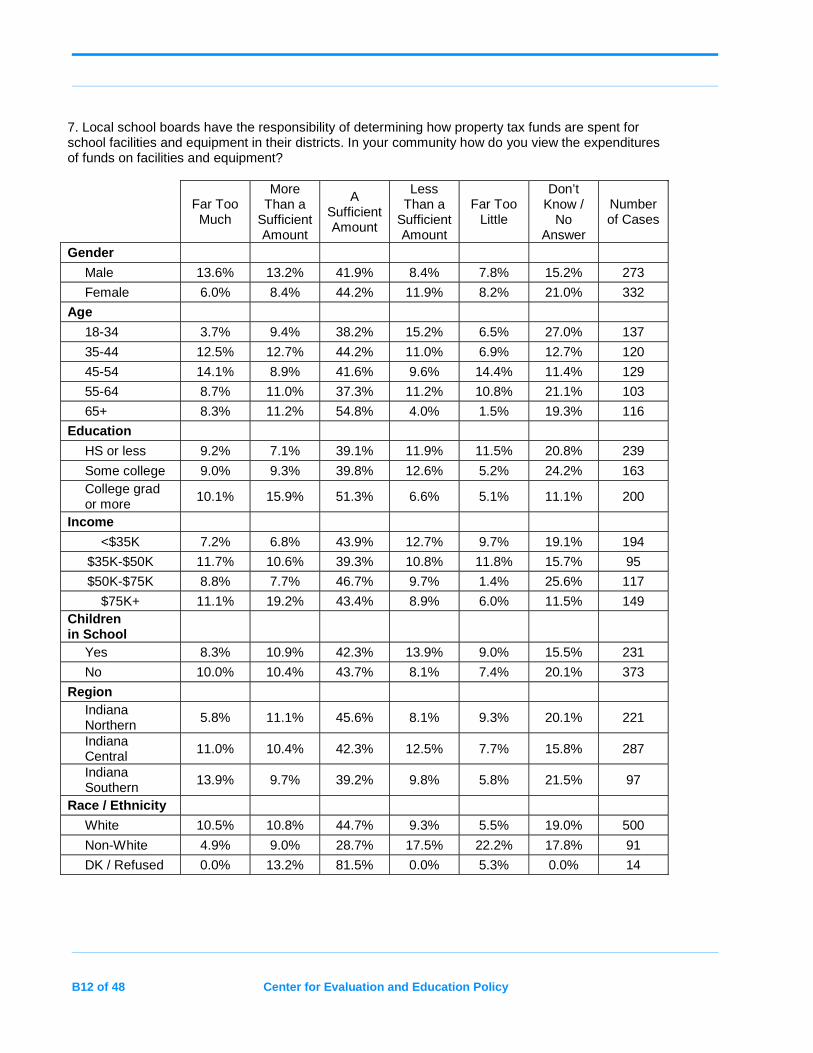
B12 of 48 Center for Evaluation and Education Policy
7. Local school boards have the responsibility of determining how property tax funds are spent for school facilities and equipment in their districts. In your community how do you view the expenditures of funds on facilities and equipment?
Far Too Much
More Than a
Sufficient Amount
A Sufficient Amount
Less Than a
Sufficient Amount
Far Too Little
Don’t Know /
No Answer
Number of Cases
Gender
Male 13.6% 13.2% 41.9% 8.4% 7.8% 15.2% 273
Female 6.0% 8.4% 44.2% 11.9% 8.2% 21.0% 332
Age
18-34 3.7% 9.4% 38.2% 15.2% 6.5% 27.0% 137
35-44 12.5% 12.7% 44.2% 11.0% 6.9% 12.7% 120
45-54 14.1% 8.9% 41.6% 9.6% 14.4% 11.4% 129
55-64 8.7% 11.0% 37.3% 11.2% 10.8% 21.1% 103
65+ 8.3% 11.2% 54.8% 4.0% 1.5% 19.3% 116
Education
HS or less 9.2% 7.1% 39.1% 11.9% 11.5% 20.8% 239
Some college 9.0% 9.3% 39.8% 12.6% 5.2% 24.2% 163 College grad or more
10.1% 15.9% 51.3% 6.6% 5.1% 11.1% 200
Income
<$35K 7.2% 6.8% 43.9% 12.7% 9.7% 19.1% 194
$35K-$50K 11.7% 10.6% 39.3% 10.8% 11.8% 15.7% 95
$50K-$75K 8.8% 7.7% 46.7% 9.7% 1.4% 25.6% 117
$75K+ 11.1% 19.2% 43.4% 8.9% 6.0% 11.5% 149 Children in School
Yes 8.3% 10.9% 42.3% 13.9% 9.0% 15.5% 231
No 10.0% 10.4% 43.7% 8.1% 7.4% 20.1% 373
Region Indiana Northern
5.8% 11.1% 45.6% 8.1% 9.3% 20.1% 221
Indiana Central 11.0% 10.4% 42.3% 12.5% 7.7% 15.8% 287
Indiana Southern
13.9% 9.7% 39.2% 9.8% 5.8% 21.5% 97
Race / Ethnicity
White 10.5% 10.8% 44.7% 9.3% 5.5% 19.0% 500
Non-White 4.9% 9.0% 28.7% 17.5% 22.2% 17.8% 91
DK / Refused 0.0% 13.2% 81.5% 0.0% 5.3% 0.0% 14
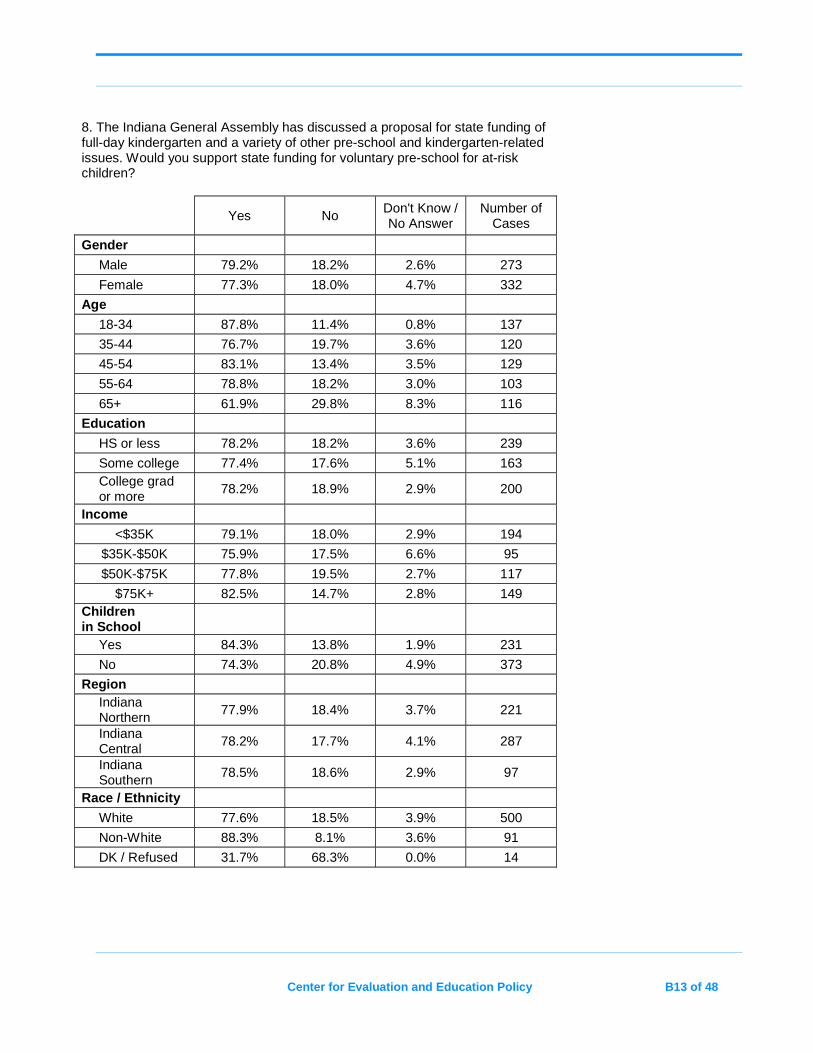
Center for Evaluation and Education Policy B13 of 48
8. The Indiana General Assembly has discussed a proposal for state funding of full-day kindergarten and a variety of other pre-school and kindergarten-related issues. Would you support state funding for voluntary pre-school for at-risk children?
Yes No Don't Know / No Answer
Number of Cases
Gender
Male 79.2% 18.2% 2.6% 273
Female 77.3% 18.0% 4.7% 332
Age
18-34 87.8% 11.4% 0.8% 137
35-44 76.7% 19.7% 3.6% 120
45-54 83.1% 13.4% 3.5% 129
55-64 78.8% 18.2% 3.0% 103
65+ 61.9% 29.8% 8.3% 116
Education
HS or less 78.2% 18.2% 3.6% 239
Some college 77.4% 17.6% 5.1% 163 College grad or more
78.2% 18.9% 2.9% 200
Income
<$35K 79.1% 18.0% 2.9% 194
$35K-$50K 75.9% 17.5% 6.6% 95
$50K-$75K 77.8% 19.5% 2.7% 117
$75K+ 82.5% 14.7% 2.8% 149 Children in School
Yes 84.3% 13.8% 1.9% 231
No 74.3% 20.8% 4.9% 373
Region Indiana Northern
77.9% 18.4% 3.7% 221
Indiana Central
78.2% 17.7% 4.1% 287
Indiana Southern
78.5% 18.6% 2.9% 97
Race / Ethnicity
White 77.6% 18.5% 3.9% 500
Non-White 88.3% 8.1% 3.6% 91
DK / Refused 31.7% 68.3% 0.0% 14
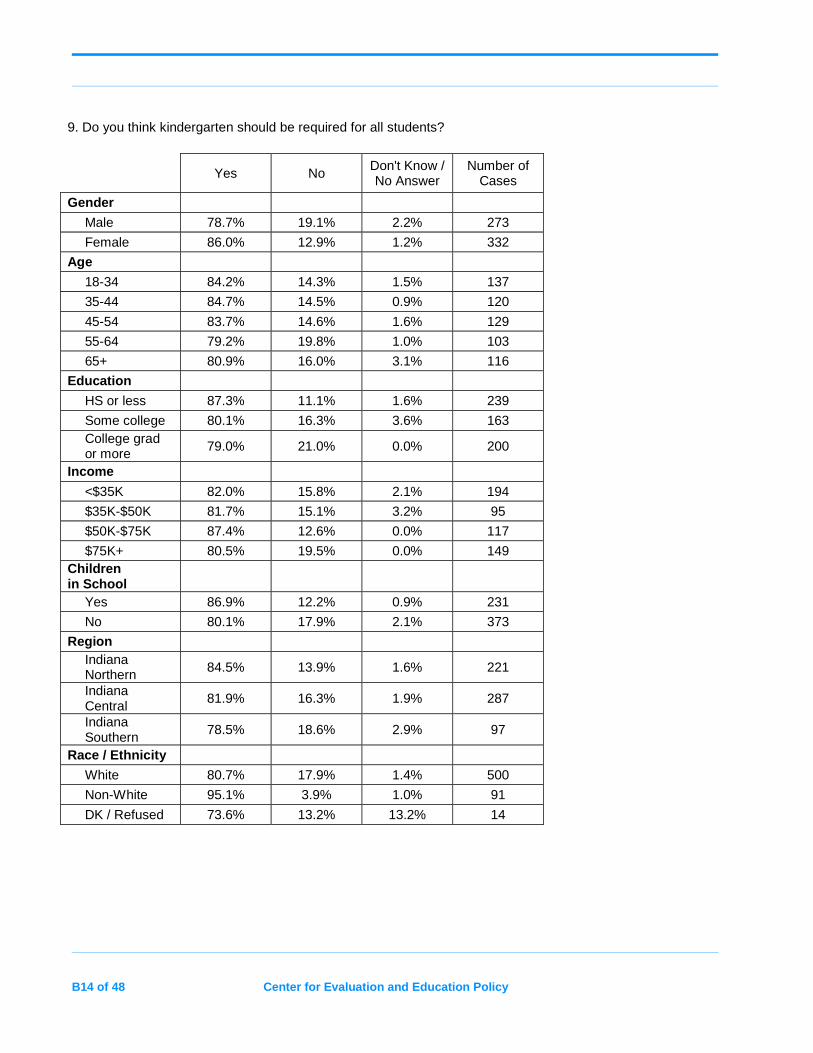
B14 of 48 Center for Evaluation and Education Policy
9. Do you think kindergarten should be required for all students?
Yes No Don't Know / No Answer
Number of Cases
Gender
Male 78.7% 19.1% 2.2% 273
Female 86.0% 12.9% 1.2% 332
Age
18-34 84.2% 14.3% 1.5% 137
35-44 84.7% 14.5% 0.9% 120
45-54 83.7% 14.6% 1.6% 129
55-64 79.2% 19.8% 1.0% 103
65+ 80.9% 16.0% 3.1% 116
Education
HS or less 87.3% 11.1% 1.6% 239
Some college 80.1% 16.3% 3.6% 163 College grad or more 79.0% 21.0% 0.0% 200
Income
<$35K 82.0% 15.8% 2.1% 194
$35K-$50K 81.7% 15.1% 3.2% 95
$50K-$75K 87.4% 12.6% 0.0% 117
$75K+ 80.5% 19.5% 0.0% 149 Children in School
Yes 86.9% 12.2% 0.9% 231
No 80.1% 17.9% 2.1% 373
Region Indiana Northern 84.5% 13.9% 1.6% 221
Indiana Central
81.9% 16.3% 1.9% 287
Indiana Southern
78.5% 18.6% 2.9% 97
Race / Ethnicity
White 80.7% 17.9% 1.4% 500
Non-White 95.1% 3.9% 1.0% 91
DK / Refused 73.6% 13.2% 13.2% 14
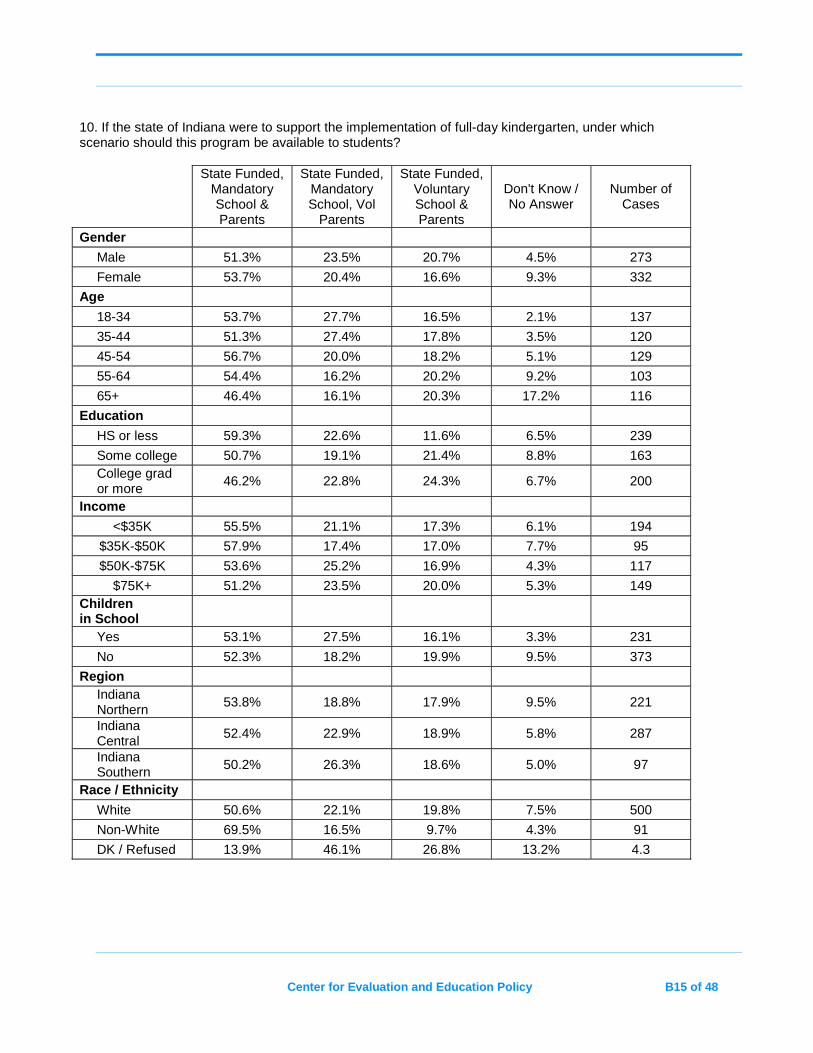
Center for Evaluation and Education Policy B15 of 48
10. If the state of Indiana were to support the implementation of full-day kindergarten, under which scenario should this program be available to students?
State Funded, Mandatory School & Parents
State Funded, Mandatory School, Vol
Parents
State Funded, Voluntary School & Parents
Don't Know / No Answer
Number of Cases
Gender
Male 51.3% 23.5% 20.7% 4.5% 273
Female 53.7% 20.4% 16.6% 9.3% 332
Age
18-34 53.7% 27.7% 16.5% 2.1% 137
35-44 51.3% 27.4% 17.8% 3.5% 120
45-54 56.7% 20.0% 18.2% 5.1% 129
55-64 54.4% 16.2% 20.2% 9.2% 103
65+ 46.4% 16.1% 20.3% 17.2% 116
Education
HS or less 59.3% 22.6% 11.6% 6.5% 239
Some college 50.7% 19.1% 21.4% 8.8% 163 College grad or more
46.2% 22.8% 24.3% 6.7% 200
Income
<$35K 55.5% 21.1% 17.3% 6.1% 194
$35K-$50K 57.9% 17.4% 17.0% 7.7% 95
$50K-$75K 53.6% 25.2% 16.9% 4.3% 117
$75K+ 51.2% 23.5% 20.0% 5.3% 149 Children in School
Yes 53.1% 27.5% 16.1% 3.3% 231
No 52.3% 18.2% 19.9% 9.5% 373
Region Indiana Northern
53.8% 18.8% 17.9% 9.5% 221
Indiana Central
52.4% 22.9% 18.9% 5.8% 287
Indiana Southern 50.2% 26.3% 18.6% 5.0% 97
Race / Ethnicity
White 50.6% 22.1% 19.8% 7.5% 500
Non-White 69.5% 16.5% 9.7% 4.3% 91
DK / Refused 13.9% 46.1% 26.8% 13.2% 4.3
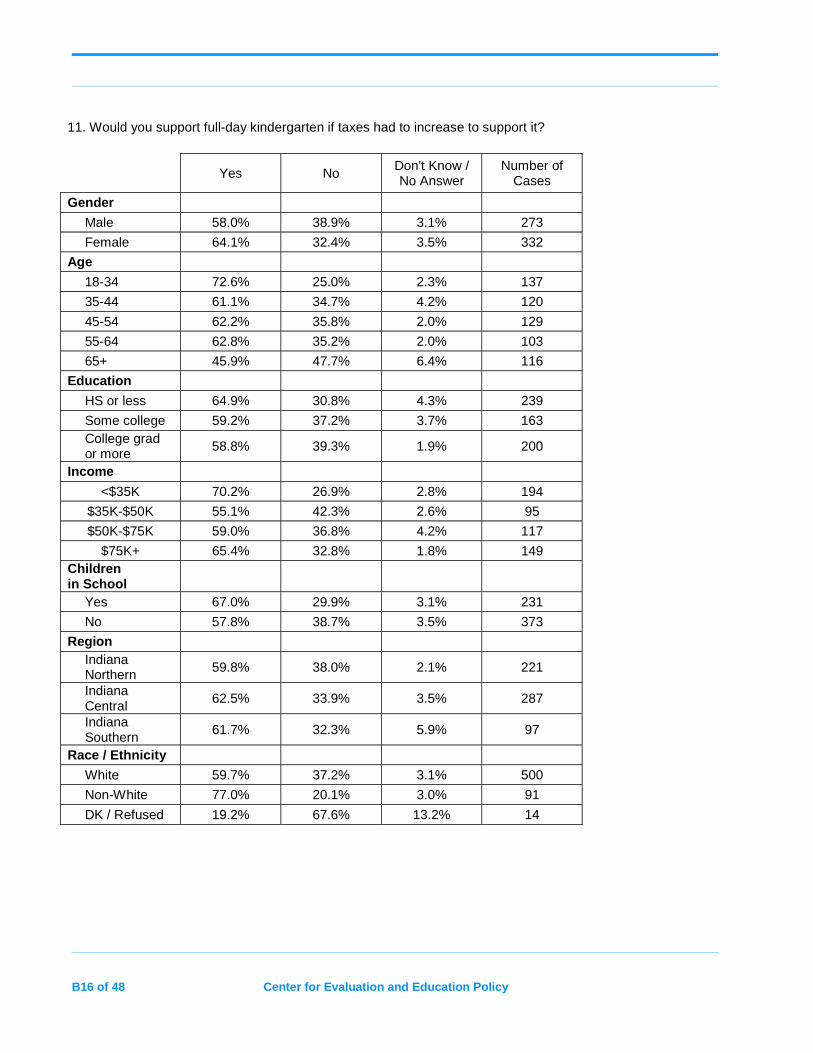
B16 of 48 Center for Evaluation and Education Policy
11. Would you support full-day kindergarten if taxes had to increase to support it?
Yes No Don't Know / No Answer
Number of Cases
Gender
Male 58.0% 38.9% 3.1% 273
Female 64.1% 32.4% 3.5% 332
Age
18-34 72.6% 25.0% 2.3% 137
35-44 61.1% 34.7% 4.2% 120
45-54 62.2% 35.8% 2.0% 129
55-64 62.8% 35.2% 2.0% 103
65+ 45.9% 47.7% 6.4% 116
Education
HS or less 64.9% 30.8% 4.3% 239
Some college 59.2% 37.2% 3.7% 163 College grad or more 58.8% 39.3% 1.9% 200
Income
<$35K 70.2% 26.9% 2.8% 194
$35K-$50K 55.1% 42.3% 2.6% 95
$50K-$75K 59.0% 36.8% 4.2% 117
$75K+ 65.4% 32.8% 1.8% 149 Children in School
Yes 67.0% 29.9% 3.1% 231
No 57.8% 38.7% 3.5% 373
Region Indiana Northern 59.8% 38.0% 2.1% 221
Indiana Central
62.5% 33.9% 3.5% 287
Indiana Southern
61.7% 32.3% 5.9% 97
Race / Ethnicity
White 59.7% 37.2% 3.1% 500
Non-White 77.0% 20.1% 3.0% 91
DK / Refused 19.2% 67.6% 13.2% 14
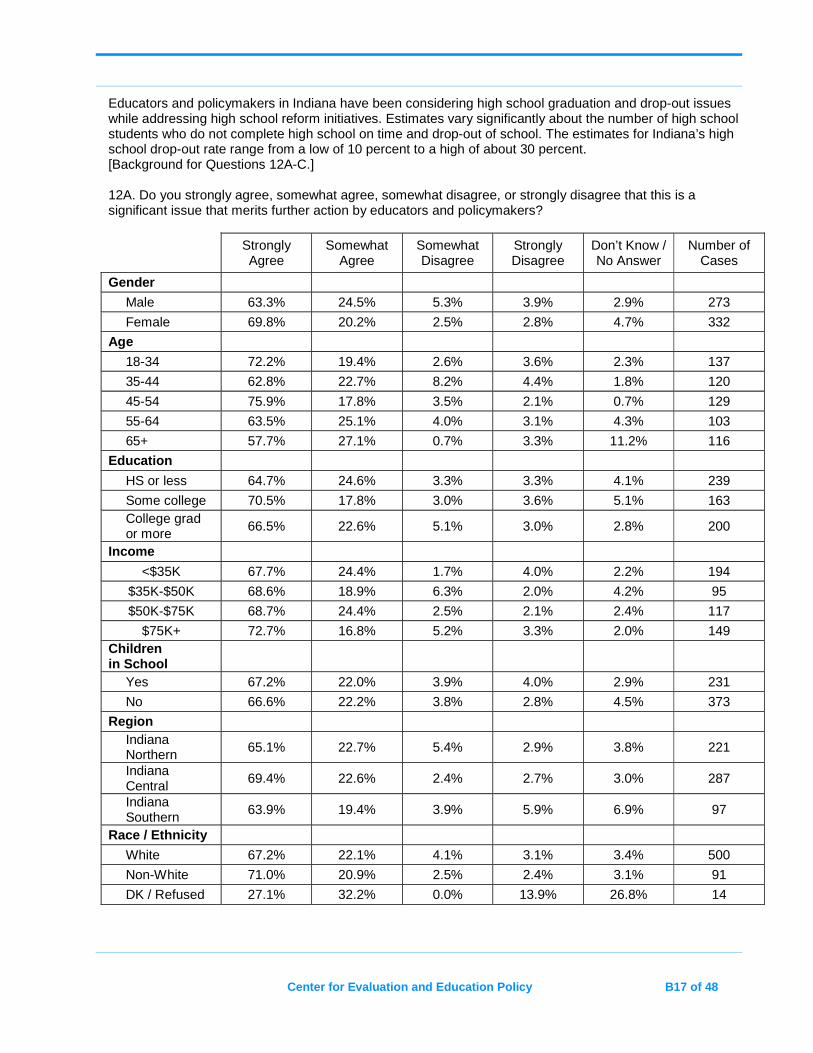
Center for Evaluation and Education Policy B17 of 48
Educators and policymakers in Indiana have been considering high school graduation and drop-out issues while addressing high school reform initiatives. Estimates vary significantly about the number of high school students who do not complete high school on time and drop-out of school. The estimates for Indiana’s high school drop-out rate range from a low of 10 percent to a high of about 30 percent. [Background for Questions 12A-C.] 12A. Do you strongly agree, somewhat agree, somewhat disagree, or strongly disagree that this is a significant issue that merits further action by educators and policymakers?
Strongly Agree
Somewhat Agree
Somewhat Disagree
Strongly Disagree
Don’t Know / No Answer
Number of Cases
Gender
Male 63.3% 24.5% 5.3% 3.9% 2.9% 273
Female 69.8% 20.2% 2.5% 2.8% 4.7% 332
Age
18-34 72.2% 19.4% 2.6% 3.6% 2.3% 137
35-44 62.8% 22.7% 8.2% 4.4% 1.8% 120
45-54 75.9% 17.8% 3.5% 2.1% 0.7% 129
55-64 63.5% 25.1% 4.0% 3.1% 4.3% 103
65+ 57.7% 27.1% 0.7% 3.3% 11.2% 116
Education
HS or less 64.7% 24.6% 3.3% 3.3% 4.1% 239
Some college 70.5% 17.8% 3.0% 3.6% 5.1% 163 College grad or more 66.5% 22.6% 5.1% 3.0% 2.8% 200
Income
<$35K 67.7% 24.4% 1.7% 4.0% 2.2% 194
$35K-$50K 68.6% 18.9% 6.3% 2.0% 4.2% 95
$50K-$75K 68.7% 24.4% 2.5% 2.1% 2.4% 117
$75K+ 72.7% 16.8% 5.2% 3.3% 2.0% 149 Children in School
Yes 67.2% 22.0% 3.9% 4.0% 2.9% 231
No 66.6% 22.2% 3.8% 2.8% 4.5% 373
Region Indiana Northern 65.1% 22.7% 5.4% 2.9% 3.8% 221
Indiana Central
69.4% 22.6% 2.4% 2.7% 3.0% 287
Indiana Southern
63.9% 19.4% 3.9% 5.9% 6.9% 97
Race / Ethnicity
White 67.2% 22.1% 4.1% 3.1% 3.4% 500
Non-White 71.0% 20.9% 2.5% 2.4% 3.1% 91
DK / Refused 27.1% 32.2% 0.0% 13.9% 26.8% 14
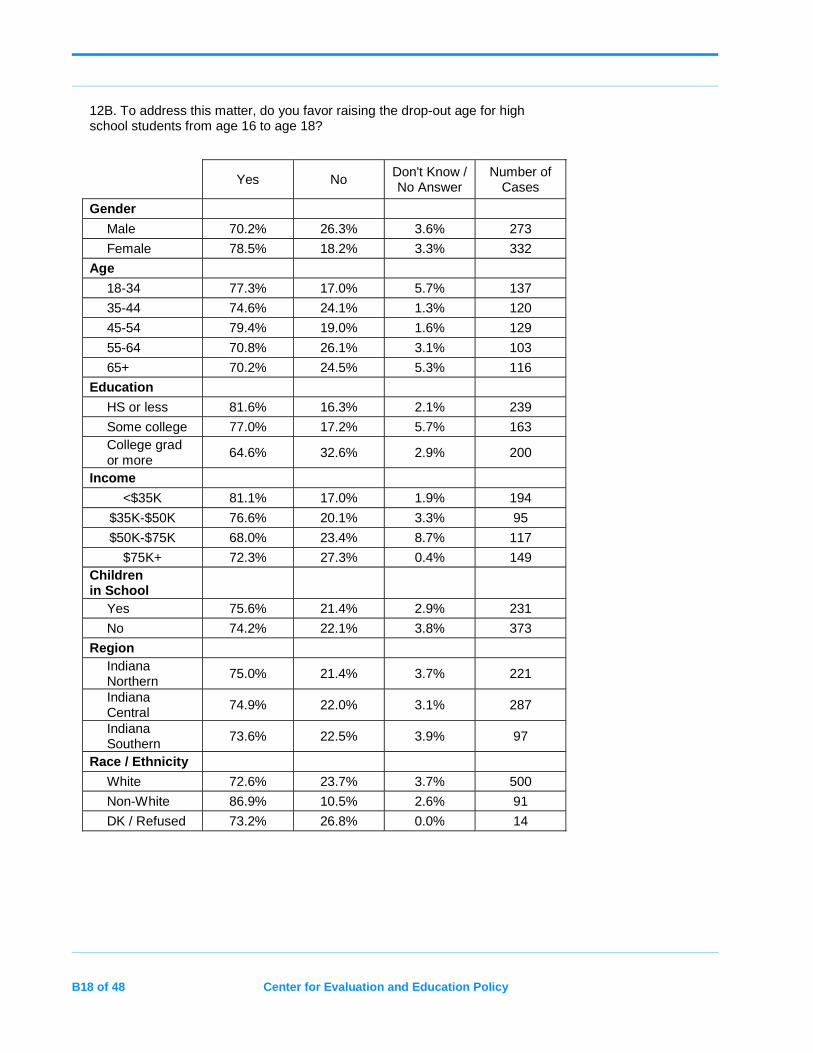
B18 of 48 Center for Evaluation and Education Policy
12B. To address this matter, do you favor raising the drop-out age for high school students from age 16 to age 18?
Yes No Don't Know / No Answer
Number of Cases
Gender
Male 70.2% 26.3% 3.6% 273
Female 78.5% 18.2% 3.3% 332
Age
18-34 77.3% 17.0% 5.7% 137
35-44 74.6% 24.1% 1.3% 120
45-54 79.4% 19.0% 1.6% 129
55-64 70.8% 26.1% 3.1% 103
65+ 70.2% 24.5% 5.3% 116
Education
HS or less 81.6% 16.3% 2.1% 239
Some college 77.0% 17.2% 5.7% 163 College grad or more
64.6% 32.6% 2.9% 200
Income
<$35K 81.1% 17.0% 1.9% 194
$35K-$50K 76.6% 20.1% 3.3% 95
$50K-$75K 68.0% 23.4% 8.7% 117
$75K+ 72.3% 27.3% 0.4% 149 Children in School
Yes 75.6% 21.4% 2.9% 231
No 74.2% 22.1% 3.8% 373
Region Indiana Northern
75.0% 21.4% 3.7% 221
Indiana Central
74.9% 22.0% 3.1% 287
Indiana Southern
73.6% 22.5% 3.9% 97
Race / Ethnicity
White 72.6% 23.7% 3.7% 500
Non-White 86.9% 10.5% 2.6% 91
DK / Refused 73.2% 26.8% 0.0% 14
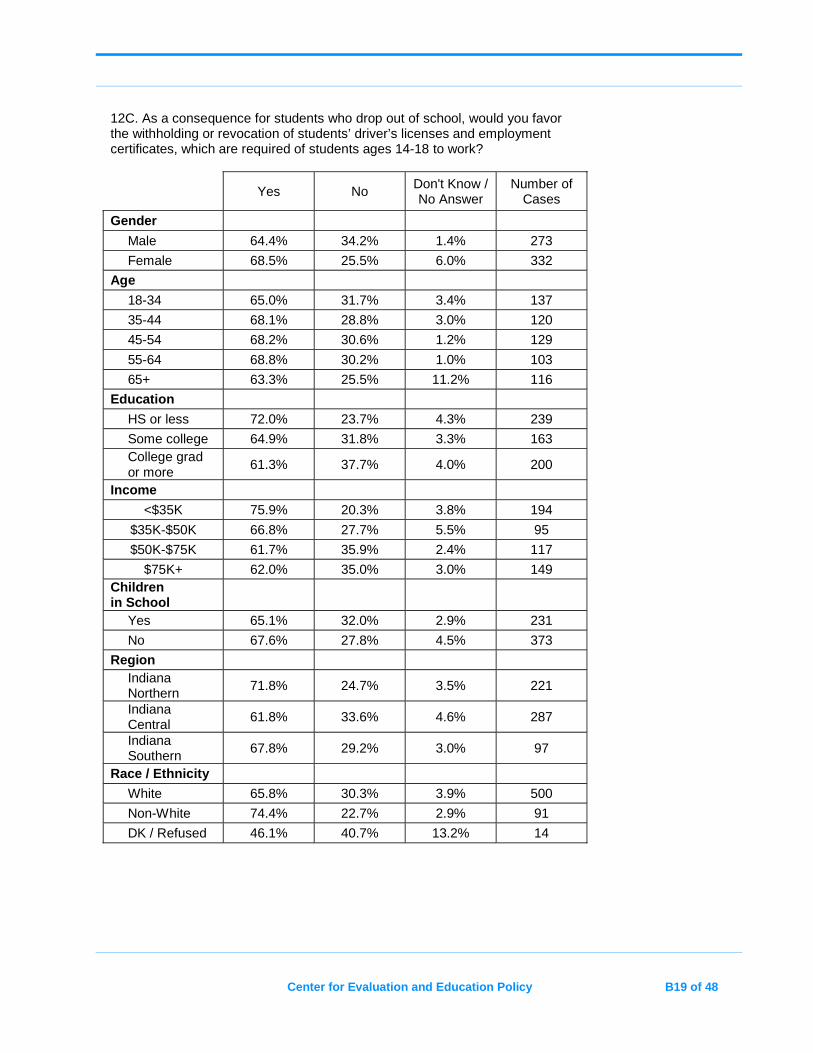
Center for Evaluation and Education Policy B19 of 48
12C. As a consequence for students who drop out of school, would you favor the withholding or revocation of students’ driver’s licenses and employment certificates, which are required of students ages 14-18 to work?
Yes No Don't Know / No Answer
Number of Cases
Gender
Male 64.4% 34.2% 1.4% 273
Female 68.5% 25.5% 6.0% 332
Age
18-34 65.0% 31.7% 3.4% 137
35-44 68.1% 28.8% 3.0% 120
45-54 68.2% 30.6% 1.2% 129
55-64 68.8% 30.2% 1.0% 103
65+ 63.3% 25.5% 11.2% 116
Education
HS or less 72.0% 23.7% 4.3% 239
Some college 64.9% 31.8% 3.3% 163 College grad or more
61.3% 37.7% 4.0% 200
Income
<$35K 75.9% 20.3% 3.8% 194
$35K-$50K 66.8% 27.7% 5.5% 95
$50K-$75K 61.7% 35.9% 2.4% 117
$75K+ 62.0% 35.0% 3.0% 149 Children in School
Yes 65.1% 32.0% 2.9% 231
No 67.6% 27.8% 4.5% 373
Region Indiana Northern
71.8% 24.7% 3.5% 221
Indiana Central
61.8% 33.6% 4.6% 287
Indiana Southern
67.8% 29.2% 3.0% 97
Race / Ethnicity
White 65.8% 30.3% 3.9% 500
Non-White 74.4% 22.7% 2.9% 91
DK / Refused 46.1% 40.7% 13.2% 14
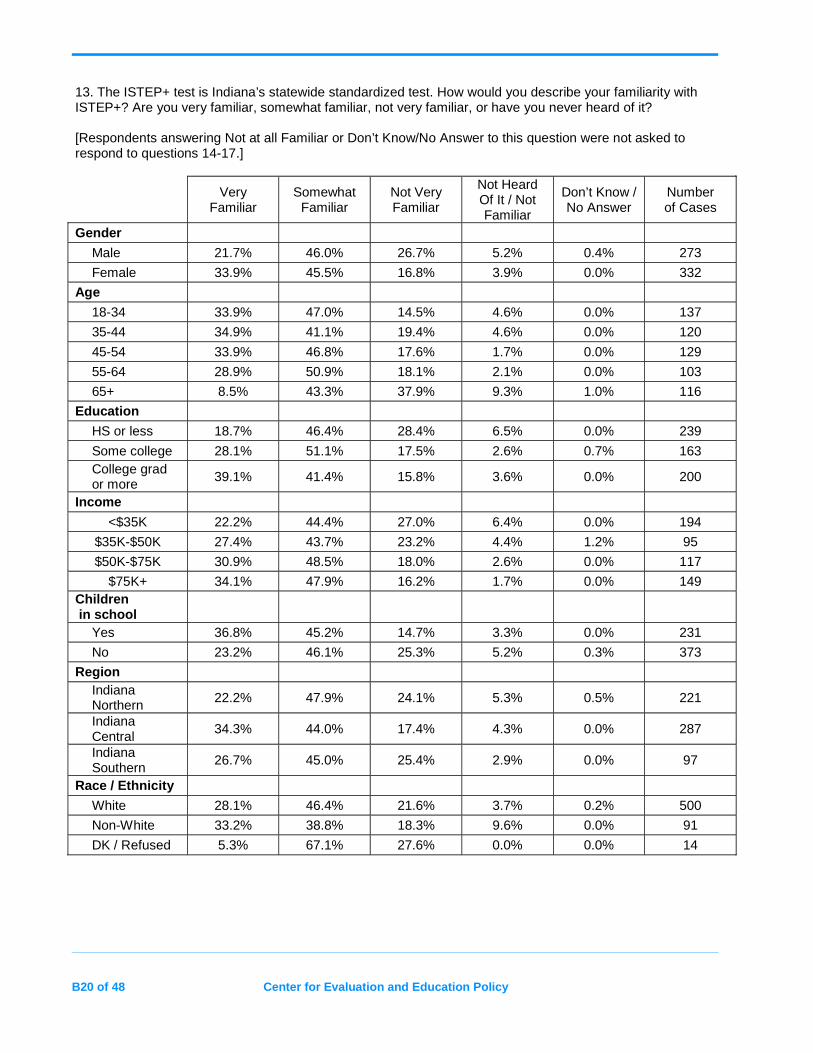
B20 of 48 Center for Evaluation and Education Policy
13. The ISTEP+ test is Indiana’s statewide standardized test. How would you describe your familiarity with ISTEP+? Are you very familiar, somewhat familiar, not very familiar, or have you never heard of it? [Respondents answering Not at all Familiar or Don’t Know/No Answer to this question were not asked to respond to questions 14-17.]
Very
Familiar Somewhat
Familiar Not Very Familiar
Not Heard Of It / Not Familiar
Don’t Know / No Answer
Number of Cases
Gender
Male 21.7% 46.0% 26.7% 5.2% 0.4% 273
Female 33.9% 45.5% 16.8% 3.9% 0.0% 332
Age
18-34 33.9% 47.0% 14.5% 4.6% 0.0% 137
35-44 34.9% 41.1% 19.4% 4.6% 0.0% 120
45-54 33.9% 46.8% 17.6% 1.7% 0.0% 129
55-64 28.9% 50.9% 18.1% 2.1% 0.0% 103
65+ 8.5% 43.3% 37.9% 9.3% 1.0% 116
Education
HS or less 18.7% 46.4% 28.4% 6.5% 0.0% 239
Some college 28.1% 51.1% 17.5% 2.6% 0.7% 163 College grad or more 39.1% 41.4% 15.8% 3.6% 0.0% 200
Income
<$35K 22.2% 44.4% 27.0% 6.4% 0.0% 194
$35K-$50K 27.4% 43.7% 23.2% 4.4% 1.2% 95
$50K-$75K 30.9% 48.5% 18.0% 2.6% 0.0% 117
$75K+ 34.1% 47.9% 16.2% 1.7% 0.0% 149 Children in school
Yes 36.8% 45.2% 14.7% 3.3% 0.0% 231
No 23.2% 46.1% 25.3% 5.2% 0.3% 373
Region Indiana Northern 22.2% 47.9% 24.1% 5.3% 0.5% 221
Indiana Central
34.3% 44.0% 17.4% 4.3% 0.0% 287
Indiana Southern
26.7% 45.0% 25.4% 2.9% 0.0% 97
Race / Ethnicity
White 28.1% 46.4% 21.6% 3.7% 0.2% 500
Non-White 33.2% 38.8% 18.3% 9.6% 0.0% 91
DK / Refused 5.3% 67.1% 27.6% 0.0% 0.0% 14
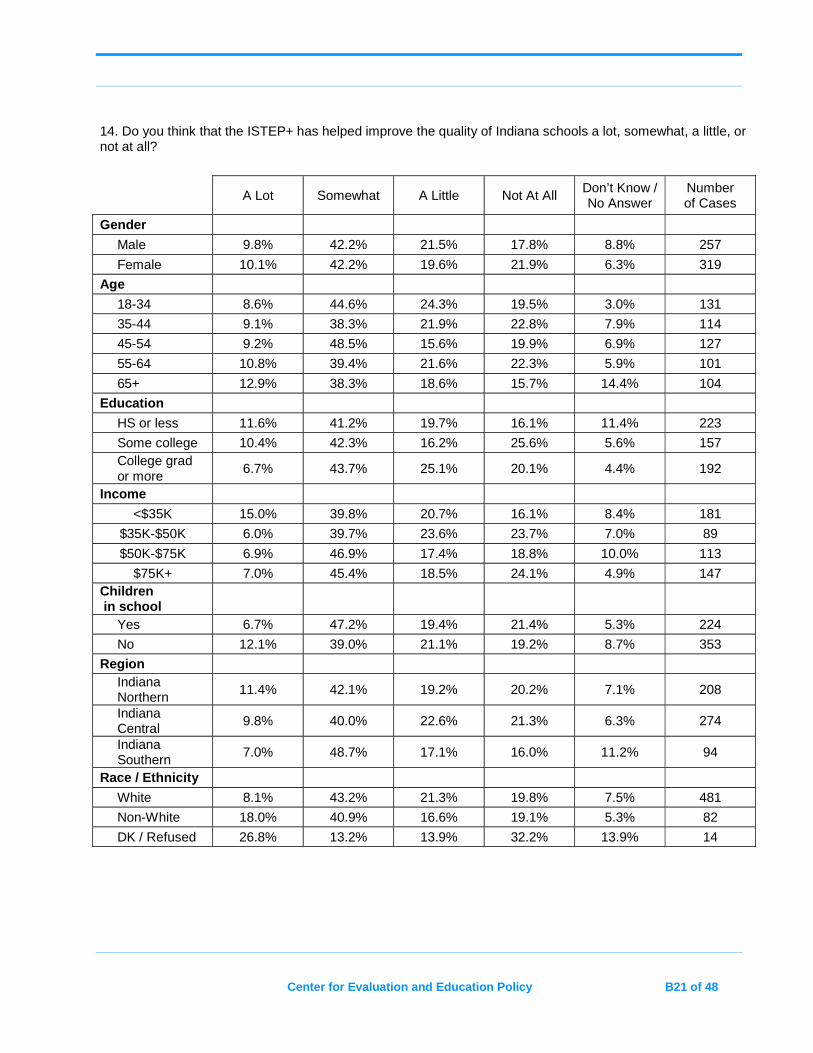
Center for Evaluation and Education Policy B21 of 48
14. Do you think that the ISTEP+ has helped improve the quality of Indiana schools a lot, somewhat, a little, or not at all?
A Lot Somewhat A Little Not At All Don’t Know / No Answer
Number of Cases
Gender
Male 9.8% 42.2% 21.5% 17.8% 8.8% 257
Female 10.1% 42.2% 19.6% 21.9% 6.3% 319
Age
18-34 8.6% 44.6% 24.3% 19.5% 3.0% 131
35-44 9.1% 38.3% 21.9% 22.8% 7.9% 114
45-54 9.2% 48.5% 15.6% 19.9% 6.9% 127
55-64 10.8% 39.4% 21.6% 22.3% 5.9% 101
65+ 12.9% 38.3% 18.6% 15.7% 14.4% 104
Education
HS or less 11.6% 41.2% 19.7% 16.1% 11.4% 223
Some college 10.4% 42.3% 16.2% 25.6% 5.6% 157 College grad or more
6.7% 43.7% 25.1% 20.1% 4.4% 192
Income
<$35K 15.0% 39.8% 20.7% 16.1% 8.4% 181
$35K-$50K 6.0% 39.7% 23.6% 23.7% 7.0% 89
$50K-$75K 6.9% 46.9% 17.4% 18.8% 10.0% 113
$75K+ 7.0% 45.4% 18.5% 24.1% 4.9% 147 Children in school
Yes 6.7% 47.2% 19.4% 21.4% 5.3% 224
No 12.1% 39.0% 21.1% 19.2% 8.7% 353
Region Indiana Northern
11.4% 42.1% 19.2% 20.2% 7.1% 208
Indiana Central
9.8% 40.0% 22.6% 21.3% 6.3% 274
Indiana Southern
7.0% 48.7% 17.1% 16.0% 11.2% 94
Race / Ethnicity
White 8.1% 43.2% 21.3% 19.8% 7.5% 481
Non-White 18.0% 40.9% 16.6% 19.1% 5.3% 82
DK / Refused 26.8% 13.2% 13.9% 32.2% 13.9% 14
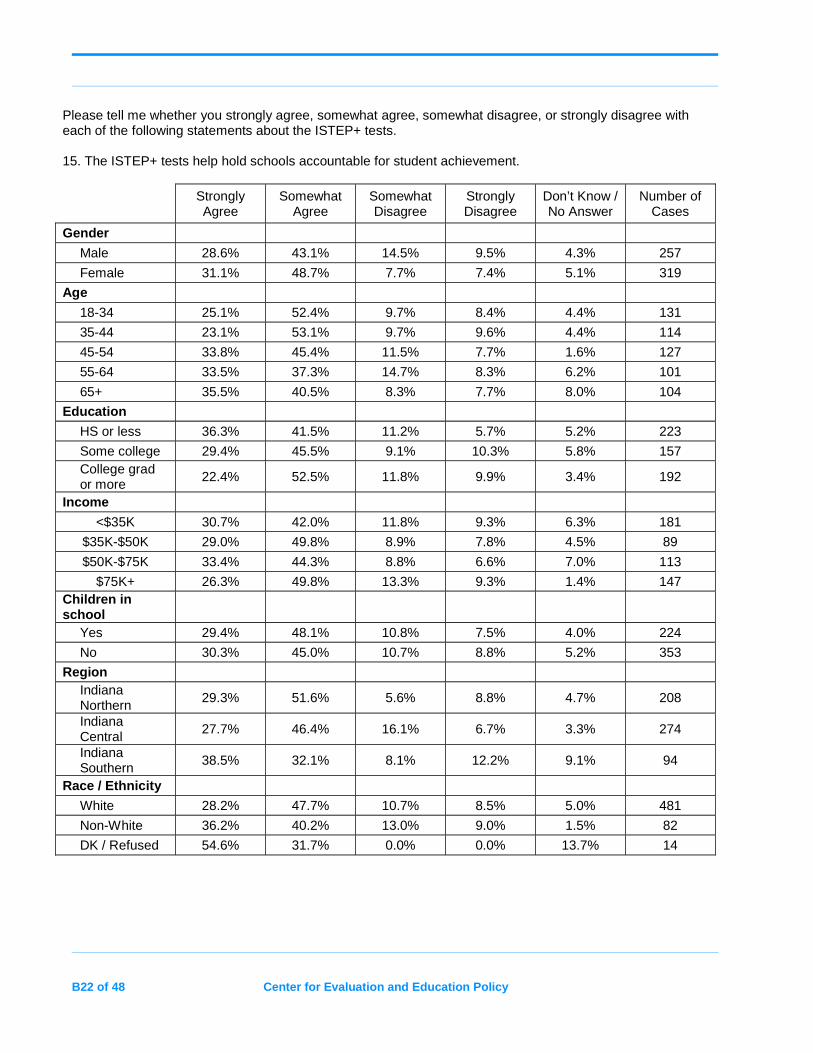
B22 of 48 Center for Evaluation and Education Policy
Please tell me whether you strongly agree, somewhat agree, somewhat disagree, or strongly disagree with each of the following statements about the ISTEP+ tests. 15. The ISTEP+ tests help hold schools accountable for student achievement.
Strongly Agree
Somewhat Agree
Somewhat Disagree
Strongly Disagree
Don’t Know / No Answer
Number of Cases
Gender
Male 28.6% 43.1% 14.5% 9.5% 4.3% 257
Female 31.1% 48.7% 7.7% 7.4% 5.1% 319
Age
18-34 25.1% 52.4% 9.7% 8.4% 4.4% 131
35-44 23.1% 53.1% 9.7% 9.6% 4.4% 114
45-54 33.8% 45.4% 11.5% 7.7% 1.6% 127
55-64 33.5% 37.3% 14.7% 8.3% 6.2% 101
65+ 35.5% 40.5% 8.3% 7.7% 8.0% 104
Education
HS or less 36.3% 41.5% 11.2% 5.7% 5.2% 223
Some college 29.4% 45.5% 9.1% 10.3% 5.8% 157 College grad or more
22.4% 52.5% 11.8% 9.9% 3.4% 192
Income
<$35K 30.7% 42.0% 11.8% 9.3% 6.3% 181
$35K-$50K 29.0% 49.8% 8.9% 7.8% 4.5% 89
$50K-$75K 33.4% 44.3% 8.8% 6.6% 7.0% 113
$75K+ 26.3% 49.8% 13.3% 9.3% 1.4% 147 Children in school
Yes 29.4% 48.1% 10.8% 7.5% 4.0% 224
No 30.3% 45.0% 10.7% 8.8% 5.2% 353
Region Indiana Northern
29.3% 51.6% 5.6% 8.8% 4.7% 208
Indiana Central
27.7% 46.4% 16.1% 6.7% 3.3% 274
Indiana Southern
38.5% 32.1% 8.1% 12.2% 9.1% 94
Race / Ethnicity
White 28.2% 47.7% 10.7% 8.5% 5.0% 481
Non-White 36.2% 40.2% 13.0% 9.0% 1.5% 82
DK / Refused 54.6% 31.7% 0.0% 0.0% 13.7% 14
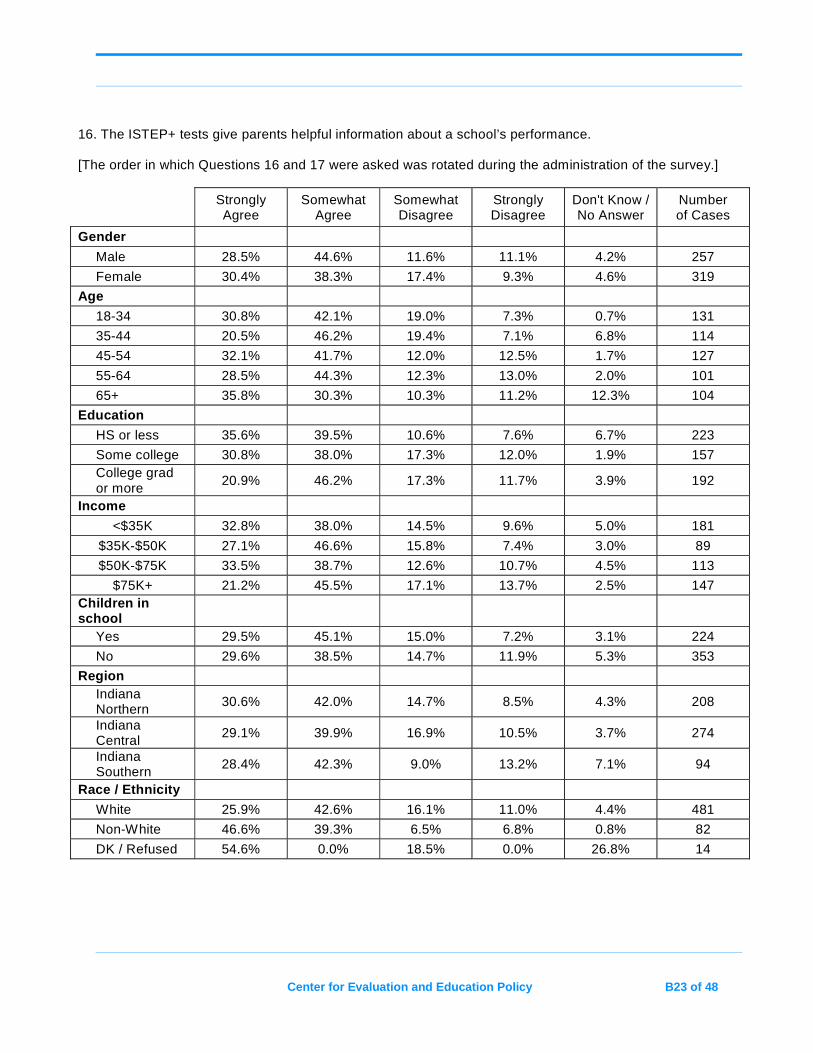
Center for Evaluation and Education Policy B23 of 48
16. The ISTEP+ tests give parents helpful information about a school’s performance. [The order in which Questions 16 and 17 were asked was rotated during the administration of the survey.]
Strongly Agree
Somewhat Agree
Somewhat Disagree
Strongly Disagree
Don't Know / No Answer
Number of Cases
Gender
Male 28.5% 44.6% 11.6% 11.1% 4.2% 257
Female 30.4% 38.3% 17.4% 9.3% 4.6% 319
Age
18-34 30.8% 42.1% 19.0% 7.3% 0.7% 131
35-44 20.5% 46.2% 19.4% 7.1% 6.8% 114
45-54 32.1% 41.7% 12.0% 12.5% 1.7% 127
55-64 28.5% 44.3% 12.3% 13.0% 2.0% 101
65+ 35.8% 30.3% 10.3% 11.2% 12.3% 104
Education
HS or less 35.6% 39.5% 10.6% 7.6% 6.7% 223
Some college 30.8% 38.0% 17.3% 12.0% 1.9% 157 College grad or more
20.9% 46.2% 17.3% 11.7% 3.9% 192
Income
<$35K 32.8% 38.0% 14.5% 9.6% 5.0% 181
$35K-$50K 27.1% 46.6% 15.8% 7.4% 3.0% 89
$50K-$75K 33.5% 38.7% 12.6% 10.7% 4.5% 113
$75K+ 21.2% 45.5% 17.1% 13.7% 2.5% 147 Children in school
Yes 29.5% 45.1% 15.0% 7.2% 3.1% 224
No 29.6% 38.5% 14.7% 11.9% 5.3% 353
Region Indiana Northern
30.6% 42.0% 14.7% 8.5% 4.3% 208
Indiana Central
29.1% 39.9% 16.9% 10.5% 3.7% 274
Indiana Southern
28.4% 42.3% 9.0% 13.2% 7.1% 94
Race / Ethnicity
White 25.9% 42.6% 16.1% 11.0% 4.4% 481
Non-White 46.6% 39.3% 6.5% 6.8% 0.8% 82
DK / Refused 54.6% 0.0% 18.5% 0.0% 26.8% 14
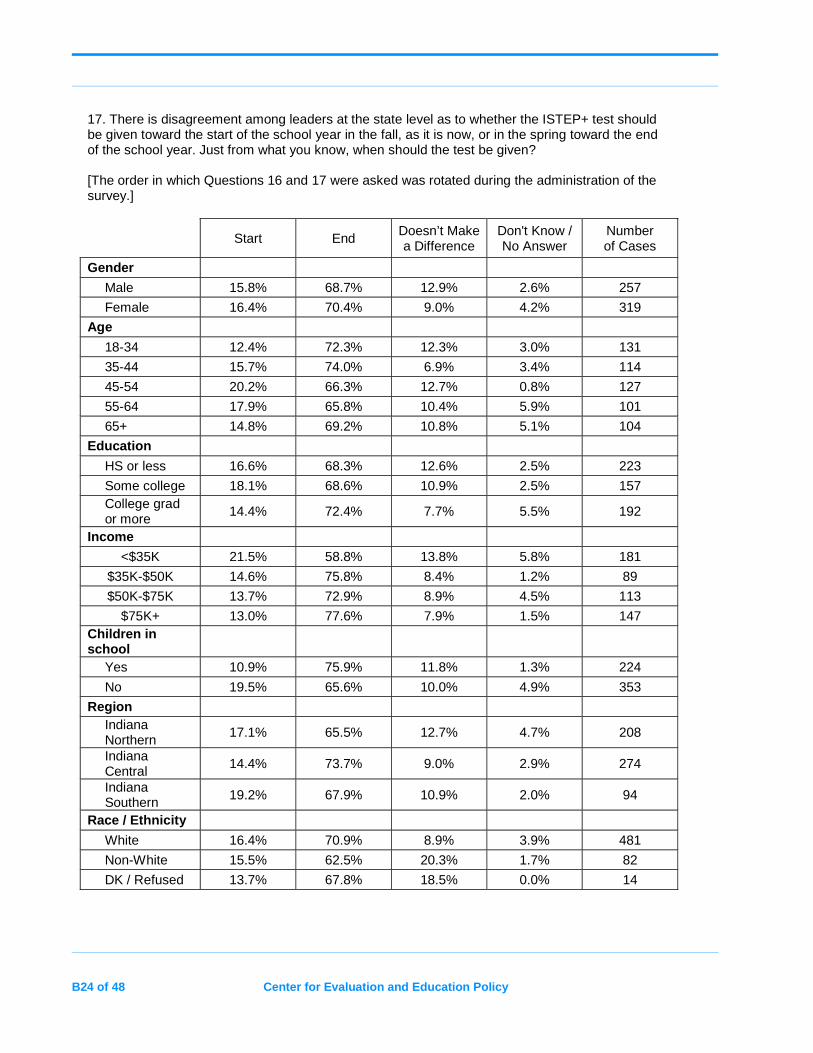
B24 of 48 Center for Evaluation and Education Policy
17. There is disagreement among leaders at the state level as to whether the ISTEP+ test should be given toward the start of the school year in the fall, as it is now, or in the spring toward the end of the school year. Just from what you know, when should the test be given? [The order in which Questions 16 and 17 were asked was rotated during the administration of the survey.]
Start End Doesn’t Make a Difference
Don't Know / No Answer
Number of Cases
Gender
Male 15.8% 68.7% 12.9% 2.6% 257
Female 16.4% 70.4% 9.0% 4.2% 319
Age
18-34 12.4% 72.3% 12.3% 3.0% 131
35-44 15.7% 74.0% 6.9% 3.4% 114
45-54 20.2% 66.3% 12.7% 0.8% 127
55-64 17.9% 65.8% 10.4% 5.9% 101
65+ 14.8% 69.2% 10.8% 5.1% 104
Education
HS or less 16.6% 68.3% 12.6% 2.5% 223
Some college 18.1% 68.6% 10.9% 2.5% 157 College grad or more
14.4% 72.4% 7.7% 5.5% 192
Income
<$35K 21.5% 58.8% 13.8% 5.8% 181
$35K-$50K 14.6% 75.8% 8.4% 1.2% 89
$50K-$75K 13.7% 72.9% 8.9% 4.5% 113
$75K+ 13.0% 77.6% 7.9% 1.5% 147 Children in school
Yes 10.9% 75.9% 11.8% 1.3% 224
No 19.5% 65.6% 10.0% 4.9% 353
Region Indiana Northern
17.1% 65.5% 12.7% 4.7% 208
Indiana Central
14.4% 73.7% 9.0% 2.9% 274
Indiana Southern 19.2% 67.9% 10.9% 2.0% 94
Race / Ethnicity
White 16.4% 70.9% 8.9% 3.9% 481
Non-White 15.5% 62.5% 20.3% 1.7% 82
DK / Refused 13.7% 67.8% 18.5% 0.0% 14
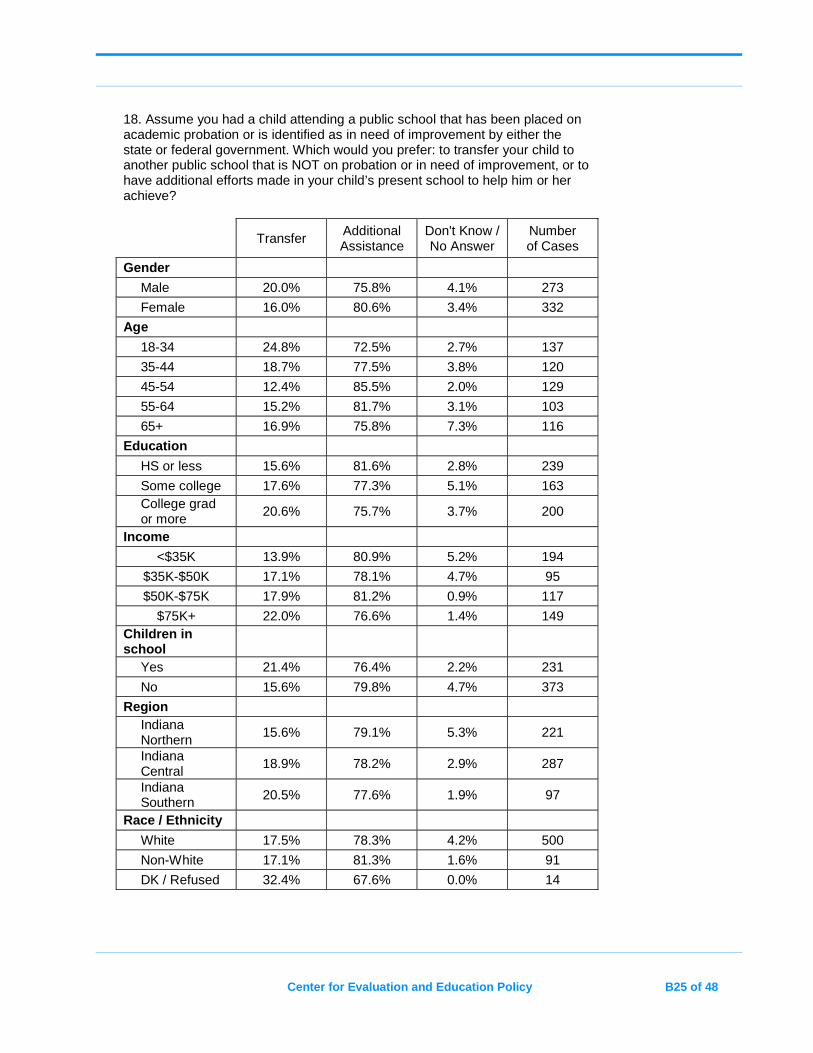
Center for Evaluation and Education Policy B25 of 48
18. Assume you had a child attending a public school that has been placed on academic probation or is identified as in need of improvement by either the state or federal government. Which would you prefer: to transfer your child to another public school that is NOT on probation or in need of improvement, or to have additional efforts made in your child’s present school to help him or her achieve?
Transfer Additional Assistance
Don't Know / No Answer
Number of Cases
Gender
Male 20.0% 75.8% 4.1% 273
Female 16.0% 80.6% 3.4% 332
Age
18-34 24.8% 72.5% 2.7% 137
35-44 18.7% 77.5% 3.8% 120
45-54 12.4% 85.5% 2.0% 129
55-64 15.2% 81.7% 3.1% 103
65+ 16.9% 75.8% 7.3% 116
Education
HS or less 15.6% 81.6% 2.8% 239
Some college 17.6% 77.3% 5.1% 163 College grad or more
20.6% 75.7% 3.7% 200
Income
<$35K 13.9% 80.9% 5.2% 194
$35K-$50K 17.1% 78.1% 4.7% 95
$50K-$75K 17.9% 81.2% 0.9% 117
$75K+ 22.0% 76.6% 1.4% 149 Children in school
Yes 21.4% 76.4% 2.2% 231
No 15.6% 79.8% 4.7% 373
Region Indiana Northern
15.6% 79.1% 5.3% 221
Indiana Central
18.9% 78.2% 2.9% 287
Indiana Southern 20.5% 77.6% 1.9% 97
Race / Ethnicity
White 17.5% 78.3% 4.2% 500
Non-White 17.1% 81.3% 1.6% 91
DK / Refused 32.4% 67.6% 0.0% 14
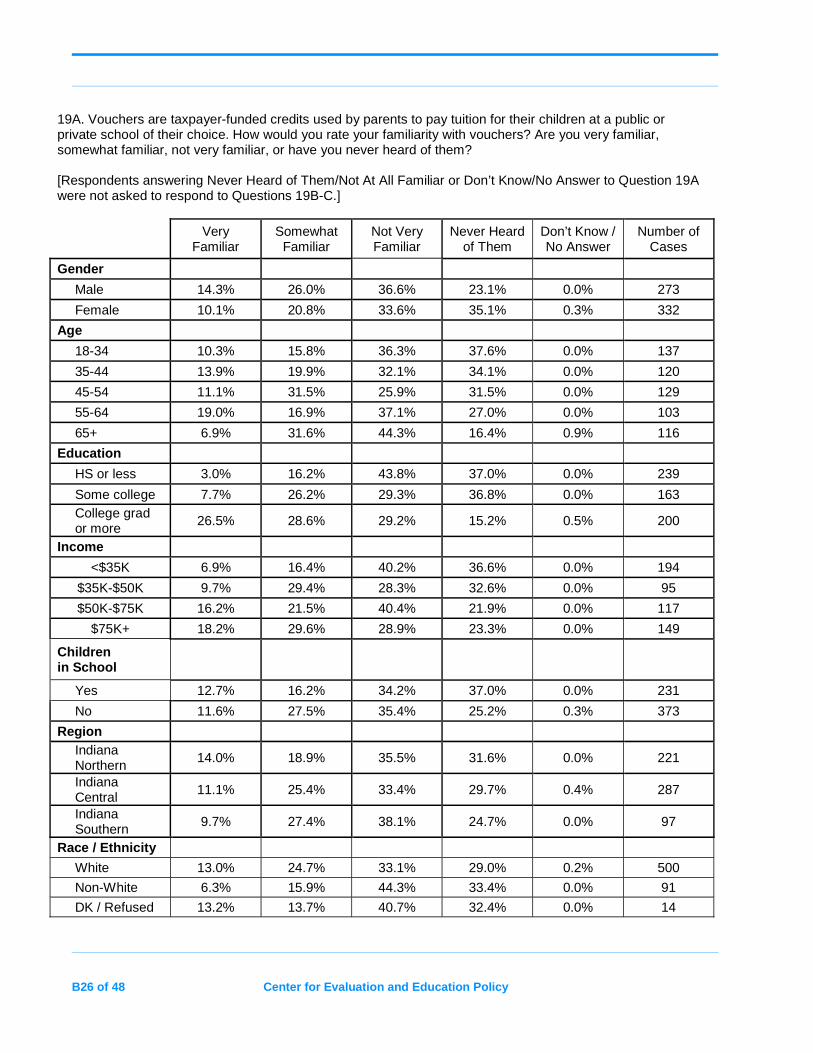
B26 of 48 Center for Evaluation and Education Policy
19A. Vouchers are taxpayer-funded credits used by parents to pay tuition for their children at a public or private school of their choice. How would you rate your familiarity with vouchers? Are you very familiar, somewhat familiar, not very familiar, or have you never heard of them? [Respondents answering Never Heard of Them/Not At All Familiar or Don’t Know/No Answer to Question 19A were not asked to respond to Questions 19B-C.]
Very
Familiar Somewhat
Familiar Not Very Familiar
Never Heard of Them
Don’t Know / No Answer
Number of Cases
Gender
Male 14.3% 26.0% 36.6% 23.1% 0.0% 273
Female 10.1% 20.8% 33.6% 35.1% 0.3% 332
Age
18-34 10.3% 15.8% 36.3% 37.6% 0.0% 137
35-44 13.9% 19.9% 32.1% 34.1% 0.0% 120
45-54 11.1% 31.5% 25.9% 31.5% 0.0% 129
55-64 19.0% 16.9% 37.1% 27.0% 0.0% 103
65+ 6.9% 31.6% 44.3% 16.4% 0.9% 116
Education
HS or less 3.0% 16.2% 43.8% 37.0% 0.0% 239
Some college 7.7% 26.2% 29.3% 36.8% 0.0% 163 College grad or more
26.5% 28.6% 29.2% 15.2% 0.5% 200
Income
<$35K 6.9% 16.4% 40.2% 36.6% 0.0% 194
$35K-$50K 9.7% 29.4% 28.3% 32.6% 0.0% 95
$50K-$75K 16.2% 21.5% 40.4% 21.9% 0.0% 117
$75K+ 18.2% 29.6% 28.9% 23.3% 0.0% 149
Children in School
Yes 12.7% 16.2% 34.2% 37.0% 0.0% 231
No 11.6% 27.5% 35.4% 25.2% 0.3% 373
Region Indiana Northern
14.0% 18.9% 35.5% 31.6% 0.0% 221
Indiana Central
11.1% 25.4% 33.4% 29.7% 0.4% 287
Indiana Southern
9.7% 27.4% 38.1% 24.7% 0.0% 97
Race / Ethnicity
White 13.0% 24.7% 33.1% 29.0% 0.2% 500
Non-White 6.3% 15.9% 44.3% 33.4% 0.0% 91
DK / Refused 13.2% 13.7% 40.7% 32.4% 0.0% 14
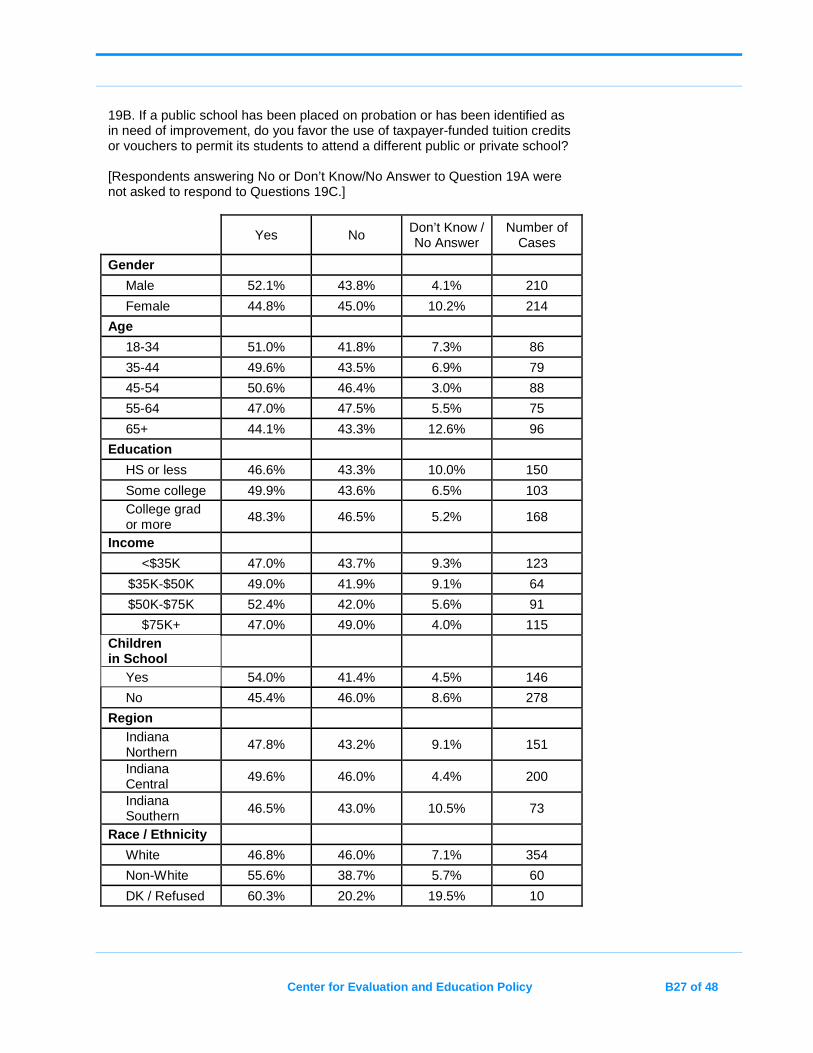
Center for Evaluation and Education Policy B27 of 48
19B. If a public school has been placed on probation or has been identified as in need of improvement, do you favor the use of taxpayer-funded tuition credits or vouchers to permit its students to attend a different public or private school? [Respondents answering No or Don’t Know/No Answer to Question 19A were not asked to respond to Questions 19C.]
Yes No Don’t Know / No Answer
Number of Cases
Gender
Male 52.1% 43.8% 4.1% 210
Female 44.8% 45.0% 10.2% 214
Age
18-34 51.0% 41.8% 7.3% 86
35-44 49.6% 43.5% 6.9% 79
45-54 50.6% 46.4% 3.0% 88
55-64 47.0% 47.5% 5.5% 75
65+ 44.1% 43.3% 12.6% 96
Education
HS or less 46.6% 43.3% 10.0% 150
Some college 49.9% 43.6% 6.5% 103 College grad or more
48.3% 46.5% 5.2% 168
Income
<$35K 47.0% 43.7% 9.3% 123
$35K-$50K 49.0% 41.9% 9.1% 64
$50K-$75K 52.4% 42.0% 5.6% 91
$75K+ 47.0% 49.0% 4.0% 115 Children in School
Yes 54.0% 41.4% 4.5% 146
No 45.4% 46.0% 8.6% 278
Region Indiana Northern
47.8% 43.2% 9.1% 151
Indiana Central
49.6% 46.0% 4.4% 200
Indiana Southern
46.5% 43.0% 10.5% 73
Race / Ethnicity
White 46.8% 46.0% 7.1% 354
Non-White 55.6% 38.7% 5.7% 60
DK / Refused 60.3% 20.2% 19.5% 10
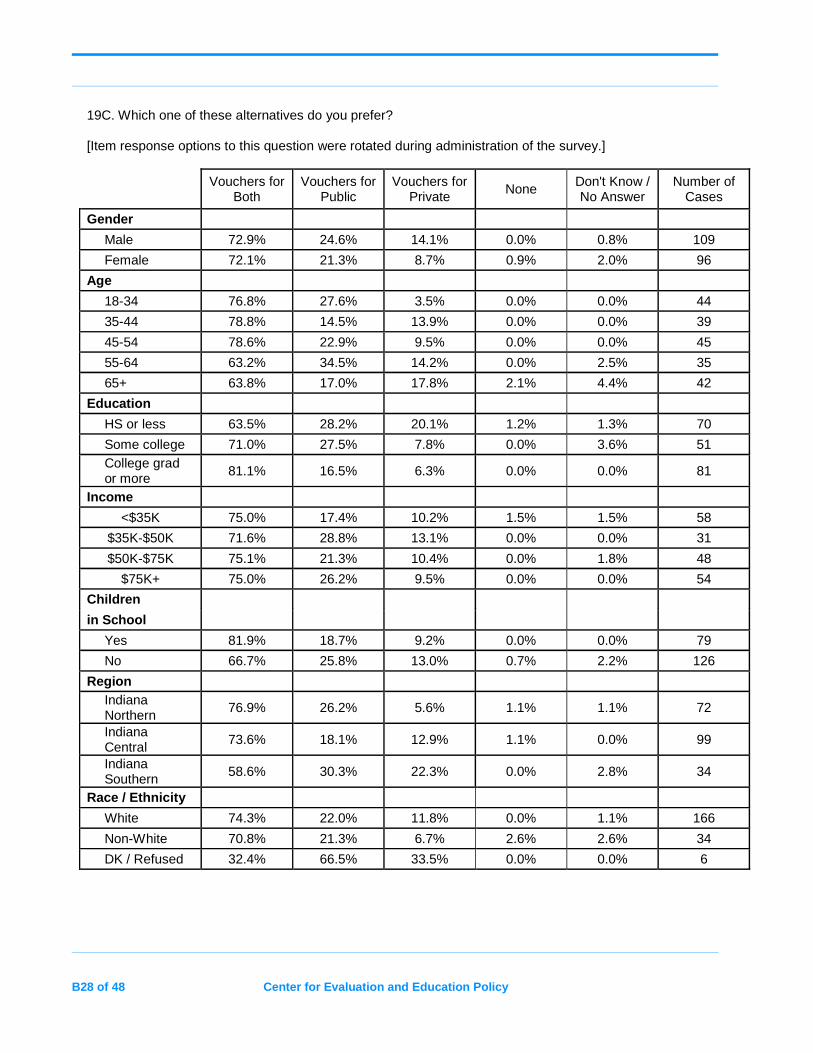
B28 of 48 Center for Evaluation and Education Policy
19C. Which one of these alternatives do you prefer? [Item response options to this question were rotated during administration of the survey.]
Vouchers for
Both Vouchers for
Public Vouchers for
Private None
Don't Know / No Answer
Number of Cases
Gender
Male 72.9% 24.6% 14.1% 0.0% 0.8% 109
Female 72.1% 21.3% 8.7% 0.9% 2.0% 96
Age
18-34 76.8% 27.6% 3.5% 0.0% 0.0% 44
35-44 78.8% 14.5% 13.9% 0.0% 0.0% 39
45-54 78.6% 22.9% 9.5% 0.0% 0.0% 45
55-64 63.2% 34.5% 14.2% 0.0% 2.5% 35
65+ 63.8% 17.0% 17.8% 2.1% 4.4% 42
Education
HS or less 63.5% 28.2% 20.1% 1.2% 1.3% 70
Some college 71.0% 27.5% 7.8% 0.0% 3.6% 51 College grad or more 81.1% 16.5% 6.3% 0.0% 0.0% 81
Income
<$35K 75.0% 17.4% 10.2% 1.5% 1.5% 58
$35K-$50K 71.6% 28.8% 13.1% 0.0% 0.0% 31
$50K-$75K 75.1% 21.3% 10.4% 0.0% 1.8% 48
$75K+ 75.0% 26.2% 9.5% 0.0% 0.0% 54
Children
in School
Yes 81.9% 18.7% 9.2% 0.0% 0.0% 79
No 66.7% 25.8% 13.0% 0.7% 2.2% 126
Region Indiana Northern
76.9% 26.2% 5.6% 1.1% 1.1% 72
Indiana Central
73.6% 18.1% 12.9% 1.1% 0.0% 99
Indiana Southern
58.6% 30.3% 22.3% 0.0% 2.8% 34
Race / Ethnicity
White 74.3% 22.0% 11.8% 0.0% 1.1% 166
Non-White 70.8% 21.3% 6.7% 2.6% 2.6% 34
DK / Refused 32.4% 66.5% 33.5% 0.0% 0.0% 6
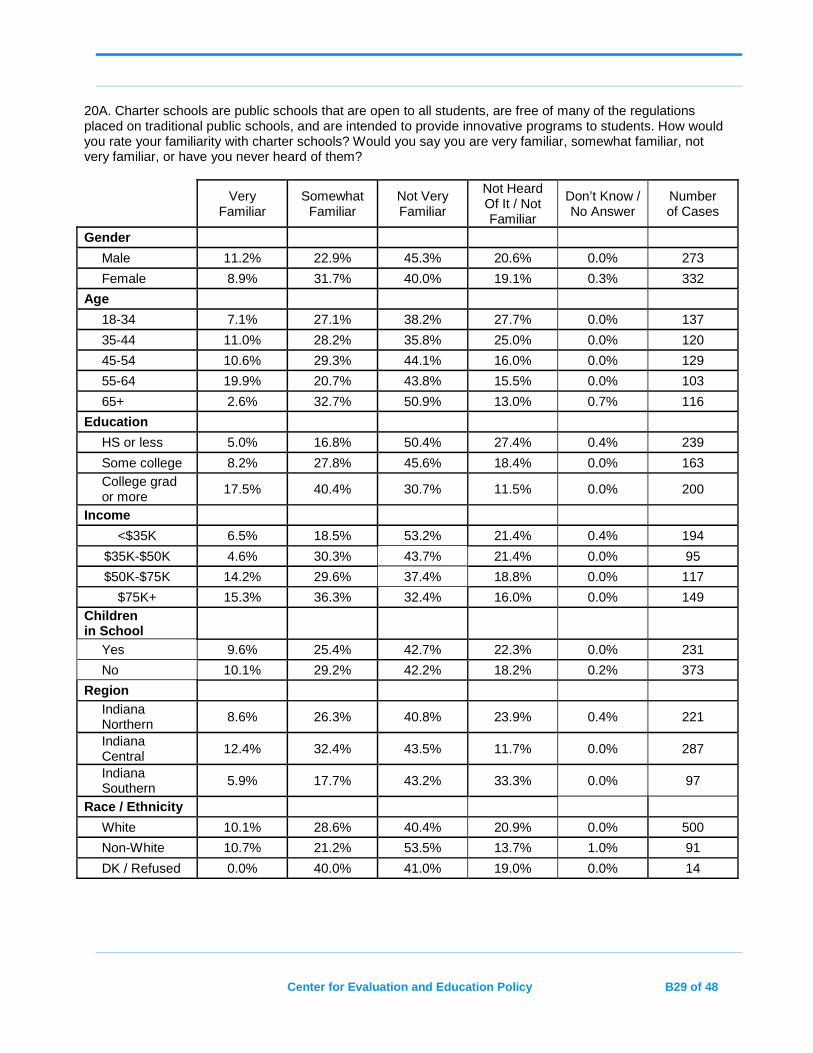
Center for Evaluation and Education Policy B29 of 48
20A. Charter schools are public schools that are open to all students, are free of many of the regulations placed on traditional public schools, and are intended to provide innovative programs to students. How would you rate your familiarity with charter schools? Would you say you are very familiar, somewhat familiar, not very familiar, or have you never heard of them?
Very
Familiar Somewhat
Familiar Not Very Familiar
Not Heard Of It / Not Familiar
Don’t Know / No Answer
Number of Cases
Gender
Male 11.2% 22.9% 45.3% 20.6% 0.0% 273
Female 8.9% 31.7% 40.0% 19.1% 0.3% 332
Age
18-34 7.1% 27.1% 38.2% 27.7% 0.0% 137
35-44 11.0% 28.2% 35.8% 25.0% 0.0% 120
45-54 10.6% 29.3% 44.1% 16.0% 0.0% 129
55-64 19.9% 20.7% 43.8% 15.5% 0.0% 103
65+ 2.6% 32.7% 50.9% 13.0% 0.7% 116
Education
HS or less 5.0% 16.8% 50.4% 27.4% 0.4% 239
Some college 8.2% 27.8% 45.6% 18.4% 0.0% 163 College grad or more
17.5% 40.4% 30.7% 11.5% 0.0% 200
Income
<$35K 6.5% 18.5% 53.2% 21.4% 0.4% 194
$35K-$50K 4.6% 30.3% 43.7% 21.4% 0.0% 95
$50K-$75K 14.2% 29.6% 37.4% 18.8% 0.0% 117
$75K+ 15.3% 36.3% 32.4% 16.0% 0.0% 149 Children in School
Yes 9.6% 25.4% 42.7% 22.3% 0.0% 231
No 10.1% 29.2% 42.2% 18.2% 0.2% 373
Region Indiana Northern 8.6% 26.3% 40.8% 23.9% 0.4% 221
Indiana Central 12.4% 32.4% 43.5% 11.7% 0.0% 287
Indiana Southern 5.9% 17.7% 43.2% 33.3% 0.0% 97
Race / Ethnicity
White 10.1% 28.6% 40.4% 20.9% 0.0% 500
Non-White 10.7% 21.2% 53.5% 13.7% 1.0% 91
DK / Refused 0.0% 40.0% 41.0% 19.0% 0.0% 14
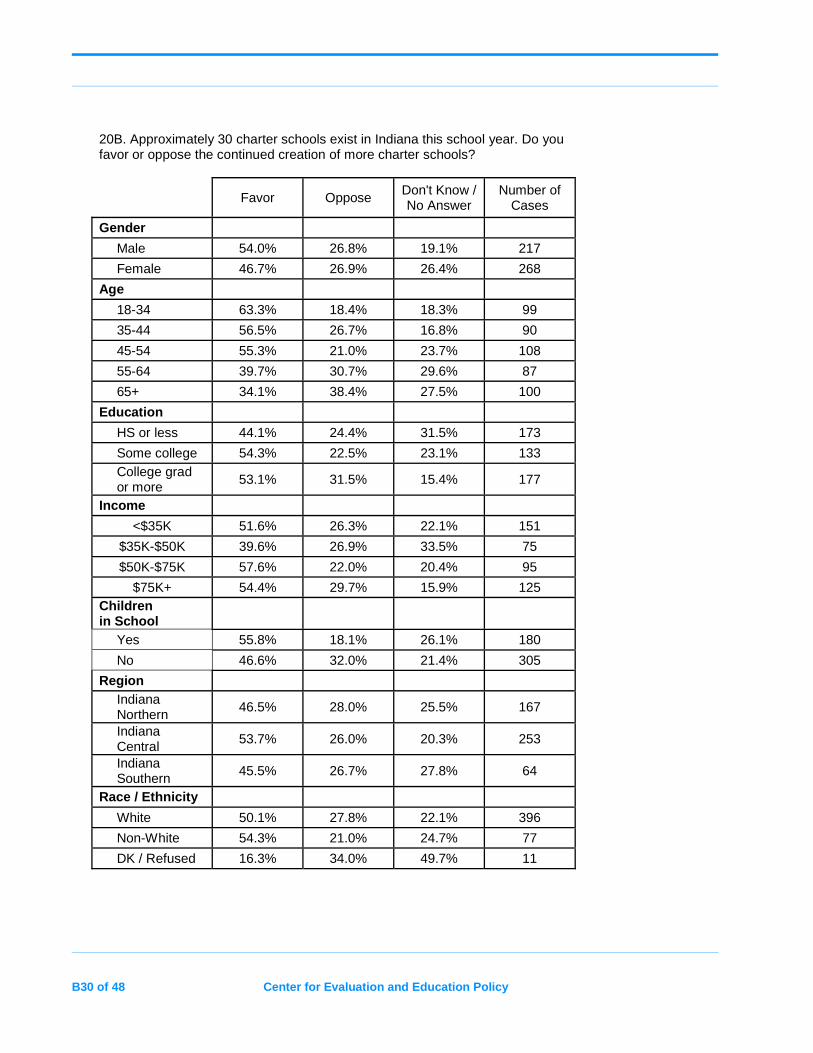
B30 of 48 Center for Evaluation and Education Policy
20B. Approximately 30 charter schools exist in Indiana this school year. Do you favor or oppose the continued creation of more charter schools?
Favor Oppose Don't Know / No Answer
Number of Cases
Gender
Male 54.0% 26.8% 19.1% 217
Female 46.7% 26.9% 26.4% 268
Age
18-34 63.3% 18.4% 18.3% 99
35-44 56.5% 26.7% 16.8% 90
45-54 55.3% 21.0% 23.7% 108
55-64 39.7% 30.7% 29.6% 87
65+ 34.1% 38.4% 27.5% 100
Education
HS or less 44.1% 24.4% 31.5% 173
Some college 54.3% 22.5% 23.1% 133 College grad or more
53.1% 31.5% 15.4% 177
Income
<$35K 51.6% 26.3% 22.1% 151
$35K-$50K 39.6% 26.9% 33.5% 75
$50K-$75K 57.6% 22.0% 20.4% 95
$75K+ 54.4% 29.7% 15.9% 125 Children in School
Yes 55.8% 18.1% 26.1% 180
No 46.6% 32.0% 21.4% 305
Region Indiana Northern
46.5% 28.0% 25.5% 167
Indiana Central
53.7% 26.0% 20.3% 253
Indiana Southern
45.5% 26.7% 27.8% 64
Race / Ethnicity
White 50.1% 27.8% 22.1% 396
Non-White 54.3% 21.0% 24.7% 77
DK / Refused 16.3% 34.0% 49.7% 11
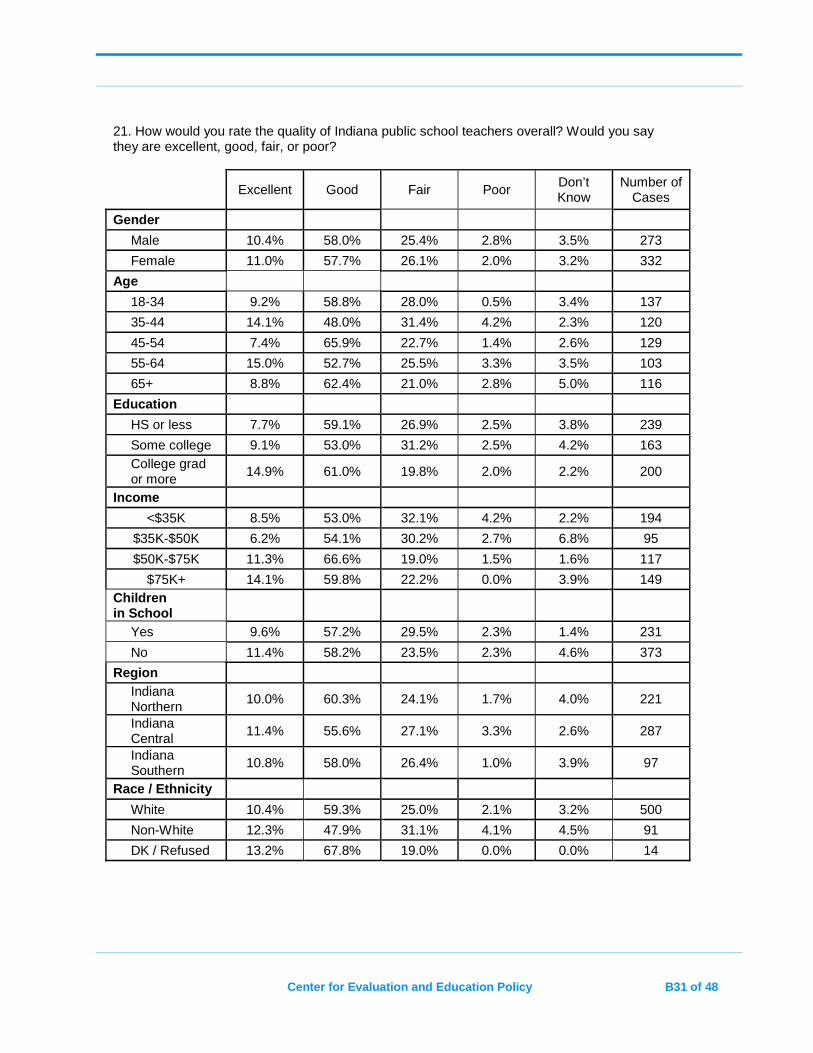
Center for Evaluation and Education Policy B31 of 48
21. How would you rate the quality of Indiana public school teachers overall? Would you say they are excellent, good, fair, or poor?
Excellent Good Fair Poor Don’t Know
Number of Cases
Gender
Male 10.4% 58.0% 25.4% 2.8% 3.5% 273
Female 11.0% 57.7% 26.1% 2.0% 3.2% 332
Age
18-34 9.2% 58.8% 28.0% 0.5% 3.4% 137
35-44 14.1% 48.0% 31.4% 4.2% 2.3% 120
45-54 7.4% 65.9% 22.7% 1.4% 2.6% 129
55-64 15.0% 52.7% 25.5% 3.3% 3.5% 103
65+ 8.8% 62.4% 21.0% 2.8% 5.0% 116
Education
HS or less 7.7% 59.1% 26.9% 2.5% 3.8% 239
Some college 9.1% 53.0% 31.2% 2.5% 4.2% 163 College grad or more
14.9% 61.0% 19.8% 2.0% 2.2% 200
Income
<$35K 8.5% 53.0% 32.1% 4.2% 2.2% 194
$35K-$50K 6.2% 54.1% 30.2% 2.7% 6.8% 95
$50K-$75K 11.3% 66.6% 19.0% 1.5% 1.6% 117
$75K+ 14.1% 59.8% 22.2% 0.0% 3.9% 149 Children in School
Yes 9.6% 57.2% 29.5% 2.3% 1.4% 231
No 11.4% 58.2% 23.5% 2.3% 4.6% 373
Region Indiana Northern
10.0% 60.3% 24.1% 1.7% 4.0% 221
Indiana Central
11.4% 55.6% 27.1% 3.3% 2.6% 287
Indiana Southern
10.8% 58.0% 26.4% 1.0% 3.9% 97
Race / Ethnicity
White 10.4% 59.3% 25.0% 2.1% 3.2% 500
Non-White 12.3% 47.9% 31.1% 4.1% 4.5% 91
DK / Refused 13.2% 67.8% 19.0% 0.0% 0.0% 14
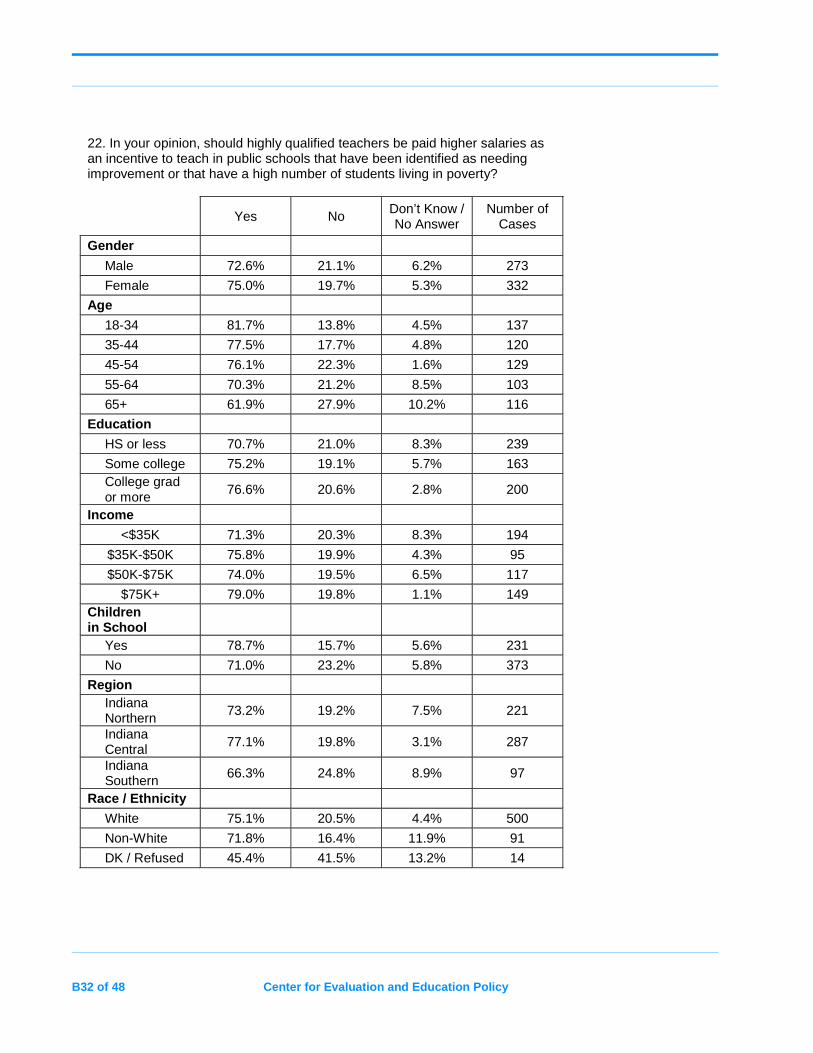
B32 of 48 Center for Evaluation and Education Policy
22. In your opinion, should highly qualified teachers be paid higher salaries as an incentive to teach in public schools that have been identified as needing improvement or that have a high number of students living in poverty?
Yes No Don’t Know / No Answer
Number of Cases
Gender
Male 72.6% 21.1% 6.2% 273
Female 75.0% 19.7% 5.3% 332
Age
18-34 81.7% 13.8% 4.5% 137
35-44 77.5% 17.7% 4.8% 120
45-54 76.1% 22.3% 1.6% 129
55-64 70.3% 21.2% 8.5% 103
65+ 61.9% 27.9% 10.2% 116
Education
HS or less 70.7% 21.0% 8.3% 239
Some college 75.2% 19.1% 5.7% 163 College grad or more
76.6% 20.6% 2.8% 200
Income
<$35K 71.3% 20.3% 8.3% 194
$35K-$50K 75.8% 19.9% 4.3% 95
$50K-$75K 74.0% 19.5% 6.5% 117
$75K+ 79.0% 19.8% 1.1% 149 Children in School
Yes 78.7% 15.7% 5.6% 231
No 71.0% 23.2% 5.8% 373
Region Indiana Northern
73.2% 19.2% 7.5% 221
Indiana Central
77.1% 19.8% 3.1% 287
Indiana Southern
66.3% 24.8% 8.9% 97
Race / Ethnicity
White 75.1% 20.5% 4.4% 500
Non-White 71.8% 16.4% 11.9% 91
DK / Refused 45.4% 41.5% 13.2% 14
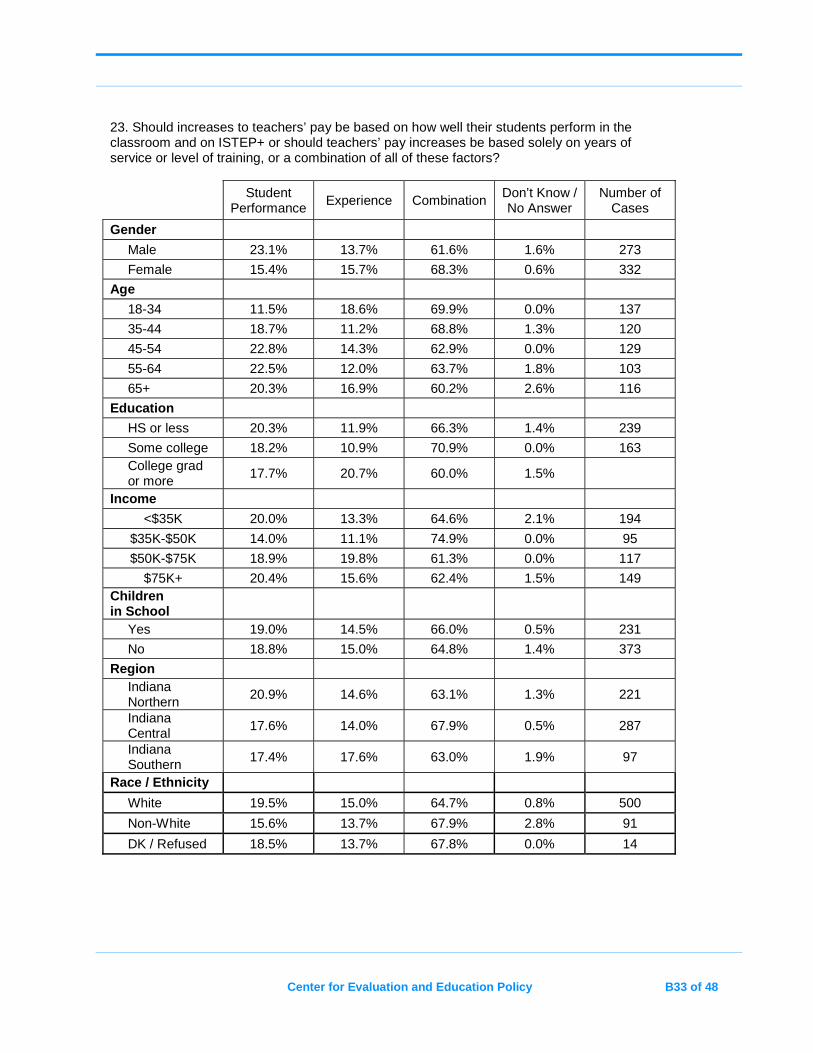
Center for Evaluation and Education Policy B33 of 48
23. Should increases to teachers’ pay be based on how well their students perform in the classroom and on ISTEP+ or should teachers’ pay increases be based solely on years of service or level of training, or a combination of all of these factors?
Student
Performance Experience Combination
Don’t Know / No Answer
Number of Cases
Gender
Male 23.1% 13.7% 61.6% 1.6% 273
Female 15.4% 15.7% 68.3% 0.6% 332
Age
18-34 11.5% 18.6% 69.9% 0.0% 137
35-44 18.7% 11.2% 68.8% 1.3% 120
45-54 22.8% 14.3% 62.9% 0.0% 129
55-64 22.5% 12.0% 63.7% 1.8% 103
65+ 20.3% 16.9% 60.2% 2.6% 116
Education
HS or less 20.3% 11.9% 66.3% 1.4% 239
Some college 18.2% 10.9% 70.9% 0.0% 163 College grad or more
17.7% 20.7% 60.0% 1.5%
Income
<$35K 20.0% 13.3% 64.6% 2.1% 194
$35K-$50K 14.0% 11.1% 74.9% 0.0% 95
$50K-$75K 18.9% 19.8% 61.3% 0.0% 117
$75K+ 20.4% 15.6% 62.4% 1.5% 149 Children in School
Yes 19.0% 14.5% 66.0% 0.5% 231
No 18.8% 15.0% 64.8% 1.4% 373
Region Indiana Northern
20.9% 14.6% 63.1% 1.3% 221
Indiana Central
17.6% 14.0% 67.9% 0.5% 287
Indiana Southern
17.4% 17.6% 63.0% 1.9% 97
Race / Ethnicity
White 19.5% 15.0% 64.7% 0.8% 500
Non-White 15.6% 13.7% 67.9% 2.8% 91
DK / Refused 18.5% 13.7% 67.8% 0.0% 14
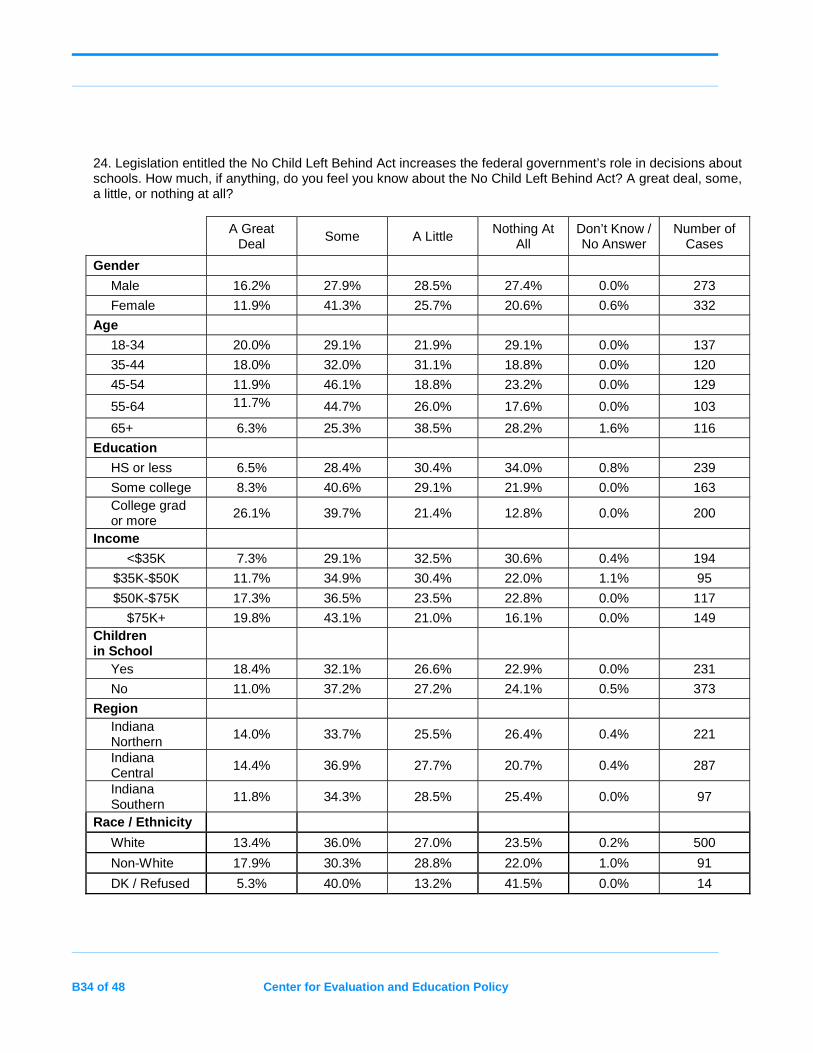
B34 of 48 Center for Evaluation and Education Policy
24. Legislation entitled the No Child Left Behind Act increases the federal government’s role in decisions about schools. How much, if anything, do you feel you know about the No Child Left Behind Act? A great deal, some, a little, or nothing at all?
A Great
Deal Some A Little
Nothing At All
Don’t Know / No Answer
Number of Cases
Gender
Male 16.2% 27.9% 28.5% 27.4% 0.0% 273
Female 11.9% 41.3% 25.7% 20.6% 0.6% 332
Age
18-34 20.0% 29.1% 21.9% 29.1% 0.0% 137
35-44 18.0% 32.0% 31.1% 18.8% 0.0% 120
45-54 11.9% 46.1% 18.8% 23.2% 0.0% 129
55-64 11.7% 44.7% 26.0% 17.6% 0.0% 103
65+ 6.3% 25.3% 38.5% 28.2% 1.6% 116
Education
HS or less 6.5% 28.4% 30.4% 34.0% 0.8% 239
Some college 8.3% 40.6% 29.1% 21.9% 0.0% 163 College grad or more
26.1% 39.7% 21.4% 12.8% 0.0% 200
Income
<$35K 7.3% 29.1% 32.5% 30.6% 0.4% 194
$35K-$50K 11.7% 34.9% 30.4% 22.0% 1.1% 95
$50K-$75K 17.3% 36.5% 23.5% 22.8% 0.0% 117
$75K+ 19.8% 43.1% 21.0% 16.1% 0.0% 149 Children in School
Yes 18.4% 32.1% 26.6% 22.9% 0.0% 231
No 11.0% 37.2% 27.2% 24.1% 0.5% 373
Region Indiana Northern
14.0% 33.7% 25.5% 26.4% 0.4% 221
Indiana Central
14.4% 36.9% 27.7% 20.7% 0.4% 287
Indiana Southern
11.8% 34.3% 28.5% 25.4% 0.0% 97
Race / Ethnicity
White 13.4% 36.0% 27.0% 23.5% 0.2% 500
Non-White 17.9% 30.3% 28.8% 22.0% 1.0% 91
DK / Refused 5.3% 40.0% 13.2% 41.5% 0.0% 14
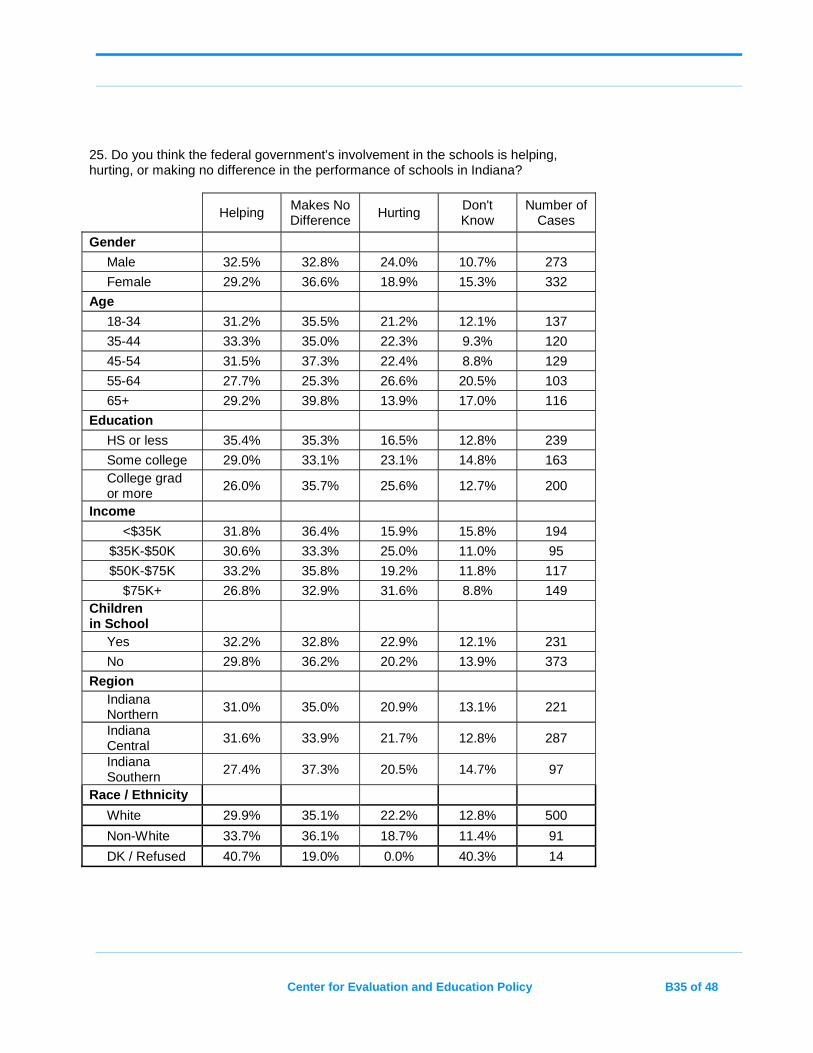
Center for Evaluation and Education Policy B35 of 48
25. Do you think the federal government’s involvement in the schools is helping, hurting, or making no difference in the performance of schools in Indiana?
Helping Makes No Difference
Hurting Don't Know
Number of Cases
Gender
Male 32.5% 32.8% 24.0% 10.7% 273
Female 29.2% 36.6% 18.9% 15.3% 332
Age
18-34 31.2% 35.5% 21.2% 12.1% 137
35-44 33.3% 35.0% 22.3% 9.3% 120
45-54 31.5% 37.3% 22.4% 8.8% 129
55-64 27.7% 25.3% 26.6% 20.5% 103
65+ 29.2% 39.8% 13.9% 17.0% 116
Education
HS or less 35.4% 35.3% 16.5% 12.8% 239
Some college 29.0% 33.1% 23.1% 14.8% 163 College grad or more
26.0% 35.7% 25.6% 12.7% 200
Income
<$35K 31.8% 36.4% 15.9% 15.8% 194
$35K-$50K 30.6% 33.3% 25.0% 11.0% 95
$50K-$75K 33.2% 35.8% 19.2% 11.8% 117
$75K+ 26.8% 32.9% 31.6% 8.8% 149 Children in School
Yes 32.2% 32.8% 22.9% 12.1% 231
No 29.8% 36.2% 20.2% 13.9% 373
Region Indiana Northern 31.0% 35.0% 20.9% 13.1% 221
Indiana Central
31.6% 33.9% 21.7% 12.8% 287
Indiana Southern
27.4% 37.3% 20.5% 14.7% 97
Race / Ethnicity
White 29.9% 35.1% 22.2% 12.8% 500
Non-White 33.7% 36.1% 18.7% 11.4% 91
DK / Refused 40.7% 19.0% 0.0% 40.3% 14
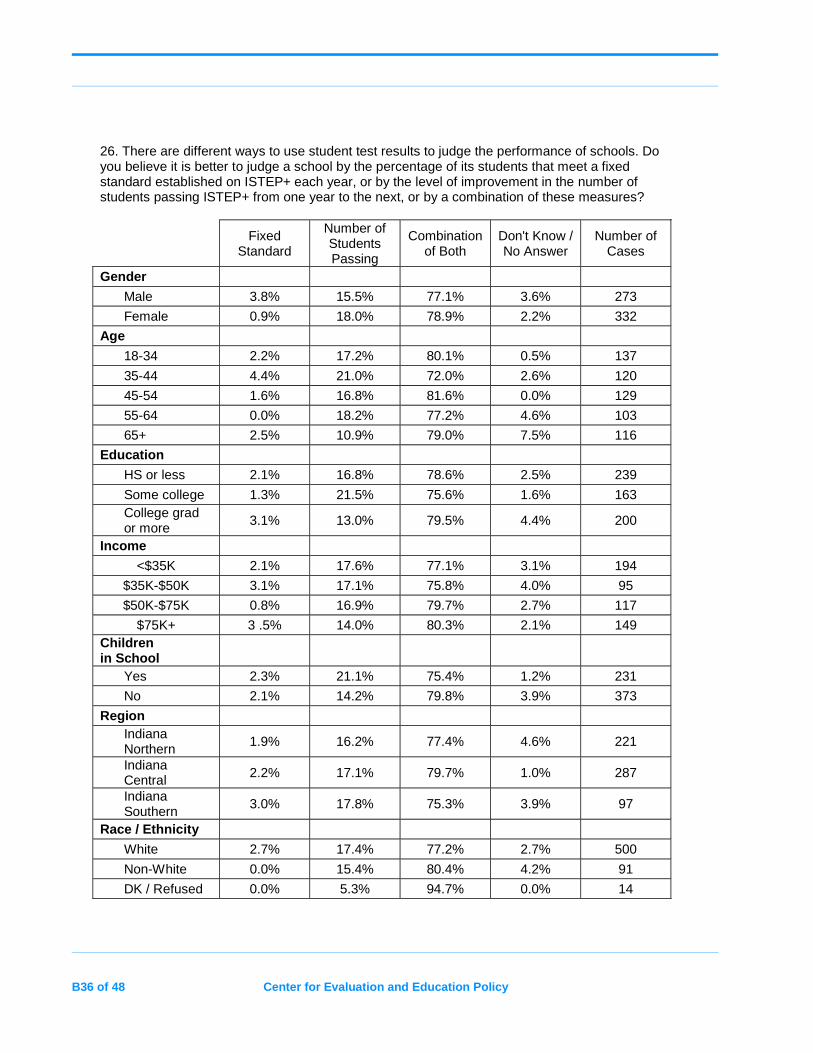
B36 of 48 Center for Evaluation and Education Policy
26. There are different ways to use student test results to judge the performance of schools. Do you believe it is better to judge a school by the percentage of its students that meet a fixed standard established on ISTEP+ each year, or by the level of improvement in the number of students passing ISTEP+ from one year to the next, or by a combination of these measures?
Fixed
Standard
Number of Students Passing
Combination of Both
Don't Know / No Answer
Number of Cases
Gender
Male 3.8% 15.5% 77.1% 3.6% 273
Female 0.9% 18.0% 78.9% 2.2% 332
Age
18-34 2.2% 17.2% 80.1% 0.5% 137
35-44 4.4% 21.0% 72.0% 2.6% 120
45-54 1.6% 16.8% 81.6% 0.0% 129
55-64 0.0% 18.2% 77.2% 4.6% 103
65+ 2.5% 10.9% 79.0% 7.5% 116
Education
HS or less 2.1% 16.8% 78.6% 2.5% 239
Some college 1.3% 21.5% 75.6% 1.6% 163 College grad or more
3.1% 13.0% 79.5% 4.4% 200
Income
<$35K 2.1% 17.6% 77.1% 3.1% 194
$35K-$50K 3.1% 17.1% 75.8% 4.0% 95
$50K-$75K 0.8% 16.9% 79.7% 2.7% 117
$75K+ 3 .5% 14.0% 80.3% 2.1% 149 Children in School
Yes 2.3% 21.1% 75.4% 1.2% 231
No 2.1% 14.2% 79.8% 3.9% 373
Region Indiana Northern
1.9% 16.2% 77.4% 4.6% 221
Indiana Central 2.2% 17.1% 79.7% 1.0% 287
Indiana Southern
3.0% 17.8% 75.3% 3.9% 97
Race / Ethnicity
White 2.7% 17.4% 77.2% 2.7% 500
Non-White 0.0% 15.4% 80.4% 4.2% 91
DK / Refused 0.0% 5.3% 94.7% 0.0% 14
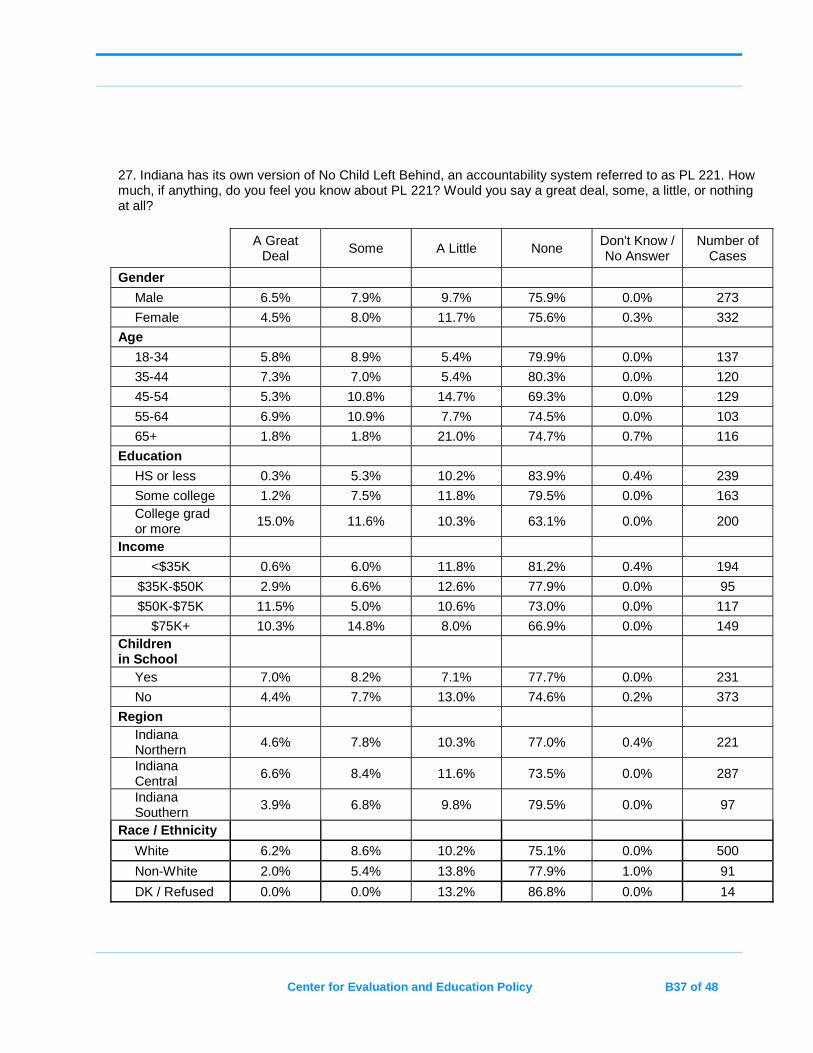
Center for Evaluation and Education Policy B37 of 48
27. Indiana has its own version of No Child Left Behind, an accountability system referred to as PL 221. How much, if anything, do you feel you know about PL 221? Would you say a great deal, some, a little, or nothing at all?
A Great
Deal Some A Little None
Don't Know / No Answer
Number of Cases
Gender
Male 6.5% 7.9% 9.7% 75.9% 0.0% 273
Female 4.5% 8.0% 11.7% 75.6% 0.3% 332
Age
18-34 5.8% 8.9% 5.4% 79.9% 0.0% 137
35-44 7.3% 7.0% 5.4% 80.3% 0.0% 120
45-54 5.3% 10.8% 14.7% 69.3% 0.0% 129
55-64 6.9% 10.9% 7.7% 74.5% 0.0% 103
65+ 1.8% 1.8% 21.0% 74.7% 0.7% 116
Education
HS or less 0.3% 5.3% 10.2% 83.9% 0.4% 239
Some college 1.2% 7.5% 11.8% 79.5% 0.0% 163 College grad or more
15.0% 11.6% 10.3% 63.1% 0.0% 200
Income
<$35K 0.6% 6.0% 11.8% 81.2% 0.4% 194
$35K-$50K 2.9% 6.6% 12.6% 77.9% 0.0% 95
$50K-$75K 11.5% 5.0% 10.6% 73.0% 0.0% 117
$75K+ 10.3% 14.8% 8.0% 66.9% 0.0% 149 Children in School
Yes 7.0% 8.2% 7.1% 77.7% 0.0% 231
No 4.4% 7.7% 13.0% 74.6% 0.2% 373
Region Indiana Northern
4.6% 7.8% 10.3% 77.0% 0.4% 221
Indiana Central
6.6% 8.4% 11.6% 73.5% 0.0% 287
Indiana Southern
3.9% 6.8% 9.8% 79.5% 0.0% 97
Race / Ethnicity
White 6.2% 8.6% 10.2% 75.1% 0.0% 500
Non-White 2.0% 5.4% 13.8% 77.9% 1.0% 91
DK / Refused 0.0% 0.0% 13.2% 86.8% 0.0% 14
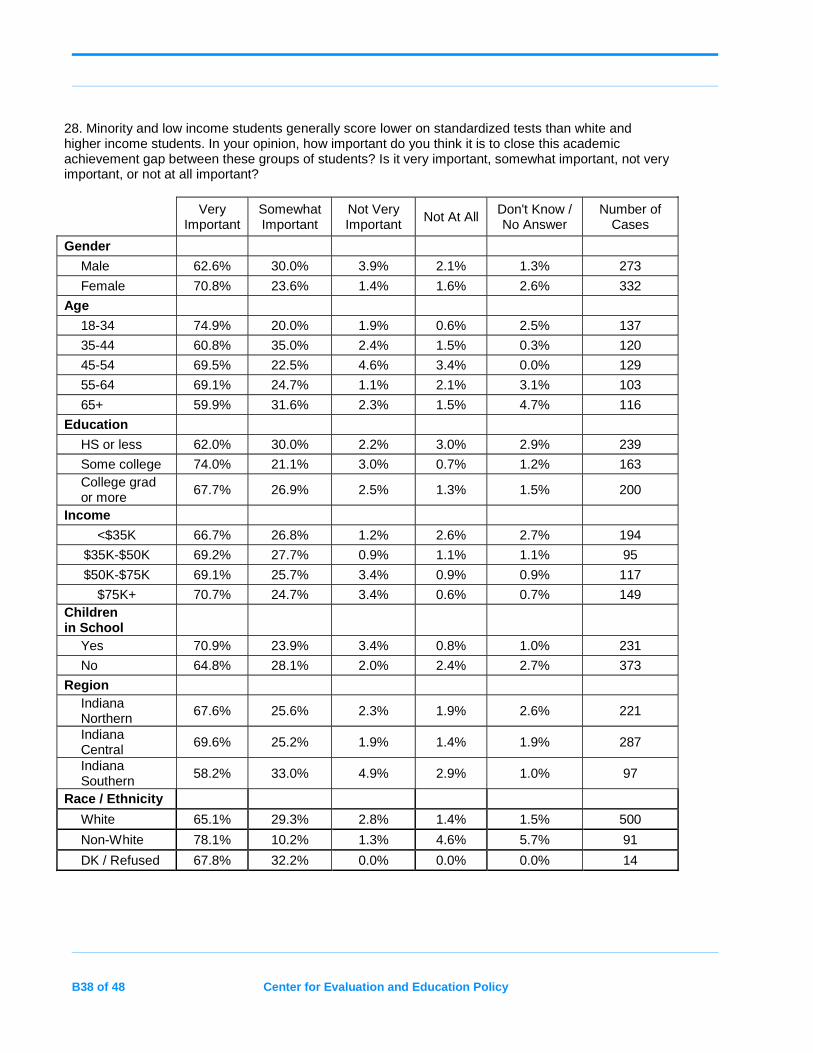
B38 of 48 Center for Evaluation and Education Policy
28. Minority and low income students generally score lower on standardized tests than white and higher income students. In your opinion, how important do you think it is to close this academic achievement gap between these groups of students? Is it very important, somewhat important, not very important, or not at all important?
Very Important
Somewhat Important
Not Very Important
Not At All Don't Know / No Answer
Number of Cases
Gender
Male 62.6% 30.0% 3.9% 2.1% 1.3% 273
Female 70.8% 23.6% 1.4% 1.6% 2.6% 332
Age
18-34 74.9% 20.0% 1.9% 0.6% 2.5% 137
35-44 60.8% 35.0% 2.4% 1.5% 0.3% 120
45-54 69.5% 22.5% 4.6% 3.4% 0.0% 129
55-64 69.1% 24.7% 1.1% 2.1% 3.1% 103
65+ 59.9% 31.6% 2.3% 1.5% 4.7% 116
Education
HS or less 62.0% 30.0% 2.2% 3.0% 2.9% 239
Some college 74.0% 21.1% 3.0% 0.7% 1.2% 163 College grad or more
67.7% 26.9% 2.5% 1.3% 1.5% 200
Income
<$35K 66.7% 26.8% 1.2% 2.6% 2.7% 194
$35K-$50K 69.2% 27.7% 0.9% 1.1% 1.1% 95
$50K-$75K 69.1% 25.7% 3.4% 0.9% 0.9% 117
$75K+ 70.7% 24.7% 3.4% 0.6% 0.7% 149 Children in School
Yes 70.9% 23.9% 3.4% 0.8% 1.0% 231
No 64.8% 28.1% 2.0% 2.4% 2.7% 373
Region Indiana Northern
67.6% 25.6% 2.3% 1.9% 2.6% 221
Indiana Central
69.6% 25.2% 1.9% 1.4% 1.9% 287
Indiana Southern
58.2% 33.0% 4.9% 2.9% 1.0% 97
Race / Ethnicity
White 65.1% 29.3% 2.8% 1.4% 1.5% 500
Non-White 78.1% 10.2% 1.3% 4.6% 5.7% 91
DK / Refused 67.8% 32.2% 0.0% 0.0% 0.0% 14
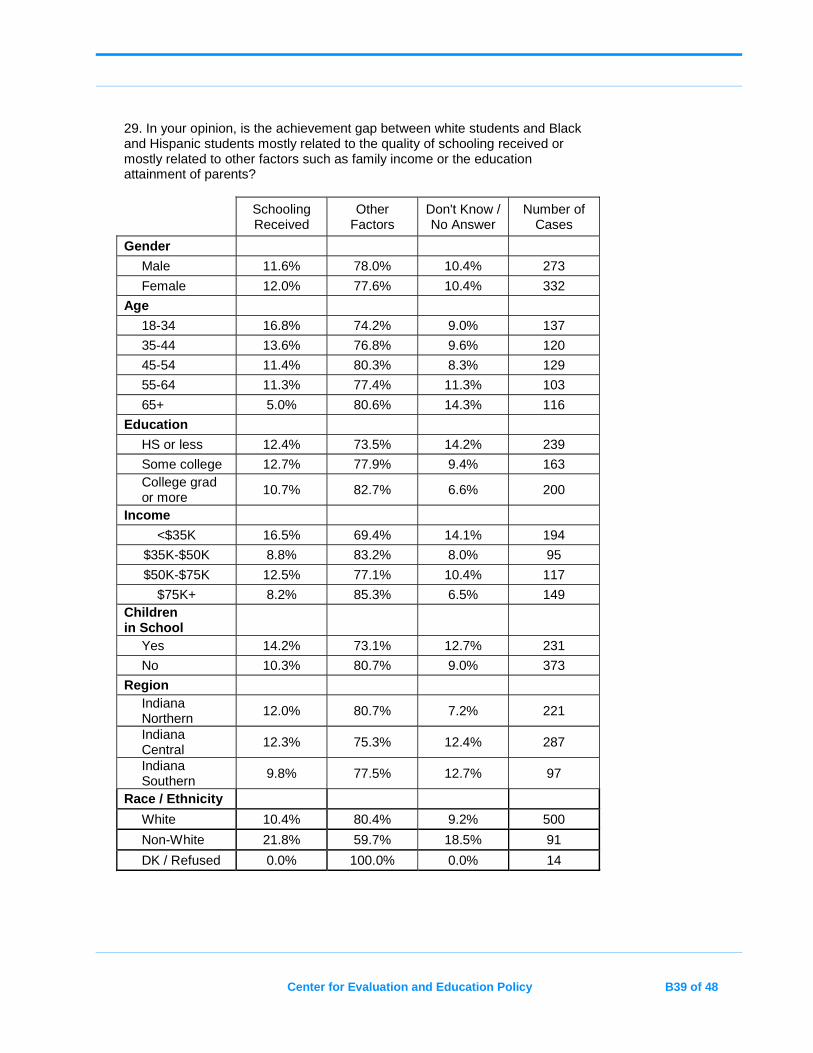
Center for Evaluation and Education Policy B39 of 48
29. In your opinion, is the achievement gap between white students and Black and Hispanic students mostly related to the quality of schooling received or mostly related to other factors such as family income or the education attainment of parents?
Schooling Received
Other Factors
Don't Know / No Answer
Number of Cases
Gender
Male 11.6% 78.0% 10.4% 273
Female 12.0% 77.6% 10.4% 332
Age
18-34 16.8% 74.2% 9.0% 137
35-44 13.6% 76.8% 9.6% 120
45-54 11.4% 80.3% 8.3% 129
55-64 11.3% 77.4% 11.3% 103
65+ 5.0% 80.6% 14.3% 116
Education
HS or less 12.4% 73.5% 14.2% 239
Some college 12.7% 77.9% 9.4% 163 College grad or more
10.7% 82.7% 6.6% 200
Income
<$35K 16.5% 69.4% 14.1% 194
$35K-$50K 8.8% 83.2% 8.0% 95
$50K-$75K 12.5% 77.1% 10.4% 117
$75K+ 8.2% 85.3% 6.5% 149 Children in School
Yes 14.2% 73.1% 12.7% 231
No 10.3% 80.7% 9.0% 373
Region Indiana Northern
12.0% 80.7% 7.2% 221
Indiana Central
12.3% 75.3% 12.4% 287
Indiana Southern
9.8% 77.5% 12.7% 97
Race / Ethnicity
White 10.4% 80.4% 9.2% 500
Non-White 21.8% 59.7% 18.5% 91
DK / Refused 0.0% 100.0% 0.0% 14
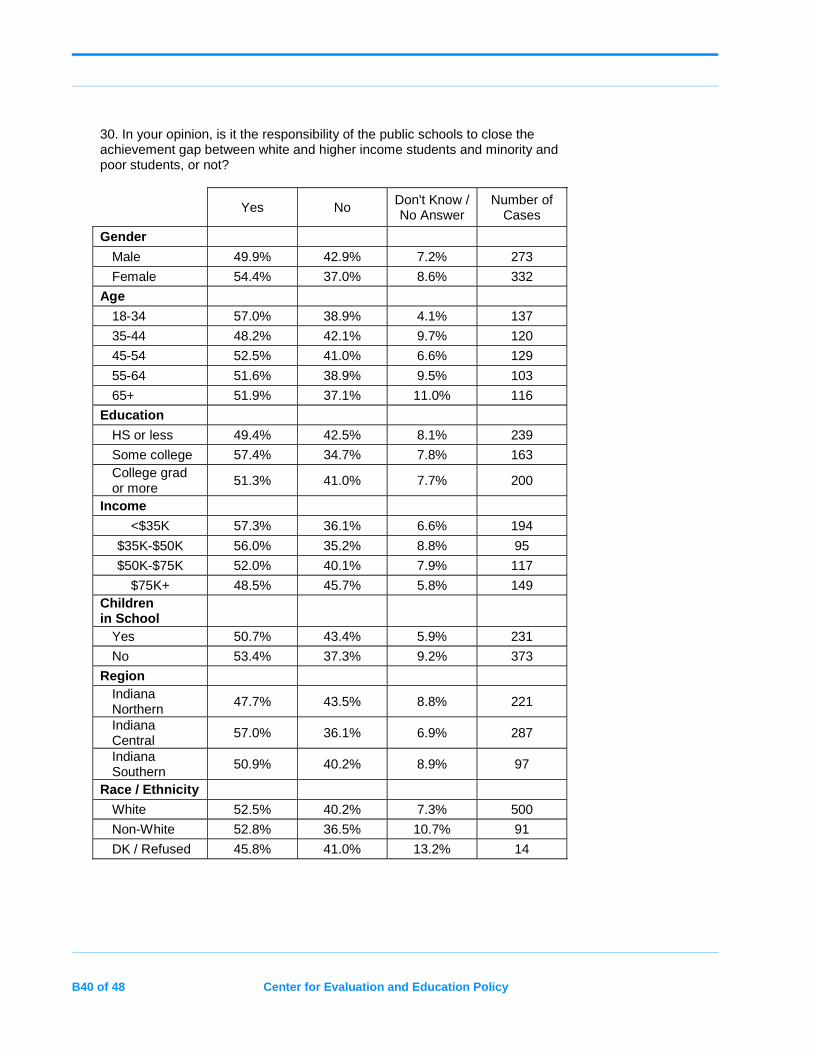
B40 of 48 Center for Evaluation and Education Policy
30. In your opinion, is it the responsibility of the public schools to close the achievement gap between white and higher income students and minority and poor students, or not?
Yes No Don't Know / No Answer
Number of Cases
Gender
Male 49.9% 42.9% 7.2% 273
Female 54.4% 37.0% 8.6% 332
Age
18-34 57.0% 38.9% 4.1% 137
35-44 48.2% 42.1% 9.7% 120
45-54 52.5% 41.0% 6.6% 129
55-64 51.6% 38.9% 9.5% 103
65+ 51.9% 37.1% 11.0% 116
Education
HS or less 49.4% 42.5% 8.1% 239
Some college 57.4% 34.7% 7.8% 163 College grad or more
51.3% 41.0% 7.7% 200
Income
<$35K 57.3% 36.1% 6.6% 194
$35K-$50K 56.0% 35.2% 8.8% 95
$50K-$75K 52.0% 40.1% 7.9% 117
$75K+ 48.5% 45.7% 5.8% 149 Children in School
Yes 50.7% 43.4% 5.9% 231
No 53.4% 37.3% 9.2% 373
Region Indiana Northern
47.7% 43.5% 8.8% 221
Indiana Central
57.0% 36.1% 6.9% 287
Indiana Southern
50.9% 40.2% 8.9% 97
Race / Ethnicity
White 52.5% 40.2% 7.3% 500
Non-White 52.8% 36.5% 10.7% 91
DK / Refused 45.8% 41.0% 13.2% 14
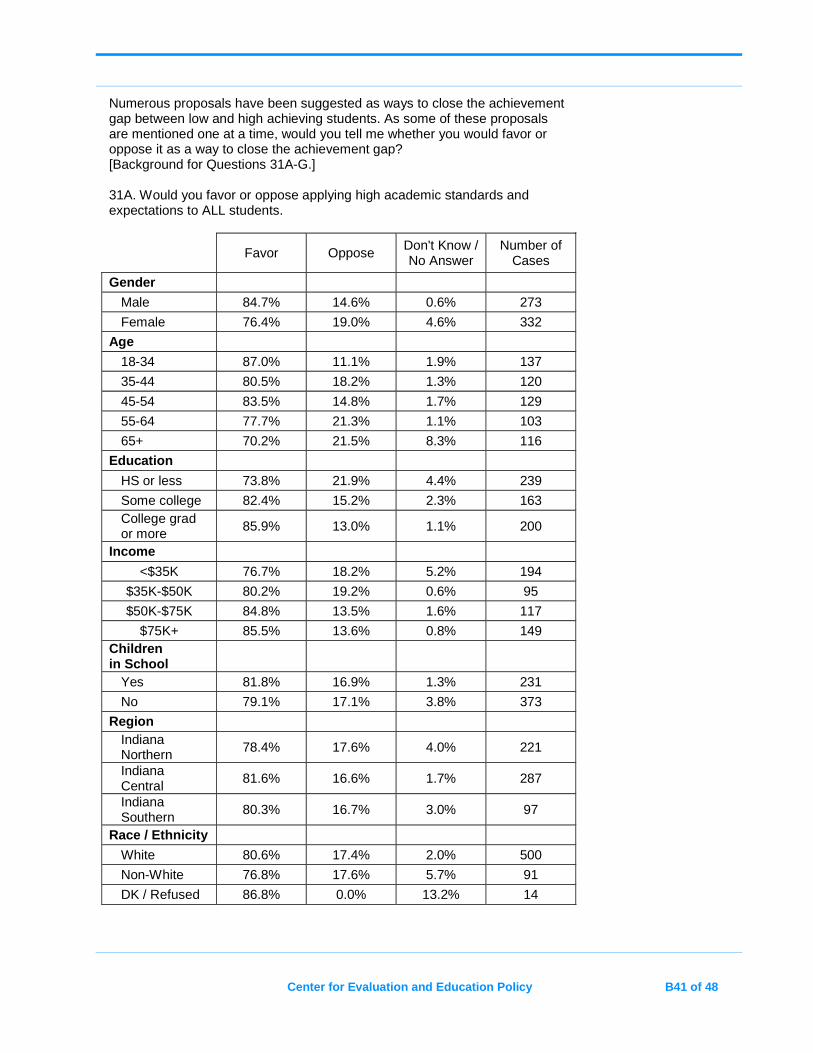
Center for Evaluation and Education Policy B41 of 48
Numerous proposals have been suggested as ways to close the achievement gap between low and high achieving students. As some of these proposals are mentioned one at a time, would you tell me whether you would favor or oppose it as a way to close the achievement gap? [Background for Questions 31A-G.] 31A. Would you favor or oppose applying high academic standards and expectations to ALL students.
Favor Oppose Don't Know / No Answer
Number of Cases
Gender
Male 84.7% 14.6% 0.6% 273
Female 76.4% 19.0% 4.6% 332
Age
18-34 87.0% 11.1% 1.9% 137
35-44 80.5% 18.2% 1.3% 120
45-54 83.5% 14.8% 1.7% 129
55-64 77.7% 21.3% 1.1% 103
65+ 70.2% 21.5% 8.3% 116
Education
HS or less 73.8% 21.9% 4.4% 239
Some college 82.4% 15.2% 2.3% 163 College grad or more 85.9% 13.0% 1.1% 200
Income
<$35K 76.7% 18.2% 5.2% 194
$35K-$50K 80.2% 19.2% 0.6% 95
$50K-$75K 84.8% 13.5% 1.6% 117
$75K+ 85.5% 13.6% 0.8% 149 Children in School
Yes 81.8% 16.9% 1.3% 231
No 79.1% 17.1% 3.8% 373
Region Indiana Northern 78.4% 17.6% 4.0% 221
Indiana Central
81.6% 16.6% 1.7% 287
Indiana Southern
80.3% 16.7% 3.0% 97
Race / Ethnicity
White 80.6% 17.4% 2.0% 500
Non-White 76.8% 17.6% 5.7% 91
DK / Refused 86.8% 0.0% 13.2% 14
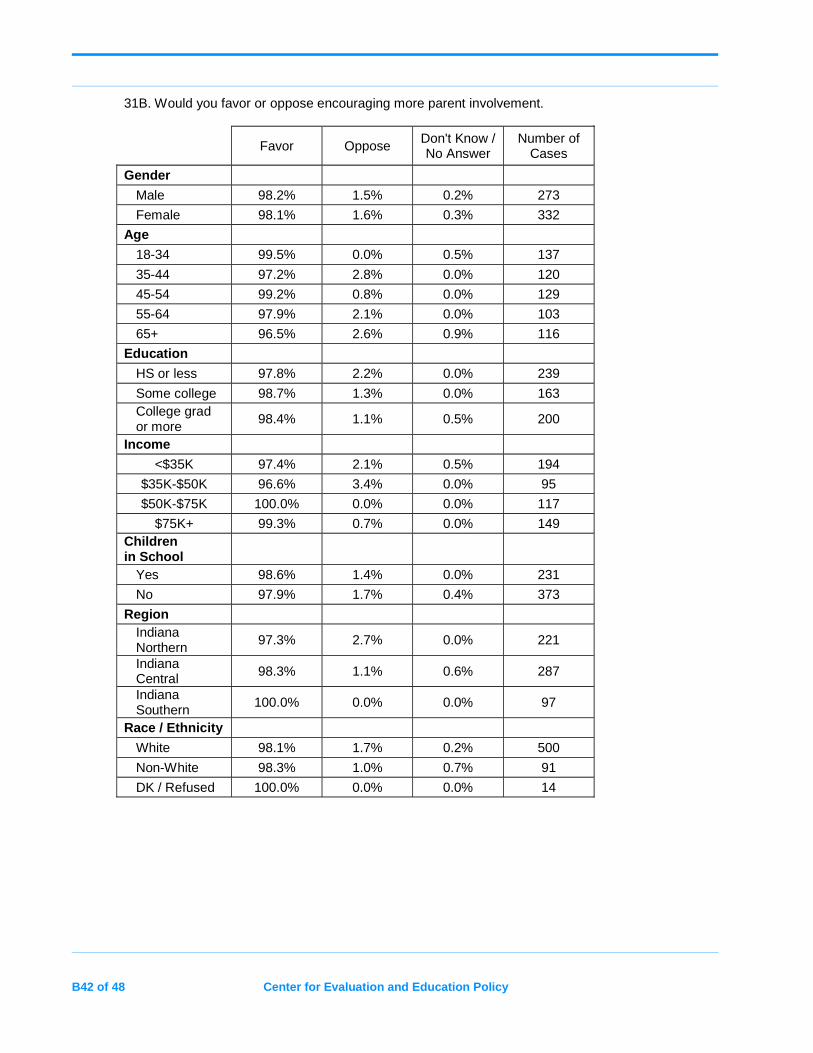
B42 of 48 Center for Evaluation and Education Policy
31B. Would you favor or oppose encouraging more parent involvement.
Favor Oppose Don't Know / No Answer
Number of Cases
Gender
Male 98.2% 1.5% 0.2% 273
Female 98.1% 1.6% 0.3% 332
Age
18-34 99.5% 0.0% 0.5% 137
35-44 97.2% 2.8% 0.0% 120
45-54 99.2% 0.8% 0.0% 129
55-64 97.9% 2.1% 0.0% 103
65+ 96.5% 2.6% 0.9% 116
Education
HS or less 97.8% 2.2% 0.0% 239
Some college 98.7% 1.3% 0.0% 163 College grad or more
98.4% 1.1% 0.5% 200
Income
<$35K 97.4% 2.1% 0.5% 194
$35K-$50K 96.6% 3.4% 0.0% 95
$50K-$75K 100.0% 0.0% 0.0% 117
$75K+ 99.3% 0.7% 0.0% 149 Children in School
Yes 98.6% 1.4% 0.0% 231
No 97.9% 1.7% 0.4% 373
Region Indiana Northern
97.3% 2.7% 0.0% 221
Indiana Central 98.3% 1.1% 0.6% 287
Indiana Southern
100.0% 0.0% 0.0% 97
Race / Ethnicity
White 98.1% 1.7% 0.2% 500
Non-White 98.3% 1.0% 0.7% 91
DK / Refused 100.0% 0.0% 0.0% 14
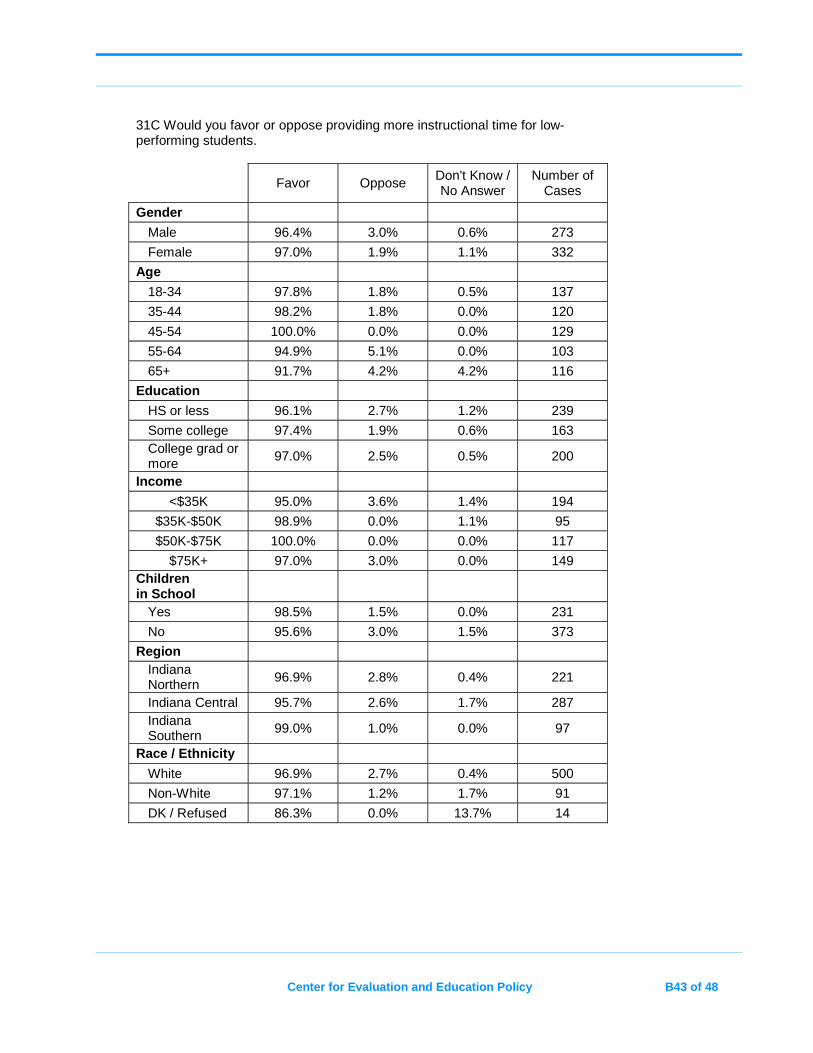
Center for Evaluation and Education Policy B43 of 48
31C Would you favor or oppose providing more instructional time for low-performing students.
Favor Oppose Don't Know / No Answer
Number of Cases
Gender
Male 96.4% 3.0% 0.6% 273
Female 97.0% 1.9% 1.1% 332
Age
18-34 97.8% 1.8% 0.5% 137
35-44 98.2% 1.8% 0.0% 120
45-54 100.0% 0.0% 0.0% 129
55-64 94.9% 5.1% 0.0% 103
65+ 91.7% 4.2% 4.2% 116
Education
HS or less 96.1% 2.7% 1.2% 239
Some college 97.4% 1.9% 0.6% 163 College grad or more 97.0% 2.5% 0.5% 200
Income
<$35K 95.0% 3.6% 1.4% 194
$35K-$50K 98.9% 0.0% 1.1% 95
$50K-$75K 100.0% 0.0% 0.0% 117
$75K+ 97.0% 3.0% 0.0% 149 Children in School
Yes 98.5% 1.5% 0.0% 231
No 95.6% 3.0% 1.5% 373
Region Indiana Northern 96.9% 2.8% 0.4% 221
Indiana Central 95.7% 2.6% 1.7% 287 Indiana Southern 99.0% 1.0% 0.0% 97
Race / Ethnicity
White 96.9% 2.7% 0.4% 500
Non-White 97.1% 1.2% 1.7% 91
DK / Refused 86.3% 0.0% 13.7% 14
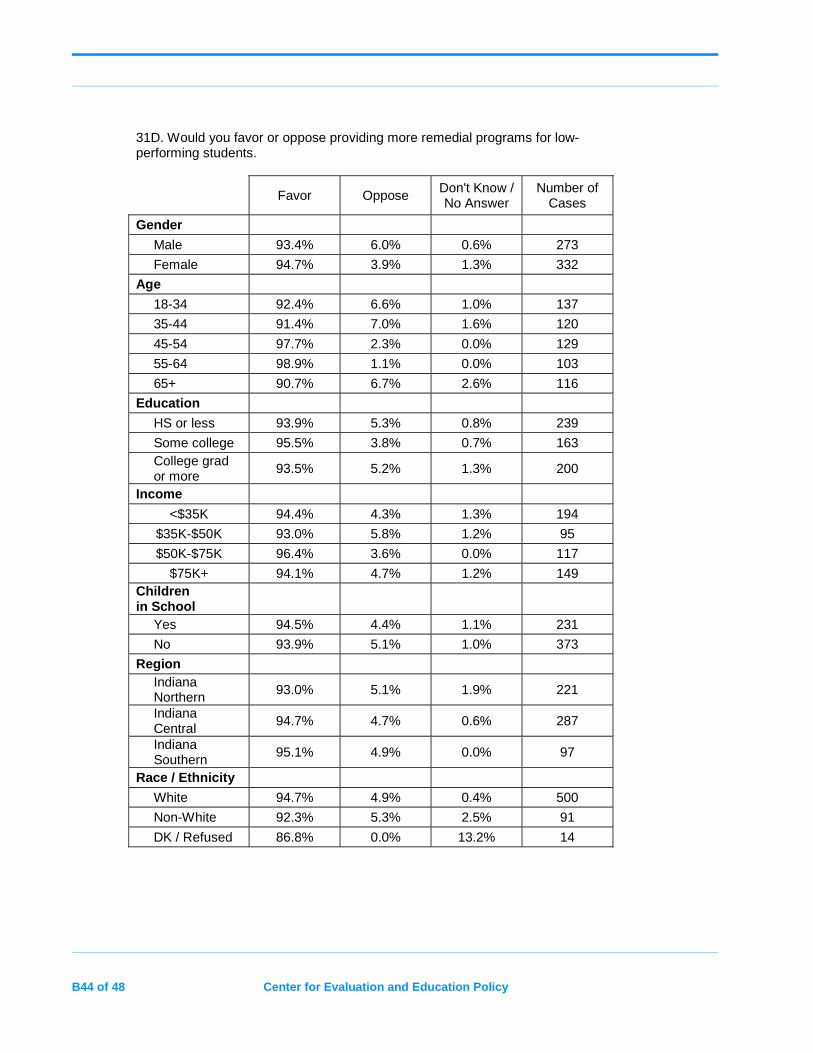
B44 of 48 Center for Evaluation and Education Policy
31D. Would you favor or oppose providing more remedial programs for low-performing students.
Favor Oppose Don't Know / No Answer
Number of Cases
Gender
Male 93.4% 6.0% 0.6% 273
Female 94.7% 3.9% 1.3% 332
Age
18-34 92.4% 6.6% 1.0% 137
35-44 91.4% 7.0% 1.6% 120
45-54 97.7% 2.3% 0.0% 129
55-64 98.9% 1.1% 0.0% 103
65+ 90.7% 6.7% 2.6% 116
Education
HS or less 93.9% 5.3% 0.8% 239
Some college 95.5% 3.8% 0.7% 163 College grad or more
93.5% 5.2% 1.3% 200
Income
<$35K 94.4% 4.3% 1.3% 194
$35K-$50K 93.0% 5.8% 1.2% 95
$50K-$75K 96.4% 3.6% 0.0% 117
$75K+ 94.1% 4.7% 1.2% 149 Children in School
Yes 94.5% 4.4% 1.1% 231
No 93.9% 5.1% 1.0% 373
Region Indiana Northern 93.0% 5.1% 1.9% 221
Indiana Central
94.7% 4.7% 0.6% 287
Indiana Southern
95.1% 4.9% 0.0% 97
Race / Ethnicity
White 94.7% 4.9% 0.4% 500
Non-White 92.3% 5.3% 2.5% 91
DK / Refused 86.8% 0.0% 13.2% 14
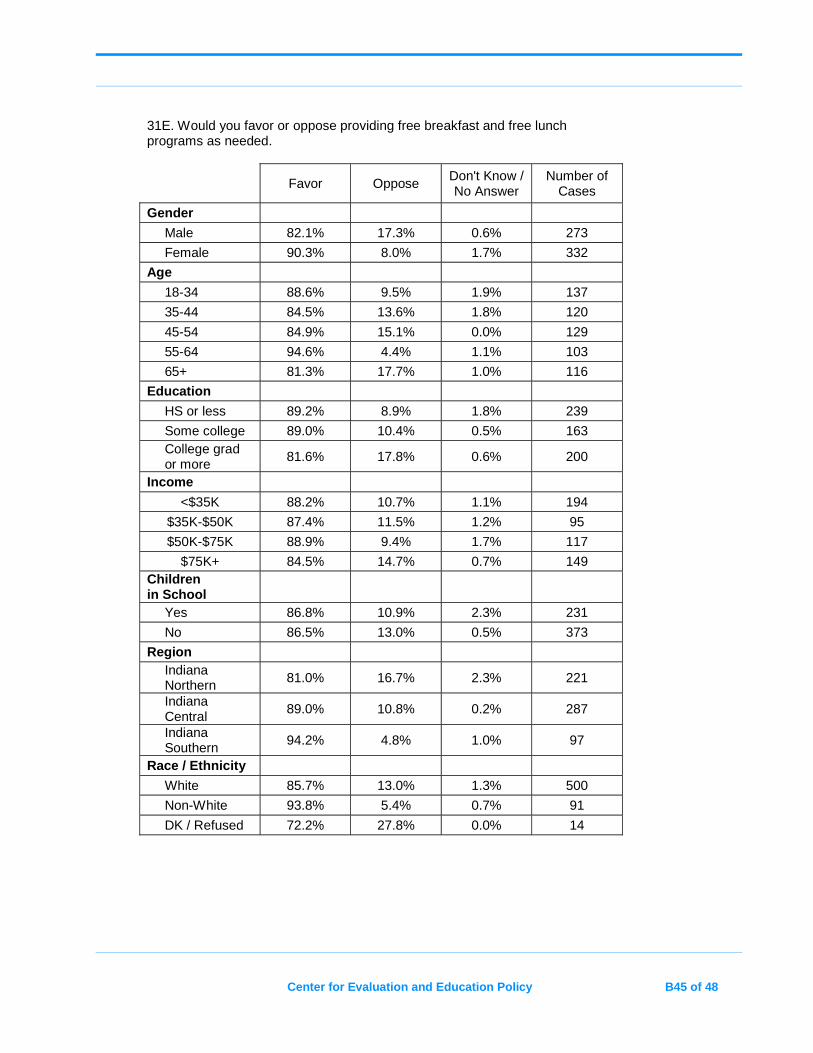
Center for Evaluation and Education Policy B45 of 48
31E. Would you favor or oppose providing free breakfast and free lunch programs as needed.
Favor Oppose Don't Know / No Answer
Number of Cases
Gender
Male 82.1% 17.3% 0.6% 273
Female 90.3% 8.0% 1.7% 332
Age
18-34 88.6% 9.5% 1.9% 137
35-44 84.5% 13.6% 1.8% 120
45-54 84.9% 15.1% 0.0% 129
55-64 94.6% 4.4% 1.1% 103
65+ 81.3% 17.7% 1.0% 116
Education
HS or less 89.2% 8.9% 1.8% 239
Some college 89.0% 10.4% 0.5% 163 College grad or more
81.6% 17.8% 0.6% 200
Income
<$35K 88.2% 10.7% 1.1% 194
$35K-$50K 87.4% 11.5% 1.2% 95
$50K-$75K 88.9% 9.4% 1.7% 117
$75K+ 84.5% 14.7% 0.7% 149 Children in School
Yes 86.8% 10.9% 2.3% 231
No 86.5% 13.0% 0.5% 373
Region Indiana Northern 81.0% 16.7% 2.3% 221
Indiana Central
89.0% 10.8% 0.2% 287
Indiana Southern
94.2% 4.8% 1.0% 97
Race / Ethnicity
White 85.7% 13.0% 1.3% 500
Non-White 93.8% 5.4% 0.7% 91
DK / Refused 72.2% 27.8% 0.0% 14
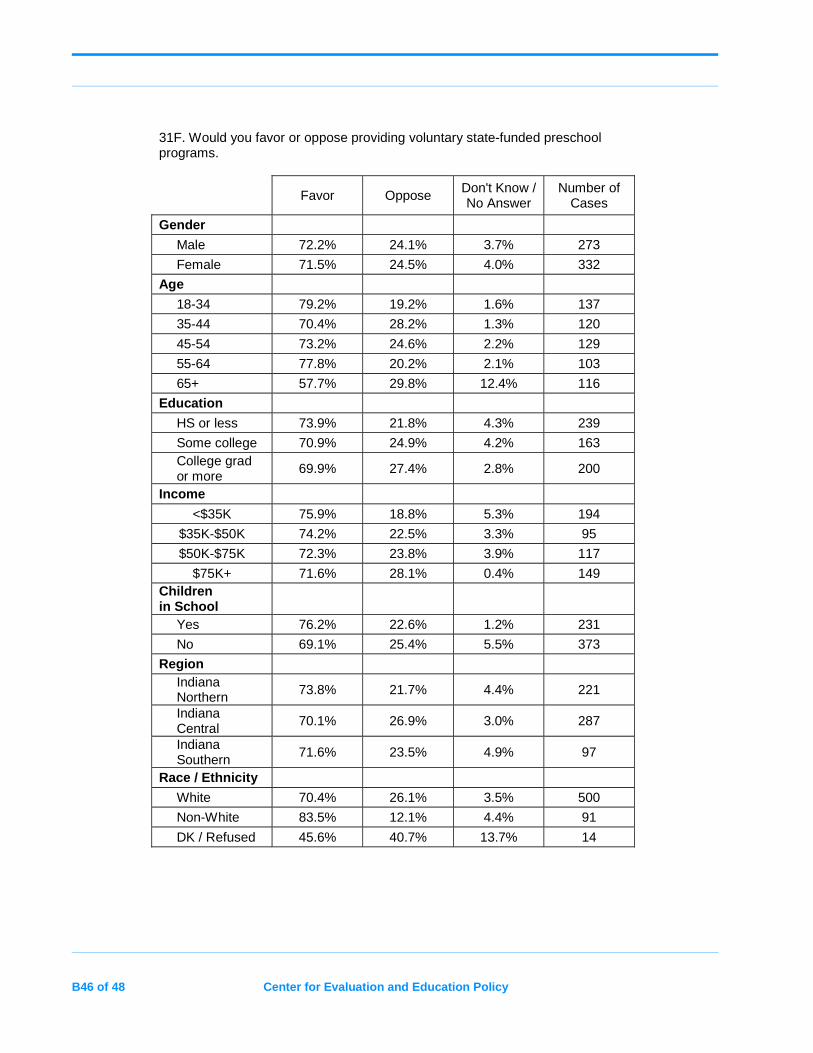
B46 of 48 Center for Evaluation and Education Policy
31F. Would you favor or oppose providing voluntary state-funded preschool programs.
Favor Oppose Don't Know / No Answer
Number of Cases
Gender
Male 72.2% 24.1% 3.7% 273
Female 71.5% 24.5% 4.0% 332
Age
18-34 79.2% 19.2% 1.6% 137
35-44 70.4% 28.2% 1.3% 120
45-54 73.2% 24.6% 2.2% 129
55-64 77.8% 20.2% 2.1% 103
65+ 57.7% 29.8% 12.4% 116
Education
HS or less 73.9% 21.8% 4.3% 239
Some college 70.9% 24.9% 4.2% 163 College grad or more
69.9% 27.4% 2.8% 200
Income
<$35K 75.9% 18.8% 5.3% 194
$35K-$50K 74.2% 22.5% 3.3% 95
$50K-$75K 72.3% 23.8% 3.9% 117
$75K+ 71.6% 28.1% 0.4% 149 Children in School
Yes 76.2% 22.6% 1.2% 231
No 69.1% 25.4% 5.5% 373
Region Indiana Northern 73.8% 21.7% 4.4% 221
Indiana Central
70.1% 26.9% 3.0% 287
Indiana Southern
71.6% 23.5% 4.9% 97
Race / Ethnicity
White 70.4% 26.1% 3.5% 500
Non-White 83.5% 12.1% 4.4% 91
DK / Refused 45.6% 40.7% 13.7% 14
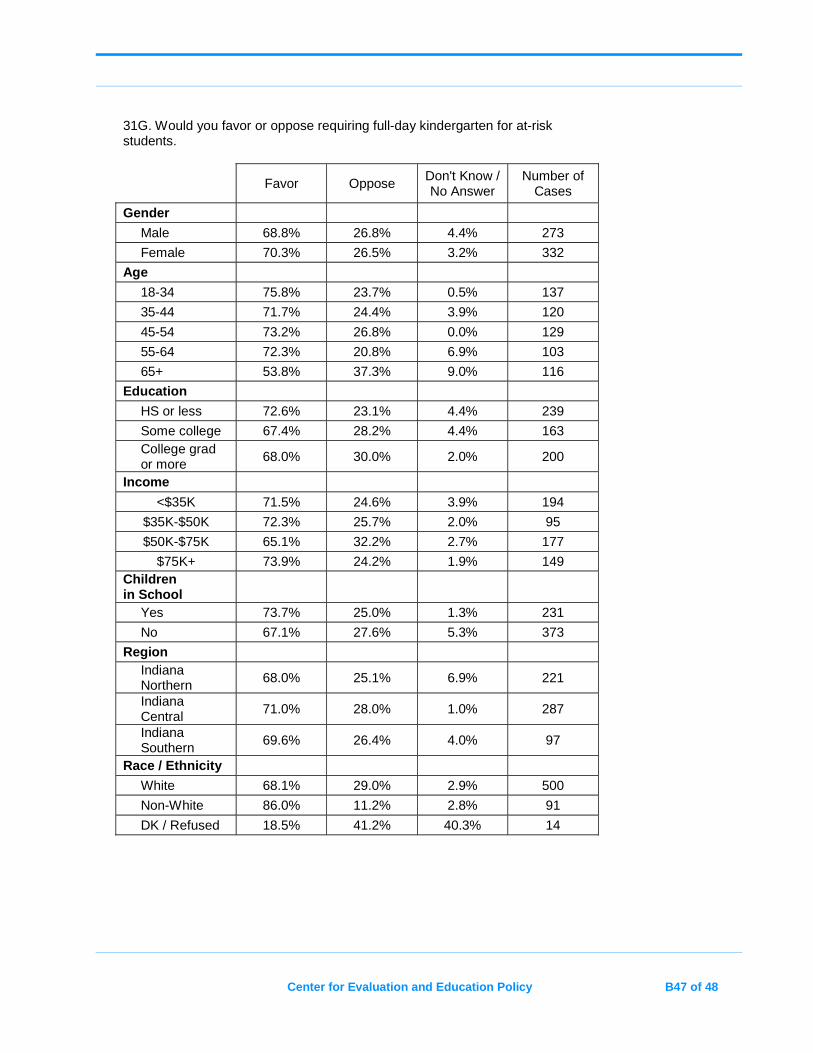
Center for Evaluation and Education Policy B47 of 48
31G. Would you favor or oppose requiring full-day kindergarten for at-risk students.
Favor Oppose Don't Know / No Answer
Number of Cases
Gender
Male 68.8% 26.8% 4.4% 273
Female 70.3% 26.5% 3.2% 332
Age
18-34 75.8% 23.7% 0.5% 137
35-44 71.7% 24.4% 3.9% 120
45-54 73.2% 26.8% 0.0% 129
55-64 72.3% 20.8% 6.9% 103
65+ 53.8% 37.3% 9.0% 116
Education
HS or less 72.6% 23.1% 4.4% 239
Some college 67.4% 28.2% 4.4% 163 College grad or more
68.0% 30.0% 2.0% 200
Income
<$35K 71.5% 24.6% 3.9% 194
$35K-$50K 72.3% 25.7% 2.0% 95
$50K-$75K 65.1% 32.2% 2.7% 177
$75K+ 73.9% 24.2% 1.9% 149 Children in School
Yes 73.7% 25.0% 1.3% 231
No 67.1% 27.6% 5.3% 373
Region Indiana Northern 68.0% 25.1% 6.9% 221
Indiana Central
71.0% 28.0% 1.0% 287
Indiana Southern
69.6% 26.4% 4.0% 97
Race / Ethnicity
White 68.1% 29.0% 2.9% 500
Non-White 86.0% 11.2% 2.8% 91
DK / Refused 18.5% 41.2% 40.3% 14

B48 of 48 Center for Evaluation and Education Policy

509 East Third StreetBloomington, IN 47401
812-855-4438Toll-Free in North America: 800.511.6575
Fax: 812.856.5890E-mail CEEP: [email protected] Web Site: http://ceep.indiana.edu/


![Court of Appeals of Indiana | Opinion 93A02-1403-EX-158 ... · Court of Appeals of Indiana | Opinion 93A02-1403-EX-158 |April 8, 2015 Page 4 of 31 Facts [4] NIPSCO is a public electric](https://img.pdfslide.net/doc/110x75/5e9f5a3f144fea243a08826f/court-of-appeals-of-indiana-opinion-93a02-1403-ex-158-court-of-appeals-of.jpg)