Embed Size (px)
Citation preview
1©2006 Prentice Hall Business Publishing Financial Accounting, 6/e Harrison/Horngren
Merchandise Inventory, Cost of Goods Sold, and Gross Profit
Chapter 6
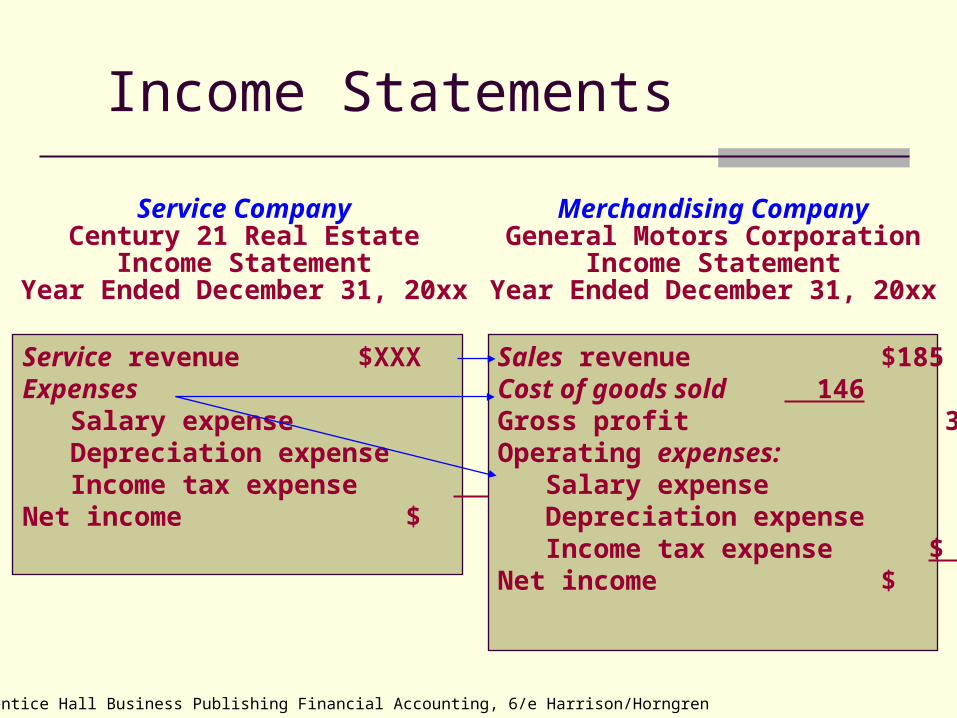
Income Statements
Service revenue $XXXExpenses Salary expense X Depreciation expense X Income tax expense XNet income $ X
Service CompanyCentury 21 Real Estate
Income StatementYear Ended December 31, 20xx
Sales revenue $185Cost of goods sold 146Gross profit 39Operating expenses: Salary expense X Depreciation expense X Income tax expense $ XNet income $ 4
Merchandising CompanyGeneral Motors Corporation
Income StatementYear Ended December 31, 20xx
©2006 Prentice Hall Business Publishing Financial Accounting, 6/e Harrison/Horngren
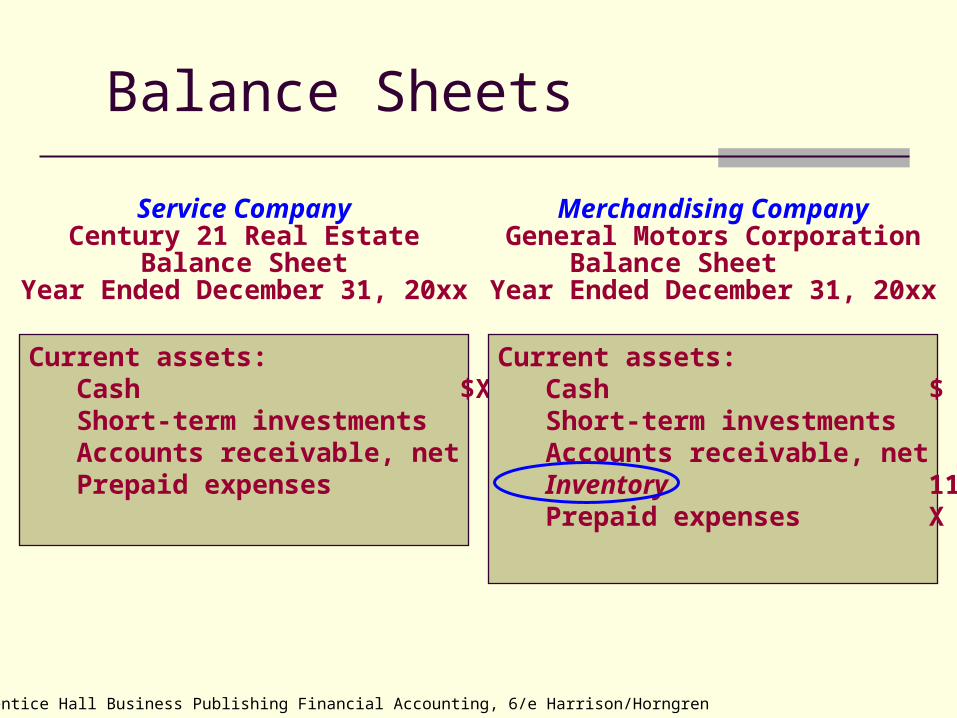
Balance Sheets
Current assets: Cash $X Short-term investments X Accounts receivable, net X Prepaid expenses X
Service CompanyCentury 21 Real Estate
Balance SheetYear Ended December 31, 20xx
Current assets: Cash $ X Short-term investments X Accounts receivable, net X Inventory 11 Prepaid expenses X
Merchandising CompanyGeneral Motors Corporation
Balance SheetYear Ended December 31, 20xx
©2006 Prentice Hall Business Publishing Financial Accounting, 6/e Harrison/Horngren

4©2006 Prentice Hall Business Publishing Financial Accounting, 6/e Harrison/Horngren
Gross Profit (Gross Margin)
Sales Revenue
- Gross Profit
- Operating Expenses
Net Income
5©2006 Prentice Hall Business Publishing Financial Accounting, 6/e Harrison/Horngren
Learning Objective 1
Account for inventory transactions.

6©2006 Prentice Hall Business Publishing Financial Accounting, 6/e Harrison/Horngren
Periodic systems do not keep a continuous record of inventory on hand.
Perpetual systems maintain a running record to show the inventory on hand at all times.
Inventory Accounting Systems
7©2006 Prentice Hall Business Publishing Financial Accounting, 6/e Harrison/Horngren
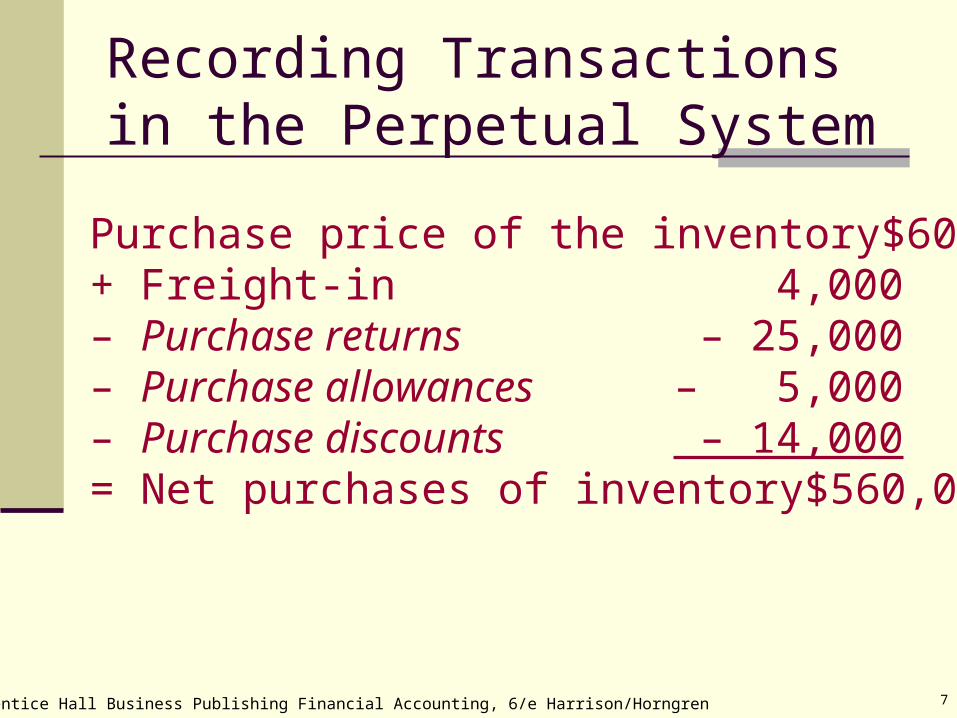
Recording Transactionsin the Perpetual System
Purchase price of the inventory $600,000+ Freight-in 4,000– Purchase returns – 25,000– Purchase allowances – 5,000– Purchase discounts – 14,000= Net purchases of inventory $560,000

General Journal
Date Accounts and Explanations PR Debit Credit
Recording Transactionsand the T-Accounts
Accounts Payable560,000Beg. 100,000
560,000
Inventory
Inventory 560,000
Accounts Payable 560,000Purchased inventory on account
©2006 Prentice Hall Business Publishing Financial Accounting, 6/e Harrison/Horngren
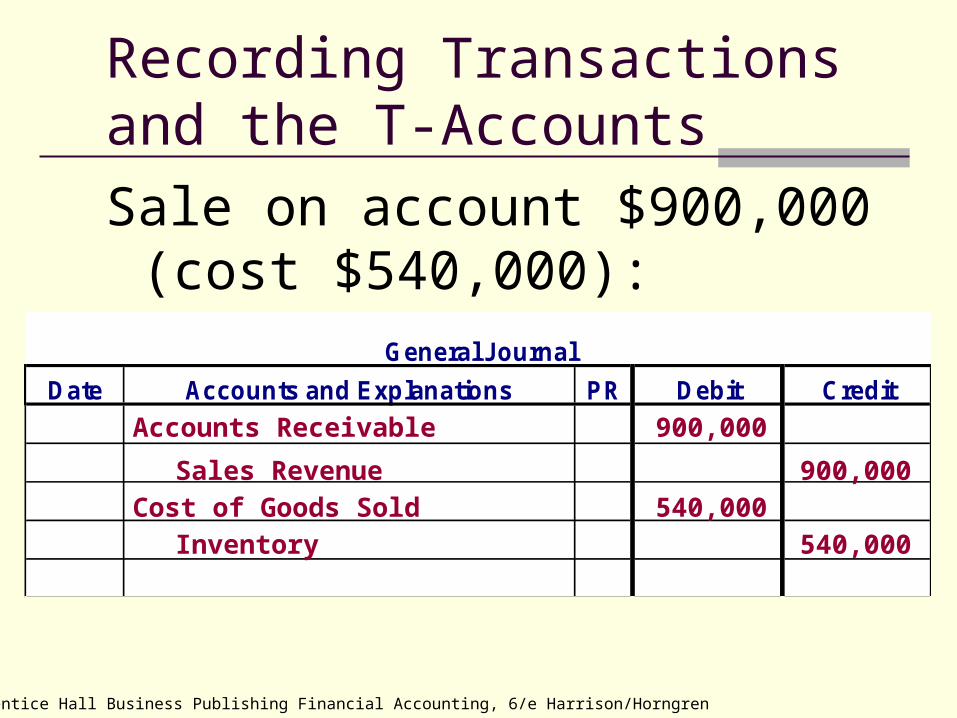
Recording Transactionsand the T-Accounts
Sale on account $900,000 (cost $540,000):
General Journal
Date Accounts and Explanations PR Debit Credit
Accounts Receivable 900,000
Sales Revenue 900,000Cost of Goods Sold 540,000
Inventory 540,000
©2006 Prentice Hall Business Publishing Financial Accounting, 6/e Harrison/Horngren
10©2006 Prentice Hall Business Publishing Financial Accounting, 6/e Harrison/Horngren
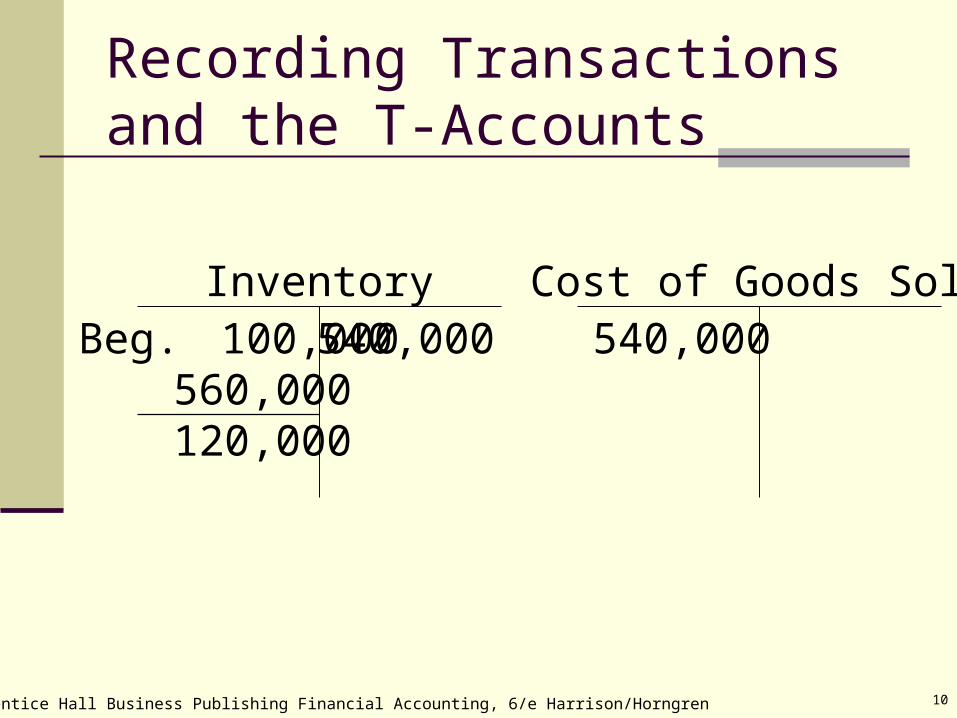
Recording Transactionsand the T-Accounts
Cost of Goods Sold540,000
InventoryBeg. 100,000
560,000120,000
540,000
11©2006 Prentice Hall Business Publishing Financial Accounting, 6/e Harrison/Horngren
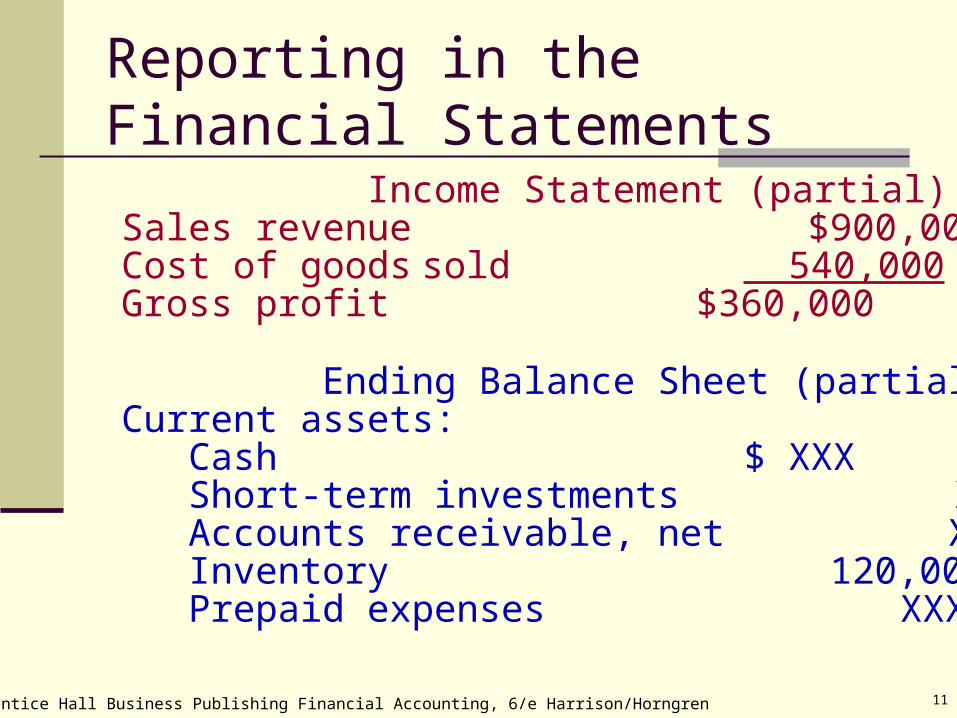
Reporting in theFinancial Statements Income Statement (partial)Sales revenue $900,000Cost of goods sold 540,000Gross profit $360,000
Ending Balance Sheet (partial)Current assets: Cash $ XXX Short-term investments XXX Accounts receivable, net XXX Inventory 120,000 Prepaid expenses XXX

12©2006 Prentice Hall Business Publishing Financial Accounting, 6/e Harrison/Horngren
Net salesSales revenue– Sales returns & allowances– Sales discounts
Reporting in theFinancial Statements
Net purchasesPurchases+ Freight-in– Purchase returns & allowances– Purchases discount
13©2006 Prentice Hall Business Publishing Financial Accounting, 6/e Harrison/Horngren
Learning Objective 2
Analyze the various inventory methods.

14©2006 Prentice Hall Business Publishing Financial Accounting, 6/e Harrison/Horngren
What Goes Into Inventory Cost?
Sum of all costs incurred to bring asset to its intended use
Inventory costing methods:Specific unit costWeighted-average costFirst-in, first-out (FIFO)Last-in, first-out (LIFO)

15©2006 Prentice Hall Business Publishing Financial Accounting, 6/e Harrison/Horngren
Beginning inventory (10 units @ $10) $ 100No. 1 (25 units @ $14 per unit) $350No. 2 (25 units @ $18 per unit) 450Total purchases 800Cost of goods available for sale $ 900
Ending inventory: 20 unitsCost of goods sold: 40 units
Illustrative Data
16©2006 Prentice Hall Business Publishing Financial Accounting, 6/e Harrison/Horngren
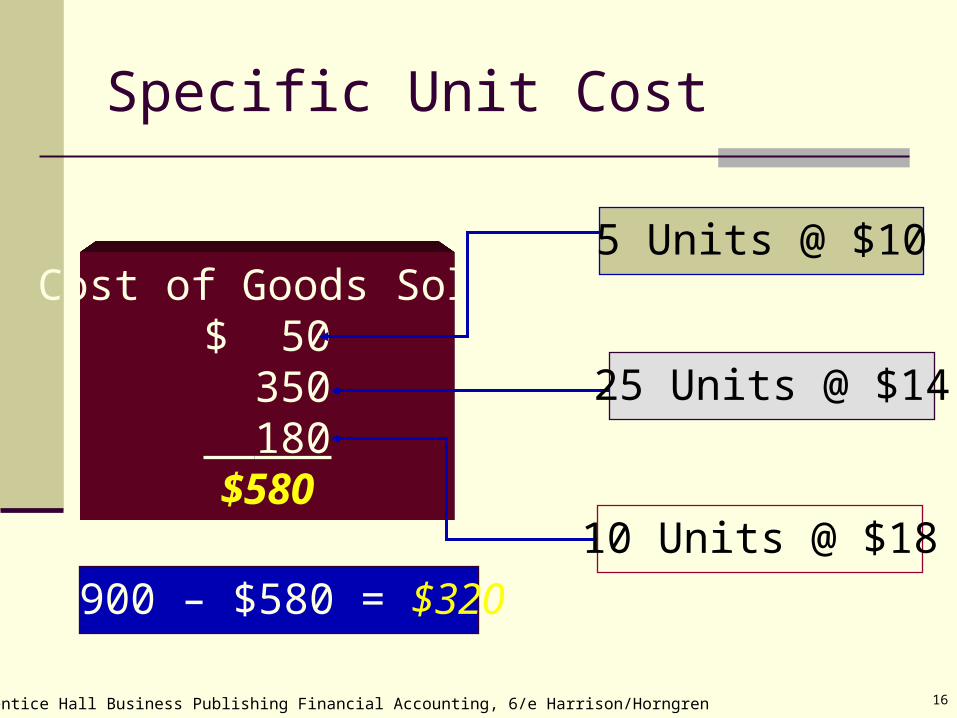
Cost of Goods Sold$ 50 350 180$580
Specific Unit Cost
$900 – $580 = $320
25 Units @ $14
10 Units @ $18
5 Units @ $10

17©2006 Prentice Hall Business Publishing Financial Accounting, 6/e Harrison/Horngren
Weighted-Average
$900 total cost ÷ 60 units = $15/unit
Cost of goods sold = 40 × $15 = $600
Ending inventory = 20 × $15 = $300

18©2006 Prentice Hall Business Publishing Financial Accounting, 6/e Harrison/Horngren
60 units Less units sold 40 Ending inventory 20 units
First-In, First-Out
Ending Inventory Cost:
20 units × $18 per unit = $360

19©2006 Prentice Hall Business Publishing Financial Accounting, 6/e Harrison/Horngren
Cost of Goods Sold$100 350 90$540
First-In, First-Out
10 Units @ $10
25 Units @ $14
5 Units @ $18

20©2006 Prentice Hall Business Publishing Financial Accounting, 6/e Harrison/Horngren
60 units Less units sold 40 Ending inventory 20 units
Last-In, First-Out
Ending Inventory Cost:
10 units × 10 =$10010 units × 14 = 140Total $240

21©2006 Prentice Hall Business Publishing Financial Accounting, 6/e Harrison/Horngren
Cost of Goods Sold$450 210$660
Last-In, First-Out
25 Units @ $18
15 Units @ $14
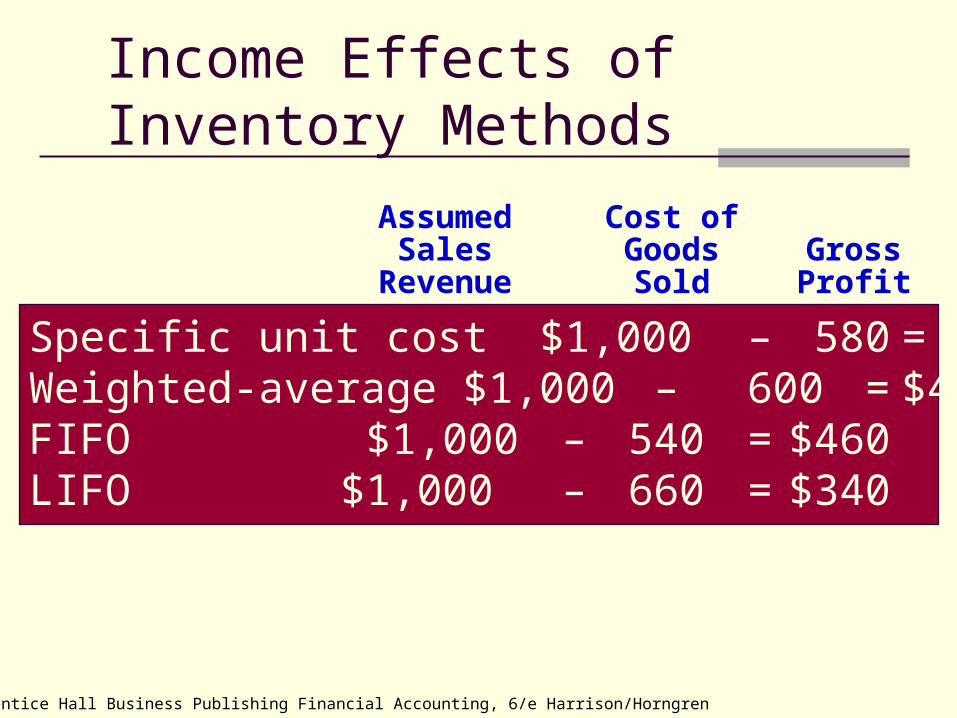
Income Effects ofInventory Methods
Specific unit cost $1,000 – 580 = $420Weighted-average $1,000 – 600 = $400FIFO $1,000 – 540 = $460LIFO $1,000 – 660 = $340
AssumedSales
Revenue
Cost ofGoodsSold
GrossProfit
©2006 Prentice Hall Business Publishing Financial Accounting, 6/e Harrison/Horngren
23©2006 Prentice Hall Business Publishing Financial Accounting, 6/e Harrison/Horngren
Learning Objective 3
Identify the income and the tax effects of the inventory methods.

24©2006 Prentice Hall Business Publishing Financial Accounting, 6/e Harrison/Horngren
The Tax Advantage of LIFO
Gross profit $460 $340Operating expenses 260 260Income before taxes $200 $ 80Income tax expense (40%) $ 80 $ 32
FIFO LIFO
The most attractive feature of LIFO is low income tax payments when prices are
increasing.
25©2006 Prentice Hall Business Publishing Financial Accounting, 6/e Harrison/Horngren
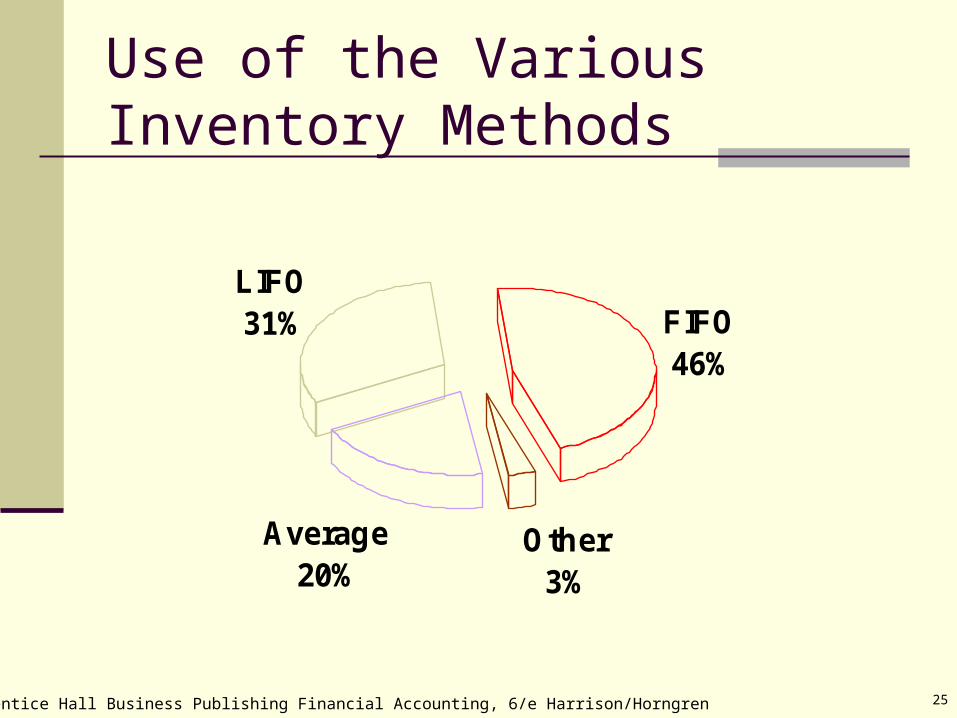
Use of the VariousInventory Methods
Other3%
Average20%
LIFO31% FIFO
46%

26©2006 Prentice Hall Business Publishing Financial Accounting, 6/e Harrison/Horngren
Comparison of Inventory MethodsFIFO produces inventory profits
during periods of inflationLIFO allows managers to
manipulate net incomeLIFO liquidation

27©2006 Prentice Hall Business Publishing Financial Accounting, 6/e Harrison/Horngren
Consistency Principle
Use the same accounting methods and procedures from one period to the next
May change inventory methods, but must disclose the effects of the change on net income
28©2006 Prentice Hall Business Publishing Financial Accounting, 6/e Harrison/Horngren
Disclosure Principle
Financial statements should report enough information to enable an outsider to make knowledgeable decisions about the company.
29©2006 Prentice Hall Business Publishing Financial Accounting, 6/e Harrison/Horngren
Conservatism
The least favorable figures are presented in the financial statements.

30©2006 Prentice Hall Business Publishing Financial Accounting, 6/e Harrison/Horngren
Lower-of-Cost-or-Market Rule
Report inventory at the lower of its historical cost or market (replacement) value
If the replacement cost falls below its historical cost, write down the value of the inventory

31©2006 Prentice Hall Business Publishing Financial Accounting, 6/e Harrison/Horngren
Learning Objective 4
Use the gross profit percentage and inventory turnover to evaluate business.
32©2006 Prentice Hall Business Publishing Financial Accounting, 6/e Harrison/Horngren
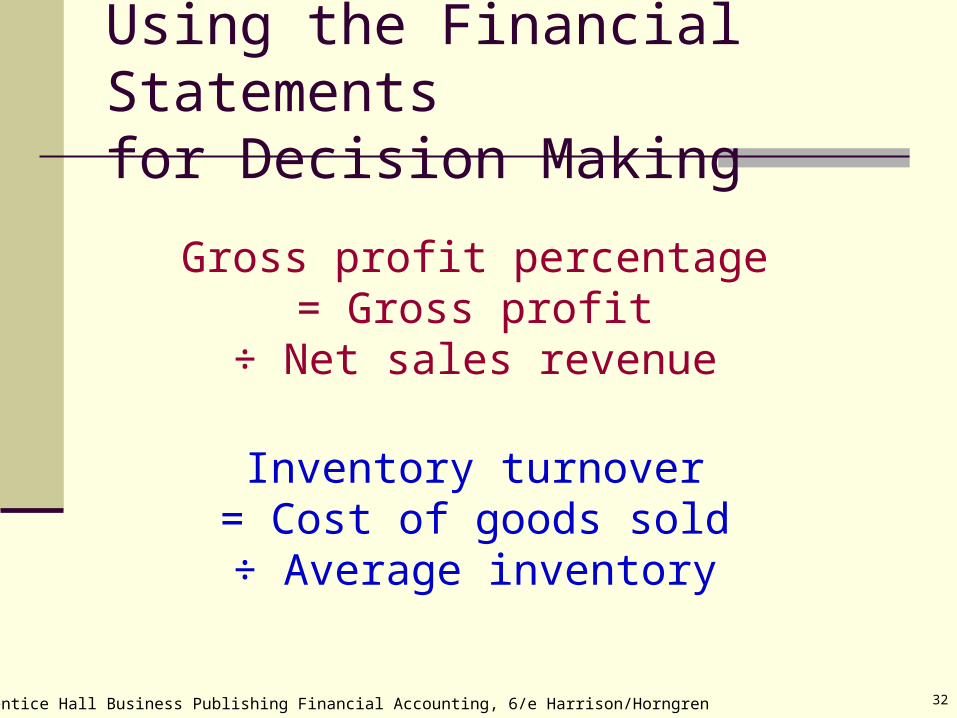
Inventory turnover= Cost of goods sold÷ Average inventory
Gross profit percentage= Gross profit
÷ Net sales revenue
Using the Financial Statementsfor Decision Making
33©2006 Prentice Hall Business Publishing Financial Accounting, 6/e Harrison/Horngren
Learning Objective 5
Estimate inventory by the gross profit method.

34©2006 Prentice Hall Business Publishing Financial Accounting, 6/e Harrison/Horngren
Estimating Inventory
Gross profit method - based on computation of cost-of-goods-sold
Beginning inventory+ Purchases= Cost of goods available for sale– Ending inventory= Cost of goods sold- Cost of goods sold= Ending inventory
35©2006 Prentice Hall Business Publishing Financial Accounting, 6/e Harrison/Horngren
Objective 6
Show how inventory errors affect cost of goods sold and income.
36©2006 Prentice Hall Business Publishing Financial Accounting, 6/e Harrison/Horngren
Effects of Inventory Errors
An error in the ending inventory creates errors for cost of goods sold and gross profit.
The current year’s ending inventory is next year’s beginning inventory.
37©2006 Prentice Hall Business Publishing Financial Accounting, 6/e Harrison/Horngren
Reporting Inventory Transactions on the Statement of Cash Flows
Inventory transactions are operating activities
The purchase of inventory requires a cash payment, and the sale a cash receipt
38©2006 Prentice Hall Business Publishing Financial Accounting, 6/e Harrison/Horngren
End of Chapter 6