Embed Size (px)
Citation preview
safety performance reportof the australian minerals industry
minerals CounCil of australia
2007 – 2008
2 | safety performanCe report of the australian minerals industry 2007–2008
2007 - 2008
introduCtion
Executive Summary 3
Vision, Beliefs and Awareness 4
Definitions 5
Introduction 7
Comparison of data from quarterly and annual reports 9
Fatalities Statistics 13
Lost Time Injury Statistics 17
Duration and Severity Rates 22
International Comparisons 23
Health Data 25
Conclusion 28
Reference Tables 29
References 40
Contents
3 | safety performanCe report of the australian minerals industry 2007–2008
2007 - 2008
The Minerals Council of Australia (MCA) represents Australia’s exploration, mining and minerals processing industry, nationally and internationally, in its contribution to sustainable development and society.
The Australian minerals industry has a vision of “An Australian minerals industry free of fatalities, injuries and diseases”.
This Report includes:
» data which primarily relates to the reporting year 1 July 2007 to 30 June 2008;
» a review of minerals industry safety performance 1998–99 to 2007–08 drawn from fatality and injury data collected by State/Territory mines inspectorates;
» an international benchmarking comparison.
Fatal Injuries In 2007-08 there were four fatalities in the Australian minerals industry. This is ten less than the 14 reported in 2006-07.
Over the past decade the Fatal Injury Frequency Rate (FIFR) has varied widely from year to year. In 2007-08 the rate was 0.01. This is below the 10-year average of 0.05.
Traditionally the underground mining sectors have recorded the highest FIFR. In 2007-08, the underground metalliferous sector recorded two fatalities, whilst underground coal record no fatalities. All sectors recorded rates either below or equal to the ten-year average FIFR for all mining..
The Northern Territory (NT) Tasmania (TAS), Victoria (VIC) and New South Wales (NSW) reported no fatalities. The FIFR has either fallen or remained constant across all States/Territories, except South Australia in 2007-08, and all States/Territories recorded an FIFR below or equal to their respective ten-year average FIFRs, except South Australia.
Lost Time Injuries Over the past decade the number of Lost Time Injuries (LTIs) has decreased consistently from year to year until 2005-06 where there was a slight increase (6 %) in LTIs on the previous year (2004-05). 2007-08 has seen a slight decrease in the number of LTI (10 %) compared to the preceding year.
The Lost Time Injury Frequency Rate (LTIFR) has decreased consistently over the past decade; however this year (5) is the same as last year (5).
By sector, the LTIFR has shown similar patterns to those seen in previous years with the underground coal sector recording the highest frequency rate.
By State, the LTIFR also followed historical trends with New South Wales recording the highest frequency rate.
exeCutive summary
The Lost Time Injury Frequency Rate (LTIFR) has decreased consistently over the past decade; however this year (5) is the same as last year (5).
By sector, the LTIFR has shown similar patterns to those seen in previous years with the underground coal sector recording the highest frequency rate.
By State, the LTIFR also followed historical trends with New South Wales recording the highest frequency rate.
By sector, the LTIFR has shown similar patterns to those seen in previous years with the underground coal sector recording the highest frequency rate.
By State, the LTIFR also followed historical trends with New South Wales recording the highest frequency rate.
By State, the LTIFR also followed historical trends with New South Wales and South Australia recording the highest rates.
International Comparisons The Australian minerals industry average FIFR for the ten-year period
1998-99 to 2007-08 was 0.05. Internationally the Australian industry
compares favourably to South Africa on this indicator, which recorded
an equivalent rate of 0.26 for this period, and the United States of
America (USA), which recorded a rate of around 0.16 for this period.
Lost time injury data are difficult to compare internationally because of
the different systems and definitions that apply. Traditionally on this
indicator the USA has outperformed Australia in metalliferous and coal
sectors. However for the past few years the Australian minerals industry
performance appears to be better than or comparable to the USA.
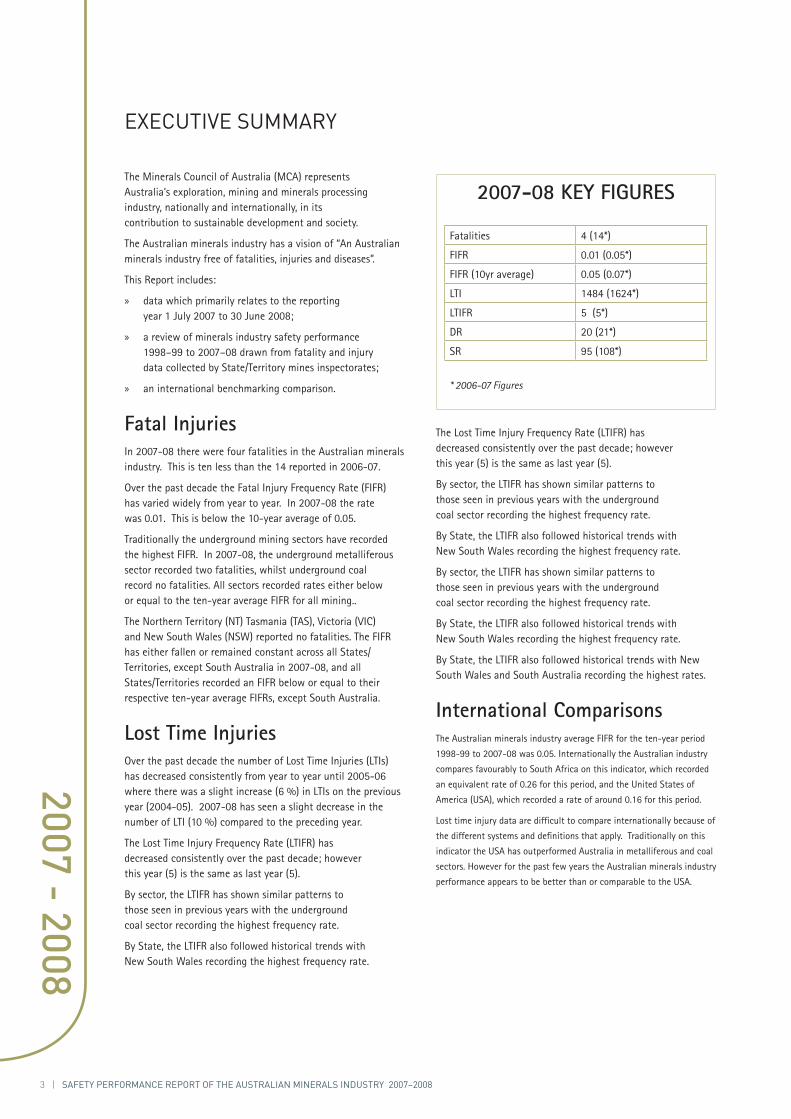
2007-08 KEY FIGURES
Fatalities 4 (14*)
FIFR 0.01 (0.05*)
FIFR (10yr average) 0.05 (0.07*)
LTI 1484 (1624*)
LTIFR 5 (5*)
DR 20 (21*)
SR 95 (108*)
* 2006-07 Figures
4 | safety performanCe report of the australian minerals industry 2007–2008
2007 - 2008
introduCtion
Vision » An Australian minerals industry free of
fatalities, injuries and diseases.
Beliefs » All fatalities, injuries and diseases are preventable.
» No task is so important that it cannot be done safely.
» All hazards can be identified and their risks managed.
» Everyone has a personal responsibility for the safety and health of themselves and others.
» Safety and health performance can always improve.
Awareness
The state of mind where we are constantly aware of the possibility of injury and act accordingly at all times.
vision, Beliefs and aWareness
5 | safety performanCe report of the australian minerals industry 2007–2008
2007 - 2008
Injury DefinitionsFatal Injury – (F)An injury that results in death.
Lost Time Injury – (LTI)An injury that results in a minimum of one full shift’s absence (AS1885.1 – 1990).
Disabling Injury - (DI) or Restricted Work Injury - (RWI)Injuries resulting in that person not returning to his/her complete range of normal duties
Medical Treatment Injury – (MTI)An injury requiring medical treatment
Total Recordable Injury – (TRI)= LTI +DI/RWI + MTI
Severe Injury – (SI) An injury that results in a minimum of two weeks off work. This definition is used by South Africa as an injury measure.
Rate DefinitionsThe performance of the minerals industry is measured as a rate, allowing for the comparison of different sectors or years on a comparable basis.
Incidence Rate – (IR)The number of fatalities or injuries per 1000 employees. This rate is calculated using the following formula:
(number of occupational fatalities or injuries) x (1000)
(number of employees)
Frequency Rate – (FR)The number of occupational fatalities or injuries expressed as a rate per million hours worked. This rate is calculated using the following formula:
(number of occupational fatalities or injuries) x (1,000,000)
(number of hours worked)
Fatal Injury Frequency Rate – (FIFR)The number of fatal injuries per one million hours worked.
Lost Time Injury Frequency Rate – (LTIFR)The number of lost time injuries per one million hours worked.
definitions
Duration Rate – (DR)The average time lost for every lost time injury. This is a measure of the severity of the injuries occurring. This rate is calculated using the following formula:
(total number of days lost)
(number of lost time injuries)
Severity Rate – (SR)The average number of days lost per one million hours worked.
(number of days lost) x (1,000,000)
(number of hours worked)
Number of Hours WorkedThe total number of hours worked by employees in the recording unit during the recording period.
6 | safety performanCe report of the australian minerals industry 2007–2008
2007 - 2008
introduCtion
ABS Australian Bureau of Statistics
ASCC Australian Safety and Compensation Council
DI Disabling Injury
DR Duration Rate - see definitions
F Fatal Injury - see definitions
FIFR Fatal Injury Frequency Rate - see definitions
FR Frequency Rate - see definitions
IR Incidence Rate - see definitions
LTI Lost Time Injury - see definitions
LTIFR Lost Time Injury Frequency Rate - see definitions
MCA Minerals Council of Australia
MINEX National Minerals Industry Excellence Awards for Safety and Health
MTI Medical Treatment Injury
RWI Restricted Work Injury
SI Severe Injury - see definitions
SR Severity Rate - see definitions
TRI Total Recordable Injury
US United States of America
aBBreviations
7 | safety performanCe report of the australian minerals industry 2007–2008
2007 - 2008
introduCtion
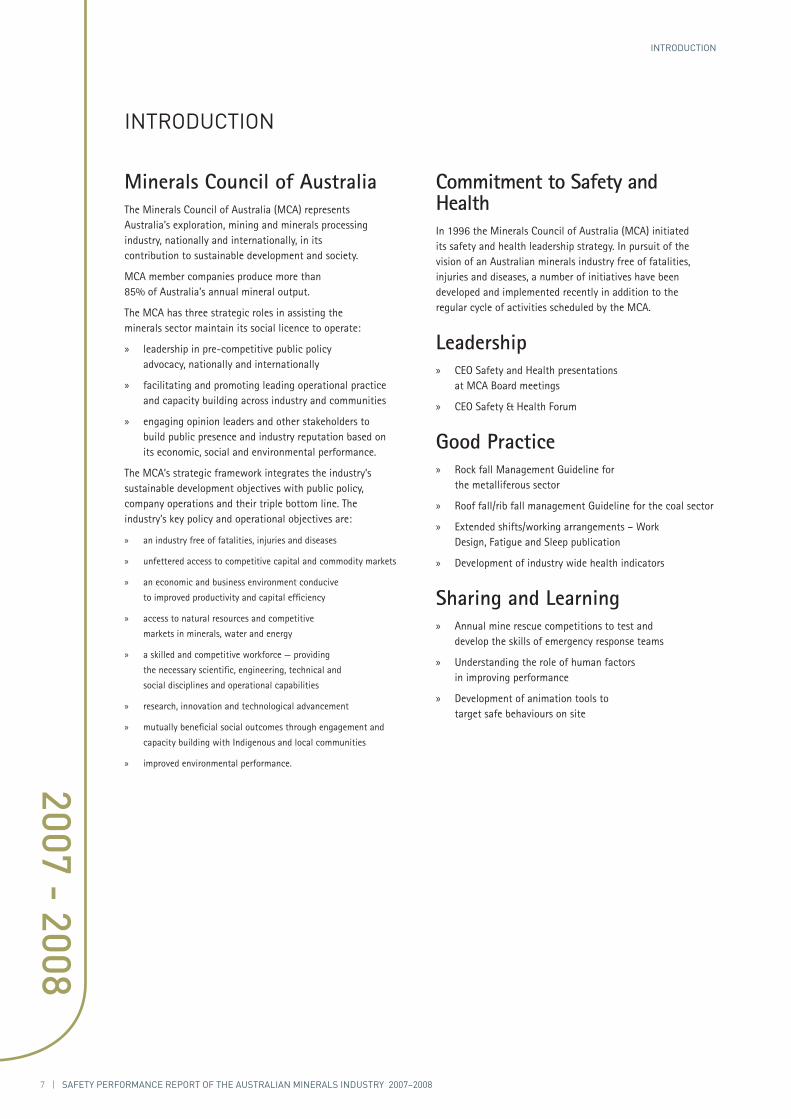
Minerals Council of AustraliaThe Minerals Council of Australia (MCA) represents Australia’s exploration, mining and minerals processing industry, nationally and internationally, in its contribution to sustainable development and society.
MCA member companies produce more than 85% of Australia’s annual mineral output.
The MCA has three strategic roles in assisting the minerals sector maintain its social licence to operate:
» leadership in pre-competitive public policy advocacy, nationally and internationally
» facilitating and promoting leading operational practice and capacity building across industry and communities
» engaging opinion leaders and other stakeholders to build public presence and industry reputation based on its economic, social and environmental performance.
The MCA’s strategic framework integrates the industry’s sustainable development objectives with public policy, company operations and their triple bottom line. The industry’s key policy and operational objectives are:
» an industry free of fatalities, injuries and diseases
» unfettered access to competitive capital and commodity markets
» an economic and business environment conducive
to improved productivity and capital efficiency
» access to natural resources and competitive
markets in minerals, water and energy
» a skilled and competitive workforce — providing
the necessary scientific, engineering, technical and
social disciplines and operational capabilities
» research, innovation and technological advancement
» mutually beneficial social outcomes through engagement and
capacity building with Indigenous and local communities
» improved environmental performance.
introduCtion
Commitment to Safety and HealthIn 1996 the Minerals Council of Australia (MCA) initiated its safety and health leadership strategy. In pursuit of the vision of an Australian minerals industry free of fatalities, injuries and diseases, a number of initiatives have been developed and implemented recently in addition to the regular cycle of activities scheduled by the MCA.
Leadership » CEO Safety and Health presentations
at MCA Board meetings
» CEO Safety & Health Forum
Good Practice » Rock fall Management Guideline for
the metalliferous sector
» Roof fall/rib fall management Guideline for the coal sector
» Extended shifts/working arrangements – Work Design, Fatigue and Sleep publication
» Development of industry wide health indicators
Sharing and Learning » Annual mine rescue competitions to test and
develop the skills of emergency response teams
» Understanding the role of human factors in improving performance
» Development of animation tools to target safe behaviours on site
8 | safety performanCe report of the australian minerals industry 2007–2008
2007 - 2008
introduCtion
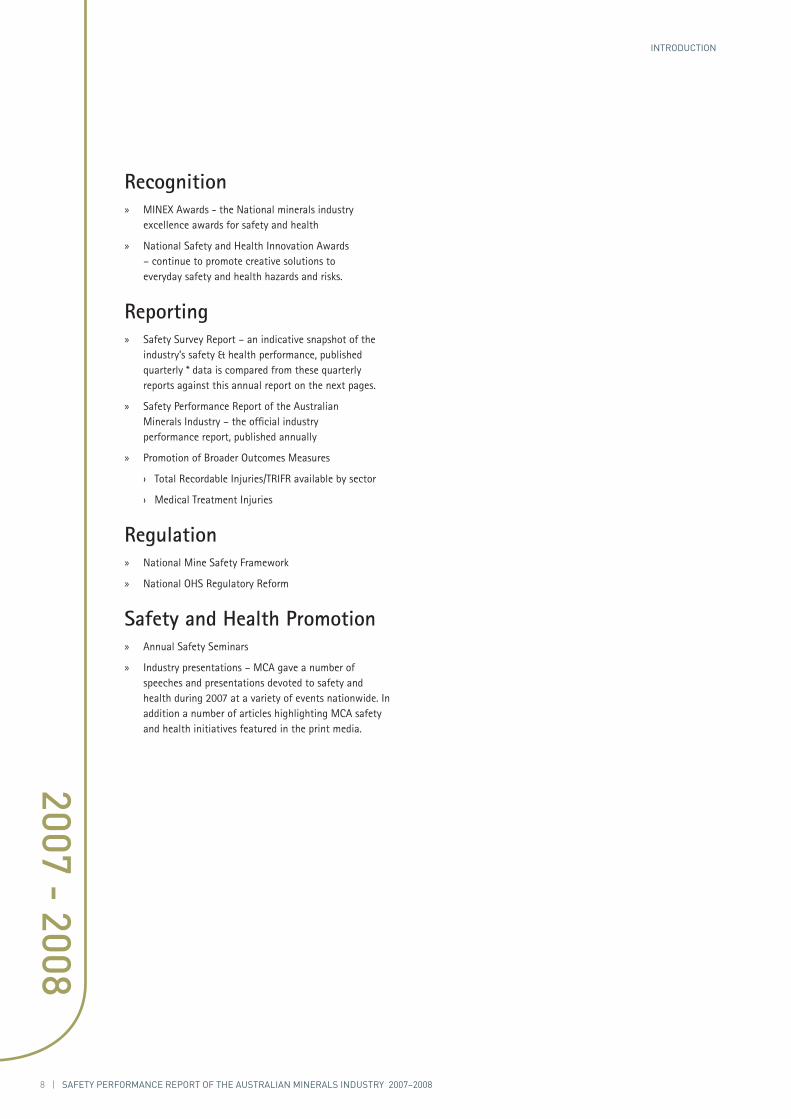
Recognition » MINEX Awards - the National minerals industry
excellence awards for safety and health
» National Safety and Health Innovation Awards – continue to promote creative solutions to everyday safety and health hazards and risks.
Reporting » Safety Survey Report – an indicative snapshot of the
industry’s safety & health performance, published quarterly * data is compared from these quarterly reports against this annual report on the next pages.
» Safety Performance Report of the Australian Minerals Industry – the official industry performance report, published annually
» Promotion of Broader Outcomes Measures
› Total Recordable Injuries/TRIFR available by sector
› Medical Treatment Injuries
Regulation » National Mine Safety Framework
» National OHS Regulatory Reform
Safety and Health Promotion » Annual Safety Seminars
» Industry presentations – MCA gave a number of speeches and presentations devoted to safety and health during 2007 at a variety of events nationwide. In addition a number of articles highlighting MCA safety and health initiatives featured in the print media.
9 | safety performanCe report of the australian minerals industry 2007–2008
2007 - 2008
introduCtion
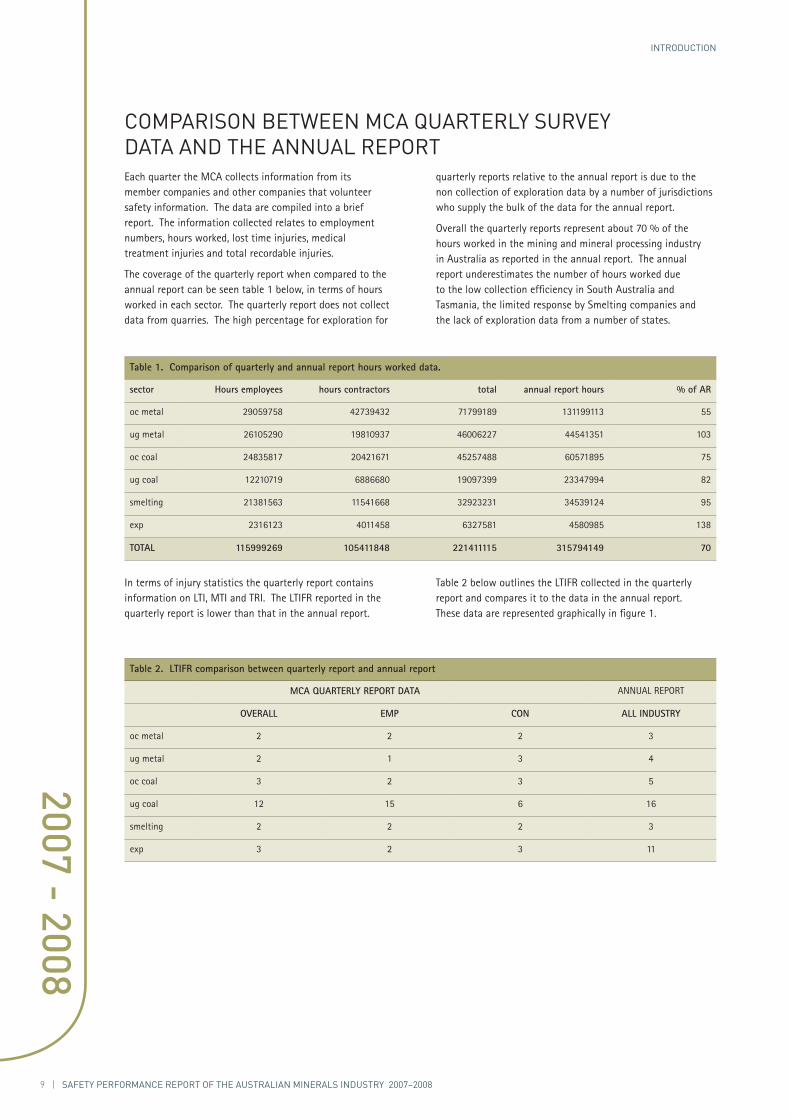
Each quarter the MCA collects information from its member companies and other companies that volunteer safety information. The data are compiled into a brief report. The information collected relates to employment numbers, hours worked, lost time injuries, medical treatment injuries and total recordable injuries.
The coverage of the quarterly report when compared to the annual report can be seen table 1 below, in terms of hours worked in each sector. The quarterly report does not collect data from quarries. The high percentage for exploration for
In terms of injury statistics the quarterly report contains information on LTI, MTI and TRI. The LTIFR reported in the quarterly report is lower than that in the annual report.
Comparison BetWeen mCa quarterly survey data and the annual report
quarterly reports relative to the annual report is due to the non collection of exploration data by a number of jurisdictions who supply the bulk of the data for the annual report.
Overall the quarterly reports represent about 70 % of the hours worked in the mining and mineral processing industry in Australia as reported in the annual report. The annual report underestimates the number of hours worked due to the low collection efficiency in South Australia and Tasmania, the limited response by Smelting companies and the lack of exploration data from a number of states.
Table 2 below outlines the LTIFR collected in the quarterly report and compares it to the data in the annual report. These data are represented graphically in figure 1.
Table 1. Comparison of quarterly and annual report hours worked data.
sector Hours employees hours contractors total annual report hours % of AR
oc metal 29059758 42739432 71799189 131199113 55
ug metal 26105290 19810937 46006227 44541351 103
oc coal 24835817 20421671 45257488 60571895 75
ug coal 12210719 6886680 19097399 23347994 82
smelting 21381563 11541668 32923231 34539124 95
exp 2316123 4011458 6327581 4580985 138
TOTAL 115999269 105411848 221411115 315794149 70
Table 2. LTIFR comparison between quarterly report and annual report
MCA QUARTERLY REPORT DATA ANNUAL REPORT
OVERALL EMP CON ALL INDUSTRY
oc metal 2 2 2 3
ug metal 2 1 3 4
oc coal 3 2 3 5
ug coal 12 15 6 16
smelting 2 2 2 3
exp 3 2 3 11
10 | safety performanCe report of the australian minerals industry 2007–2008
2007 - 2008
introduCtion
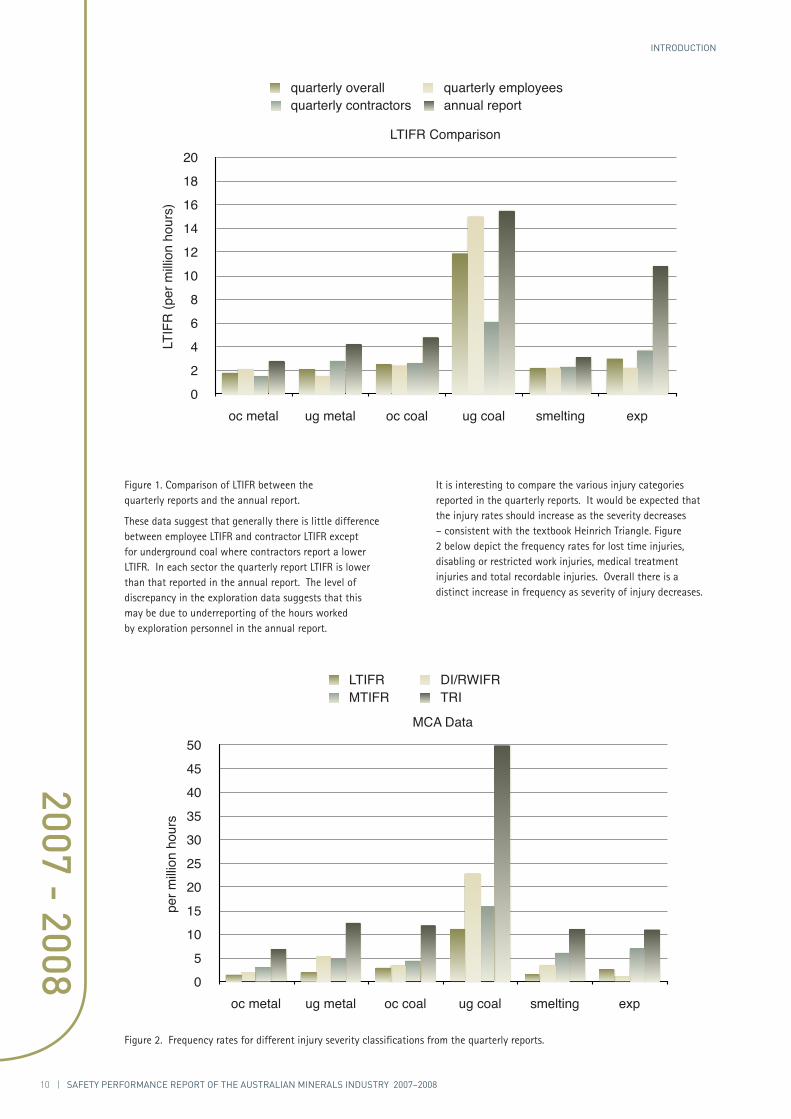
Figure 1. Comparison of LTIFR between the quarterly reports and the annual report.
These data suggest that generally there is little difference between employee LTIFR and contractor LTIFR except for underground coal where contractors report a lower LTIFR. In each sector the quarterly report LTIFR is lower than that reported in the annual report. The level of discrepancy in the exploration data suggests that this may be due to underreporting of the hours worked by exploration personnel in the annual report.
It is interesting to compare the various injury categories reported in the quarterly reports. It would be expected that the injury rates should increase as the severity decreases – consistent with the textbook Heinrich Triangle. Figure 2 below depict the frequency rates for lost time injuries, disabling or restricted work injuries, medical treatment injuries and total recordable injuries. Overall there is a distinct increase in frequency as severity of injury decreases.
LTIFR DI/RWIFRMTIFR TRI
05
101520253035404550
oc metal ug metal oc coal ug coal smelting exp
MCA Data
per m
illion
hou
rs
quarterly overall quarterly employeesquarterly contractors annual report
02468
101214161820
oc metal ug metal oc coal ug coal smelting exp
LTIFR Comparison
LTIF
R (p
er m
illion
hou
rs)
Figure 2. Frequency rates for different injury severity classifications from the quarterly reports.
11 | safety performanCe report of the australian minerals industry 2007–2008
2007 - 2008
introduCtion
This Report used data collected through the State/Territory mines inspectorates (usually located in a mining department), except in South Australia and Tasmania where data were collected from individual mining and mineral processing companies.
This data has limitations as detailed below, but does provide a comprehensive picture of the minerals industry’s safety performance.
The sources of international data included in this Report are also described below.
Mines inspectorate data – parameters and limitations
This data is supplied to inspectorates directly by mines. In most States/Territories reporting is a mandatory requirement of mining safety and health regulation.
In the New South Wales coal industry, data is collected by Coal Services Pty Ltd through the industry coal mines insurance scheme. All compensatable injuries and disease are captured in this system. Companies supply denominator data (numbers of employees and hours worked) to Coal Services on a quarterly basis. In recent years Coal Services were not able to provide the number of days lost due to LTI so this has been estimated based upon previous years data compared with the number of LTIs. This approximation has also been applied to other data supplied in this format.
Some inconsistencies are present in the data. The various State/Territory inspectorates have different jurisdictional scopes and, as a result, each has a unique definition of what constitutes the minerals industry.
Some States/Territories include smelters/refineries, extractive industries and exploration activities within their scope. In other States/ Territories these activities may be completely or partially excluded. In some cases where a mine and a smelter occupy the same lease the data are reported together as the mine. In Tasmania and South Australia there is no central collection of information. Information for mines and mineral processing plants in these states was obtained through direct contact.
For the purposes of this Report, data has been collected in a way that permits separation into the identified minerals sectors, and in most cases State inspectorates were able to provide data in a manner consistent with guidelines supplied by the MCA.
The only difficulty relates to the smelting/refinery sector where Queensland, New South Wales, Victoria and Northern Territory do not include such data with their returns. Consequently, smelting/refinery data were gathered directly by the MCA from individual companies. Unfortunately a number of major smelter companies did not supply information to the MCA.
In summary, the limitations of data contained in this Report from the State mining inspectorates include:
aBout the data used in this report 2007–08
» reliance on mines submitting accurate data
» variations in coverage by inspectorates of minerals sectors in each State/Territory
» exclusion of disease cases.
Special Note: Tasmanian, New South Wales, South Australian and Queensland exploration data was not available at the time of publishing.
About the International Statistics
When reporting international accident statistics, there are limited data readily available for direct comparisons and benchmarking. The injury data is often presented using different criteria, depending on each country’s legislative reporting requirements. Consequently, some of the data used in this section has been adjusted to provide a comparison of performance.
This Report compares injury rates for three countries. It is important to recognise that the statistical data have some differences due to variations in the definition of injury, country culture and degree of reporting.
These variables are difficult, if not impossible, to take into account. Therefore, the data presented is assumed to be of equivalent quality, but care should be exercised when making direct comparisons or drawing any conclusions. Nonetheless, the analysis below should provide a reasonable indication of the relative qualitative safety performance of the countries concerned.
The US data is reported annually by the US Mine Safety and Health Administration. The US injury data for open-cut and underground mining are for production mining, which excludes office and support workers.
The South African injury data has been obtained from information courtesy of the South African Department of Minerals and Energy.
Ontario, Canada, injury data has been collected from the Ontario Mines and Aggregates Safety and Health Association (MASHA). Ontario does not have a coal mining industry, hence only comparisons to metalliferous sectors are possible. Data from the calendar year 2007 is the latest available from MASHA.
The qualitative comparison refers to averages when comparing fatality rates. As the number of fatalities is a relatively small figure and can fluctuate significantly, particularly in the case of a multiple fatality incident, it is thought that an average taken over a number of years provides a better basis for comparison. However, the years over which the average is taken varies due to different data availability in each country. For example, while South African data are available over 1989 to 2006, Ontario data are only available for the past seven years.
12 | safety performanCe report of the australian minerals industry 2007–2008
2007 - 2008
introduCtion
Provided below are links to organisational and government Australia websites that provide information and data on mining-related health and safety activities in Australia and overseas.
Minerals Council of Australia
www.minerals.org.au
Safework Australia
www.safeworkaustralia.gov.au
Minerals Industry Safety and Health Centre
www.mishc.uq.edu.au
Queensland Mines and Energy , Department of Employment, Economic Development and Innovation
www.dme.qld.gov.au
NSW Department of Industry and Innovation
www.dpi..nsw.gov.au/minerals/safety
Western Australia Department of Mines and Petroleum
www.dmp.wa.gov.au
US – Mines Safety and Health Administration
www.msha.gov
South Africa – South African Chamber of Minerals and Energy
www.dme.gov.za
Canada – Ontario Mining Association
www.oma.on.ca
Mining and Aggregates Safety and Health Association
www.masha.on.ca
UK – Health and Safety Executive
www.hse.gov.uk
New Zealand – Department of Labour
www.dol.govt.nz.
links
13 | safety performanCe report of the australian minerals industry 2007–2008
2007 - 2008
fatality statistiCs
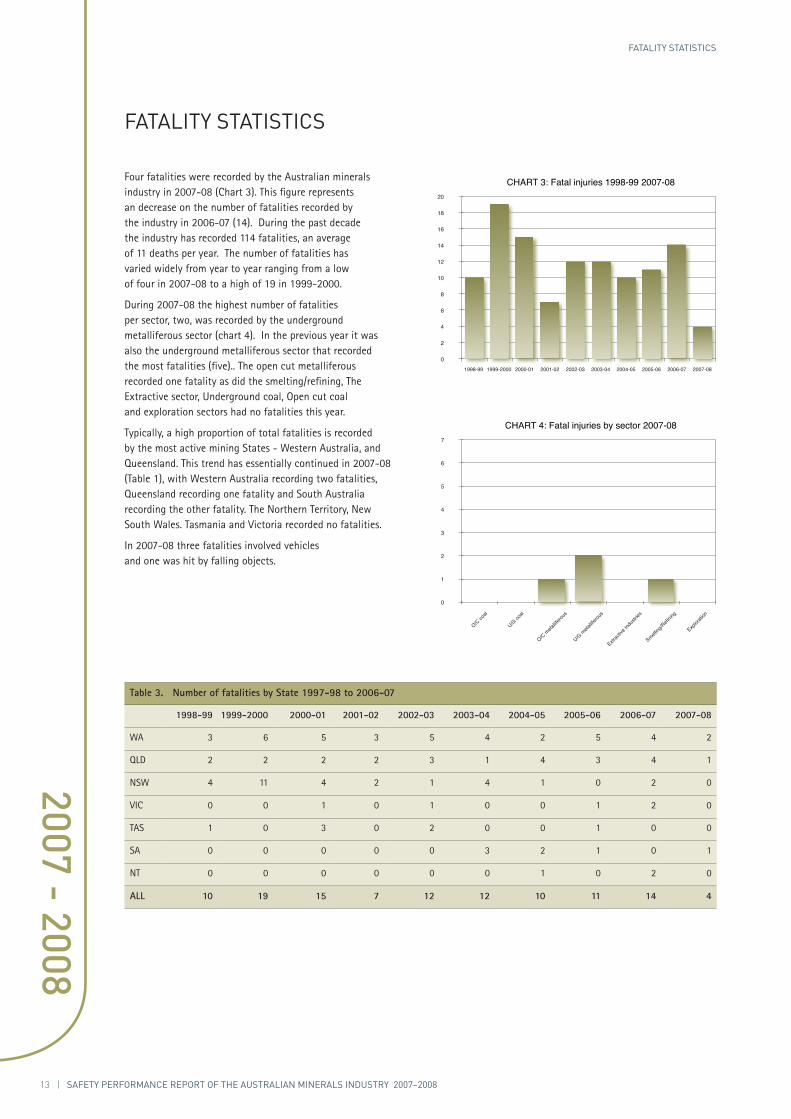
Four fatalities were recorded by the Australian minerals industry in 2007-08 (Chart 3). This figure represents an decrease on the number of fatalities recorded by the industry in 2006-07 (14). During the past decade the industry has recorded 114 fatalities, an average of 11 deaths per year. The number of fatalities has varied widely from year to year ranging from a low of four in 2007-08 to a high of 19 in 1999-2000.
During 2007-08 the highest number of fatalities per sector, two, was recorded by the underground metalliferous sector (chart 4). In the previous year it was also the underground metalliferous sector that recorded the most fatalities (five).. The open cut metalliferous recorded one fatality as did the smelting/refining, The Extractive sector, Underground coal, Open cut coal and exploration sectors had no fatalities this year.
Typically, a high proportion of total fatalities is recorded by the most active mining States - Western Australia, and Queensland. This trend has essentially continued in 2007-08 (Table 1), with Western Australia recording two fatalities, Queensland recording one fatality and South Australia recording the other fatality. The Northern Territory, New South Wales. Tasmania and Victoria recorded no fatalities.
In 2007-08 three fatalities involved vehicles and one was hit by falling objects.
fatality statistiCs
Table 3. Number of fatalities by State 1997-98 to 2006-07
1998-99 1999-2000 2000-01 2001-02 2002-03 2003-04 2004-05 2005-06 2006-07 2007-08
WA 3 6 5 3 5 4 2 5 4 2
QLD 2 2 2 2 3 1 4 3 4 1
NSW 4 11 4 2 1 4 1 0 2 0
VIC 0 0 1 0 1 0 0 1 2 0
TAS 1 0 3 0 2 0 0 1 0 0
SA 0 0 0 0 0 3 2 1 0 1
NT 0 0 0 0 0 0 1 0 2 0
ALL 10 19 15 7 12 12 10 11 14 4
0
2
4
6
8
10
12
14
16
18
20
1998-99 1999-2000 2000-01 2001-02 2002-03 2003-04 2004-05 2005-06 2006-07 2007-08
CHART 3: Fatal injuries 1998-99 2007-08
0
1
2
3
4
5
6
7
O/C coal
U/G co
al
O/C meta
lliferou
s
U/G m
etallife
rous
Extrac
tive in
dustr
ies
Smelting
/Refinin
g
Explor
ation
CHART 4: Fatal injuries by sector 2007-08
14 | safety performanCe report of the australian minerals industry 2007–2008
2007 - 2008
Fatality Incidence Rate (FIR) In 2007-08 the national minerals industry fatality incidence rate (FIR – fatalities per 1,000 employees) was 0.03, lowerer than recorded in 2006-07 (0.10).
By sector, the FIR ranged from a high of 0.09 recorded by the underground metalliferous sector, to a low of zero recorded by surface coal , underground coal sector, exploration and extractives sectors. The open cut metalliferous sector recorded a rate of 0.02, and smelting and refining 0.05.
By State, the highest FIR was recorded in South Australia (0.22), followed by Western Australia (0.03), and Queensland (0.02).. Victoria, New South Wales, Northern Territory and Tasmania recorded an FIR of zero.
Fatal Injury Frequency Rate (FIFR) The risk of fatalities is measured by the Fatal Injury Frequency Rate (FIFR − the number of fatal injuries per one million hours worked).
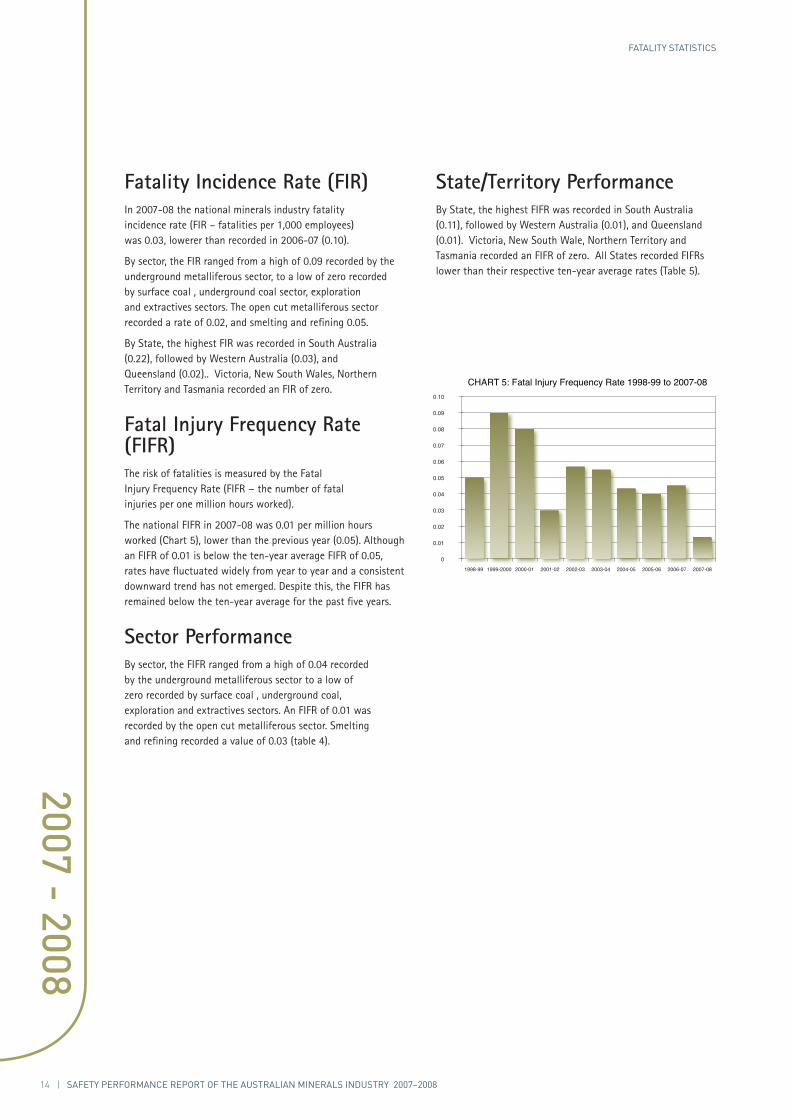
The national FIFR in 2007-08 was 0.01 per million hours worked (Chart 5), lower than the previous year (0.05). Although an FIFR of 0.01 is below the ten-year average FIFR of 0.05, rates have fluctuated widely from year to year and a consistent downward trend has not emerged. Despite this, the FIFR has remained below the ten-year average for the past five years.
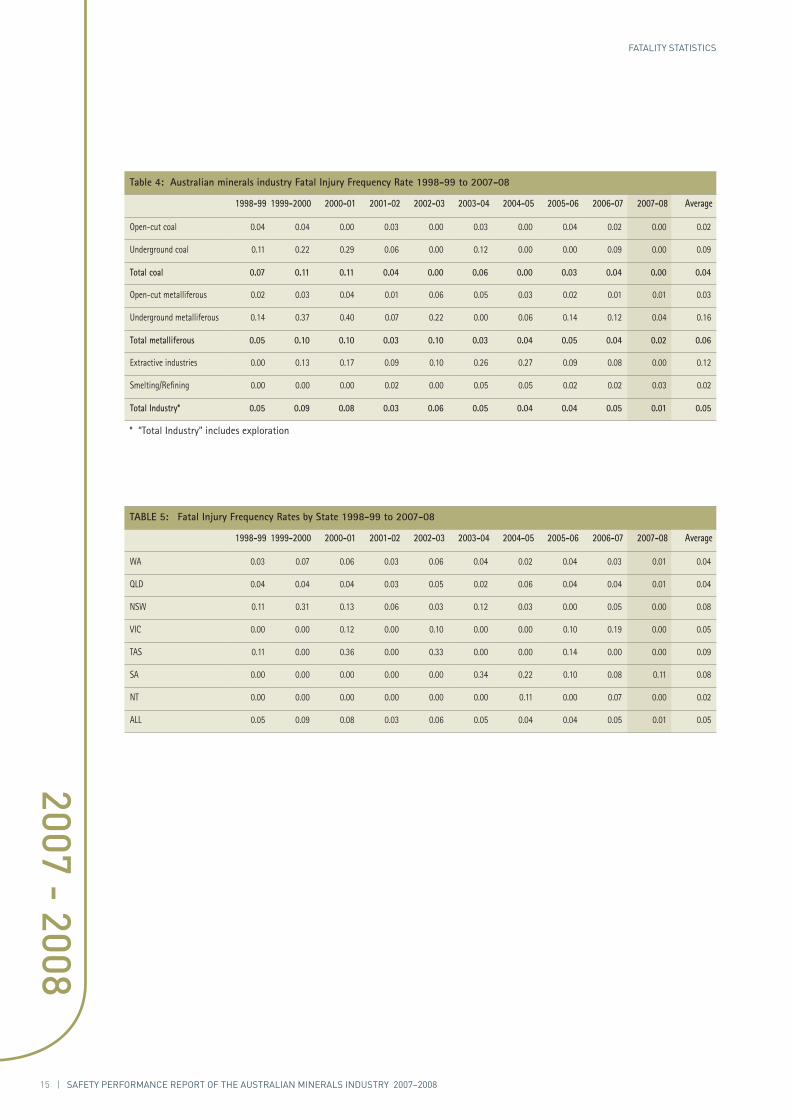
Sector Performance By sector, the FIFR ranged from a high of 0.04 recorded by the underground metalliferous sector to a low of zero recorded by surface coal , underground coal, exploration and extractives sectors. An FIFR of 0.01 was recorded by the open cut metalliferous sector. Smelting and refining recorded a value of 0.03 (table 4).
fatality statistiCs
State/Territory Performance By State, the highest FIFR was recorded in South Australia (0.11), followed by Western Australia (0.01), and Queensland (0.01). Victoria, New South Wale, Northern Territory and Tasmania recorded an FIFR of zero. All States recorded FIFRs lower than their respective ten-year average rates (Table 5).
0
0.01
0.02
0.03
0.04
0.05
0.06
0.07
0.08
0.09
0.10
1998-99 1999-2000 2000-01 2001-02 2002-03 2003-04 2004-05 2005-06 2006-07 2007-08
CHART 5: Fatal Injury Frequency Rate 1998-99 to 2007-08
15 | safety performanCe report of the australian minerals industry 2007–2008
2007 - 2008
fatality statistiCs
Table 4: Australian minerals industry Fatal Injury Frequency Rate 1998-99 to 2007-08
1998-99 1999-2000 2000-01 2001-02 2002-03 2003-04 2004-05 2005-06 2006-07 2007-08 Average
Open-cut coal 0.04 0.04 0.00 0.03 0.00 0.03 0.00 0.04 0.02 0.00 0.02
Underground coal 0.11 0.22 0.29 0.06 0.00 0.12 0.00 0.00 0.09 0.00 0.09
Total coal 0.07 0.11 0.11 0.04 0.00 0.06 0.00 0.03 0.04 0.00 0.04
Open-cut metalliferous 0.02 0.03 0.04 0.01 0.06 0.05 0.03 0.02 0.01 0.01 0.03
Underground metalliferous 0.14 0.37 0.40 0.07 0.22 0.00 0.06 0.14 0.12 0.04 0.16
Total metalliferous 0.05 0.10 0.10 0.03 0.10 0.03 0.04 0.05 0.04 0.02 0.06
Extractive industries 0.00 0.13 0.17 0.09 0.10 0.26 0.27 0.09 0.08 0.00 0.12
Smelting/Refining 0.00 0.00 0.00 0.02 0.00 0.05 0.05 0.02 0.02 0.03 0.02
Total Industry* 0.05 0.09 0.08 0.03 0.06 0.05 0.04 0.04 0.05 0.01 0.05
* “Total Industry” includes exploration
TABLE 5: Fatal Injury Frequency Rates by State 1998-99 to 2007-08
1998-99 1999-2000 2000-01 2001-02 2002-03 2003-04 2004-05 2005-06 2006-07 2007-08 Average
WA 0.03 0.07 0.06 0.03 0.06 0.04 0.02 0.04 0.03 0.01 0.04
QLD 0.04 0.04 0.04 0.03 0.05 0.02 0.06 0.04 0.04 0.01 0.04
NSW 0.11 0.31 0.13 0.06 0.03 0.12 0.03 0.00 0.05 0.00 0.08
VIC 0.00 0.00 0.12 0.00 0.10 0.00 0.00 0.10 0.19 0.00 0.05
TAS 0.11 0.00 0.36 0.00 0.33 0.00 0.00 0.14 0.00 0.00 0.09
SA 0.00 0.00 0.00 0.00 0.00 0.34 0.22 0.10 0.08 0.11 0.08
NT 0.00 0.00 0.00 0.00 0.00 0.00 0.11 0.00 0.07 0.00 0.02
ALL 0.05 0.09 0.08 0.03 0.06 0.05 0.04 0.04 0.05 0.01 0.05
16 | safety performanCe report of the australian minerals industry 2007–2008
2007 - 2008
fatality statistiCs
Below in chronological order from 1 July 2007 is a description of the fatality, where it occurred and in what sector.
Western Australia
UNDERGROUND METALLIFEROUS – 30 August 2007
A contract miner was fatally injured when the bogger he was operating overturned on level 365 of the mine. The incident occurred at 8.30am, and it is understood the incident occurred during backfilling of a stope.
South Australia
SMELTING – 12 December2007
A maintenance worker was seriously injured when struck by a falling object early in the afternoon during maintenance work at the smelter. He was taken immediately to the Roxby Downs Medical Centre but died soon afterwards.
Queensland
UNDERGROUND METALLIFEROUS – 17 January 2008
It appears that a contractor was unloading equipment from one vehicle to another when one vehicle was moved closer to the other. The contractor was and was caught between two vehicles.
Western Australia
OPEN CUT METALLIFEROUS - 25 June 2008
A 61-year-old dump truck driver was critically injured when his truck crashed into a stationary dozer. On impact, the dozer’s ripper arm pierced the truck, trapping the truck driver in the cabin. The driver was taken to Meekatharra hospital and later airlifted by the Royal Flying Doctor Service to Perth, but subsequently died from his injuries.
desCription of fatalities
17 | safety performanCe report of the australian minerals industry 2007–2008
2007 - 2008
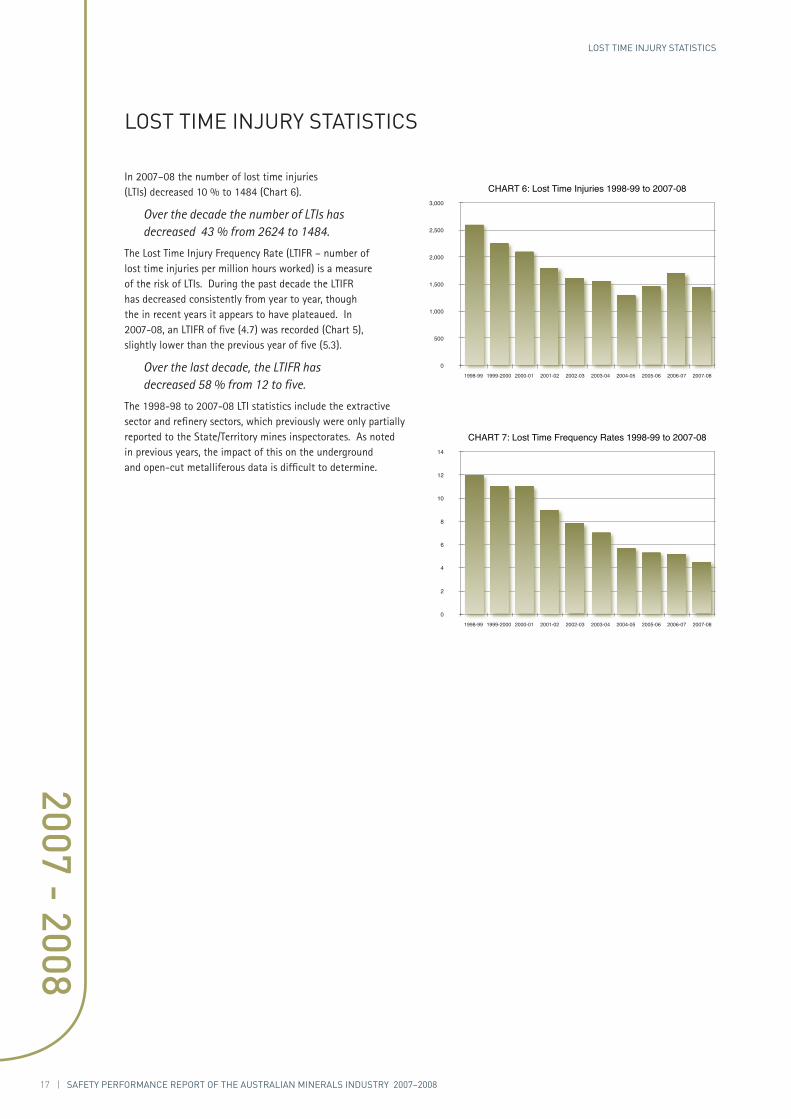
In 2007–08 the number of lost time injuries (LTIs) decreased 10 % to 1484 (Chart 6).
Over the decade the number of LTIs has decreased 43 % from 2624 to 1484.
The Lost Time Injury Frequency Rate (LTIFR – number of lost time injuries per million hours worked) is a measure of the risk of LTIs. During the past decade the LTIFR has decreased consistently from year to year, though the in recent years it appears to have plateaued. In 2007-08, an LTIFR of five (4.7) was recorded (Chart 5), slightly lower than the previous year of five (5.3).
Over the last decade, the LTIFR has decreased 58 % from 12 to five.
The 1998-98 to 2007-08 LTI statistics include the extractive sector and refinery sectors, which previously were only partially reported to the State/Territory mines inspectorates. As noted in previous years, the impact of this on the underground and open-cut metalliferous data is difficult to determine.
lost time inJury statistiCs
lost time inJury statistiCs
0
500
1,000
1,500
2,000
2,500
3,000
1998-99 1999-2000 2000-01 2001-02 2002-03 2003-04 2004-05 2005-06 2006-07 2007-08
CHART 6: Lost Time Injuries 1998-99 to 2007-08
0
2
4
6
8
10
12
14
1998-99 1999-2000 2000-01 2001-02 2002-03 2003-04 2004-05 2005-06 2006-07 2007-08
CHART 7: Lost Time Frequency Rates 1998-99 to 2007-08
18 | safety performanCe report of the australian minerals industry 2007–2008
2007 - 2008
lost time inJury statistiCs
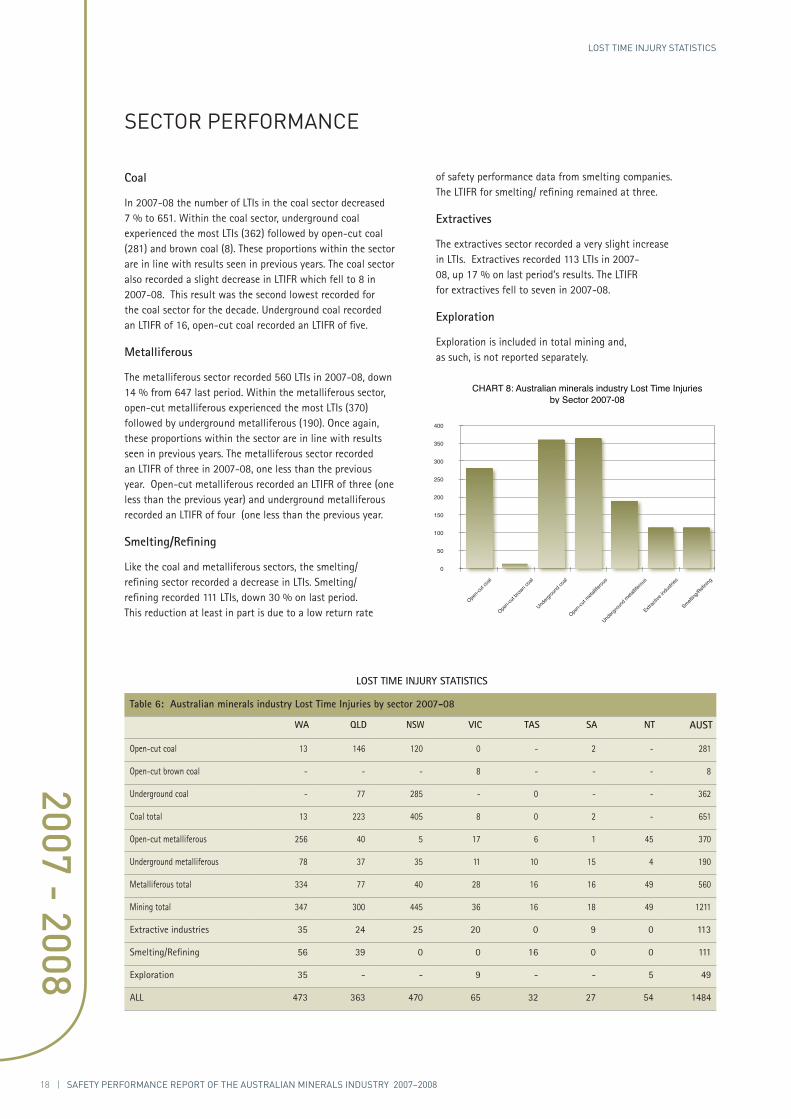
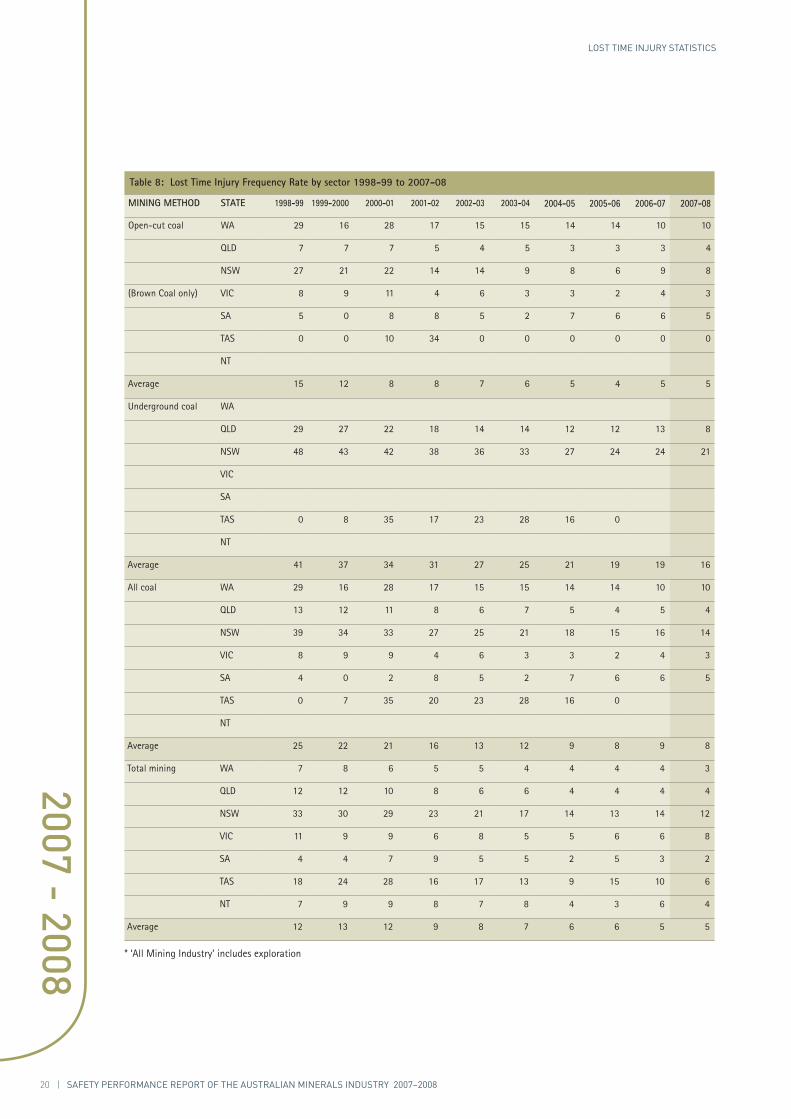
Coal
In 2007-08 the number of LTIs in the coal sector decreased 7 % to 651. Within the coal sector, underground coal experienced the most LTIs (362) followed by open-cut coal (281) and brown coal (8). These proportions within the sector are in line with results seen in previous years. The coal sector also recorded a slight decrease in LTIFR which fell to 8 in 2007-08. This result was the second lowest recorded for the coal sector for the decade. Underground coal recorded an LTIFR of 16, open-cut coal recorded an LTIFR of five.
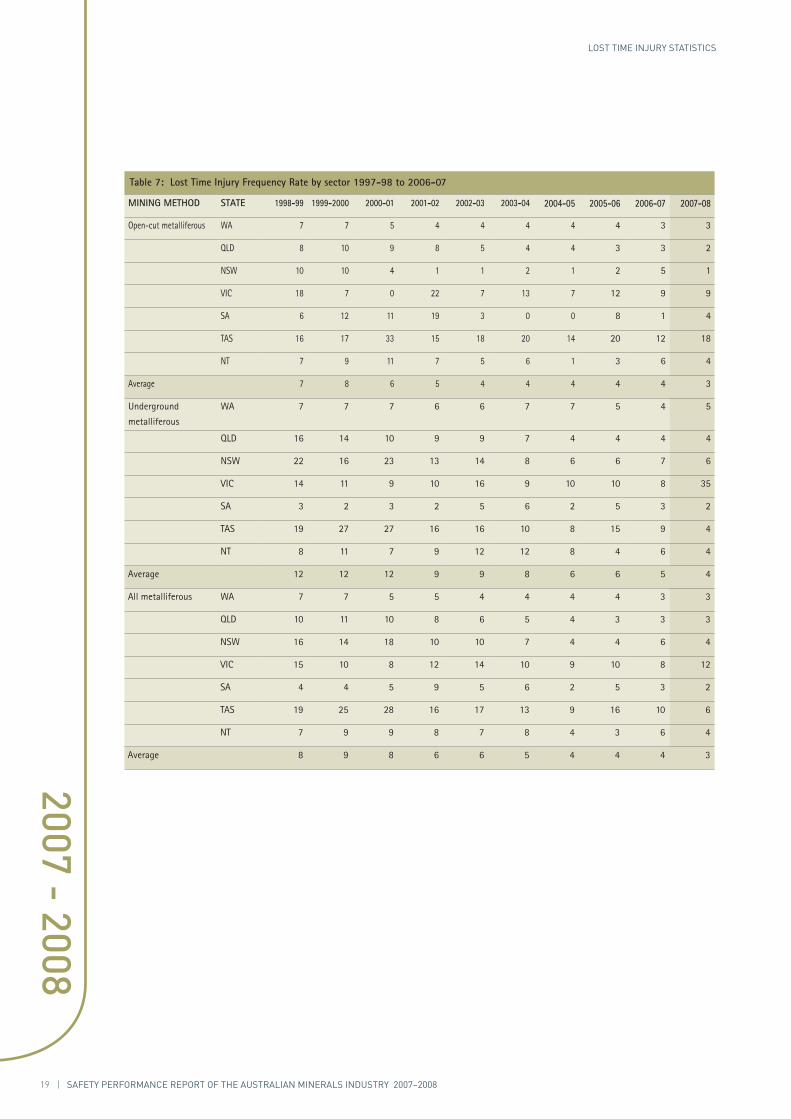
Metalliferous
The metalliferous sector recorded 560 LTIs in 2007-08, down 14 % from 647 last period. Within the metalliferous sector, open-cut metalliferous experienced the most LTIs (370) followed by underground metalliferous (190). Once again, these proportions within the sector are in line with results seen in previous years. The metalliferous sector recorded an LTIFR of three in 2007-08, one less than the previous year. Open-cut metalliferous recorded an LTIFR of three (one less than the previous year) and underground metalliferous recorded an LTIFR of four (one less than the previous year.
Smelting/Refining
Like the coal and metalliferous sectors, the smelting/refining sector recorded a decrease in LTIs. Smelting/refining recorded 111 LTIs, down 30 % on last period. This reduction at least in part is due to a low return rate
seCtor performanCe
of safety performance data from smelting companies. The LTIFR for smelting/ refining remained at three.
Extractives
The extractives sector recorded a very slight increase in LTIs. Extractives recorded 113 LTIs in 2007-08, up 17 % on last period’s results. The LTIFR for extractives fell to seven in 2007-08.
Exploration
Exploration is included in total mining and, as such, is not reported separately.
0
50
100
150
200
250
300
350
400
Open-c
ut co
al
Open-c
ut bro
wn coa
l
Underg
round
coal
Open-c
ut meta
lliferou
s
Underg
round
meta
lliferou
s
Extrac
tive in
dustr
ies
Smelting
/Refinin
g
CHART 8: Australian minerals industry Lost Time Injuries by Sector 2007-08
LOST TIME INJURY STATISTICS
Table 6: Australian minerals industry Lost Time Injuries by sector 2007-08
WA QLD NSW VIC TAS SA NT AUST
Open-cut coal 13 146 120 0 - 2 - 281
Open-cut brown coal - - - 8 - - - 8
Underground coal - 77 285 - 0 - - 362
Coal total 13 223 405 8 0 2 - 651
Open-cut metalliferous 256 40 5 17 6 1 45 370
Underground metalliferous 78 37 35 11 10 15 4 190
Metalliferous total 334 77 40 28 16 16 49 560
Mining total 347 300 445 36 16 18 49 1211
Extractive industries 35 24 25 20 0 9 0 113
Smelting/Refining 56 39 0 0 16 0 0 111
Exploration 35 - - 9 - - 5 49
ALL 473 363 470 65 32 27 54 1484
19 | safety performanCe report of the australian minerals industry 2007–2008
2007 - 2008
lost time inJury statistiCs
Table 7: Lost Time Injury Frequency Rate by sector 1997-98 to 2006-07
MINING METHOD STATE 1998-99 1999-2000 2000-01 2001-02 2002-03 2003-04 2004-05 2005-06 2006-07 2007-08
Open-cut metalliferous WA 7 7 5 4 4 4 4 4 3 3
QLD 8 10 9 8 5 4 4 3 3 2
NSW 10 10 4 1 1 2 1 2 5 1
VIC 18 7 0 22 7 13 7 12 9 9
SA 6 12 11 19 3 0 0 8 1 4
TAS 16 17 33 15 18 20 14 20 12 18
NT 7 9 11 7 5 6 1 3 6 4
Average 7 8 6 5 4 4 4 4 4 3
Underground
metalliferous
WA 7 7 7 6 6 7 7 5 4 5
QLD 16 14 10 9 9 7 4 4 4 4
NSW 22 16 23 13 14 8 6 6 7 6
VIC 14 11 9 10 16 9 10 10 8 35
SA 3 2 3 2 5 6 2 5 3 2
TAS 19 27 27 16 16 10 8 15 9 4
NT 8 11 7 9 12 12 8 4 6 4
Average 12 12 12 9 9 8 6 6 5 4
All metalliferous WA 7 7 5 5 4 4 4 4 3 3
QLD 10 11 10 8 6 5 4 3 3 3
NSW 16 14 18 10 10 7 4 4 6 4
VIC 15 10 8 12 14 10 9 10 8 12
SA 4 4 5 9 5 6 2 5 3 2
TAS 19 25 28 16 17 13 9 16 10 6
NT 7 9 9 8 7 8 4 3 6 4
Average 8 9 8 6 6 5 4 4 4 3
20 | safety performanCe report of the australian minerals industry 2007–2008
2007 - 2008
lost time inJury statistiCs
Table 8: Lost Time Injury Frequency Rate by sector 1998-99 to 2007-08
MINING METHOD STATE 1998-99 1999-2000 2000-01 2001-02 2002-03 2003-04 2004-05 2005-06 2006-07 2007-08
Open-cut coal WA 29 16 28 17 15 15 14 14 10 10
QLD 7 7 7 5 4 5 3 3 3 4
NSW 27 21 22 14 14 9 8 6 9 8
(Brown Coal only) VIC 8 9 11 4 6 3 3 2 4 3
SA 5 0 8 8 5 2 7 6 6 5
TAS 0 0 10 34 0 0 0 0 0 0
NT
Average 15 12 8 8 7 6 5 4 5 5
Underground coal WA
QLD 29 27 22 18 14 14 12 12 13 8
NSW 48 43 42 38 36 33 27 24 24 21
VIC
SA
TAS 0 8 35 17 23 28 16 0
NT
Average 41 37 34 31 27 25 21 19 19 16
All coal WA 29 16 28 17 15 15 14 14 10 10
QLD 13 12 11 8 6 7 5 4 5 4
NSW 39 34 33 27 25 21 18 15 16 14
VIC 8 9 9 4 6 3 3 2 4 3
SA 4 0 2 8 5 2 7 6 6 5
TAS 0 7 35 20 23 28 16 0
NT
Average 25 22 21 16 13 12 9 8 9 8
Total mining WA 7 8 6 5 5 4 4 4 4 3
QLD 12 12 10 8 6 6 4 4 4 4
NSW 33 30 29 23 21 17 14 13 14 12
VIC 11 9 9 6 8 5 5 6 6 8
SA 4 4 7 9 5 5 2 5 3 2
TAS 18 24 28 16 17 13 9 15 10 6
NT 7 9 9 8 7 8 4 3 6 4
Average 12 13 12 9 8 7 6 6 5 5
* ‘All Mining Industry’ includes exploration

21 | safety performanCe report of the australian minerals industry 2007–2008
2007 - 2008
lost time inJury statistiCs
Table 9: Lost Time Injury Frequency Rate by sector 1998-99 to 2007-08
MINING METHOD STATE 1997-98 1998-99 1999-2000 2000-01 2001-02 2002-03 2003-04 2004-05 2005-06 2006-07
Extractive industries WA 3 16 12 10 7 8 15 14 11 9
QLD 15 12 8 11 8 7 6 1 9 5
NSW 10 3 6 20 27 20 9 8 7 6
VIC 18 19 15 14 9 8 8 12 3 7
SA 20 18 15 21 19 17 16 11 23 15
TAS 3 4 4 23 3 0 0
NT 17 12 0 16 3 6 4 4 17 0
Average 13 9 10 15 13 11 9 8 8 7
Smelting/Refining WA 4 3 4 3 3 4 2 3 4 3
QLD 19 12 3 7 5 2 3 4 3 4
NSW 16 9 12 11 4 7 1 1
VIC 1 7 1 1 1 1 1 1
SA 11 4 1 3 2 0 11 1 6
TAS 9 9 18 17 10 8 3 3 4 6
NT 4 6 5 3 3 6 6 0 0 0
Average 8 5 6 6 4 3 3 3 3 3
All mining industry WA 7 7 6 5 4 4 4 4 4 3
QLD 12 12 10 8 6 6 4 4 4 4
NSW 29 22 25 22 14 16 13 12 12 11
VIC 10 11 8 6 6 4 5 6 4 6
SA 8 6 4 9 5 5 6 5 4 3
TAS 13 16 22 17 13 10 5 7 6 6
NT 7 9 8 7 6 7 4 3 6 4
Average 12 11 11 9 7 7 6 5 5 5
* ‘All Mining Industry’ includes exploration
22 | safety performanCe report of the australian minerals industry 2007–2008
2007 - 2008
duration rate and severity rate statistiCs
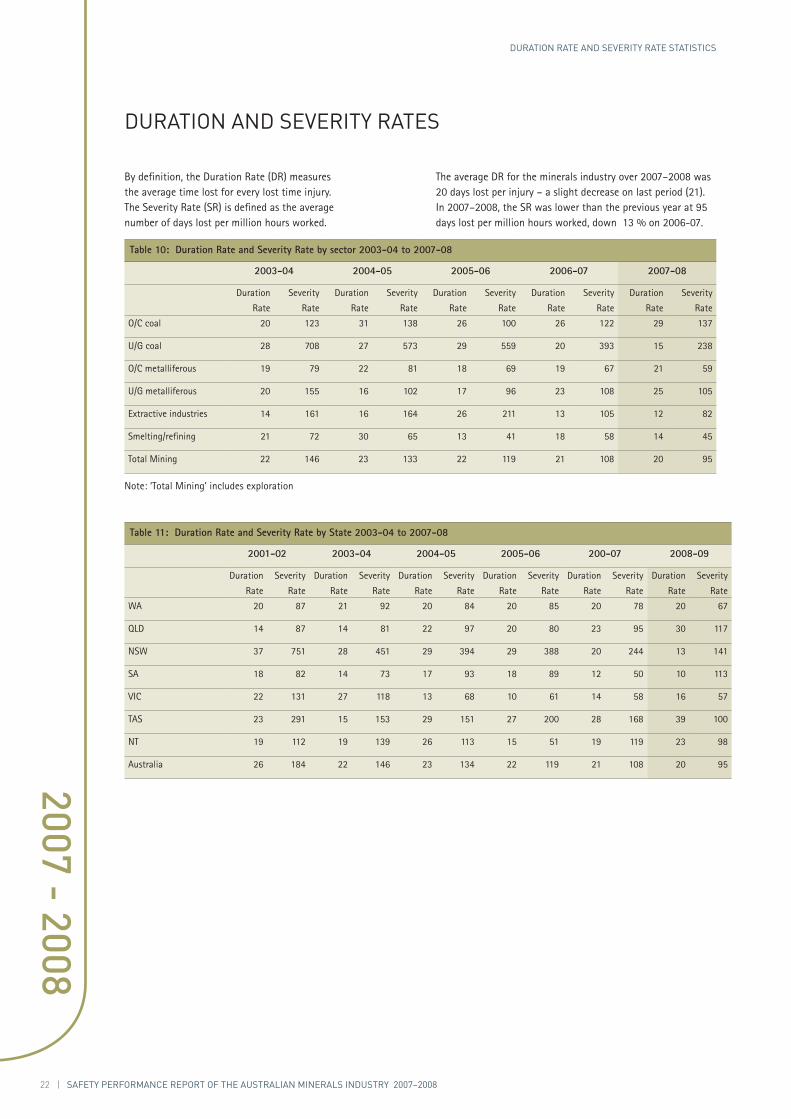
By definition, the Duration Rate (DR) measures the average time lost for every lost time injury. The Severity Rate (SR) is defined as the average number of days lost per million hours worked.
duration and severity rates
The average DR for the minerals industry over 2007–2008 was 20 days lost per injury – a slight decrease on last period (21). In 2007–2008, the SR was lower than the previous year at 95 days lost per million hours worked, down 13 % on 2006-07.
Table 10: Duration Rate and Severity Rate by sector 2003-04 to 2007-08
2003-04 2004-05 2005-06 2006-07 2007-08
Duration
Rate
Severity
Rate
Duration
Rate
Severity
Rate
Duration
Rate
Severity
Rate
Duration
Rate
Severity
Rate
Duration
Rate
Severity
Rate
O/C coal 20 123 31 138 26 100 26 122 29 137
U/G coal 28 708 27 573 29 559 20 393 15 238
O/C metalliferous 19 79 22 81 18 69 19 67 21 59
U/G metalliferous 20 155 16 102 17 96 23 108 25 105
Extractive industries 14 161 16 164 26 211 13 105 12 82
Smelting/refining 21 72 30 65 13 41 18 58 14 45
Total Mining 22 146 23 133 22 119 21 108 20 95
Note: ‘Total Mining’ includes exploration
Table 11: Duration Rate and Severity Rate by State 2003-04 to 2007-08
2001-02 2003-04 2004-05 2005-06 200-07 2008-09
Duration
Rate
Severity
Rate
Duration
Rate
Severity
Rate
Duration
Rate
Severity
Rate
Duration
Rate
Severity
Rate
Duration
Rate
Severity
Rate
Duration
Rate
Severity
Rate
WA 20 87 21 92 20 84 20 85 20 78 20 67
QLD 14 87 14 81 22 97 20 80 23 95 30 117
NSW 37 751 28 451 29 394 29 388 20 244 13 141
SA 18 82 14 73 17 93 18 89 12 50 10 113
VIC 22 131 27 118 13 68 10 61 14 58 16 57
TAS 23 291 15 153 29 151 27 200 28 168 39 100
NT 19 112 19 139 26 113 15 51 19 119 23 98
Australia 26 184 22 146 23 134 22 119 21 108 20 95
23 | safety performanCe report of the australian minerals industry 2007–2008
2007 - 2008
international Comparisons
Fatalities South Africa
Raw data indicates that the South African mining industry suffered 191 fatalities in 2008, 29 less than the previous year and its best result to date. The number of fatalities has declined steadily over recent years, with this year’s figure of 191 being well below the average annual number of fatalities for the decade of 248. By comparison, Australia experienced four fatalities this year, seven less than its average annual number of fatalities for the decade of 11.
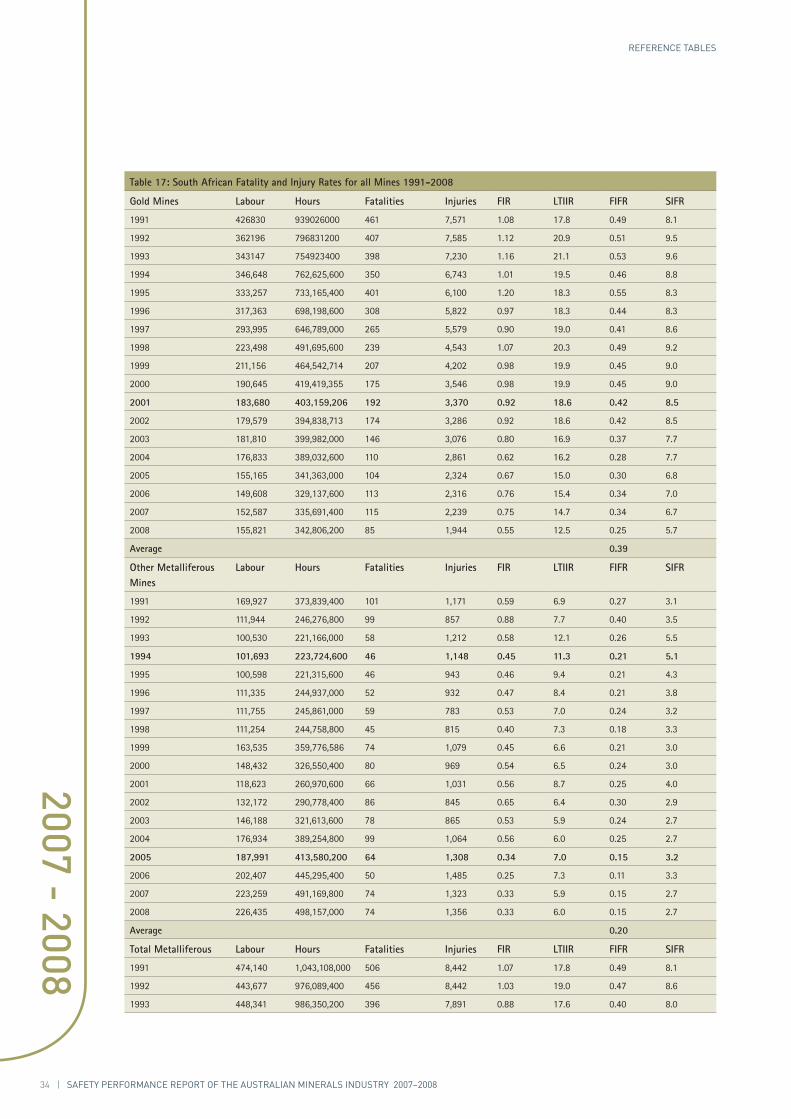
Over the past ten years, the Australian minerals industry average FIFR is 0.05. The South African equivalent for all mines is 0.26 five times that experienced in Australia. The most significant sector contributing to this high FIFR in South Africa is the gold mining sector. This sector has recorded a ten-year average FIFR of 0.39.
In a direct comparison of sectors, the South African total metalliferous sector experienced an FIFR of 0.19 in 2008 compared to the Australian sector’s FIFR of 0.02. South Africa’s total coal sector reported its lowest rate in over ten years of 0.11, but still much greater than that of the Australian total coal sector which reported a rate of 0.00. Comparisons could not be made to open-cut or underground sectors because the available South African data do not differentiate between these sectors.
USA
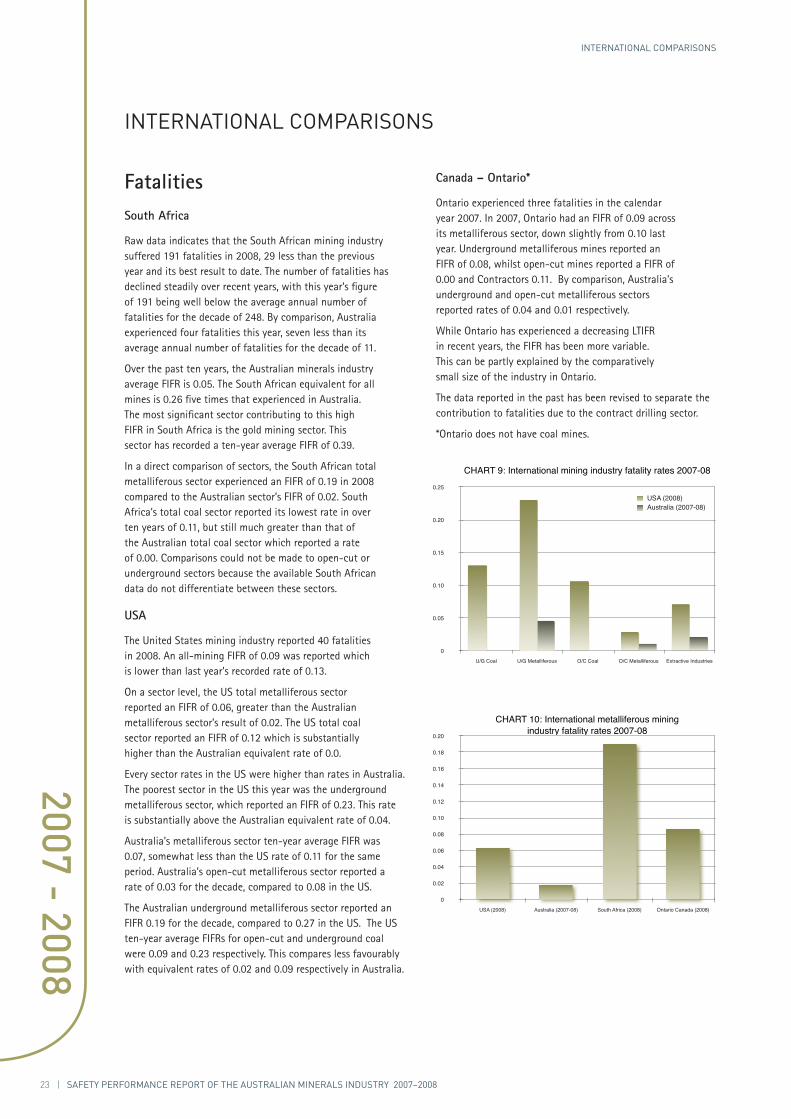
The United States mining industry reported 40 fatalities in 2008. An all-mining FIFR of 0.09 was reported which is lower than last year’s recorded rate of 0.13.
On a sector level, the US total metalliferous sector reported an FIFR of 0.06, greater than the Australian metalliferous sector’s result of 0.02. The US total coal sector reported an FIFR of 0.12 which is substantially higher than the Australian equivalent rate of 0.0.
Every sector rates in the US were higher than rates in Australia. The poorest sector in the US this year was the underground metalliferous sector, which reported an FIFR of 0.23. This rate is substantially above the Australian equivalent rate of 0.04.
Australia’s metalliferous sector ten-year average FIFR was 0.07, somewhat less than the US rate of 0.11 for the same period. Australia’s open-cut metalliferous sector reported a rate of 0.03 for the decade, compared to 0.08 in the US.
The Australian underground metalliferous sector reported an FIFR 0.19 for the decade, compared to 0.27 in the US. The US ten-year average FIFRs for open-cut and underground coal were 0.09 and 0.23 respectively. This compares less favourably with equivalent rates of 0.02 and 0.09 respectively in Australia.
international Comparisons
Canada – Ontario*
Ontario experienced three fatalities in the calendar year 2007. In 2007, Ontario had an FIFR of 0.09 across its metalliferous sector, down slightly from 0.10 last year. Underground metalliferous mines reported an FIFR of 0.08, whilst open-cut mines reported a FIFR of 0.00 and Contractors 0.11. By comparison, Australia’s underground and open-cut metalliferous sectors reported rates of 0.04 and 0.01 respectively.
While Ontario has experienced a decreasing LTIFR in recent years, the FIFR has been more variable. This can be partly explained by the comparatively small size of the industry in Ontario.
The data reported in the past has been revised to separate the contribution to fatalities due to the contract drilling sector.
*Ontario does not have coal mines.
0
0.05
0.10
0.15
0.20
0.25
U/G Coal U/G Metalliferous O/C Coal O/C Metalliferous Extractive Industries
CHART 9: International mining industry fatality rates 2007-08
USA (2008)Australia (2007-08)
0
0.02
0.04
0.06
0.08
0.10
0.12
0.14
0.16
0.18
0.20
USA (2008) Australia (2007-08) South Africa (2008) Ontario Canada (2008)
CHART 10: International metalliferous mining industry fatality rates 2007-08
24 | safety performanCe report of the australian minerals industry 2007–2008
2007 - 2008
international Comparisons
Coal
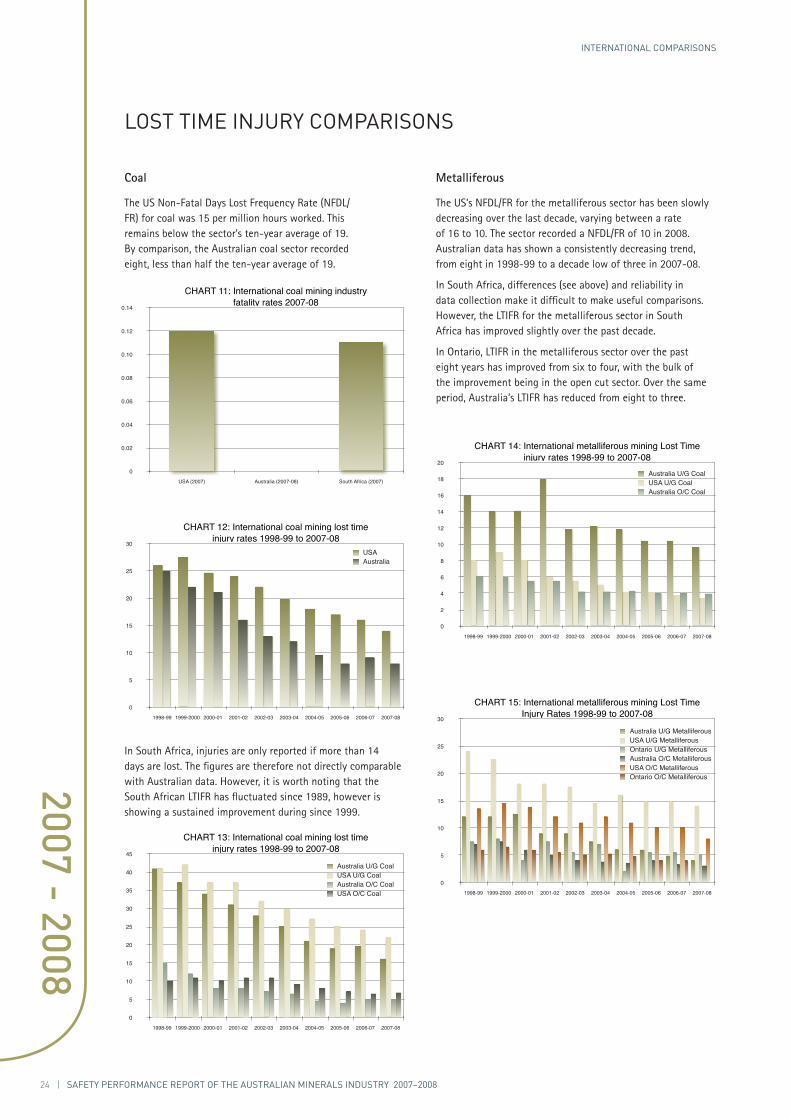
The US Non-Fatal Days Lost Frequency Rate (NFDL/FR) for coal was 15 per million hours worked. This remains below the sector’s ten-year average of 19. By comparison, the Australian coal sector recorded eight, less than half the ten-year average of 19.
In South Africa, injuries are only reported if more than 14 days are lost. The figures are therefore not directly comparable with Australian data. However, it is worth noting that the South African LTIFR has fluctuated since 1989, however is showing a sustained improvement during since 1999.
lost time inJury Comparisons
Metalliferous
The US’s NFDL/FR for the metalliferous sector has been slowly decreasing over the last decade, varying between a rate of 16 to 10. The sector recorded a NFDL/FR of 10 in 2008. Australian data has shown a consistently decreasing trend, from eight in 1998-99 to a decade low of three in 2007-08.
In South Africa, differences (see above) and reliability in data collection make it difficult to make useful comparisons. However, the LTIFR for the metalliferous sector in South Africa has improved slightly over the past decade.
In Ontario, LTIFR in the metalliferous sector over the past eight years has improved from six to four, with the bulk of the improvement being in the open cut sector. Over the same period, Australia’s LTIFR has reduced from eight to three.
0
0.02
0.04
0.06
0.08
0.10
0.12
0.14
USA (2007) Australia (2007-08) South Africa (2007)
CHART 11: International coal mining industry fatality rates 2007-08
0
5
10
15
20
25
30
1998-99 1999-2000 2000-01 2001-02 2002-03 2003-04 2004-05 2005-06 2006-07 2007-08
CHART 12: International coal mining lost time injury rates 1998-99 to 2007-08
USAAustralia
0
5
10
15
20
25
30
35
40
45
1998-99 1999-2000 2000-01 2001-02 2002-03 2003-04 2004-05 2005-06 2006-07 2007-08
CHART 13: International coal mining lost time injury rates 1998-99 to 2007-08
Australia U/G CoalUSA U/G CoalAustralia O/C CoalUSA O/C Coal
0
2
4
6
8
10
12
14
16
18
20
1998-99 1999-2000 2000-01 2001-02 2002-03 2003-04 2004-05 2005-06 2006-07 2007-08
CHART 14: International metalliferous mining Lost Time injury rates 1998-99 to 2007-08
Australia U/G CoalUSA U/G CoalAustralia O/C Coal
0
5
10
15
20
25
30
1998-99 1999-2000 2000-01 2001-02 2002-03 2003-04 2004-05 2005-06 2006-07 2007-08
CHART 15: International metalliferous mining Lost Time Injury Rates 1998-99 to 2007-08
Australia U/G MetalliferousUSA U/G MetalliferousOntario U/G MetalliferousAustralia O/C MetalliferousUSA O/C MetalliferousOntario O/C Metalliferous
25 | safety performanCe report of the australian minerals industry 2007–2008
2007 - 2008
health data
The Minerals Council of Australia has embarked on a program to further identify and clarify health data for the Australian minerals industry.
In previous safety and health performance reports, data from the Australian Safety Compensation Council - ASCC -(formerly the National Occupational Health and Safety Commission) has been reported. The data presented is always the previous year, and hence not directly related. The delay in timing is a factor of the considerable effort taken to collect the data by ASCC and the delay in claims being lodged and finalised.
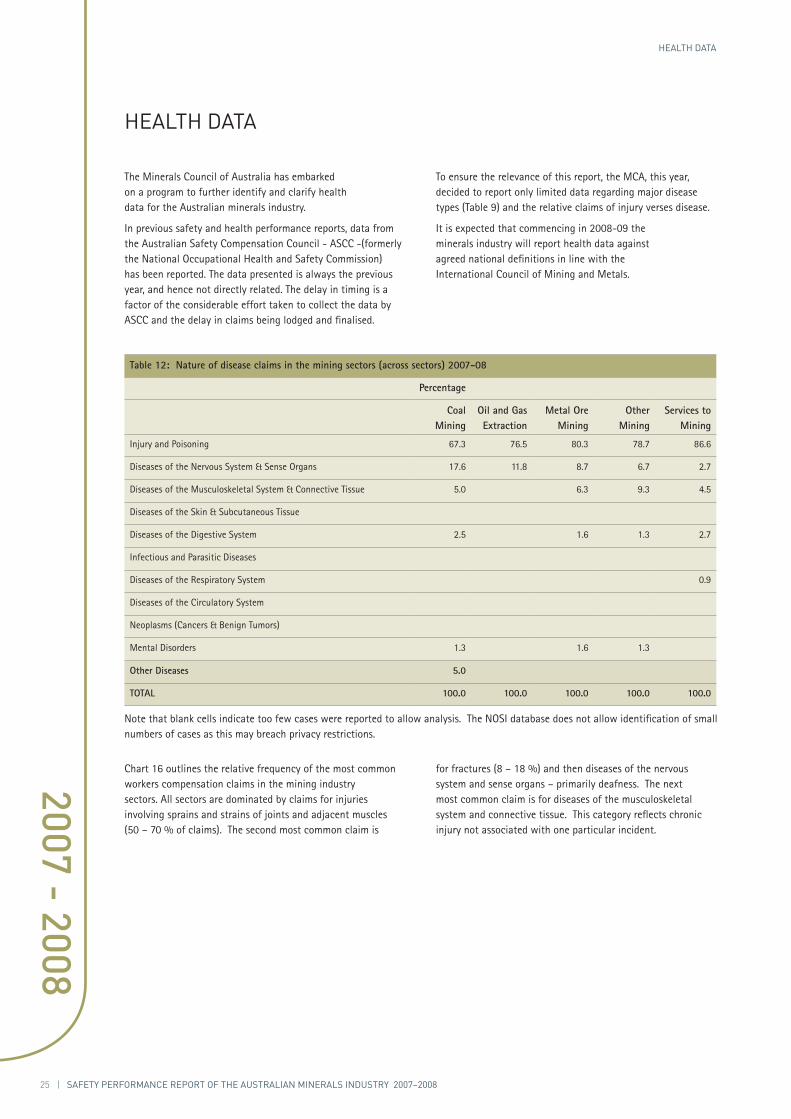
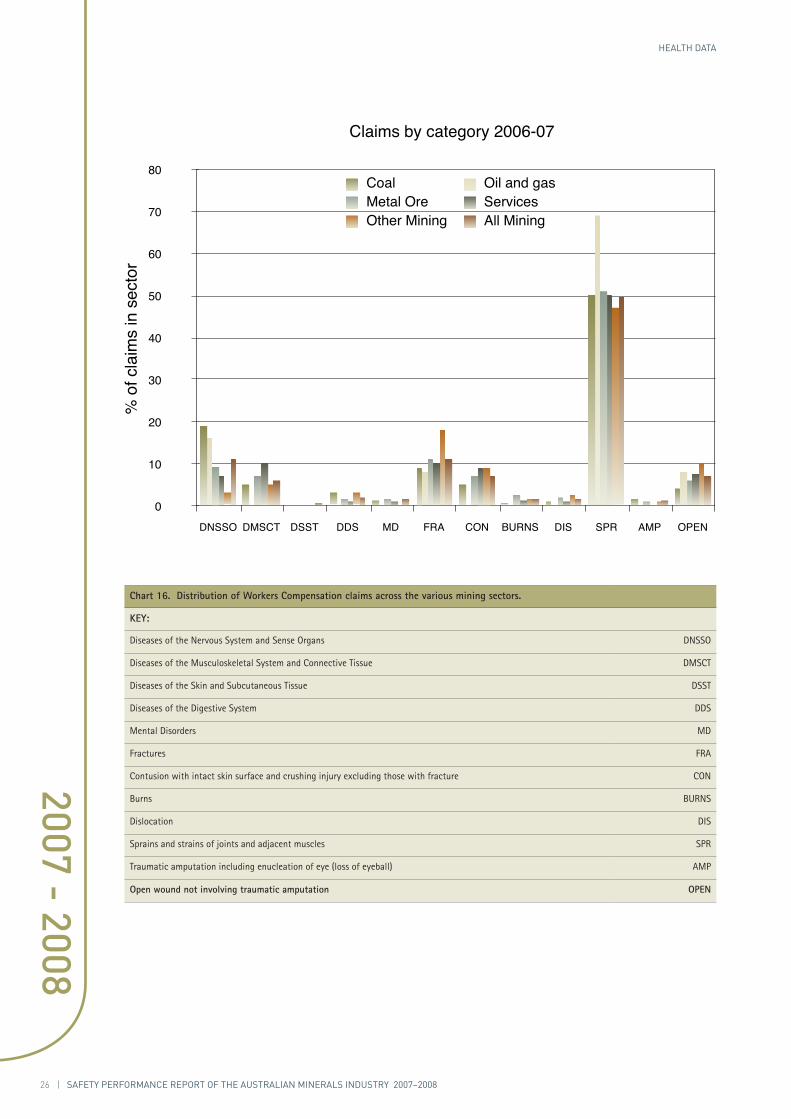
Chart 16 outlines the relative frequency of the most common workers compensation claims in the mining industry sectors. All sectors are dominated by claims for injuries involving sprains and strains of joints and adjacent muscles (50 – 70 % of claims). The second most common claim is
health data
To ensure the relevance of this report, the MCA, this year, decided to report only limited data regarding major disease types (Table 9) and the relative claims of injury verses disease.
It is expected that commencing in 2008-09 the minerals industry will report health data against agreed national definitions in line with the International Council of Mining and Metals.
for fractures (8 – 18 %) and then diseases of the nervous system and sense organs – primarily deafness. The next most common claim is for diseases of the musculoskeletal system and connective tissue. This category reflects chronic injury not associated with one particular incident.
Table 12: Nature of disease claims in the mining sectors (across sectors) 2007-08
Percentage
Coal Mining
Oil and Gas Extraction
Metal Ore Mining
Other Mining
Services to Mining
Injury and Poisoning 67.3 76.5 80.3 78.7 86.6
Diseases of the Nervous System & Sense Organs 17.6 11.8 8.7 6.7 2.7
Diseases of the Musculoskeletal System & Connective Tissue 5.0 6.3 9.3 4.5
Diseases of the Skin & Subcutaneous Tissue
Diseases of the Digestive System 2.5 1.6 1.3 2.7
Infectious and Parasitic Diseases
Diseases of the Respiratory System 0.9
Diseases of the Circulatory System
Neoplasms (Cancers & Benign Tumors)
Mental Disorders 1.3 1.6 1.3
Other Diseases 5.0
TOTAL 100.0 100.0 100.0 100.0 100.0
Note that blank cells indicate too few cases were reported to allow analysis. The NOSI database does not allow identification of small numbers of cases as this may breach privacy restrictions.
26 | safety performanCe report of the australian minerals industry 2007–2008
2007 - 2008
health data
Chart 16. Distribution of Workers Compensation claims across the various mining sectors.
KEY:
Diseases of the Nervous System and Sense Organs DNSSO
Diseases of the Musculoskeletal System and Connective Tissue DMSCT
Diseases of the Skin and Subcutaneous Tissue DSST
Diseases of the Digestive System DDS
Mental Disorders MD
Fractures FRA
Contusion with intact skin surface and crushing injury excluding those with fracture CON
Burns BURNS
Dislocation DIS
Sprains and strains of joints and adjacent muscles SPR
Traumatic amputation including enucleation of eye (loss of eyeball) AMP
Open wound not involving traumatic amputation OPEN
0
10
20
30
40
50
60
70
80
DNSSO DMSCT DSST DDS MD FRA CON BURNS DIS SPR AMP OPEN
% o
f cla
ims
in s
ecto
rClaims by category 2006-07
Coal Oil and gasMetal Ore ServicesOther Mining All Mining
27 | safety performanCe report of the australian minerals industry 2007–2008
2007 - 2008
health data
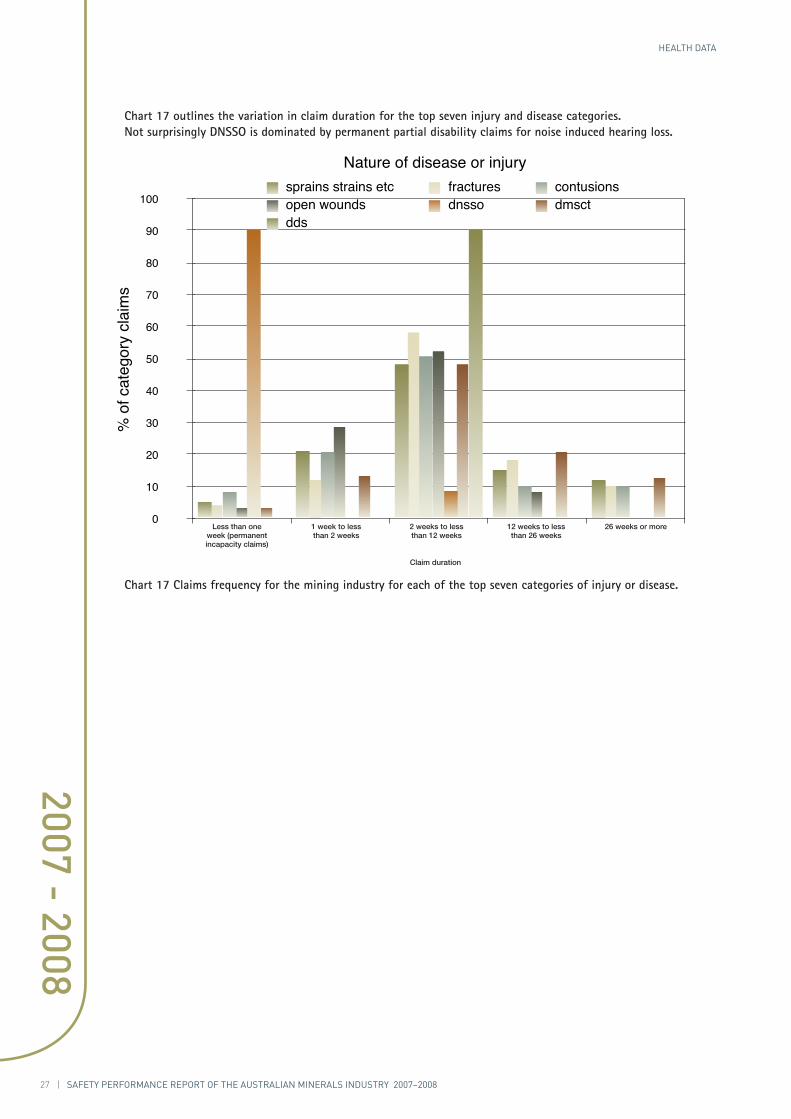
Chart 17 outlines the variation in claim duration for the top seven injury and disease categories. Not surprisingly DNSSO is dominated by permanent partial disability claims for noise induced hearing loss.
Chart 17 Claims frequency for the mining industry for each of the top seven categories of injury or disease.
0
10
20
30
40
50
60
70
80
90
100
% o
f cat
egor
y cl
aim
s
Nature of disease or injurysprains strains etc fractures contusionsopen wounds dnsso dmsctdds
Less than one week (permanent incapacity claims)
1 week to less than 2 weeks
2 weeks to less than 12 weeks
Claim duration
12 weeks to less than 26 weeks
26 weeks or more
28 | safety performanCe report of the australian minerals industry 2007–2008
2007 - 2008
ConclusionThe number of fatalities in the Australian minerals industry has varied widely from year to year, though in 2007-08 fatalities decreased over the previous year. There is limited evidence of a sustained improvement trend over the decade. This emphasises the need for minerals companies and governments to maintain an ongoing focus on fatality prevention.
A decrease in the number of LTls was also reported in 2007-8. The Lost Time Injury Frequency Rate decreased marginally again this year. At a company level this highlights the need for a continued and increasing focus on other positive lead indicators to continue to drive performance improvement.
In addition, the steady reduction in lost time injuries and associated frequency rate provides a set of consistently low numbers which is not a statistically satisfactory measurement of the industry safety and health performance.
Consequently the industry recognises the importance of expanding safety performance indicators and adopting industry-wide reporting of all injuries beyond first-aid treatment. It is expected that this broader measure will be more useful in understanding the full extent of injuries and helping to improve performance.
Minerals companies across Australia are now reporting on two measures: the number of Medical Treatment Cases (or Medical Treatment Injuries) and the number of Total Recordable Injuries.
In pursuit of the Council’s safety and health vision of an Australian minerals industry free of fatalities, injuries and diseases, it is important to separate out and report on these different types of injuries and show a progression, by company and industry reporting, towards an injury-free industry.
In recent years there has generally been an oscillation in Duration Rates. In 2007-08 in comparison to 2006-07 half the sectors recorded decreases in DR, the rest recorded slight increases in DR. Results for the SR were similar with mainly decreases and one increase being reported. Companies need to ensure through effective risk management that an adequate focus is given to the potential for high-severity permanently disabling injuries.
To the extent that valid international comparisons can be made, the Australian minerals industry appears to be performing well on these benchmarks.
29 | safety performanCe report of the australian minerals industry 2007–2008
2007 - 2008
referenCe taBles
referenCe taBles
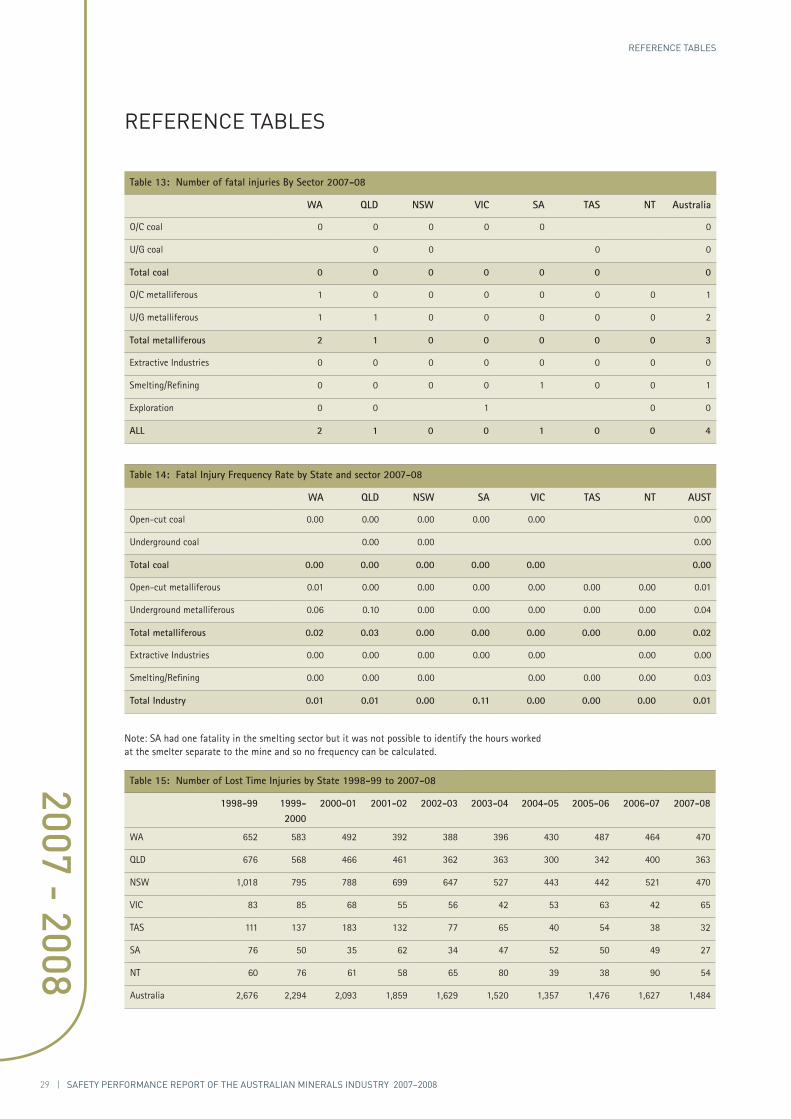
Table 13: Number of fatal injuries By Sector 2007-08
WA QLD NSW VIC SA TAS NT Australia
O/C coal 0 0 0 0 0 0
U/G coal 0 0 0 0
Total coal 0 0 0 0 0 0 0
O/C metalliferous 1 0 0 0 0 0 0 1
U/G metalliferous 1 1 0 0 0 0 0 2
Total metalliferous 2 1 0 0 0 0 0 3
Extractive Industries 0 0 0 0 0 0 0 0
Smelting/Refining 0 0 0 0 1 0 0 1
Exploration 0 0 1 0 0
ALL 2 1 0 0 1 0 0 4
Table 14: Fatal Injury Frequency Rate by State and sector 2007-08
WA QLD NSW SA VIC TAS NT AUST
Open-cut coal 0.00 0.00 0.00 0.00 0.00 0.00
Underground coal 0.00 0.00 0.00
Total coal 0.00 0.00 0.00 0.00 0.00 0.00
Open-cut metalliferous 0.01 0.00 0.00 0.00 0.00 0.00 0.00 0.01
Underground metalliferous 0.06 0.10 0.00 0.00 0.00 0.00 0.00 0.04
Total metalliferous 0.02 0.03 0.00 0.00 0.00 0.00 0.00 0.02
Extractive Industries 0.00 0.00 0.00 0.00 0.00 0.00 0.00
Smelting/Refining 0.00 0.00 0.00 0.00 0.00 0.00 0.03
Total Industry 0.01 0.01 0.00 0.11 0.00 0.00 0.00 0.01
Note: SA had one fatality in the smelting sector but it was not possible to identify the hours worked at the smelter separate to the mine and so no frequency can be calculated.
Table 15: Number of Lost Time Injuries by State 1998-99 to 2007-08
1998-99 1999-2000
2000-01 2001-02 2002-03 2003-04 2004-05 2005-06 2006-07 2007-08
WA 652 583 492 392 388 396 430 487 464 470
QLD 676 568 466 461 362 363 300 342 400 363
NSW 1,018 795 788 699 647 527 443 442 521 470
VIC 83 85 68 55 56 42 53 63 42 65
TAS 111 137 183 132 77 65 40 54 38 32
SA 76 50 35 62 34 47 52 50 49 27
NT 60 76 61 58 65 80 39 38 90 54
Australia 2,676 2,294 2,093 1,859 1,629 1,520 1,357 1,476 1,627 1,484
30 | safety performanCe report of the australian minerals industry 2007–2008
2007 - 2008
referenCe taBles
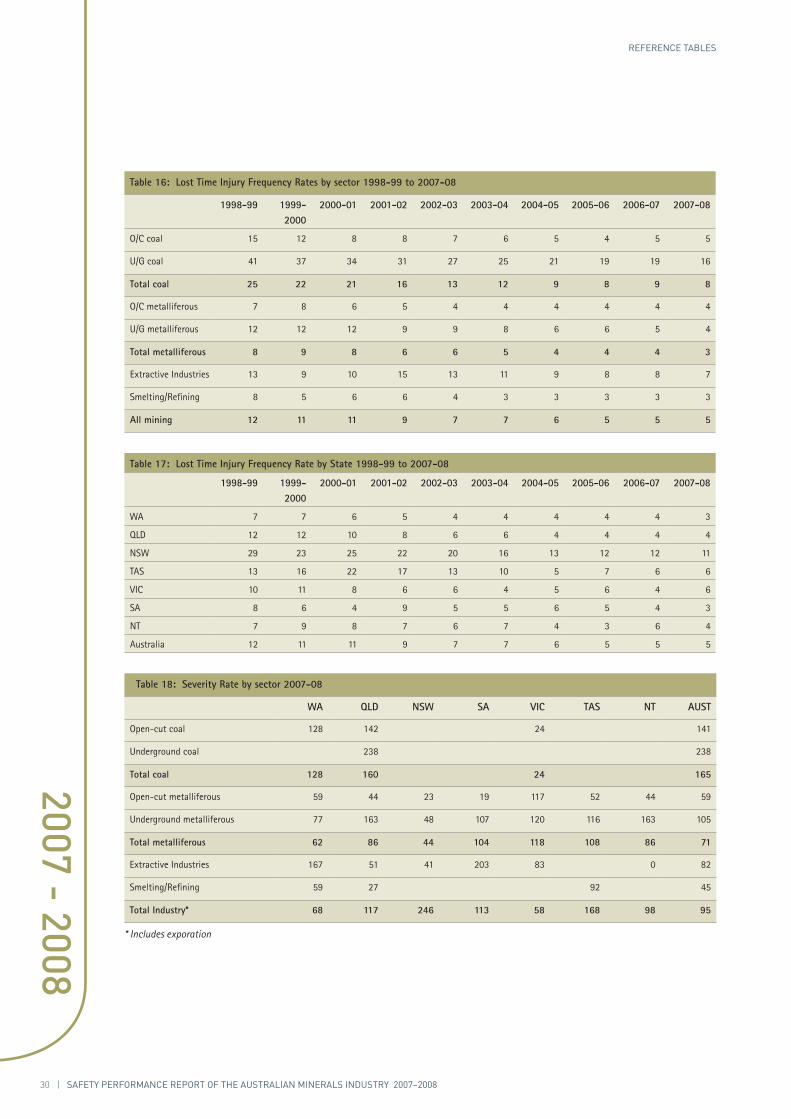
Table 16: Lost Time Injury Frequency Rates by sector 1998-99 to 2007-08
1998-99 1999-2000
2000-01 2001-02 2002-03 2003-04 2004-05 2005-06 2006-07 2007-08
O/C coal 15 12 8 8 7 6 5 4 5 5
U/G coal 41 37 34 31 27 25 21 19 19 16
Total coal 25 22 21 16 13 12 9 8 9 8
O/C metalliferous 7 8 6 5 4 4 4 4 4 4
U/G metalliferous 12 12 12 9 9 8 6 6 5 4
Total metalliferous 8 9 8 6 6 5 4 4 4 3
Extractive Industries 13 9 10 15 13 11 9 8 8 7
Smelting/Refining 8 5 6 6 4 3 3 3 3 3
All mining 12 11 11 9 7 7 6 5 5 5
Table 17: Lost Time Injury Frequency Rate by State 1998-99 to 2007-08
1998-99 1999-2000
2000-01 2001-02 2002-03 2003-04 2004-05 2005-06 2006-07 2007-08
WA 7 7 6 5 4 4 4 4 4 3
QLD 12 12 10 8 6 6 4 4 4 4
NSW 29 23 25 22 20 16 13 12 12 11
TAS 13 16 22 17 13 10 5 7 6 6
VIC 10 11 8 6 6 4 5 6 4 6
SA 8 6 4 9 5 5 6 5 4 3
NT 7 9 8 7 6 7 4 3 6 4
Australia 12 11 11 9 7 7 6 5 5 5
Table 18: Severity Rate by sector 2007-08
WA QLD NSW SA VIC TAS NT AUST
Open-cut coal 128 142 24 141
Underground coal 238 238
Total coal 128 160 24 165
Open-cut metalliferous 59 44 23 19 117 52 44 59
Underground metalliferous 77 163 48 107 120 116 163 105
Total metalliferous 62 86 44 104 118 108 86 71
Extractive Industries 167 51 41 203 83 0 82
Smelting/Refining 59 27 92 45
Total Industry* 68 117 246 113 58 168 98 95
* Includes exporation
31 | safety performanCe report of the australian minerals industry 2007–2008
2007 - 2008
referenCe taBles
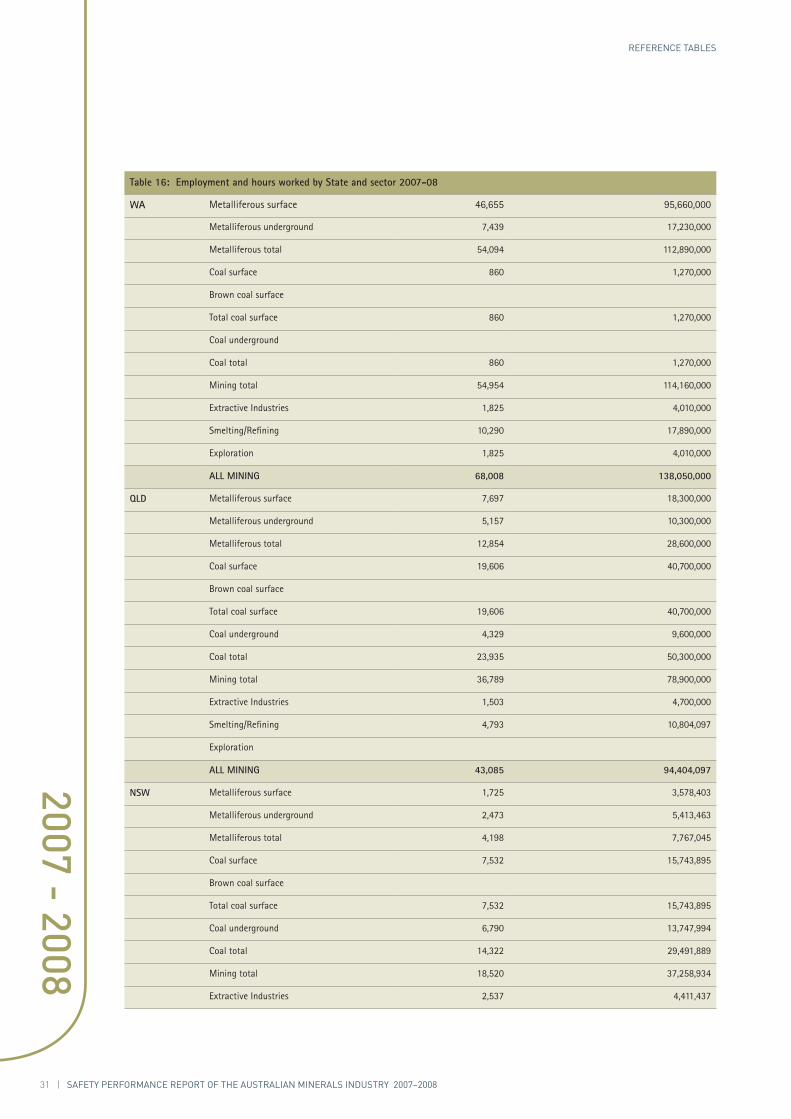
Table 16: Employment and hours worked by State and sector 2007-08
WA Metalliferous surface 46,655 95,660,000
Metalliferous underground 7,439 17,230,000
Metalliferous total 54,094 112,890,000
Coal surface 860 1,270,000
Brown coal surface
Total coal surface 860 1,270,000
Coal underground
Coal total 860 1,270,000
Mining total 54,954 114,160,000
Extractive Industries 1,825 4,010,000
Smelting/Refining 10,290 17,890,000
Exploration 1,825 4,010,000
ALL MINING 68,008 138,050,000
QLD Metalliferous surface 7,697 18,300,000
Metalliferous underground 5,157 10,300,000
Metalliferous total 12,854 28,600,000
Coal surface 19,606 40,700,000
Brown coal surface
Total coal surface 19,606 40,700,000
Coal underground 4,329 9,600,000
Coal total 23,935 50,300,000
Mining total 36,789 78,900,000
Extractive Industries 1,503 4,700,000
Smelting/Refining 4,793 10,804,097
Exploration
ALL MINING 43,085 94,404,097
NSW Metalliferous surface 1,725 3,578,403
Metalliferous underground 2,473 5,413,463
Metalliferous total 4,198 7,767,045
Coal surface 7,532 15,743,895
Brown coal surface
Total coal surface 7,532 15,743,895
Coal underground 6,790 13,747,994
Coal total 14,322 29,491,889
Mining total 18,520 37,258,934
Extractive Industries 2,537 4,411,437
32 | safety performanCe report of the australian minerals industry 2007–2008
2007 - 2008
referenCe taBles
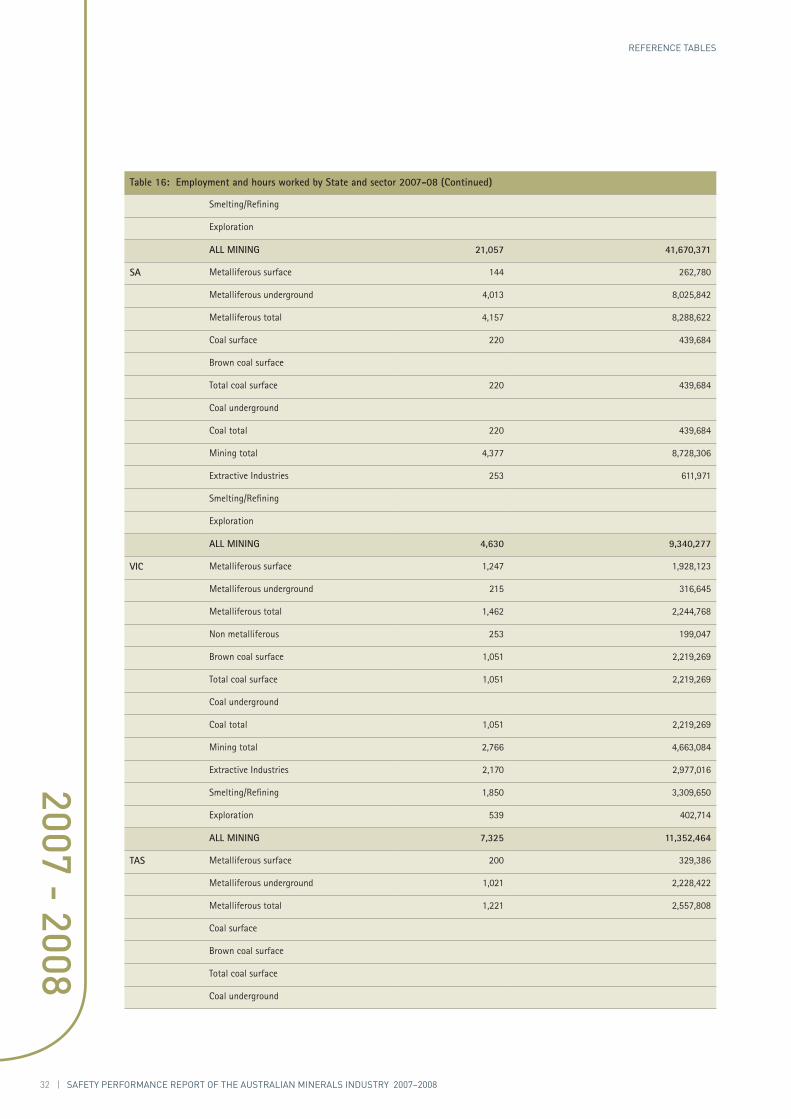
Table 16: Employment and hours worked by State and sector 2007-08 (Continued)
Smelting/Refining
Exploration
ALL MINING 21,057 41,670,371
SA Metalliferous surface 144 262,780
Metalliferous underground 4,013 8,025,842
Metalliferous total 4,157 8,288,622
Coal surface 220 439,684
Brown coal surface
Total coal surface 220 439,684
Coal underground
Coal total 220 439,684
Mining total 4,377 8,728,306
Extractive Industries 253 611,971
Smelting/Refining
Exploration
ALL MINING 4,630 9,340,277
VIC Metalliferous surface 1,247 1,928,123
Metalliferous underground 215 316,645
Metalliferous total 1,462 2,244,768
Non metalliferous 253 199,047
Brown coal surface 1,051 2,219,269
Total coal surface 1,051 2,219,269
Coal underground
Coal total 1,051 2,219,269
Mining total 2,766 4,663,084
Extractive Industries 2,170 2,977,016
Smelting/Refining 1,850 3,309,650
Exploration 539 402,714
ALL MINING 7,325 11,352,464
TAS Metalliferous surface 200 329,386
Metalliferous underground 1,021 2,228,422
Metalliferous total 1,221 2,557,808
Coal surface
Brown coal surface
Total coal surface
Coal underground
33 | safety performanCe report of the australian minerals industry 2007–2008
2007 - 2008
referenCe taBles
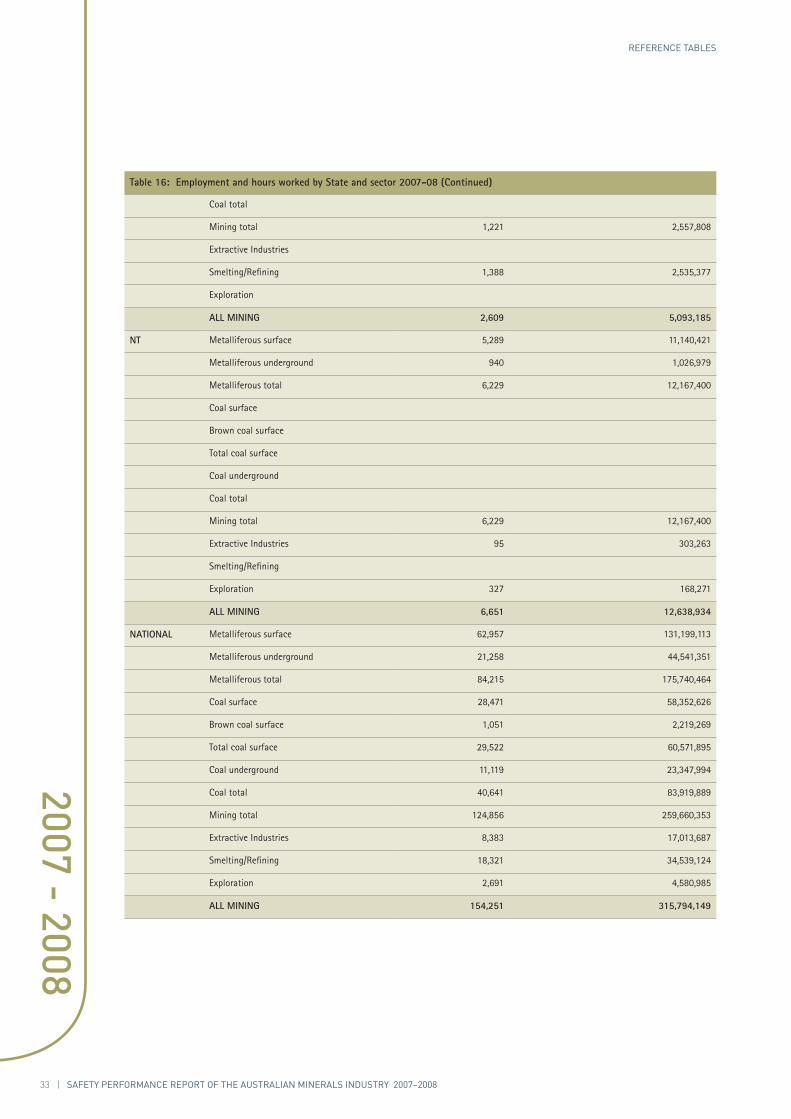
Table 16: Employment and hours worked by State and sector 2007-08 (Continued)
Coal total
Mining total 1,221 2,557,808
Extractive Industries
Smelting/Refining 1,388 2,535,377
Exploration
ALL MINING 2,609 5,093,185
NT Metalliferous surface 5,289 11,140,421
Metalliferous underground 940 1,026,979
Metalliferous total 6,229 12,167,400
Coal surface
Brown coal surface
Total coal surface
Coal underground
Coal total
Mining total 6,229 12,167,400
Extractive Industries 95 303,263
Smelting/Refining
Exploration 327 168,271
ALL MINING 6,651 12,638,934
NATIONAL Metalliferous surface 62,957 131,199,113
Metalliferous underground 21,258 44,541,351
Metalliferous total 84,215 175,740,464
Coal surface 28,471 58,352,626
Brown coal surface 1,051 2,219,269
Total coal surface 29,522 60,571,895
Coal underground 11,119 23,347,994
Coal total 40,641 83,919,889
Mining total 124,856 259,660,353
Extractive Industries 8,383 17,013,687
Smelting/Refining 18,321 34,539,124
Exploration 2,691 4,580,985
ALL MINING 154,251 315,794,149
34 | safety performanCe report of the australian minerals industry 2007–2008
2007 - 2008
referenCe taBles
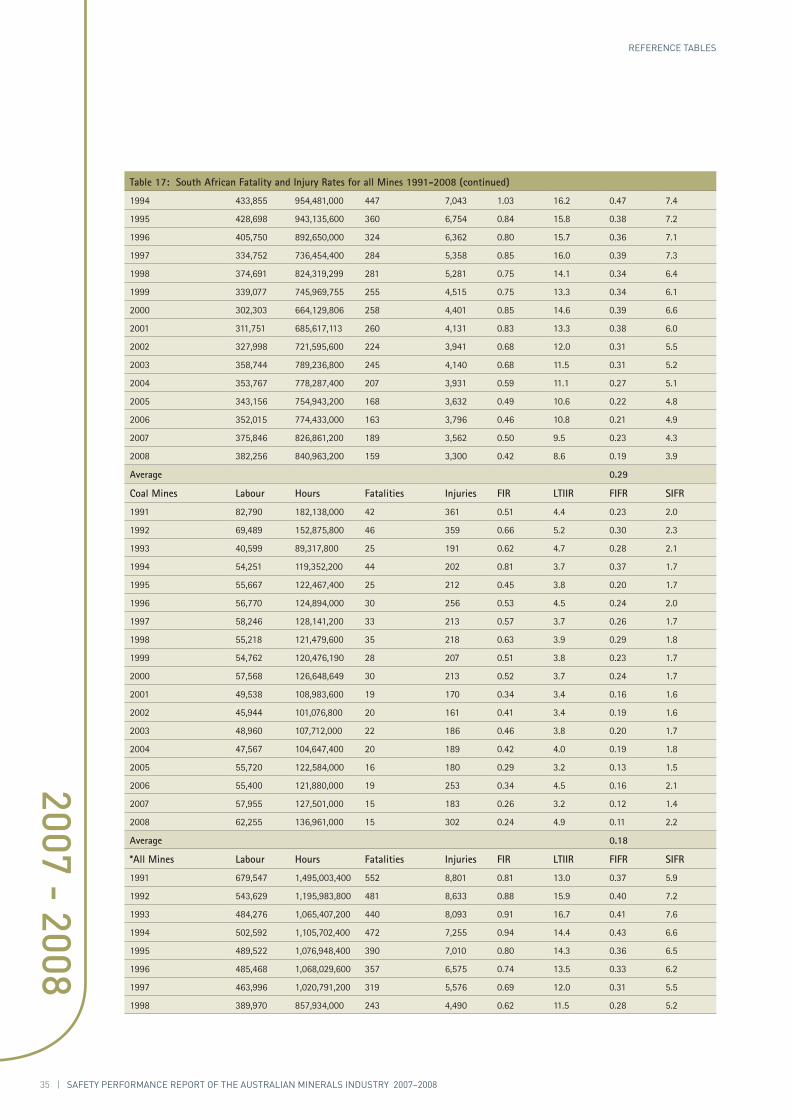
Table 17: South African Fatality and Injury Rates for all Mines 1991-2008
Gold Mines Labour Hours Fatalities Injuries FIR LTIIR FIFR SIFR
1991 426830 939026000 461 7,571 1.08 17.8 0.49 8.1
1992 362196 796831200 407 7,585 1.12 20.9 0.51 9.5
1993 343147 754923400 398 7,230 1.16 21.1 0.53 9.6
1994 346,648 762,625,600 350 6,743 1.01 19.5 0.46 8.8
1995 333,257 733,165,400 401 6,100 1.20 18.3 0.55 8.3
1996 317,363 698,198,600 308 5,822 0.97 18.3 0.44 8.3
1997 293,995 646,789,000 265 5,579 0.90 19.0 0.41 8.6
1998 223,498 491,695,600 239 4,543 1.07 20.3 0.49 9.2
1999 211,156 464,542,714 207 4,202 0.98 19.9 0.45 9.0
2000 190,645 419,419,355 175 3,546 0.98 19.9 0.45 9.0
2001 183,680 403,159,206 192 3,370 0.92 18.6 0.42 8.5
2002 179,579 394,838,713 174 3,286 0.92 18.6 0.42 8.5
2003 181,810 399,982,000 146 3,076 0.80 16.9 0.37 7.7
2004 176,833 389,032,600 110 2,861 0.62 16.2 0.28 7.7
2005 155,165 341,363,000 104 2,324 0.67 15.0 0.30 6.8
2006 149,608 329,137,600 113 2,316 0.76 15.4 0.34 7.0
2007 152,587 335,691,400 115 2,239 0.75 14.7 0.34 6.7
2008 155,821 342,806,200 85 1,944 0.55 12.5 0.25 5.7
Average 0.39
Other Metalliferous Mines
Labour Hours Fatalities Injuries FIR LTIIR FIFR SIFR
1991 169,927 373,839,400 101 1,171 0.59 6.9 0.27 3.1
1992 111,944 246,276,800 99 857 0.88 7.7 0.40 3.5
1993 100,530 221,166,000 58 1,212 0.58 12.1 0.26 5.5
1994 101,693 223,724,600 46 1,148 0.45 11.3 0.21 5.1
1995 100,598 221,315,600 46 943 0.46 9.4 0.21 4.3
1996 111,335 244,937,000 52 932 0.47 8.4 0.21 3.8
1997 111,755 245,861,000 59 783 0.53 7.0 0.24 3.2
1998 111,254 244,758,800 45 815 0.40 7.3 0.18 3.3
1999 163,535 359,776,586 74 1,079 0.45 6.6 0.21 3.0
2000 148,432 326,550,400 80 969 0.54 6.5 0.24 3.0
2001 118,623 260,970,600 66 1,031 0.56 8.7 0.25 4.0
2002 132,172 290,778,400 86 845 0.65 6.4 0.30 2.9
2003 146,188 321,613,600 78 865 0.53 5.9 0.24 2.7
2004 176,934 389,254,800 99 1,064 0.56 6.0 0.25 2.7
2005 187,991 413,580,200 64 1,308 0.34 7.0 0.15 3.2
2006 202,407 445,295,400 50 1,485 0.25 7.3 0.11 3.3
2007 223,259 491,169,800 74 1,323 0.33 5.9 0.15 2.7
2008 226,435 498,157,000 74 1,356 0.33 6.0 0.15 2.7
Average 0.20
Total Metalliferous Labour Hours Fatalities Injuries FIR LTIIR FIFR SIFR
1991 474,140 1,043,108,000 506 8,442 1.07 17.8 0.49 8.1
1992 443,677 976,089,400 456 8,442 1.03 19.0 0.47 8.6
1993 448,341 986,350,200 396 7,891 0.88 17.6 0.40 8.0
35 | safety performanCe report of the australian minerals industry 2007–2008
2007 - 2008
referenCe taBles
Table 17: South African Fatality and Injury Rates for all Mines 1991-2008 (continued)
1994 433,855 954,481,000 447 7,043 1.03 16.2 0.47 7.4
1995 428,698 943,135,600 360 6,754 0.84 15.8 0.38 7.2
1996 405,750 892,650,000 324 6,362 0.80 15.7 0.36 7.1
1997 334,752 736,454,400 284 5,358 0.85 16.0 0.39 7.3
1998 374,691 824,319,299 281 5,281 0.75 14.1 0.34 6.4
1999 339,077 745,969,755 255 4,515 0.75 13.3 0.34 6.1
2000 302,303 664,129,806 258 4,401 0.85 14.6 0.39 6.6
2001 311,751 685,617,113 260 4,131 0.83 13.3 0.38 6.0
2002 327,998 721,595,600 224 3,941 0.68 12.0 0.31 5.5
2003 358,744 789,236,800 245 4,140 0.68 11.5 0.31 5.2
2004 353,767 778,287,400 207 3,931 0.59 11.1 0.27 5.1
2005 343,156 754,943,200 168 3,632 0.49 10.6 0.22 4.8
2006 352,015 774,433,000 163 3,796 0.46 10.8 0.21 4.9
2007 375,846 826,861,200 189 3,562 0.50 9.5 0.23 4.3
2008 382,256 840,963,200 159 3,300 0.42 8.6 0.19 3.9
Average 0.29
Coal Mines Labour Hours Fatalities Injuries FIR LTIIR FIFR SIFR
1991 82,790 182,138,000 42 361 0.51 4.4 0.23 2.0
1992 69,489 152,875,800 46 359 0.66 5.2 0.30 2.3
1993 40,599 89,317,800 25 191 0.62 4.7 0.28 2.1
1994 54,251 119,352,200 44 202 0.81 3.7 0.37 1.7
1995 55,667 122,467,400 25 212 0.45 3.8 0.20 1.7
1996 56,770 124,894,000 30 256 0.53 4.5 0.24 2.0
1997 58,246 128,141,200 33 213 0.57 3.7 0.26 1.7
1998 55,218 121,479,600 35 218 0.63 3.9 0.29 1.8
1999 54,762 120,476,190 28 207 0.51 3.8 0.23 1.7
2000 57,568 126,648,649 30 213 0.52 3.7 0.24 1.7
2001 49,538 108,983,600 19 170 0.34 3.4 0.16 1.6
2002 45,944 101,076,800 20 161 0.41 3.4 0.19 1.6
2003 48,960 107,712,000 22 186 0.46 3.8 0.20 1.7
2004 47,567 104,647,400 20 189 0.42 4.0 0.19 1.8
2005 55,720 122,584,000 16 180 0.29 3.2 0.13 1.5
2006 55,400 121,880,000 19 253 0.34 4.5 0.16 2.1
2007 57,955 127,501,000 15 183 0.26 3.2 0.12 1.4
2008 62,255 136,961,000 15 302 0.24 4.9 0.11 2.2
Average 0.18
*All Mines Labour Hours Fatalities Injuries FIR LTIIR FIFR SIFR
1991 679,547 1,495,003,400 552 8,801 0.81 13.0 0.37 5.9
1992 543,629 1,195,983,800 481 8,633 0.88 15.9 0.40 7.2
1993 484,276 1,065,407,200 440 8,093 0.91 16.7 0.41 7.6
1994 502,592 1,105,702,400 472 7,255 0.94 14.4 0.43 6.6
1995 489,522 1,076,948,400 390 7,010 0.80 14.3 0.36 6.5
1996 485,468 1,068,029,600 357 6,575 0.74 13.5 0.33 6.2
1997 463,996 1,020,791,200 319 5,576 0.69 12.0 0.31 5.5
1998 389,970 857,934,000 243 4,490 0.62 11.5 0.28 5.2
36 | safety performanCe report of the australian minerals industry 2007–2008
2007 - 2008
referenCe taBles
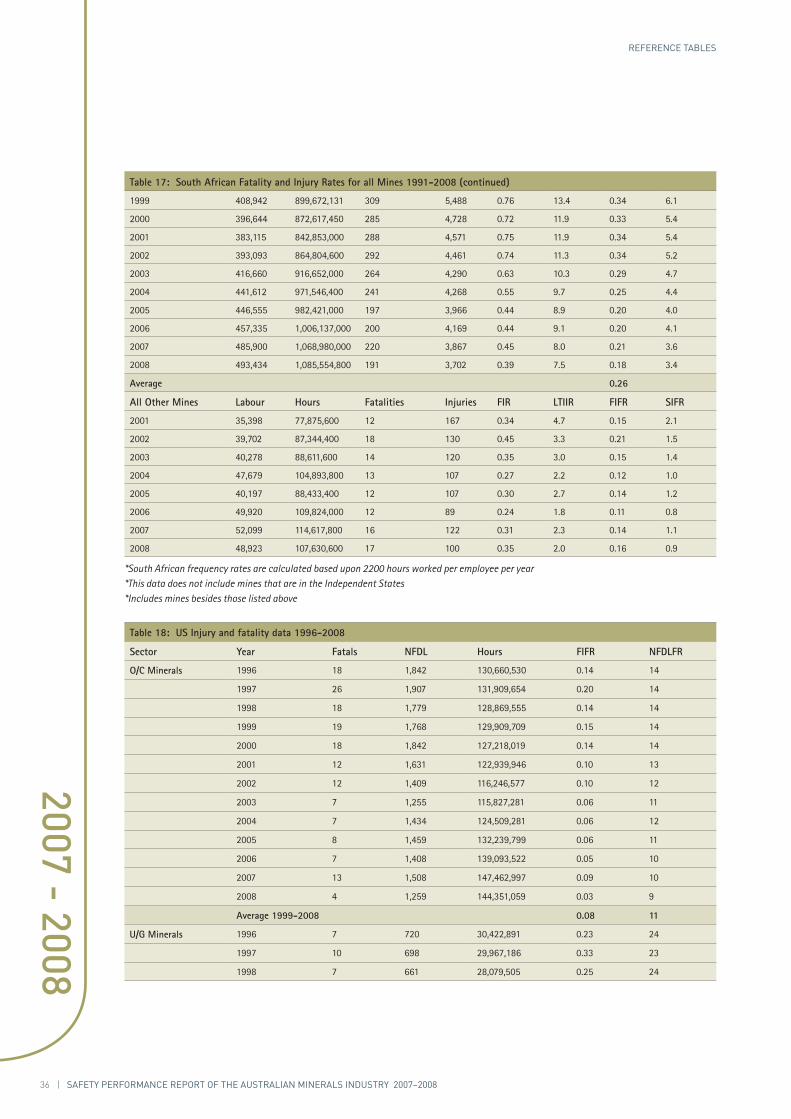
Table 17: South African Fatality and Injury Rates for all Mines 1991-2008 (continued)
1999 408,942 899,672,131 309 5,488 0.76 13.4 0.34 6.1
2000 396,644 872,617,450 285 4,728 0.72 11.9 0.33 5.4
2001 383,115 842,853,000 288 4,571 0.75 11.9 0.34 5.4
2002 393,093 864,804,600 292 4,461 0.74 11.3 0.34 5.2
2003 416,660 916,652,000 264 4,290 0.63 10.3 0.29 4.7
2004 441,612 971,546,400 241 4,268 0.55 9.7 0.25 4.4
2005 446,555 982,421,000 197 3,966 0.44 8.9 0.20 4.0
2006 457,335 1,006,137,000 200 4,169 0.44 9.1 0.20 4.1
2007 485,900 1,068,980,000 220 3,867 0.45 8.0 0.21 3.6
2008 493,434 1,085,554,800 191 3,702 0.39 7.5 0.18 3.4
Average 0.26
All Other Mines Labour Hours Fatalities Injuries FIR LTIIR FIFR SIFR
2001 35,398 77,875,600 12 167 0.34 4.7 0.15 2.1
2002 39,702 87,344,400 18 130 0.45 3.3 0.21 1.5
2003 40,278 88,611,600 14 120 0.35 3.0 0.15 1.4
2004 47,679 104,893,800 13 107 0.27 2.2 0.12 1.0
2005 40,197 88,433,400 12 107 0.30 2.7 0.14 1.2
2006 49,920 109,824,000 12 89 0.24 1.8 0.11 0.8
2007 52,099 114,617,800 16 122 0.31 2.3 0.14 1.1
2008 48,923 107,630,600 17 100 0.35 2.0 0.16 0.9
*South African frequency rates are calculated based upon 2200 hours worked per employee per year*This data does not include mines that are in the Independent States*Includes mines besides those listed above
Table 18: US Injury and fatality data 1996-2008
Sector Year Fatals NFDL Hours FIFR NFDLFR
O/C Minerals 1996 18 1,842 130,660,530 0.14 14
1997 26 1,907 131,909,654 0.20 14
1998 18 1,779 128,869,555 0.14 14
1999 19 1,768 129,909,709 0.15 14
2000 18 1,842 127,218,019 0.14 14
2001 12 1,631 122,939,946 0.10 13
2002 12 1,409 116,246,577 0.10 12
2003 7 1,255 115,827,281 0.06 11
2004 7 1,434 124,509,281 0.06 12
2005 8 1,459 132,239,799 0.06 11
2006 7 1,408 139,093,522 0.05 10
2007 13 1,508 147,462,997 0.09 10
2008 4 1,259 144,351,059 0.03 9
Average 1999-2008 0.08 11
U/G Minerals 1996 7 720 30,422,891 0.23 24
1997 10 698 29,967,186 0.33 23
1998 7 661 28,079,505 0.25 24
37 | safety performanCe report of the australian minerals industry 2007–2008
2007 - 2008
referenCe taBles
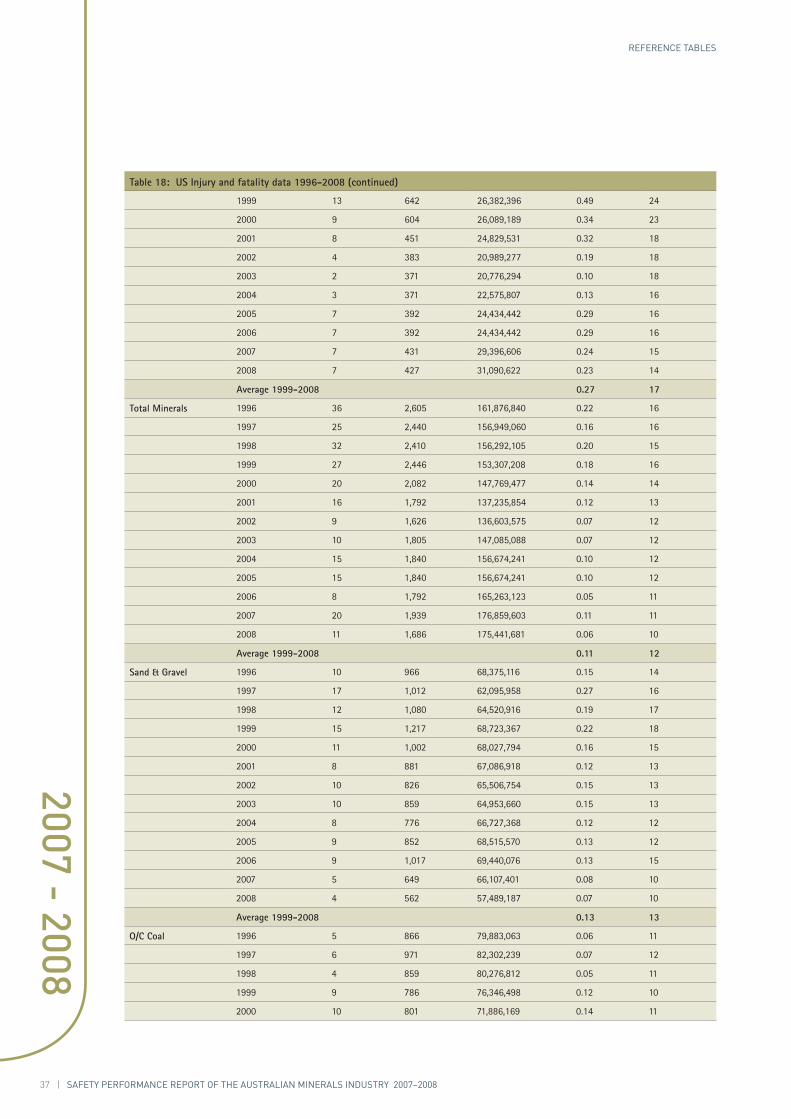
Table 18: US Injury and fatality data 1996-2008 (continued)
1999 13 642 26,382,396 0.49 24
2000 9 604 26,089,189 0.34 23
2001 8 451 24,829,531 0.32 18
2002 4 383 20,989,277 0.19 18
2003 2 371 20,776,294 0.10 18
2004 3 371 22,575,807 0.13 16
2005 7 392 24,434,442 0.29 16
2006 7 392 24,434,442 0.29 16
2007 7 431 29,396,606 0.24 15
2008 7 427 31,090,622 0.23 14
Average 1999-2008 0.27 17
Total Minerals 1996 36 2,605 161,876,840 0.22 16
1997 25 2,440 156,949,060 0.16 16
1998 32 2,410 156,292,105 0.20 15
1999 27 2,446 153,307,208 0.18 16
2000 20 2,082 147,769,477 0.14 14
2001 16 1,792 137,235,854 0.12 13
2002 9 1,626 136,603,575 0.07 12
2003 10 1,805 147,085,088 0.07 12
2004 15 1,840 156,674,241 0.10 12
2005 15 1,840 156,674,241 0.10 12
2006 8 1,792 165,263,123 0.05 11
2007 20 1,939 176,859,603 0.11 11
2008 11 1,686 175,441,681 0.06 10
Average 1999-2008 0.11 12
Sand & Gravel 1996 10 966 68,375,116 0.15 14
1997 17 1,012 62,095,958 0.27 16
1998 12 1,080 64,520,916 0.19 17
1999 15 1,217 68,723,367 0.22 18
2000 11 1,002 68,027,794 0.16 15
2001 8 881 67,086,918 0.12 13
2002 10 826 65,506,754 0.15 13
2003 10 859 64,953,660 0.15 13
2004 8 776 66,727,368 0.12 12
2005 9 852 68,515,570 0.13 12
2006 9 1,017 69,440,076 0.13 15
2007 5 649 66,107,401 0.08 10
2008 4 562 57,489,187 0.07 10
Average 1999-2008 0.13 13
O/C Coal 1996 5 866 79,883,063 0.06 11
1997 6 971 82,302,239 0.07 12
1998 4 859 80,276,812 0.05 11
1999 9 786 76,346,498 0.12 10
2000 10 801 71,886,169 0.14 11
38 | safety performanCe report of the australian minerals industry 2007–2008
2007 - 2008
referenCe taBles
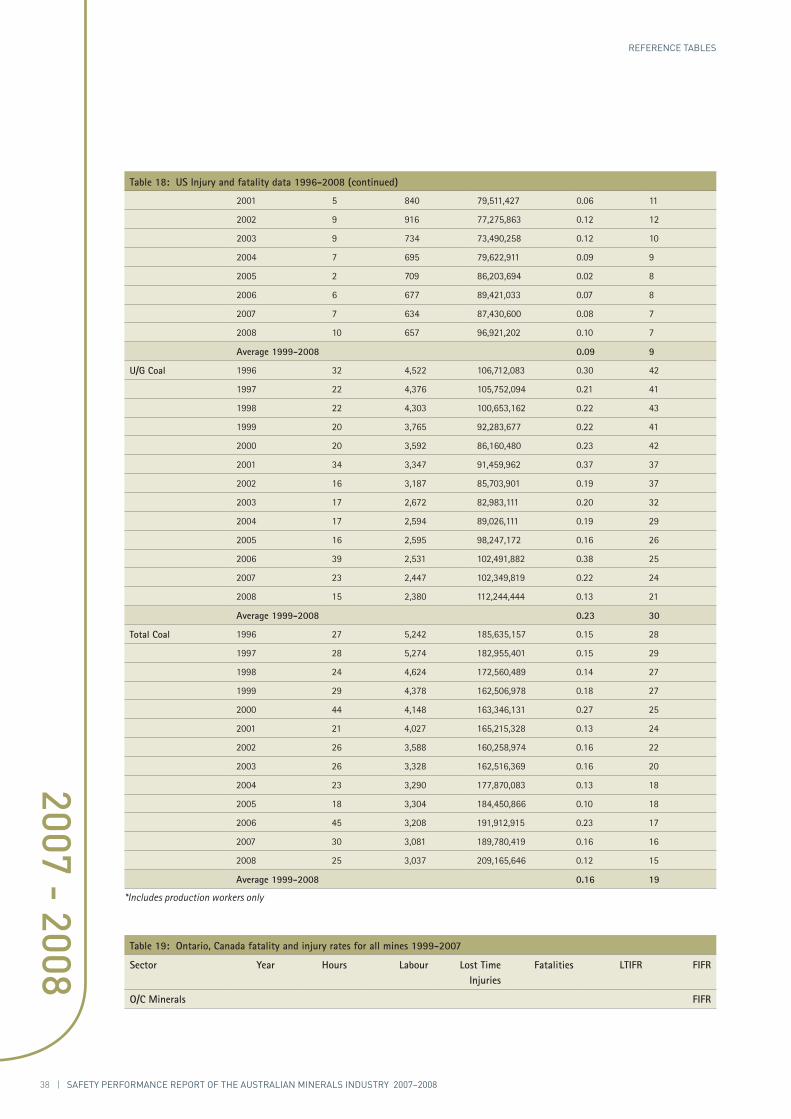
Table 18: US Injury and fatality data 1996-2008 (continued)
2001 5 840 79,511,427 0.06 11
2002 9 916 77,275,863 0.12 12
2003 9 734 73,490,258 0.12 10
2004 7 695 79,622,911 0.09 9
2005 2 709 86,203,694 0.02 8
2006 6 677 89,421,033 0.07 8
2007 7 634 87,430,600 0.08 7
2008 10 657 96,921,202 0.10 7
Average 1999-2008 0.09 9
U/G Coal 1996 32 4,522 106,712,083 0.30 42
1997 22 4,376 105,752,094 0.21 41
1998 22 4,303 100,653,162 0.22 43
1999 20 3,765 92,283,677 0.22 41
2000 20 3,592 86,160,480 0.23 42
2001 34 3,347 91,459,962 0.37 37
2002 16 3,187 85,703,901 0.19 37
2003 17 2,672 82,983,111 0.20 32
2004 17 2,594 89,026,111 0.19 29
2005 16 2,595 98,247,172 0.16 26
2006 39 2,531 102,491,882 0.38 25
2007 23 2,447 102,349,819 0.22 24
2008 15 2,380 112,244,444 0.13 21
Average 1999-2008 0.23 30
Total Coal 1996 27 5,242 185,635,157 0.15 28
1997 28 5,274 182,955,401 0.15 29
1998 24 4,624 172,560,489 0.14 27
1999 29 4,378 162,506,978 0.18 27
2000 44 4,148 163,346,131 0.27 25
2001 21 4,027 165,215,328 0.13 24
2002 26 3,588 160,258,974 0.16 22
2003 26 3,328 162,516,369 0.16 20
2004 23 3,290 177,870,083 0.13 18
2005 18 3,304 184,450,866 0.10 18
2006 45 3,208 191,912,915 0.23 17
2007 30 3,081 189,780,419 0.16 16
2008 25 3,037 209,165,646 0.12 15
Average 1999-2008 0.16 19
*Includes production workers only
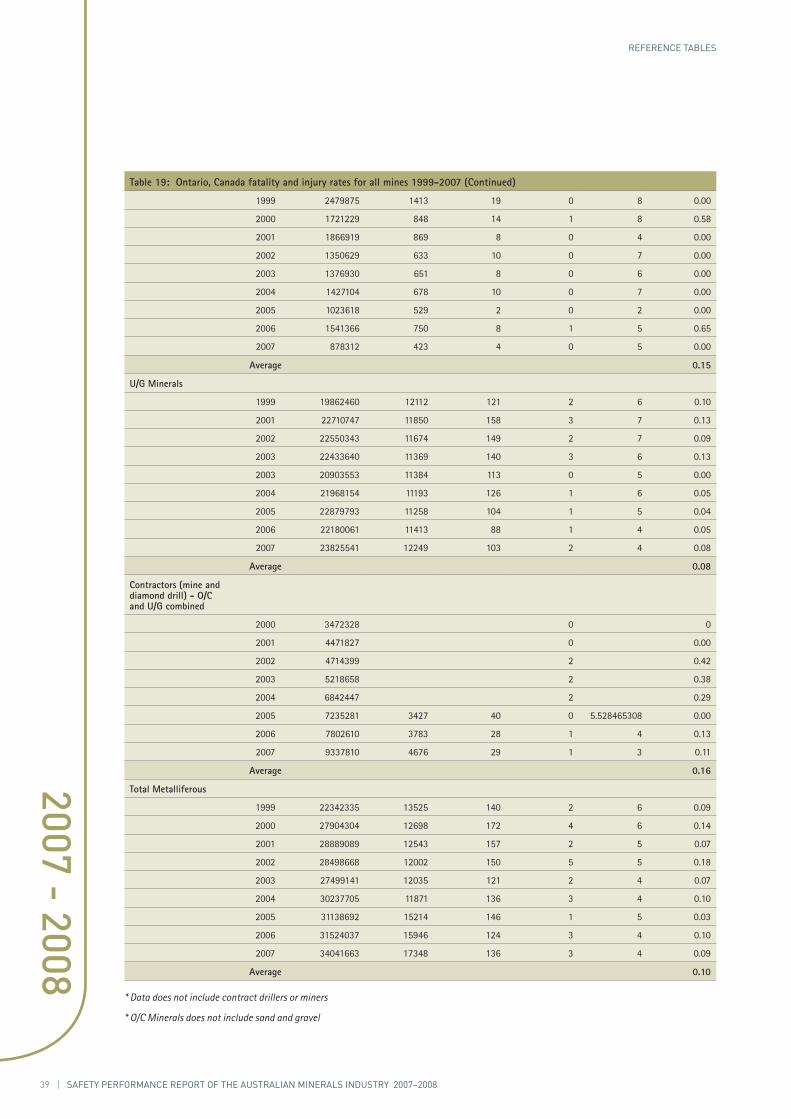
Table 19: Ontario, Canada fatality and injury rates for all mines 1999-2007
Sector Year Hours Labour Lost Time Injuries
Fatalities LTIFR FIFR
O/C Minerals FIFR
39 | safety performanCe report of the australian minerals industry 2007–2008
2007 - 2008
referenCe taBles
Table 19: Ontario, Canada fatality and injury rates for all mines 1999-2007 (Continued)
1999 2479875 1413 19 0 8 0.00
2000 1721229 848 14 1 8 0.58
2001 1866919 869 8 0 4 0.00
2002 1350629 633 10 0 7 0.00
2003 1376930 651 8 0 6 0.00
2004 1427104 678 10 0 7 0.00
2005 1023618 529 2 0 2 0.00
2006 1541366 750 8 1 5 0.65
2007 878312 423 4 0 5 0.00
Average 0.15
U/G Minerals
1999 19862460 12112 121 2 6 0.10
2001 22710747 11850 158 3 7 0.13
2002 22550343 11674 149 2 7 0.09
2003 22433640 11369 140 3 6 0.13
2003 20903553 11384 113 0 5 0.00
2004 21968154 11193 126 1 6 0.05
2005 22879793 11258 104 1 5 0.04
2006 22180061 11413 88 1 4 0.05
2007 23825541 12249 103 2 4 0.08
Average 0.08
Contractors (mine and diamond drill) - O/C and U/G combined
2000 3472328 0 0
2001 4471827 0 0.00
2002 4714399 2 0.42
2003 5218658 2 0.38
2004 6842447 2 0.29
2005 7235281 3427 40 0 5.528465308 0.00
2006 7802610 3783 28 1 4 0.13
2007 9337810 4676 29 1 3 0.11
Average 0.16
Total Metalliferous
1999 22342335 13525 140 2 6 0.09
2000 27904304 12698 172 4 6 0.14
2001 28889089 12543 157 2 5 0.07
2002 28498668 12002 150 5 5 0.18
2003 27499141 12035 121 2 4 0.07
2004 30237705 11871 136 3 4 0.10
2005 31138692 15214 146 1 5 0.03
2006 31524037 15946 124 3 4 0.10
2007 34041663 17348 136 3 4 0.09
Average 0.10
* Data does not include contract drillers or miners
* O/C Minerals does not include sand and gravel
40 | safety performanCe report of the australian minerals industry 2007–2008
2007 - 2008
referenCes
Australian Mining Industry Council, Safety Performance of the Australian Mining Industry 1986–87–1990–91,
Volumes 1 & 2, May 1993.
Australian Mining Industry Council, Safety Performance of the Australian Mining Industry 1992–93, January 1994.
Australian Mining Industry Council, Safety Performance of the Australian Mining Industry 1993–94.
Minerals Council of Australia, Safety and Health Performance Report of the Australian Mining Industry 1996–97.
Minerals Council of Australia, Safety and Health Performance Report of the Australian Mining Industry 1997–98.
Minerals Council of Australia, Safety and Health Performance Report of the Australian Mining Industry 1998–99.
Minerals Council of Australia, Safety and Health Performance Report of the Australian Mining Industry 1999–2000.
Minerals Council of Australia, Safety and Health Performance Report of the Australian Mining Industry 2000–01.
Minerals Council of Australia, Safety and Health Performance Report of the Australian Mining Industry 2001–02.
Minerals Council of Australia, Safety and Health Performance Report of the Australian Mining Industry 2002–03.
Minerals Council of Australia, Safety and Health Performance Report of the Australian Mining Industry 2003–04.
Minerals Council of Australia, Safety and Health Performance Report of the Australian Mining Industry 2004–05.
Minerals Council of Australia, Safety and Health Performance Report of the Australian Mining Industry 2005–06.
Minerals Council of Australia, Safety and Health Performance Report of the Australian Mining Industry 2006–07.
Data from websites for the following organisations were also used:
» Safework Australia
» Department of Minerals and Energy, Republic of South Africa.
» Mines and Aggregates Safety and Health Association Ontario Canada.
» Mine Safety and Health Administration US Department of Labor, USA.
41 | safety performanCe report of the australian minerals industry 2007–2008
2007 - 2008
Acknowledgements
The Minerals Council of Australia wishes to thank: Department of Industry and Innovation, New South Wales; Worksafe, Northern Territory; Department of Employment Economic Development and Innovation, Mines and Energy, Queensland Department of Mines and Petroleum Western Australia; Worksafe, Victoria; Minerals Industry Safety and Health Centre, University of Queensland; Coal Services Pty Ltd, New South Wales; Sunmetals, Rio Tinto, BHP Billiton
The Minerals Council of Australia also wishes to thank the following for providing information on international injury data comparisons:
» Mines and Aggregates Safety and Health Association, Ontario, Canada
» Mine Safety and Health Administration, Washington, USA
» South African Department of Minerals and Energy
Disclaimer
No person should rely on the contents of this publication without first obtaining advice from a qualifi ed professional person. The Minerals Council of Australia, and the authors, editors and any consultants accept no liability (including liability in negligence) and take no responsibility for any loss or damage which a user of this publication or any third party may suffer or incur as a result of reliance on this publication, and in particular for:
(a) any errors or omissions in this publication;
(b) any inaccuracy in the information and data on which this publication is based or which is contained in this publication;
(c) any interpretations or opinions stated in, or which may be inferred from this publication.
Minerals Council of Australia
PO Box 4497
KINGSTON ACT 2604
Tel: 02 6233 0600
Fax: 02 6233 0699
Email: [email protected]
www.minerals.org.au


![Department of Minerals and Energy Briefing to NCOP : Briefing to NCOP :Finance 07 August 2008 Minerals and Petroleum Resources Amendment Bill [ B10D-2007]](https://img.pdfslide.net/doc/110x75/56649ea85503460f94babbbf/department-of-minerals-and-energy-briefing-to-ncop-briefing-to-ncop-finance.jpg)