Embed Size (px)
Citation preview

2 0 0 7 A N N U A L R E P O R T
P R O P E R T I E S O F S U C C E S S
300 - 360 Main Street
Winnipeg, Manitoba R3C 3Z3
T 204.947.1250 F 204.947.0453
www.artisreit.com
AR
TIS RE
IT | 2007 AN
NU
AL R
EP
OR
T


In 2007, the ARTIS REIT portfolio more than doubled, making this
our most successful year ever. In fact, fi nancial gains were made
in all of our key performance measures. This ensures that we are
extremely well-positioned to move forward and continue to build
on our foundation of investment strength which includes a:
A T T A I N I N G N E W H E I G H T S
Regional focus on western Canada
Major focus in the Province of Alberta
Quality property portfolio diversifi ed across
offi ce, retail, and industrial asset classes
Strong record of acquiring and integrating properties
Strong record of increasing same property NOI and FFO/unit
Consistent history of generating reliable cash fl ow
Solid fi nancial position with a well-structured balance sheet
Proven management team with over 150 years of collective
experience in construction, development and management
of commercial properties in Canada and the United States.
7 5 4 5
1 8 0 7
A R T I S R E I T | I D E N T I T Y
Growth Highlights 2 | 2007 Financial Highlights 3 | Message from the Chairman 4 | Message from the President and C.E.O. 5 | Portfolio Summary 10 | Corporate Governance 12
Management’s Discussion and Analysis 14 | Consolidated Financial Statements 42 | Auditors’ Report 43 | Notes to Consolidated Financial Statements 48 | Trustees 68 | Portfolio by City 70 | Corporate Information 72

LONG-TERM DEBT ($ millions)
$665.7
0405
0607
TOTAL ASSETS ($ millions)
0405
0607
0405
0607
$1,176.4
$35.7
0405
0607
FUNDS FROM OPERATIONS($ millions)
$37.6
DISTRIBUTABLE INCOME ($ millions)
2 0 0 4 - 2 0 0 7
GROWTH HIGHLIGHTS
PROPERTY NOI ($ millions)
FUNDS FROM OPERATIONSPER UNIT
DISTRIBUTABLE INCOME PER UNIT
REVENUES ($ millions)
$99.3
0404
04 0405
0607
0506
07
0506
07
0506
07
$67.5
$1.41$1.49
2 | ARTIS REIT
$53.5
$9.6
$0.6
$34.3
$6.2$0.4
$14.0
$2.0
$0.1
$15.9
$2.5
$0.2
$312.8
$190.8
$6.0
$492.9
$273.3
$11.3
$1.16
$0.59
$0.29
$1.32
$0.74
$0.45

F I N A N C I A L H I G H L I G H T S
2007
($000’s, except unit and per unit amounts) Year ended December 31
2007 2006
Revenues $ 99,259 $ 53,522
Property NOI $ 67,469 $ 34,251
Income (loss) for the year $ 6,157 $ (11,153)
Basic income (loss) per unit $ .25 $ (0.94)
Distributions $ 27,106 $ 12,874
Distributions per unit $ 1.05 $ 1.05
DI $ 37,638 $ 15,878
DI per unit $ 1.49 $ 1.32
DI payout ratio 70.5% 79.5%
FFO $ 35,670 $ 13,995
FFO per unit $ 1.41 $ 1.16
FFO payout ratio 74.5% 90.5%
Total assets $ 1,176,448 $ 492,940
Total long-term debt $ 665,728 $ 312,844
Gross book value $ 1,247,047 $ 523,081
Total long-term debt to gross book value 53.4% 59.8%
Artis REIT trades on the Toronto Stock Exchange under the symbol AX.UN
2007 ANNUAL REPORT | 3

MESSAGE FROM THE CHAIRMAN
The Board of Trustees of Artis, together with our dedicated management team and staff, are committed to creating value for our unitholders in the real estate sector; fi rst by building a portfolio of high-quality western Canadian offi ce, retail and industrial properties, and second by maximizing the returns from those properties.
We are very pleased to report that 2007 was another year of outstanding growth for Artis. We executed a very successful acquisition program, increasing the number of commercial properties in our portfolio to 80, from 36 at the start of the year, and increasing assets to nearly $1.2 billion, from $493 million at the start of the year. Our acquisition program was primarily fi nanced by three prospectus offerings that raised over $259 million in new equity for Artis.
The REIT’s 2007 fi nancial performance was impressive, with gains made in all of our key measures. As a result of prudent acquisitions and on-going improvements in individual property results, we increased our funds from operations per unit, decreased our payout ratio on funds from operations and improved our debt-to-gross book value ratio. In 2007, we also adopted a Unitholders Rights Plan (which will be presented to our unitholders for approval at the 2008 annual general meeting) and initiated our fi rst normal course issuer bid.
The REIT’s progress to date would not have been possible without an experienced and skilled management team working cooperatively with an effective and committed Board of Trustees. Our Board benefi ts from the varied backgrounds of our individual trustees, including expertise in the areas of real estate, construction, accounting, governance, fi nancial services, engineering and law. Five of the seven Board members are independent of management and all committees of the Board are comprised solely of independent trustees.
We strive to uphold high standards of corporate governance and work to ensure Artis conducts its affairs to a high standard of ethical conduct. Our Board members attend Corporate Governance seminars in order to keep abreast of best practices. We recognize that on-going evaluation of our own performance is an important governance practice and in 2007 we undertook a comprehensive board evaluation with the assistance of an expert external consultant. Also in 2007, the Board struck a Special Committee tasked with the responsibility to twice-annually evaluate the continuation of the Asset Management Agreement between Artis and Marwest Management Canada Ltd., its external manager.
As we look ahead to 2008 the business climate appears to be markedly different than the year just completed. On-going uncertainties in the fi nancial markets are having an impact on both the availability and costs of capital and are impacting the price of real estate. However, Artis has signifi cant embedded growth in the portfolio, which will surface as our below-market leases expire and are renewed at market. We also have suffi cient capital resources to acquire new properties should suitable opportunities arise. In brief, Artis should be well-positioned to weather the turbulence in the markets, and I look forward to reporting on our successes again next year.
Edward L. WarkentinCHAIRMAN
4 | ARTIS REIT

Fiscal 2007 was, by every key measure, our most successful year to date. As a result of a well-executed acquisition program and strong growth in same property net operating income (NOI), Artis achieved exceptional growth. Our portfolio more than doubled, increasing from approximately 3 million to over 6 million square feet of gross leasable area (GLA) by year end. Our total assets increased from approximately $493 million at the start of the year to almost $1.2 billion at December 31, 2007.
We delivered solid improvements in our fi nancial results in 2007. Revenues increased from $53.5 million to $99.3 million year-over-year and net operating income increased from $34.3 million to $67.5 million year-over-year. We consider funds from operations (FFO) per unit and distributable income (DI) per unit to be key performance indicators. In 2007 our FFO per unit increased to $1.41, an impressive 21.6% increase from 2006 while our DI per unit increased by 12.9% over the previous year to end at $1.49. This past year we also strengthened our balance sheet by reducing our mortgage debt to gross book value to less than 50% by year end, and our distribution payout ratio to less than 75% of FFO.
Our objective is to produce a stable and growing stream of cash distributions for our unitholders from the ownership and management of high quality offi ce, retail and industrial properties in primary and growing secondary markets in western Canada. Today, all Artis properties are located in primary western Canadian markets, such as Calgary, Winnipeg, Saskatoon and Edmonton, as well as in thriving secondary markets, like Fort McMurray, the heart of Canada’s oil sands development. We are focused in the west as key economic fundamentals and positive demographics continue to outpace the rest of Canada and other submarkets in North America. We believe this focus provides our investors with a unique opportunity to realize the benefi ts of a strong landlord’s market.
Offi ce 43.6%
Industrial 26.3%
Retail 30.1%
Portfolio Leaseable Square Feet by Asset Class
B.C. 3.5%
Manitoba 32.1%
Portfolio Leaseable Square Feet by Province
Saskatchewan 6.9%
Alberta 57.5%
MESSAGE FROM THE PRESIDENT AND C.E.O.
2007 ANNUAL REPORT | 5

MESSAGE FROM THE PRESIDENT AND C.E.O.
2007 ACQUISITION PROGRAM
Our disciplined and focused acquisition program has been a signifi cant driver of growth to date. In 2007, Artis completed $567 million of acquisitions, comprising 45 commercial properties in western Canada.
We are pleased to report that in 2007 we continued to fi nd opportunities to acquire properties with strong embedded growth profi les in our target markets. These included properties such as North City Centre, a newly redeveloped retail complex in Edmonton, and a six property retail portfolio acquired in Fort McMurray. Our portfolio provides a signifi cant opportunity to realize substantial embedded growth. We estimate that our average in-place rent rates at December 31, 2007, were approximately 28% below current market rents.
We are confi dent that we can achieve signifi cant growth in revenues and net operating income as we renew expiring leases at higher rental rates.
We have also sought to further diversify our portfolio in 2007, acquiring properties with longer-term tenancies in place or properties in more stable markets. TransAlta Place is an excellent example as TransAlta Corp is a BBB rated tenant, occupying an entire downtown Calgary offi ce building, on a fully net and “carefree” lease to 2023. Another example is the November acquisition of a 16 building industrial portfolio in Winnipeg, which is a very stable market. These properties are well-located in established industrial zones with many long-term tenancies in place. Including all acquisitions to December 31, 2007, our portfolio is comprised of 80 offi ce, retail and industrial properties across western Canada.
Heritage Square AtriumCALGARY, ALBERTA
In 2007, Artis completed $567 million of acquisitions, comprising 45 commercial properties in western Canada.
2007 Acquisitions # of Properties GLA (000’s of square feet)
Offi ce 12 1,272
Retail 11 505
Industrial 22 1,398
TOTAL OF 3.2 MILLION SQUARE FEET
6 | ARTIS REIT

Our acquisition program has been fi nanced in large part from new equity. In 2007, we concluded three public offerings of units for gross proceeds of $259 million, as well as the private placement of a $20 million convertible debenture. Mortgage or vendor take-back loans were secured to fi nance the balance of the purchase prices. We carefully monitor our leverage and are pleased to advise that our mortgage debt to gross book value was reduced from 52.1% at the end of 2006 to 49.2% at the end of 2007. This is well within our targeted range and far below the 70% allowed under our Declaration of Trust. And, in spite of much turbulence in the credit markets in the latter part of 2007, we continued to negotiate attractive fi nancing for our properties. Our weighted average interest rate on mortgage debt decreased from 5.51% to 5.42% and our weighted average term to maturity on mortgages is 6.0 years.
MESSAGE FROM THE PRESIDENT AND C.E.O.
Our mortgage debt to gross book value was reduced from 52.1% at the end of 2006 to 49.2% at the end of 2007.
Government Entities by GLA Share
Federal Government 2.8%
Provincial Government 4.8%
Civic or Municipal Government 1.3%
Total Government by GLA 8.9%
Top Ten Tenants by GLA Share
Trans Alta Corp. 5.6%
Red River Packaging 3.2%
Reliance Products 2.9%
Jacobs Canada 2.6%
Sears 1.7%
Credit Union Central 1.4%
Shoppers Drug Mart 1.4%
MTS Allstream 1.3%
Komunik 1.2%
Cineplex Odeon 1.1%
Total of Top Ten by GLA 22.4%
Vacancy2.6%
Local & Regional 38.5%
National50%
Portfolio Tenant Mix by GLA
Government8.9%
Winnipeg Square WINNIPEG, MANITOBA
2007 ANNUAL REPORT | 7

8 | ARTIS REIT
2007 LEASING AND OPERATIONAL RESULTS
Acquisition-driven growth is only one part of our growth story. Internal growth, achieved from the active management of our portfolio, is a consistent and signifi cant source of growing returns for our unitholders. Our leasing program was highly effective and in 2007 we surfaced signifi cant embedded value from our portfolio, as illustrated by the solid growth in all of our key internal growth measures.
Occupancy rates across the portfolio increased year-over-year to 97.4% at the close of 2007 compared to 95.8% at the start of the year. On a same property basis, occupancy increased from 95.8% to 96.4%.
Overall 2007 property NOI was 68.0% of revenue, a signifi cant increase from 64.0% in 2006.
Year-over-year same property NOI growth increased an impressive 8.5% as a result of positive absorption of space in the properties and rate increases achieved on lease rollovers.
In 2007, we achieved renewal rates that were on average 35% higher than the rate on the expiring leases.
DEVELOPMENTS AND DISPOSITIONS
We continue to pursue new project development opportunities – mainly in Alberta. Artis has forward-purchased a 225,000 square foot, Class A offi ce building to be completed in late 2008 at an accretive capitalization rate. We have also acquired vacant zoned land in the Calgary region and entered into a joint venture agreement that will see the development of a new 211,000 square feet, Class A offi ce building, with completion targeted for 2010.
Additional new development opportunities exist within our current portfolio that will serve to improve the overall internal rate of return for our investors. One example is the two-storey addition that we have just started at the Millennium Centre , in Red Deer, Alberta, which we expect to complete in 2008.
From time to time we may dispose of non-core properties, realizing gains on those dispositions. In 2006 we disposed of two such properties for a net gain of $828,000 and in 2007, we sold a third property realizing a gain of $2.5 million. We continue to assess our portfolio properties on an on-going basis for opportunities such as these, where capital can be recycled and reinvested in properties more suited to our portfolio.
MESSAGE FROM THE PRESIDENT AND C.E.O.
Millenium CentreRED DEER, ALBERTA
Internal growth, achieved from the active management of our portfolio, is a consistent and signifi cant source of growing returns for our unitholders.
In 2007, we achieved renewal rates that were on average 35% higher than the rate on expiring leases.

2007 ANNUAL REPORT | 9
THE OUTLOOK: DISCIPLINED GROWTH IN OUR TARGET MARKETS
We are entering 2008 with a quality property portfolio, profi table operations, and a solid fi nancial position. Economic fundamentals in western Canada are strong. Oil and gas production and oil-sands development continue to be signifi cant growth drivers in Alberta. Global demand for potash, uranium and other precious metals, as well as agricultural commodities continue to fuel growth across the western Canadian region.
In spite of challenges in the capital markets, we are well-positioned for future growth. We are operating well within our debt capacity, with cash on hand and signifi cant room available on our line of credit to pursue further accretive acquisitions. We have continued to execute on our western Canadian acquisition program with four properties, comprising approximately 232,000 square feet of leasable area, acquired thus far in 2008. We also have an outstanding embedded growth profi le. At December 31, 2007, in-place rental rates on our 2008 lease maturities were estimated to be approximately 39% below market rates. Nearly 25% of our portfolio leasable area is expiring within the next two years.
In a few short years, we have built Artis into a prominent Canadian real estate investment trust and are in fact the only “pure-play” western Canadian REIT. We have delivered three successive years of improved fi nancial performance – increasing our DI and FFO per unit results while reducing our leverage and payout ratios. This exceptionally strong performance demonstrates the strength and viability of our business model. It also indicates the business acumen of our management, the wise counsel of our Board of Trustees, the diligence of our staff and the confi dence placed in Artis REIT by our unitholders. I sincerely thank them all and look forward to reporting further achievement of the REIT’s objectives in 2008 as we continue to attain new heights.
MESSAGE FROM THE PRESIDENT AND C.E.O.
Armin MartensPRESIDENT AND CHIEF EXECUTIVE OFFICER
(left to right ) Armin MartensKirsty StevensJim GreenDoug McGregorCornelius MartensDoug Hare Dennis Wong

10 | ARTIS REIT
PORTFOLIO SUMMARY
Focused Growth Western Canada
Saskatoon
Regina Calgary
Medicine Hat
Edson
Edmonton
Grand Prairie
Kamloops
Winnipeg
Fort McMurray
Red Deer
Vancouver
Nanaimo
3.5% of GLA
57.5% of GLA
6.9% of GLA
32.1% of GLABritish Columbia
Alberta
Saskatchewan
Manitoba

2007 ANNUAL REPORT | 11
OFFICE 43.6 % of GLA
RETAIL 30.1 % of GLA
INDUSTRIAL 26.3 % of GLA

12 | ARTIS REIT
(1) Member of Audit Committee
(2) Member of Governance and Compensation Committee
(3) Member of Investment Committee
(4) Member of Special Committee
Armin MartensTRUSTEEPRESIDENT AND CEO
Cornelius MartensTRUSTEEEXECUTIVE VICE PRESIDENT
Edward Warkentin(2)(3)(4)
TRUSTEE CHAIRMAN
Allan McLeod(1)(2)(4)
TRUSTEE
Victor Thielmann(1)(2)(4)
TRUSTEE
Wayne Townsend(1)(3)
TRUSTEE
Delmore Crewson(1)(3)(4)
TRUSTEE
Artis’ board benefi ts from the varied backgrounds of our individual trustees, including expertise in the areas of real estate, construction, fi nancial services, law and engineering. Five of seven of the board members are independent of management and all committees of the board are comprised solely of independent trustees. The REIT’s board members strive to uphold high standards of corporate governance and work to ensure Artis conducts its affairs to a high standard of ethical conduct.
CORPORATE GOVERNANCE

2007 ANNUAL REPORT | 13
The Audit Committee is charged with the responsibility for oversight of the annual audit, management’s reporting on internal controls, annual and interim fi nancial reporting and the review and recommendation for approval of fi nancial statements and other public disclosures
of a fi nancial nature. All of the committee’s members are independent of management; the committee is chaired by Mr. Crewson, FCA.
AUDIT COMMITTEE
The Corporate Governance and Compensation Committee is charged with responsibility for the development of effective corporate governance practices, including matters related to trust stewardship, board size and composition, and trustees’ remuneration. The Committee is also responsible for management’s remuneration, unit option plans and succession planning. All of the committee’s members are independent of management; the committee is chaired by Mr. Warkentin, Chairman of Artis.
The Governance and Compensation Committee has established a sub-committee called the Disclosure Committee. The Disclosure Committee is comprised
of the President and CEO of Artis, the Chairman of Artis and the Chief Financial Offi cer of Artis. The subcommittee has adopted a disclosure policy to address, among other things, the timely and accurate public dissemination of material information and the protection of confi dential information.
CORPORATE GOVERNANCE AND COMPENSATION COMMITTEE
The Investment Committee is responsible for reviewing all proposals regarding investments, dispositions and fi nancings of Artis, and making recommendations to the board with a view to achieving the strategic objective of acquiring a portfolio of quality assets and delivering the benefi ts of such asset ownership to Unitholders. All of the
committee’s members are independent of management. The Investment Committee operates within the detailed investment and operating policies set out in the REIT’s Declaration of Trust. The committee is chaired by Mr. Townsend.
INVESTMENT COMMITTEE
The Special committee was struck to evaluate, on a twice-annual basis, the continuation of the Asset Management Agreement between Artis and its external manager, Marwest Management Canada Ltd. All of the committee’s members are independent of management. The committee is chaired by Mr. Warkentin.
SPECIAL COMMITTEE

The following is management’s discussion and analysis (“MD&A”) of the financial condition and results of operations
of Artis Real Estate Investment Trust (“Artis” or the “REIT”) and should be read in conjunction with the REIT’s audited
annual consolidated financial statements for the years ended December 31, 2007 and 2006, and the notes thereto.
This MD&A has been prepared taking into account material transactions and events up to and including
March 19, 2008. Additional information about Artis, including the REIT’s most recent Annual Information Form,
has been filed with applicable Canadian securities regulatory authorities and is available at www.sedar.com
or on our web site at www.artisreit.com.
OVERVIEW 15
2007 - ANNUAL HIGHLIGHTS 18
SELECTED FINANCIAL INFORMATION 19
ANALYSIS OF OPERATING RESULTS 20
DISTRIBUTABLE INCOME
AND DISTRIBUTIONS 25
FUNDS FROM OPERATIONS 27
ANALYSIS OF FINANCIAL POSITION 28
LIQUIDITY AND CAPITAL RESOURCES 33
SUMMARIZED QUARTERLY
INFORMATION 34
RELATED PARTY TRANSACTIONS 37
OUTSTANDING UNIT DATA 37
2008 OUTLOOK 38
RISKS AND UNCERTAINTIES 38
CRITICAL ACCOUNTING ESTIMATES 40
CHANGES IN ACCOUNTING POLICIES 40
CONTROLS AND PROCEDURES 41
MANAGEMENT’S DISCUSSION AND ANALYSISAll amounts are in $000’s, unless otherwise noted
14 | ARTIS REIT

FORWARD LOOKING DISCLAIMER
This MD&A contains forward looking statements. For this purpose, any statements contained herein that are not statements of historical fact may be deemed to be forward-looking statements. Particularly, statements regarding the REIT’s future operating results, performance and achievements are forward looking statements. Without limiting the foregoing, the words “expects”, “anticipates”, “intends”, “estimates”, “projects”, and similar expressions are intended to identify forward looking statements.
Artis is subject to significant risks and uncertainties which may cause the actual results, performance or achievements of the REIT to be materially different from any future results, performance or achievements expressed or implied in these forward looking statements. Such risk factors include, but are not limited to, risks associated with real property ownership, availability of cash flow, general uninsured losses, future property acquisitions, environmental matters, tax related matters, debt financing, unitholder liability, potential conflicts of interest, potential dilution, reliance on key personnel, changes in legislation and changes in the tax treatment of trusts. Artis cannot assure investors that actual results will be consistent with any forward-looking statements and Artis assumes no obligation to update or revise such forward-looking statements to reflect actual events or new circumstances. All forward-looking statements contained in this MD&A are qualified by this cautionary statement.
OVERVIEW
Artis, formerly Westfield Real Estate Investment Trust, is an unincorporated open end real estate investment trust created under, and governed by, the laws of the province of Manitoba. The REIT was created as a closed end trust pursuant to the Declaration of Trust dated November 8, 2004.
The REIT’s Declaration of Trust was subsequently amended and restated on October 31, 2006, giving effect to the conversion of the REIT from a closed-end trust to an open-end trust. On February 15, 2007, the REIT underwent a name change from “Westfield Real Estate Investment Trust” to “Artis Real Estate Investment Trust”.
Certain of the REIT’s securities are listed on the Toronto Stock Exchange (“the TSX”). The REIT’s trust units (“units”) trade under the symbol AX.UN, and the REIT’s Series A, Series B and Series C convertible debentures trade under the symbols AX.DB.A, AX.DB.B and AX.DB.C, respectively. As at March 19, 2008, there were 31,746,696 units, and 1,458,337 options of Artis outstanding as well as 721,347 Class B limited partnership units (“Class B units”) of the REIT’s subsidiary AX L.P. (“AXLP”) (refer to the 2008 Outlook-Subsequent Events section for further details).
PRIMARY OBJECTIVES
Artis focuses on primary and growing secondary markets in western Canada, with a particular emphasis on Alberta. The REIT focuses exclusively on commercial properties; retail, office and industrial, with strong tenancies in place.
The REIT’s primary objectives are:
to provide unitholders with stable and growing cash distributions, payable monthly and, to the maximum extent practicable, income tax deferred, from investments in a diversified portfolio of income-producing office, retail and industrial properties located in western Canada, primarily in Alberta;
to enhance the value of the REIT’s assets and maximize long term unit value through the active management of its assets; and
to expand the REIT’s asset base and increase its distributable income through acquisitions in western Canada.
The Declaration of Trust provides that Artis make monthly cash distributions to its unitholders. The amount distributed in each year will be the amount of distributable income set down in a policy by the Trustees (currently $1.05 per unit on an annualized basis).
MANAGEMENT’S DISCUSSION AND ANALYSISAll amounts are in $000’s, unless otherwise noted
2007 ANNUAL REPORT | 15

PORTFOLIO SUMMARY
At December 31, 2007, the REIT’s portfolio was comprised of 80 commercial properties located across western Canada totaling approximately 6.1 million square feet (s.f.) of gross leasable area (“GLA”).
Office 43.6%
Industrial 26.3%
Retail 30.1%
GLA by Asset Class
B.C. 3.5%
Manitoba 32.1%
GLA by Province
Saskatchewan 6.9%
Alberta 57.5%
Lease Expiries by Asset Class (in 000’s of s.f.) (1)
Alberta British Columbia Manitoba Ontario
GLA % GLA % GLA % GLA %
2008* 493 14.0% 6 2.7% 183 9.4% 65 15.6%
2009 395 11.3% 26 12.3% 278 14.3% 54 12.9%
2010 508 14.6% 41 19.2% 246 12.6% 85 20.5%
2011 636 18.2% 21 9.8% 161 8.3% 40 9.6%
2012 271 7.8% 46 21.5% 236 12.1% 23 5.5%
2013+ 1,132 32.6% 72 33.5% 747 38.5% 134 32.3%
3,435 98.6% 212 99.% 1,851 95.2% 401 96.4%
Vacancies 50 1.4% 2 1.0% 93 4.8% 15 3.6%
Total GLA 3,485 100.0% 214 100.0% 1,944 100.0% 416 100.0%
*including month-to-month leases
Lease Expiries by Asset Class (in 000’s of s.f.) (1 )
Office Retail Industrial Total
GLA % GLA % GLA % GLA %
2008* 471 17.8% 130 7.1% 146 9.1% 747 12.3%
2009 241 9.1% 226 12.4% 286 17.9% 753 12.4%
2010 340 12.9% 339 18.6% 201 12.6% 880 14.5%
2011 412 15.6% 218 11.9% 228 14.3% 858 14.2%
2012 321 12.2% 137 7.5% 118 7.4% 576 9.5%
2013+ 749 28.4% 742 40.7% 594 37.3% 2,085 34.5%
2,534 96.0% 1,792 98.2% 1,573 98.6% 5,899 97.4%
Vacancies 105 4.0% 33 1.8% 22 1.4% 160 2.6%
Total GLA 2,639 100.00% 1,825 100.00% 1,595 100.0% 6,059 100.0%
*including month-to-month leases
MANAGEMENT’S DISCUSSION AND ANALYSISAll amounts are in $000’s, unless otherwise noted
16 | ARTIS REIT
(1) Based on Artis’ proportionate share of the total 6.1 million s.f. of GLA.

Historical Weighted Average Portfolio Occupancy
NOTICE RESPECTING NON-GAAP MEASURES
Distributable Income (“DI”), Property Net Operating Income (“Property NOI”) and Funds from Operations (“FFO”) are non GAAP measures commonly used by Canadian income trusts as an indicator of financial performance. “GAAP” means the generally accepted accounting principles described by the Canadian Institute of Chartered Accountants which are applicable as at the date on which any calculation using GAAP is to be made.
Artis calculates Distributable Income, or “DI”, to reflect distributable cash which is defined in the REIT’s Declaration of Trust as net income in accordance with GAAP, subject to certain adjustments as set out in the Declaration of Trust, including: (i) adding back amortization (excluding leasing costs) and accretion to the carrying value of debt and (ii) excluding gains or losses on the disposition of any asset, and (iii) adding or deducting other adjustments as determined by the Trustees at their discretion. Given that one of the REIT’s objectives is to provide stable cash flows to investors, management believes that DI is an indicative measure for evaluating the REIT’s operating performance in achieving its objectives.
Artis calculates Property NOI as revenues, prepared in accordance with GAAP, less property operating expenses such as taxes, utilities, repairs and maintenance. Property NOI does not include charges for interest and amortization. Management considers Property NOI to be a valuable measure for evaluating the operating performance of the REIT’s properties.
Artis calculates FFO, substantially in accordance with the guidelines set out by the Real Property Association of Canada (“RealPAC”). Management considers FFO to be a valuable measure for evaluating the REIT’s operating performance in achieving its objectives.
Property NOI, DI and FFO are not measures defined under GAAP. Property NOI, DI and FFO are not intended to represent operating profits for the year, or from a property, nor should any of these measures be viewed as an alternative to net income, cash flow from operating activities or other measures of financial performance calculated in accordance with GAAP. Readers should be further cautioned that DI, Property NOI and FFO as calculated by Artis may not be comparable to similar measures presented by other issuers.
On July 6, 2007 the Canadian Securities Administrators issued an amended National Policy 41-201 Income Trusts and Other Indirect Offerings which includes disclosure guidance for income trusts, including guidance relating to the disclosure of distributable income. The REIT adopted the required disclosure in 2007.
Lease Expiries by Asset Class (in 000’s of s.f.) (1 )
Office Retail Industrial Total
GLA % GLA % GLA % GLA %
2008* 471 17.8% 130 7.1% 146 9.1% 747 12.3%
2009 241 9.1% 226 12.4% 286 17.9% 753 12.4%
2010 340 12.9% 339 18.6% 201 12.6% 880 14.5%
2011 412 15.6% 218 11.9% 228 14.3% 858 14.2%
2012 321 12.2% 137 7.5% 118 7.4% 576 9.5%
2013+ 749 28.4% 742 40.7% 594 37.3% 2,085 34.5%
2,534 96.0% 1,792 98.2% 1,573 98.6% 5,899 97.4%
Vacancies 105 4.0% 33 1.8% 22 1.4% 160 2.6%
Total GLA 2,639 100.00% 1,825 100.00% 1,595 100.0% 6,059 100.0%
*including month-to-month leases
Q1-06 Q2-06 Q3-06 Q4-06 Q1-07 Q2-07 Q3-07 Q4-07
93.5% 94.9% 95.8% 95.8% 96.3% 97.2% 97.1% 97.4%
MANAGEMENT’S DISCUSSION AND ANALYSISAll amounts are in $000’s, unless otherwise noted
2007 ANNUAL REPORT | 17

2007 – ANNUAL HIGHLIGHTS
PORTFOLIO GROWTH
In 2007, Artis acquired 45 commercial properties in western Canada, adding nearly 3.2 million square feet of leasable area to the portfolio, as follows:
Highlights of the REIT’s 2007 acquisition activity include the purchase of TransAlta Place, a single-tenant office building located in the Calgary Beltline District. TransAlta Place is comprised of over 336,000 square feet of leasable area, and is 100% occupied. Artis also acquired the Winnipeg Industrial portfolio; 16 industrial properties located in Winnipeg, MB, with a total leaseable area of 949,000 square feet. The portfolio is 98% occupied. Artis acquired six retail properties located in Fort McMurray, AB, and one retail property located in Edmonton, AB. The total leaseable area of the portfolio is 269,000 square feet and the portfolio is 98.3% occupied.
Effective September 1, 2007, the REIT disposed of Royal Square. The proceeds, net of costs, were $4,591. Consideration received was the assumption of the existing mortgage in the amount of $1,729, a promissory note in the amount of $310, and cash in the amount of $2,552. The assets, intangible assets and liabilities associated with the property were removed from the books and a gain on sale of property in the amount of $2,511 was recorded.
FINANCING ACTIVITIES
On January 18, 2007, Artis announced it had entered into a bought-deal arrangement with a syndicate of underwriters for the sale of 5,050,000 units (exclusive of units issuable upon the exercise of the over allotment option granted to the underwriters) at a price of $15.85 per unit. The offering closed on February 8, 2007, for aggregate gross proceeds of $80.0 million. On February 20, 2007, the underwriting syndicate exercised its over-allotment option and a further 757,500 units were issued for aggregate proceeds of $12.0 million.
On May 10, 2007, Artis announced it had entered into a bought-deal arrangement with a syndicate of underwriters for the sale of 5,232,500 units (inclusive of units issuable upon the exercise of the over-allotment option granted to the underwriters) at a price of $17.60 per unit. The underwriting syndicate exercised its over-allotment option in full prior to closing of the offering on June 11, 2007. Aggregate gross proceeds of $92.1 million were raised from the offering.
On September 26, 2007, Artis announced it had entered into a bought-deal arrangement with a syndicate of underwriters for the sale of 4,230,000 units (exclusive of units issuable upon the exercise of the over–allotment option granted to the underwriters) at a price of $17.75 per unit. The offering closed on October 17, 2007, for aggregate gross proceeds of $75.1 million.
In conjunction with the acquisition of the Fort McMurray portfolio, the REIT issued a 5% Series D convertible redeemable debenture with a face value of $20.0 million. Interest is paid semi annually on May 31 and November 30. The convertible debenture is convertible into units of the REIT, at the option of the holder, after November 30, 2009 at a price of $17.75 per unit.
On December 12, 2007, the REIT announced that the Toronto Stock Exchange (the “Exchange”) had approved its normal course issuer bid. Under the bid, the REIT will have the ability to purchase for cancellation up to a maximum of 3,055,099 units, representing 10% of the REIT’s float of 30,550,991 on December 13, 2007. Purchases will be made at market prices through the facilities of the Exchange. The bid commenced on December 14, 2007, and will remain in effect until the earlier of December 13, 2008, or the date on which
Office Retail Industrial Total
# of
PropertiesS.F.
(000’s)# of
PropertiesS.F.
(000’s)# of
PropertiesS.F.
(000’s)# of
PropertiesS.F.
(000’s)
Portfolio properties at December 31, 2006 12 1,367 21 1,362 3 196 36 2,925
Q1-07 Acquisitions 5 462 1 55 3 389 9 906
Q2-07 Acquisitions 3 144 1 37 2 37 6 218
Q3-07 Acquisitions 2 540 1 98 1 23 4 661
Q4-07 Acquisitions 2 126 8 314 16 950 26 1,390
Total 2007 Acquisitions 12 1,272 11 504 22 1,399 45 3,175
Less Disposition – – 1 41 – – 1 41
Portfolio properties at December 31, 2007 24 2,639 31 1,825 25 1,595 80 6,059
MANAGEMENT’S DISCUSSION AND ANALYSISAll amounts are in $000’s, unless otherwise noted
18 | ARTIS REIT

the REIT has purchased the maximum number of units permitted under the bid. As of December 31, 2007, the REIT had acquired 13,000 units for cancellation at market prices aggregating $196. These units were cancelled in January, 2008. Subsequent to December 31, 2007, the REIT acquired and cancelled an additional 32,600 at market prices aggregating $469.
CREDIT FACILITY
On September 28, 2007 Artis entered into an agreement for a revolving term credit facility in the amount of $75,000, which may be utilized to fund acquisitions of office, retail and industrial properties. $7,500 may be used for general corporate purposes and, as per an amendment to the
agreement dated January 31, 2008, an additional $10,000 of the credit facility is available to purchase units under the normal course issuer bid. As at December 31, 2007, no amounts had been drawn on the facility. Subsequent to December 31, 2007, the REIT has drawn an aggregate of $10,200 of the available credit facility for bridge financing on the acquisitions of King Edward Centre and the Leon’s Building.
DISTRIBUTIONS
Artis distributed a total of $26,348 to unitholders and AXLP, the REIT’s subsidiary, distributed $758 to Class B unitholders in 2007 at a stable rate of $1.05 on an annualized basis.
Artis has acquired 45 commercial properties during 2007, increasing the portfolio to 80 commercial properties at December 31, 2007. Primarily as a result of this on-going acquisition activity, Artis increased revenues $45,737, or 85.5% compared to 2006 results. Artis increased Property NOI $33,218, or 97.0% compared to 2006 results. As well, DI and FFO increased $21,760, or 137.0% and $21,675, or 154.9%, respectively.
On a per unit basis, basic FFO increased $0.25 or 21.6% compared to 2006 results. Basic DI increased $0.17 or 12.9% compared to 2006 results.
$000’s, except unit and per unit amounts Year ended December 31,
2007 2006
Revenue $ 99,259 $ 53,522
Property NOI $ 67,469 $ 34,251
Income (loss) for the year $ 6,157 $ (11,153)
Basic income (loss) per unit $ 0.25 $ (0.94)
Distributions (including Class B units) $ 27,106 $ 12,874
Distributions per unit $ 1.05 $ 1.05
DI $ 37,638 $ 15,878
DI per unit $ 1.49 $ 1.32
DI payout ratio 70.5% 79.5%
FFO $ 35,670 $ 13,995
FFO per unit $ 1.41 $ 1.16
FFO payout ratio 74.5% 90.5%
Weighted average units:
Weighted average units (basic) 24,616,119 11,907,917
Weighted average units (basic) including Class B units 25,337,466 12,015,853
SELECTED FINANCIAL INFORMATION
MANAGEMENT’S DISCUSSION AND ANALYSISAll amounts are in $000’s, unless otherwise noted
2007 ANNUAL REPORT | 19

Revenue includes all amounts earned from tenants related to lease agreements, including basic rent, parking, operating cost and realty tax recoveries, as well as adjustments for the straight–lining of rents and above- or below-market rate adjustments recorded in accordance with GAAP.
In accordance with GAAP, Artis accounts for rent step ups by straight-lining the incremental increases over the entire non-cancelable lease term. In 2007, straight-line rent adjustments of $1,369 were recorded compared to $1,063 in 2006. In Q4-07, the straight-line rent adjustments were $465 compared to $377 in Q4-06.
On the acquisition of properties, Artis records intangible assets and liabilities resulting from above- and below-
market rent leases. These intangible assets and liabilities are amortized to revenue over the term of the related leases. Since December 31, 2006, Artis acquired 45 commercial properties; in-place rent rates in a number of the 2007 acquisitions are considered to be below market rent rates. As a result, in 2007, the adjustment to market rents was $9,554 compared to $3,036 in 2006. In Q4-07, the adjustment to market rents was $3,352 compared to $1,069 in Q4-06.
Revenue in 2007 included $3,093 of interest earned by the REIT compared to $910 in 2006. Interest income was $599 in Q4-07, compared to $254 in Q4-06. The increase in interest income resulted from the short term investment of funds received from the current year’s unit offerings.
ANALYSIS OF OPERATING RESULTS
$000’s, except unit and per unit amounts
Three month period ended December 31, Year ended December 31,
2007 % of
Revenue 2006 % of
Revenue 2007 % of
Revenue 2006 % of
Revenue
Revenue $ 31,850 $ 16,489 $ 99,259 $ 53,522
Property operating expenses 9,753 30.6% 6,056 36.7% 31,790 32.0% 19,271 36.0%
Property NOI 22,097 69.4% 10,433 63.3% 67,469 68.0% 34,251 64.0%
Interest 8,737 27.4% 4,834 29.3% 28,194 28.4% 17,003 31.8%
13,360 5,599 39,275 17,248
Expenses:
Corporate 1,382 4.3% 994 6.0% 4,798 4.8% 3,081 5.8%
Amortization 12,873 7,864 41,225 26,148
14,255 8,858 46,023 29,229
Loss before the under-noted (895) (3,259) (6,748) (11,981)
Gain on disposal of income-producing properties (10 ) – 2,511 828
Loss before income taxes (905) (3,259) (4,237) (11,153)
Future income tax recovery (expense) (1,433) – 10,394 –
Income (loss) for the period $ (2,338) $ (3,259) $ 6,157 $ (11,153)
Basic income (loss) per unit $ (0.03 ) $ (0.22 ) $ 0.25 $ (0.94 )
Diluted income (loss) per unit $ (0.03 ) $ (0.22 ) $ 0.24 $ (0.94 )
Weighted average number of units:
Basic 30,411,628 14,725,024 24,616,119 11,907,917
Diluted 31,132,975 14,725,024 25,477,421 11,907,917
Revenue and Property NOI:
MANAGEMENT’S DISCUSSION AND ANALYSISAll amounts are in $000’s, unless otherwise noted
20 | ARTIS REIT

Same Property NOI growth:
In 2007, Artis achieved an increase of $1,095, or 5.0% of Property NOI over 2006. As well, Artis also achieved an increase of $1,651, or 8.5% of Property NOI less non-cash revenue adjustments over 2006. These improvements are the result of absorption of space in the portfolio and rate increases on lease rollovers, particularly in Alberta. These same property growth results do not include the
impact of growth realized on lease turnovers in properties acquired throughout fiscal 2006 and 2007. In Q4-07, Artis achieved an increase of $154, or 2.8% of Property NOI over Q4-06. As well, Artis also achieved an increase of $438, or 9.0% of Property NOI less non-cash revenue adjustments over Q4-06.
Property operating expenses include realty taxes as well as other costs related to interior and exterior maintenance, HVAC, elevator, insurance, utilities and management fees.
Revenue and property operating expenses increased over 2006 as a result of acquiring 45 properties during the year.
For 2007, Property NOI as a percentage of revenue was 68.0%, compared to 64.0% in 2006. This increase is attributable to a higher proportion of fully net and “carefree” properties in the portfolio, such as TransAlta Place. For the three months ended December 31, 2007 and 2006, Property NOI as a percentage of revenue was 69.4% and 63.3%, respectively.
(1) Same property comparison includes only income-producing properties owned on January 1, 2006 and December 31, 2007.
Property NOI by asset class:
Property NOI results by asset class and province have been impacted by acquisitions concluded since December 31, 2006.
$000’s Year ended December 31,
2007 2006
Retail Office Industrial Retail Office Industrial
Revenue $ 33,067 $ 57,000 $ 7,118 $ 25,356 $ 26,353 $ 889
Property operating expenses 9,669 20,383 1,738 7,082 11,940 249
Property NOI $ 23,398 $ 36,617 $ 5,380 $ 18,274 $ 14,413 $ 640
Share of Property NOI 35.8% 56.0% 8.2% 54.8% 43.3% 1.9%
$000’s
Three month period ended December 31, (1)
Year ended December 31, (1)
2007 2006 2007 2006
Revenue $ 9,502 $ 9,463 $ 37,838 $ 36,251
Property operating expenses 3,804 3,919 14,987 14,495
Property NOI 5,698 5,544 22,851 21,756
Deduct non-cash revenue adjustments:
Straight-line rent adjustment (23) (234) (339) (710)
Above- and below-market rent (368) (441) (1,536) (1,721)
Property NOI less non-cash revenue adjustments $ 5,307 $ 4,869 $ 20,976 $ 19,325
MANAGEMENT’S DISCUSSION AND ANALYSISAll amounts are in $000’s, unless otherwise noted
2007 ANNUAL REPORT | 21

Consistent with its stated focus, Artis will continue to weight the portfolio’s Property NOI more heavily in Alberta, to take advantage of the strong economic fundamentals in that province. Management believes that there is growth inherent in the REIT’s portfolio that will be realized as below-market leases are renewed at higher rates. This is expected to increase Property NOI, particularly in Alberta, where the gap between in-place rents and market rents are highest.
Interest:
The current year’s interest on long-term debt is attributable to mortgages and other loans secured against the income-producing properties, as well as convertible debentures outstanding. Interest expense has increased over 2006 due to additional mortgage financing obtained to support the increased asset base of the REIT. Effective January 1, 2007, Artis adopted new accounting policies for financial instruments. As a result, on a prospective basis, financing costs are no longer deferred and amortized over the terms of the underlying agreements, and instead are netted against the related debt. Interest and financing costs are recorded on an effective interest basis.
The REIT’s weighted average effective rate for the year ending December 31, 2007 on mortgages and other debt secured by properties was 5.51%. The weighted average nominal interest rate at December 31, 2007 was 5.42% compared to 5.51% at December 31, 2006.
At the time of issue, the convertible debentures are allocated between their equity and liability components in accordance with GAAP. Artis recorded interest expense of $4,958 on the carrying value of debentures outstanding in 2007, compared to $4,257 in 2006; the increase is the net result of the decrease in interest from conversions between December 31, 2006 and December 31, 2007, additional interest resulting from the issuance of the Series D convertible debenture, and the amortization of deferred financing costs in interest expense resulting from the adoption of accounting policies relating to financial instruments. Artis recorded interest expense of $1,245 on the carrying value of debentures outstanding in Q4-07, compared to $1,074 in Q4-06
Property NOI by province:
$000’s Year ended December 31,
2007 2006
MB SK AB BC MB SK AB BC
Revenue $ 15,609 $ 10,534 $ 67,976 $ 3,066 $ 8,822 $ 10,306 $ 32,494 $ 976
Property operating expenses 6,986 3,580 20,276 948 4,191 3,294 11,508 278
Property NOI $ 8,623 $ 6,954 $ 47,700 $ 2,118 $ 4,631 $ 7,012 $ 20,986 $ 698
Share of Property NOI 13.2% 10.6% 73.0% 3.2% 13.9% 21.0% 63.0% 2.1%
Corporate expenses:
$000’s Three month period ended
December 31, Year ended
December 31,
2007 2006 2007 2006
Accounting, legal, consulting $ 393 $ 156 $ 1,123 $ 529
Advisory fees 529 286 1,693 939
Public company costs 106 86 453 426
Annual report and AGM – – 123 61
Unit-based compensation 262 382 1,039 502
Other general and administrative 92 84 367 227
Costs related to bid on property portfolio – – – 397
Total corporate expenses $ 1,382 $ 994 $ 4,798 $ 3,081
MANAGEMENT’S DISCUSSION AND ANALYSISAll amounts are in $000’s, unless otherwise noted
22 | ARTIS REIT

In 2007, accounting, legal and consulting fees increased $594 over 2006, due to additional advice relating to the new SIFT legislation, the determination of the tax status of the REIT, and the increased asset base of the REIT. 2007 advisory fees increased $754 over 2006, reflecting the increased asset base of the REIT. 2007 unit-based compensation costs increased $537 over 2006, due to options granted during the year. In Q4-07, accounting, legal and consulting fees increased $237 over Q4-06, due to the new SIFT legislation and consulting services relating to potential acquisitions. Q4-07 advisory fees increased $243 over Q4-06, reflecting the increased asset base of the REIT. Q4-07 unit based compensation costs decreased $120 over Q4-06, as a result of changes in the vesting period of the latest option grant.
Corporate expenses in 2007 were $4,798, or 4.8% of gross revenues compared to $3,081, or 5.8% of gross revenues in 2006. Corporate expenses in Q4-07 were $1,382, or 4.3% of gross revenues compared to $994, or 6.0% of gross revenues in Q4-06.
Amortization:
Amortization expense includes amortization of the income-producing properties and their related intangible assets, plus office equipment and other assets.
At the time of acquisition, Artis allocates a portion of the purchase price of properties to income-producing properties and a portion to intangible assets. Income-producing properties are amortized on a straight-line basis over their useful lives, resulting in amortization expense of $18,898 in 2007 compared to $10,106 in 2006. Intangible assets, such as the value of in place operating leases and customer relationship values, are amortized on a straight-line basis over the term of the underlying lease agreements. In 2007, Artis recorded $21,536 for the amortization of intangible assets, compared to $15,027 in 2006. Amortization expense was $6,015 in Q4-07 compared to $3,148 in Q4-06. In Q4-07, Artis recorded $6,626 for the amortization of intangible assets, compared to $4,600 in Q4-06. These increases were the result of the increased asset base of the REIT.
In 2007, amortization expense relating to tenant inducements and leasing commissions totaled $784, compared to $246 in 2006. In Q4-07, amortization expense relating to tenant inducements and leasing commissions totaled $231 compared to $137 in Q4-06. These increases were the result of the increased asset base of the REIT.
In 2006, amortization expense included $765 (Q4-06 - $222) of deferred financing costs. Deferred financing costs included legal and other fees incurred
in connection with mortgages and other loans against properties, as well as the issuance of convertible debentures, amortized over the terms of the underlying loan or indenture agreements. As a result of the adoption of new accounting policies for financial instruments, deferred finance costs are no longer included in amortization expense. Interest expense in 2007 includes $532 (Q4-07 - $171) of amortization of deferred financing costs. See Note 2(b) of the Consolidated Financial Statements of the REIT as well as the Changes in Accounting Policies section of this report for further details.
Future income taxes:
The REIT currently qualifies as a mutual fund trust for Canadian income tax purposes. Prior to new legislation relating to the federal income taxation of publicly listed or traded trusts, as discussed below, income earned by the REIT and distributed annually to unitholders was not, and would not be, subject to taxation in the REIT, but was taxed at the individual unitholder level. For financial statement reporting purposes, the tax deductibility of the REIT’s distributions was treated as an exception from taxation as the REIT distributed, and was committed to continue distributing, all of its taxable income to its unitholders. Accordingly, the REIT did not previously record a provision for income taxes or future income tax assets or liabilities.
On June 22, 2007, new legislation relating to, among other things, the federal income taxation of a specified investment flow-through trust or partnership (a “SIFT”) was enacted (the “New SIFT Rules”). A SIFT includes a publicly-listed or traded partnership or trust, such as an income trust.
Under the New SIFT Rules, following a transition period for qualifying SIFTs, certain distributions from a SIFT will no longer be deductible in computing a SIFT’s taxable income, and a SIFT will be subject to tax on such distributions at a rate that is substantially equivalent to the general tax rate applicable to a Canadian corporation. However, distributions paid by a SIFT as returns of capital should generally not be subject to the tax.
The New SIFT Rules do not apply to a “real estate investment trust” that meets prescribed conditions relating to the nature of its assets and revenue (the “REIT Conditions”). The REIT is currently reviewing the New SIFT Rules and is assessing their interpretation and application to the REIT’s assets and revenues. There are uncertainties in the interpretation and application of the New SIFT Rules and it is not possible, at the current time, to determine with certainty whether the REIT will meet the conditions of the REIT Conditions.
MANAGEMENT’S DISCUSSION AND ANALYSISAll amounts are in $000’s, unless otherwise noted
2007 ANNUAL REPORT | 23

The New SIFT Rules provide that a SIFT which was publicly traded before November 1, 2006 will become subject to the tax on distributions commencing with the 2011 taxation year. However, a SIFT may become subject to this tax prior to 2011 if its equity capital increases beyond certain limits measured against the market capitalization of the SIFT at the close of trading on October 31, 2006 (the “Safe Harbour Limits”). In the case of the REIT, its subsequent offerings have exceeded the Safe Harbour Limits. Therefore, commencing on January 1, 2007, subject to the REIT’s ability to meet the REIT Conditions, the REIT is subject to tax on certain income which may adversely impact the level of cash otherwise available for distribution.
If the REIT does not meet the REIT Conditions, the REIT may restructure its affairs in order to minimize, or if possible eliminate, the impact of the New SIFT Rules, if such a restructuring is in the best interests of the untiholders. There can be no assurances, however, that the REIT would be able to restructure such that the REIT would not be subject to the tax imposed by the New SIFT Rules, or that any such restructuring, if implemented, would not result in material costs or other adverse consequences to the REIT and its unitholders.
Under the New SIFT Rules, a flow through subsidiary of the REIT may also be a SIFT. On December 20, 2007, the Minister of Finance announced, in a backgrounder (the “Backgrounder”), his intention to introduce technical amendments to the SIFT definition to exclude certain flow-through subsidiaries of a SIFT that are able to meet certain ownership conditions. Based on the wording in the Backgrounder, it would appear that a flow-through subsidiary of the REIT would be a SIFT, however, until the legislation contemplated by the Backgrounder is enacted, there will continue to be uncertainty.
As management is unable to conclude at the present time if the REIT meets the REIT Conditions, and therefore cannot conclude that the New SIFT Rules do not apply to it, the REIT commenced recognizing future income tax assets and liabilities with respect to the temporary differences between the carrying amounts and tax basis of its assets and liabilities, including those of its subsidiary partnerships, that are expected to reverse after 2007. Future income tax assets or liabilties are recorded using tax rates and laws expected to apply when the temporary differences are expected to reverse. The New SIFT Rules resulted in the REIT recording a future income tax asset of $11,509 in the consolidated balance sheet at December 31, 2007 and a future income tax recovery of $10,394 reflected in consolidated income (loss) for the year ended December 31, 2007. The REIT also credited capital contributions in the amount of $1,115 to adjust for the tax effects of unit issue costs incurred on the issuance of units, and deferred finance costs transferred to capital contributions on the conversion of convertible debentures.
The October 30, 2007, Canadian Federal Economic Statement announced several general corporate income tax rate reductions. Legislation for such rate reductions, which apply to the computation of SIFT tax, received Royal Assent on December 14, 2007. Consequently, in accounting for the REIT’s future income taxes, the impact of these tax rate reductions have been applied in the periods that such temporary differences are expected to reverse.
MANAGEMENT’S DISCUSSION AND ANALYSISAll amounts are in $000’s, unless otherwise noted
24 | ARTIS REIT

DISTRIBUTABLE INCOME (“DI”) AND DISTRIBUTIONS:
Consistent with the application of National Policy 41-201 Income Trusts and Other Indirect Offerings, Artis reconciles DI to cash flows from operating activities, in addition to the net income (loss) for the period.
(1) Added back to 2007 DI is $1,200 (Q4-07 - $300) of Property rent (YTD and Q4-06 - $200), which is cash revenue earned pursuant to the Interplex II purchase and sale agreement not recorded as revenue in the REIT’s Consolidated Statement of Operations due to the project being in the development phase. Included in 2006 DI is $397 of costs attributable to an unsuccessful bid on a portfolio of assets.
(2) The weighted average number of units used in the calculation of basic and diluted DI per unit includes the 721,347 Class B units issued by the REIT’s subsidiary, AXLP. Options and convertible debentures are factored into the diluted weighted average calculation, to the extent that their impact is dilutive
$000’s, except unit and per unit amounts Three month period ended
December 31, Year ended
December 31,
2007 2006 2007 2006
Cash flow from operations $ 11,386 $ 5,098 $ 28,586 $ 13,620
Deduct amortization of:
Office equipment (2 ) (1 ) (7 ) (4 )
Above-market rent (68) (48 ) (226) (213)
Below-market rent 3,420 1,056 9,780 3,249
Tenant inducements and leasing costs (231) (137) (784) (246)
Above-market mortgage 12 29 96 81
Deferred financing costs, non-debenture – (59 ) – (232)
Add: Straight-line rent adjustment 465 370 1,369 1,063
Add (deduct):
Units issued for Trustees compensation – (15 ) – (15 )
Changes in non-cash operating items (2,534) (1,331) (2,147) (2,022)
Deferred financing costs, non-debenture, included in interest expense (67) – (229) –
Other adjustments (1)
Property rent 300 200 1,200 200
Property bid costs – – – 397
DI for the period $ 12,681 $ 5,162 $ 37,638 $ 15,878
DI per unit
Basic $ 0.41 $ 0.34 $ 1.49 $ 1.32
Diluted $ 0.39 $ 0.33 $ 1.42 $ 1.26
Weighted Average Number of Shares
Basic (2) 31,132,975 15,153,247 25,337,466 12,015,853
Diluted (2) 35,114,445 18,577,492 29,382,503 14,844,073
Reconciliation of cash flows from operations to DI:
MANAGEMENT’S DISCUSSION AND ANALYSISAll amounts are in $000’s, unless otherwise noted
2007 ANNUAL REPORT | 25

In 2007, DI has increased $21,760, or 137.0% over 2006. This increase is primarily attributed to the impact of acquisitions since December 31, 2006. Basic DI per unit increased $0.17, or 12.9% over 2006. On a diluted basis, DI has increased $0.16, or 12.7% over 2006. Q4-07 DI has increased $7,519, or 145.7% over Q4-06. Basic DI per unit increased $0.07, or 20.6% over Q4-06. On a diluted basis, DI has increased $0.06, or 18.2% over Q4-06.
As the current year’s acquisitions were not owned for the full period, management anticipates there will be further growth in basic and diluted DI from these acquisitions in future periods, as well as from future acquisitions that the REIT currently has under contract. Management believes that there is further potential DI growth that may be realized as below-market leases are renewed at higher rates, particularly in Alberta, where the gap between in-place rents and market rents is highest.
DISTRIBUTIONS:
Management determines the level of cash distributions based on the level of cash flow from operations before working capital changes, less actual and planned capital expenditures. As well, the REIT is committed to providing unitholders with stable and growing distributions. During the year, distributions are based on estimates of full year cash flow and capital spending; thus distributions may be adjusted as these estimates change. It is expected that normal seasonal fluctuations in working capital will be funded from cash resources. In addition, the distributions declared include a component funded by the distribution reinvestment and unit purchase plan (the “DRIP”).
Reconciliation of GAAP income (loss) to DI:
$000’s
Three month period ended December 31,
Year ended December 31,
Year ended December 31,
Year ended December 31,
2007 2007 2006 2005
Cash flow from operations $ 11,386 $ 28,586 $ 13,620 $ 4,706
Net income (loss) $ (2,338) $ 6,157 $ (11,153) $ (2,519)
Distributions declared $ 8,369 $ 27,106 $ 12,874 $ 3,330
Excess of cash flow from operations over distributions declared $ 3,017 $ 1,480 $ 746 $ 1,376
Shortfall of net income (loss) over distributions declared $ (10,707) $ (20,949) $ (24,027) $ (5,849)
$000’s, except unit and per unit amounts Three month period ended
December 31, Year ended
December 31,
2007 2006 2007 2006
Income (loss) for the period $ (2,338) $ (3,259) $ 6,157 $ (11,153)
Add:
Amortization (excluding amortized leasing costs) 12,640 7,504 40,434 25,133
Amortized financing costs on convertible debentures – 163 – 533
Accretion on liability component of convertible debentures 374 172 1,713 1,094
Unit based compensation expense 262 382 1,039 502
Gain on disposal of income-producing properties 10 – (2,511) (828)
Future income tax recovery 1,433 – (10,394) –
Other adjustments (1)
Property rent 300 200 1,200 200
Property bid costs – – – 397
DI $ 12,681 $ 5,162 $ 37,638 $ 15,878
(1) Added back to 2007 DI is $1,200 (Q4-07 - $300) of Property rent (YTD and Q4-06 - $200), which is cash revenue earned pursuant to the Interplex II purchase and sale agreement not recorded as revenue in the REIT’s Consolidated Statement of Operations due to the project being in the development phase. Included in 2006 DI is $397 of costs attributable to an unsuccessful bid on a portfolio of assets.
MANAGEMENT’S DISCUSSION AND ANALYSISAll amounts are in $000’s, unless otherwise noted
26 | ARTIS REIT
For the year ended December 31, 2007, cash flow from operations exceeded distributions declared by $1,480. For the three months ended December 31, 2007, this excess was $3,017.
For the year and three months ended December 31, 2007, distributions declared exceeded net income (loss). These differences are mainly comprised of amortization and other non-cash adjustments.

FUNDS FROM OPERATIONS (“FFO”):
Consistent with the application of National Policy 41-201 Income Trusts and Other Indirect Offerings, Artis reconciles FFO to cash flows from operating activities, in addition to the net income (loss) for the period.
Reconciliation of cash flows from operations to FFO:
$000’s, except unit and per unit amounts Three month period ended
December 31, Year ended
December 31,
2007 2006 2007 2006
Cash flow from operations $ 11,386 $ 5,098 $ 28,586 $ 13,620
Deduct amortization of:
Office equipment (2 ) (1 ) (7 ) (4 )
Above-market rent (68) (48 ) (226) (213)
Deferred financing costs – (222) – (765)
Below-market rent 3,420 1,056 9,780 3,249
Above-market mortgages 12 29 96 81
Add:
Straight-line rent adjustment 465 370 1,369 1,063
Deduct:
Units issued for Trustees compensation – (15 ) – (15 )
Accretion on liability component of convertible debentures (374) (172) (1,713) (1,094)
Unit-based compensation expense (262) (382) (1,039) (502)
Amortization of deferred financing costs included in interest (67) – (229) –
Changes in non-cash operating items (2,534) (1,331) (2,147) (2,022)
Other adjustments (1)
Property rent 300 200 1,200 200
Property bid costs – – – 397
FFO for the period $ 12,276 $ 4,582 $ 35,670 $ 13,995
FFO per unit
Basic $ 0.39 $ 0.30 $ 1.41 $ 1.16
Diluted $ 0.39 $ 0.30 $ 1.38 $ 1.16
Weighted average number of units:
Basic (2) 31,132,975 15,153,247 25,337,466 12,015,853
Diluted (2) 31,197,012 15,225,436 25,716,657 12,078,079
(1) Added back to 2007 FFO is $1,200 (Q4-07 - $300) of Property rent (YTD and Q4-06 - $200), which is cash revenue earned pursuant to the Interplex II purchase and sale agreement not recorded as revenue in the REIT’s Consolidated Statement of Operations due to the project being in the development phase. Included in 2006 FFO is $397 of costs attributable to an unsuccessful bid on a portfolio of assets.
(2) The weighted average number of units used in the calculation of FFO per unit reflects 721,347 of class B units issued by the REIT’s subsidiary, AXLP. Options and convertible debentures are factored into the diluted weighted average calculation, to the extent that their impact is dilutive.
MANAGEMENT’S DISCUSSION AND ANALYSISAll amounts are in $000’s, unless otherwise noted
2007 ANNUAL REPORT | 27

ANALYSIS OF FINANCIAL POSITION
2007 FFO has increased $21,675, or 154.9%, over 2006. This increase is attributed to the impact of acquisitions since December 31, 2006. Basic FFO per unit has increased by $0.25, or 21.6%, over 2006. On a diluted basis, FFO per unit has increased $0.22, or 19.0% over 2006. Q4-07 FFO has increased $7,694, or 167.9%, over Q4-06. Basic FFO per unit has increased by $0.09, or 30.0%, over Q4-06. On a diluted basis, FFO per unit has increased $0.09, or 30.0% over Q4-06.
As the current year’s acquisitions were not owned for the full period, management anticipates there will be further growth in FFO per unit (basic and diluted) from these acquisitions in future periods, as well as from future acquisitions that the REIT currently has under contract. Management believes that there is further potential FFO growth that may be realized as below-market leases are renewed at higher rates, particularly in Alberta, where the gap between in-place rents and market rents is highest.
Reconciliation of GAAP income (loss) to FFO:
$000’s, except unit and per unit amountsThree month period ended
December 31,Year ended
December 31,
2007 2006 2007 2006
Income (loss) for the period $ (2,338) $ (3,259) $ 6,157 $ (11,153)
Add amortization on:
Income-producing properties 6,014 3,079 18,898 10,106
Acquired in-place leases 6,620 4,419 21,514 15,004
Customer relationships 6 6 22 23
Tenant inducements and leasing costs 231 137 784 246
Gain on disposal of income-producing properties 10 – (2,511) (828)
Future income tax recovery 1,433 – (10,394) –
Other adjustments (1)
Property rent 300 200 1,200 200
Property bid costs – – – 397
FFO for the period $ 12,276 $ 4,582 $ 35,670 $ 13,995
(1) Added back to 2007 FFO is $1,200 (Q4-07 - $300) of Property rent (YTD and Q4-06 - $200), which is cash revenue earned pursuant to the Interplex II purchase and sale agreement not recorded as revenue in the REIT’s Consolidated Statement of Operations due to the project being in the development phase. Included in 2006 FFO is $397 of costs attributable to an unsuccessful bid on a portfolio of assets.
ASSETS
$000’s December 31,
2007 December 31,
2006 Increase
Income-producing properties $ 944,612 $ 388,845 $ 555,767
Other assets, including intangibles 189,942 78,173 111,769
Deposits on income-producing properties 11,826 10,343 1,483
Cash held in trust 682 327 355
Cash and cash equivalents 29,386 15,252 14,134
$ 1,176,448 $ 492,940 $ 683,508
MANAGEMENT’S DISCUSSION AND ANALYSISAll amounts are in $000’s, unless otherwise noted
28 | ARTIS REIT

Property Location Acquisition Date Type
CDI College Building 280 Main Street, Winnipeg, MB January 13, 2007 Office
Keewatin Distribution Centre 959 & 989 Keewatin Street, Winnipeg, MB January 31, 2007 Industrial
Clareview Town Centre 50th Street & 137th Avenue, Edmonton, AB February 1, 2007 Retail
Centre 70 Building (1) 7015 Macleod Tr. SW & 555 - 69th St. SW, Calgary, AB February 28, 2007 Office
Honeywell Building 2840 - 2nd Avenue SE, Calgary, AB February 28, 2007 Industrial
Millennium Centre 4909 - 49th St. & 4902 - 48th St., Red Deer, AB February 28, 2007 Office
Bower Centre 2319 Taylor Dr. & 2310 Gaetz Ave., Red Deer, AB March 1, 2007 Industrial
Britannia Building (2) 703 - 6th Avenue SW, Calgary, AB March 31, 2007 Office
Sierra Place (2) 706 - 7th Avenue SW, Calgary, AB March 31, 2007 Office
MTS Call Centre 365 Osborne Street, Winnipeg, MB April 1, 2007 Office
488 Albert St (3) 488 Albert Street, Nanaimo, BC June 19, 2007 Office
6475 Metral Drive (3) 6475 Metral Drive, Nanaimo, BC June 19, 2007 Office
Aulds Corner (3) 6551 Aulds Road, Nanaimo, BC June 19, 2007 Retail
Can-K Building (4) 8220 Davies Road, Edmonton, AB June 30, 2007 Industrial
Mayfield Industrial Plaza (4) 11304/24 - 163 Street, Edmonton, AB June 30, 2007 Industrial
TransAlta Place (5) 110 - 12th Avenue SW, Calgary, AB July 5, 2007 Office
Winnipeg Square (6) 360 Main Street, Winnipeg, MB August 29, 2007 Office/Retail
Pepco Building 608 - 17th Avenue, Nisku, AB September 15, 2007 Industrial
Delta Shoppers Mall 8037 - 120th Street, Delta, BC September 24, 2007 Retail
Glenmore Commerce Court 2880 Glenmore Trail SE, Calgary, AB November 9, 2007 Office
Winnipeg Industrial Portfolio (7) Various locations in Winnipeg, MB November 15, 2007 Industrial
Brick Centre 11226 - 100th Avenue, 11245 - 104th Avenue & 11345/53 - 104th Avenue, Grande Prairie, AB
November 30, 2007 Retail
Fort McMurray Portfolio(8) Various locations in Edmonton and Fort McMurray, AB November 30, 2007 Retail
Paramount Building 630 - 4th Avenue SW, Calgary, AB December 1, 2007 Office
(1) The REIT acquired an undivided 85% interest in Centre 70, which is proportionately consolidated in the accounts of the REIT.
(2) The Britannia Building and Sierra Place were acquired together as the Dome Britannia Portfolio.
(3) 488 Albert Street, 6475 Metral and Aulds Corner were acquired as a portfolio.
(4) Can-K Building and Mayfield Industrial Plaza were acquired as a portfolio.
(5) The acquisition of TransAlta Place also included the acquisition of a note receivable for $31,000 (note 7).
(6) The REIT acquired an undivided 38% interest in the air rights leasehold with respect to Winnipeg Square, which is proportionately consolidated in the accounts of the REIT.
(7) The Winnipeg Industrial Portfolio is comprised of 8 single-tenant and 8 multi-tenant properties.
(8) The Fort McMurray Portfolio is comprised of one property in Edmonton and 6 properties in Fort McMurray.
Income-producing properties and related intangible assets:
The REIT’s income-producing properties and related intangible assets increased in the year ended December 31, 2007, due to the acquisition of 45 properties, as follows:
MANAGEMENT’S DISCUSSION AND ANALYSISAll amounts are in $000’s, unless otherwise noted
2007 ANNUAL REPORT | 29

The results of operations for the acquired properties are included in the REIT’s accounts from the dates of acquisition. Artis funded these acquisitions from cash on hand and from the proceeds of new or assumed mortgage financings, and from the proceeds of convertible debenture and equity financings completed during 2007. The acquisitions have been accounted for by the purchase method, with a portion of the purchase price allocated to income-producing properties and a portion allocated to intangible assets and liabilities, as noted below.
Property under development:
Included in income-producing properties is property under development of $2,725 which represents a 50% undivided interest in land in Calgary, Alberta. The lands are to be developed into a 211,000 square foot Class A office building (known as Interplex III) in accordance with a co-ownership agreement between the vendor of the lands and the REIT’s subsidiary, AXLP. The development is anticipated to commence in 2008, subject to sufficient pre-leasing, and is slated for completion in 2010.
Notes receivable:
In conjunction with the acquisition of TransAlta Place, the REIT acquired a note receivable in the amount of $31,000. The note bears interest at 5.89% per annum and is repayable in varying blended monthly instalments of principal and interest. The note is transferable at the option of the REIT and matures in May, 2023.
Future income tax assets:
Effective with Q2-07, as a result of the New SIFT Rules (discussed in more detail above under the heading “Future Income Taxes”), the REIT has recorded future income tax assets, comprised of the following major components:
Capital expenditures:
Income-producing properties includes certain capital expenditures related to sustaining building improvements not related to a specific lease or tenancy. These improvements are amortized over the estimated useful life of the relevant assets.
These non-recoverable capital expenditures in 2007 totaled $984 (Q4-07 - $555) compared to $1,741 in 2006 (Q4-06 - $684), which were primarily related to the completion of the total redevelopment of a full floor in one of the REIT’s office buildings. Management considers the redevelopment project to be revenue enhancing, as the space is being improved from Class “C” building standards to Class “B” building standards, which is expected to translate into higher rents on lease-up.
Tenant inducements and leasing costs:
Other assets of the REIT includes $5,906 of unamortized tenant inducement and leasing costs related to the leasing or re-leasing of occupied or vacant space at December 31, 2007, compared to $3,406 at December 31, 2006. Tenant inducements include costs incurred to improve the space, as well as allowances paid to tenants. Leasing costs are primarily brokers’ commissions. These costs are deferred and amortized over the terms of the underlying leases.
In 2007, Artis incurred $3,469 (Q4-07 - $1,228) of tenant inducements and leasing costs compared to $3,319 (Q4-06 - $2,026) in 2006.
$000’s Year ended December 31,
2007 2006
Cash consideration $ 197,680 $ 85,200
Issuance of Class B units – 2,612
Issuance of Series D convertible debenture 20,000 –
New or assumed mortgages including above- and below-market mortgages 349,230 132,211
Net assets acquired $ 566,910 $ 220,023
Allocated to income- producing properties $ 575,340 $ 191,109
Allocated to property under development – 2,632
Allocated to other assets 87,334 35,661
Allocated to intangible liabilities (95,764) (9,379)
Net assets acquired $ 566,910 $ 220,023
Future income tax assets (liabilities):
Income-producing properties, other assets and intangible liabilites $ 8,395
Unit issue costs 4,282
Other (1,168)
$ 11,509
$000’s Year ended December 31,
2007 2006
Tenant inducements $ 1,955 $ 2,554
Leasing commissions 1,514 765
Total $ 3,469 $ 3,319
MANAGEMENT’S DISCUSSION AND ANALYSISAll amounts are in $000’s, unless otherwise noted
30 | ARTIS REIT

Deferred recoverable operating costs:
Deferred recoverable operating costs include major repair or replacement items (such as HVAC, elevator or roof replacements) that are recoverable from tenants under leases. These costs are deferred when incurred and amortized to recoverable expenses over the planned period of recovery. In 2007, Artis incurred $2,029 (Q4-07 - $996) of deferred recoverable operating costs compared to $557 (Q4-06 - $557) in 2006.
Deposits on income-producing properties:
At December 31, 2007, Artis had made $4,496 of deposits on income-producing properties, related to the conditional and unconditional agreements to acquire income-producing properties during the subsequent quarters of 2008 compared to $2,600 at December 31, 2006.
Also included in deposits on income-producing properties at December 31, 2007, is $7,330 which represents an interim payment, net of adjustments, made towards the final purchase price of the Interplex II
property, currently under development. The initial payment of $7,800 was paid by issuing Class B units of the REIT’s subsidiary AXLP. In accordance with GAAP, the initial deposit has been reduced by the $1,400 earned by the REIT under the terms of the Interplex II purchase and sale agreement up to December 31, 2007, offset by the $715 distributions paid (or payable) on the Class B units issued and the $215 of costs that were incurred related to this project.
Cash and cash equivalents:
At December 31, 2007, the REIT had $29,386 of cash and cash equivalents on hand, compared to $15,252 at December 31, 2006. The balance is anticipated to be invested in income-producing property in subsequent periods, or used for working capital purposes. All of the REIT’s cash and cash equivalents are held in current accounts and/or bank guaranteed investment certificates. The REIT does not invest in asset-backed commercial paper.
LIABILITIES
$000’s December 31,
2007 December 31,
2006 Increase
Long-term debt $ 665,728 $ 312,844 $ 352,884
Other liabilities 115,038 21,976 93,062
$ 780,766 $ 334,820 $ 445,946
Long-term debt is comprised of mortgages and other loans related to properties as well as the carrying value of convertible debentures issued by the REIT. In accordance with GAAP, the REIT’s convertible debentures on issue are separated into a liability and an equity component; with the liability component, or “carrying value” included in long-term debt of the REIT.
Under the terms of the REIT’s Declaration of Trust, the total indebtedness of the REIT (excluding indebtedness related to the convertible debentures) is limited to 70% of gross book value (“GBV”). GBV is calculated as the consolidated net book value of the consolidated assets
of the REIT, adding back the amount of accumulated amortization of the income-producing properties and other assets (including intangible assets) as disclosed in the balance sheet and notes thereto.
At December 31, 2007, Artis had reduced its debt (excluding convertible debentures) to GBV ratio to 49.2%, from 52.1% at December 31, 2006. The reduction in leverage at December 31, 2007 is attributed to the significant balance of cash on hand that is available for future investment in income-producing properties, and mortgage principal repayments during the year.
$000’s December 31,
2007 December 31,
2006
GBV $ 1,247,047 $ 523,081
Mortgages and loans secured by properties (1) 612,996 272,341
Mortgages and loans to GBV 49.2% 52.1%
Carrying value of convertible debentures $ 52,732 $ 40,503
Total long-term debt 665,728 312,844
Total long-term debt to GBV 53.4% 59.8%
(1) Includes $481 mark-to-market on above- and below-market mortgages
MANAGEMENT’S DISCUSSION AND ANALYSISAll amounts are in $000’s, unless otherwise noted
2007 ANNUAL REPORT | 31

Mortgages:
Artis finances acquisitions in part through the assumption of mortgage financing and consequently substantially all of the REIT’s income-producing properties are pledged as security under mortgages and other loans. In 2007, Artis assumed or obtained new mortgage financing, net of deferred financing costs, of $349,230 (Q4-07 - $88,343) in conjunction with the 2007 acquisitions. In 2007, $6,665 of principal repayments were made (Q4-07 - $2,065). In Q4-07, an additional $1,024 was received on the refinancing of one mortgage. No additional mortgages matured or were refinanced during the current year.
As a result of the adoption of new accounting standards effective January 1, 2007, Artis has reduced the carrying value of its mortgage debt by $2,204 at December 31, 2007, netting the financing costs against the carrying value of the debt. Interest and financing costs are amortized on an effective interest basis; the weighted average effective rate for the year ending December 31, 2007 was 5.51%. At December 31, 2007, the weighted average nominal rate on the mortgage debt was 5.42%, a decrease from the rate of 5.51% at December 31, 2006.
The weighted average term to maturity at December 31, 2007 is 6.0 years, compared to 7.0 years at December 31, 2006.
Convertible debentures:
Artis has four series of convertible debentures outstanding as at December 31, 2007, as follows:
$000’s December 31, 2007 December 31, 2006
Issued Maturity Face rate Carrying value Face value Carrying value Face value
Series A 4-Aug-05 4-Aug-10 7.75% $ 2,644 $ 3,170 $ 8,699 $ 10,185
Series B 9-Nov-05 9-Nov-10 7.50% 8,976 10,862 9,093 10,862
Series C 4-May-06 31-May-13 6.25% 22,274 29,920 22,711 30,000
Series D 30-Nov-07 30-Nov-14 5.00% 18,838 20,000 – –
$ 52,732 $ 63,952 $ 40,503 $ 51,047
As a result of the adoption of new accounting standards effective January 1, 2007, Artis has reduced the carrying value of its debentures by $1,946 at December 31, 2007, by netting the financing costs against the carrying value of the debentures. Interest and financing costs are amortized on an effective interest basis; this accretion increased the carrying value by $1,713 in 2007 (Q4-07 - $373). The weighted average effective rate of the debentures at December 31, 2007 was 11.06%, a decrease from the rate of 14.28% at December 31, 2006.
During 2007, Series A and C convertible debentures with a face value of $7,095 (Q4-07 - $70) were converted and 566,174 (Q4-07 - 4,177) units were issued upon such conversions. The carrying value was reduced by $7,021 (Q4-07 - $61).
Other liabilities:
Other liabilities includes the unamortized below-market rent intangible liability of $99,280 at December 31, 2007. This increased $85,939 from $13,341 at December 31, 2006, as a result of acquisition activity, net of amortization recorded in the year. Also included in other liabilities are security deposits paid by tenants, rents prepaid by tenants at December 31, 2007, accounts payable and accruals, as well as the December 31, 2007 distribution payable to unitholders of $2,791, subsequently paid on January 15, 2008.
NON-CONTROLLING INTEREST
In accordance with GAAP, the amount of equity related to the issue of 721,347 Class B units of a subsidiary, AXLP, (net of costs of issuance) was recorded as a non-controlling interest of the REIT. The Class B units are exchangeable on a one-for-one basis with units of Artis, and holders of the Class B units of AXLP are entitled to receive distributions at a per unit amount equal to the per unit amount payable to holders of Artis trust units. The balance of non-controlling interest at December 31, 2007, after making certain adjustments required under GAAP, is $10,182 (see Note 13 of the accompanying Consolidated Financial Statements for further details).
UNITHOLDERS’ EQUITY
Unitholders’ equity increased by $237,748 between December 31, 2006 and December 31, 2007. Equity was increased by the issue of 4,230,000 units at a price of $17.75 per unit for net proceeds of $72,702, pursuant to the prospectus dated October 11, 2007, $87,999 by the issue of 5,232,500 units at a price of $17.60 per unit, pursuant to the prospectus
MANAGEMENT’S DISCUSSION AND ANALYSISAll amounts are in $000’s, unless otherwise noted
32 | ARTIS REIT

dated May 29, 2007, and $87,870 by the issue of 5,807,500 units at a price of $15.85 per unit, pursuant to the prospectus dated February 1, 2007.
Unitholders’ equity increased during the year by a further $5,779 as a result of the conversion of a principal amount of $7,095 Series A and Series C convertible debentures. Other transactions increasing Unitholders’ equity during the year included an increase in the equity component of convertible debentures resulting from the issuance of the Series D convertible debenture, issuance of units on the exercise of options, issuance of units under the DRIP, and adjustments to contributed surplus to reflect unit-based compensation expense in the year. These increases were partially offset by the purchase of units under the normal course issuer bid.
Unitholders’ equity increased during the year by the net income for the year and the provision for future income taxes less the distributions made to unitholders.
LIQUIDITY AND CAPITAL RESOURCES
In 2007, Artis generated $28,586 (Q4-07 - $11,386) of cash flows from operating activities compared to $13,620 in 2006 (Q4-06 - $5,098). Cash flows from operations assisted in funding distributions to Unitholders of $26,348 (Q4-07 - $8,178) compared to $12,700 in 2006 (Q4-06 - $3,973), distributions to Class B unitholders of $758 (Q4-07 - $189), and for principal repayments on mortgages and loans of $6,665 (Q4-07 - $2,065) compared to $4,261 in 2006 (Q4-07 - $1,303). As the current year’s acquisitions were not owned for the full period, management anticipates that cash flows from operations will increase in future periods as a result of these acquisitions.
Cash on hand and deposits on income-producing properties at the beginning of the period, were used to finance the cash portion of acquisitions of income-producing properties in the period, totaling $197,680 (Q4-07 - $71,232) compared to $85,200 in 2006 (Q4-06 - $39,077). Cash of $4,453 (Q4-07 - $1,783) was used for substantive capital building improvements and for tenant inducements and leasing costs compared to $5,060 in 2006 (Q4-06 - $2,710).
At December 31, 2007, Artis had $29,386 of cash and cash equivalents on hand, compared to $15,252 at December 31, 2006. Management anticipates that the cash on hand will be invested in additional income-producing properties, subsequent to December 31, 2007, or used for working capital purposes.
On September 28, 2007, Artis entered into an agreement for a revolving term credit facility in the amount of $75,000 which may be utilized to fund acquisitions of office, retail and industrial properties. The credit facility matures at the earlier of one year after the initial advance, and October 1, 2008. Amounts drawn on the facility will bear interest at a floating rate equal to Canadian dollar bankers’ acceptances with a term to maturity of 30 days, plus 1.85%. The credit facility is secured by a first charge on Delta Centre, Grain Exchange Building, Johnston Terminal and Sears Centre. As at December 31, 2007, no amounts have been drawn on the facility. Subsequent to December 31, 2007, the REIT has drawn an aggregate of $10,200 of the available credit facility for bridge financing on the acquisitions of King Edward Centre and the Leon’s Building.
To its knowledge, Artis is not in default or arrears on any of its obligations, including distributions to unitholders, interest or principal payments on debt or any debt covenants.
Only two of the REIT’s mortgages mature in 2008 and management does not foresee any difficulties in obtaining replacement financing.
The REIT’s management expects to meet all of its on-going obligations and capital commitments with respect to properties through funds generated from operations, from the proceeds of mortgage refinancing, and from the available credit facility and cash on hand.
$000’s Total Less than 1 year 1 - 3 years 4 - 5 years After 5 years
Mortgages and other loans secured by properties (1) $ 614,719 $ 20,598 $ 127,729 $ 153,076 $ 313,316
Convertible debentures(2) 63,952 – 14,032 – 49,920
Total $ 678,671 $ 20,598 $ 141,761 $ 153,076 $ 363,236
(1) Not including $481 of mark-to-market on mortgages and deferred financing costs.
(2) It is assumed that none of the convertible debentures are converted or redeemed prior to maturity and that they are paid out in cash on maturity.
Contractual obligations:
MANAGEMENT’S DISCUSSION AND ANALYSISAll amounts are in $000’s, unless otherwise noted
2007 ANNUAL REPORT | 33

SUMMARIZED QUARTERLY INFORMATION:
$000’s, except unit and per unit amounts
Q4-07 Q3-07 Q2-07 Q1-07 Q4-06 Q3-06 Q2-06 Q1-06
Revenue $ 31,850 $ 27,041 $ 22,759 $ 17,609 $ 16,489 $ 15,744 $ 11,932 $ 9,357
Property operating expenses 9,753 8,385 7,671 5,980 6,077 5,665 3,912 3,617
Property NOI 22,097 18,656 15,088 11,629 10,412 10,079 8,020 5,740
Interest 8,717 7,684 6,366 5,427 4,834 5,277 3,986 2,906
13,380 10,972 8,722 6,202 5,578 4,802 4,034 2,834
Expenses:
Corporate 1,382 1,257 1,061 1,098 973 532 1,125 451
Amortization 12,893 11,158 9,413 7,761 7,864 7,545 5,906 4,833
14,275 12,415 10,474 8,859 8,837 8,077 7,031 5,284
Loss before the under-noted (895) (1,443) (1,752) (2,657) (3,259) (3,275) (2,997) (2,450)
Gain (loss) on disposal of income-producing properties (10 ) 2,521 – – – – (113) 941
Income (loss) before income taxes $ (905) $ 1,078 $ (1,752) $ (2,657) $ (3,259) $ (3,275) $ (3,110) $ (1,509)
Future income tax (expense) recovery (1,433) (201) 12,028 – – – – –
Income (loss) for the period $ (2,338) $ 877 $ 10,276 $ (2,657) $ (3,259) $ (3,275) $ (3,110) $ (1,509)
Basic income (loss) per unit $ (0.03 ) $ 0.03 $ 0.45 $ (0.14 ) $ (0.22 ) $ (0.27 ) $ (0.26 ) $ (0.17 )
Diluted income (loss) per unit $ (0.03 ) $ 0.03 $ 0.41 $ (0.14 ) $ (0.22 ) $ (0.27 ) $ (0.26 ) $ (0.17 )
MANAGEMENT’S DISCUSSION AND ANALYSISAll amounts are in $000’s, unless otherwise noted
34 | ARTIS REIT

Reconciliation of GAAP income (loss) to DI:
$000’s, except unit and per unit amounts
Q4-07 Q3-07 Q2-07 Q1-07 Q4-06 Q3-06 Q2-06 Q1-06
Income (loss) for the period $ (2,338) $ 877 $ 10,276 $ (2,657) $ (3,259) $ (3,275) $ (3,110) $ (1,509)
Add:
Amortization (excluding amortized leasing costs) 12,640 10,962 9,219 7,614 7,504 7,260 5,686 4,683
Amortized financing costs on convertible debentures – – – – 163 163 115 92
Accretion on liability component of debentures 374 391 490 457 172 399 326 197
Unit-based compensation expense 262 261 322 194 382 40 40 40
(Gain) loss on disposal of income-producing properties 10 (2,521) – – – – 113 (941)
Future income tax expense (recovery) 1,433 201 (12,028) – – – – –
Other adjustments (1)
Property rent 300 300 300 300 200 – – –
Property bid costs – – – – – – 397 –
DI $ 12,681 $ 10,471 $ 8,579 $ 5,908 $ 5,162 $ 4,587 $ 3,567 $ 2,562
DI per unit
Basic(2) $ 0.41 $ 0.38 $ 0.37 $ 0.31 $ 0.34 $ 0.38 $ 0.30 $ 0.29
Diluted(2) $ 0.39 $ 0.37 $ 0.35 $ 0.30 $ 0.33 $ 0.35 $ 0.28 $ 0.27
Weighted average number of units:
Basic (2) 31,132,975 27,546,303 23,325,672 19,189,433 15,153,247 12,072,151 11,850,099 8,918,795
Diluted (2) 35,114,445 30,519,959 26,412,775 22,630,256 18,577,492 15,609,760 15,003,921 11,502,700
(1) Added back to Q4-07, Q3-07, Q2-07, Q1-07 and Q4-06 DI is $300, $300, $300, $300 and $200 of Property rent, which is cash revenue earned pursuant to the Interplex II purchase and sale agreement not recorded as revenue in the REIT’s Consolidated Statement of Operations due to the project being in the development phase. Added back to Q2-06 DI is $397 of costs attributed to an unsuccessful take-over bid.
(2) The weighted average number of units used in the calculation of DI per unit reflects 721,347 of Class B units issued by the REIT’s subsidiary, AXLP, beginning in Q4-06. Options and convertible debentures are factored into the diluted weighted average calculation, to the extent that their impact is dilutive.
MANAGEMENT’S DISCUSSION AND ANALYSISAll amounts are in $000’s, unless otherwise noted
2007 ANNUAL REPORT | 35

Artis has executed an aggressive but disciplined external growth strategy, resulting in significant growth in revenues, Property NOI, DI and FFO over the past eight quarters. DI and FFO per unit results posted in Q4-07 were the strongest in the REIT’s history.
Management does not believe that the Q4-07 per unit results are indicative of future performance. Management expects that there will be further growth in revenues, Property NOI, FFO and DI in future periods as cash on hand at December 31, 2007 is invested in additional income-producing properties.
Reconciliation of GAAP income (loss) to FFO:
$000’s, except unit and per unit amounts
Q4-07 Q3-07 Q2-07 Q1-07 Q4-06 Q3-06 Q2-06 Q1-06
Income (loss) for the period $ (2,338) $ 877 $ 10,276 $ (2,657) $ (3,259) $ (3,275) $ (3,110) $ (1,509)
Add amortization on:
Income-producing properties 6,014 5,284 4,340 3,260 3,079 3,010 2,211 1,806
Acquired in-place leases 6,620 5,673 4,874 4,348 4,419 4,244 3,470 2,871
Customer relationships 6 5 5 6 6 6 5 6
Tenant inducements and leasing costs 231 194 191 146 137 60 33 16
(Gain) loss on disposal of income-producing properties 10 (2,521) – – – – 113 (941)
Future income tax expense (recovery) 1,433 201 (12,028) – – – – –
Other adjustments (1)
Property rent 300 300 300 300 200 – – –
Property bid costs – – – – – – 397 –
FFO $ 12,276 $ 10,013 $ 7,958 $ 5,403 $ 4,582 $ 4,045 $ 3,119 $ 2,249
FFO per unit
Basic $ 0.39 $ 0.36 $ 0.34 $ 0.28 $ 0.30 $ 0.34 $ 0.26 $ 0.25
Diluted $ 0.39 $ 0.36 $ 0.34 $ 0.28 $ 0.30 $ 0.33 $ 0.26 $ 0.24
Weighted average number of units:
Basic 31,132,975 27,546,303 23,325,672 19,189,433 15,153,247 12,072,151 11,850,099 8,918,795
Diluted 31,197,012 27,725,159 23,512,419 19,325,025 15,225,436 12,131,910 12,074,314 9,507,631
(1) Added back to Q4-07, Q3-07, Q2-07, Q1-07 and Q4-06 FFO is $300, $300, $300, $300 and $200 of Property rent, which is cash revenue earned pursuant to the Interplex II purchase and sale agreement not recorded as revenue in the REIT’s Consolidated Statement of Operations due to the project being in the development phase. Added back to Q2-06 FFO is $397 of costs attributed to an unsuccessful take-over bid.
(2) The weighted average number of units used in the calculation of FFO per unit reflects 721,347 of class B units issued by the REIT’s subsidiary, AXLP, beginning in Q4-06. Options and convertible debentures are factored into the diluted weighted average calculation, to the extent that their impact is dilutive.
MANAGEMENT’S DISCUSSION AND ANALYSISAll amounts are in $000’s, unless otherwise noted
36 | ARTIS REIT

RELATED PARTY TRANSACTIONS
The REIT incurred legal fees with a law firm associated with a trustee of the REIT in connection with the prospectus offerings, the property acquisitions and general business matters. The amount payable at December 31, 2007 is $nil (2006, $12).
The REIT incurred advisory fees and acquisition fees under the asset management agreement with Marwest Management Canada Ltd. (“Marwest”), a company owned and controlled by certain trustees and officers of the REIT. The amount payable at December 31, 2007 is $nil (2006, $116). Under the asset management agreement, Marwest is entitled to an annual advisory fee equal to 0.25% of the adjusted cost base of the REIT’s assets and an acquisition fee equal to 0.5% of the cost of each property acquired.
Artis has the option to terminate the asset management agreement in certain circumstances, including at any time on 120 days’ notice to Marwest in the event that the REIT decides to internalize its management, with no termination fee or penalty payable (unless such termination occurs following a take-over bid of the REIT, in which case Marwest is entitled to receive a termination fee equal to the anticipated fees payable until the end of the term). Marwest and its affiliated companies (collectively, the “Marwest Group”) have granted a right of first refusal to Artis with respect to office, retail and industrial properties which are presented to or developed by a member of the Marwest Group. The right of first refusal remains in effect for so long as Marwest is the asset manager of the REIT.
The REIT incurred property management fees, leasing commission fees, and tenant improvement fees under the property management agreement with Marwest. The amount payable at December 31, 2007 is $nil (2006, $78). Marwest acts as the general property manager for the REIT’s properties and is entitled to management fees, leasing renewal commissions and tenant improvement fees at commercially reasonable rates.
The REIT incurred costs for building improvements and tenant inducements paid to Marwest Construction Ltd., a company related to certain trustees and officers of the REIT. The amount payable at December 31, 2007 is $nil (2006, $115).
OUTSTANDING UNIT DATA
The balance of units outstanding as of March 19, 2008, not including Class B units, is as follows:
Reconciliation of GAAP income (loss) to FFO:
$000’s, except unit and per unit amounts
Q4-07 Q3-07 Q2-07 Q1-07 Q4-06 Q3-06 Q2-06 Q1-06
Income (loss) for the period $ (2,338) $ 877 $ 10,276 $ (2,657) $ (3,259) $ (3,275) $ (3,110) $ (1,509)
Add amortization on:
Income-producing properties 6,014 5,284 4,340 3,260 3,079 3,010 2,211 1,806
Acquired in-place leases 6,620 5,673 4,874 4,348 4,419 4,244 3,470 2,871
Customer relationships 6 5 5 6 6 6 5 6
Tenant inducements and leasing costs 231 194 191 146 137 60 33 16
(Gain) loss on disposal of income-producing properties 10 (2,521) – – – – 113 (941)
Future income tax expense (recovery) 1,433 201 (12,028) – – – – –
Other adjustments (1)
Property rent 300 300 300 300 200 – – –
Property bid costs – – – – – – 397 –
FFO $ 12,276 $ 10,013 $ 7,958 $ 5,403 $ 4,582 $ 4,045 $ 3,119 $ 2,249
FFO per unit
Basic $ 0.39 $ 0.36 $ 0.34 $ 0.28 $ 0.30 $ 0.34 $ 0.26 $ 0.25
Diluted $ 0.39 $ 0.36 $ 0.34 $ 0.28 $ 0.30 $ 0.33 $ 0.26 $ 0.24
Weighted average number of units:
Basic 31,132,975 27,546,303 23,325,672 19,189,433 15,153,247 12,072,151 11,850,099 8,918,795
Diluted 31,197,012 27,725,159 23,512,419 19,325,025 15,225,436 12,131,910 12,074,314 9,507,631
(1) Added back to Q4-07, Q3-07, Q2-07, Q1-07 and Q4-06 FFO is $300, $300, $300, $300 and $200 of Property rent, which is cash revenue earned pursuant to the Interplex II purchase and sale agreement not recorded as revenue in the REIT’s Consolidated Statement of Operations due to the project being in the development phase. Added back to Q2-06 FFO is $397 of costs attributed to an unsuccessful take-over bid.
(2) The weighted average number of units used in the calculation of FFO per unit reflects 721,347 of class B units issued by the REIT’s subsidiary, AXLP, beginning in Q4-06. Options and convertible debentures are factored into the diluted weighted average calculation, to the extent that their impact is dilutive.
Year endedDecember 31,
2007 2006
Legal fees expensed $ 101 $ 154
Capitalized legal fees 1,775 687
Advisory fees 1,693 939
Capitalized acquisition fees 3,047 1,009
Property management fees 3,052 1,830
Capitalized leasing commissions 2,224 490
Capitalized building improvements 760 410
Capitalized tenant inducements 642 –
Consulting fees – 34
Interest expense – 73
Units outstanding at December 31, 2007 31,171,068
Units acquired through normal course issuer bid prior to December 31, 2007, cancelled subsequent to year end (13,000)
Units issued (options) 22,751
Units issued (DRIP) 69,075
Units issued on conversion of debenture 529,402
Units acquired through normal course issuer bid (32,600)
Units outstanding at March 19, 2008 31,746,696
The balance of options outstanding as of March 19, 2008 is as follows:
Options
outstandingOptions
exercisable
$11.25 options, issued December 8, 2005 217,036 74,843
$14.40 options, issued October 11, 2006 380,500 181,500
$15.85 options, issued February 8, 2007 269,750 132,750
$17.60 options, issued June 11, 2007 319,050 79,762
$17.75 options, issued October 17, 2007 272,000 –
1,458,337 468,855
MANAGEMENT’S DISCUSSION AND ANALYSISAll amounts are in $000’s, unless otherwise noted
2007 ANNUAL REPORT | 37

2008 OUTLOOK
Artis is a growth-oriented REIT focused exclusively on commercial properties located in primary and growing secondary markets in western Canada, particularly in Alberta. The REIT’s goal is to provide unitholders the opportunity to invest in high-quality western Canadian office, retail and industrial properties, as well as to provide monthly cash distributions that are stable, tax efficient, and growing over time.
Artis anticipates that there will be additional growth in revenues, property NOI, DI and FFO as the full impact of 2007 acquisitions is realized in 2008. Acquisitions in 2008 are also expected to positively impact growth. Acquisitions aggregating $25,165 have already been concluded, as follows:
On January 15, 2008, the REIT acquired King Edward Centre, located in Coquitlam, British Columbia.
On February 1, 2008, the REIT acquired the Leon’s Building, located in Nanaimo, British Columbia.
The REIT has entered into agreements to acquire various properties located in Alberta and Saskatchewan. These acquisitions are expected to close in March and April, 2008.
At the existing level of debt to GBV and with funds available on the credit facility, Artis has sufficient capacity to pursue further acquisition opportunities in its target markets in 2008.
At December 31, 2007, in-place rental rates on our 2008 lease maturities were estimated to be 38.6% below market rates. As these leases expire and are renewed at current market rates, this will be an additional source of growth in revenues, property NOI, DI and FFO.
Artis has minimal exposure to financing risk, with 2% of its mortgage debt maturing late in 2008 and 4% maturing in 2009. The REIT does not anticipate difficulty in renewing or replacing these mortgages.
With its existing acquisition capacity and embedded growth profile, Artis expects to deliver another year of growth in 2008, in spite of turbulence in the capital markets and uncertainties in the credit markets. Western Canadian employment, retail sales growth and net migration figures outperformed Canada again in 2007. Oil and gas production and oil-sands development continue to be significant growth drivers in Alberta. Global demand for potash, uranium and other precious metals, as well as agricultural commodities continue to fuel growth in western Canada. In Alberta, new supply coming on the market, particularly in the Calgary office market, has slowed the velocity of leasing activity and had a moderating effect on rental rate increases. However, at current and forecast occupancy levels, management anticipates that the Alberta market will continue to be a strong landlord’s market for 2008 and well into 2009.
RISKS AND UNCERTAINTIES
All real property investments are subject to elements of risk. General economic conditions, local real estate markets, supply and demand for leased premises, competition from other available premises and various other factors affect such investments.
Credit risk and tenant concentration:
Artis is exposed to risk as tenants may be unable to pay their contracted rents. Management mitigates this risk by seeking to acquire properties across several asset classes. As well, management seeks to acquire properties with strong tenant covenants in place. As at December 31, 2007, government tenants contribute 10.1% to the REIT’s overall gross revenue and occupy 8.9% of total GLA. The REIT’s ten top tenants (excluding government tenants) are primarily high credit rated national retailers or businesses. As indicated below, the largest tenant is TransAlta Corporation, a Standard & Poor’s BBB rated multi-national corporation with a market capitalization of approximately $5 billion.
MANAGEMENT’S DISCUSSION AND ANALYSISAll amounts are in $000’s, unless otherwise noted
38 | ARTIS REIT

Lease rollover risk:
The value of income-properties and the stability of cash flows derived from those properties is dependent upon the level of occupancy and lease rates in those properties. Upon expiry of any lease, there is no assurance that a lease will be renewed on favourable terms, or at all; nor is there any assurance that a tenant can be replaced.
Approximately 24.7% of the REIT’s GLA will come up for renewal from 2008 through to 2009; approximately 59.2% of those expiries are in the province of Alberta. Management believes there is substantial upside to be realized from the below market leases coming up for renewal in Alberta, particularly in the strong Calgary office market. At January 31, 2008, Artis had renewed approximately 56% of the 2008 square footage expiring, achieving renewal rates that were on average 79% higher than the in-place rate at expiry.
Tax risk:
On June 22, 2007, the New SIFT Rules (discussed in more detail above under the heading “Future Income Taxes”) were enacted. Under the New SIFT Rules, certain distributions from a SIFT will no longer be deductible in computing a SIFT’s taxable income, and a SIFT will be subject to tax on such distributions at a rate that is substantially equivalent to the general tax rate applicable to a Canadian corporation. However, distributions paid by a SIFT as returns of capital should generally not be subject to the tax.
The New SIFT Rules do not apply to a “real estate investment trust” that meets prescribed conditions relating to the nature of its assets and revenue (the “REIT Conditions”). In order to meet the REIT
Conditions, a trust must meet a number of technical tests that do not fully accommodate common real estate and business structures. The REIT is currently reviewing the New SIFT Rules and is assessing their interpretation and application to the REIT’s assets and revenues. There are uncertainties in the interpretation and application of the New SIFT Rules and it is not possible, at the current time, to determine with certainty whether the REIT will meet the REIT Conditions.
If the REIT does not meet the REIT Conditions, the REIT may restructure its affairs in order to minimize, or if possible eliminate, the impact of the New SIFT Rules, if such restructuring is in the best interests of unitholders. There can be no assurances, however, that the REIT would be able to restructure such that the REIT would not be subject to the tax imposed by the New SIFT Rules, or that any such restructuring, if implemented, would not result in material costs or other adverse consequences to the REIT and its unitholders.
Other risks:
In addition to the specific risks identified above, Artis REIT is subject to a variety of other risks, including, but not limited to, risks posed by the illiquidity of real property investments, refinancing risks, interest rate fluctuation risks, risk of general uninsured losses as well as potential risks arising from environmental matters.
The REIT may also be subject to risks arising from land and air rights leases for properties in which the REIT has an interest, public market risks, unitholder liability risks, risks pertaining to the availability of cash flow, risks related to fluctuations in cash distributions, changes in legislation, and risks relating to the REIT’s reliance on key personnel and Marwest as asset manager.
Top Ten Tenants by GLA Share Top Ten Tenants by Gross Revenue Share
TransAlta Corporation 5.6% TransAlta Corporation 4.0%
Red River Packaging 3.2% Jacobs Canada 3.5%
Reliance Products 2.9% Birchcliff Energy 2.6%
Jacobs Canada 2.6% Credit Union Central 2.2%
Sears 1.7% Shoppers Drug Mart 1.8%
Credit Union Central 1.4% MTS Allstream 1.8%
Shoppers Drug Mart 1.4% Cineplex Odeon 1.5%
MTS Allstream 1.3% BW Technologies (Honeywell) 1.1%
Komunik 1.2% Komex International 1.1%
Cineplex Odeon 1.1% The Brick 1.0%
Total of Top Ten by GLA 22.4% Total of Top Ten by Gross Revenue 20.6%
Government Entities by GLA Share Government Entities by Gross Revenue Share
Federal Government 2.8% Federal Government 3.3%
Provincial Government 4.8% Provincial Government 5.3%
Civic or Municipal Government 1.3% Civic or Municipal Government 1.5%
Total Government by GLA 8.9% Total Government by Gross Revenue 10.1%
MANAGEMENT’S DISCUSSION AND ANALYSISAll amounts are in $000’s, unless otherwise noted
2007 ANNUAL REPORT | 39

CRITICAL ACCOUNTING ESTIMATES
Artis REIT’s management believes that the policies below are those most subject to estimation and judgment by management.
Allocation of purchase price of income-producing properties:
The REIT has adopted the EIC Abstract 140, Accounting for Operating Leases Acquired in Either an Asset Acquisition or a Business Combination. This standard requires that where an enterprise acquired real estate in either an asset acquisition or a business combination, a portion of the purchase price should be allocated to in-place operating lease intangible assets, based on their fair value, acquired in connection with the real estate property. The adoption of this standard has given rise to intangible assets and liabilities, which are amortized using the straight-line method over the terms of the tenant lease agreements and non-cancelable renewal periods, where applicable. In the event a tenant vacates its leased space prior to the contractual termination of the lease and rental payments are not being made, any unamortized balance of the intangible asset or liability will be written off.
The allocation of the purchase price to the respective income-producing properties and intangible assets and liabilities, as well as the related amortization of the assets, is subject to management’s estimations and judgment.
Impairment of assets:
Under Canadian GAAP, the REIT is required to write down to fair value an asset that is determined to have been impaired. The REIT’s most significant assets consist of investments in income-producing properties.
The fair value of investments in income-producing properties is dependent upon anticipated future cash flows from operations over the anticipated holding period. The review of anticipated cash flows involves assumptions of estimated occupancy, rental rates and a residual value. In addition to reviewing anticipated cash flows, the REIT assesses changes in business climates and other factors, which may affect the ultimate value of the property. These assumptions may not ultimately be achieved.
In the event these factors result in a carrying value that exceeds the sum of the undiscounted cash flows expected to result from the direct use and eventual disposition of the property, impairment would be recognized.
There were no impairments for the years ended December 31, 2007 and 2006.
Amortization:
Artis REIT amortizes the costs of income-producing properties on a straight-line basis over the estimated useful life of the underlying asset. For building and leasehold interest, management’s estimate is typically up to 40 years and for parking lots, 20 years. Improvements are amortized over the remaining term of the lease agreement and assumed renewal periods.
Allocation of convertible debentures:
Artis REIT has issued convertible debentures, which are a compound financial instrument. The proceeds of these issues are allocated between their liability and equity components. The discount rate applied in the allocation is determined by management.
Future income tax valuation:
Future income taxes are estimated based upon temporary differences between the assets and liabilities reported on the REIT’s consolidated financial statements and the tax basis of those assets and liabilities as determined under applicable tax laws. Future income tax assets are recognized when it is more likely than not that they will be realized prior to their expiration. This assumption is based on management’s best estimate of future circumstances and events, including the timing and amount of projected future taxable income, and will be tested on a regular basis. Changes in estimates or assumptions could affect the value of future income tax assets, resulting in an income tax expense or recovery.
CHANGES IN ACCOUNTING POLICIES
Commencing January 1, 2007, Artis adopted Section 3855, “Financial Instruments-Recognition and Measurement”. This section establishes standards for the recognition and measurement of financial assets, financial liabilities and non-financial derivatives. Financial instruments will ordinarily be measured at fair value on initial recognition. Subsequent measurement is determined by the classification of the financial instrument as held-to-maturity, loans and receivables, held-for-trading or available-for-sale.
As a result of the adoption of this standard, interest on debt instruments is now recognized at the effective interest rate, with deferred finance costs netted against the related debt. Artis recorded a reduction of $4,071 to the carrying value of long-term debt as a result of the elimination of the January 1, 2007, balance of deferred finance costs from its balance sheet. The beginning deficit balance was decreased by $311, representing that proportion of adjustment to the carrying value up to December 31, 2006.
MANAGEMENT’S DISCUSSION AND ANALYSISAll amounts are in $000’s, unless otherwise noted
40 | ARTIS REIT

Artis also adopted Section 1530, “Comprehensive Income”, which requires presentation of Other Comprehensive Income in a separate statement. Components of the new statement include unrealized gains and losses related to financial assets classified under Section 3855 as available-for-sale and changes in the fair value of certain hedging instruments. There were no adjustments to opening retained earnings or unusual adjustments as a result of the adoption of this standard.
Effective January 1, 2008, the REIT will be required to adopt additional accounting changes. The REIT does not expect Section 1535 “Capital Disclosures”, Section 3862 “Financial Instruments - Disclosure”, and Section 3863 “Financial Instruments - Presentation” to have a material effect on the financial performance of the REIT, however, management will continue to evaluate the impact of these changes.
In addition, a new accounting standard was issued in February, 2008. Section 3064, “Goodwill and Intangible Assets” replaces the existing Sections 3062 “Goodwill and Other Intangible Assets” and 3450 “Research and Development Costs”. This new section establishes standards for the recognition, measurement and disclosure of goodwill and intangible assets. This standard is effective for the REIT’s 2009 fiscal year.
CONTROLS AND PROCEDURES
Disclosure controls and procedures:
The REIT’s disclosure controls and procedures are designed to provide reasonable assurance that information required to be disclosed by the REIT is recorded, processed, summarized and reported within the time periods specified under Canadian securities laws, and include controls and procedures that are designed to ensure that information is accumulated and communicated to Management, including the Chief Executive Officer and Chief Financial Officer, to allow timely decisions regarding required disclosure.
As of December 31, 2007, an evaluation was carried out, under the supervision of and with the participation of Management, including the Chief Executive Officer and Chief Financial Officer, of the effectiveness of the REIT’s disclosure controls and procedures (as defined in Multilateral Instrument 52-109, Certification of Disclosure in Issuers’ Annual and Interim Filings). Based on the evaluation, the Chief Executive Officer and Chief Financial Officer concluded that the design and operation of the REIT’s disclosure controls and procedures were effective as at December 31, 2007.
Internal controls over financial reporting:
Management is responsible for establishing and maintaining adequate internal controls over financial reporting to provide reasonable assurance regarding the reliability of financial reporting and the preparation of financial statements for external purposes in accordance with GAAP. The Chief Executive Officer and Chief Financial Officer evaluated, or caused to be evaluated, the design of the REIT’s internal controls over financial reporting (as defined in Multilateral Instrument 52-109, Certification of Disclosure in Issuers’ Annual and Interim Filings) as at December 31, 2007. In 2006, the REIT identified that there was a lack of segregation of duties within several of the REIT’s processes. The control objectives that could be compromised by the lack of segregation were identified, and compensating controls were put in place to management’s satisfaction. Due to the increase in the asset base of the REIT during 2007, the REIT’s asset manager was required to increase staffing levels. As a result, there is adequate segregation of duties. The REIT has identified a need for assistance with taxation and complex accounting issues, and has sought outside assistance or clarification where appropriate.
All control systems have inherent limitations, and evaluation of a control system cannot provide absolute assurance that all control issues have been detected, including risks of misstatement due to error or fraud. As a growing enterprise, management anticipates that the REIT will be continually evolving and enhancing its systems of controls and procedures.
MANAGEMENT’S DISCUSSION AND ANALYSISAll amounts are in $000’s, unless otherwise noted
2007 ANNUAL REPORT | 41

42 | ARTIS REIT
The management of Artis Real Estate Investment Trust is responsible for the preparation and integrity of the consolidated fi nancial statements contained in the annual report. These consolidated fi nancial statements have been prepared in accordance with Canadian generally accepted accounting principles and necessarily include some amounts that are based on management’s best estimate and judgment. Management has determined such amounts on a reasonable basis and considers that the consolidated fi nancial statements present fairly the fi nancial position of the REIT, the results of its operations and its cash fl ows. Management has also prepared fi nancial information presented elsewhere in this annual report and has ensured that it is consistent with that in the fi nancial statements. To fulfi ll its responsibility, management maintains internal accounting controls and systems and establishes policies and procedures to ensure the reliability of fi nancial information and to safeguard assets.
The Board of Trustees is responsible for ensuring that management fulfi lls its responsibilities for fi nancial reporting and internal control. The Board of Trustees carries out this responsibility principally through its Audit Committee, composed entirely of outside and unrelated trustees. The Audit Committee meets regularly with management of the REIT and with the independent auditors. The consolidated fi nancial statements have been reviewed and approved by the Board of Trustees on the recommendation of its Audit Committee.
The REIT’s independent auditors, KPMG LLP, have been appointed by the unitholders to audit the fi nancial statements and express an opinion thereon.
MANAGEMENT’S RESPONSIBILITY FOR FINANCIAL STATEMENTS
Armin Martens, P.Eng., M.B.A.PRESIDENT AND CHIEF EXECUTIVE OFFICER
March 19, 2008
Jim Green, CACHIEF FINANCIAL OFFICER
March 19, 2008

2007 ANNUAL REPORT | 43
AUDITORS’ REPORT
To the Unitholders of Artis Real Estate Investment Trust
We have audited the consolidated balance sheets of Artis Real Estate Investment Trust as at December 31, 2007 and 2006 and the consolidated statements of operations, unitholders’ equity and cash fl ows for the years then ended. These fi nancial statements are the responsibility of Artis Real Estate Investment Trust’s management. Our responsibility is to express an opinion on these fi nancial statements based on our audits.
We conducted our audits in accordance with Canadian generally accepted auditing standards. Those standards require that we plan and perform an audit to obtain reasonable assurance whether the fi nancial statements are free of material misstatement. An audit includes examining, on a test basis, evidence supporting the amounts and disclosures in the fi nancial statements. An audit also includes assessing the accounting principles used and signifi cant estimates made by management, as well as evaluating the overall fi nancial statement presentation.
In our opinion, these consolidated fi nancial statements present fairly, in all material respects, the fi nancial position of Artis Real Estate Investment Trust as at December 31, 2007 and 2006 and the results of its operations and its cash fl ows for the years then ended in accordance with Canadian generally accepted accounting principles.
signed KPMG LLPCHARTERED ACCOUNTANTS
Winnipeg, CanadaMarch 19, 2008

44 | ARTIS REIT
CONSOLIDATED BALANCE SHEETS
As at December 31, 2007 and 2006
(In thousands of dollars) 2007 2006
ASSETS
Income-producing properties (note 4) $ 944,612 $ 388,845
Other assets (note 5) 140,070 70,348
Future income taxes (note 18) 11,509 –
Deferred fi nancing costs, net of accumulated amortization of $nil (2006, $871) – 4,057
Deposits on income-producing properties (note 6) 11,826 10,343
Prepaid expenses 1,326 812
Notes receivable (note 7) 30,494 –
Rent and other receivables 6,543 2,956
Cash held in trust 682 327
Cash and cash equivalents 29,386 15,252
$ 1,176,448 $ 492,940
LIABILITIES AND UNITHOLDERS’ EQUITY
Liabilities:
Mortgages and loans payable (note 8) $ 612,996 $ 272,341
Convertible debentures (note 9) 52,732 40,503
Intangible liabilities (note 10) 99,280 13,341
Security deposits and prepaid rent 4,033 1,402
Accounts payable and other liabilities (note 11) 11,725 7,233
780,766 334,820
Non-controlling interest (note 13) 10,182 10,368
Unitholders’ equity 385,500 147,752
Contingent consideration (note 21)
Commitments and guarantees (note 22)
Subsequent events (note 25)
$ 1,176,448 $ 492,940
On behalf of the Board:
Armin Martens – Trustee Delmore Crewson – Trustee
See accompanying notes to consolidated fi nancial statements.

2007 ANNUAL REPORT | 45
Years ended December 31, 2007 and 2006
CONSOLIDATED STATEMENTS OF OPERATIONS
(In thousands of dollars, except per unit amounts) 2007 2006
Revenue $ 99,259 $ 53,522
Property operating expenses 31,790 19,271
67,469 34,251
Interest 28,194 17,003
39,275 17,248
Expenses:
Corporate 4,798 3,081
Amortization 41,225 26,148
46,023 29,229
Loss before the undernoted (6,748) (11,981)
Gain on disposal of income-producing properties (note 3) 2,511 828
Loss before income taxes (4,237) (11,153)
Future income tax recovery (note 18) 10,394 –
Income (loss) and comprehensive income (loss) for the year 6,157 (11,153)
Basic income (loss) per unit (note 14 (e)) $ 0.25 $ (0.94)
Diluted income (loss) per unit (note 14 (e)) $ 0.24 $ (0.94)
See accompanying notes to consolidated fi nancial statements.

46 | ARTIS REIT
CONSOLIDATED STATEMENTS OF UNITHOLDERS’ EQUITY
Years ended December 31, 2007 and 2006
Unitholders’ equity, December 31, 2005
7,959,814 $ 70,151 $ 5,024 $ (5,991) $ 176 $ 69,360
Issuance of units 6,731,463 89,236 – – (29) 89,207
Unit based compensation – – – – 502 502
Issuance of convertible debentures – –
7,570 – – 7,570
Conversion of convertible debentures 527,984 5,901 (935) – – 4,966
Loss for the year – – – (11,153) – (11,153)
Distributions for the year – – – (12,700) – (12,700)
Unitholders’ equity, December 31, 2006 15,219,261 165,288
11,659 (29,844) 649 147,752
Adoption of new accounting policies (note 2(b)) – (297) – 311 – 14
Issuance of units 15,372,633 250,152 – – (170) 249,982
Unit based compensation – – – – 1,039 1,039
Conversion of convertible debentures 566,174 7,123 (1,344) – – 5,779
Issuance of convertible debentures – –
1,125 – – 1,125
Income and comprehensive income for the year – – – 6,157 – 6,157
Distributions for the year – – – (26,348) – (26,348)
Unitholders’ equity, December 31, 2007 31,158,068 $ 422,266 $ 11,440 $ (49,724) $ 1,518 $ 385,500
See accompanying notes to consolidated fi nancial statements.
(In thousands of dollars, except per unit amounts) Number of Units
Capital Contributions
Equity Component
of Convertible Debentures Defi cit
Contributed Surplus Total

2007 ANNUAL REPORT | 47
(In thousands of dollars) 2007 2006
Cash provided by (used for):
Operating activities: Income (loss) for the year $ 6,157 $ (11,153) Adjustments for non-cash items:
Amortization: Income-producing properties 18,898 10,106 Offi ce equipment 7 4 Above-market rent 226 213 Acquired in-place leases 21,514 15,004 Customer relationships 22 23 Deferred fi nancing costs – 765 Below-market rent (9,780) (3,249) Tenant inducements and leasing costs 784 246 Above- and below-market mortgages, net (96) (81)
Accretion on liability component of convertible debentures 1,713 1,094 Straight-line rent adjustment (1,369) (1,063) Gain on disposal of income-producing properties (2,511) (828) Unit based compensation expense 1,039 502
Amortization of deferred fi nancing costs included in interest 229 – Future income tax recovery (10,394) – Units issued for Trustee compensation – 15
26,439 11,598
Changes in non-cash operating items (note 16) 2,147 2,022
28,586 13,620
Investing activities:Acquisition of income-producing properties, net of related debt (note 3) (197,680) (85,200)Disposition of income-producing properties, net of mortgage and costs (note 3) 2,552 3,440Additions to income-producing properties (984) (1,741)Repayment of mortgage receivable 14,000 –Advances of mortgage and notes receivable (45,000) –Notes receivable principal repayments 816 –Additions to offi ce equipment and software (31) (15)Additions to tenant inducements and leasing costs (3,469) (3,319)Change in deposits on income-producing properties (1,374) (2,118)
(231,170) (88,953)
Financing activities:Issuance of units, net of issue costs 248,893 89,192Costs incurred on issuance of Class B units (note 13) – (13)Issuance of convertible debentures – 30,000Distributions paid on REIT units (26,348) (12,700)Distributions paid on Class B units, charged to non-controlling interest (note 13) (186) (31)Mortgages and loans principal repayments (6,665) (4,261)Repayment of mortgages and loans payable – (19,230)Advance of mortgage payable 1,024 –Deferred fi nancing costs – (2,299)
216,718 80,658
Increase in cash and cash equivalents 14,134 5,325
Cash and cash equivalents at beginning of year 15,252 9,927
Cash and cash equivalents at end of year $ 29,386 $ 15,252
Supplemental cash fl ow information:Interest paid, net of interest received $ 22,094 $ 14,212Non-cash investing and fi nancing activities:
Deposit on income-producing property and related issuance of Class B units are excluded from investing and fi nancing activities – 7,800
Years ended December 31, 2007 and 2006
CONSOLIDATED STATEMENTS OF CASH FLOWS
See accompanying notes to consolidated fi nancial statements.

48 | ARTIS REIT
NOTES TO CONSOLIDATED FINANCIAL STATEMENTS
Years ended December 31, 2007 and 2006 (In thousands of dollars, except unit and per unit amounts)
1. ORGANIZATION:
Artis Real Estate Investment Trust (the “REIT”), formerly Westfi eld Real Estate Investment Trust, is an unincorporated open-end real estate investment trust (note 14) created under, and governed by, the laws of the province of Manitoba and was created pursuant to the Declaration of Trust dated November 8, 2004, subsequently amended and restated on October 31, 2006 (the “Declaration of Trust”). The purpose of the REIT is to directly, or indirectly, own, manage, lease and (where appropriate) develop retail, industrial and offi ce properties in Canada.
The Declaration of Trust provides that the REIT makes monthly cash distributions to unitholders of the REIT’s units. The amount distributed in each year will be an amount not less than the amount of distributable income in the year set down in a policy by the Trustees (currently $1.05 per unit).
2. SIGNIFICANT ACCOUNTING POLICIES:
(a) Principles of consolidation:
The consolidated fi nancial statements include the accounts of the REIT and its subsidiaries, together with its proportionate share of the assets, liabilities, revenue and expenses of the co-ownerships in which it participates.
(b) Changes in accounting policies:
The CICA has issued three new standards: Handbook Section 3855, Financial Instruments - Recognition and Measurement, Handbook Section 3865, Hedges, and Handbook Section 1530, Comprehensive Income, which were adopted by the REIT on January 1, 2007. In accordance with the transitional provisions of the respective standards, prior periods have not been restated and the effects of adopting these standards were recorded as transitional adjustments to the opening balances of the components of consolidated unitholders’ equity.
(i) Financial Instruments - Recognition and Measurement:
This standard provides guidance on recognizing fi nancial instruments and non-fi nancial derivatives on the consolidated balance sheet. The standard also specifi es how fi nancial instrument gains and losses are presented. Initially, all fi nancial assets and liabilities must be recorded on the consolidated balance sheet at fair value. Subsequent measurement is determined by the classifi cation of each fi nancial asset and liability. Under this standard, all fi nancial instruments are classifi ed as one of: (a) held-to-maturity; (b) loans and receivables; (c) held-for-trading; (d) available-for-sale or (e) other liabilities. Financial assets and liabilities held for trading are measured at fair value with gains and losses recognized in net income. Financial instruments classifi ed as held-to-maturity, loans and receivables, and other liabilities are measured at amortized cost. Available-for-sale fi nancial instruments are measured at fair value, with unrealized gains and losses recognized in comprehensive income.
Upon adoption of this new standard, the REIT designated its cash and cash equivalents and cash held in trust as held-for-trading; notes receivable and rent and other receivables as loans and receivables; mortgages and loans payable, convertible debentures, and accounts payable and other liabilities as other liabilities. The REIT has neither available-for-sale, nor held-to-maturity instruments.
Transaction costs that are directly attributable to the acquisition or issuance of fi nancial assets or liabilities are accounted for as part of the respective asset or liability’s carrying value at inception and amortized over the expected life of the fi nancial instrument using the effective interest rate method.
All derivative instruments, including embedded derivatives, are recorded in the consolidated statement of operations at fair value unless the criteria for exemption from such treatment under Section 3855 is met.
(ii) Comprehensive Income:
This standard requires a new component of unitholders’ equity, comprehensive income, to be included in the REIT’s consolidated fi nancial statements. In addition, the standard requires a statement of comprehensive income. The major components of the statement of comprehensive income may include items such as unrealized gains and losses on fi nancial assets classifi ed as available-for-sale, deferred gains and losses arising from the settlement of historic cash fl ow hedging transactions and changes in the fair value of the effective position of cash fl ow hedging instruments.
The REIT had no “other comprehensive income or loss” transactions during the year ended December 31, 2007 and no opening or closing balances of accumulated other comprehensive income or loss.

2007 ANNUAL REPORT | 49
(iii) Hedges:
In a fair value hedge, the change in fair value of the hedging derivative will be offset in the consolidated statements of operations against the change in the fair value of the hedged item relating to the hedged risk. In a cash fl ow hedge, the change in fair value of the derivative, to the extent effective, is recorded in other comprehensive income until the asset or liability being hedged affects the consolidated statements of operations, at which time, the related change in fair value of the derivative is recorded in the consolidated statements of operations. Any hedge ineffectiveness will be recorded in the consolidated statements of operations.
The impact on the REIT from the adoption of the fi nancial instruments standard was as follows:
To change the method of amortization of the deferred fi nancing costs to the effective interest rate method from straight-line, which decreased defi cit by $311, decreased capital contributions by $297 and increased deferred fi nancing costs by $14 as at January 1, 2007; and to classify the adjusted deferred fi nancing costs against the relevant host contract within the liability portion of the consolidated balance sheet.
(iv) Equity:
In addition, the REIT adopted the disclosure requirements of Handbook Section 3251, Equity. This section establishes standards for the presentation of equity and changes in equity during the reporting period. As a result of adopting this section, the REIT has included an additional fi nancial statement entitled “Consolidated Statements of Unitholders’ Equity” within the consolidated fi nancial statements.
(v) Convertible and Other Debt Instruments with Embedded Derivatives:
Emerging Issues Committee (“EIC”) 164, Convertible and Other Debt Instruments with Embedded Derivatives issued by the EIC of the Accounting Standards Board on March 5, 2007, was adopted by the REIT on January 1, 2007. This abstract addressed various issues surrounding the recognition, classifi cation and presentation of convertible debentures. There was no impact on the consolidated fi nancial statements as a result of the adoption of this abstract.
(c) Income-producing properties, other assets and intangible liabilities:
Income-producing properties include tangible and intangible assets.
Tangible assets include land, buildings, a leasehold interest, parking lots and improvements. Intangible assets include the value of in-place lease agreements, the value of the differential between original and market rents for in-place leases and the value of customer relationships.
Income-producing properties are carried at cost less accumulated amortization. If events or circumstances indicate that the carrying value of the income-producing property may be impaired, a recoverability analysis is performed based upon estimated undiscounted cash fl ows to be generated from the income-producing property. If the analysis indicates that the carrying value is not recoverable from future cash fl ows, the income-producing property is written-down to estimated fair value and an impairment loss is recognized.
Upon acquisition of income-producing properties, the purchase price is allocated based on estimated fair values to land, building, parking lots, tenant improvements and intangibles, including the value of above-and-below market leases, acquired in-place leases, and tenant relationships, if any.
Property under development includes initial acquisition costs, other direct costs and realty taxes, interest, and operating revenue and expenses during the period of development.
Years ended December 31, 2007 and 2006 (In thousands of dollars, except unit and per unit amounts)
NOTES TO CONSOLIDATED FINANCIAL STATEMENTS

50 | ARTIS REIT
NOTES TO CONSOLIDATED FINANCIAL STATEMENTS
Years ended December 31, 2007 and 2006 (In thousands of dollars, except unit and per unit amounts)
ASSET BASIS RATE/YEARS
Buildings Straight-line up to 40
Building improvements Straight-line up to 20
Tenant improvements Straight-line Remaining term of lease agreement
and renewal years where applicable
Leasehold interest Straight-line 40
Parking lots Straight-line 20
Offi ce equipment Straight-line 5
Acquired in-place leases Straight-line Remaining term of lease agreement
and renewal years where applicable
Above-market rent Straight-line Remaining term of lease agreement
and fi xed-rate non-cancelable renewal years
Below-market rent Straight-line Remaining term of lease agreement
and fi xed-rate non-cancelable renewal years
Tenant inducements and leasing costs Straight-line Term of lease agreement
Customer relationships Straight-line Remaining term of lease agreement
and renewal years where applicable
(d) Deferred costs:
Deferred recoverable operating costs are recorded at cost and are deferred and amortized over the period which they are recoverable from tenants.
Leasing costs, such as commissions, are deferred and amortized on a straight-line basis over the term of the related lease.
Payments to tenants under lease obligations are characterized either as tenant inducements owned by the landlord or as tenant inducements provided to the tenant. When the obligation is determined to be tenant inducements owned by the REIT, the REIT is considered to have acquired an asset. If the REIT determines that for accounting purposes it is not the owner of the tenant inducements, then the obligations under the lease are treated as incentives that reduce revenue. Tenant inducements are amortized on a straight-line basis over the term of the lease.
Deferred fi nancing costs represent costs incurred relating to the issuance of the convertible debentures and the fi nancing by way of mortgage or vendor take-back loans related to the REIT’s income-producing properties.
Prior to January 1, 2007, deferred fi nancing costs were amortized on a straight-line basis over the term of the related debt. Pursuant to CICA 3855, effective January 1, 2007 (note 2(b)), deferred fi nancing costs are capitalized to the related asset or liability and are amortized using the effective interest method.
(e) Cash and cash equivalents:
Cash and cash equivalents consist of cash with fi nancial institutions and includes short-term investments with maturities of three months or less.
(f) Revenue recognition:
Revenue from income-producing properties include rents earned from tenants under lease agreements, percentage rent, realty tax and operating cost recoveries and other incidental income and is recognized as revenue over the term of the underlying leases. All rent steps in lease agreements are accounted for on a straight-line basis over the term of the respective leases. Percentage rent is not recognized until a tenant is obligated to pay such rent.
(g) Co-ownerships:
The REIT carries out a portion of its activities through co-ownership agreements and records its proportionate share of assets, liabilities, revenues, expenses and cash fl ows of the co-ownerships in which it participates.
(h) Earnings per unit:
Basic earnings (loss) per REIT unit is computed by dividing net earnings (loss) by the weighted average units outstanding during the reporting year. Diluted earnings (loss) per unit is calculated based on the weighted average number of units outstanding during the year, plus the effect of dilutive unit equivalents such as options. The diluted per unit amounts are calculated using the treasury stock method, as if all the unit equivalents where average market price exceeds issue price had been exercised at the beginning of the reporting year, or the year of issue, as the case may be, and that the funds obtained thereby were used to purchase units of the REIT at the average trading price of the units during the year.
Amortization on income-producing properties, other assets and intangible liabilities is provided on the following basis and rates:

2007 ANNUAL REPORT | 51
(i) Income taxes:
Income taxes are accounted for using the asset and liability method. Under this method, future income taxes are recognized for the expected future tax consequences of temporary differences between the carrying amount of balance sheet items and their corresponding tax values.
Future income taxes are computed using enacted or substantively enacted income tax rates or laws for the years in which the temporary differences are expected to reverse or settle. When realization of future income tax assets does not meet the more likely than not criterion, a valuation allowance is provided for the difference.
(j) Unit-based compensation:
The REIT accounts for unit options issued under its unit option plan using the fair value method. Under this method, compensation expense is measured at fair value at the grant date using the Black-Scholes option pricing model and recognized over the vesting period.
(k) Use of estimates:
The preparation of fi nancial statements requires management to make estimates and assumptions that affect the reported amounts of assets and liabilities, the disclosure of contingent assets and liabilities at the date of the fi nancial statements and the reported amounts of revenues and expenses during the year. Actual results could differ from those estimates.
PROPERTY LOCATION ACQUISITION DATE TYPE
CDI College Building 280 Main Street, Winnipeg, MB January 13, 2007 Offi ce
Keewatin Distribution Centre 959 & 989 Keewatin Street, Winnipeg, MB January 31, 2007 Industrial
Clareview Town Centre 50th Street & 137th Avenue, Edmonton, AB February 1, 2007 Retail
Centre 70 Building(1) 7015 Macleod Tr. SW & 555 - 69th St. SW, Calgary, AB February 28, 2007 Offi ce
Honeywell Building 2840 - 2nd Avenue SE, Calgary, AB February 28, 2007 Industrial
Millennium Centre 4909 - 49th St. & 4902 - 48th St., Red Deer, AB February 28, 2007 Offi ce
Bower Centre 2319 Taylor Dr. & 2310 Gaetz Ave., Red Deer, AB March 1, 2007 Industrial
Britannia Building (2) 703 - 6th Avenue SW, Calgary, AB March 31, 2007 Offi ce
Sierra Place (2) 706 - 7th Avenue SW, Calgary, AB March 31, 2007 Offi ce
MTS Call Centre 365 Osborne Street, Winnipeg, MB April 1, 2007 Offi ce
488 Albert St (3) 488 Albert Street, Nanaimo, BC June 19, 2007 Offi ce
6475 Metral Drive (3) 6475 Metral Drive, Nanaimo, BC June 19, 2007 Offi ce
Aulds Corner (3) 6551 Aulds Road, Nanaimo, BC June 19, 2007 Retail
Can-K Building (4) 8220 Davies Road, Edmonton, AB June 30, 2007 Industrial
Mayfi eld Industrial Plaza(4) 11304/24 - 163 Street, Edmonton, AB June 30, 2007 Industrial
TransAlta Place (5) 110 - 12th Avenue SW, Calgary, AB July 5, 2007 Offi ce
Winnipeg Square (6) 360 Main Street, Winnipeg, MB August 29, 2007 Offi ce/Retail
Pepco Building 608 - 17th Avenue, Nisku, AB September 15, 2007 Industrial
Delta Shoppers Mall 8037 - 120th Street, Delta, BC September 24, 2007 Retail
Glenmore Commerce Court 2880 Glenmore Trail SE, Calgary, AB November 9, 2007 Offi ce
Winnipeg Industrial Portfolio (7) Various locations in Winnipeg, MB November 15, 2007 Industrial
Brick Centre 11226 - 100th Avenue, 11245 - 104th Avenue
& 11345/53 - 104th Avenue, Grande Prairie, AB
November 30, 2007 Retail
Fort McMurray Portfolio (8) Various locations in Edmonton and Fort McMurray, AB November 30, 2007 Retail
Paramount Building 630 - 4th Avenue SW, Calgary, AB December 1, 2007 Offi ce
(1) The REIT acquired an undivided 85% interest in Centre 70, which is proportionately consolidated in the accounts of the REIT.
(2) The Britannia Building and Sierra Place were acquired together as the Dome Britannia Portfolio.
(3) 488 Albert Street, 6475 Metral Drive and Aulds Corner were acquired as a portfolio.
(4) Can-K Building and Mayfi eld Industrial Plaza were acquired as a portfolio.
(5) The acquisition of TransAlta Place also included the acquisition of a note receivable for $31,000 (note 7).
(6) The REIT acquired an undivided 38% interest in the air rights leashold with respect to Winnipeg Square, which is proportionately consolidated in the accounts of the REIT.
(7) The Winnipeg Industrial Portfolio is comprised of 8 single-tenant and 8 multi-tenant properties.
(8) The Fort McMurray Portfolio is comprised of one property in Edmonton and 6 properties in Fort McMurray.
Years ended December 31, 2007 and 2006 (In thousands of dollars, except unit and per unit amounts)
NOTES TO CONSOLIDATED FINANCIAL STATEMENTS
3. ACQUISITIONS AND DISPOSITIONS OF INCOME-PRODUCING PROPERTIES:
Acquisitions:
The REIT acquired the following properties during the year ended December 31, 2007:

52 | ARTIS REIT
NOTES TO CONSOLIDATED FINANCIAL STATEMENTS
Years ended December 31, 2007 and 2006 (In thousands of dollars, except unit and per unit amounts)
The REIT acquired the following properties during the year ended December 31, 2006:
PROPERTY LOCATION ACQUISITION DATE TYPE
Northwest Centre 4500 and 4520 - 16th Ave. NW, Calgary, AB February 28, 2006 Offi ce
Southwood Corner 10233 Elbow Drive, Calgary, AB March 31, 2006 Retail
Circle 8 3120, 3124, 3126 & 3134 - 8th St. E, Saskatoon, SK March 31, 2006 Retail
Reenders Square 3-11 Reenders Drive, Winnipeg, MB March 31, 2006 Retail
Sunridge Spectrum Sunridge & 32nd St. NE, Calgary, AB May 31, 2006 Retail
McCall Lake 1338 - 36th Ave. NE, Calgary, AB June 30, 2006 Industrial
Heritage Square 8500 Macleod Trail SE, Calgary, AB July 13, 2006 Offi ce
Franklin Showcase Warehouse 700 - 33rd Street NE & 3501 - 8th Avenue NE,
Calgary, AB July 14, 2006 Industrial
Horizon Heights 3508 - 32nd Avenue NE, Calgary, AB July 17, 2006 Retail
Liberton Square 504, 506 & 506A St. Albert Trail, St. Albert, AB November 1, 2006 Retail
Delta Centre 16515 - 116th Avenue, Edmonton, AB December 31, 2006 Industrial
Year Ended December 31,
2007 2006
Land $ 126,881 $ 56,837
Buildings 419,975 119,666
Leasehold interest – 6
Parking lots 7,512 3,800
Property under development – 2,632
Improvements 20,972 10,800
Acquired in-place leases 86,925 35,460
Above-market rent 409 201
Below-market rent (95,764) (9,379 )
Long-term debt including acquired above- and below-market mortgages (349,230) (132,211 )
Series D convertible debenture (20,000) –
Total consideration 197,680 87,812
Issuance of Class B units (note 13) – (2,612 )
Cash consideration $ 197,680 $ 85,200
Acquisition costs included above $ 9,251 $ 9,141
These acquisitions have been accounted for by the purchase method, with the results of operations included in the REIT’s accounts from the date of acquisition.
The net assets acquired including acquisition costs were as follows:

2007 ANNUAL REPORT | 53
Dispositions:
The REIT disposed of the following property during the year ended December 31, 2007:
PROPERTY LOCATION DISPOSITION DATE TYPE
Royal Square 15 Worobetz Place, Saskatoon, SK September 1, 2007 Retail
The proceeds from the sale of Royal Square, net of costs, were $4,591. Consideration received was the assumption of the existing mortgage in the amount of $1,729, a promissory note in the amount of $310 (note 7), and cash in the amount of $2,552. The assets, intangible assets and liabilities associated with the property were removed from the books and a gain on sale of property in the amount of $2,511 was recorded.
The REIT disposed of the following properties during the year ended December 31, 2006:
PROPERTY LOCATION DISPOSITION DATE TYPE
Edgemont Mall 34 Edgedale Drive NW, Calgary, AB January 12, 2006 Retail
Keystone Village Mall 1300 - 18th Street, Brandon, MB June 15, 2006 Retail
The proceeds from the sale of Edgemont Mall, net of costs, were $5,117. Consideration received was the assumption of the existing mortgage in the amount of $2,976 and cash in the amount of $2,141. The assets, intangible assets and liabilities associated with the property were removed from the books and a gain on sale of property in the amount of $941 was recorded.
The proceeds from the sale of Keystone Village Mall, net of costs, were $3,510. Consideration received was the assumption of the existing mortgage in the amount of $2,211 and cash in the amount of $1,299. The assets, intangible assets and liabilities associated with the property were removed from the books and a loss on sale of property in the amount of $113 was recorded.
The impact of the gain on disposal of the income-producing property in 2007, net of future income taxes, on basic and diluted income per unit was $0.08 (2006 - $0.07).
December 31, 2007
Cost Accumulated amortization Net book value
Land $ 234,301 $ – $ 234,301
Buildings and building improvements 667,846 16,944 650,902
Leasehold interest 8,015 489 7,526
Tenant improvements 46,807 12,199 34,608
Parking lots 15,513 963 14,550
Property under development 2,725 – 2,725
$ 975,207 $ 30,595 $ 944,612
4. INCOME-PRODUCING PROPERTIES:
December 31, 2006
Cost
Accumulated
amortization Net book value
Land $ 108,066 $ – $ 108,066
Buildings and building improvements 247,942 5,708 242,234
Leasehold interest 8,015 286 7,729
Tenant improvements 26,225 5,694 20,531
Parking lots 8,020 367 7,653
Property under development 2,632 – 2,632
$ 400,900 $ 12,055 $ 388,845
Years ended December 31, 2007 and 2006 (In thousands of dollars, except unit and per unit amounts)
NOTES TO CONSOLIDATED FINANCIAL STATEMENTS

54 | ARTIS REIT
NOTES TO CONSOLIDATED FINANCIAL STATEMENTS
Years ended December 31, 2007 and 2006 (In thousands of dollars, except unit and per unit amounts)
December 31, 2007
Cost Accumulated amortization Net book value
Acquired in-place leases $ 168,892 $ 38,319 $ 130,573
Above-market rent 1,573 498 1,075
Customer relationships 105 68 37
Tenant inducements and leasing costs 6,864 958 5,906
Deferred recoverable operating costs 2,585 149 2,436
Offi ce equipment and software 55 12 43
$ 180,074 $ 40,004 $ 140,070
December 31, 2006
Cost
Accumulated
amortization Net book value
Acquired in-place leases $ 82,898 $ 17,489 $ 65,409
Above-market rent 1,179 283 896
Customer relationships 115 54 61
Tenant inducements and leasing costs 3,661 255 3,406
Deferred recoverable operating costs 557 – 557
Offi ce equipment 24 5 19
$ 88,434 $ 18,086 $ 70,348
5. OTHER ASSETS:
6. DEPOSITS ON INCOME-PRODUCING PROPERTIES:
Year Ended
December 31, 2007
Year Ended
December 31, 2006
Deposit on income-producing property (note 13):
Balance, beginning of year $ 7,743 $ –
Initial deposit – 7,800
Property rent (1,200) (200 )
Costs incurred 215 –
Distributions on 543,781 Class B units of AX L.P. 572 143
7,330 7,743
Deposits on other income-producing properties 4,496 2,600
$ 11,826 $ 10,343
Effective February 21, 2007, the REIT entered into a purchase and sale agreement with respect to the forward purchase of the property known as “Bridges Place”, currently under development. The REIT anticipates that the purchase price, which is to be determined based on a 7% capitalization rate on the net operating income in place at acquisition, will be approximately $6,800. The REIT has made deposits totaling $1,150 with respect to the purchase and sale agreement. Construction has commenced and is anticipated to be completed in 2008. The vendor may extend closing until any date up to December 1, 2008 pending the lease-up of the property.

2007 ANNUAL REPORT | 55
7. NOTES RECEIVABLE:
December 31, 2007 December 31, 2006
Note receivable from tenant (note 3) maturing in May 2023, bearing interest at
5.894% per annum, repayable in varying blended monthly instalments of
principal and interest. The note is unsecured and is transferable at the option
of the holder. A default under the terms of the note constitutes a default of the
lease of the tenant. $ 30,187 $ –
Note receivable maturing in November 2010, bearing interest at 5.06% per annum,
repayable in blended monthly instalments of principal and interest of $2 and is
unsecured. The note was received as partial consideration for the sale of Royal
Square (note 3). 307 –
$ 30,494 $ –
8. MORTGAGES AND LOANS PAYABLE:
Substantially all of the REIT’s assets have been pledged as security under mortgages and other security agreements. The mortgages and loans payable bear interest at fi xed rates, with a weighted average effective rate of 5.51% at December 31, 2007, a weighted average nominal rate of 5.42% at December 31, 2007 (nominal and effective December 31, 2006, 5.51%), and maturity dates ranging from November 1, 2008 to January 1, 2018.
Principal payment requirements on the mortgages and loans payable as at December 31, 2007 are as follows:
2008 $ 20,598
2009 34,910
2010 92,819
2011 45,163
2012 107,913
2013 and thereafter 313,316
614,719
Net of above- and below-market mortgage adjustments 481
Deferred fi nancing costs (2,204 )
$ 612,996
Years ended December 31, 2007 and 2006 (In thousands of dollars, except unit and per unit amounts)
NOTES TO CONSOLIDATED FINANCIAL STATEMENTS
9. CONVERTIBLE DEBENTURES:
In conjunction with the private placement offering that closed August 4, 2005, the REIT issued Series A convertible redeemable 7.75% debentures totaling $15,000. Interest is paid semi-annually on February 4 and August 4. The convertible debentures are convertible into units of the REIT by the holder at $12.60 after August 4, 2006, and redeemable for cash at the option of the REIT at any time after August 4, 2007 provided that the market price of the units exceeds 150% of the conversion price, and will be redeemable at the option of the REIT at any time after August 4, 2009 provided that the market price of the units exceeds 125% of the conversion price. Debentures that are not converted into units of the REIT are to be repaid in cash on maturity, being August 4, 2010. The convertible debentures are compound fi nancial instruments and the proceeds of the offering, at the time of issue, were allocated between a liability and equity component in the amount of $12,169 and $2,831, respectively. The equity component refl ects the equity value of the conversion option embedded in the convertible debentures. During the year, Series A convertible debentures with a face value of $7,015 (2006, $4,815) were converted and the REIT issued 561,538 (2006, 382,138) units at the exercise price of $12.60 per unit. The carrying value of the debt component was reduced by $5,701 (2006, $4,071), the equity component was reduced by $1,323 (2006, $909), future income taxes were increased by $26 (2006, $nil), with an offsetting increase to capital contributions of $7,050 (2006, $4,980) (note 14(b)).

56 | ARTIS REIT
NOTES TO CONSOLIDATED FINANCIAL STATEMENTS
Years ended December 31, 2007 and 2006 (In thousands of dollars, except unit and per unit amounts)
In conjunction with the private placement offering that closed November 9, 2005, the REIT issued Series B convertible redeemable 7.5% debentures totaling $10,862. Interest is paid semi-annually on May 9 and November 9. The convertible debentures are convertible into units of the REIT by the holder after November 9, 2007 at a price of $13.50 per unit. The debentures are redeemable for cash at the option of the REIT (i) at any time after November 9, 2007 provided that the market price of the units exceeds 150% of the conversion price; and (ii) at any time after November 9, 2009 provided that the market price of the units exceeds 125% of the conversion price. The debentures rank pari passu with the convertible debentures issued August 4, 2005. Debentures that are not converted into units of the REIT are to be repaid in cash on maturity, being November 9, 2010. The convertible debentures are compound fi nancial instruments and the proceeds of the offering, at the time of issue, were allocated between a liability and equity component in the amount of $8,715 and $2,147, respectively. The equity component refl ects the equity value of the conversion option embedded in the convertible debentures. None of the Series B convertible debentures were converted into units of the REIT in fi scal 2007 or 2006.
In conjunction with the prospectus that closed May 4, 2006, the REIT issued Series C convertible redeemable 6.25% debentures totaling $30,000. Interest is paid semi-annually on May 31 and November 30. The convertible debentures are convertible into units of the REIT by the holder after May 31, 2009 at a price of $17.25 per unit. The debentures are redeemable for cash at the option of the REIT (i) at any time after May 31, 2009 provided that the market price of the units exceeds 125% of the conversion price; and (ii) at any time after May 31, 2011. The debentures rank pari passu with the convertible debentures issued August 4, 2005 and November 9, 2005. Debentures that are not converted into units of the REIT are to be repaid in cash on maturity, being May 31, 2013. The convertible debentures are compound fi nancial instruments and the proceeds of the offering, at the time of issue, were allocated between a liability and equity component in the amount of $22,410 and $7,590, respectively. The equity component refl ects the equity value of the conversion option embedded in the convertible debentures. During the year, Series C convertible debentures with a face value of $80 were converted and the REIT issued 4,636 units at the exercise price of $17.25 per unit. The carrying value of the debt component was reduced by $52 and the equity component was reduced by $21, with an offsetting increase to capital contributions of $73 (note 14(b)).
In conjunction with the purchase of the Fort McMurray portfolio (note 3) effective November 30, 2007, the REIT issued a Series D convertible redeemable 5% debenture totaling $20,000. Interest is paid semi-annually on May 31 and November 30. The convertible debenture is convertible into units of the REIT by the holder after November 30, 2009 at a price of $17.75 per unit. The debenture is redeemable for cash at the option of the REIT at any time prior to maturity provided that the market price of the units exceeds 120% of the conversion price. The debenture ranks pari passu with the convertible debentures issued August 4, 2005, November 9, 2005 and May 4, 2006. If the debenture is not converted into units of the REIT it is to be repaid in cash on maturity, being November 30, 2014. The convertible debenture is a compound fi nancial instrument and the proceeds of the offering, at the time of issue, were allocated between a liability and equity component in the amount of $18,875 and $1,125, respectively. The equity component refl ects the equity value of the conversion option embedded in the convertible debenture. None of the Series D convertible debenture was converted into units of the REIT in fi scal 2007.
Using a term until maturity, the liability portion of the debentures at the date of issuance represents the present value of the mandatory cash payments of interest plus the present value of the principal amount due under the terms of the debentures discounted at 13%, or in the case of the Series C debentures, 11.75%, being the rate of interest that would be applicable to a debt-only instrument of comparable term and risk. The equity component, which represents the value ascribed to the conversion option issued, is calculated as the difference between the amount issued and the liability component. Interest expense is determined by applying the discount rate against the outstanding liability component of the debentures. The difference between actual interest payments and interest expense is treated as an addition to the liability component of the debentures.
Upon issuance, the Series D convertible debenture was separated into liability and equity components based on the respective estimated fair values at the date of issuance of the convertible debenture. The fair value of the liability component is estimated based on the present value of future interest and principal payments due under the terms of the convertible debenture using a discount rate for similar debt instruments without a conversion feature. The value assigned to the equity component is the estimated fair value ascribed to the holder’s option to convert. Interest expense on the Series D convertible debenture is determined by applying an effective interest rate of 6% to the outstanding liability component. The difference between actual cash interest payments and interest expense is accreted to the liability component.

2007 ANNUAL REPORT | 57
Years ended December 31, 2007 and 2006 (In thousands of dollars, except unit and per unit amounts)
NOTES TO CONSOLIDATED FINANCIAL STATEMENTS
Particulars of the REIT’s outstanding convertible debentures as at December 31, 2007 and December 31, 2006 are as follows:
Convertible debenture issue
Series A
convertible
redeemable
Series B
convertible
redeemable
Series C
convertible
redeemable
Series D
convertible
redeemable 2007 2006
Issue date
August 4,
2005
November 9,
2005
May 4,
2006
November 30,
2007
Interest rate 7.75% 7.50% 6.25% 5.00%
Face value $ 3,170 $ 10,862 $ 29,920 $ 20,000 $ 63,952 $ 51,047
Equity portion 598 2,147 7,570 1,125 11,440 11,659
Liability portion 2,572 8,715 22,350 18,875 52,512 39,388
Accretion to December 31, 2007
and December 31, 2006 236 759 1,162 9 2,166 1,115
Deferred fi nancing costs (note 2(b)) (164 ) (498 ) (1,238 ) (46 ) (1,946) –
Carrying value at December 31, 2007
and December 31, 2006 $ 2,644 $ 8,976 $ 22,274 $ 18,838 $ 52,732 $ 40,503
10. INTANGIBLE LIABILITIES:
Accretion to the carrying value of the debt component was $1,713 (2006, $1,094) during the year ended December 31, 2007. The weighted average effective rate of the debentures at December 31, 2007 is 11.06% (2006, 12.30%).
December 31, 2007
Cost Accumulated amortization Net book value
Below-market rent $ 112,954 $ 13,674 $ 99,280
December 31, 2006
Cost
Accumulated
amortization Net book value
Below-market rent $ 17,302 $ 3,961 $ 13,341
11. ACCOUNTS PAYABLE AND OTHER LIABILITIES:
December 31, 2007 December 31, 2006
Accounts payable and accrued liabilities $ 8,934 $ 5,727
Distributions payable (note 15) 2,791 1,506
$ 11,725 $ 7,233
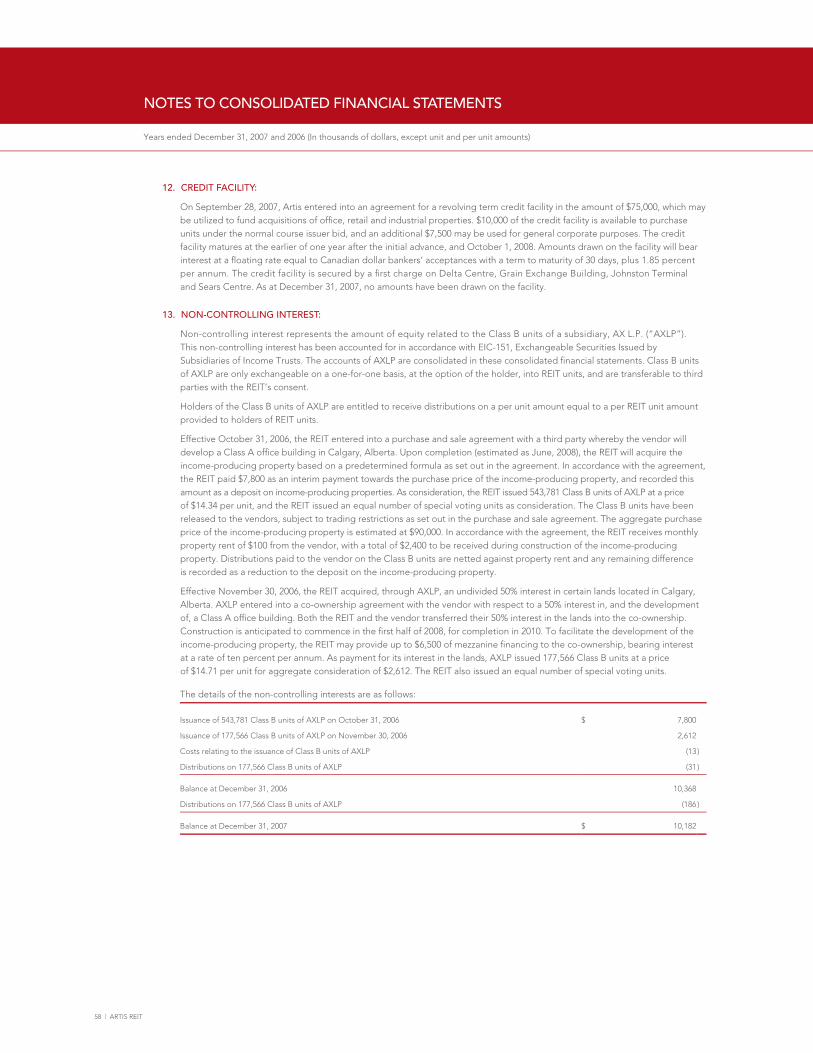
58 | ARTIS REIT
NOTES TO CONSOLIDATED FINANCIAL STATEMENTS
Years ended December 31, 2007 and 2006 (In thousands of dollars, except unit and per unit amounts)
12. CREDIT FACILITY:
On September 28, 2007, Artis entered into an agreement for a revolving term credit facility in the amount of $75,000, which may be utilized to fund acquisitions of offi ce, retail and industrial properties. $10,000 of the credit facility is available to purchase units under the normal course issuer bid, and an additional $7,500 may be used for general corporate purposes. The credit facility matures at the earlier of one year after the initial advance, and October 1, 2008. Amounts drawn on the facility will bear interest at a fl oating rate equal to Canadian dollar bankers’ acceptances with a term to maturity of 30 days, plus 1.85 percent per annum. The credit facility is secured by a fi rst charge on Delta Centre, Grain Exchange Building, Johnston Terminal and Sears Centre. As at December 31, 2007, no amounts have been drawn on the facility.
13. NON-CONTROLLING INTEREST:
Non-controlling interest represents the amount of equity related to the Class B units of a subsidiary, AX L.P. (“AXLP”). This non-controlling interest has been accounted for in accordance with EIC-151, Exchangeable Securities Issued by Subsidiaries of Income Trusts. The accounts of AXLP are consolidated in these consolidated fi nancial statements. Class B units of AXLP are only exchangeable on a one-for-one basis, at the option of the holder, into REIT units, and are transferable to third parties with the REIT’s consent.
Holders of the Class B units of AXLP are entitled to receive distributions on a per unit amount equal to a per REIT unit amount provided to holders of REIT units.
Effective October 31, 2006, the REIT entered into a purchase and sale agreement with a third party whereby the vendor will develop a Class A offi ce building in Calgary, Alberta. Upon completion (estimated as June, 2008), the REIT will acquire the income-producing property based on a predetermined formula as set out in the agreement. In accordance with the agreement, the REIT paid $7,800 as an interim payment towards the purchase price of the income-producing property, and recorded this amount as a deposit on income-producing properties. As consideration, the REIT issued 543,781 Class B units of AXLP at a price of $14.34 per unit, and the REIT issued an equal number of special voting units as consideration. The Class B units have been released to the vendors, subject to trading restrictions as set out in the purchase and sale agreement. The aggregate purchase price of the income-producing property is estimated at $90,000. In accordance with the agreement, the REIT receives monthly property rent of $100 from the vendor, with a total of $2,400 to be received during construction of the income-producing property. Distributions paid to the vendor on the Class B units are netted against property rent and any remaining difference is recorded as a reduction to the deposit on the income-producing property.
Effective November 30, 2006, the REIT acquired, through AXLP, an undivided 50% interest in certain lands located in Calgary, Alberta. AXLP entered into a co-ownership agreement with the vendor with respect to a 50% interest in, and the development of, a Class A offi ce building. Both the REIT and the vendor transferred their 50% interest in the lands into the co-ownership. Construction is anticipated to commence in the fi rst half of 2008, for completion in 2010. To facilitate the development of the income-producing property, the REIT may provide up to $6,500 of mezzanine fi nancing to the co-ownership, bearing interest at a rate of ten percent per annum. As payment for its interest in the lands, AXLP issued 177,566 Class B units at a price of $14.71 per unit for aggregate consideration of $2,612. The REIT also issued an equal number of special voting units.
Issuance of 543,781 Class B units of AXLP on October 31, 2006 $ 7,800
Issuance of 177,566 Class B units of AXLP on November 30, 2006 2,612
Costs relating to the issuance of Class B units of AXLP (13 )
Distributions on 177,566 Class B units of AXLP (31 )
Balance at December 31, 2006 10,368
Distributions on 177,566 Class B units of AXLP (186 )
Balance at December 31, 2007 $ 10,182
The details of the non-controlling interests are as follows:

2007 ANNUAL REPORT | 59
14. CAPITAL CONTRIBUTIONS:
(a) Authorized:
The REIT completed its conversion into an “open-ended” mutual fund trust under the provisions of the Income Tax Act (Canada) effective October 31, 2006. In accordance with the Amended and Restated Declaration of Trust, the REIT may issue an unlimited number of units, with each unit representing an equal fractional undivided benefi cial interest in any distributions from the REIT, and in the net assets in the event of termination or wind-up of the REIT. All units are of the same class with equal rights and privileges. The units are redeemable at any time at the option of the holder at a price defi ned in the Amended and Restated Declaration of Trust, subject to a maximum of $30 in cash redemptions by the REIT in any one month. Redemptions in excess of this amount will be paid by way of a distribution of notes of the REIT, or the notes of a wholly-owned subsidiary of the REIT.
In accordance with the Amended and Restated Declaration of Trust, the REIT may also issue a class of special voting units, which are non-participating voting units of the REIT, to be issued to holders of securities which are exchangeable for units of the REIT (note 13). Special voting units are cancelled on the issuance of REIT units on exercise, conversion or cancellation of the corresponding exchangeable securities.
Effective February 1, 2006, the REIT consolidated its units on a 15 for one basis. All unit and per unit disclosures are presented on a post-consolidation basis.
(b) Issued and Outstanding:
Units stated on a post-consolidation basis Number of units Amount
Balance at December 31, 2005 7,959,814 $ 70,151
Public offerings, net of issue costs of $5,624 6,657,138 88,693
Conversion of $875 convertible debentures 145,833 921
Conversion of Series A convertible debentures 382,151 4,980
Options exercised 69,000 469
Distribution Reinvestment Plan 4,264 59
Units issued for Trustee compensation 1,066 15
Fractional units eliminated on consolidation (5 ) –
Balance at December 31, 2006 15,219,261 165,288
Adoption of new accounting policies (note 2 (b)) – (297)
Public offerings, net of issue costs of $10,709 (net of future income taxes of $1,089) 15,270,000 248,572
Conversion of Series A convertible debentures 561,538 7,050
Conversion of Series C convertible debentures 4,636 73
Options exercised 81,355 1,223
Distribution Reinvestment Plan 34,278 553
Units acquired through normal course issuer bid, not cancelled at year end (13,000) (196)
Balance at December 31, 2007 31,158,068 $ 422,266
At December 31, 2007, there were 721,347 special voting units issued and outstanding (note 13). There is no value assigned to the special voting units.
On June 27, 2006, the REIT announced its new Distribution Reinvestment Plan (“DRIP”). Under the terms of the DRIP, Unitholders now have the option to elect to receive all or a portion of their regular monthly distributions in additional REIT units.
Years ended December 31, 2007 and 2006 (In thousands of dollars, except unit and per unit amounts)
NOTES TO CONSOLIDATED FINANCIAL STATEMENTS

60 | ARTIS REIT
Range of
exercise prices
Number
outstanding
Weighted average
remaining contractual life
Options
outstanding
weighted average
exercise price
Number
exercisable
$ 11.25 239,788 3.0 years $ 11.25 97,595
$ 14.40 380,500 3.75 years $ 14.40 181,500
$ 15.85 269,750 4.0 years $ 15.85 64,250
$ 17.60 319,050 4.5 years $ 17.60 79,762
$ 17.75 272,000 4.75 years $ 17.75 –
1,481,088 $ 15.47
423,107
NOTES TO CONSOLIDATED FINANCIAL STATEMENTS
Years ended December 31, 2007 and 2006 (In thousands of dollars, except unit and per unit amounts)
(c) Contributed surplus:Year Ended December 31,
2007 2006
Balance, beginning of year $ 649 $ 176
Unit based compensation expense 1,039 502
Value of options exercised (170 ) (29 )
Balance, end of year $ 1,518 $ 649
Contributed surplus arises as a result of recording the fair value of options granted under the unit option plan (see note 14(d)). The fair value of the options is recorded to contributed surplus as the options vest. Upon exercise, the proceeds received, as well as any balance previously recorded to contributed surplus, are credited to capital contributions.
(d) Unit options:
The REIT has a unit option plan which is administered by the Board of Trustees of the REIT with unit options granted to trustees, management, management company employees and consultants as a form of compensation. The total number of units reserved under option for issuance may not exceed 5% of the units outstanding.
A summary of the REIT’s unit options for the year ended December 31 are as follows:
2007 2006
Units Weighted average
exercise price Units
Weighted average
exercise price
Balance, beginning of year 729,393 $ 13.20 348,393 $ 10.29
Granted 898,050 17.07 450,000 14.40
Exercised (81,355) 12.94 (69,000 ) 6.38
Expired (65,000) 15.25 – –
Balance, end of year 1,481,088 $ 15.47 729,393 $ 13.20
Options exercisable at end of year 423,107 178,598
Weighted average fair value per unit
of options granted during the year $ 1.21 $ 2.16
Options outstanding at December 31, 2007 consist of the following:
2007 2006
Expected option life 3.8 years 5 years
Risk-free interest rate 4.38% 4.01%
Dividend yield 6.11% 7.3%
Expected volatility 16.1% 31.83%
The compensation expense related to unit options granted under the unit option plan for the year ended December 31, 2007 amounted to $1,039 (2006, $502). The balance of contributed surplus at December 31, 2007 relates to unexercised options. The compensation expense was determined based on the fair value of the options at the date of grant using the Black-Scholes option pricing model with the following weighted average assumptions:
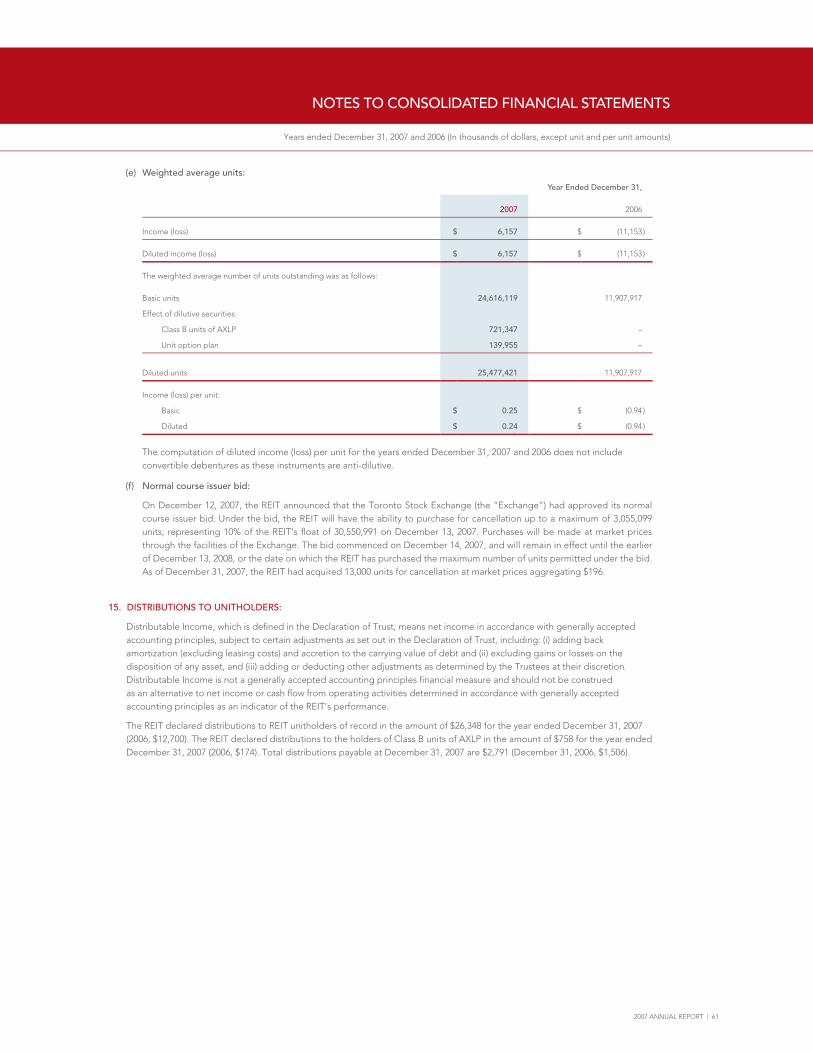
2007 ANNUAL REPORT | 61
(e) Weighted average units:
Year Ended December 31,
2007 2006
Income (loss) $ 6,157 $ (11,153 )
Diluted income (loss) $ 6,157 $ (11,153 )
The weighted average number of units outstanding was as follows:
Basic units 24,616,119 11,907,917
Effect of dilutive securities:
Class B units of AXLP 721,347 –
Unit option plan 139,955 –
Diluted units 25,477,421
11,907,917
Income (loss) per unit:
Basic $ 0.25 $ (0.94 )
Diluted $ 0.24 $ (0.94 )
The computation of diluted income (loss) per unit for the years ended December 31, 2007 and 2006 does not include convertible debentures as these instruments are anti-dilutive.
15. DISTRIBUTIONS TO UNITHOLDERS:
Distributable Income, which is defi ned in the Declaration of Trust, means net income in accordance with generally accepted accounting principles, subject to certain adjustments as set out in the Declaration of Trust, including: (i) adding back amortization (excluding leasing costs) and accretion to the carrying value of debt and (ii) excluding gains or losses on the disposition of any asset, and (iii) adding or deducting other adjustments as determined by the Trustees at their discretion. Distributable Income is not a generally accepted accounting principles fi nancial measure and should not be construed as an alternative to net income or cash fl ow from operating activities determined in accordance with generally accepted accounting principles as an indicator of the REIT’s performance.
The REIT declared distributions to REIT unitholders of record in the amount of $26,348 for the year ended December 31, 2007 (2006, $12,700). The REIT declared distributions to the holders of Class B units of AXLP in the amount of $758 for the year ended December 31, 2007 (2006, $174). Total distributions payable at December 31, 2007 are $2,791 (December 31, 2006, $1,506).
(f) Normal course issuer bid:
On December 12, 2007, the REIT announced that the Toronto Stock Exchange (the “Exchange”) had approved its normal course issuer bid. Under the bid, the REIT will have the ability to purchase for cancellation up to a maximum of 3,055,099 units, representing 10% of the REIT’s fl oat of 30,550,991 on December 13, 2007. Purchases will be made at market prices through the facilities of the Exchange. The bid commenced on December 14, 2007, and will remain in effect until the earlier of December 13, 2008, or the date on which the REIT has purchased the maximum number of units permitted under the bid. As of December 31, 2007, the REIT had acquired 13,000 units for cancellation at market prices aggregating $196.
Years ended December 31, 2007 and 2006 (In thousands of dollars, except unit and per unit amounts)
NOTES TO CONSOLIDATED FINANCIAL STATEMENTS

62 | ARTIS REIT
NOTES TO CONSOLIDATED FINANCIAL STATEMENTS
Years ended December 31, 2007 and 2006 (In thousands of dollars, except unit and per unit amounts)
16. CHANGES IN NON-CASH OPERATING ITEMS:
Year Ended December 31,
2007 2006
Deferred recoverable operating costs $ (2,029) $ (557 )
Amortization of deferred recoverable operating costs 149 –
Prepaid expenses (514 ) (541 )
Rent and other receivables (2,235) (447 )
Cash held in trust (355 ) 706
Security deposits and prepaid rent 2,639 438
Accounts payable and other liabilities 4,492 2,423
$ 2,147 $ 2,022
17. RELATED PARTY TRANSACTIONS:
The REIT incurred legal fees with a law fi rm associated with a trustee of the REIT in connection with the prospectus offerings, the property acquisitions and general business matters. The amount payable at December 31, 2007 is $nil (December 31, 2006, $12).
The REIT incurred advisory fees and acquisition fees under the asset management agreement with Marwest Management Canada Ltd. (“Marwest”), a company owned and controlled by certain trustees and offi cers of the REIT. The amount payable at December 31, 2007 is $nil (December 31, 2006, $116). Under the asset management agreement, Marwest is entitled to an annual advisory fee equal to 0.25% of the adjusted cost base of the REIT’s assets and an acquisition fee equal to 0.5% of the cost of each property acquired.
The REIT incurred property management fees, leasing commission fees, and tenant improvement fees under the property management agreement with Marwest. The amount payable at December 31, 2007 is $nil (December 31, 2006, $78). Marwest acts as the general property manager for the REIT’s properties and is entitled to management fees, leasing renewal commissions and tenant improvement fees at commercially reasonable rates.
The REIT incurred costs for building improvements and tenant inducements paid to Marwest Construction Ltd., a company related to certain trustees and offi cers of the REIT. The amount payable at December 31, 2007 is $nil (December 31, 2006, $115).
Year Ended December 31,
2007 2006
Legal fees expensed $ 101 $ 154
Capitalized legal fees 1,775 687
Advisory fees 1,693 939
Capitalized acquisition fees 3,047 1,009
Property management fees 3,052 1,830
Capitalized leasing commissions 2,224 490
Capitalized building improvements 760 410
Capitalized tenant inducements 642 –
Consulting fees _ 34
Interest expense _ 73

2007 ANNUAL REPORT | 63
18. FUTURE INCOME TAXES:
The REIT currently qualifi es as a mutual fund trust for Canadian income tax purposes. Prior to new legislation relating to the federal income taxation of publicly listed or traded trusts, as discussed below, income earned by the REIT and distributed annually to unitholders was not, and would not be, subject to taxation in the REIT, but was taxed at the individual unitholder level. For fi nancial statement reporting purposes, the tax deductibility of the REIT’s distributions was treated as an exception from taxation as the REIT distributed, and was committed to continue distributing, all of its taxable income to its unitholders. Accordingly, the REIT did not previously record a provision for income taxes or future income tax assets or liabilities.
On June 22, 2007, new legislation relating to, among other things, the federal income taxation of a specifi ed investment fl ow-through trust or partnership (a “SIFT”) was enacted (the “New SIFT Rules”). A SIFT includes a publicly-listed or traded partnership or trust, such as an income trust.
Under the New SIFT Rules, following a transition period for qualifying SIFTs, certain distributions from a SIFT will no longer be deductible in computing a SIFT’s taxable income, and a SIFT will be subject to tax on such distributions at a rate that is substantially equivalent to the general tax rate applicable to a Canadian corporation. However, distributions paid by a SIFT as returns of capital should generally not be subject to the tax.
The New SIFT Rules do not apply to a “real estate investment trust” that meets prescribed conditions relating to the nature of its assets and revenue (the “REIT Conditions”). The REIT is currently reviewing the New SIFT Rules and is assessing their interpretation and application to the REIT’s assets and revenues. There are uncertainties in the interpretation and application of the New SIFT Rules and it is not possible, at the current time, to determine with certainty whether the REIT will meet the REIT Conditions.
The New SIFT Rules provide that a SIFT which was publicly traded before November 1, 2006 will become subject to the tax on distributions commencing with the 2011 taxation year. However, a SIFT may become subject to this tax prior to 2011 if its equity capital increases beyond certain limits measured against the market capitalization of the SIFT at the close of trading on October 31, 2006 (the “Safe Harbour Limits”). In the case of the REIT, its subsequent offerings have exceeded the Safe Harbour Limits. Therefore, commencing on January 1, 2007, subject to the REIT’s ability to meet the REIT Conditions, the REIT is subject to tax on certain income which may adversely impact the level of cash otherwise available for distribution.
If the REIT does not meet the REIT Conditions, the REIT may restructure its affairs in order to minimize, or if possible eliminate, the impact of the New SIFT Rules, if such restructuring is in the best interests of unitholders. There can be no assurances, however, that the REIT would be able to restructure such that the REIT would not be subject to the tax imposed by the New SIFT Rules, or that any such restructuring, if implemented, would not result in material costs or other adverse consequences to the REIT and its unitholders.
Under the New SIFT Rules, a fl ow-through subsidiary of the REIT may also be a SIFT. On December 20, 2007, the Minister of Finance announced, in a backgrounder (the “Backgrounder”), his intention to introduce technical amendments to the SIFT defi nition to exclude certain fl ow-through subsidiaries of a SIFT that are able to meet certain ownership conditions. Based on the wording in the Backgrounder, it would appear that a fl ow-through subsidiary of the REIT would be a SIFT, however, until the legislation contemplated by the Backgrounder is enacted, there will continue to be uncertainty.
As management is unable to conclude at the present time if the REIT meets the REIT Conditions, and therefore cannot conclude that the New SIFT Rules do not apply to it, the REIT commenced recognizing future income tax assets and liabilities with respect to the temporary differences between the carrying amounts and tax basis of its assets and liabilities, including those of its subsidiary partnerships, that are expected to reverse after 2007. Future income tax assets or liabilties are recorded using tax rates and laws expected to apply when the temporary differences are expected to reverse. The New SIFT Rules resulted in the REIT including a future income tax asset of $11,509 in the consolidated balance sheet at December 31, 2007 and a future income tax recovery of $10,394 refl ected in consolidated income (loss) for the year ended December 31, 2007. The REIT also credited capital contributions in the amount of $1,115 to adjust for the tax effects of unit issue costs incurred on the issuance of units, and deferred fi nance costs transferred to capital contributions on the conversion of convertible debentures.
The October 30, 2007, Canadian Federal Economic Statement announced several general corporate income tax rate reductions. Legislation for such rate reductions, which apply to the computation of SIFT tax, received Royal Assent on December 14, 2007. Consequently, in accounting for the REIT’s future income taxes, the impact of these tax rate reductions have been applied in the periods that such temporary differences are expected to reverse.
Future income tax assets (liabilities):
Income-producing properties, other assets and intangible liabilities $ 8,395
Unit issue costs 4,282
Other (1,168)
Net future income tax asset $ 11,509
Years ended December 31, 2007 and 2006 (In thousands of dollars, except unit and per unit amounts)
NOTES TO CONSOLIDATED FINANCIAL STATEMENTS
The tax effects of temporary differences that give rise to signifi cant portions of the future tax asset are as follows as at December 31, 2007:

64 | ARTIS REIT
Years ended December 31, 2006 and 2005 (In thousands of dollars, except unit and per unit amounts)
NOTES TO CONSOLIDATED FINANCIAL STATEMENTS
Years ended December 31, 2007 and 2006 (In thousands of dollars, except unit and per unit amounts)
A reconciliation of expected income taxes based upon the 2007 statutory rates to the recorded income tax recovery is as follows:
2007 2006
Income taxes computed at the Canadian statutory rate of 35.12% applicable to the REIT for 2007 $ 1,453 $ –
Future income taxes arising from a change in tax status with the enactment of the SIFT rules 11,080 –
Non-deductible unit based compensation expense (365 ) –
Accretion in liability component of convertible debenture (497 ) –
Other permanent differences 15 –
Reduction of future income taxes arising from changes in tax rates (1,292) –
$ 10,394 $ –
Year Ended December 31,
2007 2006
Assets $ 72,871 $ 2,632
Liabilities 73,232 2,632
Revenue 5,511 –
Expenses 5,872 –
Operating loss from properties (361 ) –
Cash fl ows provided by operating activities 1,107 –
Cash fl ows used in investing activities (22,247) (20 )
Cash fl ows provided by fi nancing activities 21,897 –
19. CO-OWNERSHIP ACTIVITIES:
These consolidated fi nancial statements include the REIT’s proportionate share of assets, liabilities, revenue, expenses and cash fl ows of the co-ownerships in which it participates. The REIT’s proportionate share of these co-ownerships range between 38% and 85%, summarized as follows:

2007 ANNUAL REPORT | 65
Years ended December 31, 2007 and 2006 (In thousands of dollars, except unit and per unit amounts)
NOTES TO CONSOLIDATED FINANCIAL STATEMENTS
20. SEGMENTED INFORMATION:
The REIT owns and operates various retail, offi ce and industrial properties located in Western Canada. Information related to these property types is presented below. REIT expenses as well as interest and amortization of deferred fi nancing costs relating to the convertible debentures have not been allocated to the segments.
Year Ended December 31, 2007
Retail Offi ce Industrial REIT Total
Revenue $ 33,067 $ 57,000 $ 7,118 $ 2,074 $ 99,259
Property operating expenses 9,669 20,383 1,738 – 31,790
23,398 36,617 5,380 2,074 67,469
Interest 8,702 12,595 1,883 5,014 28,194
Corporate expenses – – – 4,798 4,798
Amortization 13,759 22,704 3,943 819 41,225
22,461 35,299 5,826 10,631 74,217
937 1,318 (446) (8,557) (6,748)
Gain on disposal of income-producing property 2,511 – – – 2,511
Future income tax recovery – – – 10,394 10,394
Income (loss) for the year $ 3,448 $ 1,318 $ (446) $ 1,837 $ 6,157
Total assets $ 381,908 $ 637,582 $ 114,923 $ 42,035 $ 1,176,448
Year Ended December 31, 2006
Retail Offi ce Industrial REIT Total
Revenue $ 25,356 $ 26,353 $ 889 $ 924 $ 53,522
Property operating expenses 7,082 11,940 249 – 19,271
18,274 14,413 640 924 34,251
Interest 6,920 5,551 275 4,257 17,003
Corporate expenses – – – 3,081 3,081
Amortization 11,672 13,402 518 556 26,148
18,592 18,953 793 7,894 46,232
(318 ) (4,540 ) (153 ) (6,970 ) (11,981 )
Gain on disposal of income-producing properties 828 – – – 828
Income (loss) for the year $ 510 $ (4,540 ) $ (153 ) $ (6,970 ) $ (11,153 )
Total assets $ 246,932 $ 204,085 $ 20,712 $ 21,211 $ 492,940

66 | ARTIS REIT
21. CONTINGENT CONSIDERATION:
In accordance with the purchase and sale agreement for Heritage Square, the vendor is entitled to a purchase price adjustment related to future events. The purchase and sale agreement provides for contingent consideration based on certain leases expiring prior to June 30, 2011 and being re-leased at a higher rental rate, net of leasing costs. The calculation provides for the difference in rate to be capitalized at 7.5% and 30% of that amount paid to the vendor. The amount and timing of the contingent consideration are not determinable at this time, and when determinable, will be recorded as an intangible asset.
22. COMMITMENTS AND GUARANTEES:
(a) Letters of credit
As of December 31, 2007, the REIT had issued letters of credit in the amount of $1,700 (2006, $nil).
(b) Guarantee
The REIT has guaranteed certain debt assumed by a purchaser in connection with the disposition of Royal Square. This guarantee will remain until the debt is modifi ed, refi nanced or extinguished. Credit risk arises in the event that the purchaser defaults on repayment of their debt since it is guaranteed by the REIT. This credit risk is mitigated as the REIT has recourse under this guarantee in the event of default by the purchaser, in which case the REIT would have a claim against the underlying property. The estimated amount of debt subject to the guarantee at December 31, 2007, is $1,709 (2006, $nil), with an estimated weighted average remaining term of 2.8 years (2006, nil). No liability in excess of the fair value of the guarantee has been recognized in these consolidated fi nancial statements as the estimated fair value of the borrower’s interest in the underlying property is greater than the mortgage payable for which the REIT provided the guarantee.
23. RISK MANAGEMENT AND FAIR VALUES:
(a) Risk management:
In the normal course of business, the REIT is exposed to a number of risks that can affect its operating performance. These risks, and the actions taken to manage them, are as follows:
(i) Interest rate risk:
The REIT is exposed to interest rate risk on its borrowings. It minimizes this risk by restricting total debt to 70% of gross book value and by attaining long-term fi xed rate debt to replace short-term fl oating rate borrowings. In addition, management considers the weighted average term to maturity of long-term debt relative to the remaining average lease terms.
(ii) Credit risk:
The REIT is exposed to credit risk as an owner of real estate in that tenants may become unable to pay the contracted rents. Management mitigates this risk by carrying out appropriate credit checks and related due diligence on the signifi cant tenants. Management has diversifi ed the REIT’s holdings so that it owns several categories of properties (retail, offi ce and industrial) and acquires properties throughout Western Canada.
(b) Fair values:
The fair value of the REIT’s rent and other receivables, and accounts payable and other liabilities, approximate their carrying amounts due to the relatively short periods to maturity of these fi nancial instruments.
The fair value of the notes receivable has been determined by discounting the cash fl ows of these fi nancial assets using year end market rates for assets of similar terms and credit risks. Based on these assumptions, the fair value of notes receivable at December 31, 2007 has been estimated at $30,530 compared with the carrying value of $30,494.
The fair value of the mortgages and loans payable has been determined by discounting the cash fl ows of these fi nancial obligations using year end market rates for debt of similar terms and credit risks. Based on these assumptions, the fair value of mortgages and loans payable at December 31, 2007 has been estimated at $607,981 (2006, $275,679) compared with the carrying value of $612,996 (2006, $272,341).
The fair value of the REIT’s convertible debentures is $66,072 (2006, $53,169) compared to its face value of $63,952 (2006, $51,047) at December 31, 2007. Fair value is based on the market price of the debentures, or if no market price exists, fair value is determined by discounting the cash fl ows of these fi nancial obligations using year end market rates for debt of similar terms and credit risks.
Years ended December 31, 2006 and 2005 (In thousands of dollars, except unit and per unit amounts)
NOTES TO CONSOLIDATED FINANCIAL STATEMENTS
Years ended December 31, 2007 and 2006 (In thousands of dollars, except unit and per unit amounts)

2007 ANNUAL REPORT | 67
24. FUTURE CHANGES IN ACCOUNTING POLICIES:
The CICA has issued three new accounting standards that are effective for the REIT’s 2008 year end.
(a) Capital Disclosures:
Section 1535, “Capital Disclosures” establishes standards for the disclosure of (i) an entity’s objectives, policies and processes for managing capital; (ii) quantitative data about what the entity regards as capital; (iii) whether the entity has complied with any capital requirements; and (iv) if it has not complied, the consequences of such non-compliance.
(b) Financial Instruments - Disclosures and Presentation:
Sections 3862, “Financial Instruments - Disclosures” and 3863 “Financial Instruments - Presentation” replace the existing Section 3861 “Financial Instruments - Disclosure and Presentation”. These new sections revise and enhance disclosure requirements, and carry forward, unchanged, existing presentation requirements. These new sections require disclosures about the nature and extent of risks arising from fi nancial instruments and how the entity manages those risks.
In addition, the CICA issued a new accounting standard in February, 2008. Section 3064, “Goodwill and Intangible Assets” replaces the existing Sections 3062 “Goodwill and Other Intangible Assets” and 3450 “Research and Development Costs”. This new section establishes standards for the recognition, measurement and disclosure of goodwill and intangible assets. This standard is effective for the REIT’s 2009 fi scal year.
The REIT is in the process of assessing the full impact of these new standards to the consolidated fi nancial statements.
25. SUBSEQUENT EVENTS:
On January 15, 2008, the REIT acquired King Edward Centre, located in Coquitlam, British Columbia. The property was acquired for $16,615 and the purchase price was satisfi ed with a combination of cash and new mortgage fi nancing in the amount of $10,000 bearing interest at a rate of 5.27% per annum.
On February 1, 2008, the REIT acquired the Leon’s Building, located in Nanaimo, British Columbia. The property was acquired for $8,550 and the purchase price was satisfi ed with a combination of cash and new mortgage fi nancing in the amount of $5,100 bearing interest at a rate of 5.42% per annum.
The REIT has entered into agreements with respect to the acquisitions of various properties located in Alberta and Saskatchewan. The total purchase price of the properties is $20,500. The REIT anticipates that the acquisitions will close in March and April, 2008, and will be fi nanced through a combination of existing mortgage fi nancing, the issuance of 140,845 REIT units at a value of $17.75 per unit, and cash consideration.
The REIT has drawn an aggregate of $10,200 of the available credit facility for bridge fi nancing on the acquisition of King Edward Centre and the Leon’s Building.
Years ended December 31, 2007 and 2006 (In thousands of dollars, except unit and per unit amounts)
NOTES TO CONSOLIDATED FINANCIAL STATEMENTS

68 | ARTIS REIT
Armin Martens, P.Eng., M.B.A., President and Chief Executive Offi cer and Trustee
A long time resident of Manitoba, Mr. Martens graduated from the University of Manitoba with a Bachelor of Science degree in Civil Engineering in 1977. Thereafter, he began to work in the construction and real estate development fi eld and became a member of the Association of Professional Engineers & Geologists of Manitoba (APEGM) in 1979. Mr. Martens continued his career in the fi eld of commercial real estate development which encompassed taking a leave in 1983-1984 to complete his Master of Business Administration (M.B.A.) degree at the International Institute for Management Development (IMD) in Lausanne, Switzerland. Mr. Martens currently serves as a director on the board of Fortress Paper Ltd, trading under the symbol FTP on the TSX. With operating plants in Germany and Switzerland, Fortress Paper Ltd., is a major producer of wallpaper and other paper products in the pan European and Asian Markets. Mr. Martens is a director of All in West! Capital Corporation, a TSX Venture Exchange-listed issuer. Mr. Martens has also had the privilege of serving as a director of the Bank of Canada, Canada’s central bank. In addition to Mr. Martens’ position as Chief Executive Offi cer of Artis REIT, he is President and CEO of Marwest Development Corporation, based in Winnipeg, Manitoba, a position he has held since 1994. The Marwest Group of Companies is engaged in the development, construction and management of income-producing properties, including offi ce buildings, shopping centres, residential and mixed-use properties both in Canada and the United States.
Cornelius Martens, P.Eng, Executive Vice-President and Trustee
A long time resident of Manitoba, Mr. Martens graduated from the University of Manitoba with a Bachelor of Science degree in Civil Engineering in 1965. He became a member of the Association of Professional Engineers & Geologists of Manitoba (APEGM) in 1967. Mr. Martens began his career in the fi eld of commercial real estate development, construction and property management in 1968, when he, together with his father, incorporated what today is known as The Marwest Group of Companies. The Marwest Group of Companies is engaged in the development, construction and management of income-producing properties, including offi ce buildings, shopping centres, residential and mixed-use properties both in Canada and the United States. In his capacity as President of the Marwest Group of Companies during the last 35 years, Mr. Martens has acquired extensive and valuable business experience, particularly in the fi eld of real estate. From 1996 to 2001, Mr. Martens was a director of Consolidated Properties Ltd., a publicly traded company previously listed on the Toronto Stock Exchange. Mr. Martens is currently President and Chief Executive Offi cer of numerous companies including Marwest Construction Ltd. and Marwest Management Canada Ltd., all based in Winnipeg, Manitoba. Mr. Martens is also the President and Chief Executive Offi cer and a director of All in West! Capital Corporation, a TSX Venture Exchange-listed issuer.
Delmore Crewson, FCA,Trustee and Chair
Mr. Crewson is a former senior partner and Vice-Chair of Deloitte and Touche LLP. He is a member of the Institute of Chartered Accountants of Manitoba and has been elected as a “Fellow” of the Institute. Mr. Crewson serves on the board of directors and as Chair of the Audit Committee of The Wawanesa Mutual Insurance Company. He is also a trustee and Chair of the Audit Committee of Pollard Banknote Income Fund. Mr. Crewson is a member of the Institute of Corporate Directors. He is the past President of the Institute of Chartered Accountants of Manitoba and is a former Canadian Institute of Chartered Accountants Board and Executive Committee member. Mr. Crewson has also served on numerous community boards and has held leadership positions in a number of organizations including Manitoba Museum of Man and Nature (Board, Chair of Finance and Vice-Chair of the Board), and Associates of the Faculty of Management, University of Manitoba (Board and Chair). He also served as a Director on the Board of Management and chaired the Audit Committee of Canada Customs and Revenue Agency.
TRUSTEES

2007 ANNUAL REPORT | 69
Allan McLeod,Trustee
Mr. McLeod is the President and Chief Executive Offi cer of Tribal Councils Investment Group of Manitoba Ltd. and its group of wholly-owned subsidiaries, including Artic Beverages Limited, First Canadian Health Management Corporation, First Canadian Fuels Ltd., First Canadian Water & Infrastructure Inc. and First Nations Financial Services Inc. Mr. McLeod is also this position for the Radisson Hotel Winnipeg. He is also a director of Perimeter Aviation Ltd., a wholly-owned subsidiary of Exchange Industrial Income Fund, a TSX listed issuer, and is a director of EIIF Management GP, which is responsible for the management of Exchange Industrial Income Fund. In 2003, Mr. McLeod was honoured with the Top 40 under 40 award for Canada.
Victor Thielmann, P.Eng.,Trustee
A long time resident of Manitoba, Mr. Thielmann graduated from the University of Manitoba with a Bachelor of Science degree in 1977. He began work in the electrical construction and professional consulting industry and became a member of the Association of Professional Engineers of Manitoba (APEM) in 1979. Mr. Thielmann was founding President of Tri-Star Electrical Contractors Ltd. of Manitoba. During his tenure from 1979 to 1982, he completed his Electrical Journeyman Certifi cation as well as Professional Engineering (P.Eng.) requirements. In 1982, Mr. Thielmann founded Nova 3 Engineering Ltd. of Manitoba and continued his career as a professional consultant in the fi eld of electrical engineering. Over the years, under his direction, Nova 3 Engineering Ltd. expanded its scope of services to include Mechanical and Fire Protection Engineering, as well as Electrical Engineering. Mr. Thielmann is currently a member of numerous professional organizations, including Association of Professional Engineers of British Columbia (APEBC), Association of Professional Engineers, Geologists & Geophysicists of Alberta (APEGGA), Association of Professional Engineers of Saskatchewan (APES), Association of Professional Engineers of Manitoba (APEM), Association of Professional Engineers of Ontario (APEO), Association of Professional Engineers of Yukon Territory (APEYT), Association of Professional Engineers, Geologists & Geophysicists of North West Territories, Institute of Electrical and Professional Engineers and Geoscientists of Newfoundland and Labrador (PEG) Institute of Electrical and Electronic Engineers (IEEE), National Fire Protection Association (NFPA) and Society of Fire Protection Engineers of America (SFPE). During his 28 working years, Mr Thielmann has acquired extensive professional and business experience related to design, construction and real estate. Mr. Thielmann also served on the board directors of the Forks North Portage Partnership, a crown corporation owned by the three levels of Government. Mr. Thielman is a director of All in West! Capital Corporation, a TSX Venture Exchange-listed issuer. He is currently President and Chief Executive Offi cer of Nova 3 Engineering Ltd.
Wayne Townsend, CFP,Trustee
Mr. Townsend is a Partner at Lawton Partner Financial Planning Services Limited and has over 31 of experience in the fi nancial planning industry. Mr. Townsend holds a Bachelor of Arts from the University of Manitoba, the Certifi ed Financial Planner (CFP) designation, the Chartered Life Underwriter (C.L.U.) designation, the Chartered Financial Consultants (Ch.F.C.) designation, Society of Trust and Estate Practitioners (TEP) and is a graduate of the Canadian Securities Course. Past board activities include Vice-Chair of St. John’s-Ravenscourt School, a Past Chairman at Misericordia General Hospital Foundation and Past Vice-Chair at Misericordia General Hospital. Mr. Townsend currently serves as a director/trustee of Cardinal Capital Management, Value Partners Investments and All in West! Capital Corporation, a TSX Venture Exchange-listed issuer.
Edward Warkentin, B.A., LL.B.,Trustee and Chairman
Mr. Warkentin of Winnipeg, Manitoba, holds an undergraduate degree from the University of Winnipeg, a law degree from the University of Manitoba and has been a member of the Bars of Ontario and Manitoba for more than 25 years. Mr. Warkentin is the Managing Partner of Aikins, MacAulay & Thorvaldson LLP and practices in the area of corporate and commercial law. He is a former director and Chair of Youth for Christ (Winnipeg) Inc., former director of Manitoba Mineral Resources Ltd. and former Director of Grace Hospital Board of Management. He is currently a director or offi cer of several private corporations, private foundations and public partnership. Mr. Warkentin is currently the Secretary of Exchange Industrial Income Fund, a TSX listed issuer and a director of All in West! Capital Corporation, a TSX Venture Exchange-listed issuer.
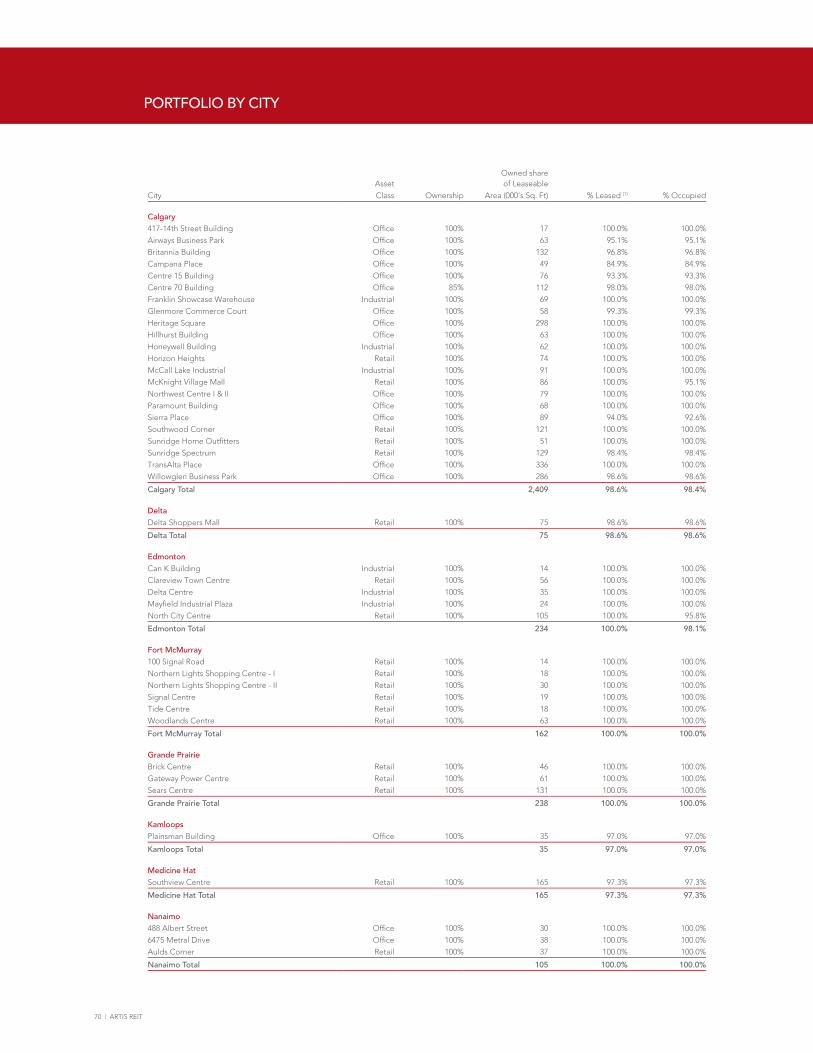
70 | ARTIS REIT
Asset Owned share of Leaseable
City Class Ownership Area (000’s Sq. Ft) % Leased (1) % Occupied
Calgary417-14th Street Building Offi ce 100% 17 100.0% 100.0%
Airways Business Park Offi ce 100% 63 95.1% 95.1%
Britannia Building Offi ce 100% 132 96.8% 96.8%
Campana Place Offi ce 100% 49 84.9% 84.9%
Centre 15 Building Offi ce 100% 76 93.3% 93.3%
Centre 70 Building Offi ce 85% 112 98.0% 98.0%
Franklin Showcase Warehouse Industrial 100% 69 100.0% 100.0%
Glenmore Commerce Court Offi ce 100% 58 99.3% 99.3%
Heritage Square Offi ce 100% 298 100.0% 100.0%
Hillhurst Building Offi ce 100% 63 100.0% 100.0%
Honeywell Building Industrial 100% 62 100.0% 100.0%
Horizon Heights Retail 100% 74 100.0% 100.0%
McCall Lake Industrial Industrial 100% 91 100.0% 100.0%
McKnight Village Mall Retail 100% 86 100.0% 95.1%
Northwest Centre I & II Offi ce 100% 79 100.0% 100.0%
Paramount Building Offi ce 100% 68 100.0% 100.0%
Sierra Place Offi ce 100% 89 94.0% 92.6%
Southwood Corner Retail 100% 121 100.0% 100.0%
Sunridge Home Outfi tters Retail 100% 51 100.0% 100.0%
Sunridge Spectrum Retail 100% 129 98.4% 98.4%
TransAlta Place Offi ce 100% 336 100.0% 100.0%
Willowglen Business Park Offi ce 100% 286 98.6% 98.6%
Calgary Total 2,409 98.6% 98.4%
DeltaDelta Shoppers Mall Retail 100% 75 98.6% 98.6%
Delta Total 75 98.6% 98.6%
EdmontonCan K Building Industrial 100% 14 100.0% 100.0%
Clareview Town Centre Retail 100% 56 100.0% 100.0%
Delta Centre Industrial 100% 35 100.0% 100.0%
Mayfi eld Industrial Plaza Industrial 100% 24 100.0% 100.0%
North City Centre Retail 100% 105 100.0% 95.8%
Edmonton Total 234 100.0% 98.1%
Fort McMurray100 Signal Road Retail 100% 14 100.0% 100.0%
Northern Lights Shopping Centre - I Retail 100% 18 100.0% 100.0%
Northern Lights Shopping Centre - II Retail 100% 30 100.0% 100.0%
Signal Centre Retail 100% 19 100.0% 100.0%
Tide Centre Retail 100% 18 100.0% 100.0%
Woodlands Centre Retail 100% 63 100.0% 100.0%
Fort McMurray Total 162 100.0% 100.0%
Grande PrairieBrick Centre Retail 100% 46 100.0% 100.0%
Gateway Power Centre Retail 100% 61 100.0% 100.0%
Sears Centre Retail 100% 131 100.0% 100.0%
Grande Prairie Total 238 100.0% 100.0%
KamloopsPlainsman Building Offi ce 100% 35 97.0% 97.0%
Kamloops Total 35 97.0% 97.0%
Medicine HatSouthview Centre Retail 100% 165 97.3% 97.3%
Medicine Hat Total 165 97.3% 97.3%
Nanaimo488 Albert Street Offi ce 100% 30 100.0% 100.0%
6475 Metral Drive Offi ce 100% 38 100.0% 100.0%
Aulds Corner Retail 100% 37 100.0% 100.0%
Nanaimo Total 105 100.0% 100.0%
PORTFOLIO BY CITY

2007 ANNUAL REPORT | 71
Asset Owned share of Leaseable
City Class Ownership Area (000’s Sq. Ft) % Leased (1) % Occupied
NiskuPepco Building Industrial 100% 23 100.0% 100.0%
Nisku Total 23 100.0% 100.0%
Red DeerBower Centre Industrial 100% 126 98.5% 98.5%
Millennium Centre Offi ce 100% 105 100.0% 100.0%
Red Deer Total 231 99.2% 99.2%
ReginaAlbert Street Mall Retail 100% 18 100.0% 100.0%
Capital City Centre Retail 100% 44 100.0% 100.0%
East Landing Mall Retail 100% 41 100.0% 100.0%
East Landing Plaza Retail 100% 24 86.1% 86.1%
Fleet Street Crossing Retail 100% 38 89.2% 89.2%
Shoppers Landmark Centre Retail 100% 49 100.0% 100.0%
Strathcona Shoppers Centre Retail 100% 22 100.0% 100.0%
West Landing Mall Retail 100% 39 93.5% 93.5%
Regina Total 275 96.4% 96.4%
SaskatoonCanarama Mall Retail 100% 65 100.0% 97.1%
Circle 8 Centre Retail 100% 77 98.0% 95.9%
Saskatoon Total 142 98.9% 96.4%
St. AlbertLiberton Square Retail 100% 21 100.0% 100.0%
St. Albert Total 21 100.0% 100.0%
Winnipeg100 Omands Creek Boulevard Industrial 100% 50 100.0% 100.0%
1000-1020 Powell Avenue & 1499-1501 King Edward Street Industrial 100% 27 100.0% 100.0%
1093 Sherwin Road Industrial 100% 175 100.0% 100.0%
1475 King Edward Street Industrial 100% 5 100.0% 100.0%
1595 Buffalo Place Industrial 100% 76 100.0% 100.0%
1681-1703 Dublin Avenue Industrial 100% 22 100.0% 100.0%
1717 Dublin Avenue Industrial 100% 30 100.0% 100.0%
1750 Inkster Boulevard Industrial 100% 196 100.0% 100.0%
1810 Dublin Avenue Industrial 100% 22 100.0% 100.0%
1832 King Edward Street Industrial 100% 74 100.0% 100.0%
2110-2130 Notre Dame Avenue Industrial 100% 82 76.0% 76.0%
27-81 Plymouth Street Industrial 100% 91 100.0% 100.0%
500 Berry Street Industrial 100% 8 100.0% 100.0%
530-538 Berry Street Industrial 100% 11 100.0% 100.0%
850 Empress Street Industrial 100% 26 100.0% 100.0%
951-977 Powell Avenue Industrial 100% 54 100.0% 100.0%
CDI College Building Offi ce 100% 24 100.0% 100.0%
Grain Exchange Building Offi ce 100% 263 77.5% 77.5%
Hamilton Building Offi ce 100% 66 100.0% 100.0%
Johnston Terminal Offi ce 100% 72 99.1% 99.1%
Keewatin Distribution Centre Industrial 100% 201 100.0% 100.0%
MTS Call Centre Building Offi ce 100% 76 100.0% 100.0%
Reenders Square Retail 100% 66 100.0% 100.0%
Winnipeg Square Offi ce 38% 205 94.1% 94.1%
Shops of Winnipeg Square Retail 38% 22 93.8% 93.8%
Winnipeg Total 1,944 95.2% 95.2%
6,059 97.6% 97.4%(1) Percentage leased is based on executed leases at December 31, 2007.
Asset Owned share of Leaseable
City Class Ownership Area (000’s Sq. Ft) % Leased (1) % Occupied
Calgary417-14th Street Building Offi ce 100% 17 100.0% 100.0%
Airways Business Park Offi ce 100% 63 95.1% 95.1%
Britannia Building Offi ce 100% 132 96.8% 96.8%
Campana Place Offi ce 100% 49 84.9% 84.9%
Centre 15 Building Offi ce 100% 76 93.3% 93.3%
Centre 70 Building Offi ce 85% 112 98.0% 98.0%
Franklin Showcase Warehouse Industrial 100% 69 100.0% 100.0%
Glenmore Commerce Court Offi ce 100% 58 99.3% 99.3%
Heritage Square Offi ce 100% 298 100.0% 100.0%
Hillhurst Building Offi ce 100% 63 100.0% 100.0%
Honeywell Building Industrial 100% 62 100.0% 100.0%
Horizon Heights Retail 100% 74 100.0% 100.0%
McCall Lake Industrial Industrial 100% 91 100.0% 100.0%
McKnight Village Mall Retail 100% 86 100.0% 95.1%
Northwest Centre I & II Offi ce 100% 79 100.0% 100.0%
Paramount Building Offi ce 100% 68 100.0% 100.0%
Sierra Place Offi ce 100% 89 94.0% 92.6%
Southwood Corner Retail 100% 121 100.0% 100.0%
Sunridge Home Outfi tters Retail 100% 51 100.0% 100.0%
Sunridge Spectrum Retail 100% 129 98.4% 98.4%
TransAlta Place Offi ce 100% 336 100.0% 100.0%
Willowglen Business Park Offi ce 100% 286 98.6% 98.6%
Calgary Total 2,409 98.6% 98.4%
DeltaDelta Shoppers Mall Retail 100% 75 98.6% 98.6%
Delta Total 75 98.6% 98.6%
EdmontonCan K Building Industrial 100% 14 100.0% 100.0%
Clareview Town Centre Retail 100% 56 100.0% 100.0%
Delta Centre Industrial 100% 35 100.0% 100.0%
Mayfi eld Industrial Plaza Industrial 100% 24 100.0% 100.0%
North City Centre Retail 100% 105 100.0% 95.8%
Edmonton Total 234 100.0% 98.1%
Fort McMurray100 Signal Road Retail 100% 14 100.0% 100.0%
Northern Lights Shopping Centre - I Retail 100% 18 100.0% 100.0%
Northern Lights Shopping Centre - II Retail 100% 30 100.0% 100.0%
Signal Centre Retail 100% 19 100.0% 100.0%
Tide Centre Retail 100% 18 100.0% 100.0%
Woodlands Centre Retail 100% 63 100.0% 100.0%
Fort McMurray Total 162 100.0% 100.0%
Grande PrairieBrick Centre Retail 100% 46 100.0% 100.0%
Gateway Power Centre Retail 100% 61 100.0% 100.0%
Sears Centre Retail 100% 131 100.0% 100.0%
Grande Prairie Total 238 100.0% 100.0%
KamloopsPlainsman Building Offi ce 100% 35 97.0% 97.0%
Kamloops Total 35 97.0% 97.0%
Medicine HatSouthview Centre Retail 100% 165 97.3% 97.3%
Medicine Hat Total 165 97.3% 97.3%
Nanaimo488 Albert Street Offi ce 100% 30 100.0% 100.0%
6475 Metral Drive Offi ce 100% 38 100.0% 100.0%
Aulds Corner Retail 100% 37 100.0% 100.0%
Nanaimo Total 105 100.0% 100.0%
PORTFOLIO BY CITY

72 | ARTIS REIT
CORPORATE INFORMATION
MANAGEMENT
Armin Martens, P.Eng., M.B.A. President and Chief Executive Offi cer
Cornelius Martens, P.Eng. Executive Vice-President
Jim Green, CAChief Financial Offi cer
Kirsty Stevens, CMASenior Vice-President
Douglas McGregorVice President – Leasing
Dennis Wong, CFAVice President – Portfolio Manager
Douglas Hare, CACorporate Controller
HEAD OFFICE
300 - 360 Main StreetWinnipeg, Manitoba, R3C 3Z3Phone 204-947-1250Fax 204-947-0453
TRADING SYMBOLS
Toronto Stock ExchangeAX.UN – UnitsAX.DB.A – Series A Convertible DebenturesAX.DB.B – Series B Convertible DebenturesAX.DB.C – Series C Convertible Debentures
TRANSFER AGENT
CIBC Mellon Trust CompanyPhone 416-643-5500 or 1-800-387-0825 (Toll free throughout North America)Fax [email protected]
AUDITORS
KPMG LLP
LEGAL COUNSEL
Aikins, MacAulay & Thorvaldson LLP
PRINCIPAL BANKER
Scotiabank
INVESTOR RELATIONS
Kirsty Stevens, CMASenior Vice-PresidentPhone 204-947-1250 Fax [email protected]
FISCAL 2007 MONTHLY DISTRIBUTIONS
January $ 0.0875 July $ 0.0875
February $ 0.0875 August $ 0.0875
March $ 0.0875 September $ 0.0875
April $ 0.0875 October $ 0.0875
May $ 0.0875 November $ 0.0875
June $ 0.0875 December $ 0.0875
ANNUAL GENERAL MEETING
Winnipeg Square Conference CentreMain Floor – 360 Main StreetWinnipeg, ManitobaFriday, May 16, 200811:00 am (CST)


2 0 0 7 A N N U A L R E P O R T
P R O P E R T I E S O F S U C C E S S
300 - 360 Main Street
Winnipeg, Manitoba R3C 3Z3
T 204.947.1250 F 204.947.0453
www.artisreit.com
AR
TIS RE
IT | 2007 AN
NU
AL R
EP
OR
T