Embed Size (px)
Citation preview

We supply the world.
2007 Annual ReportV
isteon 2007 Annual R
eport
www.visteon.com
Visteon Cover.indd 1 3/12/08 5:39:26 PM

Michael F. JohnstonChairman and Chief Executive Officer
Donald J. StebbinsPresident and Chief Operating Officer
William H. Gray, IIIChairmanAmani Group
Steven K. HampPrincipal Hamp Advisors, LLC
Patricia L. HigginsFormer President and CEO Switch and Data
Karl J. KrapekFormer President and COO United Technologies Corporation
Charles L. SchafferFormer COOUnited Parcel Service, Inc.
Richard J. TaggartFormer Executive Vice President and CFO Weyerhaeuser Company
James D. ThorntonFormer Senior Executive Vice PresidentMBNA America Bank, N.A.
Kenneth B. WoodrowFormer Vice ChairmanTarget Corporation
Corporate Officers(as of 3/1/08):
Michael F. JohnstonChairman and Chief Executive Officer Donald J. StebbinsPresident and Chief Operating Officer
William G. Quigley IIIExecutive Vice Presidentand Chief Financial Officer John DonofrioSenior Vice President and General Counsel
Robert C. PallashSenior Vice President Dorothy L. StephensonSenior Vice President Michael J. WidgrenVice President, Corporate Controller and Chief Accounting Officer
Directors and Officers of Visteon Corporation
Directors(as of 3/1/08):
2007 Annual Report
2010ProfitableInnovative, flexible and profitable with the momentum and focus for long-term growth
Drivers: Diverse Customer Base, Innovation, Market-Leading Technology, Cost-Competitive Footprint
Visteon Timeline – Where We’re Going, Where We’ve Been
2011Sustainable Business Model
2009Free Cash Flow PositiveRealize benefits of three-year plan – Visteon is a lean and productive business
2006Launched Restructuring PlanThree-year plan launched – focused on restructuring, improving base operations, growing the business
2008Creating Our FutureHeavy restructuring year with focus on transformation into a lean, flexible company well-positioned to thrive in a global market
2007 Exceeded CommitmentsRestructuring on track, operations and cost structure improved along with new business wins – performed better than guidance
2005Reached New Structural Agreement with FordReshaped company to leaner, smaller, more competitive organization
Visteon Cover.indd 2 3/12/08 5:39:30 PM

To Our Shareholders:Visteon is evolving quickly and globally. We are now in the final year of our three-year plan, which we launched in January 2006 to shape Visteon into a lean and productive company. This plan, vital as it is, marks just the beginning of our journey – one that will gather momentum and lead us to profitability by 2010. And while we continue to look ahead – positively – there is also much to report about where we have been. Over the past two years, we made very significant progress executing the key pillars of our three-year plan – restructuring, improving base operations and growing the business.
Our plan is working, as evidenced by our balanced product portfolio, increasingly diverse customer base, continued strong new business wins and a virtually unmatched global manufacturing and engineering footprint.
In the area of restructuring we have hit all of our marks along the way. We delivered on each of the 11 restructuring targets we set for 2006 and completed seven that were identified for 2007.
We continue to make progress on improving base operations, reducing administrative expenses and establishing a more competitive cost structure, while improving product quality to our customers by 79 percent over the last two years. Despite customer vehicle production declines and unstable market conditions, we improved our liquidity and cash position.
We did an outstanding job growing the business – winning roughly $1 billion in new business for two consecutive years. These wins – across all product lines and regions – are at healthy margins and will help improve the financial performance of the company when these products launch.
The progress Visteon is making, combined with what we will execute in 2008, puts us in position to be free cash flow* positive in 2009. With almost $1.8 billion of cash at year-end 2007 and additional liquidity available, we can look positively toward our future.
Our short- and long-term plans are working, and we remain committed to building on the established foundation of change, discipline and action as we head toward a sustainable and global future.
Donald J. StebbinsPresident and Chief Operating Officer
Michael F. Johnston Chairman and Chief Executive Officer
2007 New Business By Product Line
2007 New Business By Region
2007 Customer Distribution
Electronics22%
Interiors38%
Climate40%
Asia25%Europe
32%
SouthAmerica
6%
NorthAmerica
37%
All Other27%
Ford38%
Renault/Nissan11%
PSA 5%Hyundai/Kia15%
GM/Chrysler4%
The statements in this Annual Report relating to new business wins and future estimates, plans and projections are forward-looking statements. Please see “Item 1A Risk Factors” and “Item 7, Management’s Discussion and Analysis of Financial Condition and Results of Operations – Forward-Looking Statements” contained in Visteon’s Annual Report on Form 10-K for the fiscal year ended December 31, 2007, included elsewhere in this Annual Report, for a discussion of various risks and uncertainties that could cause actual results to differ materially from those expressed in these forward-looking statements.
*Defined as the amount of cash generated by operations, minus capital expenditures. 2007 Annual Report 1
Visteon AR 07 Final.indd 1 3/12/08 5:38:40 PM

Our Products. Our Success. Our Future.At our core is the ability to create, design and manufacture leading automotive solutions. We call it “automotive intellect” and it’s providing us with an ever-growing customer list and product solutions that are concentrated in the areas of climate, interiors and electronics.
Some of these products are quite visible, like our light pipe technology on the 2008 Cadillac CTS and the instrument clusters and door panels in the Renault Clio III. Others are found further inside vehicles, like our multi-zone climate systems.
Regardless of where they appear, we’re most proud of their ability to provide our customers with a distinctive selling advantage. That’s something understood in any language.
Visteon products help automakers worldwide deliver a
renewed emphasis on interior craftsmanship. Shown at left
is the instrument panel developed for the European-designed
Renault Clio III. Together, Renault and Visteon designers
developed a cockpit that expresses the same feel as interiors
in upper-segment vehicles.
Visteon employees at our China Technical
Center discuss driver information technology.
Visteon’s well-balanced geographical footprint
allows us to support global platforms and take
advantage of regional expertise and distribution.
This includes our 235,000-square foot technical
center in Shanghai, China, which opened in
2005. With corporate offices in Van Buren
Township, Mich. (U.S.); Shanghai; and Kerpen,
Germany; the company has facilities
in 26 countries.
Visteon’s innovative light pipe technology debuted in the
summer of 2007 on the Cadillac CTS. It is found in both the
highly stylized head lamp and tail lamp systems which feature
single, high-power LED emitters that have a distinctive tubular
appearance. This solution earned a 2008 Automotive News
PACE Honorable Mention designation.
2 2007 Annual Report
Visteon AR 07 Final.indd 2 3/12/08 5:38:41 PM

Innovative climate products continue to be a core focus. Visteon’s affiliate,
Halla Climate Control Corporation (HCC), won a 2007 Automotive News PACE
Award for its innovative cooling fan module. Unlike conventional engine-cooling
fans, HCC’s patented fan design integrates a single wave-blade fan and saw
tooth-type shroud to create a low power, lightweight and high-efficiency
cooling fan that significantly reduces overall noise. HCC’s cooling fan module
is in production on various global platforms for Hyundai and Kia, including the
Hyundai Sonata and the new Hyundai Genesis. Visteon is also a market leader
of R744 automotive thermal management solutions. Visteon’s latest generation
R744 system consumes up to 25 percent less fuel compared with conventional
R134a systems.
Values: Integrity, Safety, Customers, People, Innovation, Profitability, Citizenship
The Visteon quality story extends around the world. In 2007, two Visteon
manufacturing plants, Visteon Climate Control Beijing (VCCB) and Visteon
Automotive Systems India Chennai Plant (VASI), received Hyundai Motor
Company’s coveted Five Star Certification. The award recognized our
continuous efforts to deliver outstanding quality performance.
Quality Improvement*
79%Visteon has improved quality to auto manufacturers
by 79 percent over the past two years.
* Based on parts per million defective (PPM), a common auto industry quality standard.
Visteon and 3M have joined forces in a global advanced technology
collaboration. Together, the two Fortune 500 companies have developed
global demonstration vehicles showcasing more than 50 technologies
designed to enhance the driving experience. Ultimately, the collaboration is
expected to deliver consumer-focused automotive products that capitalize
on the expertise of each company. The Visteon and 3M demonstration
vehicle features many Visteon technologies like map-pocket “smart
lighting” with proximity sensors that activate LEDs to illuminate a map
pocket at night when a user’s hand is nearby. Shown on the right is a
sleek integrated center panel that also utilizes proximity sensing – this
time to enable a clean, “dead-front” look in situations when panel buttons
don’t need to be visible. Visteon’s InSkinTM technology is another feature
of this demonstration vehicle – it offers the ability to achieve zero-gap for
decorative components on the surface of the instrument and door-trim
panels creating a smooth looking interior at a competitive cost.
An Innovative Collaboration
2007 Annual Report 3
Visteon AR 07 Final.indd 3 3/12/08 5:38:44 PM

Corporate InformationInvestor RelationsAs a Visteon shareholder, you’re invited to take advantage of shareholder services or to request more information about Visteon.
Investor InformationYou can contact Visteon’s Investor Relations group to order financial documents such as this annual report and the Form 10-K. Call us toll-free at (877) 367-6092. We can be contacted during business hours to answer investment-oriented questions about Visteon.
In addition, you can write to us at:Investor RelationsVisteon CorporationOne Village Center DriveVan Buren Township, MI 48111 USA
Or send us an e-mail at [email protected].
Shareholder Communications with the Board of DirectorsShareholders interested in communicating directly with a committee chairperson or with the non-management directors as a group may do so as described on Visteon’s Web site at www.visteon.com/investors, or by writing to the chairperson or non-management directors in care of the Company Secretary, One Village Center Drive, Van Buren Township, MI 48111 USA.
Shareholder Account ServicesOur transfer agent and Registrar, The Bank of New York, can help registered shareholders with a variety of shareholder-related services, including:• Change of address• Lost stock certificates• Transfer of stock to another person• Dividend reinvestment or dividend direct deposit• Direct stock purchase• Additional administrative services
You can call our transfer agent at: 1-877-881-59621-201-680-6669 (Outside the U.S. and Canada)1-800-231-5469 (Hearing impaired - TTY Phone)
You can also write to our transfer agent at:Visteon Corporationc/o BNY Mellon Shareholders Services480 Washington BoulevardJersey City, New Jersey 07310-1900Or you can e-mail our transfer agent at: [email protected] Bank of New York also offers online access to shareholder accounts through the following Web site: https://www.bnymellon.com/shareowner/isd.
Shareholders can view account balances, transaction and check history, as well as retrieve transfer instructions and other frequently used forms by accessing this Web site.
Shareholders of record who receive more than one copy of this annual report can contact our transfer agent and arrange to have their accounts consolidated.
Shareholders who own Visteon stock through a brokerage firm should contact their broker for account-related requests.
Investor Information OnlineAnyone with access to the Internet can view this annual report electronically, along with a variety of other financial materials: our current and periodic reports filed with the SEC; our code of business conduct and ethics for directors, officers and employees; our corporate governance guidelines; and the charters for each of our board committees. Please visit: www.visteon.com/investors.
New York Stock ExchangeVisteon filed, as exhibits to its annual report on Form 10-K, the CEO and CFO certifications as required by Section 302 of the Sarbanes-Oxley Act. Visteon also submitted the required annual CEO certification to the NYSE.
Annual MeetingVisteon shareholders are invited to attend our annual meeting, which will be held on Wednesday, May 14, 2008, at 11:00 a.m. EDT at the Hotel du Pont, 11th and Market Streets, Wilmington, Delaware, USA.
4 2007 Annual Report
Visteon AR 07 Final.indd 4 3/12/08 5:38:45 PM

UNITED STATES SECURITIES AND EXCHANGE COMMISSIONWashington D.C. 20549
FORM 10-K(Mark One)
¥ ANNUAL REPORT PURSUANT TO SECTION 13 OR 15(d)OF THE SECURITIESEXCHANGE ACT OF 1934
For the fiscal year ended December 31, 2007, or
n TRANSITION REPORT PURSUANT TO SECTION 13 OR 15(d) OF THESECURITIES EXCHANGE ACT OF 1934For the transition period from to
Commission file number 1-15827
VISTEON CORPORATION(Exact name of Registrant as specified in its charter)
Delaware 38-3519512(State of incorporation) (I.R.S. employer
identification no.)
One Village Center Drive,Van Buren Township, Michigan
(Address of principal executive offices)
48111(Zip code)
Registrant’s telephone number, including area code: (800)-VISTEON
Securities registered pursuant to Section 12(b) of the Act:
Title of each className of each exchange on
which registered
Common Stock, par value $1.00 per share New York Stock Exchange
Indicate by check mark whether the registrant is a well-known seasoned issuer, as defined in Rule 405 of the Securities Act.Yes No ✓
Indicate by check mark if the registrant is not required to file reports pursuant to Section 13 or Section 15(d) of the Exchange Act.Yes No ✓
Indicate by check mark whether the Registrant: (1) has filed all reports required to be filed by Section 13 or 15(d) of the SecuritiesExchange Act of 1934 during the preceding 12 months (or for such shorter period that the Registrant was required to file suchreports), and (2) has been subject to such filing requirements for the past 90 days.Yes ✓ No
Indicate by check mark if disclosure of delinquent filers pursuant to Item 405 of Regulation S-K is not contained herein, and will notbe contained, to the best of Registrant’s knowledge, in definitive proxy or information statements incorporated by reference inPart III of this Form 10-K or any amendment to this Form 10-K. ✓
Indicate by check mark whether the registrant is a large accelerated filer, an accelerated filer, a non-accelerated filer, or a smallerreporting company. See the definitions of “large accelerated filer,” “accelerated filer” and “smaller reporting company” in Rule 12b-2of the Exchange Act. (Check one):Large accelerated filer ✓ Accelerated filer Non-accelerated filer Smaller reporting company
(Do not check if a smaller reporting company)
Indicate by check mark whether the registrant is a shell company (as defined in Rule 12b-2 of the Exchange Act).Yes No ✓
The aggregate market value of the registrant’s voting and non-voting common equity held by non-affiliates of the registrant onJune 29, 2007 (the last business day of the most recently completed second fiscal quarter) was approximately $1 billion.
As of February 15, 2008, the registrant had outstanding 129,650,038 shares of common stock.
Document Incorporated by Reference*Document Where Incorporated
2008 Proxy Statement Part III (Items 10, 11, 12, 13 and 14)
* As stated under various Items of this Report, only certain specified portions of such document are incorporated by reference in this Report.

INDEX
Part IItem 1. — Business . . . . . . . . . . . . . . . . . . . . . . . . . . . . . . . . . . . . . . . . . . . . . . . . . . . . . . . . . 1Item 1A. — Risk Factors . . . . . . . . . . . . . . . . . . . . . . . . . . . . . . . . . . . . . . . . . . . . . . . . . . . . . 12Item 1B. — Unresolved Staff Comments . . . . . . . . . . . . . . . . . . . . . . . . . . . . . . . . . . . . . . . . . 19Item 2. — Properties . . . . . . . . . . . . . . . . . . . . . . . . . . . . . . . . . . . . . . . . . . . . . . . . . . . . . . . . 20Item 3. — Legal Proceedings. . . . . . . . . . . . . . . . . . . . . . . . . . . . . . . . . . . . . . . . . . . . . . . . . . 21Item 4. — Submission of Matters to A Vote of Security Holders . . . . . . . . . . . . . . . . . . . . . . . . 22Item 4A. — Executive Officers of Visteon. . . . . . . . . . . . . . . . . . . . . . . . . . . . . . . . . . . . . . . . . 23
Part IIItem 5. — Market for Registrant’s Common Equity, Related Stockholder Matters and Issuer
Purchases of Equity Securities. . . . . . . . . . . . . . . . . . . . . . . . . . . . . . . . . . . . . . . . . . . . . . . 24Item 6. — Selected Financial Data. . . . . . . . . . . . . . . . . . . . . . . . . . . . . . . . . . . . . . . . . . . . . . 27Item 7. — Management’s Discussion and Analysis of Financial Condition and Results of
Operations. . . . . . . . . . . . . . . . . . . . . . . . . . . . . . . . . . . . . . . . . . . . . . . . . . . . . . . . . . . . . . 28Item 7A. — Quantitative and Qualitative Disclosures About Market Risk . . . . . . . . . . . . . . . . . 58Item 8. — Financial Statements and Supplementary Data . . . . . . . . . . . . . . . . . . . . . . . . . . . . 60Item 9. — Changes in and Disagreements with Accountants on Accounting and Financial
Disclosure . . . . . . . . . . . . . . . . . . . . . . . . . . . . . . . . . . . . . . . . . . . . . . . . . . . . . . . . . . . . . . 128Item 9A. — Controls and Procedures. . . . . . . . . . . . . . . . . . . . . . . . . . . . . . . . . . . . . . . . . . . . 128Item 9B. — Other Information . . . . . . . . . . . . . . . . . . . . . . . . . . . . . . . . . . . . . . . . . . . . . . . . . 128
Part IIIItem 10. — Directors, Executive Officers and Corporate Governance . . . . . . . . . . . . . . . . . . . . 132Item 11. — Executive Compensation . . . . . . . . . . . . . . . . . . . . . . . . . . . . . . . . . . . . . . . . . . . . 132Item 12. — Security Ownership of Certain Beneficial Owners and Management and Related
Stockholder Matters . . . . . . . . . . . . . . . . . . . . . . . . . . . . . . . . . . . . . . . . . . . . . . . . . . . . . . . 132Item 13. — Certain Relationships and Related Transactions, and Director Independence. . . . . 133Item 14. — Principal Accounting Fees and Services . . . . . . . . . . . . . . . . . . . . . . . . . . . . . . . . 133
Part IVItem 15. — Exhibits, Financial Statement Schedules . . . . . . . . . . . . . . . . . . . . . . . . . . . . . . . . 133
Report of Independent Registered Public Accounting Firm on Financial Statement Schedules . . 134Exhibit Index. . . . . . . . . . . . . . . . . . . . . . . . . . . . . . . . . . . . . . . . . . . . . . . . . . . . . . . . . . . . . . . . 141Signatures . . . . . . . . . . . . . . . . . . . . . . . . . . . . . . . . . . . . . . . . . . . . . . . . . . . . . . . . . . . . . . . . . 147

PART I
ITEM 1. BUSINESS
The Company’s Business
Visteon Corporation (“Visteon” or the “Company”) is a leading global supplier of automotive systems,modules and components to global vehicle manufacturers and the automotive aftermarket. The Companyis headquartered in Van Buren Township, Michigan, has a workforce of approximately 41,500 employeesand has a network of manufacturing sites, technical centers, sales offices and joint ventures located inevery major geographic region of the world. The Company was incorporated in Delaware in January 2000as a wholly-owned subsidiary of Ford Motor Company (“Ford” or “Ford Motor Company”). Subsequently,Ford transferred the assets and liabilities comprising its automotive components and systems business toVisteon. The Company separated from Ford on June 28, 2000 when all of the Company’s common stockwas distributed by Ford to its shareholders.
In September 2005, the Company transferred 23 of its North American facilities and certain other relatedassets and liabilities (the “Business”) to Automotive Components Holdings, LLC (“ACH”), an indirect,wholly-owned subsidiary of the Company. On October 1, 2005, the Company sold ACH to Ford for cashproceeds of approximately $300 million, as well as the forgiveness of certain other postretirementemployee benefit liabilities and other obligations relating to hourly employees associated with theBusiness and the assumption of certain other liabilities (together, the “ACH Transactions”). Thetransferred facilities included all of the Company’s plants that leased hourly workers covered by Ford’sMaster Agreement with the United Auto Workers (“UAW”). The Business accounted for approximately$6.1 billion of the Company’s total product sales for 2005, the majority being products sold to Ford.
The Company’s Industry
The Company supplies a range of integrated systems, modules and components to vehicle manufacturersfor use in the manufacture of new vehicles, as well as to the aftermarket for use as replacement andenhancement parts. Historically, large vehicle manufacturers operated internal divisions to provide a widerange of component parts for their vehicles. Vehicle manufacturers have moved toward a competitivesourcing process for automotive parts, including increased purchases from independent suppliers, as theyseek lower-priced and/or higher-technology products. Additional significant factors and trends in theautomotive industry include:
• Globalization — Fueled by significant growth of emerging economies and by an ongoing need to reducecosts, vehicle manufacturers are expanding globally through localized vehicle assembly operations. Bylocalizing assembly operations, vehicle manufacturers can achieve advantages including new marketentry, existing market expansion, low cost manufacturing capabilities, reduced exposure to currencyfluctuations, and enhanced customer responsiveness. As vehicle manufacturers expand globally andlocalize their assembly operations, they are increasingly interested in buying components and systemsfrom suppliers that can serve multiple markets, support a global vehicle platform and maintain a localpresence.
• Shift in Original Equipment Manufacturers (“OEM”) market share — Vehicle manufacturers domiciledoutside of the United States continued to gain market share at the expense of the domestic vehiclemanufacturers. Many of these foreign vehicle manufacturers have strong existing relationships withforeign-based suppliers. This has increased the competitive pressure on domestically domiciledsuppliers like Visteon. However, the Company believes that this trend creates growth opportunitiesfor domestically domiciled suppliers, such as Visteon, to leverage existing customer relationships to growwith vehicle manufacturers domiciled in the United States as they penetrate emerging markets and toleverage the Company’s innovative and competitively priced technologies to develop new relationshipswith foreign vehicle manufacturers as they establish local manufacturing and assembly facilities in NorthAmerica.
1

ITEM 1. BUSINESS — (Continued)
• Pricing and cost pressures — Because vehicle manufacturers are under increasing competitiveintensity, they must rapidly adjust to changing consumer preferences in order to differentiate theirvehicles to maintain and grow their market share. These market dynamics inhibit the ability of vehiclemanufacturers to significantly increase vehicle prices, leading vehicle manufacturers to intensify theircost-reduction efforts with their suppliers. In particular, vehicle manufacturers are increasingly searchingfor lower cost sources of components and systems to maintain and improve profitability.
Additionally, the supply of certain commodities used in the production of automotive parts, primarilymetals and petroleum-based products such as plastic resins continues to be constrained resulting inincreased costs which cannot be wholly recovered from the vehicle manufacturers. Such constraintsand/or disruptions in supply are likely to continue to pressure operating results of automotive partsuppliers, including Visteon.
• Financial condition — In light of market share and end consumer pricing trends certain vehiclemanufacturers, particularly in North America and Europe, continue to report significant financialchallenges driven by excess production capacity and high fixed cost structures. These vehiclemanufacturers continue to implement actions to further reduce capacity and streamline coststructures while investing in new technologies and global vehicle platforms. Vehicle manufacturerscontinue to look to the supply base to assume additional design, development and serviceresponsibilities for products providing capable suppliers the opportunity to further their commercialposition in the OEM supply chain.
In response, automotive suppliers are also investing in similar capacity and cost reduction actions andare investing in new technologies and further integration of the automotive supply chain. However, thedeclining sales volumes of certain domestic automakers combined with high material and labor costshas adversely impacted the financial condition of several domestic automotive suppliers resulting insignificant demands on liquidity, industry consolidation, several supplier bankruptcies, extensive privateequity investment and severe tightening of the credit markets making access to future liquidity difficultand costly. These conditions are expected to continue into the foreseeable future, resulting in continuedindustry consolidation and the possibility of additional supplier bankruptcies. Accordingly, automotivesuppliers must work to secure and preserve cost-competitive liquidity, strengthen financial disciplines,accelerate cost and capacity reduction efforts, and focus on diversifying their customer base.
• Environmental regulation — Vehicle manufacturers are under increasing pressure to improve the fuelefficiency of their vehicles due to concerns over global warming, increased cost of petroleum, andenergy security. Recently U.S. Corporate Average Fuel Economy (“CAFE”) standards for light vehicleswere increased from 27.5 mpg in 2007 to 35 mpg by 2020 with the intent of reducing carbon emissionsand improving fuel economy. Additionally, during 2007 the European Commission announced a carbonemissions reduction target of 130g/km for automotive fleets. Increases in fuel efficiency and decreasesin carbon emissions will likely be achieved through the reduction of average vehicle and related enginesize, hybrid-electric and diesel powered light vehicles, continued vehicle weight reduction, improved airand engine control systems, and other powertrain technologies. Successful automotive suppliers willsupport vehicle manufacturers with world class engineering capabilities and innovative technologies tocollectively drive improvements in vehicle performance related to fuel efficiency and carbon emissions.
• Consumer-driven growth — Despite increased environmental regulation over fuel efficiency and carbonemissions, consumers in more developed economies continue to demand larger and more powerfulvehicles, while consumers in emerging markets demand vehicles offered at a lower than traditional entryprice. Additionally, consumers are increasingly interested in products that make them feel safer andmore secure and include increased electronic and technical content such as in-vehicle communication,navigation and entertainment capabilities. To achieve sustainable profitable growth, automotive partsuppliers must effectively support their customers in developing and delivering products andtechnologies to the end-consumer at competitive prices that provide for differentiation and thataddress divergent consumer preferences.
2

ITEM 1. BUSINESS — (Continued)
The Company’s Business Strategy
By leveraging the Company’s extensive experience, innovative technology and geographic strengths, theCompany aims to grow leading positions in its key climate, interiors and electronics product groups and toimprove overall margins, long-term operating profitability and cash flows. To achieve these goals andrespond to industry factors and trends, the Company is working to restructure its business, improve itsoperations and achieve profitable growth.
Restructure the Business
• Underperforming and non-strategic operations — In January 2006, the Company announced a multi-year improvement plan designed to further restructure the business and improve profitability. Thisimprovement plan identified certain underperforming and non-strategic facilities that require significantrestructuring or potential sale or exit, as well as other infrastructure and cost reduction initiatives. Themajority of the cash expenses for this plan are expected to be funded by the $400 million escrow accountestablished pursuant to the ACH Transactions.
• Reduce overhead costs — The Company continues to implement actions designed to fundamentallyreorganize and streamline its administrative functions and reduce the related cost. Such actions includeorganizational realignment and consolidation, employee benefit reduction, business systemenhancements, resource relocation to more competitive cost locations, selective functionaloutsourcing, and evaluation of third-party supplier arrangements for purchased services.Additionally, as the Company improves its base operations and restructures underperforming andnon-strategic operations, certain administrative functions must be fundamentally restructured toeffectively and efficiently support the Company’s business.
Improve Operations
• Achieving cost efficiencies — The Company continues to take actions to lower its manufacturing costsby increasing its focus on production utilization and related investment, closure and consolidation offacilities and relocation of production to lower cost environments to take further advantage of its globalmanufacturing footprint. The Company has consolidated its regional purchasing activities into a globalcommodity driven organization to provide increased spending leverage to optimize supplierrelationships, and to further standardize its production and related material purchases.
• Improve product quality and the health and safety of employees — The Company has increased itsefforts to ensure that the products provided to its customers are of the highest quality and specification.Processes and standards continue to be implemented to prevent the occurrence of non-conformingproduction as measured by various industry standard quality ratings such as defective parts per million.The Company’s customers have recognized these efforts with various annual supplier quality awards.The health and safety of the Company’s employees is of utmost importance and the Company continuesto implement programs, training and awareness in all of its operations to limit safety related incidents andto improve lost time case rates.
• Capital investment efficiency — The Company has enhanced its financial discipline related to theevaluation of investment in and profitability of new customer programs to improve the Company’soperating margins and related return on investment and to achieve the best use of its capital.
3

ITEM 1. BUSINESS — (Continued)
Achieve Profitable Growth
• Focused product portfolio — The global automotive parts industry is highly competitive; winning andmaintaining new business requires suppliers to rapidly produce new and innovative products on a cost-competitive basis. Because of the heavy capital and engineering investment needed to maintain thiscompetitiveness, the Company re-examined its broad product portfolio to identify its key growth productsconsidered core to its future success. Based on this assessment, the Company identified interiors,climate and electronics as its key growth products. The Company believes there are opportunities tocapitalize on the continuing demand for additional electronics integration and associated products withits product portfolio and technical capabilities.
• Customer and geographic diversification — The Company is well positioned globally, with a diversecustomer base. Although Ford remains the Company’s largest customer, the Company has beensteadily diversifying its sales with other OEMs. Product sales to customers other than Ford were 61% oftotal product sales for the year ended December 31, 2007 compared to 55% for the year endedDecember 31, 2006. The Company’s regional sales mix has also become more balanced, with a greaterpercentage of product sales outside of North America. As a percent of total product sales, theCompany’s product sales by region for the year ended December 31, 2007 were as follows:North America — 32%; Europe — 37%; Asia — 27%; and South America — 4%. In comparison,product sales by region as a percentage of total product sales for the year ended December 31,2006 were as follows: North America — 37%; Europe — 36%; Asia — 23%; and South America — 4%.
Financial Information about Segments
The Company’s operations are organized in global product groups, including Climate, Electronics,Interiors and Other. Additionally, the Company operates a centralized administrative function tomonitor and facilitate the delivery of transition services in support of divestiture transactions, primarilyrelated to the ACH Transactions.
Further information relating to the Company’s reportable segments can be found in Item 8, “FinancialStatements and Supplementary Data” of this Annual Report on Form 10-K (Note 21, “SegmentInformation,” to the Company’s consolidated financial statements).
The Company’s Products
The following discussion provides an overview description of the products associated with major designsystems within each of the Company’s global product groups.
Electronics Product Group
The Company is one of the leading global suppliers of advanced in-vehicle entertainment, driverinformation, wireless communication, climate control, body and security electronics and lightingtechnologies and products.
Electronics Products Description
Audio Systems . . . . . . . . . . . . . . . . . . . . . . The Company produces a wide range of audio systems and components,ranging from base radio head units to integrated premium audio systems andamplifiers. Examples of the Company’s latest electronics products include digitaland satellite radios, HD RadioTM broadcast tuners and premium systems.
Driver Information Systems. . . . . . . . . . . . . . The Company designs and manufacturers a wide range of displays, fromanalog-electronic to high-impact instrument clusters that incorporate LCDdisplays.
4

ITEM 1. BUSINESS — (Continued)
Electronics Products Description
Infotainment — Information, Entertainment andMultimedia . . . . . . . . . . . . . . . . . . . . . . . The Company has developed numerous products to assist driving and provide
in-vehicle entertainment. A sampling of these technologies include: MACH(R)Voice Link Technology, connectivity solutions for portable devices, and a rangeof Family Entertainment Systems designed to support a variety of applicationsand vehicle segments.
Powertrain and Feature Control Modules . . . . The Company designs and manufactures a wide range of powertrain and featurecontrol modules for a worldwide customer base. Powertrain control modulescover a range of applications from single-cylinder small engine control systemsto fully-integrated V8/V10 engine and transmission controllers. Feature controlmodules include products which manage a variety of electrical loads related topowertrain function, including controllers for fuel pumps, 4x4 transfer cases,intake manifold tuning valves, and voltage regulation systems.
Electronic Climate Controls. . . . . . . . . . . . . . The Company designs and manufactures a complete line of climate controlmodules with capability to provide full system integration. The array of modulesavailable varies from single zone manual electronic modules to fully automaticmultiple zone modules. The Company also provides integrated audio andclimate control assemblies allowing styling and electrical architectureflexibility for various customer applications.
Lighting . . . . . . . . . . . . . . . . . . . . . . . . . . . The Company designs and builds a wide variety of headlamps (projector,reflector or Advanced Front Lighting Systems), Rear Combination Lamps,Center High-Mounted Stop Lamps (“CHMSL”) and Fog Lamps. The Companyutilizes a variety of light-generating sources including Light Emitting Diode(“LED”), High Intensity Discharge (“HID”) and Halogen-based systems.
Climate Product Group
The Company is one of the leading global suppliers in the design and manufacturing of components,modules and systems that provide automotive heating, ventilation, air conditioning and powertrain cooling.
Climate Products Description
Climate Systems. . . . . . . . . . . . . . . . . . . . . The Company designs and manufactures fully integrated heating, ventilationand air conditioning (“HVAC”) systems. The Company’s proprietary analyticaltools and systems integration expertise enables the development of climate-oriented components, subsystems and vehicle-level systems. Productscontained in this area include: Heat Exchangers, Climate Controls,Compressors, and Fluid Transport Systems.
Powertrain Cooling Systems . . . . . . . . . . . . . Cooling functionality and thermal management for the vehicle’s powertrainsystem (engine and transmission) is provided by powertrain cooling-relatedtechnologies.
Interior Product Group
The Company is one of the leading global suppliers of cockpit modules, instrument panels, door andconsole modules and interior trim components.
Interiors Products Description
Cockpit Modules . . . . . . . . . . . . . . . . . . . . . The Company’s cockpit modules incorporate structural, electronic, climatecontrol, mechanical and safety components. Customers are provided with acomplete array of services including advanced engineering and computer-aideddesign, styling concepts and modeling and in-sequence delivery ofmanufactured parts. The Company’s Cockpit Modules are built around itsinstrument panels which consist of a substrate and the optional assembly ofstructure, ducts, registers, passenger airbag system (integrated orconventional), finished panels and the glove box assembly.
5
ITEM 1. BUSINESS — (Continued)
Interiors Products Description
Door Panels and Trims . . . . . . . . . . . . . . . . The Company provides a wide range of door panels / modules as well as avariety of interior trim products.
Console Modules . . . . . . . . . . . . . . . . . . . . The Company’s consoles deliver flexible and versatile storage options to theconsumer. The modules are interchangeable units and offer consumers a widerange of storage options that can be tailored to their individual needs.
Other Product Group
The Company also designs and manufactures a variety of other products, including driveline systemsincluding applications for popular all-wheel drive vehicles and powertrain products and systems, which aredesigned to provide the automotive customer with solutions that enhance powertrain performance, fueleconomy and emissions control.
The Company’s Customers
The Company sells its products primarily to global vehicle manufacturers as well as to other suppliers andassemblers. In addition, it sells products for use as aftermarket and service parts to automotive originalequipment manufacturers and others for resale through independent distribution networks. The Companyrecords revenue when persuasive evidence of an arrangement exists, delivery occurs or services arerendered, the sales price or fee is fixed or determinable and collectibility is reasonably assured.
Vehicle Manufacturers
The Company sells to all of the world’s largest vehicle manufacturers including BMW, Chrysler LLC,Daimler AG, Ford, General Motors, Honda, Hyundai/Kia, Mazda, Mitsubishi, Nissan, PSA PeugeotCitroën, Renault, Toyota, and Volkswagen, as well as emerging new vehicle manufacturers in Asia.Ford is the Company’s largest customer, and product sales to Ford, including those sales to Auto AllianceInternational, a joint venture between Ford and Mazda, accounted for approximately 39% of 2007 totalproduct sales. In addition, product sales to Hyundai/Kia accounted for approximately 15% of 2007 totalproduct sales, and product sales to Nissan and Renault accounted for approximately 11% of 2007 totalproduct sales. Sales to customers other than Ford include sales to Mazda, of which Ford holds a 33.4%equity interest.
Price reductions are typically negotiated on an annual basis between suppliers and vehicle manufacturers.Such reductions are intended to take into account expected annual reductions in the overall cost to thesupplier of providing products and services to the customer, through such factors as overall increases inmanufacturing productivity, material cost reductions, and design-related cost improvements. TheCompany has agreed to provide specific average price reductions to its largest customer, Ford, formost North America sales through 2008. The Company has an aggressive cost reduction program thatfocuses on reducing its total costs, which are intended to offset customer price reductions. However, therecan be no assurance that such cost reduction efforts will be sufficient to do so, especially consideringrecent increases in the costs of certain commodities used in the manufacture of the Company’s products.The Company records such price reductions when specific facts and circumstances indicate that a pricereduction is probable and the amounts are reasonably estimable.
Other Customers
The Company sells products to various customers in the worldwide aftermarket as replacement orenhancement parts, such as body appearance packages and in-car entertainment systems, forcurrent production and older vehicles. The Company’s services revenues relate primarily to the supplyof leased personnel and transition services to ACH in connection with various agreements pursuant to theACH Transactions. The Company has also agreed to provide transition services to other customers inconnection with certain other divestitures.
6

ITEM 1. BUSINESS — (Continued)
The Company’s Competition
The Company conducts its business in a complex and highly competitive industry. The global automotiveparts industry principally involves the supply of systems, modules and components to vehiclemanufacturers for the manufacture of new vehicles. Additionally, suppliers provide components toother suppliers for use in their product offerings and to the aftermarket for use as replacement orenhancement parts. As the supplier industry consolidates, the number of competitors decreasesfostering extremely competitive conditions. Vehicle manufacturers rigorously evaluate suppliers on thebasis of product quality, price competitiveness, technical expertise and development capability, newproduct innovation, reliability and timeliness of delivery, product design and manufacturing capability andflexibility, customer service and overall management.
A summary of the Company’s primary independent competitors is provided below.
Electronics — The Company’s principal competitors in the Electronics segment include Robert BoschGmbH; Delphi Corporation; Denso Corporation; Hella KGaA; Koito Manufacturing Co., Ltd (NorthAmerican Lighting); Matsushita Electric Industrial Co., Ltd. (Panasonic); and Continental AG.
Climate — The Company’s principal competitors in the Climate segment include Behr GmbH & Co. KG;Delphi Corporation; Denso Corporation; and Valéo S.A.
Interiors — The Company’s principal competitors in the Interiors segment include Faurecia Group;Johnson Controls, Inc.; Magna International Inc.; International Automotive Components Group; andDelphi Corporation.
Other — The Company’s principal competitors in the Other segment include American Axle &Manufacturing Holdings, Inc; Robert Bosch GmbH; Dana Corporation; Delphi Corporation; DensoCorporation; Magna International Inc.; Siemens VDO Automotive AG; GKN Plc.; JTEKT Corporation;ZF Friedrichshafen AG; NTN Corporation; Kautex Textron GmbH&Co KG; Inergy Automotive Systems;and TI Automotive.
The Company’s Product Sales Backlog
Anticipated net product sales for 2008 through 2010 from new and replacement programs, less net salesfrom phased-out and canceled programs are approximately $725 million. The Company’s estimate ofanticipated net sales may be impacted by various assumptions, including vehicle production levels on newand replacement programs, customer price reductions, currency exchange rates and the timing ofprogram launches. In addition, the Company typically enters into agreements with its customers at thebeginning of a vehicle’s life for the fulfillment of a customers’ purchasing requirements for the entireproduction life of the vehicle. These agreements generally may be terminated by customers at any time.Therefore, this anticipated net sales information does not represent firm orders or firm commitments.
7
ITEM 1. BUSINESS — (Continued)
The Company’s International Operations
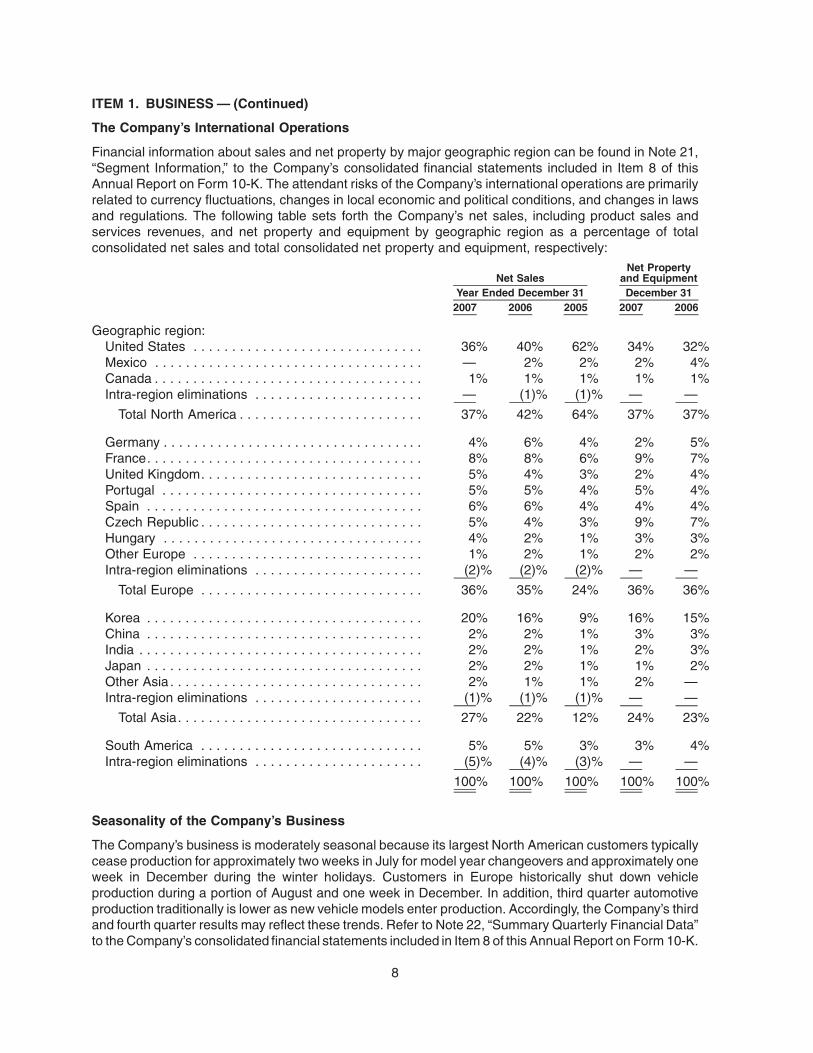
Financial information about sales and net property by major geographic region can be found in Note 21,“Segment Information,” to the Company’s consolidated financial statements included in Item 8 of thisAnnual Report on Form 10-K. The attendant risks of the Company’s international operations are primarilyrelated to currency fluctuations, changes in local economic and political conditions, and changes in lawsand regulations. The following table sets forth the Company’s net sales, including product sales andservices revenues, and net property and equipment by geographic region as a percentage of totalconsolidated net sales and total consolidated net property and equipment, respectively:
2007 2006 2005 2007 2006Year Ended December 31 December 31
Net SalesNet Property
and Equipment
Geographic region:United States . . . . . . . . . . . . . . . . . . . . . . . . . . . . . . 36% 40% 62% 34% 32%Mexico . . . . . . . . . . . . . . . . . . . . . . . . . . . . . . . . . . . — 2% 2% 2% 4%Canada . . . . . . . . . . . . . . . . . . . . . . . . . . . . . . . . . . . 1% 1% 1% 1% 1%Intra-region eliminations . . . . . . . . . . . . . . . . . . . . . . — (1)% (1)% — —
Total North America . . . . . . . . . . . . . . . . . . . . . . . . 37% 42% 64% 37% 37%
Germany . . . . . . . . . . . . . . . . . . . . . . . . . . . . . . . . . . 4% 6% 4% 2% 5%France. . . . . . . . . . . . . . . . . . . . . . . . . . . . . . . . . . . . 8% 8% 6% 9% 7%United Kingdom. . . . . . . . . . . . . . . . . . . . . . . . . . . . . 5% 4% 3% 2% 4%Portugal . . . . . . . . . . . . . . . . . . . . . . . . . . . . . . . . . . 5% 5% 4% 5% 4%Spain . . . . . . . . . . . . . . . . . . . . . . . . . . . . . . . . . . . . 6% 6% 4% 4% 4%Czech Republic . . . . . . . . . . . . . . . . . . . . . . . . . . . . . 5% 4% 3% 9% 7%Hungary . . . . . . . . . . . . . . . . . . . . . . . . . . . . . . . . . . 4% 2% 1% 3% 3%Other Europe . . . . . . . . . . . . . . . . . . . . . . . . . . . . . . 1% 2% 1% 2% 2%Intra-region eliminations . . . . . . . . . . . . . . . . . . . . . . (2)% (2)% (2)% — —
Total Europe . . . . . . . . . . . . . . . . . . . . . . . . . . . . . 36% 35% 24% 36% 36%
Korea . . . . . . . . . . . . . . . . . . . . . . . . . . . . . . . . . . . . 20% 16% 9% 16% 15%China . . . . . . . . . . . . . . . . . . . . . . . . . . . . . . . . . . . . 2% 2% 1% 3% 3%India . . . . . . . . . . . . . . . . . . . . . . . . . . . . . . . . . . . . . 2% 2% 1% 2% 3%Japan . . . . . . . . . . . . . . . . . . . . . . . . . . . . . . . . . . . . 2% 2% 1% 1% 2%Other Asia . . . . . . . . . . . . . . . . . . . . . . . . . . . . . . . . . 2% 1% 1% 2% —Intra-region eliminations . . . . . . . . . . . . . . . . . . . . . . (1)% (1)% (1)% — —
Total Asia. . . . . . . . . . . . . . . . . . . . . . . . . . . . . . . . 27% 22% 12% 24% 23%
South America . . . . . . . . . . . . . . . . . . . . . . . . . . . . . 5% 5% 3% 3% 4%Intra-region eliminations . . . . . . . . . . . . . . . . . . . . . . (5)% (4)% (3)% — —
100% 100% 100% 100% 100%
Seasonality of the Company’s Business
The Company’s business is moderately seasonal because its largest North American customers typicallycease production for approximately two weeks in July for model year changeovers and approximately oneweek in December during the winter holidays. Customers in Europe historically shut down vehicleproduction during a portion of August and one week in December. In addition, third quarter automotiveproduction traditionally is lower as new vehicle models enter production. Accordingly, the Company’s thirdand fourth quarter results may reflect these trends. Refer to Note 22, “Summary Quarterly Financial Data”to the Company’s consolidated financial statements included in Item 8 of this Annual Report on Form 10-K.
8

ITEM 1. BUSINESS — (Continued)
The Company’s Workforce and Employee Relations
The Company’s workforce as of December 31, 2007 included approximately 41,500 persons, of whichapproximately 14,000 were salaried employees and 27,500 were hourly workers. As of December 31, 2007,the Company leased approximately 2,200 salaried employees to ACH under the terms of the SalariedEmployee Lease Agreement.
A substantial number of the Company’s hourly workforce in the U.S. are represented by unions andoperate under collective bargaining agreements. In connection with the ACH Transactions, the Companyterminated its lease from Ford of its UAW Master Agreement hourly workforce. Many of the Company’sEuropean and Mexican employees are members of industrial trade unions and confederations within theirrespective countries. Many of these organizations operate under collectively bargained contracts that arenot specific to any one employer. The Company constantly works to establish and maintain positive,cooperative relations with its unions around the world and believes that its relationships with unionizedemployees are satisfactory. There have been no significant work stoppages in the past five years, exceptfor a brief work stoppage by employees represented by the IUE-CWA Local 907 at a manufacturing facilitylocated in Bedford, Indiana during June 2004.
The Company’s Product Research and Development
The Company’s research and development efforts are intended to maintain leadership positions in coreproduct lines and provide the Company with a competitive edge as it seeks additional business with newand existing customers. The Company also works with technology development partners, includingcustomers, to develop technological capabilities and new products and applications. Total researchand development expenditures were approximately $510 million in 2007, decreasing from $594 millionin 2006 and $804 million in 2005. The decrease from 2005 to 2006 is primarily due to the ACHTransactions. The remaining decreases are attributable to divestitures, shifting engineering headcountfrom high-cost to low-cost countries as well as right-sizing efforts.
The Company’s Intellectual Property
The Company owns significant intellectual property, including a large number of patents, copyrights,proprietary tools and technologies and trade secrets and is involved in numerous licensing arrangements.Although the Company’s intellectual property plays an important role in maintaining its competitiveposition, no single patent, copyright, proprietary tool or technology, trade secret or license, or group ofrelated patents, copyrights, proprietary tools or technologies, trade secrets or licenses is, in the opinion ofmanagement, of such value to the Company that its businesswould be materially affected by the expirationor termination thereof. The Company’s general policy is to apply for patents on an ongoing basis, inappropriate countries, on its patentable developments which are considered to have commercialsignificance.
The Company also views its name and mark as significant to its business as a whole. In addition, theCompany holds rights in a number of other trade names and marks applicable to certain of its businessesand products that it views as important to such businesses and products.
The Company’s Raw Materials and Suppliers
Raw materials used by the Company in the manufacture of its products primarily include steel, aluminum,resins, precious metals, urethane chemicals and electronics components. All of the materials used aregenerally available from numerous sources. However, the automotive supply industry has experiencedsignificant inflationary pressures, which have placed operational and financial burdens on the entire supplychain. Accordingly, the cost of ensuring the continued supply of certain raw materials, in particularpetroleum-based commodities, such as resins, has increased significantly and is expected to continue forthe foreseeable future.
9

ITEM 1. BUSINESS — (Continued)
The Company continues to take actions with its customers and suppliers to mitigate the impact of theseinflationary pressures. Actions to mitigate inflationary pressures with customers include collaboration onalternative product designs and material specifications, contractual price escalation clauses andnegotiated customer recoveries. Actions to mitigate inflationary pressures with suppliers includeaggregation of purchase requirements to achieve optimal volume benefits, negotiation of costreductions, and identification of more cost competitive suppliers. While these actions have allowed theCompany to partially offset the impact of these inflationary pressures, the Company cannot provideassurance that it will be able to do so in the future.
In general, the Company does not carry inventories of raw materials in excess of those reasonablyrequired to meet production and shipping schedules. To date, the Company has not experienced anysignificant shortages of raw materials nor does it anticipate significant interruption in the supply of rawmaterials. However, the possibilities of such shortages exist, especially in light of the weakened state of thesupply base previously described.
Impact of Environmental Regulations on the Company
The Company is subject to the requirements of federal, state, local and foreign environmental andoccupational safety and health laws and regulations. These include laws regulating air emissions, waterdischarge and waste management. The Company is also subject to environmental laws requiring theinvestigation and cleanup of environmental contamination at properties it presently owns or operates andat third-party disposal or treatment facilities to which these sites send or arranged to send hazardouswaste.
At the time of spin-off, the Company and Ford agreed on a division of liability for, and responsibility formanagement and remediation of environmental claims existing at that time and, further, that the Companywould assume all liabilities for existing and future claims relating to sites that were transferred to it and itsoperation of those sites, including off-site disposal, except as otherwise specifically retained by Ford in theMaster Transfer Agreement. In connection with the ACH Transactions, Ford agreed to re-assume theseliabilities to the extent they arise from the ownership or operation prior to the spin-off of the locationstransferred to ACH (excluding any increase in costs attributable to the exacerbation of such liability by theCompany or its affiliates).
The Company is aware of contamination at some of its properties and relating to various third-partySuperfund sites at which the Company or its predecessor has been named as a potentially responsibleparty. It is in various stages of investigation and cleanup at these sites. At December 31, 2007, theCompany had recorded a reserve of approximately $9 million for this environmental investigation andcleanup. However, estimating liabilities for environmental investigation and cleanup is complex anddependent upon a number of factors beyond the Company’s control and which may changedramatically. Accordingly, although the Company believes its reserve is adequate based on currentinformation, the Company cannot provide any assurance that its ultimate environmental investigation andcleanup costs and liabilities will not exceed the amount of its current reserve.
During 2007, the Company did not make any material capital expenditures relating to environmentalcompliance.
10
ITEM 1. BUSINESS — (Continued)
The Company’s Website and Access to Available Information
The Company’s current and periodic reports filed with the Securities and Exchange Commission, includingamendments to those reports, may be obtained through its internet website at www.visteon.com free ofcharge as soon as reasonably practicable after the Company files these reports with the SEC. A copy ofthe Company’s code of business conduct and ethics for directors, officers and employees of Visteon and itssubsidiaries, entitled “Ethics and Integrity Policy,” the Corporate Governance Guidelines adopted by theCompany’s Board of Directors and the charters of each committee of the Board of Directors are alsoavailable on the Company’s website. A printed copy of the foregoing documents may be requested bycontacting the Company’s Shareholder Relations department in writing at One Village Center Drive,Van Buren Township, MI 48111; by phone (877) 367-6092; or via email at [email protected].
11

ITEM 1A. RISK FACTORS
The risks and uncertainties described below are not the only ones facing the Company. Additional risksand uncertainties, including those not presently known or that the Company believes to be immaterial, alsomay adversely affect the Company’s results of operations and financial condition. Should any such risksand uncertainties develop into actual events, these developments could have material adverse effects onthe Company’s business and financial results.
A decline in automotive sales could reduce the Company’s sales and harm its operations.
Demand for the Company’s products is directly related to automotive vehicle production. Automotive salesand production can be affected by general economic conditions, such as employment levels and trends,fuel prices and interest rates, labor relations issues, regulatory requirements, trade agreements and otherfactors. Automotive industry conditions in North America and Europe continue to be challenging. In NorthAmerica, the domestic automotive industry is characterized by significant overcapacity, fierce competition,high fixed cost structures and significant employee pension and health care obligations for the domesticautomakers. Domestic automakers continue to report market share loss to other vehicle manufacturersresulting in lower annual production volumes and the need to further address their production capacity andcost structure. Any decline in automotive production levels of its current and future customers could reducethe Company’s sales and harm its results of operations and financial condition.
Further, certain automakers, particularly in North America and Europe, report significant financialchallenges due to the factors described above. These automakers continue to implement actions tofurther reduce capacity and streamline their cost structure while at the same time investing in newtechnologies and vehicle platforms. In the United States, Chrysler LLC, Ford Motor Company, and GeneralMotors Corporation have announced on-going restructuring plans aimed at realigning their cost structurein light of current and projected market share and production volumes for the North American market. Asignificant element of these cost reduction actions includes closing factories and/or reducing the number ofproduction shifts at open factories. The results and effects of these actions and related negotiationscontinue to be uncertain and, accordingly, could have a material adverse affect on the Company’s resultsof operations and financial condition.
The Company is highly dependent on Ford. Ford is currently undergoing a restructuring plan andfurther decreases in Ford’s vehicle production volume would adversely affect the Company’sresults.
Ford is the Company’s largest customer and accounted for approximately 39% of total product sales in2007, 45% of total product sales in 2006 and 62% of total product sales in 2005. The Company has madesignificant progress in diversifying its customer base with other automakers and reducing its salesconcentration with Ford. Ford will continue to be the Company’s largest customer for the near future.Ford is currently undergoing a restructuring plan and may ultimately restructure its operations in a way thatcould be adverse to the Company’s interests. As in the past, any change in Ford’s vehicle productionvolume will have a significant impact on the Company’s sales volume and restructuring efforts.
The Company currently leases approximately 2,200 salaried employees to ACH, a company controlled byFord, and has an agreement with Ford to reimburse the Company for up to $150 million of the costs relatedto separating any of the leased employees should they be returned to the Company for any reason. In theevent that Ford is unable or unwilling to fulfill its obligations under this agreement, the Company could beadversely affected.
12

ITEM 1A. RISK FACTORS — (Continued)
The discontinuation of, the loss of business with respect to, or a lack of commercial success of aparticular vehicle model for which the Company is a significant supplier could affect theCompany’s estimates of anticipated net sales.
Although the Company has purchase orders from many of its customers, these purchase orders generallyprovide for the supply of a customer’s annual requirements for a particular model and assembly plant andare renewable on a year-to-year basis, rather than for the purchase of a specific quantity of products.Therefore, the discontinuation, loss of business with respect to, or a lack of commercial success, of aparticular vehicle model for which the Company is a significant supplier could reduce the Company’s salesand affect its estimates of anticipated net sales, including new business and net new business.
Escalating price pressures from customers may adversely affect the Company’s business.
Downward pricing pressures by automotive manufacturers is a characteristic of the automotive industry.Virtually all automakers have aggressive price reduction initiatives and objectives each year with theirsuppliers, and such actions are expected to continue in the future. In addition, estimating such amounts issubject to risk and uncertainties as any price reductions are a result of negotiations and other factors.Accordingly, suppliers must be able to reduce their operating costs in order to maintain profitability. TheCompany has taken steps to reduce its operating costs to offset customer price reductions, in addition toother actions designed to resist such reductions; however, price reductions have impacted the Company’ssales and profit margins and are expected to do so in the future. If the Company is unable to offsetcustomer price reductions in the future through improved operating efficiencies, new manufacturingprocesses, sourcing alternatives and other cost reduction initiatives, the Company’s results of operationsand financial condition would be adversely affected.
The automotive supplier environment in which the Company operates continues to evolve and beuncertain.
In recent years, the competitive environment among suppliers to the global automotive manufacturers haschanged significantly as these manufacturers have sought to outsource more vehicular components,modules and systems. In addition, the number of suppliers worldwide has been declining due to continuedconsolidation. In the United States, declining sales volumes of certain domestic automakers combinedwith high raw material and labor costs has adversely impacted the financial condition of several domesticautomotive suppliers, including resulting in several significant supplier bankruptcies. The Companyexpects to respond to these developments by continuing to diversify its customer base through thecontinued development of innovative products at competitive prices as well as through strategic alliances,joint ventures, acquisitions and divestitures and aggressively restructuring its high cost operations.However, there is no assurance that the Company’s efforts will be successful or that competitors withlower cost structures and better access to liquidity sources will not significantly impact the Company’sbusiness, results of operations and financial condition.
Severe inflationary pressures impacting ferrous and non-ferrous metals and petroleum-basedcommodities may adversely affect the Company’s profitability and the profitability of theCompany’s Tier 2 and Tier 3 supply base.
The automotive supply industry has experienced significant inflationary pressures, primarily in ferrous andnon-ferrous metals and petroleum-based commodities, such as resins. These inflationary pressures haveplaced significant operational and financial burdens on automotive suppliers at all levels, and are expectedto continue for the foreseeable future. Generally, it has been difficult to pass on, in total, the increased costsof raw materials and components used in the manufacture of the Company’s products to its customers. Inaddition, the Company’s need to maintain a continued supply of raw materials and/or components hasmade it difficult to resist price increases and surcharges imposed by its suppliers.
13
ITEM 1A. RISK FACTORS — (Continued)
Further, this inflationary pressure, combined with other factors, has adversely impacted the financialcondition of several domestic automotive suppliers, including resulting in several significant supplierbankruptcies. Because the Company purchases various types of equipment, raw materials andcomponent parts from suppliers, it may be materially and adversely affected by the failure of thosesuppliers to perform as expected. This non-performance may consist of delivery delays, failures caused byproduction issues or delivery of non-conforming products, or supplier insolvency or bankruptcy.Consequently, the Company’s efforts to continue to mitigate the effects of these inflationary pressuresmay be insufficient if conditions were to worsen, resulting in a negative impact on the Company’s financialresults.
The Company could be adversely affected by shortages of components from suppliers.
In an effort to manage and reduce the costs of purchased goods and services, the Company, like manysuppliers and automakers, has been consolidating its supply base. As a result, the Company is dependenton single or limited sources of supply for certain components used in the manufacture of its products. TheCompany selects its suppliers based on total value (including price, delivery and quality), taking intoconsideration their production capacities and financial condition. However, there can be no assurance thatstrong demand, capacity limitations or other problems experienced by the Company’s suppliers will notresult in occasional shortages or delays in their supply of components. If the Company was to experience asignificant or prolonged shortage of critical components from any of its suppliers, particularly those whoare sole sources, and could not procure the components from other sources, the Company would beunable to meet its production schedules for some of its key products and to ship such products to itscustomers in timely fashion, which would adversely affect sales, margins and customer relations.
Work stoppages or similar difficulties could significantly disrupt the Company’s operations.
A work stoppage at one or more of the Company’s manufacturing and assembly facilities could havematerial adverse effects on the business. Also, if one or more of the Company’s customers were toexperience a work stoppage, that customer would likely halt or limit purchases of the Company’s productswhich could result in the shut down of the related manufacturing facilities. Further, because the automotiveindustry relies heavily on just-in-time delivery of components during the assembly and manufacture ofvehicles, a significant disruption in the supply of a key component due to a work stoppage at one of theCompany’s suppliers or any other supplier could have the same consequences, and accordingly, have amaterial adverse effect on the Company’s financial results.
14
ITEM 1A. RISK FACTORS — (Continued)
The Company has a history of significant losses; the Company is in the process of implementing amulti-year improvement plan but may be unable to successfully improve its performance or attainprofitability.
The Company incurred net losses of $372 million, $163 million and $270 million for 2007, 2006 and 2005,respectively. The Company’s ability to improve its financial performance and return to profitability isdependent on its ability to implement its multi-year improvement plan, and realize the benefits of such plan.The Company expects to fund the majority of the cash restructuring costs contemplated by its multi-yearplan with reimbursements from the $400 million escrow account established by Ford upon the completionof the ACH Transactions. However, it is possible that actual cash restructuring costs could vary significantlyfrom the Company’s initial projections as the plan progresses, which could result in unexpected costs infuture periods that may be in excess of amounts available from the escrow account resulting in an adverseimpact on the Company’s financial results. Further, the Company cannot provide assurances that it willrealize the expected benefits in the time periods projected, or at all, from its restructuring actions, or thatsuch actions will improve its financial performance or return the Company to profitability in the near term orat all. In addition, a significant portion of the Company’s hourly workforce is unionized. Labor contracts withthese unions can significantly restrict the Company’s ability to restructure or close plants and divestunprofitable, noncompetitive businesses as well as limit its ability to change local work rules and practicesat a number of the Company’s facilities, constraining the implementation of cost-saving measures. Theserestrictions and limitations could have adverse effects on the Company’s results of operations andcompetitive position and could slow or alter the Company’s improvement plans.
Moreover, the Company recorded asset impairment charges of $95 million, $22 million and $1,504 millionin 2007, 2006 and 2005, respectively, to adjust the carrying value of certain assets to their estimated fairvalue. Additional asset impairment charges in the future may result in the event that the Company does notachieve its internal financial plans, and such charges could materially affect the Company’s results ofoperations and financial condition in the period(s) recognized. In addition, the Company cannot provideassurance that it will be able to recover its remaining net deferred tax assets which is dependent uponachieving future taxable income in certain foreign jurisdictions. Failure to achieve its taxable incometargets may change the Company’s assessment of the recoverability of its remaining net deferred taxassets and would likely result in an increase in the valuation allowance in the applicable period. Anyincrease in the valuation allowance would result in additional income tax expense, would reducestockholders’ equity and could have a significant impact on the Company’s earnings going forward.
Sources of financing may not be available to the Company in the amount or terms required.
The Company’s business is highly dependent upon the ability to access the credit and capital markets.Access to, and the costs of borrowing in, these markets depend in part on the Company’s credit ratings,which are currently below investment grade. There can be no assurance that the Company’s credit ratingswill not decline further in the future. Further downgrades of these ratings would increase the Company’scosts of borrowing and could adversely affect its liquidity. Additionally, the current state of the credit andcapital markets has resulted in severely constrained liquidity conditions owing to a reevaluation of riskattributable primarily, but not limited, to the U.S. sub-prime mortgage crisis. Continuation of suchconstraints may increase the Company’s costs of borrowing and could restrict the Company’s accessto this potential source of future liquidity.
15

ITEM 1A. RISK FACTORS — (Continued)
The Company’s working capital requirements and cash provided by operating activities can vary greatlyfrom quarter to quarter and from year to year, depending in part on the level, variability and timing of itscustomers’ worldwide vehicle production and the payment terms with the Company’s customers andsuppliers. The Company cannot provide assurance that it will be able to satisfy its capital expenditurerequirements during 2008 or subsequent years, or during any particular quarter, from cash provided byoperating activities. If the Company’s working capital needs and capital expenditure requirements exceedits cash flows from operations, the Company would look to its cash balances and availability for borrowingsto satisfy those needs, as well as the need to raise additional capital, which may not be available onsatisfactory terms and in adequate amounts. For a discussion of these and other factors affecting theCompany’s liquidity, refer to “Management’s Discussion and Analysis of Financial Condition and Results ofOperations — Liquidity.”
The Company’s pension and other postretirement employee benefits expense and funding levelsof pension plans could materially deteriorate or the Company may be unable to generate sufficientexcess cash flow to meet increased pension and other postretirement employee benefitobligations.
Substantially all of the Company’s employees participate in defined benefit pension plans orretirement/termination indemnity plans. The Company also sponsors other postretirement employeebenefit (“OPEB”) plans in the United States. The Company’s worldwide pension and OPEB obligationsexposed the Company to approximately $985 million in unfunded liabilities as of December 31, 2007, ofwhich approximately $131 million and $311 million was attributable to unfunded U.S. and Non-U.S. pensionobligations, respectively and $543 million was attributable to unfunded OPEB obligations.
The Company has previously experienced declines in interest rates and pension asset values. Futuredeclines in interest rates or the market values of the securities held by the plans, or certain other changes,could materially deteriorate the funded status of the Company’s plans and affect the level and timing ofrequired contributions in 2008 and beyond. Additionally, a material deterioration in the funded status of theplans could significantly increase pension expenses and reduce the Company’s profitability.
The Company funds its OPEB obligations on a pay-as-you-go basis; accordingly, the related plans have noassets. The Company is subject to increased OPEB cash outlays and costs due to, among other factors,rising health care costs. Increases in the expected cost of health care in excess of current assumptionscould increase actuarially determined liabilities and related OPEB expenses along with future cashoutlays.
The Company’s assumptions used to calculate pension and OPEB obligations as of the annualmeasurement date directly impact the expense to be recognized in future periods. While theCompany’s management believes that these assumptions are appropriate, significant differences inactual experience or significant changes in these assumptions may materially affect the Company’spension and OPEB obligations and future expense. For more information on sensitivities to changingassumptions, please see Item 7. “Management’s Discussion and Analysis of Financial Condition andResults of Operations” and Note 15 to the Company’s consolidated financial statements.
The Company’s ability to generate sufficient cash to satisfy our obligations may be impacted by the factorsdiscussed herein.
16

ITEM 1A. RISK FACTORS — (Continued)
The Company’s expected annual effective tax rate could be volatile and materially change as aresult of changes in mix of earnings and other factors.
Changes in the Company’s debt and capital structure, among other items, may impact its effective tax rate.The Company’s overall effective tax rate is equal to consolidated tax expense as a percentage ofconsolidated earnings before tax. However, tax expense and benefits are not recognized on a globalbasis but rather on a jurisdictional basis. Further, the Company is in a position whereby losses incurred incertain tax jurisdictions generally provide no current financial statement benefit. In addition, certainjurisdictions have statutory rates greater than or less than the United States statutory rate. As such,changes in the mix and source of earnings between jurisdictions could have a significant impact on theCompany’s overall effective tax rate in future periods. Changes in tax law and rates, changes in rulesrelated to accounting for income taxes, or adverse outcomes from tax audits that regularly are in process inany of the jurisdictions in which the Company operates could also have a significant impact on theCompany’s overall effective rate in future periods.
If Visteon were to have a change of ownership within the meaning of Section 382 of the Internal RevenueCode, under current conditions, its annual federal net operating loss (“NOL”) utilization could be limited toan amount equal to its market capitalization at the time of the ownership change multiplied by the federallong-term tax exempt rate. Visteon cannot provide any assurance that such an ownership change will notoccur, in which case the availability of Visteon’s substantial NOL carryforward and other federal income taxattributes would be significantly limited or possibly eliminated.
The Company’s ability to effectively operate could be hindered if it fails to attract and retain keypersonnel.
The Company’s ability to operate its business and implement its strategies effectively depends, in part, onthe efforts of its executive officers and other key employees. In addition, the Company’s future success willdepend on, among other factors, the ability to attract and retain qualified personnel, particularly engineersand other employees with critical expertise and skills that support key customers and products. The loss ofthe services of any key employees or the failure to attract or retain other qualified personnel could have amaterial adverse effect on the Company’s business.
The Company’s international operations, including Asian joint ventures, are subject to variousrisks that could adversely affect the Company’s business, results of operations and financialcondition.
The Company has operating facilities, and conducts a significant portion of its business, outside theUnited States. The Company has invested significantly in joint ventures with other parties to conductbusiness in South Korea, China and elsewhere in Asia. The Company’s ability to repatriate funds fromthese joint ventures depends not only upon their uncertain cash flows and profits, but also upon the termsof particular agreements with the Company’s joint venture partners and maintenance of the legal andpolitical status quo. The Company risks expropriation in China and the instability that would accompanycivil unrest or armed conflict within the Asian region. More generally, the Company’s Asian joint venturesand other foreign investments could be adversely affected by changes in the political, economic andfinancial environments in host countries, including fluctuations in exchange rates, political instability,changes in foreign laws and regulations (or new interpretations of existing laws and regulations) andchanges in trade policies, import and export restrictions and tariffs, taxes and exchange controls. Any oneof these factors could have an adverse effect on the Company’s business, results of operations andfinancial condition. In addition, the Company’s consolidated financial statements are denominated inU.S. dollars and require translation adjustments, which can be significant, for purposes of reporting resultsfrom, and the financial condition of, its foreign investments.
17
ITEM 1A. RISK FACTORS — (Continued)
Warranty claims, product liability claims and product recalls could harm the Company’s business,results of operations and financial condition.
The Company faces inherent business risk of exposure to warranty and product liability claims in the eventthat its products fail to perform as expected or such failure results, or is alleged to result, in bodily injury orproperty damage (or both). In addition, if any of the Company’s designed products are defective or arealleged to be defective, the Company may be required to participate in a recall campaign. As suppliersbecome more integrally involved in the vehicle design process and assume more of the vehicle assemblyfunctions, automakers are increasingly expecting them to warrant their products and are increasinglylooking to them for contributions when faced with product liability claims or recalls. A successful warranty orproduct liability claim against the Company in excess of its available insurance coverage and establishedreserves, or a requirement that the Company participate in a product recall campaign, would have adverseeffects that could be material on the Company’s business, results of operations and financial condition.
The Company is involved from time to time in legal proceedings and commercial or contractualdisputes, which could have an adverse effect on its business, results of operations and financialposition.
The Company is involved in legal proceedings and commercial or contractual disputes that, from time totime, are significant. These are typically claims that arise in the normal course of business including,without limitation, commercial or contractual disputes (including disputes with suppliers), intellectualproperty matters, personal injury claims and employment matters. In addition, the Company, certaindirectors, officers and employees have been named in lawsuits alleging violations of the federal securitieslaws, ERISA and fiduciary obligations. No assurances can be given that such proceedings and claims willnot have a material adverse impact on the Company’s profitability and financial position.
The Company could be adversely impacted by environmental laws and regulations.
The Company’s operations are subject to U.S. and non-U.S. environmental laws and regulationsgoverning emissions to air; discharges to water; the generation, handling, storage, transportation,treatment and disposal of waste materials; and the cleanup of contaminated properties. Currently,environmental costs with respect to former, existing or subsequently acquired operations are notmaterial, but there is no assurance that the Company will not be adversely impacted by such costs,liabilities or claims in the future either under present laws and regulations or those that may be adopted orimposed in the future.
Developments or assertions by or against the Company relating to intellectual property rightscould materially impact its business.
The Company owns significant intellectual property, including a large number of patents, trademarks,copyrights and trade secrets, and is involved in numerous licensing arrangements. The Company’sintellectual property plays an important role in maintaining its competitive position in a number of themarkets served. Developments or assertions by or against the Company relating to intellectual propertyrights could materially impact the business. Significant technological developments by others also couldmaterially and adversely affect the Company’s business and results of operations and financial condition.
The Company’s business and results of operations could be affected adversely by terrorism.
Terrorist-sponsored attacks, both foreign and domestic, could have adverse effects on the Company’sbusiness and results of operations. These attacks could accelerate or exacerbate other automotiveindustry risks such as those described above and also have the potential to interfere with the Company’sbusiness by disrupting supply chains and the delivery of products to customers.
18
ITEM 1A. RISK FACTORS — (Continued)
A failure of the Company’s internal controls could adversely affect the Company’s ability to reportits financial condition and results of operations accurately and on a timely basis. As a result, theCompany’s business, operating results and liquidity could be harmed.
Because of the inherent limitations of any system of internal control, including the possibility of humanerror, the circumvention or overriding of controls or fraud, even an effective system of internal control maynot prevent or detect all misstatements. In the event of an internal control failure, the Company’s ability toreport its financial results on a timely and accurate basis could be adversely impacted, which could result ina loss of investor confidence in its financial reports or have a material adverse affect on the Company’sability to operate its business or access sources of liquidity.
ITEM 1B. UNRESOLVED STAFF COMMENTS
None.
19

ITEM 2. PROPERTIES
The Company’s principal executive offices are located in Van Buren Township, Michigan. Set forth below isa listing of the Company’s most significant manufacturing and/or assembly facilities that are owned orleased by the Company and its consolidated subsidiaries as of December 31, 2007.
Interiors
Alabama Tuscaloosa(L)Michigan Benton Harbor(O)Michigan Benton Harbor(L)Michigan Highland Park(L)Mississippi Canton(L)Mississippi Durant(L)Missouri Eureka(L)Tennessee LaVergne(L)Tennessee Sparta(O)Belgium Genk(L)Brazil Camacari, Bahia(L)France Aubergenville(L)France Blainville(L)France Brebieres(L)France Carvin(O)France Gondecourt(O)France Noyal-Chatillon-sur-Seiche(L)France Oyonnax(L)France Rougegoutte(O)Germany Berlin(L)Poland Swarzedz(L)Slovakia Nitra(L)South Korea Choongnam, Asan(O)South Korea Kangse-gu, Busan-si(L)South Korea Kangse-gu, Busan-si(L)South Korea Shinam-myon, Yesan-gun,
Choongnam(O)South Korea Ulsan-si, Ulsan(O)Spain Almussafes, Valencia(L)Spain Barcelona(L)Spain Igualada(O)Spain Medina de Rioseco,
Valladolid(O)Spain Pontevedra(O)Thailand Amphur Pluakdaeng,
Rayong(O)Thailand Bangsaothoong,
Samutprakam(L)United Kingdom Enfield, Middlesex(L)United Kingdom Enfield, Middlesex(L)United Kingdom Liverpool(L)
Climate
Alabama Shorter(L)Indiana Connersville(O)Argentina General Pacheco, Buenos
Aires(O)Argentina Quilmes, Buenos Aires(O)Argentina Rio Grande, Terra del
Fuego(O)Canada Belleville, Ontario(O)China Chongqing(L)China Chongqing(L)China Nanchang, Jiangxi
Province(O)China Beijing(L)France Charleville, Mezieres
Cedex(O)India Chennai(L)India Bhiwadi(L)India Maharashtra(L)Mexico Juarez, Chihuahua(O)Mexico Juarez, Chihuahua(L)Mexico Juarez, Chihuahua(L)Portugal Palmela(O)Slovakia Dubnica(L)South Africa Port Elizabeth(L)South Korea Pyungtaek(O)South Korea Namgo, Ulsan(O)South Korea Taedok-Gu, Taejon(O)Thailand Amphur Pluakdaeng,
Rayong(O)Turkey Gebze, Kocaeli(L)United Kingdom Basildon(O)
20

ITEM 2. PROPERTIES — (Continued)
Electronics
Pennsylvania Lansdale(L)Brazil Guarulhos, Sao Paulo(O)Brazil Manaus, Amazonas(L)Czech Republic Hluk(O)Czech Republic Novy Jiein(O)Czech Republic Rychvald(O)Hungary Szekesfehervar(O)Japan Higashi, Hiroshima(O)Mexico Apodaca, Nuevo Leon(O)Mexico Apodaca, Nuevo Leon(O)Mexico Chihuahua, Chihuahua(L)Portugal Palmela(O)Spain Cadiz(O)
Other
Indiana Bedford(O)Missouri Concordia(L)Ohio Springfield(L)Germany Emden, Niedersachsen(L)Germany Glauchau, North Rhine
Westfalia(L)Mexico Tamaulipas, Reynosa(L)Philippines Santa Rosa, Laguna(L)United Kingdom Belfast, Northern Ireland(L)United Kingdom Swansea(O)
(O) indicates owned facilities; (L) indicates leased facilities
As of December 31, 2007, the Company also owned or leased 42 corporate and sales offices, technicaland engineering centers and customer service centers in thirteen countries around the world, 37 of whichwere leased and 5 which were owned. Although the Company believes that its facilities are suitable andadequate and have sufficient productive capacity to meet its present needs, additional facilities may beneeded to meet future needs. The majority of the Company’s facilities are operating at normal levels basedon respective capacities, with the exception of facilities that are in the process of being closed orrestructured.
In addition, the Company’s non-consolidated affiliates operate over 31 manufacturing and/or assemblylocations, primarily in the Asia Pacific region.
ITEM 3. LEGAL PROCEEDINGS
Securities and Related Matters
In February 2005, a shareholder lawsuit was filed in the U.S. District Court for the Eastern District ofMichigan against the Company and certain current and former officers of the Company. In July 2005, thePublic Employees’ Retirement System of Mississippi was appointed as lead plaintiff in this matter. InSeptember 2005, the lead plaintiff filed an amended complaint, which alleges, among other things, that theCompany and its independent registered public accounting firm, PricewaterhouseCoopers LLP, mademisleading statements of material fact or omitted to state material facts necessary in order to make thestatements made, in light of the circumstances under which they were made, not misleading. The namedplaintiff seeks to represent a class consisting of purchasers of the Company’s securities during the periodbetween June 28, 2000 and January 31, 2005. Class action status has not yet been certified in thislitigation. On August 31, 2006, the defendants motion to dismiss the amended complaint for failure to statea claim was granted. The plaintiffs have appealed this decision.
21

ITEM 3. LEGAL PROCEEDINGS — (Continued)
In March 2005, a number of current and former directors and officers were named as defendants in twoshareholder derivative suits pending in the State of Michigan Circuit Court for the County of Wayne. As iscustomary in derivative suits, the Company has been named as a defendant in these actions. As a nominaldefendant, the Company is not liable for any damages in these suits nor is any specific relief sought againstthe Company. The complaints allege that, among other things, the individual defendants breached theirfiduciary duties of good faith and loyalty and aided and abetted such breaches during the period betweenJanuary 23, 2004 and January 31, 2005 in connection with the Company’s conduct concerning, amongother things, the matters alleged in the securities class action discussed immediately above. OnFebruary 15, 2008 the Court approved the settlement of the shareholder derivative suits and orderedtheir dismissal with prejudice. Pursuant to the settlement, the Company will, among other things, pay forthe defendants’ attorneys’ fees and expenses in the amount of $250,000.
The Company and its current and former directors and officers intend to contest the foregoing lawsuitvigorously. However, at this time the Company is not able to predict with certainty the final outcome of theforegoing lawsuit or its potential exposure with respect to such lawsuit. In the event of an unfavorableresolution of these matters, the Company’s financial results and cash flows in one or more periods could bematerially affected to the extent any such loss is not covered by insurance or applicable reserves.
Other Matters
Various other legal actions, governmental investigations and proceedings and claims are pending or maybe instituted or asserted in the future against the Company, including those arising out of alleged defects inthe Company’s products; governmental regulations relating to safety; employment-related matters;customer, supplier and other contractual relationships; intellectual property rights; product warranties;product recalls; and environmental matters. Some of the foregoing matters may involve compensatory,punitive or antitrust or other treble damage claims in very large amounts, or demands for recall campaigns,environmental remediation programs, sanctions, or other relief which, if granted, would require very largeexpenditures.
Litigation is subject to many uncertainties, and the outcome of individual litigated matters is not predictablewith assurance. Reserves have been established by the Company for matters discussed in theimmediately foregoing paragraph where losses are deemed probable and reasonably estimable. It ispossible, however, that some of the matters discussed in the foregoing paragraph could be decidedunfavorably to the Company and could require the Company to pay damages or make other expendituresin amounts, or a range of amounts, that cannot be estimated at December 31, 2007 and that are in excessof established reserves. The Company does not reasonably expect, except as otherwise described herein,based on its analysis, that any adverse outcome from such matters would have a material effect on theCompany’s financial condition, results of operations or cash flows, although such an outcome is possible.
ITEM 4. SUBMISSION OF MATTERS TO A VOTE OF SECURITY HOLDERS
None.
22

ITEM 4A. EXECUTIVE OFFICERS OF VISTEON
The following table shows information about the executive officers of the Company. All ages are as ofFebruary 15, 2008:
Name Age Position
Michael F. Johnston. . . . . . . . . . . . . . 60 Chairman and Chief Executive OfficerDonald J. Stebbins . . . . . . . . . . . . . . 50 President and Chief Operating OfficerWilliam G. Quigley III . . . . . . . . . . . . . 46 Executive Vice President and Chief Financial OfficerJohn Donofrio . . . . . . . . . . . . . . . . . . 46 Senior Vice President and General CounselRobert Pallash. . . . . . . . . . . . . . . . . . 56 Senior Vice President and President, Global Customer
GroupDorothy L. Stephenson . . . . . . . . . . . 58 Senior Vice President, Human ResourcesTerrence G. Gohl . . . . . . . . . . . . . . . . 46 Vice President, Interiors, Lighting & Global
Manufacturing OperationsJoy M. Greenway. . . . . . . . . . . . . . . . 47 Vice President, Climate Product GroupSteve Meszaros. . . . . . . . . . . . . . . . . 44 Vice President, Electronics Product GroupMichael J. Widgren . . . . . . . . . . . . . . 39 Vice President, Corporate Controller and Chief
Accounting Officer
Michael F. Johnston has been Visteon’s Chairman of the Board and Chief Executive Officer sinceJune 2005, and a member of the Board of Directors since May 2002. Prior to that, he was ChiefExecutive Officer and President since July 2004, and President and Chief Operating Officer sincejoining the Company in September 2000. Mr. Johnston is also a director of Flowserve Corporation andWhirlpool Corporation.
Donald J. Stebbins has been Visteon’s President and Chief Operating Officer since joining the Company inMay 2005, and a member of the Board of Directors since December 2006. Before joining Visteon,Mr. Stebbins served as President and Chief Operating Officer of operations in Europe, Asia and Africa forLear Corporation since August 2004 and prior to that he was President and Chief Operating Officer ofLear’s operations in the Americas since September 2001. Mr. Stebbins is also a director of WABCOHoldings.
William G. Quigley III has been Visteon’s Executive Vice President and Chief Financial Officer sinceNovember 2007. Prior to that he was Senior Vice President and Chief Financial Officer since March 2007and Vice President, Corporate Controller and Chief Accounting Officer since joining the company inDecember 2004. Before joining Visteon, he was Vice President and Controller — Chief Accounting Officerof Federal-Mogul Corporation since June 2001.
John Donofrio has been Visteon’s Senior Vice President and General Counsel since joining the Companyin June 2005. Before joining Visteon, he was Vice President and General Counsel, Honeywell Aerospaceof Honeywell International since 2000, where he also served as Vice President and Deputy GeneralCounsel of Honeywell International from 1996 through 2005. Prior to that he was a partner at the law firm,Kirkland & Ellis LLP. Mr. Donofrio is also a director of FARO Technologies, Inc.
Robert C. Pallash has been Visteon’s Senior Vice President and President, Global Customer Group sinceJanuary 2008 and Senior Vice President, Asia Customer Group since August 2005. Prior to that, he wasVice President and President, Asia Pacific since July 2004, and Vice President, Asia Pacific since joiningthe Company in September 2001. Before joining Visteon, Mr. Pallash served as president of TRWAutomotive Japan since 1999, and president of Lucas Varity Japan prior thereto.
Dorothy L. Stephenson has been Visteon’s Senior Vice President, Human Resources since joining theCompany in May 2006. Prior to that, she was a human resources consultant since May 2003, and VicePresident, Human Resources for Bethlehem Steel prior thereto.
23

ITEM 4A. EXECUTIVE OFFICERS OF VISTEON — (Continued)
Terrence G. Gohl has been Visteon’s Vice President of Interiors, Lighting and Global ManufacturingOperations since July 2007. Prior to that he was Vice President, Global Manufacturing Operations, Quality,MP&L and Business Practices since October 2005, and Vice President, North America ManufacturingOperations since joining the Company in August 2005. Before joining Visteon, Mr. Gohl served as SeniorVice President of North American Operations for Tower Automotive since August 2004, and VicePresident, North American Operations for Lear Corporation since 2001.
Joy M. Greenway has been Visteon’s Vice President, Climate Product Group since August 2005. Prior tothat, she was Director, Powertrain since March 2002, and Director of Visteon’s Ford truck customerbusiness group since April 2001. She joined Visteon in 2000 as Director of Fuel Storage and DeliveryStrategic Business Unit.
Steve Meszaros has been Visteon’s Vice President, Electronics Product Group since August 2005. Prior tothat, he was Managing Director, China Operations and General Manager, Yanfeng Visteon sinceFebruary 2001. Prior to that, he was based in Europe, where he was responsible for Visteon’s interiorsystems business in the United Kingdom and Germany since 1999.
Michael J. Widgren has been Visteon’s Vice President, Corporate Controller and Chief Accounting Officersince May 2007. Prior to that, he was Assistant Corporate Controller since joining the Company inOctober 2005. Before joining Visteon, Mr. Widgren served as Chief Accounting Officer for Federal-MogulCorporation.
PART II
ITEM 5. MARKET FOR REGISTRANT’S COMMON EQUITY, RELATED STOCKHOLDERMATTERS AND ISSUER PURCHASES OF EQUITY SECURITIES
The Company’s common stock is listed on the New York Stock Exchange in the United States under thesymbol “VC.” As of February 15, 2008, the Company had 129,650,038 shares of its common stock$1.00 par value outstanding, which were owned by 97,950 shareholders of record. The table below showsthe high and low sales prices for the Company’s common stock as reported by the New York StockExchange for each quarterly period for the last two years.
FirstQuarter
SecondQuarter
ThirdQuarter
FourthQuarter
2007
Common stock price per shareHigh. . . . . . . . . . . . . . . . . . . . . . . . . . . . . . . . . . . . . . . . . . . . $9.24 $10.08 $8.08 $6.35Low . . . . . . . . . . . . . . . . . . . . . . . . . . . . . . . . . . . . . . . . . . . . $7.56 $ 7.53 $4.66 $3.84
FirstQuarter
SecondQuarter
ThirdQuarter
FourthQuarter
2006
Common stock price per shareHigh . . . . . . . . . . . . . . . . . . . . . . . . . . . . . . . . . . . . . . . . . . . . $6.84 $7.93 $9.99 $8.60Low . . . . . . . . . . . . . . . . . . . . . . . . . . . . . . . . . . . . . . . . . . . . $4.28 $4.07 $6.53 $7.26
24

ITEM 5. MARKET FOR REGISTRANT’S COMMON EQUITY, RELATED STOCKHOLDERMATTERS AND ISSUER PURCHASES OF EQUITY SECURITIES — (Continued)
On February 9, 2005, the Company’s Board of Directors suspended the Company’s quarterly cashdividend on its common stock. Accordingly, no dividends were paid by the Company during the yearsended December 31, 2007 or 2006. The Board evaluates the Company’s dividend policy based on allrelevant factors. The Company’s credit agreements limit the amount of cash payments for dividends thatmay be made. Additionally, the ability of the Company’s subsidiaries to transfer assets is subject to variousrestrictions, including regulatory requirements and governmental restraints. Refer to Note 11,“Non-Consolidated Affiliates,” to the Company’s consolidated financial statements included in Item 8 ofthis Annual Report on Form 10-K.
The following table summarizes information relating to purchases made by or on behalf of the Company, oran affiliated purchaser, of shares of Visteon common stock during the fourth quarter of 2007.
Issuer Purchases of Equity Securities
Period
TotalNumber of
Shares (or Units)Purchased(1)
AveragePrice Paidper Share(or Unit)
Total Numberof Shares (or Units)Purchased as Part
of PubliclyAnnounced Plans
or Programs
Maximum Number(or Approximate
Dollar Value)of Shares (or Units)
that May Yet BePurchased Under the
Plans or Programs
October 1, 2007 toOctober 31, 2007 . . . . . . . . . — $ — — —
November 1, 2007 toNovember 30, 2007 . . . . . . . — — — —
December 1, 2007 toDecember 31, 2007 . . . . . . . 150,770 4.26 150,000 1,850,000
Total. . . . . . . . . . . . . . . . . . . . . 150,770 $4.26 150,000 1,850,000
(1) This column includes 770 shares surrendered to the Company by employees to satisfy tax withholding obligations in connectionwith the vesting of restricted share awards made pursuant to the Visteon Corporation 2004 Incentive Plan. This column alsoincludes 150,000 shares purchased in the open market pursuant to a publicly announced program approved by the Board ofDirectors on December 12, 2007, which authorized the purchase of up to 2 million shares of the Company’s common stock duringthe subsequent 24 months to be used solely to satisfy obligations under the Company’s employee benefit programs.
25

ITEM 5. MARKET FOR REGISTRANT’S COMMON EQUITY, RELATED STOCKHOLDERMATTERS AND ISSUER PURCHASES OF EQUITY SECURITIES — (Continued)
The following information in Item 5 is not deemed to be “soliciting material” or be “filed” with the SEC orsubject to Regulation 14A or 14C under the Securities Exchange Act of 1934 (“Exchange Act”) or to theliabilities of Section 18 of the Exchange Act, and will not be deemed to be incorporated by reference intoany filing under the Securities Act of 1933 or the Exchange Act, except to the extent the Companyspecifically incorporates it by reference into such a filing.
The following graph compares the cumulative total return on the Company’s common stock over a five yearperiod with the cumulative total return on the Standard and Poor’s 500 Composite Index and the Standardand Poor’s Supercomposite Auto Parts & Equipment Index. For comparison purposes, we have alsoincluded in the accompanying graph a Peer Group Index that Visteon developed and used in the precedingfiscal year. The Peer Group Index is comprised of ArvinMeritor, Inc., American Axle & ManufacturingHoldings, Inc., Borg-Warner Automotive, Inc., Johnson Controls, Inc., Lear Corporation and MagnaInternational, Inc.
The graph assumes an initial investment of $100 and reinvestment of cash dividends. The comparisons inthis table are required by the Securities and Exchange Commission and are not intended to forecast or beindicative of possible future performance of the Company’s common stock or the referenced indices.
Comparison of Five-Year Cumulative Total Return
$-
$50
$100
$150
$200
12/31/02 12/31/03 12/31/04 12/31/05 12/31/06 12/31/07
S&P 500Visteon S&P Auto Parts Peer Group
2002 2003 2004 2005 2006 2007
December 31
Visteon Corporation . . . . . . . . . $100.00 $153.02 $147.14 $ 94.28 $127.71 $ 66.11S&P 500 . . . . . . . . . . . . . . . . . . 100.00 128.42 142.20 149.10 172.37 181.83S&P 500 Auto Parts . . . . . . . . . 100.00 146.46 147.61 118.00 123.76 150.21Peer Group . . . . . . . . . . . . . . . . 100.00 125.55 132.61 125.39 144.19 178.40
26

ITEM 6. SELECTED FINANCIAL DATA
The following table presents information from the Company’s consolidated financial statements for each ofthe five years ended December 31, 2007. This information should be read in conjunction with“Management’s Discussion and Analysis of Financial Condition and Results of Operations” and“Financial Statements and Supplementary Data” included under Items 7 and 8, respectively, of thisAnnual Report on Form 10-K.
2007 2006 2005 2004 2003(Dollars in Millions,
Except Per Share Amounts and Percentages)
Statement of Operations DataNet sales . . . . . . . . . . . . . . . . . . . . . . . . . . . . $11,266 $11,253 $16,750 $18,354 $17,374Gross margin . . . . . . . . . . . . . . . . . . . . . . . . . 573 753 544 882 565Net loss from continuing operations before
change in accounting and extraordinaryitem . . . . . . . . . . . . . . . . . . . . . . . . . . . . . . (348) (145) (262) (1,537) (1,102)
(Loss) income from discontinued operations,net of tax . . . . . . . . . . . . . . . . . . . . . . . . . . (24) (22) (8) 1 (127)
Net loss before change in accounting andextraordinary item . . . . . . . . . . . . . . . . . . . . (372) (167) (270) (1,536) (1,229)
Cumulative effect of change in accounting,net of tax . . . . . . . . . . . . . . . . . . . . . . . . . . — (4) — — —
Net loss before extraordinary item . . . . . . . . . (372) (171) (270) (1,536) (1,229)Extraordinary item, net of tax . . . . . . . . . . . . . — 8 — — —
Net loss . . . . . . . . . . . . . . . . . . . . . . . . . . . . . $ (372) $ (163) $ (270) $ (1,536) $ (1,229)
Basic and diluted per share data:Loss from continuing operations before
change in accounting and extraordinaryitem . . . . . . . . . . . . . . . . . . . . . . . . . . . . . . $ (2.69) $ (1.13) $ (2.08) $ (12.27) $ (8.76)
(Loss) income from discontinued operations,net of tax . . . . . . . . . . . . . . . . . . . . . . . . . . (0.18) (0.17) (0.06) 0.01 (1.01)
Loss before change in accounting andextraordinary item . . . . . . . . . . . . . . . . . . . . (2.87) (1.30) (2.14) $ (12.26) (9.77)
Cumulative effect of change in accounting,net of tax . . . . . . . . . . . . . . . . . . . . . . . . . . — (0.03) — — —
Loss before extraordinary item . . . . . . . . . . . . (2.87) (1.33) (2.14) (12.26) (9.77)Extraordinary item, net of tax . . . . . . . . . . . . . — 0.06 — — —
Basic and diluted loss per share . . . . . . . . . $ (2.87) $ (1.27) $ (2.14) $ (12.26) $ (9.77)
Cash dividends per share . . . . . . . . . . . . . . . . $ — $ — $ — $ 0.24 $ 0.24Balance Sheet DataTotal assets . . . . . . . . . . . . . . . . . . . . . . . . . . $ 7,205 $ 6,938 $ 6,736 $10,292 $11,024Total debt . . . . . . . . . . . . . . . . . . . . . . . . . . . . $ 2,840 $ 2,228 $ 1,994 $ 2,021 $ 1,818Total (deficit)/equity . . . . . . . . . . . . . . . . . . . . . $ (90) $ (188) $ (48) $ 320 $ 1,812Statement of Cash Flows DataCash provided from operating activities. . . . . . $ 293 $ 281 $ 417 $ 418 $ 363Cash used by investing activities . . . . . . . . . . $ (177) $ (337) $ (231) $ (782) $ (781)Cash provided from (used by) financing
activities . . . . . . . . . . . . . . . . . . . . . . . . . . . $ 547 $ 214 $ (51) $ 135 $ 128
27

ITEM 7. MANAGEMENT’S DISCUSSION AND ANALYSIS OF FINANCIAL CONDITION ANDRESULTS OF OPERATIONS
Management’s Discussion and Analysis (“MD&A”) is intended to help the reader understand the results ofoperations, financial condition, and cash flows of Visteon Corporation (“Visteon” or the “Company”).MD&A is provided as a supplement to, and should be read in conjunction with, the Company’s consolidatedfinancial statements and related notes appearing in Item 8 of this Annual Report on Form 10-K.
Description of the Business
Visteon is a leading global supplier of climate, interiors, electronics and other automotive systems,modules and components to vehicle manufacturers as well as the automotive aftermarket. TheCompany sells to the world’s largest vehicle manufacturers including BMW, Chrysler LLC, Daimler AG,Ford, General Motors, Honda, Hyundia/Kia, Nissan, PSA Peugeot Citroën, Renault, Toyota andVolkswagen. The Company has a broad network of manufacturing, technical engineering and jointventure operations throughout the world, supported by approximately 41,500 employees dedicated tothe design, development, manufacture and support of its product offering and its global customers.
Visteon was incorporated in Delaware in January 2000 as a wholly-owned subsidiary of Ford MotorCompany (“Ford” or “Ford Motor Company”). Subsequently, Ford transferred the assets and liabilitiescomprising its automotive components and systems business to Visteon. The Company separated fromFord on June 28, 2000 when all of the Company’s common stock was distributed by Ford to itsshareholders.
On May 24, 2005, the Company and Ford entered into a non-binding Memorandum of Understanding(“MOU”), setting forth a framework for the transfer of 23 North American facilities and related assets andliabilities (the “Business”) to a Ford-controlled entity. In September 2005, the Company and Ford enteredinto several definitive agreements, and the Company completed the transfer of the Business to AutomotiveComponents Holdings, LLC (“ACH”), an indirect, wholly-owned subsidiary of the Company.
On June 30, 2005, following the signing of the MOU, the Company classified the manufacturing facilitiesand associated assets, including inventory, machinery, equipment and tooling, to be sold as “held for sale.”The liabilities to be assumed or forgiven by Ford pursuant to the MOU, including employee liabilities andpostemployment benefits payable to Ford, were classified as “Liabilities associated with assets held forsale” in the Company’s consolidated balance sheet following the signing of the MOU. Statement ofFinancial Accounting Standards No. 144 (“SFAS 144”), “Accounting for the Impairment or Disposal ofLong-Lived Assets,” requires long-lived assets that are considered “held for sale” to be measured at thelower of their carrying value or fair value less cost to sell and future depreciation of such assets is ceased.During the second quarter of 2005, the Company recorded a non-cash impairment charge of $920 millionto write-down those assets considered “held for sale” to their aggregate estimated fair value less cost tosell. Fair values were determined primarily based on prices for similar groups of assets determined bythird-party valuation firms and management estimates.
On October 1, 2005, Visteon sold ACH to Ford for cash proceeds of approximately $300 million, as well asforgiveness of certain other postretirement employee benefit (“OPEB”) liabilities and other obligationsrelating to hourly employees associated with the Business, and the assumption of certain other liabilitieswith respect to the Business (together, the “ACH Transactions”). Additionally, on October 1, 2005, Fordacquired from the Company warrants to acquire 25 million shares of the Company’s common stock andagreed to provide $550 million to be used in the Company’s further restructuring.
The Business accounted for approximately $6.1 billion of the Company’s total 2005 product sales, themajority being products sold to Ford. Also, the transferred facilities included all of the Company’s plantsthat leased hourly workers covered by Ford’s Master Agreement with the UAW. The ACH Transactionsaddressed certain strategic and structural challenges of the business, although the Company expectsadditional restructuring activities and business improvement actions will be needed in the foreseeablefuture for the Company to achieve sustainable success in an increasingly challenging environment.
28

ITEM 7. MANAGEMENT’S DISCUSSION AND ANALYSIS OF FINANCIAL CONDITION ANDRESULTS OF OPERATIONS — (Continued)
Business Strategy
By leveraging the Company’s extensive experience, innovative technology and geographic strengths, theCompany aims to grow leading positions in its key climate, interiors and electronics product groups and toimprove overall margins, long-term operating profitability and cash flows. To achieve these goals andrespond to industry factors and trends, the Company is working to restructure its business, improve itsoperations and achieve profitable growth. Visteon has embarked upon a multi-phase, multi-year plan toimplement this strategy.
• Restructure the business — The Company remains focused on executing its previously announcedmulti-year improvement plan designed to address under performing and non-strategic operations,reducing overhead cost structure and improving efficiency. As the Company executes its multi-yearimprovement plan, certain administrative functions are also being fundamentally reorganized toeffectively and efficiently support the Company’s restructured business. Additionally, the Companycontinues to reduce engineering costs through relocation of its engineering capability to morecompetitive cost locations.
• Improve operations — The Company continues to take actions to improve its operations by lowering itsmanufacturing costs, increasing its focus on production utilization and related investment, closure andconsolidation of facilities and relocation of production to lower cost environments to take furtheradvantage of its global manufacturing footprint. The Company is also working to improve productquality and the health and safety of employees. Processes and standards continue to be implemented toprevent the occurrence of non-conforming production as measured by various industry standard qualityratings such as defective parts per million. Additionally, the Company continues to implement programs,training and awareness in all of its operations to limit safety related incidents and to improve lost timecase rates.
• Grow the business — The Company is well positioned to achieve profitable growth on a global basis andhas focused its resources to achieve growth in core climate, electronics and interiors products. TheCompany is focused on further diversifying its customer base, leveraging its expansive global footprint,offering innovative technologies and solutions, and providing world class engineering support tocustomers. The Company believes there are opportunities to capitalize on the continuing demandfor additional electronics integration and associated products with its product portfolio and technicalcapabilities. Although Ford remains the Company’s largest customer, the Company has been steadilydiversifying its sales with growing OEMs and is well positioned globally with capabilities in every majorgeographic region in the world, including a significant presence in emerging markets in Asia.
Organizational Structure
The Company views its organizational structure as an important enabler of its business strategy.Accordingly, and in late 2005, the Company announced a new operating structure to manage thebusiness following the ACH Transactions. The new organizational structure was designed to achieve aglobal product focus and a regional customer focus. The global product focus is achieved through aproduct group structure which provides for financial and operating responsibility over the design,development and manufacture of the Company’s product portfolio. The regional customer focus isachieved through a customer group structure, which provides for the marketing, sales and service ofthe Company’s product portfolio to its customer base. Additionally, certain functions such as procurement,information technology and other administrative activities are managed on a global basis with regionaldeployment.
In 2006 the Company completed the process of realigning systems and reporting structures to facilitatefinancial reporting under the revised organizational structure. The Company’s global product groups as ofDecember 31, 2007 are as follows:
29
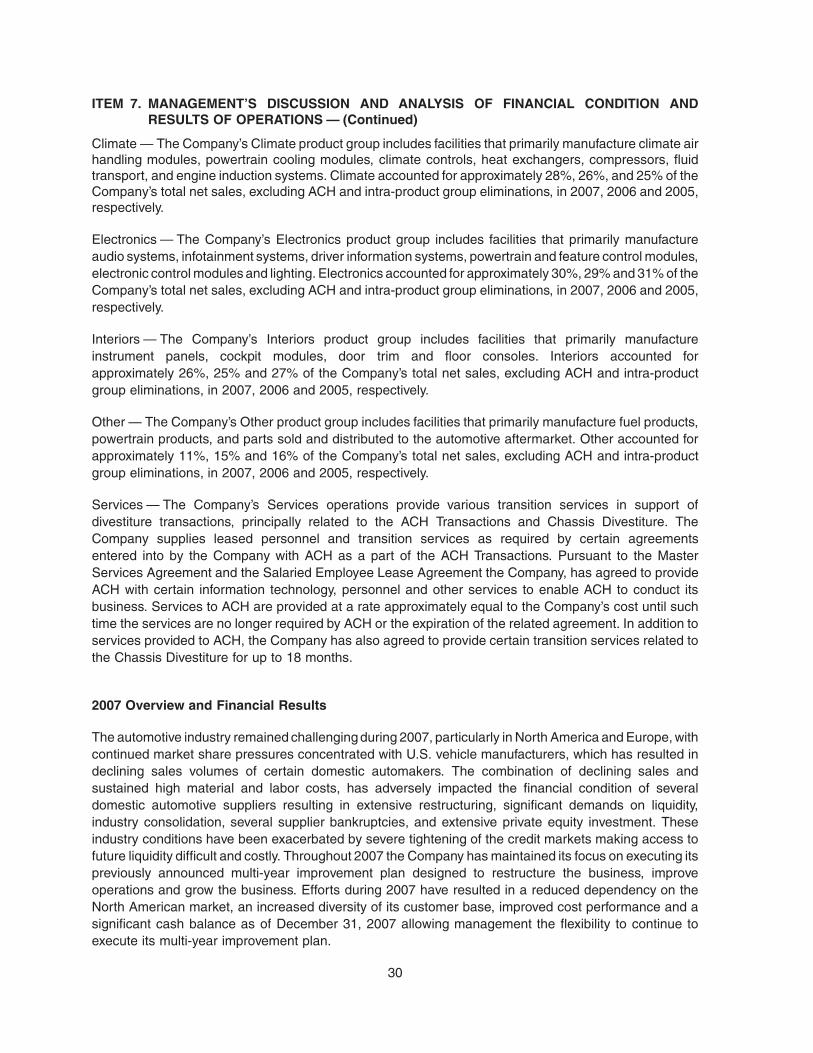
ITEM 7. MANAGEMENT’S DISCUSSION AND ANALYSIS OF FINANCIAL CONDITION ANDRESULTS OF OPERATIONS — (Continued)
Climate — The Company’s Climate product group includes facilities that primarily manufacture climate airhandling modules, powertrain cooling modules, climate controls, heat exchangers, compressors, fluidtransport, and engine induction systems. Climate accounted for approximately 28%, 26%, and 25% of theCompany’s total net sales, excluding ACH and intra-product group eliminations, in 2007, 2006 and 2005,respectively.
Electronics — The Company’s Electronics product group includes facilities that primarily manufactureaudio systems, infotainment systems, driver information systems, powertrain and feature control modules,electronic control modules and lighting. Electronics accounted for approximately 30%, 29% and 31% of theCompany’s total net sales, excluding ACH and intra-product group eliminations, in 2007, 2006 and 2005,respectively.
Interiors — The Company’s Interiors product group includes facilities that primarily manufactureinstrument panels, cockpit modules, door trim and floor consoles. Interiors accounted forapproximately 26%, 25% and 27% of the Company’s total net sales, excluding ACH and intra-productgroup eliminations, in 2007, 2006 and 2005, respectively.
Other — The Company’s Other product group includes facilities that primarily manufacture fuel products,powertrain products, and parts sold and distributed to the automotive aftermarket. Other accounted forapproximately 11%, 15% and 16% of the Company’s total net sales, excluding ACH and intra-productgroup eliminations, in 2007, 2006 and 2005, respectively.
Services — The Company’s Services operations provide various transition services in support ofdivestiture transactions, principally related to the ACH Transactions and Chassis Divestiture. TheCompany supplies leased personnel and transition services as required by certain agreementsentered into by the Company with ACH as a part of the ACH Transactions. Pursuant to the MasterServices Agreement and the Salaried Employee Lease Agreement the Company, has agreed to provideACH with certain information technology, personnel and other services to enable ACH to conduct itsbusiness. Services to ACH are provided at a rate approximately equal to the Company’s cost until suchtime the services are no longer required by ACH or the expiration of the related agreement. In addition toservices provided to ACH, the Company has also agreed to provide certain transition services related tothe Chassis Divestiture for up to 18 months.
2007 Overview and Financial Results
The automotive industry remained challenging during 2007, particularly in North America and Europe, withcontinued market share pressures concentrated with U.S. vehicle manufacturers, which has resulted indeclining sales volumes of certain domestic automakers. The combination of declining sales andsustained high material and labor costs, has adversely impacted the financial condition of severaldomestic automotive suppliers resulting in extensive restructuring, significant demands on liquidity,industry consolidation, several supplier bankruptcies, and extensive private equity investment. Theseindustry conditions have been exacerbated by severe tightening of the credit markets making access tofuture liquidity difficult and costly. Throughout 2007 the Company has maintained its focus on executing itspreviously announced multi-year improvement plan designed to restructure the business, improveoperations and grow the business. Efforts during 2007 have resulted in a reduced dependency on theNorth American market, an increased diversity of its customer base, improved cost performance and asignificant cash balance as of December 31, 2007 allowing management the flexibility to continue toexecute its multi-year improvement plan.
30

ITEM 7. MANAGEMENT’S DISCUSSION AND ANALYSIS OF FINANCIAL CONDITION ANDRESULTS OF OPERATIONS — (Continued)
In connection with the multi-year improvement plan, the Company identified 30 facilities for closure,divestiture or other actions designed to improve operations and profitability. During 2007 the Companycompleted the closure of 3 facilities and completed the sale of 4 facilities. The Company also continued toimplement actions designed to fundamentally reorganize and streamline its administrative functions andreduce the related cost, including resource relocation to more competitive cost locations. The percentageof the Company’s manufacturing headcount and engineering headcount in high cost geographiesdecreased by approximately 20% and 16%, respectively, during 2007.
Improvements to the Company’s base operations are focused on improving product quality, improving thehealth and safety of employees and improving investment efficiency. The Company continued to makeprogress in these areas as evidenced by improvements in key metrics during 2007 including qualityperformance as measured in defective parts per million, which improved by 38% and safety performanceas measured in lost time case rates, which improved by 29%.
Efforts to grow the business during 2007 resulted in about $1 billion of new business wins, which marks thesecond consecutive year the Company has achieved this level. The Company’s new business wins for2007 include 40% attributable to the Climate product group, 38% attributable to the Interiors product groupand 22% attributable to the Electronics product group. Geographically, 25% of the new businesswins are inAsia, while the remaining 75% is evenly split between North America and Europe.
While the Company continues its efforts to improve its operations, restructure its business, and achieveprofitable growth, there can be no assurances that the results of these efforts alone will be sufficient toaddress the impact of current industry and market trends. The Company will continue to monitor suchindustry and market trends taking action as necessary, including, but not limited to, additional restructuringactivities and global capacity rationalization.
The Company’s product sales for 2007 were adversely affected by a decline in Ford North Americaproduction volume of approximately 192,000 units or 6%, and year-over-year production declines ofcertain Nissan vehicles produced for the North American market. These pressures were partially offset byan increase in Ford Europe production volumes and new business launches and continued growth in theCompany’s Asia Pacific operations.
In addition to the vehicle production volume declines, the Company’s gross margin during 2007 was alsoadversely affected by the impact of unfavorable vehicle and product mix, weakening aftermarket businessin North America and the performance of certain Western European manufacturing facilities, partiallyoffset by manufacturing efficiencies and savings associated with the Company’s ongoing restructuringactivities.
The Company generated $293 million of cash from operating activities during 2007. The Company alsosecured additional financing of approximately $640 million during 2007, including an additional $500million seven year term loan and the issuance of two separate unsecured bonds due November 27, 2009and 2010 through its 70% owned subsidiary Halla Climate Control Corporation. As of December 31, 2007the Company had total cash balances of approximately $1.8 billion.
31

ITEM 7. MANAGEMENT’S DISCUSSION AND ANALYSIS OF FINANCIAL CONDITION ANDRESULTS OF OPERATIONS — (Continued)
Key financial highlights as of and for the year ended December 31, 2007 are summarized as follows(dollars in millions):
Statement of Operations DataNet sales
Products . . . . . . . . . . . . . . . . . . . . . . . . . . . . . . . . . . . . . . . . . . . . . . . . . . . . . . . $10,721Services . . . . . . . . . . . . . . . . . . . . . . . . . . . . . . . . . . . . . . . . . . . . . . . . . . . . . . . 545
11,266Gross margin . . . . . . . . . . . . . . . . . . . . . . . . . . . . . . . . . . . . . . . . . . . . . . . . . . . . . 573Selling, general and administrative expenses . . . . . . . . . . . . . . . . . . . . . . . . . . . . . 636Restructuring expenses. . . . . . . . . . . . . . . . . . . . . . . . . . . . . . . . . . . . . . . . . . . . . . 152Reimbursement from escrow account . . . . . . . . . . . . . . . . . . . . . . . . . . . . . . . . . . . 142Balance Sheet DataCash and equivalents . . . . . . . . . . . . . . . . . . . . . . . . . . . . . . . . . . . . . . . . . . . . . . . $ 1,758Total debt . . . . . . . . . . . . . . . . . . . . . . . . . . . . . . . . . . . . . . . . . . . . . . . . . . . . . . . . $ 2,840Statement of Cash Flows DataCash provided from operating activities . . . . . . . . . . . . . . . . . . . . . . . . . . . . . . . . . . $ 293Cash used by investing activities . . . . . . . . . . . . . . . . . . . . . . . . . . . . . . . . . . . . . . . $ (177)Cash provided from financing activities . . . . . . . . . . . . . . . . . . . . . . . . . . . . . . . . . . $ 547
Net Sales
The Company recorded total net sales from continuing operations of $11.3 billion, including product salesof $10.7 billion and services revenues of $545 million for the year ended December 31, 2007. Total netsales for 2007 were essentially flat when compared to 2006 and included $569 million of favorablecurrency, which was more than offset by the impact of divestitures, lower North American volumes,customer pricing and changes in vehicle mix. The Company’s sales are well balanced across its corestrategic product groups with Climate sales of $3.4 billion or 29% of total product sales, Electronics sales of$3.5 billion or 31% of total product sales and Interiors sales of $3.1 billion or 27% of total product sales.
Following the ACH Transactions, the Company’s sales have become more balanced by geographic region,with a greater percentage of product sales outside of North America. For the year endedDecember 31, 2007 the Company recorded net sales in North America of approximately $4.2 billionor 37%, Europe of approximately $4.1 billion or 36%, and Asia of approximately $3.0 billion or 27%.
Additionally, the Company’s product sales have become more diversified by customer. Although Fordremains the Company’s largest customer, the Company has been steadily diversifying its sales with otherOriginal Equipment Manufacturers (“OEM”). Product sales to Ford were $4.1 billion or 39% of total productsales for the year ended December 31, 2007 compared to $4.8 billion or 45% of total product sales for theyear December 31, 2006. Continued declines in Ford’s vehicle production could materially affect theCompany’s operating results, and the Company continues to work with other vehicle manufacturers tofurther its sales growth and diversification. During 2007, the Company was awarded new forward yearprograms across all of its product groups by other vehicle manufacturers as well as Ford. These newprograms will further diversify the Company’s sales base in future years.
32

ITEM 7. MANAGEMENT’S DISCUSSION AND ANALYSIS OF FINANCIAL CONDITION ANDRESULTS OF OPERATIONS — (Continued)
Gross Margin
The Company’s gross margin was $573 million in 2007, compared with $753 million in 2006, representinga decrease of $180 million or 24%. The decrease in gross margin was attributable to lower Ford and Nissanproduction volumes in North America and unfavorable product mix, primarily at the Company’s Electronicsfacilities, partially offset by higher Ford Europe volumes and net new business in Asia. Additionally, thenon-recurrence of 2006 cost benefits, including postretirement benefit relief resulting from the assumptionof such obligation by Ford related to Company employees transferred to Ford in connection with two ACHmanufacturing facilities, reduced gross margin. These reductions were offset by cost efficiencies achievedthrough manufacturing, purchasing, and ongoing restructuring efforts.
The Company continues to take actions to lower its manufacturing costs by increasing its focus onproduction utilization and related investment, closure and consolidation of facilities and relocation ofproduction to lower cost environments to take further advantage of its global manufacturing footprint. TheCompany has consolidated its regional purchasing activities into a global commodity driven organization toprovide increased spending leverage and to further standardize its production and related materialpurchases. The Company has increased its focus and financial discipline in the evaluation of andbidding on new customer programs to improve operating margins and continues to take actions toaddress lower margin customer programs.
Restructuring Activities
During 2007 the Company completed the closure of 3 facilities and completed the sale of 4 facilities as partof the multi-year improvement plan. Specific closure and divestiture activities during 2007 include thefollowing:
• Closed its Chicago, IL, Chesapeake, VA and Connersville, IN facilities in response to customer sourcingactions. Annual sales from these facilities were approximately $700 million.
• Completed the sale of certain chassis operations, including plants in Dueren and Wuelfrath, Germany,and Prazska, Poland (the “Chassis Divestiture”). Annual sales from these facilities were approximately$600 million, approximately 70% of which were to Ford.
• Completed the sale of Visteon Powertain Control Systems India (“VPCSI”) operation located in Chennai,India (the “VPCSI Divestiture”). Annual sales from this facility were approximately $100 million.
As of December 31, 2007, cumulatively, the Company had closed 9 facilities, had sold 6 facilities and hadcompleted other improvement actions at 3 facilities under the multi-year improvement plan. As a result ofthese actions, the Company has recognized cumulative savings of approximately $210 million since theinception of the multi-year improvement plan. The Company continues to evaluate alternative courses ofaction related to the remaining 12 facilities, including the possibility of divestiture, closure or renegotiatedcommercial and/or labor arrangements. However, there is no assurance that a transaction or otherarrangement will occur in the near term or at all. The Company’s ultimate course of action for thesefacilities will be dependent upon that which provides the greatest long-term return to shareholders.
As the Company executes its multi-year improvement plan, related general and administrative functionsare being fundamentally reorganized to effectively and efficiently support the Company’s restructuredbusiness. Additionally, the Company continues to reduce engineering costs through relocation of itsengineering capability to more competitive cost locations. Throughout 2007, the Company continued toundertake administrative and engineering related restructuring activities to further reduce such costs.
33

ITEM 7. MANAGEMENT’S DISCUSSION AND ANALYSIS OF FINANCIAL CONDITION ANDRESULTS OF OPERATIONS — (Continued)
The Company has incurred $275 million in cumulative restructuring costs related to the multi-yearimprovement plan including $97 million, $90 million, $58 million and $30 million for the Other,Interiors, Climate and Electronics product groups, respectively. The Company estimates that the totalcash cost associated with the multi-year improvement plan will be approximately $555 million. However,the Company continues to achieve targeted reductions at a lower cost than anticipated due to higher levelsof employee attrition and lower per employee benefits resulting from changes to certain employee benefitplans. The Company expects that approximately $420 million of cash costs incurred under the multi-yearimprovement plan will be reimbursed from the escrow account pursuant to the terms of the EscrowAgreement. It is possible that actual cash restructuring costs could vary significantly from the Company’sestimates resulting in unexpected costs in future periods. Generally, charges are recorded as elements ofthe plan are finalized and the timing of activities and the amount of related costs are not likely to change.
While the Company continues its efforts to improve its operations, restructure its business, and achieveprofitable growth, there can be no assurances that the results of these efforts alone will be sufficient toaddress the impact of current industry and market trends. The Company will continue to monitor suchindustry and market trends taking action as necessary, including, but not limited to, additional restructuringactivities and global capacity rationalization.
Liquidity, Debt and Capital Structure
The Company monitors and evaluates its debt and capital structure on an ongoing basis and inconsideration of liquidity needs and capital market conditions enters into transactions designed toenhance liquidity, improve financial flexibility and reduce associated costs of capital. As ofDecember 31, 2007, the Company had cash balances totaling $1.8 billion compared to $1.1 billion asof December 31, 2006. The increase of $700 million is primarily attributable to an increase in debt related totwo significant borrowing transactions during 2007.
On November 27, 2007, the Company’s 70% owned subsidiary, Halla Climate Control Corporation(“HCCC”), issued two separate unsecured bonds due November 27, 2009 (Korean Won 60 billion)and due November 27, 2010 (Korean Won 70 billion) for total proceeds of Korean Won 130 million orapproximately $139 million. The proceeds from these bond issuances, combined with existing cashbalances, were used to subscribe for an ownership interest in a newly formed Korean company that holdsinterests in certain of the Company’s climate control operations in India, China and the United States. InDecember 2007 Visteon redeemed its ownership interest in the newly formed Korean company inexchange for approximately $292 million.
On April 10, 2007, the Company entered into an agreement to amend and restate its Credit Agreement(“Amended Credit Agreement”) to provide an additional $500 million seven-year term loan. Consistent withthe existing $1 billion seven-year term loan, the additional $500 million seven-year term loan bears interestat a Eurodollar rate plus 3% and will mature on December 13, 2013.
During 2007, the Company received cash reimbursements of $186 million for qualifying restructuringexpenses from an escrow account established pursuant to the ACH Transactions for use in the Company’sfurther restructuring. Effective in October 2007, the Company’s restructuring cost reimbursement matchwas reduced to fifty percent of qualifying expenses pursuant to the Escrow Agreement.
In addition to debt service, the Company’s cash and liquidity needs are affected by its efforts to restructurethe business, improve operations and achieve profitable growth. Accordingly, the Company continues toexplore opportunities to enhance liquidity, improve financial flexibility and reduce the long-term costs ofcapital.
34

ITEM 7. MANAGEMENT’S DISCUSSION AND ANALYSIS OF FINANCIAL CONDITION ANDRESULTS OF OPERATIONS — (Continued)
Critical Accounting Estimates
The Company’s consolidated financial statements and accompanying notes as included in Item 8 of thisAnnual Report on Form 10-K have been prepared in conformity with accounting principles generallyaccepted in the United States. Accordingly, the Company’s significant accounting policies have beendisclosed in the consolidated financial statements and accompanying notes under Note 2. The Companyprovides enhanced information that supplements such disclosures for accounting estimates when:
• The estimate involves matters that are highly uncertain at the time the accounting estimate is made; and
• Different estimates or changes to an estimate could have a material impact on the reported financialposition, changes in financial condition, or results of operations.
When more than one accounting principle, or the method of its application, is generally accepted,management selects the principle or method that it considers to be the most appropriate given thespecific circumstances. Application of these accounting principles requires the Company’s managementto make estimates about the future resolution of existing uncertainties. Estimates are typically based uponhistorical experience, current trends, contractual documentation, and other information, as appropriate.Due to the inherent uncertainty involving estimates, actual results reported in the future may differ fromthose estimates. In preparing these financial statements, management has made its best estimates andjudgments of the amounts and disclosures included in the financial statements.
Pension Plans and Other Postretirement Employee Benefit Plans
Using appropriate actuarial methods and assumptions, the Company’s defined benefit pension and non-pension postretirement employee benefit plans are accounted for in accordance with Statement ofFinancial Accounting Standards No. 87 (“SFAS 87”), “Employers’ Accounting for Pensions,” andStatement of Financial Accounting Standards No. 106 (“SFAS 106”), “Employers’ Accounting forPostretirement Benefits Other Than Pensions,” respectively, and as amended by Statement ofFinancial Accounting Standards No. 158 (“SFAS 158”), “Employers’ Accounting for Defined BenefitPension and Other Postretirement Plans.” Disability, early retirement and other postretirementemployee benefits are accounted for in accordance with Statement of Financial Accounting StandardsNo. 112 (“SFAS 112”), “Employer Accounting for Postemployment Benefits.”
The determination of the Company’s obligation and expense for its pension and other postretirementemployee benefits, such as retiree health care and life insurance, is dependent on the Company’sselection of certain assumptions used by actuaries in calculating such amounts. Selected assumptionsare described in Note 15 “Employee Retirement Benefits” to the Company’s consolidated financialstatements, which are incorporated herein by reference, including the discount rate, expected long-term rate of return on plan assets and rates of increase in compensation and health care costs.
35

ITEM 7. MANAGEMENT’S DISCUSSION AND ANALYSIS OF FINANCIAL CONDITION ANDRESULTS OF OPERATIONS — (Continued)
In accordance with accounting principles generally accepted in the United States, actual results that differfrom assumptions used are accumulated and amortized over future periods and, accordingly, generallyaffect recognized expense in future periods. Therefore, assumptions used to calculate benefit obligationsas of the annual measurement date directly impact the expense to be recognized in future periods. Theprimary assumptions affecting the Company’s accounting for employee benefits underSFAS Nos. 87, 106, 112 and 158 as of December 31, 2007 are as follows:
• Long-term rate of return on plan assets: The expected long-term rate of return is used to calculate netperiodic pension cost. The required use of the expected long-term rate of return on plan assets mayresult in recognized returns that are greater or less than the actual returns on those plan assets in anygiven year. Over time, however, the expected long-term rate of return on plan assets is designed toapproximate actual earned long-term returns. The expected long-term rate of return for pension assetshas been chosen based on various inputs, including historical returns for the different asset classes heldby the Company’s trusts and its asset allocation, as well as inputs from internal and external sourcesregarding expected capital market returns, inflation and other variables. In determining its pensionexpense for 2007, the Company used long-term rates of return on plan assets ranging from 3% to 10.6%outside the U.S. and 8% in the U.S.
Actual returns on U.S. pension assets for 2007, 2006 and 2005 were 8%, 8% and 14%, respectively,compared to the expected rate of return assumption of 8%, 8.5% and 9% respectively, for each of thoseyears. The Company’s market-related value of pension assets reflects changes in the fair value of assetsover a five-year period, with a one-third weighting to the most recent year.
• Discount rate: The discount rate is used to calculate pension and postretirement employee benefitobligations. The discount rate assumption is based on market rates for a hypothetical portfolio of high-quality corporate bonds rated Aa or better with maturities closely matched to the timing of projectedbenefit payments for each plan at its annual measurement date. The Company used discount ratesranging from 2% to 10.25% to determine its pension and other benefit obligations as ofDecember 31, 2007, including weighted average discount rates of 6.25% for U.S. pension plans,5.7% for non-U.S. pension plans, and 6.05% for postretirement employee health care and life insuranceplans.
• Health care cost trend: For postretirement employee health care plan accounting, the Companyreviews external data and Company specific historical trends for health care costs to determine thehealth care cost trend rate assumptions. In determining the projected benefit obligation forpostretirement employee health care plans as of December 31, 2007, the Company used healthcare cost trend rates of 9%, declining to an ultimate trend rate of 5.0% in 2013.
36
ITEM 7. MANAGEMENT’S DISCUSSION AND ANALYSIS OF FINANCIAL CONDITION ANDRESULTS OF OPERATIONS — (Continued)
While the Company believes that these assumptions are appropriate, significant differences in actualexperience or significant changes in these assumptions may materially affect the Company’s pension andother postretirement employee benefit obligations and its future expense. The following table illustrates thesensitivity to a change in certain assumptions for Company sponsored U.S. and non-U.S. pension plans onits 2007 funded status and 2008 pre-tax pension expense (excludes certain salaried employees that arecovered by a Ford sponsored plan):
Impact onU.S. 2008
Pre-tax PensionExpense
Impact onU.S. Plan 2007Funded Status
Impact onNon-U.S. 2008
Pre-tax PensionExpense
Impact onNon-U.S. Plan 2007
Funded Status
25 basis point decrease indiscount rate(a) . . . . . . . . . . . . +$2 million �$44 million +$4 million �$38 million
25 basis point increase indiscount rate(a) . . . . . . . . . . . . �$3 million +$41 million �$3 million +$36 million
25 basis point decrease inexpected return on assets(a) . . +$3 million +$2 million
25 basis point increase inexpected return on assets(a) . . �$3 million �$2 million
(a) Assumes all other assumptions are held constant.
The following table illustrates the sensitivity to a change in the discount rate assumption related to Visteonsponsored postretirement employee health care and life insurance plans expense (excludes certainsalaried that employees are covered by a Ford sponsored plan):
Impact on 2008Pre-tax OPEB
Expense
Impact on VisteonSponsored Plan 2007
Funded Status
25 basis point decrease in discount rate(a) . . . . . . . . . . . . . . . . . +$1 million �$13 million
25 basis point increase in discount rate(a) . . . . . . . . . . . . . . . . . . �$1 million +$12 million
(a) Assumes all other assumptions are held constant.
The following table illustrates the sensitivity to a change in the assumed health care trend rate related toVisteon sponsored postretirement employee health expense (excludes certain salaried employees thatare covered by a Ford sponsored plan):
Total Service andInterest Cost APBO
100 basis point increase in health care trend rate(a) . . . . . . . . . . . . . +$4 million +$55 million
100 basis point decrease in health care trend rate(a) . . . . . . . . . . . . . �$3 million �$47 million
(a) Assumes all other assumptions are held constant.
Effective October 1, 2005 and in connection with the ACH Transactions, Ford relieved the Company of allliabilities associated with postretirement employee health care and life insurance related obligations forVisteon-assigned Ford-UAW employees and retirees and for salaried retirees who retired prior toMay 24, 2005. The amount of benefit relief pursuant to the ACH transactions totaled $2.2 billion. TheCompany continues to have a financial obligation to Ford for the cost of providing selected health care andlife insurance benefits to certain Visteon salaried employees who retire after May 24, 2005. The health careand life insurance costs for these employees are calculated using Ford’s assumptions.
37

ITEM 7. MANAGEMENT’S DISCUSSION AND ANALYSIS OF FINANCIAL CONDITION ANDRESULTS OF OPERATIONS — (Continued)
Impairment of Long-Lived Assets and Certain Identifiable Intangibles
Statement of Financial Accounting Standards No. 144, “Accounting for the Impairment or Disposal ofLong-Lived Assets” (“SFAS 144”) requires that long-lived assets and intangible assets subject toamortization are reviewed for impairment when certain indicators of impairment are present.Impairment exists if estimated future undiscounted cash flows associated with long-lived assets arenot sufficient to recover the carrying value of such assets. Generally, when impairment exists the long-livedassets are adjusted to their respective fair values.
In assessing long-lived assets for an impairment loss, assets are grouped with other assets and liabilitiesat the lowest level for which identifiable cash flows are largely independent of the cash flows of other assetsand liabilities. Asset grouping requires a significant amount of judgment. Accordingly, facts andcircumstances will influence how asset groups are determined for impairment testing. In assessinglong-lived assets for impairment, management considered the Company’s product line portfolio,customers and related commercial agreements, labor agreements and other factors in groupingassets and liabilities at the lowest level for which identifiable cash flows are largely independent.Additionally, in determining fair value of long-lived assets, management uses appraisals, managementestimates or discounted cash flow calculations.
Product Warranty and Recall
The Company accrues for warranty obligations for products sold based on management estimates, withsupport from the Company’s sales, engineering, quality and legal functions, of the amount that eventuallywill be required to settle such obligations. This accrual is based on several factors, including contractualarrangements, past experience, current claims, production changes, industry developments and variousother considerations.
The Company accrues for product recall claims related to potential financial participation in customers’actions to provide remedies related primarily to safety concerns as a result of actual or threatenedregulatory or court actions or the Company’s determination of the potential for such actions. The Companyaccrues for recall claims for products sold based on management estimates, with support from theCompany’s engineering, quality and legal functions. Amounts accrued are based upon management’sbest estimate of the amount that will ultimately be required to settle such claims.
Environmental Matters
The Company is subject to the requirements of federal, state, local and international environmental andoccupational safety and health laws and regulations. These include laws regulating air emissions, waterdischarge and waste management. The Company is also subject to environmental laws requiring theinvestigation and cleanup of environmental contamination at properties it presently owns or operates andat third-party disposal or treatment facilities to which these sites send or arranged to send hazardouswaste.
At the time of spin-off, the Company and Ford agreed on a division of liability for, and responsibility formanagement and remediation of, environmental claims existing at that time, and, further, that theCompany would assume all liabilities for existing and future claims relating to sites that weretransferred to it and its operation of those sites, including off-site disposal, except as otherwisespecifically retained by Ford in the Master Transfer Agreement. In connection with the ACHTransactions, Ford agreed to re-assume these liabilities to the extent they arise from the ownership oroperation prior to the spin-off of the locations transferred to ACH (excluding any increase in costsattributable to the exacerbation of such liability by the Company or its affiliates).
38

ITEM 7. MANAGEMENT’S DISCUSSION AND ANALYSIS OF FINANCIAL CONDITION ANDRESULTS OF OPERATIONS — (Continued)
The Company is aware of contamination at some of its properties and relating to various third-partysuperfund sites at which the Company or its predecessor has been named as a potentially responsibleparty. The Company is in various stages of investigation and cleanup at these sites. At December 31, 2007,the Company had recorded a reserve of approximately $9 million for this environmental investigation andcleanup. However, estimating liabilities for environmental investigation and cleanup is complex anddependent upon a number of factors beyond the Company’s control and which may changedramatically. Accordingly, although the Company believes its reserve is adequate based on currentinformation, the Company cannot provide any assurance that its ultimate environmental investigation andcleanup costs and liabilities will not exceed the amount of its current reserve.
Income Taxes
The Company, which is subject to income taxes in the U.S. and numerous non-U.S. jurisdictions, accountsfor income taxes in accordance with Statement of Financial Accounting Standards No. 109, “Accountingfor Income Taxes.” Significant judgment is required in determining the Company’s worldwide provision forincome taxes, deferred tax assets and liabilities and the valuation allowance recorded against theCompany’s net deferred tax assets. Deferred tax assets and liabilities are recorded for the future taxconsequences attributable to differences between financial statement carrying amounts of existing assetsand liabilities and their respective tax bases and operating loss and tax credit carry forwards. Deferred taxassets and liabilities are measured using enacted tax rates expected to apply to taxable income in theyears in which those temporary differences are expected to be recovered or settled. The Company recordsa valuation allowance on deferred tax assets by tax jurisdiction when it is more likely than not that suchassets will not be realized. In determining the need for a valuation allowance, the historical and projectedfinancial performance of the entity recording the net deferred tax asset is considered along with any otherpertinent information.
Uncertain Tax Positions
In the ordinary course of the Company’s business, there are many transactions and calculations where theultimate tax determination is uncertain. The Company is regularly under audit by tax authorities. Accrualsfor tax contingencies are provided for in accordance with the requirements of Financial AccountingStandards Board (“FASB”) Interpretation No. 48, “Accounting for Uncertainty in Income Taxes — aninterpretation of FASB Statement No. 109” and Statement of Financial Accounting Standards No. 5“Accounting for Contingencies” where appropriate.
39

ITEM 7. MANAGEMENT’S DISCUSSION AND ANALYSIS OF FINANCIAL CONDITION ANDRESULTS OF OPERATIONS — (Continued)
Results of Operations
2007 Compared with 2006
2007 2006 Change 2007 2006 Change
Sales Gross Margin
(Dollars in Millions)
Climate . . . . . . . . . . . . . . . . . . . . . . . . . . . . $ 3,370 $ 3,123 $ 247 $233 $170 $ 63Electronics . . . . . . . . . . . . . . . . . . . . . . . . . 3,528 3,408 120 254 364 (110)Interiors . . . . . . . . . . . . . . . . . . . . . . . . . . . 3,130 3,004 126 68 60 8Other . . . . . . . . . . . . . . . . . . . . . . . . . . . . . 1,349 1,819 (470) 32 82 (50)Eliminations . . . . . . . . . . . . . . . . . . . . . . . . (656) (648) (8) — — —
Total products . . . . . . . . . . . . . . . . . . . . . 10,721 10,706 15 587 676 (89)Services . . . . . . . . . . . . . . . . . . . . . . . . . . . 545 547 (2) 6 5 1
Total segments . . . . . . . . . . . . . . . . . . . . 11,266 11,253 13 593 681 (88)Reconciling ItemsCorporate . . . . . . . . . . . . . . . . . . . . . . . . . . — — — (20) 72 (92)
Total consolidated . . . . . . . . . . . . . . . . . . $11,266 $11,253 $ 13 $573 $753 $(180)
Net Sales
The Company’s consolidated net sales during the year ended December 31, 2007 were essentially flatwhen compared to the same period of 2006. Changes in currency resulted in an increase of $569 million,primarily related to the strengthening of the Euro, Korean Won, Brazil Real, and British Pound during 2007.Divestitures and closures, including the Chassis Divestiture, Chicago, IL plant closure, and the Chennai,India divestiture reduced sales by $675 million in the aggregate. North America sales volumes decreasedby $434 million related to lower Ford and Nissan volumes in North America and the result of customersourcing actions, primarily in the Electronics product group. Sales in Asia increased $537 million, including$269 million of directed source content related to Hyundai/Kia production and net new business wins.Higher Ford and Premium Auto Group production volumes in Europe contributed to an increase in sales of$136 million.
Net sales for Climate were $3.4 billion in 2007, compared with $3.1 billion in 2006, representing anincrease of $247 million or 8%. Sales increased in Asia by $237 million, principally attributable to newbusiness and higher production volumes. Climate sales increased in Europe by $68 million principallyrelated to higher Ford vehicle production volumes. Sales were lower in North America by $121 million dueto lower Ford North America vehicle production volume and unfavorable product mix partially offset by newbusiness. Net customer price reductions were more than offset by favorable currency of $153 million.
Net sales for Electronics were $3.5 billion in 2007, compared with $3.4 billion in 2006, representing anincrease of $120 million or 4%. Sales in 2007 included higher sales in Europe of $171 million due toincreased Ford vehicle production volumes, partially offset by lower Ford North American vehicleproduction volumes and adverse product mix related to past customer sourcing actions of $197 million.Net customer price reductions were more than offset by favorable currency of $198 million.
40

ITEM 7. MANAGEMENT’S DISCUSSION AND ANALYSIS OF FINANCIAL CONDITION ANDRESULTS OF OPERATIONS — (Continued)
Net sales for Interiors were $3.1 billion in 2007, compared with $3.0 billion in 2006, representing anincrease of $126 million or 4%. Increased sales in Asia of $300 million, primarily due to an increase indirected source content for Hyundai/Kia production, were partially offset by lower sales in North America of$297 million, primarily due to lower Ford and Nissan vehicle production volumes as well as the impact oflost volume related to the closure of the Chicago facility. Net customer price reductions were more thanoffset by customer commercial settlements and favorable currency of $165 million.
Net sales for Other was $1.3 billion in 2007, compared with $1.8 billion in 2006, representing a decrease of$470 million or 26%. The decrease is largely attributable to 2007 divestiture activities including the ChassisDivestiture, which resulted in a decrease of $390 million and the Chennai, India divestiture, which resultedin a decrease of $35 million. Sales decreased by $83 million with reductions in all regions related to lowervehicle production volumes and adverse product mix. Net customer price reductions were more than offsetby favorable currency of $53 million.
Services revenues relate to information technology, engineering, administrative and other businesssupport services provided by the Company under the terms of various transition agreements. Suchservices are generally provided at an amount that approximates cost. Services revenues totaled$545 million for the year ended December 31, 2007 compared with $547 million for the year endedDecember 31, 2006.
Gross Margin
The Company’s gross margin was $573 million for the year ended December 31, 2007, compared with$753 million for the year ended December 31, 2006, representing a decrease of $180 million or 24%. Thedecrease resulted from the following items:
• Non-recurrence of certain benefits recorded in 2006, including $72 million of postretirement benefit reliefrelated to the transfer of certain Visteon salaried employees to Ford, commercial agreements of$39 million, and non-income tax reserve adjustments of $27 million.
• Non-recurrence of certain expense items recorded in 2006, including $11 million of employee benefitcurtailment expense included in cost of sales but reimbursed from the escrow account and a $9 millionlitigation settlement.
• Certain 2007 benefits, including OPEB curtailment gains related to restructuring activities of $58 million,commercial agreements of $35 million, and gains on the sale of land and buildings in the UK of$24 million.
• Certain 2007 expense items, including accelerated depreciation of $50 million resulting from theCompany’s restructuring activities, $23 million of employee benefit curtailment and settlementexpense included in cost of sales but reimbursed from the escrow account, and $20 million ofpension settlement expenses related to a previously closed Canadian facility.
• The Chassis Divestiture resulted in a reduction in gross margin of $33 million.
• The remainder was related to vehicle production volume and mix, past sourcing actions and customerpricing partially offset by improved operating performance.
Gross margin for Climate was $233 million in 2007, compared with $170 million in 2006, representing anincrease of $63 million or 37%. Material and manufacturing cost reduction activities, lower OPEBexpenses and restructuring savings were partially offset by customer pricing and increases in rawmaterial costs resulting in a net increase in gross margin of $101 million. Favorable currencyincreased gross margin by $9 million. These increases were partially offset by $47 million related tounfavorable vehicle and product mix, lower vehicle production volumes, in North America and accelerateddepreciation.
41
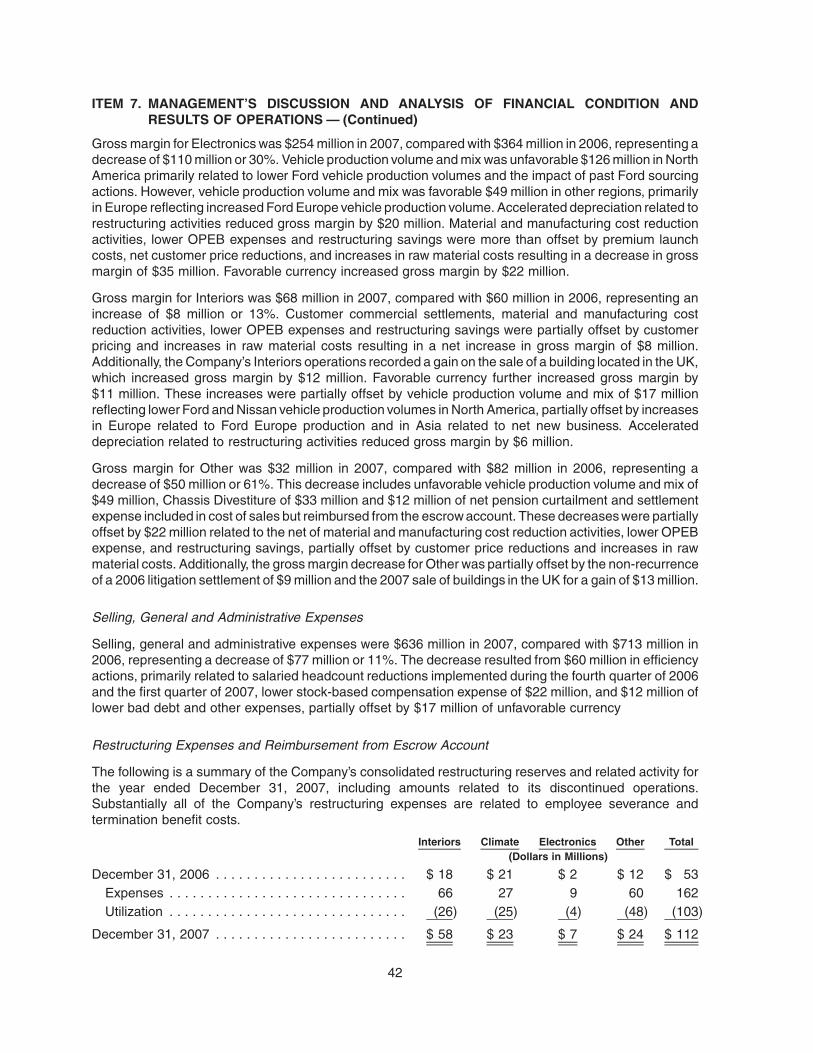
ITEM 7. MANAGEMENT’S DISCUSSION AND ANALYSIS OF FINANCIAL CONDITION ANDRESULTS OF OPERATIONS — (Continued)
Gross margin for Electronics was $254 million in 2007, compared with $364 million in 2006, representing adecrease of $110 million or 30%. Vehicle production volume and mix was unfavorable $126 million in NorthAmerica primarily related to lower Ford vehicle production volumes and the impact of past Ford sourcingactions. However, vehicle production volume and mix was favorable $49 million in other regions, primarilyin Europe reflecting increased Ford Europe vehicle production volume. Accelerated depreciation related torestructuring activities reduced gross margin by $20 million. Material and manufacturing cost reductionactivities, lower OPEB expenses and restructuring savings were more than offset by premium launchcosts, net customer price reductions, and increases in raw material costs resulting in a decrease in grossmargin of $35 million. Favorable currency increased gross margin by $22 million.
Gross margin for Interiors was $68 million in 2007, compared with $60 million in 2006, representing anincrease of $8 million or 13%. Customer commercial settlements, material and manufacturing costreduction activities, lower OPEB expenses and restructuring savings were partially offset by customerpricing and increases in raw material costs resulting in a net increase in gross margin of $8 million.Additionally, the Company’s Interiors operations recorded a gain on the sale of a building located in the UK,which increased gross margin by $12 million. Favorable currency further increased gross margin by$11 million. These increases were partially offset by vehicle production volume and mix of $17 millionreflecting lower Ford and Nissan vehicle production volumes in North America, partially offset by increasesin Europe related to Ford Europe production and in Asia related to net new business. Accelerateddepreciation related to restructuring activities reduced gross margin by $6 million.
Gross margin for Other was $32 million in 2007, compared with $82 million in 2006, representing adecrease of $50 million or 61%. This decrease includes unfavorable vehicle production volume and mix of$49 million, Chassis Divestiture of $33 million and $12 million of net pension curtailment and settlementexpense included in cost of sales but reimbursed from the escrow account. These decreases were partiallyoffset by $22 million related to the net of material and manufacturing cost reduction activities, lower OPEBexpense, and restructuring savings, partially offset by customer price reductions and increases in rawmaterial costs. Additionally, the gross margin decrease for Other was partially offset by the non-recurrenceof a 2006 litigation settlement of $9 million and the 2007 sale of buildings in the UK for a gain of $13 million.
Selling, General and Administrative Expenses
Selling, general and administrative expenses were $636 million in 2007, compared with $713 million in2006, representing a decrease of $77 million or 11%. The decrease resulted from $60 million in efficiencyactions, primarily related to salaried headcount reductions implemented during the fourth quarter of 2006and the first quarter of 2007, lower stock-based compensation expense of $22 million, and $12 million oflower bad debt and other expenses, partially offset by $17 million of unfavorable currency
Restructuring Expenses and Reimbursement from Escrow Account
The following is a summary of the Company’s consolidated restructuring reserves and related activity forthe year ended December 31, 2007, including amounts related to its discontinued operations.Substantially all of the Company’s restructuring expenses are related to employee severance andtermination benefit costs.
Interiors Climate Electronics Other Total(Dollars in Millions)
December 31, 2006 . . . . . . . . . . . . . . . . . . . . . . . . . $ 18 $ 21 $ 2 $ 12 $ 53Expenses . . . . . . . . . . . . . . . . . . . . . . . . . . . . . . . 66 27 9 60 162Utilization . . . . . . . . . . . . . . . . . . . . . . . . . . . . . . . (26) (25) (4) (48) (103)
December 31, 2007 . . . . . . . . . . . . . . . . . . . . . . . . . $ 58 $ 23 $ 7 $ 24 $ 112
42

ITEM 7. MANAGEMENT’S DISCUSSION AND ANALYSIS OF FINANCIAL CONDITION ANDRESULTS OF OPERATIONS — (Continued)
During the year ended December 31, 2007 the Company recorded restructuring expenses of $162 million,including $10 million related to discontinued operations, compared to $95 million, including $2 millionrelated to discontinued operations, for the year ended December 31, 2006. Pursuant to the terms of theEscrow Agreement, approximately $100 million of these restructuring costs were fully reimbursable, while$62 million of these costs were reimbursable at a rate of fifty percent as the Company entered into the cost-sharing portion of the Escrow Agreement during the fourth quarter of 2007. Significant restructuringactions under the multi-year improvement plan for the year ended December 31, 2007 include thefollowing:
• $31 million of employee severance and termination benefit costs associated with the elimination ofapproximately 300 salaried positions.
• $27 million of employee severance and termination benefit costs for approximately 300 employees at aEuropean Interiors facility related to the announced 2008 closure of that facility.
• $21 million of employee severance and termination benefit costs for approximately 600 hourly and 100salaried employees related to the announced 2008 closure of a North American Other facility.
• $14 million was recorded related to the December 2007 closure of a North American Climate facility foremployee severance and termination benefits, contract termination and equipment move costs.
• $12 million of expected employee severance and termination benefit costs associated withapproximately 100 hourly employees under a plant efficiency action at a European Climate facility.
• $10 million of employee severance and termination benefit costs associated with the exit of brakemanufacturing operations at a European Other facility. Approximately 160 hourly and 20 salariedpositions were eliminated as a result of this action.
• $10 million of employee severance and termination benefit costs were recorded for approximately40 hourly and 20 salaried employees at various European facilities.
• The Company recorded an estimate of employee severance and termination benefit costs under themulti-year improvement plan of approximately $34 million for the probable payment of such post-employment benefit costs.
Utilization of $103 million for the year ended December 31, 2007 includes $79 million of payments forseverance and other employee termination benefits, $16 million of special termination benefits reclassifiedto pension and other postretirement employee benefit liabilities where such payments are made from theCompany’s benefit plans and $8 million in payments related to contract termination and equipmentrelocation costs.
Impairment of Long-Lived Assets
During the fourth quarter of 2007 the Company recorded impairment charges of $16 million to reduce thenet book value of long-lived assets associated with the Company’s fuel products to their estimated fairvalue. This amount was recorded pursuant to impairment indicators including lower than anticipatedcurrent and near term future customer volumes and the related impact on the Company’s current andprojected operating results and cash flows resulting from a change in product technology.
During the third quarter of 2007, the Company completed the sale of its Visteon Powertrain ControlSystems India (“VPCSI”) operation located in Chennai, India. The Company determined that assetssubject to the VPCSI divestiture including inventory, intellectual property, and real and personal propertymet the “held for sale” criteria of SFAS 144. Accordingly, these assets were valued at the lower of carryingamount or fair value less cost to sell, which resulted in asset impairment charges of approximately$14 million.
43

ITEM 7. MANAGEMENT’S DISCUSSION AND ANALYSIS OF FINANCIAL CONDITION ANDRESULTS OF OPERATIONS — (Continued)
During the first quarter of 2007, the Company determined that assets subject to the Chassis Divestitureincluding inventory, intellectual property, and real and personal property met the “held for sale” criteria ofSFAS 144. Accordingly, these assets were valued at the lower of carrying amount or fair value less cost tosell, which resulted in asset impairment charges of approximately $28 million.
In connection with the Company’s announced exit of the brake manufacturing business at its Swansea, UKfacility, an asset impairment charge of $16 million was recorded to reduce the net book value of certainlong-lived assets at the facility to their estimated fair value. The Company’s estimate of fair value wasbased on market prices, prices of similar assets, and other available information.
During 2007 the Company entered into agreements to sell two Electronics buildings located in Japan. TheCompany determined that these buildings met the “held for sale” criteria of SFAS 144 and were recorded atthe lower of carrying value or fair value less cost to sell, which resulted in asset impairment charges ofapproximately $15 million.
Interest
Interest expense, net was $164 million for the year ended December 31, 2007 compared to $159 million forthe year ended December 31, 2006. Interest expense increased $35 million due to higher average debtlevels in 2007. Interest income was $61 million for the year ended December 31, 2007 compared to$31 million for the year ended December 31, 2006. Interest income increased $30 million due to higheraverage cash balances in 2007.
Income Taxes
The Company’s 2007 provision for income taxes of $20 million represents a decrease of $5 million whencompared with 2006. The income tax provisions for the years ended December 31, 2007 and 2006 reflectincome tax expense related to those countries where the Company is profitable, accrued withholding taxes,certain non-recurring and other discrete items and the inability to record a tax benefit for pre-tax losses in theU.S. and certain foreign countries to the extent not offset by other categories of income in those jurisdictions.
The Company’s 2007 income tax provision includes income tax expense items totaling $140 millionincluding the following:
• $72 million for unrecognized tax benefits resulting from positions taken in tax returns filed during theyear, as well as those expected to be taken in future tax returns, including interest and penalties.
• $50 million related to certain countries where the Company is profitable, accrued withholding taxes, andthe inability to record a tax benefit for pre-tax losses in the U.S. and certain foreign countries to the extentnot offset by other categories of income in those jurisdictions.
• $18 million resulting from significant tax law changes in Mexico, enacted in October 2007.
These 2007 income tax expense items were partially offset by income tax benefits totaling $120 millionincluding the following:
• $91 million related to offsetting pre-tax operating losses against current year net pre-tax income fromother categories of income or loss, in particular pre-tax other comprehensive income primarilyattributable to re-measurement of pension and OPEB obligations and foreign currency translation.
• $18 million net tax benefit resulting from the Company’s redemption of its ownership interest in a newlyformed Korean company as part of a legal restructuring of its climate control operations in Asia. Inconnection with this redemption, the Company concluded that a portion of its earnings in Halla ClimateControl Korea, a 70% owned affiliate of the Company, were permanently reinvested resulting in a$30 million reduction of previously accrued withholding taxes. This benefit was partially offset by$12 million of income tax expense related to a taxable gain from the restructuring.
• $11 million related to favorable tax law changes in Portugal enacted in the fourth quarter of 2007.
44

ITEM 7. MANAGEMENT’S DISCUSSION AND ANALYSIS OF FINANCIAL CONDITION ANDRESULTS OF OPERATIONS — (Continued)
The Company’s 2006 income tax provision of $25 million reflects income tax expense of $122 millionrelated to certain countries where the Company is profitable, accrued withholding taxes, and the inability torecord a tax benefit for pre-tax losses in certain foreign countries and pre-tax losses in the U.S. to theextent not offset by U.S. pre-tax other comprehensive income. These income tax expense items werepartially offset by income tax benefits of $97 million, including $68 million related to offsetting U.S. pre-taxoperating losses against current year U.S. pre-tax other comprehensive income primarily attributable toforeign currency translation, $15 million related to a reduction of the Company’s dividend withholding taxesaccrued for unremitted earnings of Spain and the Czech Republic as a result of legal entity restructuring,and $14 million related to the restoration of deferred tax assets associated with the Company’s operationsin Brazil.
2006 Compared with 2005
2006 2005 Change 2006 2005 Change
Sales Gross Margin
(Dollars in Millions)
Climate . . . . . . . . . . . . . . . . . . . . . . . . . . . $ 3,123 $ 2,931 $ 192 $170 $175 $ (5)Electronics. . . . . . . . . . . . . . . . . . . . . . . . . 3,408 3,615 (207) 364 316 48Interiors . . . . . . . . . . . . . . . . . . . . . . . . . . . 3,004 3,160 (156) 60 29 31Other . . . . . . . . . . . . . . . . . . . . . . . . . . . . . 1,819 1,829 (10) 82 64 18Eliminations . . . . . . . . . . . . . . . . . . . . . . . . (648) (1,001) 353 — — —
Total products . . . . . . . . . . . . . . . . . . . . 10,706 10,534 172 676 584 92Services . . . . . . . . . . . . . . . . . . . . . . . . . . 547 164 383 5 1 4
Total segments. . . . . . . . . . . . . . . . . . . . 11,253 10,698 555 681 585 96Reconciling ItemsACH . . . . . . . . . . . . . . . . . . . . . . . . . . . . . — 6,052 (6,052) — (41) 41Corporate . . . . . . . . . . . . . . . . . . . . . . . . . — — — 72 — 72
Total consolidated . . . . . . . . . . . . . . . . . $11,253 $16,750 $(5,497) $753 $544 $209
Net Sales
The Company’s consolidated net sales decreased by approximately $5.5 billion or 33% during the yearended December 31, 2006 when compared to the same period of 2005. The ACH Transactions resulted ina decrease of $6.1 billion, which was partially offset by an increase in services revenues of $383 million.Excluding the ACH Transactions and related eliminations and revenues from services provided to ACH,product sales decreased by $218 million. The decrease included favorable currency of $91 million year-over-year. Sales were significantly lower in North America reflecting decreased Ford vehicle productionvolume and unfavorable product mix, lower non-Ford vehicle production volume, principally Nissanproducts, and lower aftermarket sales. This decrease was partially offset by a significant salesincrease in Asia Pacific reflecting growth in that region and new business launched in 2006.
Net sales for Climate were $3.1 billion in 2006, compared with $2.9 billion in 2005, representing anincrease of $192 million or 7%. Continued growth in the Company’s Asia Pacific consolidated subsidiariesincreased net sales by $307 million. This growth was primarily driven by new business and includedfavorable currency of $70 million partially offset by customer price reductions. Net sales in North Americawere $115 million lower year-over-year, reflecting lower Ford North America vehicle production volumesand unfavorable product mix, partially offset by the launch of a new manufacturing facility in Alabama. Netsales in Europe increased $41 million reflecting higher Ford Europe vehicle production volume partiallyoffset by lower vehicle production volumes by other customers.
45

ITEM 7. MANAGEMENT’S DISCUSSION AND ANALYSIS OF FINANCIAL CONDITION ANDRESULTS OF OPERATIONS — (Continued)
Net sales for Electronics were $3.4 billion in 2006, compared with $3.6 billion in 2005, representing adecrease of $207 million or 6%. Vehicle production volume and mix decreased net sales by $153 million,primarily attributable to lower Ford and Nissan vehicle production volume and unfavorable product mix inNorth America and lower sales in Asia Pacific. This reduction was partially offset by higher Ford Europevehicle production volume. Net customer price reductions were more than offset by favorable currency of$24 million, primarily in South America.
Net sales for Interiors were $3.0 billion in 2006, compared with $3.2 billion in 2005, representing adecrease of $156 million or 5%. Vehicle production volume and product mix decreased net sales by$186 million. The decrease was attributable to lower Ford and Nissan vehicle production volume andunfavorable product mix in North America of $258 million and lower vehicle production by certain EuropeOEM’s of $92 million, partially offset by increased sales in Asia Pacific of $163 million. The increase in AsiaPacific sales reflected increased directed source content sales at a consolidated joint venture. Netcustomer price reductions were more than offset by price increases resulting from favorable customersettlements, raw material cost recoveries, and product design actions. Favorable currency increased year-over-year sales by $5 million.
Net sales for Other was $1.8 billion in 2006, compared with $1.8 billion in 2005. Vehicle production volumeand product mix decreased net sales by $85 million. Lower Ford vehicle production volume in NorthAmerica, lower non-Ford vehicle production in Europe, and lower aftermarket sales decreased net salesby $125 million. This decrease was partially offset by higher vehicle production volume in Asia Pacific.Customer price reductions were more than offset by price increases resulting from favorable customersettlements, raw material cost recoveries, and product design actions. Unfavorable currency of $6 million,primarily in Europe, decreased sales year-over-year.
Services revenues related to information technology, engineering, administrative and other businesssupport services provided by the Company to ACH, pursuant to agreements associated with theOctober 1, 2005 ACH Transactions, were $547 million in 2006, compared with $164 million in 2005.
Gross Margin
The Company’s gross margin was $753 million in 2006, compared with $544 million in 2005, representingan increase of $209 million or 38%. The increase in gross margin is primarily attributable to postretirementbenefit relief of $72 million related to the transfer of certain Visteon salaried employees supporting twoACH manufacturing facilities that were transferred to Ford in January 2006, lower depreciation andamortization expense of $73 million (primarily reflecting the impact of the 2005 asset impairments), thebenefit of eliminating loss making operations transferred to ACH of $42 million, improved operatingperformance, and lower non-income based taxes (primarily reflecting a reserve adjustment of $23 millionfor the completion of regulatory tax audits and the lapse of certain statutory limitation periods). Theseincreases were partially offset by unfavorable vehicle production volumes of $135 million, net customerprice reductions, unfavorable currency of $17 million and a litigation settlement of $9 million in excess ofpreviously provided reserves.
Gross margin for Climate was $170 million in 2006, compared with $175 million in 2005, representing adecrease of $5 million or 3%. Although net sales increased during the year, unfavorable North Americaproduct mix partially offset by continued growth of the Company’s Asia Pacific consolidated subsidiariesresulted in a net decrease in gross margin of $7 million. Material and manufacturing cost reductionactivities, lower depreciation and amortization expense reflecting the impact of the 2005 assetimpairments, and lower OPEB expenses increased gross margin by $97 million. This performancewas partially offset by net customer price reductions and increases in raw material costs (principallyaluminum) of $89 million. Unfavorable currency reduced gross margin by $6 million.
46

ITEM 7. MANAGEMENT’S DISCUSSION AND ANALYSIS OF FINANCIAL CONDITION ANDRESULTS OF OPERATIONS — (Continued)
Gross margin for Electronics was $364 million in 2006, compared with $316 million in 2005, representingan increase of $48 million or 15%. Lower vehicle production volumes and unfavorable product mix reducedgross margin by $92 million, primarily attributable to lower volumes in North America. Material andmanufacturing cost reduction activities, lower depreciation and amortization expense reflecting the impactof the 2005 asset impairments, and lower OPEB expenses increased gross margin by $181 million. Thisperformance was partially offset by net customer price reductions and increases in raw material costs of$31 million. Unfavorable currency reduced gross margin by $10 million.
Gross margin for Interiors was $60 million in 2006, compared with $29 million in 2005, representing anincrease of $31 million or 107%. Lower vehicle production volume and unfavorable product mix reducedgross margin by $24 million, primarily attributable to lower PSA Peugeot Citroën production in Europe.Material and manufacturing cost reduction activities, lower depreciation and amortization expensereflecting the impact of the 2005 asset impairments, and lower OPEB expenses increased grossmargin by $55 million. Additionally, favorable customer agreements, raw material cost recoveries, andproduct design actions more than offset customer price reductions and raw material cost increases,increasing gross margin by $2 million. Unfavorable currency reduced gross margin by $2 million.
Gross margin for Other was $82 million in 2006, compared with $64 million in 2005, representing anincrease of $18 million or 28%. Vehicle production volumes and product mix was favorable by $3 million.Material and manufacturing cost reduction activities, lower depreciation and amortization expensereflecting the impact of the 2005 asset impairments, and lower OPEB expenses increased grossmargin by $19 million, despite unfavorable operating performance at certain Western Europemanufacturing facilities engaged in ongoing restructuring initiatives. This performance was partiallyoffset by net customer price reductions and increases in raw material costs of $5 million. Favorablecurrency increased gross margin $1 million.
Selling, General and Administrative Expenses
Selling, general and administrative expenses were $713 million in 2006, compared with $945 million in2005, representing a decrease of $232 million or 25%. Under the terms of various agreements betweenthe Company and ACH, expenses previously classified as selling, general and administrative expensesincurred to support the business of ACH are now classified as “Cost of sales” in the consolidatedstatements of operations, comprising $175 million of the decrease. Bad debt expense improved yearover year primarily reflecting the non-recurrence of a charge of approximately $41 million related to thebankruptcy of a customer in the second quarter of 2005. Furthermore, selling, general and administrativeexpenses decreased by $39 million reflecting lower OPEB and pension expenses, net cost efficiencies,and favorable currency. Increases to selling, general and administrative expenses during the year includedfees associated with the implementation of the Company’s European securitization facility of $10 millionand increased expenses related to the Company’s stock-based incentive compensation plans of$15 million.
Restructuring Expenses and Reimbursement from Escrow Accounts
The following is a summary of the Company’s consolidated restructuring reserves and related activity forthe year ended December 31, 2006, including amounts related to its discontinued operations.Substantially all of the Company’s restructuring expenses are related to employee severance andtermination benefit costs.
47

ITEM 7. MANAGEMENT’S DISCUSSION AND ANALYSIS OF FINANCIAL CONDITION ANDRESULTS OF OPERATIONS — (Continued)
Interiors Climate Electronics Other Total
(Dollars in Millions)
December 31, 2005 . . . . . . . . . . . . . . . . . . . . . . . . . . $— $ — $ 4 $ 10 $ 14Expenses . . . . . . . . . . . . . . . . . . . . . . . . . . . . . . . . 24 31 16 24 95Utilization . . . . . . . . . . . . . . . . . . . . . . . . . . . . . . . . (6) (10) (18) (22) (56)
December 31, 2006 . . . . . . . . . . . . . . . . . . . . . . . . . . $18 $ 21 $ 2 $ 12 $ 53
During the year ended December 31, 2006 the Company recorded restructuring expenses of $95 million,including $2 million related to discontinued operations, compared to $26 million for the year endedDecember 31, 2005. Pursuant to the terms of the Escrow Agreement the restructuring costs incurredduring the year ended December 31, 2006 were fully reimbursable. Significant restructuring actions underthe multi-year improvement plan for the year ended December 31, 2006 include the following:
• $20 million in employee severance and termination benefit costs related to the 2007 closure of a NorthAmerican Climate manufacturing facility. These costs are associated with approximately 170 salariedand 750 hourly employees.
• $19 million in employee severance and termination benefit costs related to an announced plan to reducethe Company’s salaried workforce in higher cost countries. These costs are associated withapproximately 800 salaried positions.
• $9 million in employee severance and termination benefit costs related to certain hourly employeeheadcount reductions attributable to approximately 600 employees at Climate facilities in North Americaand 70 employees at certain European manufacturing facilities.
• $7 million related to the announced closure of a European Interiors manufacturing facility. Costs includeemployee severance and termination benefits for approximately 150 hourly and salaried employees andcertain non-employee related costs associated with closing the facility.
• $7 million of employee severance and termination benefit costs related to a workforce reduction effort ata European Interiors manufacturing facility. These costs relate to approximately 110 hourly employees.
• $6 million related to workforce reduction activities in Electronics manufacturing facilities in Mexico andPortugal. These costs include employee severance and termination benefits for approximately500 hourly and 50 salaried employees.
• $6 million related to a restructuring initiative at a North American Electronics manufacturing facility.These costs include severance and termination benefit costs for approximately 1,000 employees.
• $5 million related to the announced closure of a North American Interiors manufacturing facility, includingemployee severance and termination benefit costs for 265 hourly employees, 26 salaried employees,and a lease termination penalty.
• $3 million related to the closure of a North American Climate manufacturing facility, including severanceand termination benefit costs for approximately 350 hourly and salaried employees.
Utilization of $56 million for the year ended December 31, 2006 includes $49 million payments forseverance and other employee termination benefits and $7 million of special termination benefitsreclassified to pension and other postretirement employee benefit liabilities where such payments aremade from the Company’s benefit plans.
48

ITEM 7. MANAGEMENT’S DISCUSSION AND ANALYSIS OF FINANCIAL CONDITION ANDRESULTS OF OPERATIONS — (Continued)
Impairment of Long-Lived Assets
During the second quarter of 2006 the Company announced the closure of a European Interiors facility. Inconnection with this action, the Company recorded an asset impairment of $10 million to reduce the netbook value of certain long-lived assets to their estimated fair value. Also during the second quarter of 2006and in accordance with Accounting Principles Board Opinion No. 18, “The Equity Method of Accounting forInvestments in Common Stock,” the Company determined that an “other than temporary” decline in the fairmarket value of its investment in Vitro Flex, S.A. de C.V. (“Vitro Flex”) had occurred. Consequently, theCompany reduced the carrying value of its investment in Vitro Flex by approximately $12 million to itsestimated fair market value at June 30, 2006.
Interest
Interest expense for the year ended December 31, 2006 was $190 million, representing an increase of$34 million or 22% from $156 million in 2005. The increase was due to higher average interest rates onoutstanding debt and a write-off of unamortized deferred charges of $7 million. Interest income for the yearended December 31, 2006 was $31 million, representing an increase of $7 million or 29% when comparedto the year ended December 31, 2005. The increase in interest income was attributable to higher averagecash balances during 2006.
Other
The Company recorded a gain on early debt extinguishment of approximately $8 million during the yearended December 31, 2006 related to the repurchase of $150 million of its 8.25% bonds due in 2010.
Income Taxes
The Company’s 2006 income tax provision of $25 million reflects income tax expense of $122 millionrelated to certain countries where the Company is profitable, accrued withholding taxes, and the inability torecord a tax benefit for pre-tax losses in certain foreign countries and pre-tax losses in the U.S. to theextent not offset by U.S. pre-tax other comprehensive income. These income tax expense items werepartially offset by income tax benefits of $97 million, including $68 million related to offsetting U.S. pre-taxoperating losses against current year U.S. pre-tax other comprehensive income primarily attributable toforeign currency translation, $15 million related to a reduction of the Company’s dividend withholding taxesaccrued for unremitted earnings of Spain and the Czech Republic as a result of legal entity restructuring,and $14 million related to the restoration of deferred tax assets associated with the Company’s operationsin Brazil.
The Company’s 2005 income tax provision of $64 million reflects income tax expense related to thosecountries where the Company is profitable, accrued withholding taxes, certain non-recurring and otherdiscrete tax items and the inability to record a tax benefit for pre-tax losses in the U.S. and certain foreigncountries. Non-recurring and other discrete tax items recorded in 2005 resulted in a net benefit of$31 million, including $28 million for a reduction in income tax reserves corresponding with theconclusion of U.S. Federal income tax audits for 2002, 2003 and certain pre-spin periods, as well as anet benefit of $3 million consisting primarily of benefits related to a change in the estimated benefitassociated with tax losses in Canada and the favorable resolution of tax matters in Mexico.
49

ITEM 7. MANAGEMENT’S DISCUSSION AND ANALYSIS OF FINANCIAL CONDITION ANDRESULTS OF OPERATIONS — (Continued)
Liquidity
Overview
The Company’s cash and liquidity needs are impacted by the level, variability, and timing of its customers’worldwide vehicle production, which varies based on economic conditions and market shares in majormarkets. Additionally, the Company’s cash and liquidity needs are impacted by seasonal factors, includingOEM shutdown periods and new model year production launches. These seasonal factors generallyrequire the use of liquidity resources during the first and third quarters. The Company expects to fund itsworking capital, restructuring and capital expenditure needs with cash flows from operations. To the extentthat the Company’s liquidity needs exceed cash from operations, the Company would look to its cashbalances and availability for borrowings to satisfy those needs, as well as the need to raise additionalcapital. However, the Company’s ability to fund its working capital, restructuring and capital expenditureneeds may be adversely affected by many factors including, but not limited to, general economicconditions, specific industry conditions, financial markets, competitive factors and legislative andregulatory changes. Therefore, assurance cannot be provided that Visteon will generate sufficientcash flow from operations or that available borrowings will be sufficient to enable the Company tomeet its liquidity needs.
The Company’s business is highly dependent upon the ability to access the credit and capital markets.Access to, and the costs of borrowing in, these markets depend in part on the Company’s credit ratings,which are currently below investment grade. Moody’s current corporate rating of the Company is B3, andthe SGL rating is 3. The rating on senior unsecured debt is Caa2 with a negative outlook. The currentcorporate rating of the Company by S&P is B and the short term liquidity rating is B-3, with a negativeoutlook on the rating. Fitch’s current rating on the Company’s senior secured debt is B with a negativeoutlook. Any further downgrade in the Company’s credit ratings could reduce its access to capital, increasethe costs of future borrowings, and increase the possibility of more restrictive terms and conditionscontained in any new or replacement financing arrangements or commercial agreements or paymentterms with suppliers. Additionally, the current state of the credit and capital markets has resulted inseverely constrained liquidity conditions owing to a reevaluation of risk attributable primarily, but not limitedto, the U.S. sub-prime mortgage crisis. Continuation of such constraints may increase the Company’scosts of borrowing and could restrict the Company’s access to this potential source of future liquidity.
Cash and Equivalents
As of December 31, 2007 and 2006, the Company’s consolidated cash balances totaled $1.8 billion and$1.1 billion, respectively. Approximately 68% and 41% of these consolidated cash balances are locatedwithin the U.S. as of December 31, 2007 and 2006, respectively. As the Company’s operating profitabilityhas become more concentrated with its foreign subsidiaries and joint ventures, the Company’s cashgenerated from operations and related balances located outside of the U.S. continue to be significant. TheCompany’s ability to efficiently access cash balances in certain foreign jurisdictions is subject to localregulatory and statutory requirements.
Escrow Account
In connection with the ACH Transactions, Ford paid $400 million into an escrow account for use by theCompany to restructure its businesses subject to the terms and conditions of the Escrow Agreement,dated October 1, 2005, among the Company, Ford and Deutsche Bank Trust Company Americas. TheEscrow Agreement provides that the Company will be reimbursed from the escrow account for the first$250 million of reimbursable restructuring costs, as defined in the Escrow Agreement, and up to one half ofthe next $300 million of such costs.
50

ITEM 7. MANAGEMENT’S DISCUSSION AND ANALYSIS OF FINANCIAL CONDITION ANDRESULTS OF OPERATIONS — (Continued)
Effective October 2007, the Company’s restructuring cost reimbursement match was reduced to fiftypercent of qualifying expenses pursuant to the terms of the Escrow Agreement. As of December 31, 2007,the Company had received cumulative reimbursements from the escrow account of $288 million and$144 million was available for reimbursement pursuant to the terms of the Escrow Agreement.
Asset Securitization
The Company transfers certain customer trade account receivables originating from subsidiaries locatedin Germany, Portugal, Spain, France and the UK (“Sellers”) pursuant to a European securitizationagreement (“European Securitization”). The European Securitization agreement extends until August2011 and provides up to $325 million in funding from the sale of receivables originated by the Sellers andtransferred to Visteon Financial Centre P.L.C. (the “Transferor”). The Transferor is a bankruptcy-remotequalifying special purpose entity. Receivables transferred from the Sellers are funded through cashobtained from the issuance of variable loan notes to third-party lenders and through subordinated loansobtained from a wholly-owned subsidiary of the Company, which represent the Company’s retainedinterest in the receivables transferred.
Availability of funding under the European Securitization depends primarily upon the amount of tradeaccount receivables, reduced by outstanding borrowings under the program and other characteristics ofthose receivables that affect their eligibility (such as bankruptcy or the grade of the obligor, delinquencyand excessive concentration). As of December 31, 2007, approximately $248 million of the Company’stransferred receivables were considered eligible for borrowing under this facility, $99 million wasoutstanding and $149 million was available for funding.
Revolving Credit
The Company’s Revolving Credit Agreement allows for available borrowings of up to $350 million. Theamount of availability at any time is dependent upon various factors, including outstanding letters of credit,the amount of eligible receivables, inventory and property and equipment. Borrowings under the RevolvingCredit Agreement bear interest based on a variable rate interest option selected at the time of borrowing.The Revolving Credit Agreement expires on August 14, 2011.
As of December 31, 2007, there were no outstanding borrowings under the Revolving Credit Agreement.The total facility availability for the Company was $257 million, with $159 million of available borrowingsafter $98 million of obligations under letters of credit.
Obligations under the Revolving Credit Agreement are collateralized by a first-priority lien on certainassets of the Company and most of its domestic subsidiaries, including real property, accounts receivable,inventory, equipment and other tangible and intangible property, including the capital stock of nearly alldirect and indirect domestic subsidiaries (other than those domestic subsidiaries the sole assets of whichare capital stock of foreign subsidiaries), as well as a second-priority lien on substantially all other materialtangible and intangible assets of the Company and most of its domestic subsidiaries which collateralize theCompany’s seven-year term loan agreement. The terms of the Revolving Credit Agreement limit theobligations collateralized by certain U.S. assets to ensure compliance with the Company’s bond indenture.
51

ITEM 7. MANAGEMENT’S DISCUSSION AND ANALYSIS OF FINANCIAL CONDITION ANDRESULTS OF OPERATIONS — (Continued)
Cash Flows
Operating Activities
Cash provided from operating activities during 2007 totaled $293 million, compared with $281 million forthe same period in 2006. The increase is largely attributable to improved commercial payment terms andcollections, higher rate of escrow account reimbursements received in excess of restructuring payments,increased dividends from non-consolidated affiliates, and non-recurrence of the settlement of outstandingbalances with ACH plants in 2006, partially offset by a reduction in receivables sold, a higher net loss, asadjusted for non-cash items, incentive compensation payments made in 2007 for 2006 accruals, and anincrease in Ford North America receivable payment terms.
Investing Activities
Cash used in investing activities was $177 million during 2007, compared with $337 million for 2006. Thedecrease in cash usage primarily resulted from an increase in proceeds from divestitures and other assetsales. The proceeds from divestitures and other asset sales for 2007, which included proceeds from theChassis Divestiture and the Chennai divestiture, totaled $207 million compared to $42 for 2006. Capitalexpenditures, excluding capital leases, increased slightly to $376 in 2007 compared with $373 in 2006.The Company’s credit agreements limit the amount of capital expenditures the Company may make.
Financing Activities
Cash provided from financing activities totaled $547 million in 2007, compared with $214 million in 2006.Cash provided from financing activities in 2007 primarily resulted from the proceeds from the additional$500 million seven-year term loan and approximately $139 million from two new separate unsecuredKorean bonds, partially offset by reductions in affiliate debt and book overdrafts. Cash provided fromfinancing activities in 2006 reflects the borrowing on the $1 billion seven-year term loan and $350 million onan 18-month term loan in January 2006. Financing cash uses in 2006 included repayment of $347 millionon the short-term revolving credit facility, repayment and termination of the Company’s $241 millionfive-year term loan, repurchase of $150 million of its outstanding 8.25% interest bearing notes dueAugust 1, 2010, and repayment and termination of its $350 million 18-month term loan issued in January2006. The Company’s credit agreements limit the amount of cash payments for dividends the Companymay make.
Debt and Capital Structure
Debt
Information related to the Company’s debt and related agreements is set forth in Note 14 “Debt” to theconsolidated financial statements which are included in Item 8 of this Annual Report on Form 10-K.
Covenants and Restrictions
Subject to limited exceptions, each of the Company’s direct and indirect, existing and future, domesticsubsidiaries, as well as a limited number of foreign subsidiaries act as guarantor under its term loan creditagreement. The obligations under the credit agreement are secured by a first-priority lien on certain assetsof the Company and most of its domestic subsidiaries, including intellectual property, intercompany debt,the capital stock of nearly all direct and indirect domestic subsidiaries, and at least 65% of the stock of mostforeign subsidiaries and 100% of the stock of certain foreign subsidiaries that are guarantors, as well as asecond-priority lien on substantially all other material tangible and intangible assets of the Company andmost of its domestic subsidiaries.
52

ITEM 7. MANAGEMENT’S DISCUSSION AND ANALYSIS OF FINANCIAL CONDITION ANDRESULTS OF OPERATIONS — (Continued)
The obligations under the ABL credit agreement are secured by a first-priority lien on certain assets of theCompany and most of its domestic subsidiaries, including real property, accounts receivable, inventory,equipment and other tangible and intangible property, including the capital stock of nearly all direct andindirect domestic subsidiaries (other than those domestic subsidiaries the sole assets of which are capitalstock of foreign subsidiaries), as well as a second-priority lien on substantially all other material tangibleand intangible assets of the Company and most of its domestic subsidiaries which secure the Company’sterm loan credit agreement.
The terms relating to both credit agreements specifically limit the obligations to be secured by a securityinterest in certain U.S. manufacturing properties and intercompany indebtedness and capital stock ofU.S. manufacturing subsidiaries in order to ensure that, at the time of any borrowing under the CreditAgreement and other credit lines, the amount of the applicable borrowing which is secured by such assets(together with other borrowings which are secured by such assets and obligations in respect of certainsale-leaseback transactions) do not exceed 15% of Consolidated Net Tangible Assets (as defined in theindenture applicable to the Company’s outstanding bonds and debentures).
The credit agreements contain, among other things, mandatory prepayment provisions for certain assetsales, recovery events, equity issuances and debt incurrence, covenants, representations and warrantiesand events of default customary for facilities of this type. Such covenants include certain restrictions on theincurrence of additional indebtedness, liens, acquisitions and other investments, mergers, consolidations,liquidations and dissolutions, sales of assets, dividends and other repurchases in respect of capital stock,voluntary prepayments of certain other indebtedness, capital expenditures, transactions with affiliates,changes in fiscal periods, hedging arrangements, lines of business, negative pledge clauses, subsidiarydistributions and the activities of certain holding company subsidiaries, subject to certain exceptions. Theability of the Company’s subsidiaries to transfer assets is subject to various restrictions, includingregulatory, governmental and contractual restraints.
Under certain conditions amounts outstanding under the credit agreements may be accelerated.Bankruptcy and insolvency events with respect to the Company or certain of its subsidiaries will resultin an automatic acceleration of the indebtedness under the credit agreements. Subject to notice and cureperiods in certain cases, other events of default under the credit agreements will result in acceleration ofindebtedness under the credit agreements at the option of the lenders. Such other events of default includefailure to pay any principal, interest or other amounts when due, failure to comply with covenants, breach ofrepresentations or warranties in any material respect, non-payment or acceleration of other material debt,entry of material judgments not covered by insurance, or a change of control of the Company.
At December 31, 2007, the Company was in compliance with applicable covenants and restrictions, asamended, although there can be no assurance that the Company will remain in compliance with suchcovenants in the future.
Off-Balance Sheet Arrangements
Guarantees
The Company has guaranteed approximately $35 million of debt capacity held by subsidiaries, and$95 million for lifetime lease payments held by consolidated subsidiaries. In addition, atDecember 31, 2007, the Company has guaranteed certain Tier 2 suppliers’ debt and lease obligationsand other third-party service providers’ obligations of up to $2 million, to ensure the continued supply ofessential parts. These guarantees have not, nor does the Company expect they are reasonably likely tohave, a material current or future effect on the Company’s financial position, results of operations or cashflows.
53

ITEM 7. MANAGEMENT’S DISCUSSION AND ANALYSIS OF FINANCIAL CONDITION ANDRESULTS OF OPERATIONS — (Continued)
Asset Securitization
Transfers under the European Securitization, for which the Company receives consideration other than abeneficial interest, are accounted for as “true sales” under the provisions of Statement of FinancialAccounting Standards No. 140 (“SFAS 140”), “Accounting for Transfers and Servicing of Financial Assetsand Extinguishments of Liabilities” and are removed from the balance sheet. Transfers under theEuropean Securitization, for which the Company receives a beneficial interest are not removed fromthe balance sheet and total $434 million and $482 million as of December 31, 2007 and 2006, respectively.Such amounts are recorded at fair value and are subordinated to the interests of third-party lenders.Securities representing the Company’s retained interests are accounted for as trading securities underStatement of Financial Accounting Standards No. 115 “Accounting for Certain Investments in Debt andEquity Securities.”
Availability of funding under the European Securitization depends primarily upon the amount of tradereceivables reduced by outstanding borrowings under the program and other characteristics of those tradereceivables that affect their eligibility (such as bankruptcy or the grade of the obligor, delinquency andexcessive concentration). As of December 31, 2007, approximately $248 million of the Company’stransferred trade receivables were considered eligible for borrowing under this facility, $99 million wasoutstanding and $149 million was available for funding. The Company recorded losses of $8 million and$2 million for the years ended December 31, 2007 and 2006, respectively related to trade receivables soldunder the European Securitization. The table below provides a reconciliation of changes in interests inaccount receivables transferred for the period.
2007 2006December 31
(Dollars in Millions)
Beginning balance . . . . . . . . . . . . . . . . . . . . . . . . . . . . . . . . . . . . . . . . . . . . . . . . . $ 482 $ —Receivables transferred . . . . . . . . . . . . . . . . . . . . . . . . . . . . . . . . . . . . . . . . . . . . . 3,321 1,389Proceeds from new securitizations . . . . . . . . . . . . . . . . . . . . . . . . . . . . . . . . . . . . . (41) (76)Proceeds from collections reinvested in securitization . . . . . . . . . . . . . . . . . . . . . . (522) (101)Cash flows received on interests retained . . . . . . . . . . . . . . . . . . . . . . . . . . . . . . . (2,806) (730)
Ending balance . . . . . . . . . . . . . . . . . . . . . . . . . . . . . . . . . . . . . . . . . . . . . . . . . . . $ 434 $ 482
United States Securitization
In December 2005, the Company terminated its revolving accounts receivable securitization facility in theUnited States (“facility agreement”). Formerly, under this facility agreement, the Company could sell aportion of its U.S. account receivables from customers other than Ford to Visteon Receivables, LLC(“VRL”), a wholly-owned consolidated special purpose entity. VRL may then have sold, on a non-recoursebasis (subject to certain limited exceptions), an undivided interest in the receivables to an asset-backed,multi-seller commercial paper conduit, which is unrelated to the Company or VRL. The conduit typicallyfinanced the purchases through the issuance of commercial paper, with back-up purchase commitmentsfrom the conduit’s financial institution. The sale of the undivided interest in the receivables from VRL to theconduit was accounted for as a sale under the provisions of SFAS 140. When VRL sold an undividedinterest to the conduit, VRL retained the remaining undivided interest. The carrying value of the remainingundivided interests approximated the fair market value of these receivables. The value of the undividedinterest sold to the conduit was excluded from the Company’s consolidated balance sheets and reducedthe accounts receivable balances. The Company performed the collection and administrative functionsrelated to the accounts receivable.
54

ITEM 7. MANAGEMENT’S DISCUSSION AND ANALYSIS OF FINANCIAL CONDITION ANDRESULTS OF OPERATIONS — (Continued)
At the time VRL sold the undivided interest to the conduit, the sale was recorded at fair market value withthe difference between the carrying amount and fair value of the assets sold included in operating incomeas a loss on sale. This difference between carrying value and fair value was principally the estimateddiscount inherent in the facility agreement, which reflected the borrowing costs as well as fees andexpenses of the conduit, and the length of time the receivables were expected to be outstanding. Grossproceeds from new securitizations were $237 million during the year ended December 31, 2005.Collections and repayments to the conduit were $292 million during the year endedDecember 31, 2005. This resulted in net payments and net proceeds of $55 million for the year endedDecember 31, 2005. Losses on the sale of these receivables was approximately $1 million for the yearended December 31, 2005 and are included under the caption “Selling, general and administrativeexpenses” in the Company’s consolidated statements of operations.
Other
During 2006 and 2005, the Company sold account receivables without recourse under a European sale ofreceivables agreement. As of December 31, 2006 and 2005, the Company had sold approximately62 million Euro ($81 million) and 99 million Euro ($117 million), respectively. This European sale ofreceivables agreement was terminated in December 2006. Losses on these receivable sales wereapproximately $3 million and $2 million for the years ended December 31, 2006 and 2005, respectively.
As of December 31, 2005, the Company had sold 830 million Japanese Yen ($7 million) of accountreceivables, without recourse, under a Japanese sale of receivables agreement initiated in the first quarterof 2005. This Japanese sale of receivables agreement was terminated in January 2006.
Contractual Obligations
The following table summarizes the Company’s contractual obligations existing as of December 31, 2007:
Total 2008 2009-2010 2011-2012 2013 & After
Debt, including capital leases . . . . . . . . . . . . . . $2,840 $ 95 $ 720 $ 20 $2,005
Purchase obligations(a) . . . . . . . . . . . . . . . . . . 827 200 342 259 26
Interest payments on long-term debt(b) . . . . . . 1,047 191 347 283 226
Capital expenditures . . . . . . . . . . . . . . . . . . . . 228 199 29 — —
Operating leases . . . . . . . . . . . . . . . . . . . . . . . 185 48 73 28 36
Postretirement funding commitments(c) . . . . . . 121 5 17 18 81
Total contractual obligations(d) . . . . . . . . . . . $5,248 $738 $1,528 $608 $2,374
(a) Purchase obligations include amounts related to a 10 year Master Service Agreement (“MSA”) with IBM in January 2003.Pursuant to this agreement, the Company outsourced most of its information technology needs on a global basis. During 2006,the Company and IBM modified this agreement, resulting in certain changes to the service delivery model and related servicecharges. Accordingly, the Company estimates that service charges under the modified MSA are expected to aggregateapproximately $700 million during the remaining term of the MSA, subject to decreases and increases based on theCompany’s actual consumption of services to meet its then current business needs. The outsourcing agreement may beterminated also for the Company’s business convenience under the agreement for a scheduled termination fee.
(b) Payments include the impact of interest rate swaps, and do not assume the replenishment of retired debt.
(c) Postretirement funding commitments include the estimated liability to Ford for postretirement employee health care and lifeinsurance benefits of certain salaried employees as discussed in Note 15 to the consolidated financial statements, which isincorporated by reference herein.
(d) Excludes any reserve for income taxes under FIN 48 since the Company is unable to specify the future periods in which it may beobligated to settle such amounts.
55

ITEM 7. MANAGEMENT’S DISCUSSION AND ANALYSIS OF FINANCIAL CONDITION ANDRESULTS OF OPERATIONS — (Continued)
Additionally, the Company has guaranteed approximately $35 million of debt capacity held by subsidiariesand $95 million for lifetime lease payments held by consolidated subsidiaries. At December 31, 2007, theCompany has also guaranteed certain Tier 2 suppliers’ debt and lease obligations and other third-partyservice providers’ obligations of up to $2 million to ensure the continued supply of essential parts.
Recent Accounting Pronouncements
See Note 2 to the accompanying consolidated financial statements under Item 8 of this Annual Report onForm 10-K for a discussion of recent accounting pronouncements.
FORWARD-LOOKING STATEMENTS
Certain statements contained or incorporated in this Annual Report on Form 10-K which are notstatements of historical fact constitute “Forward-Looking Statements” within the meaning of the PrivateSecurities Litigation Reform Act of 1995 (the “Reform Act”). Forward-looking statements give currentexpectations or forecasts of future events. Words such as “anticipate”, “expect”, “intend”, “plan”, “believe”,“seek”, “estimate” and other words and terms of similar meaning in connection with discussions of futureoperating or financial performance signify forward-looking statements. These statements reflect theCompany’s current views with respect to future events and are based on assumptions and estimates,which are subject to risks and uncertainties including those discussed in Item 1A under the heading “RiskFactors” and elsewhere in this report. Accordingly, undue reliance should not be placed on these forward-looking statements. Also, these forward-looking statements represent the Company’s estimates andassumptions only as of the date of this report. The Company does not intend to update any of theseforward-looking statements to reflect circumstances or events that occur after the statement is made andqualifies all of its forward-looking statements by these cautionary statements.
You should understand that various factors, in addition to those discussed elsewhere in this document,could affect the Company’s future results and could cause results to differ materially from those expressedin such forward-looking statements, including:
• Visteon’s ability to satisfy its future capital and liquidity requirements; Visteon’s ability to access the creditand capital markets at the times and in the amounts needed and on terms acceptable to Visteon, which isinfluenced by Visteon’s credit ratings (which have declined in the past and could decline further in thefuture); Visteon’s ability to comply with covenants applicable to it; and the continuation of acceptablesupplier payment terms.
• Visteon’s ability to satisfy its pension and other postemployment benefit obligations, and to retireoutstanding debt and satisfy other contractual commitments, all at the levels and times planned bymanagement.
• Visteon’s ability to access funds generated by its foreign subsidiaries and joint ventures on a timely andcost effective basis.
• Changes in the operations (including products, product planning and part sourcing), financial condition,results of operations or market share of Visteon’s customers, particularly its largest customer, Ford.
• Changes in vehicle production volume of Visteon’s customers in the markets where we operate, and inparticular changes in Ford’s North American and European vehicle production volumes and platformmix.
• Visteon’s ability to profitably win new business from customers other than Ford and to maintain currentbusiness with, and win future business from, Ford, and, Visteon’s ability to realize expected sales andprofits from new business.
• Increases in commodity costs or disruptions in the supply of commodities, including steel, resins,aluminum, copper, fuel and natural gas.
56

ITEM 7. MANAGEMENT’S DISCUSSION AND ANALYSIS OF FINANCIAL CONDITION ANDRESULTS OF OPERATIONS — (Continued)
• Visteon’s ability to generate cost savings to offset or exceed agreed upon price reductions or pricereductions to win additional business and, in general, improve its operating performance; to achieve thebenefits of its restructuring actions; and to recover engineering and tooling costs and capitalinvestments.
• Visteon’s ability to compete favorably with automotive parts suppliers with lower cost structures andgreater ability to rationalize operations; and to exit non-performing businesses on satisfactory terms,particularly due to limited flexibility under existing labor agreements.
• Restrictions in labor contracts with unions that restrict Visteon’s ability to close plants, divestnoncompetitive or noncore businesses, change local work rules and practices at a number offacilities and implement cost-saving measures.
• The costs and timing of facility closures or dispositions, business or product realignments, or similarrestructuring actions, including potential asset impairment or other charges related to theimplementation of these actions or other adverse industry conditions and contingent liabilities.
• Significant changes in the competitive environment in the major markets where Visteon procuresmaterials, components or supplies or where its products are manufactured, distributed or sold.
• Legal and administrative proceedings, investigations and claims, including shareholder class actions,regulatory inquiries, product liability, warranty, employee-related environmental and safety claims, andany recalls of products manufactured or sold by Visteon.
• Changes in economic conditions, currency exchange rates, changes in foreign laws, regulations or tradepolicies or political stability in foreign countries where Visteon procures materials, components orsupplies or where its products are manufactured, distributed or sold.
• Shortages of materials or interruptions in transportation systems, labor strikes, work stoppages or otherinterruptions to or difficulties in the employment of labor in the major markets where Visteon purchasesmaterials, components or supplies to manufacture its products or where its products are manufactured,distributed or sold.
• Changes in laws, regulations, policies or other activities of governments, agencies and similarorganizations, domestic and foreign, that may tax or otherwise increase the cost of, or otherwiseaffect, the manufacture, licensing, distribution, sale, ownership or use of Visteon’s products or assets.
• Possible terrorist attacks or acts of war, which could exacerbate other risks such as slowed vehicleproduction, interruptions in the transportation system, or fuel prices and supply.
• The cyclical and seasonal nature of the automotive industry.
• Visteon’s ability to comply with environmental, safety and other regulations applicable to it and anyincrease in the requirements, responsibilities and associated expenses and expenditures of theseregulations.
• Visteon’s ability to protect its intellectual property rights, and to respond to changes in technology andtechnological risks and to claims by others that Visteon infringes their intellectual property rights.
• Visteon’s ability to provide various employee and transition services in accordance with the terms ofexisting agreements, as well as Visteon’s ability to recover the costs of such services.
• Visteon’s ability to quickly and adequately remediate control deficiencies in its internal control overfinancial reporting.
• Other factors, risks and uncertainties detailed from time to time in Visteon’s Securities and ExchangeCommission filings.
57

ITEM 7A. QUANTITATIVE AND QUALITATIVE DISCLOSURES ABOUT MARKET RISK
The Company is exposed to market risks from changes in currency exchange rates, interest rates andcertain commodity prices. To manage these risks, the Company uses a combination of fixed pricecontracts with suppliers, cost sourcing arrangements with customers and financial derivatives. TheCompany maintains risk management controls to monitor the risks and the related hedging. Derivativepositions are examined using analytical techniques such as market value and sensitivity analysis.Derivative instruments are not used for speculative purposes, as per clearly defined risk managementpolicies.
Foreign Currency Risk
The Company’s net cash inflows and outflows exposed to the risk of changes in exchange rates arise fromthe sale of products in countries other than the manufacturing source, foreign currency denominatedsupplier payments, debt and other payables, subsidiary dividends and investments in subsidiaries. TheCompany’s on-going solution is to reduce the exposure through operating actions.
The Company’s primary foreign exchange operating exposures include the Korean Won, Mexican Peso,Euro and Czech Koruna. The Company’s operating results are exposed generally to weakening of the Euroand to strengthening of the Korean Won, Mexican Peso, and Czech Koruna. For transactions in thesecurrencies, the Company utilizes a strategy of partial coverage. As of December 31, 2007, the Company’scoverage for projected transactions in these currencies was approximately 18% for 2008.
As of December 31, 2007 and 2006, the net fair value of foreign currency forward contracts was a liability of$1 million and an asset of $8 million, respectively. The hypothetical pre-tax gain or loss in fair value from a10% change in quoted currency exchange rates would be approximately $30 million and $76 million as ofDecember 31, 2007 and 2006, respectively. These estimated changes assume a parallel shift in allcurrency exchange rates and include the gain or loss on financial instruments used to hedge loans tosubsidiaries. Because exchange rates typically do not all move in the same direction, the estimate mayoverstate the impact of changing exchange rates on the net fair value of the Company’s financialderivatives. It is also important to note that gains and losses indicated in the sensitivity analysis wouldgenerally be offset by gains and losses on the underlying exposures being hedged.
Interest Rate Risk
The Company monitors its exposure to interest rate risk principally in relation to fixed-rate and variable-ratedebt. The Company uses derivative financial instruments to reduce exposure to fluctuations in interestrates in connection with its risk management policies. Accordingly, the Company has entered into certainfixed-for-variable and variable-for-fixed interest rate swap agreements to manage such interest rateexposures. The Company has entered into interest rate swaps for a portion of the 8.25% notes dueAugust 1, 2010 ($125 million) and a portion of the 7.00% notes due March 10, 2014 ($225 million). Theseinterest rate swaps effectively convert the designated portions of these notes from fixed interest rate tovariable interest rate instruments. Additionally, the Company has entered into interest rate swaps for aportion of the $1 billion term loan due 2013 ($200 million), effectively converting the designated portion ofthis loan from a variable interest rate to a fixed interest rate instrument. Approximately 37% and 42% of theCompany’s borrowings were effectively on a fixed rate basis as of December 31, 2007 and 2006,respectively.
As of December 31, 2007 and 2006, the net fair value of interest rate swaps were liabilities of $9 million and$18 million, respectively. The potential loss in fair value of these swaps from a hypothetical 50 basis pointadverse change in interest rates would be approximately $4 million as of December 31, 2007 and 2006.The annual increase in pre-tax interest expense from a hypothetical 50 basis point adverse change invariable interest rates (including the impact of interest rate swaps) would be approximately $9 million and$6 million as of December 31, 2007 and 2006, respectively. This analysis may overstate the adverseimpact on net interest expense because of the short-term nature of the Company’s interest bearinginvestments.
58

ITEM 7A. QUANTITATIVE AND QUALITATIVE DISCLOSURES ABOUT MARKET RISK — (Continued)
Commodity Risk
The Company’s exposure to market risks from changes in the price of production material commodities arenot hedged due to a lack of acceptable hedging instruments in the market. The Company’s exposures toprice changes in these commodities are addressed through negotiations with suppliers and customers,although there can be no assurance that the Company will recover all such costs. When, and if, acceptablehedging instruments are available in the market, management will determine at that time if financialhedging is appropriate, depending upon the Company’s exposure level at that time, the effectiveness of thefinancial hedge and other factors.
In the second quarter of 2005, the Company discontinued hedge accounting treatment for natural gas andcopper forward contracts. Discontinuance of hedge accounting for hedges on transactions that were notexpected to occur resulted in the reclassification of a gain of approximately $8 million from “Accumulatedother comprehensive income (loss)” to “Net income (loss)”. These forward contracts were subsequentlyterminated during the third quarter of 2005. Since completion of the ACH Transactions on October 1, 2005,the Company’s exposure to market risks from changes in the price of natural gas and copper has beensubstantially reduced.
59

ITEM 8. FINANCIAL STATEMENTS AND SUPPLEMENTARY DATA
Index to Consolidated Financial Statements
Page No.
Management’s Report on Internal Control Over Financial Reporting . . . . . . . . . . . . . . . . . . . 61Report of Independent Registered Public Accounting Firm . . . . . . . . . . . . . . . . . . . . . . . . . . 62Consolidated Statements of Operations for the years ended December 31, 2007, 2006 and
2005 . . . . . . . . . . . . . . . . . . . . . . . . . . . . . . . . . . . . . . . . . . . . . . . . . . . . . . . . . . . . . . . . . 63Consolidated Balance Sheets as of December 31, 2007 and 2006 . . . . . . . . . . . . . . . . . . . . 64Consolidated Statements of Cash Flows for the years ended December 31, 2007, 2006 and
2005 . . . . . . . . . . . . . . . . . . . . . . . . . . . . . . . . . . . . . . . . . . . . . . . . . . . . . . . . . . . . . . . . . 65Consolidated Statements of Shareholders’ Deficit for the years ended December 31, 2007,
2006 and 2005 . . . . . . . . . . . . . . . . . . . . . . . . . . . . . . . . . . . . . . . . . . . . . . . . . . . . . . . . . 66Notes to Consolidated Financial Statements . . . . . . . . . . . . . . . . . . . . . . . . . . . . . . . . . . . . . 67
60
ITEM 8. FINANCIAL STATEMENTS AND SUPPLEMENTARY DATA — (Continued)
MANAGEMENT’S REPORT ON INTERNAL CONTROL OVER FINANCIAL REPORTING
Management is responsible for establishing and maintaining adequate internal control over financialreporting as such term is defined under Rule 13a-15(f) of the Securities Exchange Act of 1934. Under thesupervision and with the participation of the principal executive and financial officers of the Company, anevaluation of the effectiveness of internal control over financial reporting was conducted based on theframework in Internal Control — Integrated Framework issued by the Committee of SponsoringOrganizations (“the COSO Framework”) of the Treadway Commission. Based on the evaluationperformed under the COSO Framework as of December 31, 2007, management has concluded thatthe Company’s internal control over financial reporting is effective.
PricewaterhouseCoopers LLP, an independent registered public accounting firm, has audited theeffectiveness of the Company’s internal control over financial reporting as of December 31, 2007, asstated in their report which is included herein.
61

ITEM 8. FINANCIAL STATEMENTS AND SUPPLEMENTARY DATA — (Continued)
REPORT OF INDEPENDENT REGISTERED PUBLIC ACCOUNTING FIRM
To the Board of Directors and ShareholdersVisteon Corporation:
In our opinion, the accompanying consolidated balance sheets and the related consolidated statements ofoperations, shareholders’deficit and cash flows present fairly, in all material respects, the financial positionof Visteon Corporation and its subsidiaries at December 31, 2007 and 2006, and the results of theiroperations and their cash flows for each of the three years in the period ended December 31, 2007 inconformity with accounting principles generally accepted in the United States of America. Also in ouropinion, the Company maintained, in all material respects, effective internal control over financial reportingas of December 31, 2007, based on criteria established in Internal Control - Integrated Framework issuedby the Committee of Sponsoring Organizations of the Treadway Commission (COSO). The Company’smanagement is responsible for these financial statements, for maintaining effective internal control overfinancial reporting and for its assessment of the effectiveness of internal control over financial reporting,included in the accompanying Management’s Report on Internal Control over Financial Reporting. Ourresponsibility is to express opinions on these financial statements and on the Company’s internal controlover financial reporting based on our integrated audits. We conducted our audits in accordance with thestandards of the Public Company Accounting Oversight Board (United States). Those standards requirethat we plan and perform the audits to obtain reasonable assurance about whether the financialstatements are free of material misstatement and whether effective internal control over financialreporting was maintained in all material respects. Our audits of the financial statements includedexamining, on a test basis, evidence supporting the amounts and disclosures in the financialstatements, assessing the accounting principles used and significant estimates made bymanagement, and evaluating the overall financial statement presentation. Our audit of internal controlover financial reporting included obtaining an understanding of internal control over financial reporting,assessing the risk that a material weakness exists, and testing and evaluating the design and operatingeffectiveness of internal control based on the assessed risk. Our audits also included performing suchother procedures as we considered necessary in the circumstances. We believe that our audits provide areasonable basis for our opinions.
As discussed in Note 2 to the consolidated financial statements, Visteon Corporation changed the mannerin which it accounts for share-based compensation in 2006, the manner in which it accounts for the fundedstatus of defined benefit pension and other postretirement plans in 2006, and the measurement date for itsdefined benefit pension and other post retirement plans in 2007.
A company’s internal control over financial reporting is a process designed to provide reasonableassurance regarding the reliability of financial reporting and the preparation of financial statements forexternal purposes in accordance with generally accepted accounting principles. A company’s internalcontrol over financial reporting includes those policies and procedures that (i) pertain to the maintenanceof records that, in reasonable detail, accurately and fairly reflect the transactions and dispositions of theassets of the company; (ii) provide reasonable assurance that transactions are recorded as necessary topermit preparation of financial statements in accordance with generally accepted accounting principles,and that receipts and expenditures of the company are being made only in accordance with authorizationsof management and directors of the company; and (iii) provide reasonable assurance regarding preventionor timely detection of unauthorized acquisition, use, or disposition of the company’s assets that could havea material effect on the financial statements.
Because of its inherent limitations, internal control over financial reporting may not prevent or detectmisstatements. Also, projections of any evaluation of effectiveness to future periods are subject to the riskthat controls may become inadequate because of changes in conditions, or that the degree of compliancewith the policies or procedures may deteriorate.
PricewaterhouseCoopers LLPDetroit, MichiganFebruary 22, 2008
62

ITEM 8. FINANCIAL STATEMENTS AND SUPPLEMENTARY DATA — (Continued)
VISTEON CORPORATION AND SUBSIDIARIES
CONSOLIDATED STATEMENTS OF OPERATIONS
2007 2006 2005Year Ended December 31
(Dollars in Millions,Except Per Share Amounts)
Net salesProducts . . . . . . . . . . . . . . . . . . . . . . . . . . . . . . . . . . . . . . . . . . . . $10,721 $10,706 $16,586Services . . . . . . . . . . . . . . . . . . . . . . . . . . . . . . . . . . . . . . . . . . . . . 545 547 164
11,266 11,253 16,750Cost of sales
Products . . . . . . . . . . . . . . . . . . . . . . . . . . . . . . . . . . . . . . . . . . . . 10,154 9,958 16,043Services . . . . . . . . . . . . . . . . . . . . . . . . . . . . . . . . . . . . . . . . . . . . . 539 542 163
10,693 10,500 16,206
Gross margin . . . . . . . . . . . . . . . . . . . . . . . . . . . . . . . . . . . . . . . . . . 573 753 544
Selling, general and administrative expenses . . . . . . . . . . . . . . . . . . . 636 713 945Restructuring expenses . . . . . . . . . . . . . . . . . . . . . . . . . . . . . . . . . . . 152 93 26Reimbursement from Escrow Account . . . . . . . . . . . . . . . . . . . . . . . . 142 104 51Asset impairments . . . . . . . . . . . . . . . . . . . . . . . . . . . . . . . . . . . . . . . 95 22 1,504Gain on ACH Transactions. . . . . . . . . . . . . . . . . . . . . . . . . . . . . . . . . — — 1,822
Operating (loss) income . . . . . . . . . . . . . . . . . . . . . . . . . . . . . . . . . (168) 29 (58)
Interest expense . . . . . . . . . . . . . . . . . . . . . . . . . . . . . . . . . . . . . . . . 225 190 156Interest income . . . . . . . . . . . . . . . . . . . . . . . . . . . . . . . . . . . . . . . . . 61 31 24Debt extinguishment gain. . . . . . . . . . . . . . . . . . . . . . . . . . . . . . . . . . — 8 —Equity in net income of non-consolidated affiliates . . . . . . . . . . . . . . . 47 33 25
Loss from continuing operations before income taxes, minorityinterests, change in accounting and extraordinary item . . . . . . (285) (89) (165)
Provision for income taxes . . . . . . . . . . . . . . . . . . . . . . . . . . . . . . . . . 20 25 64Minority interests in consolidated subsidiaries . . . . . . . . . . . . . . . . . . 43 31 33
Net loss from continuing operations before change inaccounting and extraordinary item . . . . . . . . . . . . . . . . . . . . . . . (348) (145) (262)
Loss from discontinued operations, net of tax . . . . . . . . . . . . . . . . . . 24 22 8
Net loss before change in accounting and extraordinary item . . . (372) (167) (270)Cumulative effect of change in accounting, net of tax. . . . . . . . . . . . . — (4) —
Net loss before extraordinary item . . . . . . . . . . . . . . . . . . . . . . . . . (372) (171) (270)
Extraordinary item, net of tax . . . . . . . . . . . . . . . . . . . . . . . . . . . . . . . — 8 —
Net loss . . . . . . . . . . . . . . . . . . . . . . . . . . . . . . . . . . . . . . . . . . . . . . $ (372) $ (163) $ (270)
Basic and diluted loss per share:
Continuing operations . . . . . . . . . . . . . . . . . . . . . . . . . . . . . . . . . . . . $ (2.69) $ (1.13) $ (2.08)Discontinued operations. . . . . . . . . . . . . . . . . . . . . . . . . . . . . . . . . . . (0.18) (0.17) (0.06)Net loss . . . . . . . . . . . . . . . . . . . . . . . . . . . . . . . . . . . . . . . . . . . . . . . (2.87) (1.27) (2.14)Cash dividends per share . . . . . . . . . . . . . . . . . . . . . . . . . . . . . . . . . $ — $ — $ —
See accompanying notes to the consolidated financial statements.
63

ITEM 8. FINANCIAL STATEMENTS AND SUPPLEMENTARY DATA — (Continued)
VISTEON CORPORATION AND SUBSIDIARIES
CONSOLIDATED BALANCE SHEETS
2007 2006December 31
(Dollars in Millions)
ASSETSCash and equivalents . . . . . . . . . . . . . . . . . . . . . . . . . . . . . . . . . . . . . . . . . . . . . . $ 1,758 $ 1,057Accounts receivable, net . . . . . . . . . . . . . . . . . . . . . . . . . . . . . . . . . . . . . . . . . . . . 1,150 1,233Interests in accounts receivable transferred . . . . . . . . . . . . . . . . . . . . . . . . . . . . . 434 482Inventories, net . . . . . . . . . . . . . . . . . . . . . . . . . . . . . . . . . . . . . . . . . . . . . . . . . . . 495 520Other current assets . . . . . . . . . . . . . . . . . . . . . . . . . . . . . . . . . . . . . . . . . . . . . . . 235 273
Total current assets . . . . . . . . . . . . . . . . . . . . . . . . . . . . . . . . . . . . . . . . . . . . . . 4,072 3,565
Property and equipment, net. . . . . . . . . . . . . . . . . . . . . . . . . . . . . . . . . . . . . . . . . 2,793 3,034Equity in net assets of non-consolidated affiliates . . . . . . . . . . . . . . . . . . . . . . . . . 218 224Other non-current assets . . . . . . . . . . . . . . . . . . . . . . . . . . . . . . . . . . . . . . . . . . . 122 115
Total assets . . . . . . . . . . . . . . . . . . . . . . . . . . . . . . . . . . . . . . . . . . . . . . . . . . . . . $ 7,205 $ 6,938
LIABILITIES AND SHAREHOLDERS’ DEFICITShort-term debt, including current portion of long-term debt . . . . . . . . . . . . . . . . . $ 95 $ 100Accounts payable . . . . . . . . . . . . . . . . . . . . . . . . . . . . . . . . . . . . . . . . . . . . . . . . . 1,766 1,825Accrued employee liabilities . . . . . . . . . . . . . . . . . . . . . . . . . . . . . . . . . . . . . . . . . 316 323Other current liabilities . . . . . . . . . . . . . . . . . . . . . . . . . . . . . . . . . . . . . . . . . . . . . 351 320
Total current liabilities . . . . . . . . . . . . . . . . . . . . . . . . . . . . . . . . . . . . . . . . . . . . 2,528 2,568
Long-term debt . . . . . . . . . . . . . . . . . . . . . . . . . . . . . . . . . . . . . . . . . . . . . . . . . . . 2,745 2,128Postretirement benefits other than pensions . . . . . . . . . . . . . . . . . . . . . . . . . . . . . 624 747Employee benefits, including pensions . . . . . . . . . . . . . . . . . . . . . . . . . . . . . . . . . 530 924Deferred tax liabilities . . . . . . . . . . . . . . . . . . . . . . . . . . . . . . . . . . . . . . . . . . . . . . 147 170Other non-current liabilities . . . . . . . . . . . . . . . . . . . . . . . . . . . . . . . . . . . . . . . . . . 428 318Minority interests in consolidated subsidiaries . . . . . . . . . . . . . . . . . . . . . . . . . . . . 293 271Shareholders’ deficit
Preferred stock (par value $1.00, 50 million shares authorized, noneoutstanding). . . . . . . . . . . . . . . . . . . . . . . . . . . . . . . . . . . . . . . . . . . . . . . . . . — —
Common stock (par value $1.00, 500 million shares authorized, 131 millionshares issued, 130 million and 129 million shares outstanding,respectively) . . . . . . . . . . . . . . . . . . . . . . . . . . . . . . . . . . . . . . . . . . . . . . . . . 131 131
Stock warrants . . . . . . . . . . . . . . . . . . . . . . . . . . . . . . . . . . . . . . . . . . . . . . . . . 127 127Additional paid-in capital . . . . . . . . . . . . . . . . . . . . . . . . . . . . . . . . . . . . . . . . . . 3,406 3,398Accumulated deficit . . . . . . . . . . . . . . . . . . . . . . . . . . . . . . . . . . . . . . . . . . . . . . (4,016) (3,606)Accumulated other comprehensive income (loss) . . . . . . . . . . . . . . . . . . . . . . . 275 (216)Other. . . . . . . . . . . . . . . . . . . . . . . . . . . . . . . . . . . . . . . . . . . . . . . . . . . . . . . . . (13) (22)
Total shareholders’ deficit . . . . . . . . . . . . . . . . . . . . . . . . . . . . . . . . . . . . . . . . . (90) (188)
Total liabilities and shareholders’ deficit . . . . . . . . . . . . . . . . . . . . . . . . . . . . . . $ 7,205 $ 6,938
See accompanying notes to the consolidated financial statements.
64

ITEM 8. FINANCIAL STATEMENTS AND SUPPLEMENTARY DATA — (Continued)
VISTEON CORPORATION AND SUBSIDIARIES
CONSOLIDATED STATEMENTS OF CASH FLOWS
2007 2006 2005Year Ended December 31
(Dollars in Millions)
Operating ActivitiesNet loss . . . . . . . . . . . . . . . . . . . . . . . . . . . . . . . . . . . . . . . . . . . . . . . . . $ (372) $ (163) $ (270)Adjustments to reconcile net loss to net cash provided from operating
activities:Depreciation and amortization. . . . . . . . . . . . . . . . . . . . . . . . . . . . . . . 472 430 595Asset impairments . . . . . . . . . . . . . . . . . . . . . . . . . . . . . . . . . . . . . . . 107 22 1,511Gain on ACH Transactions . . . . . . . . . . . . . . . . . . . . . . . . . . . . . . . . . — — (1,832)Non-cash tax items . . . . . . . . . . . . . . . . . . . . . . . . . . . . . . . . . . . . . . . (91) (68) —Non-cash postretirement benefits . . . . . . . . . . . . . . . . . . . . . . . . . . . . (29) (72) —Equity in net income of non-consolidated affiliates, net of dividends
remitted. . . . . . . . . . . . . . . . . . . . . . . . . . . . . . . . . . . . . . . . . . . . . . 20 (9) 23Other non-cash items . . . . . . . . . . . . . . . . . . . . . . . . . . . . . . . . . . . . . (6) (10) 44
Changes in assets and liabilities:Accounts receivable and retained interests . . . . . . . . . . . . . . . . . . . . . 216 122 718Inventories . . . . . . . . . . . . . . . . . . . . . . . . . . . . . . . . . . . . . . . . . . . . . 6 55 34Escrow receivable. . . . . . . . . . . . . . . . . . . . . . . . . . . . . . . . . . . . . . . . 33 (28) (27)Accounts payable . . . . . . . . . . . . . . . . . . . . . . . . . . . . . . . . . . . . . . . . (123) (104) (593)Postretirement benefits other than pensions . . . . . . . . . . . . . . . . . . . . (19) (7) 227Income taxes deferred and payable, net . . . . . . . . . . . . . . . . . . . . . . . 20 (4) (40)Other assets and other liabilities . . . . . . . . . . . . . . . . . . . . . . . . . . . . . 59 117 27
Net cash provided from operating activities. . . . . . . . . . . . . . . . . . . . . . . 293 281 417Investing ActivitiesCapital expenditures. . . . . . . . . . . . . . . . . . . . . . . . . . . . . . . . . . . . . . . . (376) (373) (585)Acquisitions and investments in joint ventures, net . . . . . . . . . . . . . . . . . (8) (6) (21)Net cash proceeds from ACH Transactions. . . . . . . . . . . . . . . . . . . . . . . — — 299Other, including proceeds from asset disposals . . . . . . . . . . . . . . . . . . . 207 42 76
Net cash used by investing activities . . . . . . . . . . . . . . . . . . . . . . . . . . . (177) (337) (231)Financing ActivitiesShort-term debt, net . . . . . . . . . . . . . . . . . . . . . . . . . . . . . . . . . . . . . . . . 33 (400) 239Proceeds from issuance of debt, net of issuance costs. . . . . . . . . . . . . . 637 1,378 50Principal payments on debt . . . . . . . . . . . . . . . . . . . . . . . . . . . . . . . . . . (88) (624) (69)Maturity/repurchase of unsecured debt securities . . . . . . . . . . . . . . . . . . — (141) (250)Other, including book overdrafts . . . . . . . . . . . . . . . . . . . . . . . . . . . . . . . (35) 1 (21)
Net cash provided from (used by) financing activities . . . . . . . . . . . . . . . 547 214 (51)Effect of exchange rate changes on cash . . . . . . . . . . . . . . . . . . . . . . . . 38 34 (22)
Net increase in cash and equivalents . . . . . . . . . . . . . . . . . . . . . . . . . . . 701 192 113Cash and equivalents at beginning of year . . . . . . . . . . . . . . . . . . . . . . . 1,057 865 752
Cash and equivalents at end of year . . . . . . . . . . . . . . . . . . . . . . . . . . . $1,758 $1,057 $ 865
Cash paid for:Interest . . . . . . . . . . . . . . . . . . . . . . . . . . . . . . . . . . . . . . . . . . . . . . . . . $ 215 $ 197 $ 164Income taxes paid, net of refunds. . . . . . . . . . . . . . . . . . . . . . . . . . . . . . $ 91 $ 97 $ 104
See accompanying notes to the consolidated financial statements.
65

ITEM 8. FINANCIAL STATEMENTS AND SUPPLEMENTARY DATA — (Continued)
VISTEON CORPORATION AND SUBSIDIARIES
CONSOLIDATED STATEMENTS OF SHAREHOLDERS’ DEFICIT2007 2006 2005
(Dollars in Millions)
Common StockBalance at January 1 . . . . . . . . . . . . . . . . . . . . . . . . . . . . . . . . . . . . $ 131 $ 131 $ 131Balance at December 31 . . . . . . . . . . . . . . . . . . . . . . . . . . . . . . . . . $ 131 $ 131 $ 131
Stock WarrantsBalance at January 1 . . . . . . . . . . . . . . . . . . . . . . . . . . . . . . . . . . . . $ 127 $ 127 $ —Issuance of stock warrants . . . . . . . . . . . . . . . . . . . . . . . . . . . . . . . . — — 127Balance at December 31 . . . . . . . . . . . . . . . . . . . . . . . . . . . . . . . . . $ 127 $ 127 $ 127
Additional Paid-In CapitalBalance at January 1 . . . . . . . . . . . . . . . . . . . . . . . . . . . . . . . . . . . . $ 3,398 $ 3,396 $ 3,380Shares issued for stock options exercised . . . . . . . . . . . . . . . . . . . . — — (2)Share-based compensation . . . . . . . . . . . . . . . . . . . . . . . . . . . . . . . 8 2 18Balance at December 31 . . . . . . . . . . . . . . . . . . . . . . . . . . . . . . . . . $ 3,406 $ 3,398 $ 3,396
Accumulated DeficitBalance at January 1 . . . . . . . . . . . . . . . . . . . . . . . . . . . . . . . . . . . . $(3,606) $(3,440) $(3,170)Net loss . . . . . . . . . . . . . . . . . . . . . . . . . . . . . . . . . . . . . . . . . . . . . . (372) (163) (270)SFAS 158 adjustment . . . . . . . . . . . . . . . . . . . . . . . . . . . . . . . . . . . . (34) — —Shares issued for stock options exercised . . . . . . . . . . . . . . . . . . . . (4) (3) —Balance at December 31 . . . . . . . . . . . . . . . . . . . . . . . . . . . . . . . . . $(4,016) $(3,606) $(3,440)
Accumulated Other Comprehensive Income (Loss)Balance at January 1 . . . . . . . . . . . . . . . . . . . . . . . . . . . . . . . . . . . . $ (216) $ (234) $ 5
Net foreign currency translation adjustment . . . . . . . . . . . . . . . . . . 131 121 (154)Net change in pension obligation. . . . . . . . . . . . . . . . . . . . . . . . . . 158 25 (64)Net (loss) gain on derivatives and other. . . . . . . . . . . . . . . . . . . . . (8) 1 (21)
Net other comprehensive income (loss) adjustments. . . . . . . . . . . . . 281 147 (239)Cumulative effect of adoption of SFAS 158 . . . . . . . . . . . . . . . . . . . . 210 (129) —Balance at December 31 . . . . . . . . . . . . . . . . . . . . . . . . . . . . . . . . . $ 275 $ (216) $ (234)
Other — Treasury StockBalance at January 1 . . . . . . . . . . . . . . . . . . . . . . . . . . . . . . . . . . . . $ (22) $ (27) $ (17)Shares issued for stock options exercised . . . . . . . . . . . . . . . . . . . . 10 9 5Treasury stock activity. . . . . . . . . . . . . . . . . . . . . . . . . . . . . . . . . . . . (1) (4) (2)Restricted stock awards forfeited . . . . . . . . . . . . . . . . . . . . . . . . . . . — — (13)Balance at December 31 . . . . . . . . . . . . . . . . . . . . . . . . . . . . . . . . . $ (13) $ (22) $ (27)
Other — Unearned Stock CompensationBalance at January 1 . . . . . . . . . . . . . . . . . . . . . . . . . . . . . . . . . . . . $ — $ (1) $ (9)Restricted stock awards compensation, net . . . . . . . . . . . . . . . . . . . — — 8Other . . . . . . . . . . . . . . . . . . . . . . . . . . . . . . . . . . . . . . . . . . . . . . . . — 1 —Balance at December 31 . . . . . . . . . . . . . . . . . . . . . . . . . . . . . . . . . $ — $ — $ (1)
Total Shareholders’ Deficit. . . . . . . . . . . . . . . . . . . . . . . . . . . . . . . $ (90) $ (188) $ (48)
Comprehensive LossNet loss . . . . . . . . . . . . . . . . . . . . . . . . . . . . . . . . . . . . . . . . . . . . . . $ (372) $ (163) $ (270)Net other comprehensive income (loss) adjustments. . . . . . . . . . . . . 281 147 (239)Total comprehensive loss . . . . . . . . . . . . . . . . . . . . . . . . . . . . . . . . . $ (91) $ (16) $ (509)
See accompanying notes to the consolidated financial statements.
66

VISTEON CORPORATION AND SUBSIDIARIES
NOTES TO CONSOLIDATED FINANCIAL STATEMENTS
NOTE 1. Description of Business and Company Background
Visteon Corporation (the “Company” or “Visteon”) is a leading global supplier of automotive systems,modules and components. The Company sells products primarily to global vehicle manufacturers and tothe worldwide aftermarket for replacement and enhancement parts. The Company’s operations areorganized by global product groups including Climate, Electronics, Interiors and Other and are principallyconducted in the United States, Mexico, Canada, Germany, United Kingdom, France, Spain, Portugal,Czech Republic, Korea, China, India, Brazil and Argentina.
The Company became an independent company when Ford Motor Company and affiliates (including AutoAlliance International, a joint venture between Ford and Mazda) (“Ford” or “Ford Motor Company”),established the Company as a wholly-owned subsidiary in January 2000 and subsequently transferred tothe Company the assets and liabilities comprising Ford’s automotive components and systems business.Ford completed its spin-off of the Company on June 28, 2000. Prior to incorporation, the Companyoperated as Ford’s automotive components and systems business.
ACH Transactions
On May 24, 2005, the Company and Ford entered into a non-binding Memorandum of Understanding(“MOU”), setting forth a framework for the transfer of 23 North American facilities and related assets andliabilities (the “Business”) to a Ford-controlled entity. In September 2005, the Company and Ford enteredinto several definitive agreements and the Company completed the transfer of the Business to AutomotiveComponents Holdings, LLC (“ACH”), an indirect, wholly owned subsidiary of the Company, pursuant to theterms of various agreements described below. Following the signing of the MOU and at June 30, 2005, theCompany classified the related assets and liabilities as “held for sale” and recorded a non-cash impairmentcharge of $920 million to adjust those assets considered “held for sale” to their aggregate estimated fairvalue less cost to sell in accordance with Statement of Financial Accounting Standards No. 144(“SFAS 144”), “Accounting for the Impairment or Disposal of Long-Lived Assets.”
On October 1, 2005, Visteon sold ACH to Ford for cash proceeds of approximately $300 million, as well asthe forgiveness of certain other postretirement employee benefit (“OPEB”) liabilities and other obligationsrelating to hourly employees associated with the Business, and the assumption of certain other liabilitieswith respect to the Business (together, the “ACH Transactions”). The ACH Transactions also provided forthe termination of the Hourly Employee Assignment Agreement and complete relief to the Company of allliabilities relating to Visteon-assigned Ford UAW hourly employees. Previously deferred amounts relatingto the 2003 forgiveness of debt, accounted for pursuant to Statement of Financial Accounting StandardsNo. 15 (“SFAS 15”), “Accounting by Debtors and Creditors for Troubled Debt Restructurings,” werereleased to income concurrent with the ACH Transactions and have been included in the “Gain on ACHTransactions.”
67

NOTE 1. Description of Business and Company Background — (Continued)
Additionally, on October 1, 2005, Ford acquired from the Company warrants to acquire 25 million shares ofthe Company’s common stock (the “Warrant and Stockholder Agreement”) and agreed to provide$550 million (pursuant to the “Escrow Agreement” and the “Reimbursement Agreement”) to be used inthe Company’s further restructuring. The Warrant and Stockholder Agreement provides for certainregistration rights with respect to the shares of common stock underlying the warrant and containsrestrictions on the transfer of the warrant and the underlying shares of common stock. Pursuant to theEscrow Agreement, dated as of October 1, 2005, among the Company, Ford and Deutsche BankTrust Company Americas, as escrow agent, Ford paid $400 million into an escrow account for use bythe Company to restructure its businesses. The Escrow Agreement provides that the Company will bereimbursed from the escrow account for the first $250 million of reimbursable restructuring costs asdefined in the Escrow Agreement, and up to one half of the next $300 million of such costs. Pursuant to theReimbursement Agreement, dated as of October 1, 2005, between the Company and Ford, the Companywill be reimbursed for up to $150 million of separation costs associated with those Company salariedemployees who are leased to ACH, and whose services are no longer required by ACH or a subsequentbuyer. The Reimbursement Agreement provides that Ford will reimburse the Company for the first$50 million and up to one half of the next $200 million of such costs. Subject to change of controlrestrictions, any unused funds under the Escrow and Reimbursement Agreements reverts to the Companyupon expiration of such agreement.
Pursuant to the Master Services Agreement dated September 30, 2005 between the Company and ACH,the Company provides information technology and other transitional services to ACH. The services areprovided at a rate approximating the Company’s cost until such time the services are no longer required byACH but not later than December 31, 2008.
The following table summarizes the impact of the ACH Transactions, including $10 million reported indiscontinued operations.
Assets, Liabilitiesand Other
Consideration asof October 1, 2005
Gain on ACHTransactions Forthe Year Ended
December 31, 2005
(Dollars in Millions)
Assets transferred to ACHInventories . . . . . . . . . . . . . . . . . . . . . . . . . . . . . . . . . . . . . . . $ (299)Property and equipment . . . . . . . . . . . . . . . . . . . . . . . . . . . . . (578)Prepaid and other assets. . . . . . . . . . . . . . . . . . . . . . . . . . . . . (75)
$ (952)Proceeds from divestiture of ACH
Cash . . . . . . . . . . . . . . . . . . . . . . . . . . . . . . . . . . . . . . . . . . . . 299Forgiveness of indebtedness:
OPEB liabilities . . . . . . . . . . . . . . . . . . . . . . . . . . . . . . . . . . 2,164Employee fringe benefits . . . . . . . . . . . . . . . . . . . . . . . . . . . 260Other liabilities . . . . . . . . . . . . . . . . . . . . . . . . . . . . . . . . . . . 241
2,964Stock warrants issued to Ford. . . . . . . . . . . . . . . . . . . . . . . . . . . (127)Other consideration. . . . . . . . . . . . . . . . . . . . . . . . . . . . . . . . . . . (53)
(180)
Gain on ACH Transactions . . . . . . . . . . . . . . . . . . . . . . . . . . . . . $1,832
68
VISTEON CORPORATION AND SUBSIDIARIES
NOTES TO CONSOLIDATED FINANCIAL STATEMENTS — (Continued)
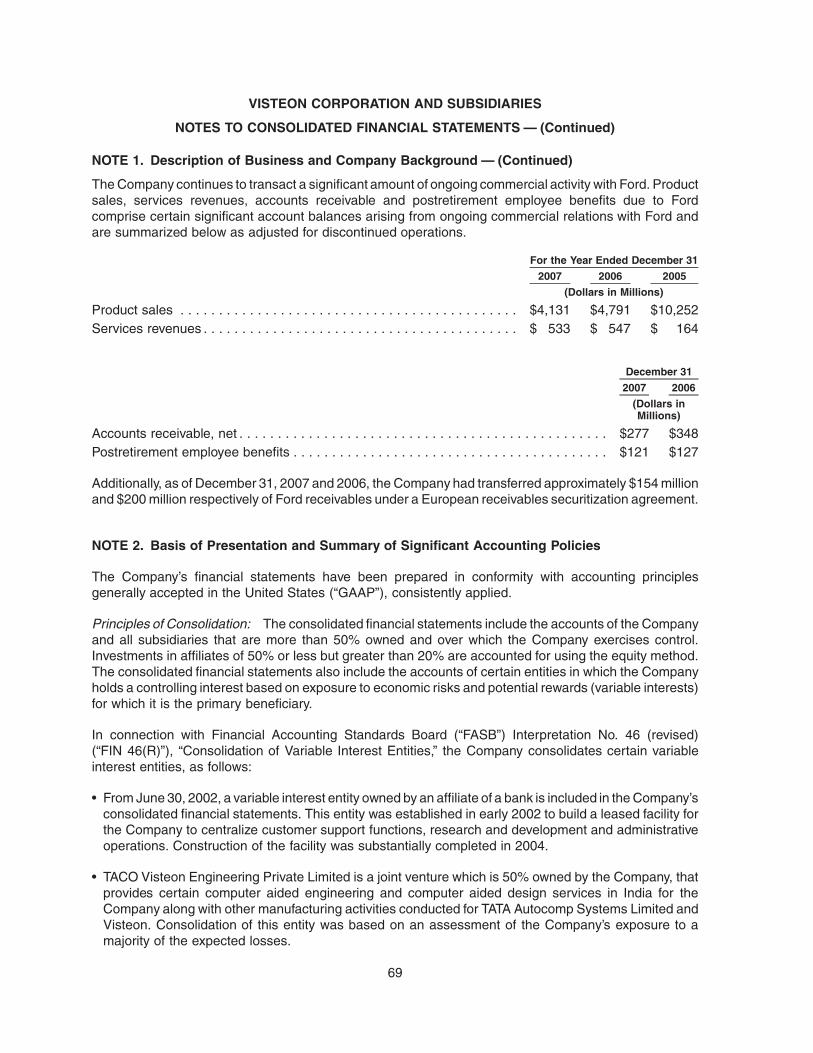
NOTE 1. Description of Business and Company Background — (Continued)
The Company continues to transact a significant amount of ongoing commercial activity with Ford. Productsales, services revenues, accounts receivable and postretirement employee benefits due to Fordcomprise certain significant account balances arising from ongoing commercial relations with Ford andare summarized below as adjusted for discontinued operations.
2007 2006 2005
For the Year Ended December 31
(Dollars in Millions)
Product sales . . . . . . . . . . . . . . . . . . . . . . . . . . . . . . . . . . . . . . . . . . . . $4,131 $4,791 $10,252Services revenues . . . . . . . . . . . . . . . . . . . . . . . . . . . . . . . . . . . . . . . . . $ 533 $ 547 $ 164
2007 2006
December 31
(Dollars inMillions)
Accounts receivable, net . . . . . . . . . . . . . . . . . . . . . . . . . . . . . . . . . . . . . . . . . . . . . . . . $277 $348Postretirement employee benefits . . . . . . . . . . . . . . . . . . . . . . . . . . . . . . . . . . . . . . . . . $121 $127
Additionally, as of December 31, 2007 and 2006, the Company had transferred approximately $154 millionand $200 million respectively of Ford receivables under a European receivables securitization agreement.
NOTE 2. Basis of Presentation and Summary of Significant Accounting Policies
The Company’s financial statements have been prepared in conformity with accounting principlesgenerally accepted in the United States (“GAAP”), consistently applied.
Principles of Consolidation: The consolidated financial statements include the accounts of the Companyand all subsidiaries that are more than 50% owned and over which the Company exercises control.Investments in affiliates of 50% or less but greater than 20% are accounted for using the equity method.The consolidated financial statements also include the accounts of certain entities in which the Companyholds a controlling interest based on exposure to economic risks and potential rewards (variable interests)for which it is the primary beneficiary.
In connection with Financial Accounting Standards Board (“FASB”) Interpretation No. 46 (revised)(“FIN 46(R)”), “Consolidation of Variable Interest Entities,” the Company consolidates certain variableinterest entities, as follows:
• From June 30, 2002, a variable interest entity owned by an affiliate of a bank is included in the Company’sconsolidated financial statements. This entity was established in early 2002 to build a leased facility forthe Company to centralize customer support functions, research and development and administrativeoperations. Construction of the facility was substantially completed in 2004.
• TACO Visteon Engineering Private Limited is a joint venture which is 50% owned by the Company, thatprovides certain computer aided engineering and computer aided design services in India for theCompany along with other manufacturing activities conducted for TATA Autocomp Systems Limited andVisteon. Consolidation of this entity was based on an assessment of the Company’s exposure to amajority of the expected losses.
69
VISTEON CORPORATION AND SUBSIDIARIES
NOTES TO CONSOLIDATED FINANCIAL STATEMENTS — (Continued)

NOTE 2. Basis of Presentation and Summary of Significant Accounting Policies — (Continued)
• MIG-Visteon Automotive Systems, LLC is a joint venture which is 49% owned by the Company or itssubsidiaries, that supplies integrated cockpit modules and systems. Consolidation of this entity wasbased on an assessment of the amount of equity investment at risk, the subordinated financial supportprovided by the Company, and that substantially all of the joint venture’s operations are performed onbehalf of the Company.
The effect of consolidation of variable interest entities on the Company’s results of operations or financialposition as of December 31, 2007 was not significant as substantially all of the joint ventures’ liabilities andcosts are related to activity with the Company. As of December 31, 2007, these variable interest entitieshave total assets of $254 million and total liabilities of $29 million.
Reclassifications: Certain prior year amounts have been reclassified to conform to current yearpresentation.
Use of Estimates: The preparation of the financial statements in conformity with GAAP requiresmanagement to make estimates, judgments and assumptions that affect amounts reported herein.Management believes that such estimates, judgments and assumptions are reasonable andappropriate. However, due to the inherent uncertainty involved, actual results may differ from thoseprovided in the Company’s consolidated financial statements.
Foreign Currency: Assets and liabilities of the Company’s non-U.S. businesses are translated intoU.S. Dollars at end-of-period exchange rates and the related translation adjustments are reported in theconsolidated balance sheets under the classification of “Accumulated other comprehensive income(loss).” The effects of remeasurement of assets and liabilities of the Company’s non-U.S. businessesthat use the U.S. Dollar as their functional currency are included in the consolidated statements ofoperations as transaction gains and losses. Income and expense elements of the Company’snon-U.S. businesses are translated into U.S. Dollars at average-period exchange rates and arereflected in the consolidated statements of operations as part of sales, costs and expenses.Additionally, gains and losses resulting from transactions denominated in a currency other than thefunctional currency are included in the consolidated statements of operations as transaction gains andlosses. Transaction losses of $6 million in both 2007 and 2006 and transaction gains of $2 million in 2005resulted from the remeasurement of certain deferred foreign tax liabilities and are included within incometaxes. Net transaction gains and losses, as described above, decreased net loss by $2 million, $3 millionand $9 million in 2007, 2006 and 2005, respectively.
Revenue Recognition: The Company records revenue when persuasive evidence of an arrangementexists, delivery occurs or services are rendered, the sales price or fee is fixed or determinable andcollectibility is reasonably assured. The Company ships product and records revenue pursuant tocommercial agreements with its customers generally in the form of an approved purchase order,including the effects of contractual customer price productivity. The Company does negotiate discreteprice changes with its customers, which are generally the result of unique commercial issues between theCompany and its customers and are generally the subject of specific negotiations between the Companyand its customers. The Company records amounts associated with discrete price changes as a reductionto revenue when specific facts and circumstances indicate that a price reduction is probable and theamounts are reasonably estimable. The Company records amounts associated with discrete pricechanges as an increase to revenue upon execution of a legally enforceable contractual agreement andwhen collectibility is reasonably assured.
Services revenues are recognized as services are rendered and associated costs of providing suchservices are recorded as incurred.
70
VISTEON CORPORATION AND SUBSIDIARIES
NOTES TO CONSOLIDATED FINANCIAL STATEMENTS — (Continued)

NOTE 2. Basis of Presentation and Summary of Significant Accounting Policies — (Continued)
Cash Equivalents: The Company considers all highly liquid investments purchased with a maturity ofthree months or less, including short-term time deposits, commercial paper, repurchase agreements andmoney market funds to be cash equivalents.
Accounts Receivable and Allowance for Doubtful Accounts: Accounts receivable are stated at historicalvalue, which approximates fair value. The Company does not generally require collateral from itscustomers. Accounts receivable are reduced by an allowance for amounts that may be uncollectible inthe future. This estimated allowance is determined by considering factors such as length of time accountsare past due, historical experience of write-offs, and customer financial condition. If not reserved throughspecific examination procedures, the Company’s general policy for uncollectible accounts is to reservebased upon the aging categories of accounts receivable. Past due status is based upon the invoice date ofthe original amounts outstanding. Included in selling, general and administrative (“SG&A”) expenses arerecoveries in excess of provisions for estimated uncollectible accounts receivable of $19 million for theyear ended December 31, 2007 and provisions for estimated uncollectible accounts receivable of $4 millionand $45 million for the years ended December 31, 2006 and 2005, respectively. The allowance for doubtfulaccounts balance was $18 million, $44 million and $77 million at December 31, 2007, 2006 and 2005,respectively.
Interests in Accounts Receivable Transferred: When the Company sells receivables under a certainasset transfer arrangement it retains servicing rights, one or more subordinated tranches, and a cashreserve balance. These retained amounts are recorded in the Company’s consolidated balance sheets as“Interests in accounts receivable transferred.” Such amounts are recorded at their carrying values, whichapproximate fair value due to the current nature of the related maturities.
Inventories: Inventories are stated at the lower of cost, determined on a first-in, first-out (“FIFO”) basis, ormarket. Inventories are reduced by an allowance for excess and obsolete inventories based onmanagement’s review of on-hand inventories compared to historical and estimated future sales andusage.
Product Tooling: Product tooling includes molds, dies and other tools used in production of a specific partor parts of the same basic design. The Company accounts for product tooling in accordance with therequirements of Emerging Issue Task Force Issue No. 99-5 (“EITF 99-5”), “Accounting for Pre-ProductionCosts Related to Long-Term Supply Arrangements.” EITF 99-5 generally requires that non-reimbursabledesign and development costs for products to be sold under long-term supply arrangements be expensedas incurred and costs incurred for molds, dies and other tools that will be owned by the Company or itscustomers and used in producing the products under long-term supply arrangements be capitalized andamortized over the shorter of the expected useful life of the assets or the term of the supply arrangement.Contractually reimbursable design and development costs that would otherwise be expensed underEITF 99-5 are recorded as an asset as incurred.
Product tooling owned by the Company is capitalized as property and equipment, and amortized to cost ofsales over its estimated economic life, generally not exceeding six years. The net book value of producttooling owned by the Company was $148 million and $164 million as of December 31, 2007 and 2006,respectively. Unbilled receivables related to production tools in progress, which will not be owned by theCompany and for which there is a contractual agreement for reimbursement from the customer, wereapproximately $14 million, $74 million and $68 million as of December 31, 2007, 2006 and 2005,respectively.
71
VISTEON CORPORATION AND SUBSIDIARIES
NOTES TO CONSOLIDATED FINANCIAL STATEMENTS — (Continued)

NOTE 2. Basis of Presentation and Summary of Significant Accounting Policies — (Continued)
Restructuring: The Company defines restructuring expense to include costs directly associated with exitor disposal activities accounted for in accordance with Statement of Financial Accounting StandardsNo. 146 (“SFAS 146”), “Accounting for Costs Associated with Exit or Disposal Activities,” employeeseverance and special termination benefit costs incurred as a result of an exit or disposal activity or afundamental realignment accounted for in accordance with Statement of Financial Accounting StandardsNo. 88 (“SFAS 88”), “Employers’ Accounting for Settlements and Curtailments of Defined Benefit PensionPlans and for Termination Benefits” and Statement of Financial Accounting Standards No. 112(“SFAS 112”), “Employers’ Accounting for Postemployment Benefits” and pension and otherpostretirement employee benefit costs incurred as a result of an exit or disposal activity or afundamental realignment accounted for in accordance with Statement of Financial AccountingStandard No. 87 (“SFAS 87”), “Employers’ Accounting for Pensions” and Statement of AccountingStandard No. 106 (“SFAS 106”), “Employers’ Accounting for Postretirement Benefits Other than Pensions.”
Long-Lived Assets and Certain Identifiable Intangibles: Long-lived assets, such as property andequipment and definite-lived intangible assets are stated at cost or fair value for impaired assets.Depreciation or amortization is computed principally by the straight-line method for financial reportingpurposes and by accelerated methods for income tax purposes in certain jurisdictions. Long-lived assetsand intangible assets subject to amortization are depreciated or amortized over the estimated useful life ofthe asset.
Asset impairment charges are recorded for long-lived assets and intangible assets subject to amortizationwhen events and circumstances indicate that such assets may be impaired and the undiscounted net cashflows estimated to be generated by those assets are less than their carrying amounts. If estimated futureundiscounted cash flows are not sufficient to recover the carrying value of the assets, an impairmentcharge is recorded for the amount by which the carrying value of the assets exceeds its fair value. TheCompany classifies assets and liabilities as held for sale when management approves and commits to aformal plan of sale and it is probable that the sale will be completed. The carrying value of the assets andliabilities held for sale are recorded at the lower of carrying value or fair value less cost to sell, and therecording of depreciation is ceased. Fair value is determined using appraisals, management estimates ordiscounted cash flow calculations.
Capitalized Software Costs: Certain costs incurred in the acquisition or development of software forinternal use are capitalized in accordance with Statement of Position No. 98-1 “Accounting for the Costs ofComputer Software Developed or Obtained for Internal Use.” Capitalized software costs are amortizedusing the straight-line method over estimated useful lives generally ranging from 3 to 8 years. The net bookvalue of capitalized software costs was approximately $66 million, $83 million and $112 million atDecember 31, 2007, 2006 and 2005, respectively. Related amortization expense was approximately$40 million, $41 million and $39 million for the years ended December 31, 2007, 2006 and 2005,respectively. Amortization expense of approximately $39 million is expected for 2008 and is expectedto decrease to $30 million, $34 million and $31 million for 2009, 2010 and 2011, respectively.
Pensions and Other Postretirement Employee Benefits: Pensions and other postretirement employeebenefit costs and related liabilities and assets are dependent upon assumptions used in calculating suchamounts. These assumptions include discount rates, expected returns on plan assets, health care costtrends, compensation and other factors. In accordance with GAAP, actual results that differ from theassumptions used are accumulated and amortized over future periods, and accordingly, generally affectrecognized expense in future periods.
72
VISTEON CORPORATION AND SUBSIDIARIES
NOTES TO CONSOLIDATED FINANCIAL STATEMENTS — (Continued)
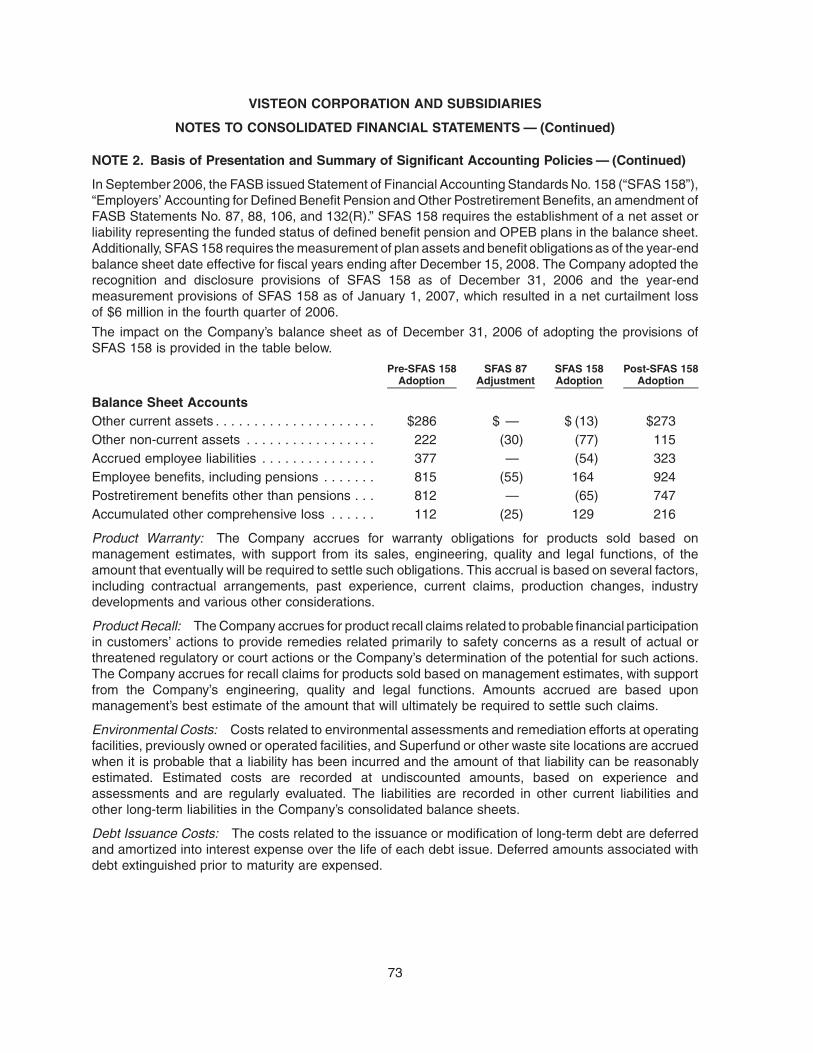
NOTE 2. Basis of Presentation and Summary of Significant Accounting Policies — (Continued)
In September 2006, the FASB issued Statement of Financial Accounting Standards No. 158 (“SFAS 158”),“Employers’ Accounting for Defined Benefit Pension and Other Postretirement Benefits, an amendment ofFASB Statements No. 87, 88, 106, and 132(R).” SFAS 158 requires the establishment of a net asset orliability representing the funded status of defined benefit pension and OPEB plans in the balance sheet.Additionally, SFAS 158 requires the measurement of plan assets and benefit obligations as of the year-endbalance sheet date effective for fiscal years ending after December 15, 2008. The Company adopted therecognition and disclosure provisions of SFAS 158 as of December 31, 2006 and the year-endmeasurement provisions of SFAS 158 as of January 1, 2007, which resulted in a net curtailment lossof $6 million in the fourth quarter of 2006.
The impact on the Company’s balance sheet as of December 31, 2006 of adopting the provisions ofSFAS 158 is provided in the table below.
Pre-SFAS 158Adoption
SFAS 87Adjustment
SFAS 158Adoption
Post-SFAS 158Adoption
Balance Sheet AccountsOther current assets . . . . . . . . . . . . . . . . . . . . . $286 $ — $ (13) $273Other non-current assets . . . . . . . . . . . . . . . . . 222 (30) (77) 115Accrued employee liabilities . . . . . . . . . . . . . . . 377 — (54) 323Employee benefits, including pensions . . . . . . . 815 (55) 164 924Postretirement benefits other than pensions . . . 812 — (65) 747Accumulated other comprehensive loss . . . . . . 112 (25) 129 216
Product Warranty: The Company accrues for warranty obligations for products sold based onmanagement estimates, with support from its sales, engineering, quality and legal functions, of theamount that eventually will be required to settle such obligations. This accrual is based on several factors,including contractual arrangements, past experience, current claims, production changes, industrydevelopments and various other considerations.
Product Recall: The Company accrues for product recall claims related to probable financial participationin customers’ actions to provide remedies related primarily to safety concerns as a result of actual orthreatened regulatory or court actions or the Company’s determination of the potential for such actions.The Company accrues for recall claims for products sold based on management estimates, with supportfrom the Company’s engineering, quality and legal functions. Amounts accrued are based uponmanagement’s best estimate of the amount that will ultimately be required to settle such claims.
Environmental Costs: Costs related to environmental assessments and remediation efforts at operatingfacilities, previously owned or operated facilities, and Superfund or other waste site locations are accruedwhen it is probable that a liability has been incurred and the amount of that liability can be reasonablyestimated. Estimated costs are recorded at undiscounted amounts, based on experience andassessments and are regularly evaluated. The liabilities are recorded in other current liabilities andother long-term liabilities in the Company’s consolidated balance sheets.
Debt Issuance Costs: The costs related to the issuance or modification of long-term debt are deferredand amortized into interest expense over the life of each debt issue. Deferred amounts associated withdebt extinguished prior to maturity are expensed.
73
VISTEON CORPORATION AND SUBSIDIARIES
NOTES TO CONSOLIDATED FINANCIAL STATEMENTS — (Continued)

NOTE 2. Basis of Presentation and Summary of Significant Accounting Policies — (Continued)
Other Costs: Advertising and sales promotion costs, repair and maintenance costs, research anddevelopment costs, and pre-production operating costs are expensed as incurred. Research anddevelopment expenses include salary and related employee benefits, contractor fees, informationtechnology, occupancy, telecommunications and depreciation. Advertising costs were $3 million in2007, $4 million in 2006 and $12 million in 2005. Research and development costs were $510 millionin 2007, $594 million in 2006 and $804 million in 2005. Shipping and handling costs are recorded in theCompany’s consolidated statements of operations as “Cost of sales.”
Income Taxes: The Company accounts for income taxes in accordance with Statement of FinancialAccounting Standards No. 109 (“SFAS 109”), “Accounting for Income Taxes.” Deferred tax assets andliabilities are recognized for the future tax consequences attributable to differences between financialstatement carrying amounts of existing assets and liabilities and their respective tax bases and operatingloss and tax credit carryforwards. Deferred tax assets and liabilities are measured using enacted tax ratesexpected to apply to taxable income in the years in which those temporary differences are expected to berecovered or settled. The Company records a valuation allowance on deferred tax assets by tax jurisdictionwhen it is more likely than not that such assets will not be realized. Management judgment is required indetermining the Company’s valuation allowance on deferred tax assets.
Derivative Financial Instruments: The Company uses derivative financial instruments, including forwardcontracts, swaps and options, to manage exposures to changes in currency exchange rates and interestrates. All derivative financial instruments are classified as “held for purposes other than trading.” TheCompany’s policy specifically prohibits the use of derivatives for speculative purposes.
Stock-Based Compensation: In December 2004, the FASB issued Statement of Financial AccountingStandards No. 123 (Revised 2004) (“SFAS 123(R)”), “Share-Based Payments.” This statement requiresthat all share-based payments to employees be recognized in the financial statements based on theirestimated fair value. SFAS 123(R) was adopted by the Company effective January 1, 2006 using themodified-prospective method. In accordance with the modified-prospective method, the Company’sconsolidated financial statements for prior periods have not been restated to reflect, and do notinclude, the impact of SFAS 123(R). Under the modified-prospective method, compensation expenseincludes:
• Share-based payments granted prior to, but not yet vested as of January 1, 2006, based on the fair valueestimated in accordance with the original provisions of Statement of Financial Accounting StandardsNo. 123, (“SFAS 123”) “Accounting for Stock-Based Compensation.”
• Share-based payments granted subsequent to January 1, 2006, based on the fair value estimated inaccordance with the provisions of SFAS 123(R).
The cumulative effect, net of tax, of adoption of SFAS 123(R) was $4 million or $0.03 per share as ofJanuary 1, 2006. The Company recorded $13 million, or $0.10 per share, of incremental compensationexpense during the year ended December 31, 2006 under SFAS 123(R) when compared to the amountthat would have been recorded under SFAS 123. Additional disclosures required by SFAS 123(R)regarding the Company’s stock-based compensation plans and related accounting are provided inNote 7 “Stock-Based Compensation.”
74
VISTEON CORPORATION AND SUBSIDIARIES
NOTES TO CONSOLIDATED FINANCIAL STATEMENTS — (Continued)

NOTE 2. Basis of Presentation and Summary of Significant Accounting Policies — (Continued)
Prior to the adoption of SFAS 123(R) and effective January 1, 2003, the Company began expensing the fairvalue of stock-based awards granted to employees pursuant to SFAS 123. This standard was adopted onthe prospective method basis for stock-based awards granted, modified or settled afterDecember 31, 2002. For stock options and restricted stock awards granted prior to January 1, 2003,the Company measured compensation cost using the intrinsic value method of Accounting PrinciplesBoard Opinion No. 25, “Accounting for Stock Issued to Employees” as permitted by SFAS 123.
If compensation cost for all stock-based awards had been determined based on the estimated fair value ofstock options and the fair value at the date of grant for restricted stock awards, in accordance with theprovisions of SFAS 123, the Company’s reported net loss and net loss per share would have resulted in thepro forma amounts provided below:
2005(Dollars in Millions,Except Per Share
Amounts)
Net loss, as reported . . . . . . . . . . . . . . . . . . . . . . . . . . . . . . . . . . . . . . . . . . . . . . . . $ (270)Add: Stock-based employee compensation expense included in reported net loss,
net of related tax effects . . . . . . . . . . . . . . . . . . . . . . . . . . . . . . . . . . . . . . . . . . . . 20Deduct: Total stock-based employee compensation expense determined under fair
value based method for all awards, net of related tax effects . . . . . . . . . . . . . . . . (21)
Pro forma net loss . . . . . . . . . . . . . . . . . . . . . . . . . . . . . . . . . . . . . . . . . . . . . . . . . . $ (271)
Net loss per shareAs reported:
Basic and diluted . . . . . . . . . . . . . . . . . . . . . . . . . . . . . . . . . . . . . . . . . . . . . . . . . $(2.14)Pro forma:
Basic and diluted . . . . . . . . . . . . . . . . . . . . . . . . . . . . . . . . . . . . . . . . . . . . . . . . . $(2.15)
Recent Accounting Pronouncements: In December 2007, the FASB issued Statement of FinancialAccounting Standards No. 141(R) (“SFAS 141(R)”), “Business Combinations” and Statement of FinancialAccounting Standards No. 160 (“SFAS 160”) “Non-controlling Interests in Consolidated FinancialStatements, an amendment to ARB No. 51.” These new standards will significantly change thefinancial accounting and reporting of business combination transactions and non-controlling (orminority) interests in consolidated financial statements. SFAS 141(R) and SFAS 160 are required tobe adopted simultaneously and are effective for the first annual reporting period beginning on or afterDecember 15, 2008. The Company is currently evaluating the impact of these pronouncements on itsconsolidated financial statements.
In February 2007, the FASB issued Statement of Financial Accounting Standards No. 159 (“SFAS 159”),“The Fair Value Option for Financial Assets and Financial Liabilities — Including an Amendment of FASBStatement No. 115.” SFAS 159 permits measurement of financial instruments and certain other items atfair value. SFAS 159 is designed to mitigate volatility in reported earnings caused by measuring relatedassets and liabilities differently without having to apply complex hedge accounting provisions. SFAS 159 iseffective as of the beginning of the first fiscal year after November 15, 2007. The Company is currentlyevaluating the impact of this statement on its consolidated financial statements.
75
VISTEON CORPORATION AND SUBSIDIARIES
NOTES TO CONSOLIDATED FINANCIAL STATEMENTS — (Continued)

NOTE 2. Basis of Presentation and Summary of Significant Accounting Policies — (Continued)
In September 2006, the FASB issued Statement of Financial Accounting Standards No. 157, “Fair ValueMeasurements.” This statement, which becomes effective January 1, 2008, defines fair value, establishesa framework for measuring fair value and expands disclosure requirements regarding fair valuemeasurements. The FASB has provided a one-year deferral for the implementation of FASB 157 forother non-financial assets and liabilities. An exposure draft will be issued for comment in the near future onthe partial deferral. The Company is currently evaluating the impact of this statement on its consolidatedfinancial statements.
In March 2006, the FASB issued Statement of Financial Accounting Standards No. 156 (“SFAS 156”),“Accounting for Servicing of Financial Assets.” This statement amends Statement of Financial AccountingStandards No. 140, (“SFAS 140”), “Accounting for Transfers and Servicing of Financial Assets andExtinguishments of Liabilities” with respect to the accounting for separately recognized servicing assetsand servicing liabilities. The Company adopted SFAS 156 as of January 1, 2007 without a material impacton its consolidated financial statements.
In February 2006, the FASB issued Statement of Financial Accounting Standards No. 155 (“SFAS 155”),“Accounting for Certain Hybrid Financial Instruments” which amends Statement of Financial AccountingStandards No. 133 (“SFAS 133”), “Accounting for Derivatives Instruments and Hedging Activities” andSFAS 140. SFAS 155 amends SFAS 133 to narrow the scope exception for interest-only and principal onlystrips on debt instruments to include only such strips representing rights to receive a specified portion ofthe contractual interest or principle cash flows. The Company adopted SFAS 155 as of January 1, 2007without a material impact on its consolidated financial statements.
In June 2006, the FASB issued FASB Interpretation No. 48 (“FIN 48”), “Accounting for Uncertainty inIncome Taxes — an interpretation of FASB Statement No. 109.” FIN 48 clarifies the accounting foruncertainty in income taxes recognized in accordance with Statement of Financial AccountingStandards No. 109 (“SFAS 109”), “Accounting for Income Taxes” and prescribes a recognitionthreshold and measurement process for recording in financial statements tax positions taken orexpected to be taken in a tax return. The evaluation of a tax position under FIN 48 is a two-stepprocess. The first step requires an entity to determine whether it is more likely than not that a taxposition will be sustained upon examination based on the technical merits of the position. For thosepositions that meet the more likely than not recognition threshold, the second step requires measurementof the largest amount of benefit that has a greater than fifty percent likelihood of being realized uponultimate settlement. The Company adopted the provisions of FIN 48 effective January 1, 2007, without amaterial impact to the Company’s consolidated financial statements.
NOTE 3. Discontinued Operations
In March 2007, the Company entered into a Master Asset and Share Purchase Agreement (“MASPA”) tosell certain assets and liabilities associated with the Company’s chassis operations (the “ChassisDivestiture”). The Company’s chassis operations are primarily comprised of suspension, driveline andsteering product lines and include facilities located in Dueren and Wuelfrath, Germany, Praszka, Polandand Sao Paulo, Brazil. Collectively, these operations recorded sales for the year ended December 31, 2006of approximately $600 million. The Chassis Divestiture, while representing a significant portion of theCompany’s chassis operations, did not result in the complete exit of any of the affected product lines.
76
VISTEON CORPORATION AND SUBSIDIARIES
NOTES TO CONSOLIDATED FINANCIAL STATEMENTS — (Continued)

NOTE 3. Discontinued Operations — (Continued)
Effective May 31, 2007, the Company ceased to produce brake components at its Swansea, UK facility,which resulted in the complete exit of the Company’s global suspension product line. Accordingly, theresults of operations of the Company’s global suspension product line have been reclassified to “Loss fromdiscontinued operations, net of tax” in the consolidated statements of operations for the years endedDecember 31, 2007, 2006 and 2005.
A summary of the results of discontinued operations is provided in the table below.
2007 2006 2005Year Ended December 31
(Dollars in Millions)
Net product sales . . . . . . . . . . . . . . . . . . . . . . . . . . . . . . . . . . . . . . . . . . . . . . . $ 50 $165 $226Cost of sales . . . . . . . . . . . . . . . . . . . . . . . . . . . . . . . . . . . . . . . . . . . . . . . . . . 63 184 236
Gross margin . . . . . . . . . . . . . . . . . . . . . . . . . . . . . . . . . . . . . . . . . . . . . . . . . . (13) (19) (10)Selling, general and administrative expenses . . . . . . . . . . . . . . . . . . . . . . . . . . 1 3 1Asset impairments . . . . . . . . . . . . . . . . . . . . . . . . . . . . . . . . . . . . . . . . . . . . . . 12 — 7Gain on ACH Transactions . . . . . . . . . . . . . . . . . . . . . . . . . . . . . . . . . . . . . . . . — — 10Restructuring expenses . . . . . . . . . . . . . . . . . . . . . . . . . . . . . . . . . . . . . . . . . . 10 2 —Reimbursement from Escrow Account . . . . . . . . . . . . . . . . . . . . . . . . . . . . . . . 12 2 —
Loss from discontinued operations, net of tax . . . . . . . . . . . . . . . . . . . . . . . . . . $(24) $ (22) $ (8)
NOTE 4. Restructuring Activities
The Company has undertaken various restructuring activities to achieve its strategic and financialobjectives. Restructuring activities include, but are not limited to, plant closures, production relocation,administrative cost structure realignment and consolidation of available capacity and resources. Inaddition to its ongoing operating cash needs, the Company expects to finance restructuring programsthrough cash reimbursement from an escrow account established pursuant to the ACH Transactions, fromcash generated from its ongoing operations, or through cash available under its existing debt agreements,subject to the terms of applicable covenants.
Escrow Agreement
Pursuant to the Escrow Agreement, dated as of October 1, 2005, among the Company, Ford and DeutscheBank Trust Company Americas, Ford paid $400 million into the escrow account for use by the Company torestructure its businesses. The Escrow Agreement provides that the Company will be reimbursed from theescrow account for the first $250 million of reimbursable restructuring costs, as defined in the EscrowAgreement, and up to one half of the next $300 million of such costs. Cash in the escrow account isinvested, at the direction of the Company, in high quality, short-term investments and related investmentearnings are credited to the account as earned. Investment earnings of $28 million became available toreimburse the Company’s restructuring costs following the use of the first $250 million of available funds.Investment earnings on the remaining $150 million will be available for reimbursement after full utilizationof those funds. The following table provides a reconciliation of amounts available in the escrow account.
77
VISTEON CORPORATION AND SUBSIDIARIES
NOTES TO CONSOLIDATED FINANCIAL STATEMENTS — (Continued)

NOTE 4. Restructuring Activities — (Continued)Year Ended
December 31, 2007Inception throughDecember 31, 2007
(Dollars in Millions)
Beginning escrow account available . . . . . . . . . . . . . . . . . . . . . . $ 319 $ 400Add: Investment earnings. . . . . . . . . . . . . . . . . . . . . . . . . . . . . . 11 32Deduct: Disbursements for restructuring costs . . . . . . . . . . . . . . (186) (288)
Ending escrow account available . . . . . . . . . . . . . . . . . . . . . . . . $ 144 $ 144
Approximately $22 million and $55 million of amounts receivable from the escrow account were classifiedin “Other current assets” in the Company’s consolidated balance sheets as of December 31, 2007 and2006, respectively.
Restructuring Reserves
The following is a summary of the Company’s consolidated restructuring reserves and related activity forthe years ended December 31, 2007, 2006 and 2005, respectively. Substantially all of the Company’srestructuring expenses are related to employee severance and termination benefit costs. Information inthe table below includes amounts associated with the Company’s discontinued operations.
Interiors Climate Electronics Other Total(Dollars in Millions)
December 31, 2004 . . . . . . . . . . . . . . . . . . . . . . . . . $ 3 $ 1 $ — $118 $ 122Expenses . . . . . . . . . . . . . . . . . . . . . . . . . . . . . . . — — 5 21 26Liability transferred to ACH . . . . . . . . . . . . . . . . . . — — — (61) (61)Utilization . . . . . . . . . . . . . . . . . . . . . . . . . . . . . . . (3) (1) (1) (68) (73)
December 31, 2005 . . . . . . . . . . . . . . . . . . . . . . . . . — — 4 10 14Expenses . . . . . . . . . . . . . . . . . . . . . . . . . . . . . . . 24 31 16 24 95Utilization . . . . . . . . . . . . . . . . . . . . . . . . . . . . . . . (6) (10) (18) (22) (56)
December 31, 2006 . . . . . . . . . . . . . . . . . . . . . . . . . 18 21 2 12 53Expenses . . . . . . . . . . . . . . . . . . . . . . . . . . . . . . . 66 27 9 60 162Utilization . . . . . . . . . . . . . . . . . . . . . . . . . . . . . . . (26) (25) (4) (48) (103)
December 31, 2007 . . . . . . . . . . . . . . . . . . . . . . . . . $ 58 $ 23 $ 7 $ 24 $ 112
Restructuring reserve balances of $87 million and $53 million at December 31, 2007 and 2006,respectively, are classified as “Other current liabilities” on the consolidated balance sheets. TheCompany anticipates that the activities associated with the restructuring reserve balance as ofDecember 31, 2007 will be substantially completed by the end of 2008. Other restructuring reservesof $25 million are classified as “Other non-current liabilities” on the consolidated balance sheet as ofDecember 31, 2007 and relate to employee benefits that are probable and estimable but for whichassociated activities will not be completed until 2009.
78
VISTEON CORPORATION AND SUBSIDIARIES
NOTES TO CONSOLIDATED FINANCIAL STATEMENTS — (Continued)
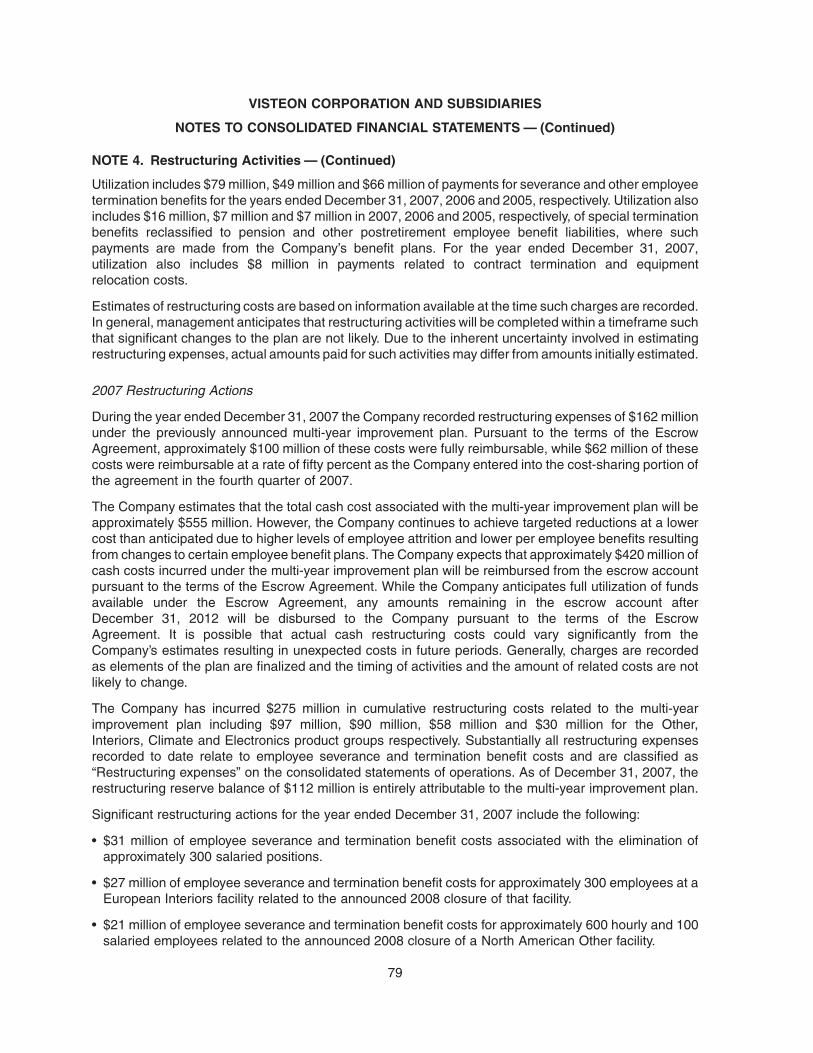
NOTE 4. Restructuring Activities — (Continued)
Utilization includes $79 million, $49 million and $66 million of payments for severance and other employeetermination benefits for the years ended December 31, 2007, 2006 and 2005, respectively. Utilization alsoincludes $16 million, $7 million and $7 million in 2007, 2006 and 2005, respectively, of special terminationbenefits reclassified to pension and other postretirement employee benefit liabilities, where suchpayments are made from the Company’s benefit plans. For the year ended December 31, 2007,utilization also includes $8 million in payments related to contract termination and equipmentrelocation costs.
Estimates of restructuring costs are based on information available at the time such charges are recorded.In general, management anticipates that restructuring activities will be completed within a timeframe suchthat significant changes to the plan are not likely. Due to the inherent uncertainty involved in estimatingrestructuring expenses, actual amounts paid for such activities may differ from amounts initially estimated.
2007 Restructuring Actions
During the year ended December 31, 2007 the Company recorded restructuring expenses of $162 millionunder the previously announced multi-year improvement plan. Pursuant to the terms of the EscrowAgreement, approximately $100 million of these costs were fully reimbursable, while $62 million of thesecosts were reimbursable at a rate of fifty percent as the Company entered into the cost-sharing portion ofthe agreement in the fourth quarter of 2007.
The Company estimates that the total cash cost associated with the multi-year improvement plan will beapproximately $555 million. However, the Company continues to achieve targeted reductions at a lowercost than anticipated due to higher levels of employee attrition and lower per employee benefits resultingfrom changes to certain employee benefit plans. The Company expects that approximately $420 million ofcash costs incurred under the multi-year improvement plan will be reimbursed from the escrow accountpursuant to the terms of the Escrow Agreement. While the Company anticipates full utilization of fundsavailable under the Escrow Agreement, any amounts remaining in the escrow account afterDecember 31, 2012 will be disbursed to the Company pursuant to the terms of the EscrowAgreement. It is possible that actual cash restructuring costs could vary significantly from theCompany’s estimates resulting in unexpected costs in future periods. Generally, charges are recordedas elements of the plan are finalized and the timing of activities and the amount of related costs are notlikely to change.
The Company has incurred $275 million in cumulative restructuring costs related to the multi-yearimprovement plan including $97 million, $90 million, $58 million and $30 million for the Other,Interiors, Climate and Electronics product groups respectively. Substantially all restructuring expensesrecorded to date relate to employee severance and termination benefit costs and are classified as“Restructuring expenses” on the consolidated statements of operations. As of December 31, 2007, therestructuring reserve balance of $112 million is entirely attributable to the multi-year improvement plan.
Significant restructuring actions for the year ended December 31, 2007 include the following:
• $31 million of employee severance and termination benefit costs associated with the elimination ofapproximately 300 salaried positions.
• $27 million of employee severance and termination benefit costs for approximately 300 employees at aEuropean Interiors facility related to the announced 2008 closure of that facility.
• $21 million of employee severance and termination benefit costs for approximately 600 hourly and 100salaried employees related to the announced 2008 closure of a North American Other facility.
79
VISTEON CORPORATION AND SUBSIDIARIES
NOTES TO CONSOLIDATED FINANCIAL STATEMENTS — (Continued)

NOTE 4. Restructuring Activities — (Continued)
• $14 million was recorded related to the December 2007 closure of a North American Climate facility foremployee severance and termination benefits, contract termination and equipment move costs.
• $12 million of expected employee severance and termination benefit costs associated withapproximately 100 hourly employees under a plant efficiency action at a European Climate facility.
• $10 million of employee severance and termination benefit costs associated with the exit of brakemanufacturing operations at a European Other facility. Approximately 160 hourly and 20 salariedpositions were eliminated as a result of this action.
• $10 million of employee severance and termination benefit costs were recorded for approximately40 hourly and 20 salaried employees at various European facilities.
In addition to the above announced actions the Company recorded an estimate of expected employeeseverance and termination benefit costs of approximately $34 million for the probable payment of suchpost-employment benefit costs in connection with the multi-year improvement plan.
Approximately $66 million and $25 million of reserves related to these activities were classified as “Othercurrent liabilities” and “Other non-current liabilities”, respectively on the consolidated balance sheet as ofDecember 31, 2007.
2006 Restructuring Actions
During 2006 the Company incurred restructuring expenses of $95 million under the multi-yearimprovement plan, including the following significant actions:
• $20 million in employee severance and termination benefit costs related to the 2007 closure of a NorthAmerican Climate manufacturing facility. These costs are associated with approximately 170 salariedand 750 hourly employees.
• $19 million in employee severance and termination benefit costs related to an announced plan to reducethe Company’s salaried workforce in higher cost countries. These costs are associated withapproximately 800 salaried positions.
• $9 million in employee severance and termination benefit costs related to certain hourly employeeheadcount reductions attributable to approximately 600 employees at Climate facilities in North Americaand 70 employees at certain European manufacturing facilities.
• $7 million related to the announced closure of a European Interiors manufacturing facility. Costs includeemployee severance and termination benefits for approximately 150 hourly and salaried employees andcertain non-employee related costs associated with closing the facility.
• $7 million of employee severance and termination benefit costs related to a workforce reduction effort ata European Interiors manufacturing facility. These costs relate to approximately 110 hourly employees.
• $6 million related to workforce reduction activities in Electronics manufacturing facilities in Mexico andPortugal. These costs include employee severance and termination benefits for approximately500 hourly and 50 salaried employees.
• $6 million related to a restructuring initiative at a North American Electronics manufacturing facility.These costs include severance and termination benefit costs for approximately 1,000 employees.
• $5 million related to the announced closure of a North American Interiors manufacturing facility, includingemployee severance and termination benefit costs for 265 hourly employees, 26 salaried employees,and a lease termination penalty.
80
VISTEON CORPORATION AND SUBSIDIARIES
NOTES TO CONSOLIDATED FINANCIAL STATEMENTS — (Continued)

NOTE 4. Restructuring Activities — (Continued)
• $3 million related to the closure of a North American Climate manufacturing facility, including severanceand termination benefit costs for approximately 350 hourly and salaried employees.
Approximately $21 million and $53 million of reserves related to these activities were classified as “Othercurrent liabilities” on the consolidated balance sheets as of December 31, 2007 and 2006, respectively.
2005 Restructuring Actions
During 2005, the Company incurred restructuring expenses of $26 million which included the followingsignificant actions:
• $14 million of employee severance and termination benefit costs associated with programs offered atvarious Mexican and European facilities affecting approximately 700 salaried and hourly positions.
• $7 million related to the continuation of a voluntary termination incentive program offered during thefourth quarter of 2004 to eligible U.S. salaried employees. Terms of the program required the effectivetermination date to be no later than March 31, 2005, unless otherwise mutually agreed. ThroughMarch 31, 2005, 409 employees voluntarily elected to participate in this program, including 35 employeesduring the first quarter of 2005. As of December 31, 2005, substantially all of the employees hadterminated their employment.
• $6 million for employee severance and termination benefit costs associated with the closure of certainNorth American facilities located in the U.S., Mexico and Puerto Rico related to approximately 100salaried employees and 400 hourly employees.
Previously recorded restructuring reserves of $61 million were transferred to ACH as the Company wasrelieved, pursuant to the ACH Transactions, from fulfilling the remaining obligations to Ford for the transferof seat production from the Company’s Chesterfield, Michigan operation to another supplier.Approximately $14 million of reserves related to these activities were classified as “Other currentliabilities” on the consolidated balance sheet as of December 31, 2005. These reserves were fullyutilized as of December 31, 2006.
NOTE 5. Asset Impairments
Statement of Financial Accounting Standards No. 144, “Accounting for the Impairment or Disposal ofLong-Lived Assets” (“SFAS 144”) requires that long-lived assets and intangible assets subject toamortization are reviewed for impairment when certain indicators of impairment are present.Impairment exists if estimated future undiscounted cash flows associated with long-lived assets arenot sufficient to recover the carrying value of such assets. Generally, when impairment exists the long-livedassets are adjusted to their respective fair values.
81
VISTEON CORPORATION AND SUBSIDIARIES
NOTES TO CONSOLIDATED FINANCIAL STATEMENTS — (Continued)

NOTE 5. Asset Impairments — (Continued)
In assessing long-lived assets for an impairment loss, assets are grouped with other assets and liabilitiesat the lowest level for which identifiable cash flows are largely independent of the cash flows of other assetsand liabilities. Asset grouping requires a significant amount of judgment. Accordingly, facts andcircumstances will influence how asset groups are determined for impairment testing. In assessinglong-lived assets for impairment, management considered the Company’s product line portfolio,customers and related commercial agreements, labor agreements and other factors in groupingassets and liabilities at the lowest level for which identifiable cash flows are largely independent. TheCompany considers projected future undiscounted cash flows, trends and other factors in its assessmentof whether impairment conditions exist. While the Company believes that its estimates of future cash flowsare reasonable, different assumptions regarding such factors as future automotive production volumes,customer pricing, economics and productivity and cost saving initiatives, could significantly affect itsestimates. In determining fair value of long-lived assets, management uses appraisals, managementestimates or discounted cash flow calculations.
The Company recorded asset impairment charges of $95 million, $22 million and $1,504 million for theyears ended December 31, 2007, 2006 and 2005, respectively, to adjust certain long-lived assets to theirestimated fair values.
2007 Impairment Charges
During the fourth quarter of 2007 the Company recorded impairment charges of $16 million to reduce thenet book value of long-lived assets associated with the Company’s fuel products to their estimated fairvalue. This amount was recorded pursuant to impairment indicators including lower than anticipatedcurrent and near term future customer volumes and the related impact on the Company’s current andprojected operating results and cash flows resulting from a change in product technology.
During the third quarter of 2007, the Company completed the sale of its Visteon Powertrain ControlSystems India (“VPCSI”) operation located in Chennai, India. The Company determined that assetssubject to the VPCSI divestiture including inventory, intellectual property, and real and personal propertymet the “held for sale” criteria of SFAS 144. Accordingly, these assets were valued at the lower of carryingamount or fair value less cost to sell, which resulted in asset impairment charges of approximately$14 million.
During the first quarter of 2007, the Company determined that assets subject to the Chassis Divestitureincluding inventory, intellectual property, and real and personal property met the “held for sale” criteria ofSFAS 144. Accordingly, these assets were valued at the lower of carrying amount or fair value less cost tosell, which resulted in asset impairment charges of approximately $28 million.
In consideration of the MASPA and the Company’s announced exit of the brake manufacturing business atits Swansea, UK facility, an asset impairment charge of $16 million was recorded to reduce the net bookvalue of certain long-lived assets at the facility to their estimated fair value in the first quarter of 2007. TheCompany’s estimate of fair value was based on market prices, prices of similar assets, and other availableinformation.
During 2007 the Company entered into agreements to sell two Electronics buildings located in Japan. TheCompany determined that these buildings met the “held for sale” criteria of SFAS 144 and were recorded atthe lower of carrying value or fair value less cost to sell, which resulted in asset impairment charges ofapproximately $15 million.
82
VISTEON CORPORATION AND SUBSIDIARIES
NOTES TO CONSOLIDATED FINANCIAL STATEMENTS — (Continued)

NOTE 5. Asset Impairments — (Continued)
2006 Impairment Charges
During the second quarter of 2006 the Company announced the closure of a European Interiors facility. Inconnection with this action, the Company recorded an asset impairment of $10 million to reduce the netbook value of certain long-lived assets to their estimated fair value. Also during the second quarter of 2006and in accordance with Accounting Principles Board Opinion No. 18, “The Equity Method of Accounting forInvestments in Common Stock,” the Company determined that an “other than temporary” decline in the fairmarket value of its investment in Vitro Flex, S.A. de C.V. (“Vitro Flex”) had occurred. Consequently, theCompany reduced the carrying value of its investment in Vitro Flex by approximately $12 million to itsestimated fair market value at June 30, 2006.
2005 Impairment Charges
During 2005 the Company recorded impairment charges of $1,511 million, including amounts related todiscontinued operations, to reduce the net book value of certain long-lived assets to their estimated fairvalue. Approximately $591 of this amount was recorded pursuant to impairment indicators including lowerthan anticipated current and near term future vehicle production volumes and the related impact on theCompany’s current and projected operating results and cash flows. Additionally, the Company recorded animpairment charge of $920 million to write-down certain assets considered “held for sale” pursuant to theACH Transactions to their aggregate estimated fair value less cost to sell.
NOTE 6. Extraordinary Item
On April 27, 2006 the Company’s wholly-owned, consolidated subsidiary Carplastics, S.A. de C.V.acquired the real property, inventory, tooling and equipment of Guide Lighting Technologies of MexicoS. de R.L. de C.V., a lighting manufacturing facility located in Monterrey, Mexico. In accordance withStatement of Financial Accounting Standards No. 141 “Business Combinations,” the Company allocatedthe purchase price to the assets and liabilities acquired. The sum of the amounts assigned to the assetsand liabilities acquired exceeded the cost of the acquired entity and that excess was allocated as a pro ratareduction of the amounts that otherwise would have been assigned to all of the acquired non-financialassets (i.e. property and equipment). An excess of $8 million remained after reducing to zero the amountsthat otherwise would have been assigned to the non-financial assets and was recorded as an extraordinarygain in the accompanying consolidated financial statements.
NOTE 7. Stock-Based Compensation
During the year-ended December 31, 2007, the Company recorded a benefit of approximately $11 milliondue to a decrease in the market value of the Company’s common stock. The Company recordedcompensation expense including the cumulative effect of a change in accounting, for various stock-based compensation awards issued pursuant to the plans described below in the amounts of $58 millionand $20 million, for the years ended December 31, 2006 and 2005, respectively. No related income taxbenefits were recorded during the years ended December 31, 2007, 2006 and 2005. During 2007, theCompany received $7 million of cash from the exercise of share-based compensation instruments andpaid $21 million to settle share-based compensation instruments.
83
VISTEON CORPORATION AND SUBSIDIARIES
NOTES TO CONSOLIDATED FINANCIAL STATEMENTS — (Continued)

NOTE 7. Stock-Based Compensation — (Continued)
Stock-Based Compensation Plans
The Visteon Corporation 2004 Incentive Compensation Plan (“2004 Incentive Plan”) as approved byshareholders, is administered by the Organization and Compensation Committee of the Board of Directorsand provides for the grant of incentive and nonqualified stock options, stock appreciation rights (“SARs”),performance stock rights, restricted stock awards (“RSAs”), restricted stock units (“RSUs”) and stock andvarious other rights based on common stock. The maximum number of shares of common stock that maybe subject to awards under the 2004 Incentive Plan is approximately 22 million shares. During the yearended December 31, 2007, the Company granted approximately 1 million RSUs, 3 million SARs,25,000 RSAs and 2 million stock options under the Incentive Plan. At December 31, 2007, there wereapproximately 7 million shares of common stock available for grant under the 2004 Incentive Plan.Effective June 14, 2007, the 2004 Incentive Plan was amended to allow the Company to utilize net exercisesettlement of stock options. Under a net exercise provision, an option holder is permitted to exercise anoption without paying any cash. Instead, the option holder “pays” the exercise price by forfeiting sharessubject to the option, based on the value of the underlying shares.
The Visteon Corporation Employees Equity Incentive Plan (“EEIP”) as approved by shareholders isadministered by the Organization and Compensation Committee of the Board of Directors and provides forthe grant of nonqualified stock options, restricted stock awards, and various other rights based on commonstock. The maximum number of shares of common stock that may be subject to awards under the EEIP isapproximately 7 million shares. During the year ended December 31, 2007, the Company grantedapproximately 65,000 RSAs under the EEIP. At December 31, 2007, there were approximately2 million shares of common stock available for grant under EEIP.
The Visteon Corporation Non-Employee Director Stock Unit Plan provides for the automatic annual grantof RSUs to non-employee directors. RSUs awarded under the Non-Employee Director Stock Unit Planvest immediately but are settled after the participant terminates service as a non-employee director of theCompany.
Stock-Based Compensation Awards
The Company’s stock-based compensation awards take the form of stock options, SARs, RSAs andRSUs.
• Stock options and SARs granted under the aforementioned plans have an exercise price equal to theaverage of the highest and lowest prices at which the Company’s common stock was traded on the NewYork Stock Exchange on the date of grant, and become exercisable on a ratable basis over the vestingperiod. Stock options and SARs granted prior to January 1, 2004, expire 10 years after the grant date.Stock options and SARs granted after December 31, 2003 and prior to January 1, 2007 expire five yearsfollowing the grant date. Stock options and SARs granted after December 31, 2006 expire seven yearsfollowing the grant date. Stock options are settled in shares of the Company’s common stock uponexercise and are recorded in the Company’s consolidated balance sheets under the caption “Additionalpaid-in capital.” SARs are settled in cash and result in the recognition of a liability representing the vestedportion of the obligation. As of December 31, 2007 and 2006, approximately $10 million and $31 million,respectively, of such liability is recorded in the Company’s consolidated balance sheets under thecaption “Other non-current liabilities.”
84
VISTEON CORPORATION AND SUBSIDIARIES
NOTES TO CONSOLIDATED FINANCIAL STATEMENTS — (Continued)

NOTE 7. Stock-Based Compensation — (Continued)
• RSAs and RSUs granted under the aforementioned plans vest after a designated period of time (“time-based”), which is generally one to five years, or upon the achievement of certain performance goals(“performance-based”) following the completion of a performance period, which is generally two or threeyears. RSAs are settled in shares of the Company’s common stock upon the lapse of restrictions on theunderlying shares. Accordingly, such amount is recorded in the Company’s consolidated balance sheetsunder the caption “Additional paid-in capital.” RSUs awarded under the 2004 Incentive Plan are settled incash and result in the recognition of a liability representing the vested portion of the obligation. As ofDecember 31, 2007 and 2006, approximately $8 million and $17 million, respectively, of the currentportion of such liability are recorded in the Company’s consolidated balance sheets under the caption“Accrued employee liabilities.” As of December 31, 2007 and 2006, approximately $6 million and$15 million, respectively, of the long-term portion of such liability are recorded under the caption“Other non-current liabilities.”
Upon exercise of stock-based compensation awards settled in shares of Company stock, the Company’spolicy is to deliver such shares on a net-settled basis utilizing available treasury shares, purchasingtreasury shares or newly issuing shares in accordance with the terms of approved stock-basedcompensation agreements. In December 2007, the Company’s board of directors authorized a sharerepurchase program of up to 2 million shares of Company common stock, which may be repurchased overthe following 24 months to fund ongoing employee compensation and benefit plan obligations. Purchasesunder the program will be funded from Visteon’s existing cash balance. Repurchases under the programmay be made through open market purchases or privately negotiated transactions in accordance withapplicable federal securities laws. The timing, amount, manner and price of repurchases, if any, will bedetermined by Visteon, at its discretion, and will depend upon, among other things, the stock price,economic and market conditions and such other factors as Visteon considers appropriate. The programmay be extended, suspended or discontinued at any time, without notice.
Fair Value Estimation Methodology and Assumptions
The fair value of RSAs and RSUs is based on the period-ending market price of the Company’s commonstock, while the fair value of stock options and SARs is determined at the date of grant using the Black-Scholes option pricing model. The Black-Scholes option pricing model requires management to makevarious assumptions including the expected term, expected volatility, risk-free interest rate, and dividendyield. The expected term represents the period of time that stock-based compensation awards granted areexpected to be outstanding and is estimated based on considerations including the vesting period,contractual term and anticipated employee exercise patterns. Expected volatility is based on the historicalvolatility of the Company’s stock. The risk-free rate is based on the U.S. Treasury yield curve in relation tothe contractual life of stock-based compensation instrument. The dividend yield assumption is based onhistorical patterns and future expectations for Company dividends.
Weighted average assumptions used to estimate the fair value of stock-based compensation awards as ofDecember 31, are as follows:
2007 2006 2007 2006
SARs Stock Options*
Expected term (in years) . . . . . . . . . . . . . . . . . . . . . . . . . . . . . 2.76 2.75 4-6 4Expected volatility . . . . . . . . . . . . . . . . . . . . . . . . . . . . . . . . . . 62.3% 59.0% 59.0% 57.0%Risk-free interest rate . . . . . . . . . . . . . . . . . . . . . . . . . . . . . . . 3.22% 4.72% 4.55%-4.70% 5.1%Expected dividend yield . . . . . . . . . . . . . . . . . . . . . . . . . . . . . 0.0% 0.0% 0.0% 0.0%* Assumptions at grant date
85
VISTEON CORPORATION AND SUBSIDIARIES
NOTES TO CONSOLIDATED FINANCIAL STATEMENTS — (Continued)

NOTE 7. Stock-Based Compensation — (Continued)
Stock Appreciation Rights and Stock Options
The following is a summary of the range of exercise prices for stock options and SARs that are currentlyoutstanding and that are currently exercisable at December 31, 2007:
NumberOutstanding
WeightedAverage
Remaining Life
WeightedAverage
Exercise PriceNumber
Exercisable
WeightedAverage
Exercise Price
Stock Optionsand SARs Outstanding
Stock Optionsand SARs Exercisable
(In Thousands) (In Years) (In Thousands)
$ 3.00 - $ 7.00 . . . . . . 9,794 3.2 $ 5.88 5,995 $ 6.20$ 7.01 - $12.00 . . . . . . 7,298 4.5 $ 9.29 2,559 $ 9.88$12.01 - $17.00 . . . . . . 3,835 3.4 $13.44 3,835 $13.44$17.01 - $22.00 . . . . . . 1,966 3.3 $17.46 1,966 $17.46
22,893 14,355
The intrinsic value of stock options and SARs outstanding and exercisablewas zero at December 31, 2007.The weighted average fair value of SARs granted was $1.65 and $5.25 at December 31, 2007 and 2006,respectively. The weighted average fair value of stock options granted was $4.90, $2.79 and $2.48 atDecember 31, 2007, 2006 and 2005, respectively.
As of December 31, 2007, there was approximately $2 million and $2 million of total unrecognizedcompensation cost related to non-vested stock options and SARs, respectively, granted under theCompany’s stock-based compensation plans. That cost is expected to be recognized over a weightedaverage period of approximately one year. A summary of activity, including award grants, exercises andforfeitures is provided below for stock options and SARs.
86
VISTEON CORPORATION AND SUBSIDIARIES
NOTES TO CONSOLIDATED FINANCIAL STATEMENTS — (Continued)

NOTE 7. Stock-Based Compensation — (Continued)
Stock Options
WeightedAverage
Exercise Price SARs
WeightedAverage
Exercise Price
(In Thousands) (In Thousands)
Outstanding at December 31, 2004 . . . 14,168 $11.24 2,111 $9.90Granted . . . . . . . . . . . . . . . . . . . . . . 2,567 $ 6.32 4,408 $6.35Exercised . . . . . . . . . . . . . . . . . . . . . (442) $ 6.63 (2) $9.90Forfeited or expired. . . . . . . . . . . . . . (1,279) $ 9.54 (414) $8.47
Outstanding at December 31, 2005 . . . 15,014 $10.68 6,103 $7.43Granted . . . . . . . . . . . . . . . . . . . . . . 41 $ 5.79 4,719 $4.78Exercised . . . . . . . . . . . . . . . . . . . . . (873) $ 6.62 (434) $6.25Forfeited or expired. . . . . . . . . . . . . . (1,217) $12.41 (1,118) $6.46
Outstanding at December 31, 2006 . . . 12,965 $10.77 9,270 $6.30Granted . . . . . . . . . . . . . . . . . . . . . . 1,976 $ 8.98 3,151 $8.94Exercised . . . . . . . . . . . . . . . . . . . . . (965) $ 6.51 (1,219) $5.68Forfeited or expired. . . . . . . . . . . . . . (1,048) $10.86 (1,237) $6.50
Outstanding at December 31, 2007 . . . 12,928 $10.80 9,965 $7.19Less: Outstanding but not exercisable
at December 31, 2007 . . . . . . . . . . . 2,361 6,177
Exercisable at December 31, 2007 . . . . 10,567 $11.35 3,788 $7.51
87
VISTEON CORPORATION AND SUBSIDIARIES
NOTES TO CONSOLIDATED FINANCIAL STATEMENTS — (Continued)

NOTE 7. Stock-Based Compensation — (Continued)
Restricted Stock Units and Restricted Stock Awards
The weighted average grant date fair value of RSUs granted was $8.79 and $4.90 for the periods endedDecember 31, 2007 and 2006, respectively. The weighted average grant date fair value of RSAs was$7.75, $5.85 and $3.47 for the periods ended December 31, 2007, 2006 and 2005 respectively. The totalfair value of RSAs vested during the periods ended December 31, 2007, 2006 and 2005 was approximately$10,000, $10 million and $6 million, respectively. As of December 31, 2007, there was approximately$300,000 and $6 million of total unrecognized compensation cost related to non-vested RSAs and RSUs,respectively, granted under the Company’s stock-based compensation plans. That cost is expected to berecognized over a weighted average period of approximately one year. A summary of activity, includingaward grants, vesting and forfeitures is provided below for RSAs and RSUs.
RSAs RSUs
Weighted AverageGrant DateFair Value
(In Thousands)
Non-vested at December 31, 2004 . . . . . . . . . . . . . . . . . . . . . . . 4,180 2,360 $10.17Granted . . . . . . . . . . . . . . . . . . . . . . . . . . . . . . . . . . . . . . . . . . 6 3,779 $ 6.96Vested . . . . . . . . . . . . . . . . . . . . . . . . . . . . . . . . . . . . . . . . . . . (949) (8) $15.47Forfeited . . . . . . . . . . . . . . . . . . . . . . . . . . . . . . . . . . . . . . . . . (1,020) (532) $10.57
Non-vested at December 31, 2005 . . . . . . . . . . . . . . . . . . . . . . . 2,217 5,599 $ 7.89Granted . . . . . . . . . . . . . . . . . . . . . . . . . . . . . . . . . . . . . . . . . . 25 2,192 $ 4.90Vested . . . . . . . . . . . . . . . . . . . . . . . . . . . . . . . . . . . . . . . . . . . (2,098) (324) $ 7.36Forfeited . . . . . . . . . . . . . . . . . . . . . . . . . . . . . . . . . . . . . . . . . (19) (804) $ 6.70
Non-vested at December 31, 2006 . . . . . . . . . . . . . . . . . . . . . . . 125 6,663 $ 7.23Granted . . . . . . . . . . . . . . . . . . . . . . . . . . . . . . . . . . . . . . . . . . 90 1,219 $ 8.73Vested . . . . . . . . . . . . . . . . . . . . . . . . . . . . . . . . . . . . . . . . . . . (3) (2,262) $ 9.76Forfeited . . . . . . . . . . . . . . . . . . . . . . . . . . . . . . . . . . . . . . . . . (120) (1,047) $ 7.45
Non-vested at December 31, 2007 . . . . . . . . . . . . . . . . . . . . . . . 92 4,573 $ 6.42
NOTE 8. Asset Securitizations
European Securitization
Effective August 14, 2006, the Company entered into a European accounts receivable securitizationfacility (“European Securitization”) that extends until August 2011 and provides up to $325 million infunding from the sale of trade receivables originating from Company subsidiaries located in Germany,Portugal, Spain, France and the UK (the “Sellers”). Under the European Securitization, trade receivablesoriginated by the Sellers and certain of their subsidiaries are transferred to Visteon Financial Centre P.L.C.(the “Transferor”). The Transferor is a bankruptcy-remote qualifying special purpose entity. Tradereceivables transferred from the Sellers are funded through cash obtained from the issuance ofvariable loan notes to third-party lenders and through subordinated loans obtained from a wholly-owned subsidiary of the Company, which represent the Company’s retained interest in the tradereceivables transferred.
88
VISTEON CORPORATION AND SUBSIDIARIES
NOTES TO CONSOLIDATED FINANCIAL STATEMENTS — (Continued)

NOTE 8. Asset Securitizations — (Continued)
Transfers under the European Securitization, for which the Company receives consideration other than abeneficial interest, are accounted for as “true sales” under the provisions of Statement of FinancialAccounting Standards No. 140 (“SFAS 140”), “Accounting for Transfers and Servicing of Financial Assetsand Extinguishments of Liabilities” and are removed from the balance sheet. Transfers under theEuropean Securitization, for which the Company receives a beneficial interest are not removed fromthe balance sheet and total $434 million and $482 million as of December 31, 2007 and 2006, respectively.Such amounts are recorded at fair value and are subordinated to the interests of third-party lenders.Securities representing the Company’s retained interests are accounted for as trading securities underStatement of Financial Accounting Standards No. 115 “Accounting for Certain Investments in Debt andEquity Securities.”
Availability of funding under the European Securitization depends primarily upon the amount of tradereceivables reduced by outstanding borrowings under the program and other characteristics of those tradereceivables that affect their eligibility (such as bankruptcy or the grade of the obligor, delinquency andexcessive concentration). As of December 31, 2007, approximately $248 million of the Company’stransferred trade receivables were considered eligible for borrowing under this facility, $99 million wasoutstanding and $149 million was available for funding. The Company recorded losses of $8 million and$2 million for the years ended December 31, 2007 and 2006, respectively related to trade receivables soldunder the European Securitization.
The table below provides a reconciliation of changes in interests in account receivables transferred for theperiod.
2007 2006
December 31
(Dollars in Millions)
Beginning balance . . . . . . . . . . . . . . . . . . . . . . . . . . . . . . . . . . . . . . . . . . . . . . . . . $ 482 $ —Receivables transferred . . . . . . . . . . . . . . . . . . . . . . . . . . . . . . . . . . . . . . . . . . . . . 3,321 1,389Proceeds from new securitizations . . . . . . . . . . . . . . . . . . . . . . . . . . . . . . . . . . . . . (41) (76)Proceeds from collections reinvested in securitization . . . . . . . . . . . . . . . . . . . . . . (522) (101)Cash flows received on interests retained . . . . . . . . . . . . . . . . . . . . . . . . . . . . . . . (2,806) (730)
Ending balance . . . . . . . . . . . . . . . . . . . . . . . . . . . . . . . . . . . . . . . . . . . . . . . . . . . $ 434 $ 482
The Sellers act as servicing agents and continue to service the transferred receivables for which theyreceive a monthly servicing fee based on the aggregate amount of the outstanding purchased receivables.The Company is required to pay a monthly fee to the lenders based on the unused portion of the EuropeanSecuritization.
89
VISTEON CORPORATION AND SUBSIDIARIES
NOTES TO CONSOLIDATED FINANCIAL STATEMENTS — (Continued)

NOTE 8. Asset Securitizations — (Continued)
United States Securitization
In December 2005, the Company terminated its revolving accounts receivable securitization facility in theUnited States (“facility agreement”). Formerly, under this facility agreement, the Company could sell aportion of its U.S. account receivables from customers other than Ford to Visteon Receivables, LLC(“VRL”), a wholly-owned consolidated special purpose entity. VRL may then have sold, on a non-recoursebasis (subject to certain limited exceptions), an undivided interest in the receivables to an asset-backed,multi-seller commercial paper conduit, which is unrelated to the Company or VRL. The conduit typicallyfinanced the purchases through the issuance of commercial paper, with back-up purchase commitmentsfrom the conduit’s financial institution. The sale of the undivided interest in the receivables from VRL to theconduit was accounted for as a sale under the provisions of SFAS 140. When VRL sold an undividedinterest to the conduit, VRL retained the remaining undivided interest. The carrying value of the remainingundivided interests approximated the fair market value of these receivables. The value of the undividedinterest sold to the conduit was excluded from the Company’s consolidated balance sheets and reducedthe accounts receivable balances. The Company performed the collection and administrative functionsrelated to the accounts receivable.
At the time VRL sold the undivided interest to the conduit, the sale was recorded at fair market value withthe difference between the carrying amount and fair value of the assets sold included in operating incomeas a loss on sale. This difference between carrying value and fair value was principally the estimateddiscount inherent in the facility agreement, which reflected the borrowing costs as well as fees andexpenses of the conduit, and the length of time the receivables were expected to be outstanding. Grossproceeds from new securitizations were $237 million during the year ended December 31, 2005.Collections and repayments to the conduit were $292 million during the year endedDecember 31, 2005. This resulted in net payments and net proceeds of $55 million for the year endedDecember 31, 2005. Losses on the sale of these receivables was approximately $1 million for the yearended December 31, 2005 and are included under the caption “Selling, general and administrativeexpenses” in the Company’s consolidated statements of operations.
Other
During 2006 and 2005, the Company sold account receivables without recourse under a European sale ofreceivables agreement. As of December 31, 2006 and 2005, the Company had sold approximately62 million Euro ($81 million) and 99 million Euro ($117 million), respectively. This European sale ofreceivables agreement was terminated in December 2006. Losses on these receivable sales wereapproximately $3 million and $2 million for the years ended December 31, 2006 and 2005, respectively.
As of December 31, 2005, the Company had sold 830 million Japanese Yen ($7 million) of accountreceivables, without recourse, under a Japanese sale of receivables agreement initiated in the first quarterof 2005. This Japanese sale of receivables agreement was terminated in January 2006.
90
VISTEON CORPORATION AND SUBSIDIARIES
NOTES TO CONSOLIDATED FINANCIAL STATEMENTS — (Continued)

NOTE 9. Inventories
Inventories consist of the following components:
2007 2006
December 31
(Dollars in Millions)
Raw materials . . . . . . . . . . . . . . . . . . . . . . . . . . . . . . . . . . . . . . . . . . . . . . . . . . . . . $159 $154Work-in-process . . . . . . . . . . . . . . . . . . . . . . . . . . . . . . . . . . . . . . . . . . . . . . . . . . . 224 266Finished products . . . . . . . . . . . . . . . . . . . . . . . . . . . . . . . . . . . . . . . . . . . . . . . . . . 160 157
543 577Valuation reserves . . . . . . . . . . . . . . . . . . . . . . . . . . . . . . . . . . . . . . . . . . . . . . . . . . (48) (57)
$495 $520
NOTE 10. Other Assets
Other current assets are summarized as follows:
2007 2006
December 31
(Dollars in Millions)
Recoverable taxes . . . . . . . . . . . . . . . . . . . . . . . . . . . . . . . . . . . . . . . . . . . . . . . . . . $ 88 $107Current deferred tax assets . . . . . . . . . . . . . . . . . . . . . . . . . . . . . . . . . . . . . . . . . . . 47 47Deposits . . . . . . . . . . . . . . . . . . . . . . . . . . . . . . . . . . . . . . . . . . . . . . . . . . . . . . . . . 30 23Prepaid assets. . . . . . . . . . . . . . . . . . . . . . . . . . . . . . . . . . . . . . . . . . . . . . . . . . . . . 28 22Escrow receivable . . . . . . . . . . . . . . . . . . . . . . . . . . . . . . . . . . . . . . . . . . . . . . . . . . 22 55Other . . . . . . . . . . . . . . . . . . . . . . . . . . . . . . . . . . . . . . . . . . . . . . . . . . . . . . . . . . . . 20 19
$235 $273
Other non-current assets are summarized as follows:
2007 2006
December 31
(Dollars in Millions)
Non-current deferred tax assets. . . . . . . . . . . . . . . . . . . . . . . . . . . . . . . . . . . . . . . . $ 39 $ 45Unamortized debt costs and other intangible assets . . . . . . . . . . . . . . . . . . . . . . . . 33 35Notes and other receivables . . . . . . . . . . . . . . . . . . . . . . . . . . . . . . . . . . . . . . . . . . 11 13Other . . . . . . . . . . . . . . . . . . . . . . . . . . . . . . . . . . . . . . . . . . . . . . . . . . . . . . . . . . . . 39 22
$122 $115
91
VISTEON CORPORATION AND SUBSIDIARIES
NOTES TO CONSOLIDATED FINANCIAL STATEMENTS — (Continued)

NOTE 11. Non-Consolidated Affiliates
The Company had $218 million and $224 million of equity in the net assets of non-consolidated affiliates atDecember 31, 2007 and 2006, respectively. The Company recorded equity in net income of non-consolidated affiliates of $47 million, $33 million and $25 million at December 31, 2007, 2006 and2005, respectively. The following table presents summarized financial data for such non-consolidatedaffiliates. The amounts included in the table below represent 100% of the results of operations of theCompany’s non-consolidated affiliates accounted for under the equity method. Yanfeng VisteonAutomotive Trim Systems Co., Ltd (“Yanfeng”), of which the Company owns a 50% interest, isconsidered a significant non-consolidated affiliate and is shown separately below.
Summarized balance sheet data as of December 31 is as follows:
2007 2006 2007 2006
(Dollars in Millions)
Yanfeng All Others
Current assets . . . . . . . . . . . . . . . . . . . . . . . . . . . . . . . . . . . . . . . . $382 $270 $230 $217Other assets . . . . . . . . . . . . . . . . . . . . . . . . . . . . . . . . . . . . . . . . . 298 277 184 161
Total assets . . . . . . . . . . . . . . . . . . . . . . . . . . . . . . . . . . . . . . . . $680 $547 $414 $378
Current liabilities . . . . . . . . . . . . . . . . . . . . . . . . . . . . . . . . . . . . . . $390 $254 $211 $198Other liabilities . . . . . . . . . . . . . . . . . . . . . . . . . . . . . . . . . . . . . . . . 70 54 23 18Shareholders’ equity . . . . . . . . . . . . . . . . . . . . . . . . . . . . . . . . . . . . 220 239 180 162
Total liabilities and shareholders’ equity . . . . . . . . . . . . . . . . . . . . $680 $547 $414 $378
Summarized statement of operations data for the years ended December 31 is as follows:
2007 2006 2005 2007 2006 2005 2007 2006 2005
Net Sales Gross Margin Net Income
(Dollars in Millions)
Yanfeng. . . . . . . . . . . . . . . . . . . . . $ 937 $ 700 $ 497 $166 $121 $ 89 $68 $51 $30All other . . . . . . . . . . . . . . . . . . . . 707 652 600 106 94 88 26 16 22
$1,644 $1,352 $1,097 $272 $215 $177 $94 $67 $52
The Company’s share of net assets and net income is reported in the consolidated financial statements as“Equity in net assets of non-consolidated affiliates” on the consolidated balance sheets and “Equity in netincome of non-consolidated affiliates” on the consolidated statements of operations. Included in theCompany’s accumulated deficit is undistributed income of non-consolidated affiliates accounted for underthe equity method of approximately $99 million and $117 million at December 31, 2007 and 2006,respectively.
Restricted net assets related to the Company’s consolidated subsidiaries were approximately $85 millionand $70 million, respectively as of December 31, 2007 and 2006. Restricted net assets related to theCompany’s non-consolidated affiliates were approximately $218 million and $224 million, respectively asof December 31, 2007 and 2006. Restricted net assets of consolidated subsidiaries are attributable to theCompany’s operations in China, where certain regulatory requirements and governmental restraints resultin significant restrictions on the Company’s consolidated subsidiaries ability to transfer funds to theCompany.
92
VISTEON CORPORATION AND SUBSIDIARIES
NOTES TO CONSOLIDATED FINANCIAL STATEMENTS — (Continued)

NOTE 12. Property and Equipment
Property and equipment, net consists of the following:
2007 2006
December 31
(Dollars in Millions)
Land . . . . . . . . . . . . . . . . . . . . . . . . . . . . . . . . . . . . . . . . . . . . . . . . . . . . . . . . . . . $ 95 $ 112Buildings and improvements . . . . . . . . . . . . . . . . . . . . . . . . . . . . . . . . . . . . . . . . . 1,083 1,221Machinery, equipment and other . . . . . . . . . . . . . . . . . . . . . . . . . . . . . . . . . . . . . . 3,894 4,065Construction in progress . . . . . . . . . . . . . . . . . . . . . . . . . . . . . . . . . . . . . . . . . . . . 146 125
Total property and equipment . . . . . . . . . . . . . . . . . . . . . . . . . . . . . . . . . . . . . . 5,218 5,523Accumulated depreciation . . . . . . . . . . . . . . . . . . . . . . . . . . . . . . . . . . . . . . . . . . . (2,573) (2,653)
2,645 2,870Product tooling, net of amortization . . . . . . . . . . . . . . . . . . . . . . . . . . . . . . . . . . . . 148 164
Property and equipment, net. . . . . . . . . . . . . . . . . . . . . . . . . . . . . . . . . . . . . . . . . $ 2,793 $ 3,034
Property and equipment is depreciated principally using the straight-line method of depreciation over theestimated useful life of the asset. Generally, buildings and improvements are depreciated over a 30-yearestimated useful life and machinery, equipment and other assets are depreciated over estimated usefullives ranging from 5 to 15 years. Product tooling is amortized using the straight-line method over theestimated life of the tool, generally approximating five years.
Depreciation and amortization expenses are summarized as follows:
2007 2006 2005
Year Ended December 31
(Dollars in Millions)
Depreciation . . . . . . . . . . . . . . . . . . . . . . . . . . . . . . . . . . . . . . . . . . . . . . . . . . $425 $377 $508Amortization. . . . . . . . . . . . . . . . . . . . . . . . . . . . . . . . . . . . . . . . . . . . . . . . . . . 47 53 87
$472 $430 $595
The Company recorded approximately $50 million and $5 million of accelerated depreciation expense forthe years ended December 31, 2007 and 2006, respectively, representing the shortening of estimateduseful lives of certain assets (primarily machinery and equipment) in connection with the Company’srestructuring activities.
93
VISTEON CORPORATION AND SUBSIDIARIES
NOTES TO CONSOLIDATED FINANCIAL STATEMENTS — (Continued)

NOTE 13. Other Liabilities
Other current liabilities consist of the following:
2007 2006
December 31
(Dollars in Millions)
Restructuring reserves. . . . . . . . . . . . . . . . . . . . . . . . . . . . . . . . . . . . . . . . . . . . . . . $ 87 $ 53Accrued interest payable . . . . . . . . . . . . . . . . . . . . . . . . . . . . . . . . . . . . . . . . . . . . . 62 53Product warranty and recall reserves . . . . . . . . . . . . . . . . . . . . . . . . . . . . . . . . . . . . 54 53Non-income taxes payable. . . . . . . . . . . . . . . . . . . . . . . . . . . . . . . . . . . . . . . . . . . . 34 31Income taxes payable . . . . . . . . . . . . . . . . . . . . . . . . . . . . . . . . . . . . . . . . . . . . . . . 13 23Other accrued liabilities . . . . . . . . . . . . . . . . . . . . . . . . . . . . . . . . . . . . . . . . . . . . . . 101 107
$351 $320
Other non-current liabilities consist of the following:
2007 2006
December 31
(Dollars in Millions)
Income tax reserves . . . . . . . . . . . . . . . . . . . . . . . . . . . . . . . . . . . . . . . . . . . . . . . . $154 $ 57Non-income taxes payable. . . . . . . . . . . . . . . . . . . . . . . . . . . . . . . . . . . . . . . . . . . . 80 106Deferred income . . . . . . . . . . . . . . . . . . . . . . . . . . . . . . . . . . . . . . . . . . . . . . . . . . . 63 56Product warranty and recall reserves . . . . . . . . . . . . . . . . . . . . . . . . . . . . . . . . . . . . 54 52Restructuring reserves. . . . . . . . . . . . . . . . . . . . . . . . . . . . . . . . . . . . . . . . . . . . . . . 25 —Other accrued liabilities . . . . . . . . . . . . . . . . . . . . . . . . . . . . . . . . . . . . . . . . . . . . . . 52 47
$428 $318
In connection with the ACH Transactions, the Company sold to and leased-back from Ford certain land andbuildings. The leases have 6-year terms with rental payments that are significantly below market rates,which represents continuing involvement under Statement of Financial Accounting Standards No. 98,“Accounting for Leases.” Accordingly, the resulting gain on the sale of the land and buildings of $42 millionhas been deferred and will be recognized upon termination of continuing involvement. Additionally, theCompany had deferred gains on other sale/leaseback transactions of $15 million and $9 million as ofDecember 31, 2007 and 2006 respectively which will be recognized during the remaining lease terms of upto six years on these facilities.
94
VISTEON CORPORATION AND SUBSIDIARIES
NOTES TO CONSOLIDATED FINANCIAL STATEMENTS — (Continued)

NOTE 14. Debt
The Company had $95 million and $2,745 million of outstanding short-term debt and long-term debt,respectively, at December 31, 2007. Short-term debt and long-term debt at December 31, including the fairmarket value of related interest rate swaps, was as follows:
Maturity 2007 2006 2007 2006
WeightedAverage
Interest Rate Carrying Value
(Dollars in Millions)
Short-term debtCurrent portion of long-term debt . . . . . . . . . . . . . . . 5.8% 6.3% $ 44 $ 31Other — short-term . . . . . . . . . . . . . . . . . . . . . . . . . 5.5% 6.3% 51 69
Total short-term debt . . . . . . . . . . . . . . . . . . . . . . 95 100
Long-term debt8.25% notes due August 1, 2010 . . . . . . . . . . . . . . . 2010 8.4% 8.4% 553 550Term loan due June 13, 2013 . . . . . . . . . . . . . . . . . 2013 8.5% 8.5% 1,000 1,000Term loan due December 13, 2013 . . . . . . . . . . . . . 2013 8.6% — 500 —7.00% notes due March 10, 2014 . . . . . . . . . . . . . . 2014 7.7% 7.4% 449 439Other . . . . . . . . . . . . . . . . . . . . . . . . . . . . . . . . . . . . 2009-2025 5.6% 5.4% 243 139
Total long-term debt . . . . . . . . . . . . . . . . . . . . . . . 2,745 2,128
Total debt . . . . . . . . . . . . . . . . . . . . . . . . . . . . . . . $2,840 $2,228
2007 Debt Transactions
On November 27, 2007, the Company’s 70% owned subsidiary, Halla Climate Control Corporation(“HCCC”), issued two separate unsecured bonds of 60 billion KRW and 70 billion KRW, dueNovember 27, 2009 and 2010 respectively, for total proceeds of approximately $139 million. Theproceeds from the new loan, combined with existing cash balances were used to subscribe for anownership interest in a newly formed Korean company that holds interests in certain of the Company’sclimate control operations in India, China and the United States. In December 2007 Visteon redeemed itsownership interest in the newly formed Korean company in exchange for approximately $292 million.
On April 10, 2007, the Company entered into an agreement to amend and restate its $1 billion seven-yearterm loan due June 13, 2013 (the “Amended Credit Agreement”) to provide an additional $500 millionseven-year term loan, which will mature on December 13, 2013. Consistent with the existing term loan, theadditional term loan bears interest at a Eurodollar rate plus 3%.
2006 Debt Transactions
On January 9, 2006 the Company closed on an 18-month term loan (the “18-Month Term Loan”) in theamount of $350 million to replace the Company’s $300 million short-term revolving credit agreement thatexpired on December 15, 2005. The 18-Month Term Loan was made a part of the Company’s existingFive-Year Revolving Credit Facility agreement, which was to expire in June 2007.
95
VISTEON CORPORATION AND SUBSIDIARIES
NOTES TO CONSOLIDATED FINANCIAL STATEMENTS — (Continued)

NOTE 14. Debt — (Continued)
On June 13, 2006 the Company entered into a credit agreement with a syndicate of third-party lenders toprovide for an $800 million seven-year term loan. The proceeds from that loan were used to repayborrowings and interest under the $350 million 18-Month Term Loan, the $241 million five-year term loan,and amounts outstanding under the Five-Year Revolving Credit Facility. Subsequent to closing on the newterm loan, the Company initiated open market purchases of its 8.25% notes due 2010. The Companypurchased $150 million of the 8.25% notes at an all-in weighted cost of 94.16% of par, resulting in a gain onearly extinguishment of approximately $8 million.
On August 14, 2006 the Company entered into a revolving credit agreement (“Revolving CreditAgreement”) with a syndicate of financial institutions to provide for up to $350 million in revolvingloans. The Revolving Credit Agreement replaced the Company’s Five-Year Revolving Credit Facilityagreement that was to expire in June 2007.
On November 27, 2006 the Company increased the $800 million seven-year term due June 13, 2013 loanby $200 million, for a total of $1 billion outstanding as of December 31, 2006.
Revolving Credit
The Revolving Credit Agreement allows for total borrowings of up to $350 million. The amount ofavailability at any time is dependent upon various factors, including outstanding letters of credit, theamount of eligible receivables, inventory and property and equipment. Borrowings under the RevolvingCredit Agreement bear interest based on a variable rate interest option selected at the time of borrowing.The Revolving Credit Agreement expires on August 14, 2011. As of December 31, 2007, there were nooutstanding borrowings under the Revolving Credit Agreement. The total facility availability for theCompany was $257 million with $159 million available for borrowings after consideration of $98 millionof obligations under outstanding letters of credit.
Borrowings under the Revolving Credit Agreement are secured by a first-priority lien on certain assets ofthe Company and most of its domestic subsidiaries, including real property, accounts receivable, inventory,equipment and other tangible and intangible property, including the capital stock of nearly all direct andindirect domestic subsidiaries (other than those domestic subsidiaries the sole assets of which are capitalstock of foreign subsidiaries), as well as a second-priority lien on substantially all other material tangibleand intangible assets of the Company and most of its domestic subsidiaries which secure the Company’sseven-year term loan agreement. The terms of the Revolving Credit Agreement limit the obligationssecured by certain U.S. assets to ensure compliance with the Company’s bond indenture.
8.25% Notes due August 1, 2010
On August 3, 2000, the Company completed a public offering of unsecured fixed rate term debt securities,which included $700 million maturing on August 1, 2010. These securities bear interest at a stated rate of8.25%, with interest payable semi-annually on February 1 and August 1, beginning on February 1, 2001.The unsecured term debt securities agreement contains certain restrictions including, among others, alimitation relating to liens and sale-leaseback transactions, as defined in the agreement. The Companywas in compliance with applicable restrictions as of December 31, 2007.
96
VISTEON CORPORATION AND SUBSIDIARIES
NOTES TO CONSOLIDATED FINANCIAL STATEMENTS — (Continued)
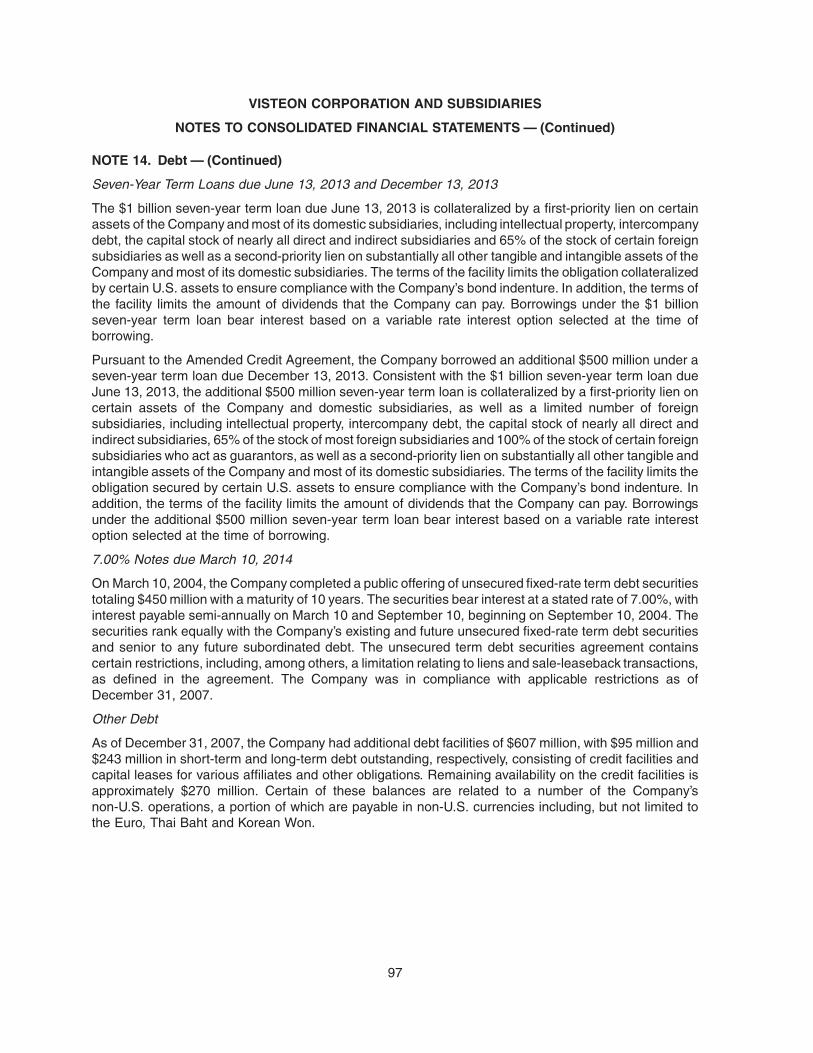
NOTE 14. Debt — (Continued)
Seven-Year Term Loans due June 13, 2013 and December 13, 2013
The $1 billion seven-year term loan due June 13, 2013 is collateralized by a first-priority lien on certainassets of the Company and most of its domestic subsidiaries, including intellectual property, intercompanydebt, the capital stock of nearly all direct and indirect subsidiaries and 65% of the stock of certain foreignsubsidiaries as well as a second-priority lien on substantially all other tangible and intangible assets of theCompany and most of its domestic subsidiaries. The terms of the facility limits the obligation collateralizedby certain U.S. assets to ensure compliance with the Company’s bond indenture. In addition, the terms ofthe facility limits the amount of dividends that the Company can pay. Borrowings under the $1 billionseven-year term loan bear interest based on a variable rate interest option selected at the time ofborrowing.
Pursuant to the Amended Credit Agreement, the Company borrowed an additional $500 million under aseven-year term loan due December 13, 2013. Consistent with the $1 billion seven-year term loan dueJune 13, 2013, the additional $500 million seven-year term loan is collateralized by a first-priority lien oncertain assets of the Company and domestic subsidiaries, as well as a limited number of foreignsubsidiaries, including intellectual property, intercompany debt, the capital stock of nearly all direct andindirect subsidiaries, 65% of the stock of most foreign subsidiaries and 100% of the stock of certain foreignsubsidiaries who act as guarantors, as well as a second-priority lien on substantially all other tangible andintangible assets of the Company and most of its domestic subsidiaries. The terms of the facility limits theobligation secured by certain U.S. assets to ensure compliance with the Company’s bond indenture. Inaddition, the terms of the facility limits the amount of dividends that the Company can pay. Borrowingsunder the additional $500 million seven-year term loan bear interest based on a variable rate interestoption selected at the time of borrowing.
7.00% Notes due March 10, 2014
On March 10, 2004, the Company completed a public offering of unsecured fixed-rate term debt securitiestotaling $450 million with a maturity of 10 years. The securities bear interest at a stated rate of 7.00%, withinterest payable semi-annually on March 10 and September 10, beginning on September 10, 2004. Thesecurities rank equally with the Company’s existing and future unsecured fixed-rate term debt securitiesand senior to any future subordinated debt. The unsecured term debt securities agreement containscertain restrictions, including, among others, a limitation relating to liens and sale-leaseback transactions,as defined in the agreement. The Company was in compliance with applicable restrictions as ofDecember 31, 2007.
Other Debt
As of December 31, 2007, the Company had additional debt facilities of $607 million, with $95 million and$243 million in short-term and long-term debt outstanding, respectively, consisting of credit facilities andcapital leases for various affiliates and other obligations. Remaining availability on the credit facilities isapproximately $270 million. Certain of these balances are related to a number of the Company’snon-U.S. operations, a portion of which are payable in non-U.S. currencies including, but not limited tothe Euro, Thai Baht and Korean Won.
97
VISTEON CORPORATION AND SUBSIDIARIES
NOTES TO CONSOLIDATED FINANCIAL STATEMENTS — (Continued)

NOTE 14. Debt — (Continued)
Interest Rate Swaps
The Company has entered into interest rate swaps for a portion of the 8.25% notes due August 1, 2010($125 million) and a portion of the 7.00% notes due March 10, 2014 ($225 million). These interest rateswaps effectively convert the designated portions of these notes from fixed interest rate to variable interestrate instruments in connection with the Company’s risk management policies. These interest rate swapshave been designated as fair value hedges and the effect of marking these contracts to market has beenrecorded in the Company’s consolidated balance sheets as a direct adjustment to the underlying debt. Theadjustment does not affect the results of operations unless the contract is terminated, in which case theresulting gain or loss on termination is recorded as a valuation adjustment of the underlying debt and isamortized to interest expense over the remaining life of the debt.
During 2006, the Company entered into interest rate swaps for a portion of the $1 billion seven-year termloan due 2013 ($200 million), effectively converting the designated portion of this loan from a variableinterest rate to a fixed interest rate instrument. These interest rate swaps are accounted for as cash flowhedges with the effective portion of the gain or loss reported in the “Accumulated other comprehensiveincome/ (loss)” component of “Shareholders’ Deficit” in the Company’s consolidated balance sheets. Theineffective portion of these swaps is assessed based on the hypothetical derivative method and is recordedas interest expense in the Company’s consolidated statements of operations.
During the first quarter of 2005, the Company terminated interest rate swaps with a notional amount of$200 million related to the 8.25% notes due August 1, 2010 and received $7 million in cash. The fair valueof the interest rate swaps at termination is deferred as part of the underlying debt and amortized as areduction in interest expense over the remaining term of the debt.
NOTE 15. Employee Retirement Benefits
Visteon Sponsored Employee Retirement Plans
In the U.S., the Company’s hourly employees represented by certain collective bargaining groups earnnoncontributory benefits based on employee service, while the Company’s U.S. salaried employees earnnoncontributory pay related benefits. Certain of the non-U.S. subsidiaries sponsor separate plans thatprovide similar types of benefits to their employees. In general, the Company’s defined benefit plans arefunded with the exception of certain supplemental benefit plans for executives and certain non-U.S. plans,primarily in Germany. The Company’s policy for funded plans is to contribute annually, at a minimum,amounts required by applicable law, regulation or union agreement.
Most U.S. salaried employees and certain non-U.S. employees are eligible to participate in definedcontribution plans by contributing a portion of their compensation, which is partially matched by theCompany. Matching contributions were suspended for the U.S. defined contribution plan effectiveJanuary 1, 2002 and were reinstated on July 1, 2006. The expense related to matching contributionswas approximately $8 million and $4 million in 2007 and 2006, respectively.
In December 2005, the Company approved changes to the U.S. salaried pension plans which becameeffective July 1, 2006 and service accruals for the previous pension benefit ceased as of June 30, 2006.The U.S. salaried pension plans no longer provide early retirement supplements to participants who retireafter July 1, 2006. However, a cash balance benefit accrues for service earned after June 30, 2006. Thesechanges resulted in a reduction to the projected benefit obligation (“PBO”) of $30 million which is beingamortized as a reduction of retirement benefit expense over the estimated average remaining employeeservice lives.
98
VISTEON CORPORATION AND SUBSIDIARIES
NOTES TO CONSOLIDATED FINANCIAL STATEMENTS — (Continued)

NOTE 15. Employee Retirement Benefits — (Continued)
In May 2007, the Company approved changes to the U.S. salaried pension plans which reduced disabilityretirement benefits. These changes resulted in a reduction to the PBO of approximately $20 million whichis being amortized as a reduction of retirement benefit expense over the estimated average remainingservice lives.
Visteon Sponsored Postretirement Employee Health Care and Life Insurance Benefits
In the U.S., the Company has a financial obligation for the cost of providing selected postretirement healthcare and life insurance benefits to its employees under Company sponsored plans. These plans generallypay for the cost of health care and life insurance for retirees and dependents, less retiree contributions andco-pays.
During January 2007, the Company communicated changes to the U.S. salaried postretirement healthcare plans which became effective June 1, 2007. These changes eliminate Company-sponsoredprescription drug coverage for Medicare eligible salaried retirees, surviving spouses and dependents.These changes resulted in a reduction to the accumulated postretirement benefit obligation (“APBO”) ofapproximately $30 million which will be amortized as a reduction of postretirement employee benefitexpense over the estimated average remaining employee service lives.
Ford Sponsored Employee Retirement Plans
Prior to the ACH Transactions, Visteon-assigned Ford-UAW employees participated in the Ford-UAWRetirement Plan, sponsored by Ford, and the Company reimbursed Ford for the related pension expense.Effective October 1, 2005 and in connection with the ACH Transactions, Ford assumed all wage andbenefit accruals for Ford-UAW employees, eliminating further reimbursement to Ford from the Companyrelated to these employees.
Ford Sponsored Postretirement Employee Health Care and Life Insurance Benefits
Effective October 1, 2005 and in connection with the ACH Transactions, Ford relieved the Company of allliabilities totaling approximately $2.2 billion for postretirement health care and life insurance relatedobligations for Visteon-assigned Ford-UAW employees and retirees and for salaried retirees who retiredprior to May 24, 2005. In addition, the Company transferred the related assets of approximately $25 millionto Ford. This relief was accounted for in accordance with Statement of Financial Accounting StandardsNo. 15 “Accounting by Debtors and Creditors for Troubled Debt Restructurings.” Because there were nocontingently payable amounts relating to this obligation as of October 1, 2005, amounts currently forgivenand previously deferred amounts were recorded in the “Gain on ACH Transactions” in the 2005consolidated statement of operations.
Ford will continue to charge the Company for the expense of postretirement health care and life insurancebenefits that are provided by Ford to certain Company salaried employees who retire after May 24, 2005.The Company is required to fund the actual costs of these benefits as incurred by Ford for the salariedretirees through 2010. In addition, the Company has agreed to contribute funds to a trust to fundpostretirement health care and life insurance benefits to be provided by Ford related to these salariedemployees and retirees. The required funding is over a 39-year period beginning in 2011. The annualfunding requirement during this period will be determined annually based upon amortization of theunfunded liabilities at year-end 2010 plus a portion of annual expense.
99
VISTEON CORPORATION AND SUBSIDIARIES
NOTES TO CONSOLIDATED FINANCIAL STATEMENTS — (Continued)

NOTE 15. Employee Retirement Benefits — (Continued)
The benefit obligations below reflect the salaried plan changes announced by Ford in November 2006 andthe effect of the ACH Transactions and are based upon Ford’s assumptions. The current and long-termbenefit obligations and total net amount recognized in the balance sheets for the postretirement healthcare and life insurance benefits payable to Ford relating to participation by certain salaried employeeswere as follows:
2007 2006December 31
(Dollars in Millions)
Obligation for benefits to certain salaried employees . . . . . . . . . . . . . . . . . . . . . . . . $ 81 $ 91Unamortized gains associated with the obligation . . . . . . . . . . . . . . . . . . . . . . . . . . 40 36
Postretirement employee benefits payable to Ford . . . . . . . . . . . . . . . . . . . . . . . . $121 $127
Adoption of Statement of Financial Accounting Standards No. 158 Measurement Date Provisions
Statement of Financial Accounting Standards No. 158 (“SFAS 158”), “Employers’ Accounting for DefinedBenefit Pension and Other Postretirement Benefits, an amendment of FASB Statements No. 87, 88, 106,and 132(R)” requires recognition of a net asset or liability representing the funded status of defined benefitpension and other postretirement benefit (“OPEB”) plans. In addition, SFAS 158 requires companies tomeasure plan assets and benefit obligations as of the date of the employer’s fiscal year-end balance sheet.The Company adopted the recognition and disclosure provisions of SFAS 158 as of December 31, 2006and the measurement provisions of this standard as of January 1, 2007.
The Company re-measured plan assets and obligations as of January 1, 2007 consistent with theprovisions of SFAS 158, initially recording a reduction to its pension and OPEB liabilities of$100 million and $90 million, respectively, and an increase to accumulated other comprehensiveincome of $190 million. The Company also adjusted the January 1, 2007 retained earnings balanceby approximately $34 million, representing the net periodic benefit costs for the period betweenSeptember 30, 2006 and January 1, 2007 that would have been recognized on a delayed basis duringthe first quarter of 2007 absent the change in measurement date. The net periodic benefit costs for 2007were based on this January 1, 2007 measurement or subsequent re-measurements. During the fourthquarter of 2007 the Company further reduced its pension liability by $20 million with a correspondingincrease to accumulated other comprehensive income based on a revision of its re-measured pensionobligation as of January 1, 2007. The revision had no impact on full year earnings and an immaterial impacton income as reported in each of the previous three quarters of 2007.
100
VISTEON CORPORATION AND SUBSIDIARIES
NOTES TO CONSOLIDATED FINANCIAL STATEMENTS — (Continued)

NOTE 15. Employee Retirement Benefits — (Continued)
Benefit Expenses
The Company’s expense for retirement benefits is as follows:
2007 2006 2005 2007 2006 2005 2007 2006 2005U.S. Plans Non-U.S. Plans
Health Care and LifeInsurance Benefits
Retirement Plans
(Dollars in Millions, Except Percentages)
Costs Recognized in IncomeService cost . . . . . . . . . . . . . . . . . . . . . . . $ 23 $ 49 $ 62 $ 27 $ 35 $ 32 $ 6 $ 16 $ 38Interest cost . . . . . . . . . . . . . . . . . . . . . . . 71 73 72 72 70 66 32 42 65Expected return on plan assets . . . . . . . . . . (76) (73) (68) (55) (56) (61) — — —Amortization of:
Transition obligation . . . . . . . . . . . . . . . . — — — — 1 1 — — —Plan amendments . . . . . . . . . . . . . . . . . 1 6 9 5 5 7 (47) (49) (15)Losses and other . . . . . . . . . . . . . . . . . . 1 5 7 11 21 7 15 28 29
Special termination benefits . . . . . . . . . . . . 3 1 — — — — — — —Curtailments . . . . . . . . . . . . . . . . . . . . . . . 7 — — 4 — 13 (58) (51) 6Settlements . . . . . . . . . . . . . . . . . . . . . . . — — — 32 (1) — — — —
Visteon sponsored plan net pension/postretirement expense . . . . . . . . . . . . . . 30 61 82 96 75 65 (52) (14) 123
Expense for Visteon-assigned Ford-UAW andcertain salaried employees. . . . . . . . . . . . 6 (2) 85 — — — (5) (32) 168
Employee retirement benefit expensesexcluding restructuring . . . . . . . . . . . . . . $ 36 $ 59 $ 167 $ 96 $ 75 $ 65 $ (57) $ (46) $ 291
Retirement benefit related restructuringexpenses
Special termination benefits . . . . . . . . . . . . $ 6 $ 4 $ — $ 9 $ 1 $ 4 $ — $ — $ —Other . . . . . . . . . . . . . . . . . . . . . . . . . . . 1 2 3 — — — — — —
Total employee retirement benefit relatedrestructuring expenses . . . . . . . . . . . . . . $ 7 $ 6 $ 3 $ 9 $ 1 $ 4 $ — $ — $ —
Weighted Average Assumptions Used forExpenses
Discount rate for expense . . . . . . . . . . . . . . 5.95% 5.70% 6.10% 5.05% 4.90% 5.50% 5.85% 5.70% 5.80%Assumed long-term rate of return on assets. . 8.00% 8.50% 9.00% 6.50% 6.70% 7.50% — — —Initial health care cost trend rate . . . . . . . . . 9.30% 9.80% 11.00%Ultimate health care cost trend rate . . . . . . . 5.00% 5.00% 5.00%Year ultimate health care cost trend rate
reached . . . . . . . . . . . . . . . . . . . . . . . . 2011 2010 2010
Curtailments and Settlements
Curtailment and settlement gains and losses are recorded in accordance with Statement of FinancialAccounting Standards Nos. 88 (“SFAS 88”), “Employers’ Accounting for Settlements and Curtailments ofDefined Benefit Pension Plans and for Termination Benefits”, and 106 (“SFAS 106”), “Employers’Accounting for Postretirement Benefits Other Than Pensions” and are classified in the Company’sconsolidated statements of operations as “Cost of sales” or “Selling, general and administrativeexpenses”. Qualifying curtailment and settlement losses related to the Company’s restructuringactivities are reimbursable under the terms of the Escrow Agreement.
101
VISTEON CORPORATION AND SUBSIDIARIES
NOTES TO CONSOLIDATED FINANCIAL STATEMENTS — (Continued)

NOTE 15. Employee Retirement Benefits — (Continued)
During 2007 the Company recorded significant curtailments and settlements of its employee retirementbenefit plans as follows:
• Curtailment loss of $7 million related to employee retirement benefit obligations under certainU.S. retirement plans in connection with previously announced restructuring actions.
• Settlement loss of $13 million related to employee retirement benefit obligations under certain Germanretirement plans for employees of the Dueren and Wuelfrath, Germany facilities, which were included inthe Chassis Divestiture.
• Settlement losses of $20 million related to employee retirement benefit obligations under Canadianretirement plans for employees of the Markham, Ontario facility, which was closed in 2002.
• Curtailment loss of $4 million related to employee retirement benefit obligations for certain salariedemployee reductions in the UK.
• Curtailment gains of $58 million related to elimination of employee benefits associated with a U.S. OPEBplan in connection with employee headcount reductions under previously announced restructuringactions.
During 2006 the Company recorded significant curtailments and settlements of its employee retirementbenefit plans as follows:
• Effective January 1, 2006, Ford acquired two plants from ACH, which are located in Rawsonville,Michigan and Sterling Heights, Michigan. In connection with this transaction and the Salaried EmployeeTransition Agreement between the Company and Ford, certain salaried employees of the Companywere transferred to Ford who were eligible for benefits or who had rights to benefits under Ford’spostretirement health care and life insurance plans. The Company recorded approximately $24 millionrelated to the relief of postretirement benefits payable to Ford. Additionally, the Company recordedcurtailment gains of approximately $48 million related to the reduction in expected years of future servicein Visteon sponsored postretirement health care and life insurance and retirement plans.
• Reduction of approximately 200 hourly employees at certain U.S. manufacturing facilities, resulted in areduction in expected years of future service in the related retirement and postretirement health careplans. As a result, the Company recorded an OPEB curtailment gain of approximately $14 million and apension curtailment loss of $3 million.
• In connection with a plan to exit a North American manufacturing facility, the Company recorded acurtailment loss of $8 million. The curtailment loss reflects a reduction in expected years of future servicein the related retirement plans.
During 2005, the Company recognized curtailment losses on its postretirement health care plans andnon-U.S. retirement plans of $6 million primarily related to the closure of a Puerto Rican manufacturingfacility and $13 million related to certain non-U.S. pensions, respectively.
102
VISTEON CORPORATION AND SUBSIDIARIES
NOTES TO CONSOLIDATED FINANCIAL STATEMENTS — (Continued)

NOTE 15. Employee Retirement Benefits — (Continued)
Retirement Benefit Related Restructuring Expenses
In addition to normal employee retirement benefit expenses, the Company recorded $16 million, $7 millionand $7 million for the years ended December 31, 2007, 2006 and 2005, respectively, for retirement benefitrelated restructuring charges. Such charges generally relate to special termination benefits, voluntarytermination incentives, and pension losses and are the result of various restructuring actions as describedin Note 4 “Restructuring Activities.” Retirement benefit related restructuring charges are recorded inaccordance with SFAS 87, 88, 106, 112 and 158, are initially classified as restructuring expenses and aresubsequently reclassified to retirement benefit expenses.
Assumed Health Care Trend Rate Sensitivity
The following table illustrates the sensitivity to a change in the assumed health care trend rate related toVisteon sponsored postretirement employee health care plan expense (excludes certain salariedemployees that are covered by a Ford sponsored plan):
Total Service andInterest Cost APBO
100 basis point increase in health care cost trend rates(a) . . . . . . . . . +$4 million +$55 million
100 basis point decrease in health care cost trend rates(a) . . . . . . . . �$3 million �$47 million
(a) Assumes all other assumptions are held constant.
103
VISTEON CORPORATION AND SUBSIDIARIES
NOTES TO CONSOLIDATED FINANCIAL STATEMENTS — (Continued)

NOTE 15. Employee Retirement Benefits — (Continued)
Benefit Obligations
2007 2006 2007 2006 2007 2006
U.S. Plans Non-U.S. Plans
Health Care andLife Insurance
Benefits
Retirement Plans
(Dollars in Millions, Except Percentages)
Change in Benefit ObligationBenefit obligation — beginning. . . . . . . . . . . . . . . . . . . $1,224 $1,309 $1,566 $1,349 $ 667 $ 742
Effect of SFAS 158 adoption. . . . . . . . . . . . . . . . . 17 — (52) — (90) —Service cost . . . . . . . . . . . . . . . . . . . . . . . . . . . . 23 49 27 35 6 16Interest cost . . . . . . . . . . . . . . . . . . . . . . . . . . . . 71 73 72 70 32 42Participant contributions . . . . . . . . . . . . . . . . . . . . — 5 8 10 1 1Amendments/other. . . . . . . . . . . . . . . . . . . . . . . . (19) (29) 1 (2) — (2)Actuarial (gain)/loss . . . . . . . . . . . . . . . . . . . . . . . (49) (105) (105) (16) (20) (80)Special termination benefits . . . . . . . . . . . . . . . . . 9 1 9 4 — —Curtailments, net . . . . . . . . . . . . . . . . . . . . . . . . . (32) (21) (32) (1) (28) (18)Settlements . . . . . . . . . . . . . . . . . . . . . . . . . . . . . (1) — (183) (3) — —Foreign exchange translation . . . . . . . . . . . . . . . . — — 57 163 1 —Divestitures . . . . . . . . . . . . . . . . . . . . . . . . . . . . . — — (70) — — —Benefits paid . . . . . . . . . . . . . . . . . . . . . . . . . . . . (64) (58) (50) (43) (26) (34)
Benefit obligation — ending . . . . . . . . . . . . . . . . . . . . . $1,179 $1,224 $1,248 $1,566 $ 543 $ 667
Change in Plan AssetsPlan assets — beginning. . . . . . . . . . . . . . . . . . . . . . . $ 960 $ 889 $1,002 $ 817 $ — $ —
Effect of SFAS 158 adoption. . . . . . . . . . . . . . . . . 29 — 24 — — —Actual return on plan assets . . . . . . . . . . . . . . . . . 78 69 45 72 — —Sponsor contributions. . . . . . . . . . . . . . . . . . . . . . 49 59 77 51 25 33Participant contributions . . . . . . . . . . . . . . . . . . . . — 5 8 10 1 1Foreign exchange translation . . . . . . . . . . . . . . . . — — 38 98 — —Settlements . . . . . . . . . . . . . . . . . . . . . . . . . . . . . — — (171) (3) — —Divestitures . . . . . . . . . . . . . . . . . . . . . . . . . . . . . — — (36) — — —Benefits paid/other . . . . . . . . . . . . . . . . . . . . . . . . (68) (62) (50) (43) (26) (34)
Plan assets — ending . . . . . . . . . . . . . . . . . . . . . . . . . $1,048 $ 960 $ 937 $1,002 $ — $ —
Funded Status of the PlansBenefit obligations in excess of plan assets . . . . . . . . . $ (131) $ (264) $ (311) $ (564) $(543) $(667)Contributions . . . . . . . . . . . . . . . . . . . . . . . . . . . . . . . — 2 — 11 — 8Special termination benefits/other . . . . . . . . . . . . . . . . — (4) — — — —Net benefit obligation . . . . . . . . . . . . . . . . . . . . . . . . . $ (131) $ (266) $ (311) $ (553) $(543) $(659)
Balance Sheet ClassificationOther current assets . . . . . . . . . . . . . . . . . . . . . . . . . . $ — $ — $ — $ 2 $ — $ —Other non-current assets . . . . . . . . . . . . . . . . . . . . . . — — 5 — — —Accrued employee liabilities . . . . . . . . . . . . . . . . . . . . (3) (2) (3) (18) (34) (34)Pension benefits. . . . . . . . . . . . . . . . . . . . . . . . . . . . . (128) (264) (313) (537) — —Postretirement benefits . . . . . . . . . . . . . . . . . . . . . . . . — — — — (509) (625)Accumulated other comprehensive (income)/loss . . . . . (93) 20 212 421 (109) (63)
The accumulated benefit obligation for all defined benefit pension plans was $2,246 million and$2,501 million at the 2007 and 2006 measurement dates. The projected benefit obligation,accumulated benefit obligation and fair value of plan assets for employee retirement plans withaccumulated benefit obligations in excess of plan assets were $1,693 million, $1,605 million and$1,323 million, respectively, for 2007 and $2,240 million, $2,061 million and $1,512 million,respectively, for 2006.
104
VISTEON CORPORATION AND SUBSIDIARIES
NOTES TO CONSOLIDATED FINANCIAL STATEMENTS — (Continued)

NOTE 15. Employee Retirement Benefits — (Continued)
Certain unrealized amounts related to the Company’s retirement, health care and life insurance benefitplans were included in “Accumulated other comprehensive income (loss)” on the Company’s consolidatedbalance sheet as of December 31, 2007, as follows:
U.S. Plans Non-U.S. Plans
Health Care andLife Insurance
Benefits
Retirement Plans
Actuarial (gain)/loss . . . . . . . . . . . . . . . . . . . . . . . . . . . . . $(61) $119 $ 175
Prior service (credit)/cost . . . . . . . . . . . . . . . . . . . . . . . . . (32) 46 (284)
Deferred taxes . . . . . . . . . . . . . . . . . . . . . . . . . . . . . . . . . — 47 —
$(93) $212 $(109)
Amounts included in “Accumulated other comprehensive income (loss)” as of December 31, 2007 that areexpected to be realized in 2008 are as follows:
U.S. Plans Non-U.S. Plans
Health Care andLife Insurance
Benefits
Retirement Plans
Actuarial (gain)/loss . . . . . . . . . . . . . . . . . . . . . . . . . . . . . $(1) $1 $ 12
Prior service cost/(credit) . . . . . . . . . . . . . . . . . . . . . . . . . (1) 6 (66)
$(2) $7 $(54)
Assumptions used by the Company in determining its benefit obligations as of December 31, 2007 and2006 were based on December 31 and September 30 measurement dates, respectively. Suchassumptions are summarized in the following table.
2007 2006 2007 2006 2007 2006U.S. Plans Non-U.S. Plans
Health Care andLife Insurance
BenefitsRetirement Plans
(Dollars in Millions, Except Percentages)
Weighted Average Assumptions
Discount rate . . . . . . . . . . . . . . . . . . . . . . . . . . . . . . 6.25% 5.90% 5.70% 4.90% 6.05% 5.90%
Expected rate of return on assets . . . . . . . . . . . . . . . 8.25% 8.00% 6.80% 6.40% — —
Rate of increase in compensation . . . . . . . . . . . . . . . 3.75% 3.75% 3.30% 2.90% — —
Initial health care cost trend rate . . . . . . . . . . . . . . . . 9.00% 9.30%
Ultimate health care cost trend rate . . . . . . . . . . . . . 5.00% 5.00%
Year ultimate health care cost trend rate reached . . . 2013 2011
Measurement date . . . . . . . . . . . . . . . . . . . . . . . . . . 12/31 9/30 12/31 9/30 12/31 9/30
Contributions
During 2008, the Company’s expected contributions to its U.S. retirement plans and postretirementemployee health care and life insurance plans are $19 million and $34 million, respectively. TheCompany’s expected 2008 contributions to non-U.S. retirement plans is $79 million. These areexpected contributions and may be revised during 2008.
105
VISTEON CORPORATION AND SUBSIDIARIES
NOTES TO CONSOLIDATED FINANCIAL STATEMENTS — (Continued)

NOTE 15. Employee Retirement Benefits — (Continued)
Estimated Future Benefit Payments
The following benefit payments, which reflect expected future service, as appropriate, are expected to bepaid by the Company plans; expected receipts from the Medicare Prescription Drug Act subsidy are alsoincluded below:
U.S. Non-U.S.Gross
Payments
MedicareSubsidyReceipts
Pension Benefits
Retiree Health and Life
(Dollars in Millions)
2008 . . . . . . . . . . . . . . . . . . . . . . . . . . . . . . . . . . . . . . . . . . . $ 62 $ 45 $ 36 $ 22009 . . . . . . . . . . . . . . . . . . . . . . . . . . . . . . . . . . . . . . . . . . . 65 43 41 22010 . . . . . . . . . . . . . . . . . . . . . . . . . . . . . . . . . . . . . . . . . . . 67 43 45 32011 . . . . . . . . . . . . . . . . . . . . . . . . . . . . . . . . . . . . . . . . . . . 66 43 47 32012 . . . . . . . . . . . . . . . . . . . . . . . . . . . . . . . . . . . . . . . . . . . 66 45 47 3Years 2013 — 2017 . . . . . . . . . . . . . . . . . . . . . . . . . . . . . . . . 343 238 240 20
During 2007 the Company’s Medicare subsidy receipts were approximately $2 million.
Plan Assets and Investment Strategy
Substantially all of the Company’s pension assets are managed by outside investment managers and heldin trust by third-party custodians. The selection and oversight of these outside service providers is theresponsibility of the Investment Committees and their advisors. The selection of specific securities is at thediscretion of the investment manager and is subject to the provisions set forth by written investmentmanagement agreements and related policy guidelines regarding permissible investments, riskmanagement practices and the use of derivative securities. Investment in debt or equity securitiesrelated to the Company or any of its affiliates is prohibited. Derivative securities may be used byinvestment managers as efficient substitutes for traditional securities, to reduce portfolio risks, or tohedge identifiable economic exposures. The use of derivative securities to create economic leverage toengage in unrelated speculation is expressly prohibited. The Company staff or its outside consultantsverify compliance with these provisions at least quarterly.
The primary objective of the pension funds is to pay the plans’ benefit and expense obligations when due.Given the relatively long horizon of these obligations and their sensitivity to interest rates, the investmentstrategy is intended to improve the funded status of its U.S. and non-U.S. plans over time while maintaininga prudent level of risk. Risk is managed primarily by diversifying each plan’s target asset allocation acrossequity, fixed income securities and alternative investment strategies, and then maintaining the allocationwithin a specified range of its target. In addition, diversification across various investment subcategorieswithin each plan is also maintained within specified ranges. The 2008 target allocation for the U.S. and oneof the large non-U.S. plans reflect investment policy changes to more broadly diversify the funds’ assetmixes across traditional and alternative asset classes and strategies, as well as more closely align the termstructure of their assets and liabilities.
106
VISTEON CORPORATION AND SUBSIDIARIES
NOTES TO CONSOLIDATED FINANCIAL STATEMENTS — (Continued)

NOTE 15. Employee Retirement Benefits — (Continued)
The Company’s retirement plan asset allocation at December 31, 2007 and September 30, 2006 andtarget allocation for 2008 are as follows:
2008 2007 2006 2008 2007 2006
TargetAllocation
Percentage ofPlan Assets
TargetAllocation
Percentage ofPlan Assets
U.S. Non-U.S.
Equity securities . . . . . . . . . . . . . . . . . . . . . 40% 68% 69% 30% 44% 59%Balanced Global asset allocation . . . . . . . . . 20 — — 3 — —Alternative Strategies. . . . . . . . . . . . . . . . . . 10 — — 4 — —Debt securities. . . . . . . . . . . . . . . . . . . . . . . 30 32 31 63 56 41
100% 100% 100% 100% 100% 100%
The Balanced Global asset allocation will be invested primarily in equity, fixed income and cashinstruments. Managers may change the mix within these allocations in response to market conditions,remaining within the guidelines for their specific strategies. The targeted Alternative Strategies allocationswill be primarily invested in hedge fund-of-funds designed to provide positive absolute returns throughoutthe market cycle.
The expected long-term rate of return for pension assets has been chosen based on various inputs,including historical returns for the different asset classes held by and to be held by the Company’s trustsand its targeted asset allocation, as well as inputs from internal and external sources regarding capitalmarket returns, inflation and other variables.
107
VISTEON CORPORATION AND SUBSIDIARIES
NOTES TO CONSOLIDATED FINANCIAL STATEMENTS — (Continued)

NOTE 16. Income Taxes
Income tax provision
Loss before income taxes, minority interests, discontinued operations, change in accounting andextraordinary item, excluding equity in net income of non-consolidated affiliates and the componentsof provision for income taxes are shown below:
2007 2006 2005Year Ended December 31
(Dollars in Millions)
U.S. . . . . . . . . . . . . . . . . . . . . . . . . . . . . . . . . . . . . . . . . . . . . . . . . . . . . . . . $(384) $(292) $ 117Non-U.S. . . . . . . . . . . . . . . . . . . . . . . . . . . . . . . . . . . . . . . . . . . . . . . . . . . . 52 170 (307)
Total loss before income taxes . . . . . . . . . . . . . . . . . . . . . . . . . . . . . . . . . $(332) $(122) $(190)
Current tax provision (benefit)U.S. federal . . . . . . . . . . . . . . . . . . . . . . . . . . . . . . . . . . . . . . . . . . . . . . . . $ — $ — $ (26)Non-U.S. . . . . . . . . . . . . . . . . . . . . . . . . . . . . . . . . . . . . . . . . . . . . . . . . . 93 118 111U.S. state and local . . . . . . . . . . . . . . . . . . . . . . . . . . . . . . . . . . . . . . . . . . — (1) (2)
Total current . . . . . . . . . . . . . . . . . . . . . . . . . . . . . . . . . . . . . . . . . . . . . 93 117 83
Deferred tax provision (benefit)U.S. federal . . . . . . . . . . . . . . . . . . . . . . . . . . . . . . . . . . . . . . . . . . . . . . . . (73) (68) —Non-U.S. . . . . . . . . . . . . . . . . . . . . . . . . . . . . . . . . . . . . . . . . . . . . . . . . . (4) (24) (19)U.S. state and local . . . . . . . . . . . . . . . . . . . . . . . . . . . . . . . . . . . . . . . . . . 4 — —
Total deferred . . . . . . . . . . . . . . . . . . . . . . . . . . . . . . . . . . . . . . . . . . . . (73) (92) (19)
Total provision for income taxes . . . . . . . . . . . . . . . . . . . . . . . . . . . . . . . $ 20 $ 25 $ 64
108
VISTEON CORPORATION AND SUBSIDIARIES
NOTES TO CONSOLIDATED FINANCIAL STATEMENTS — (Continued)
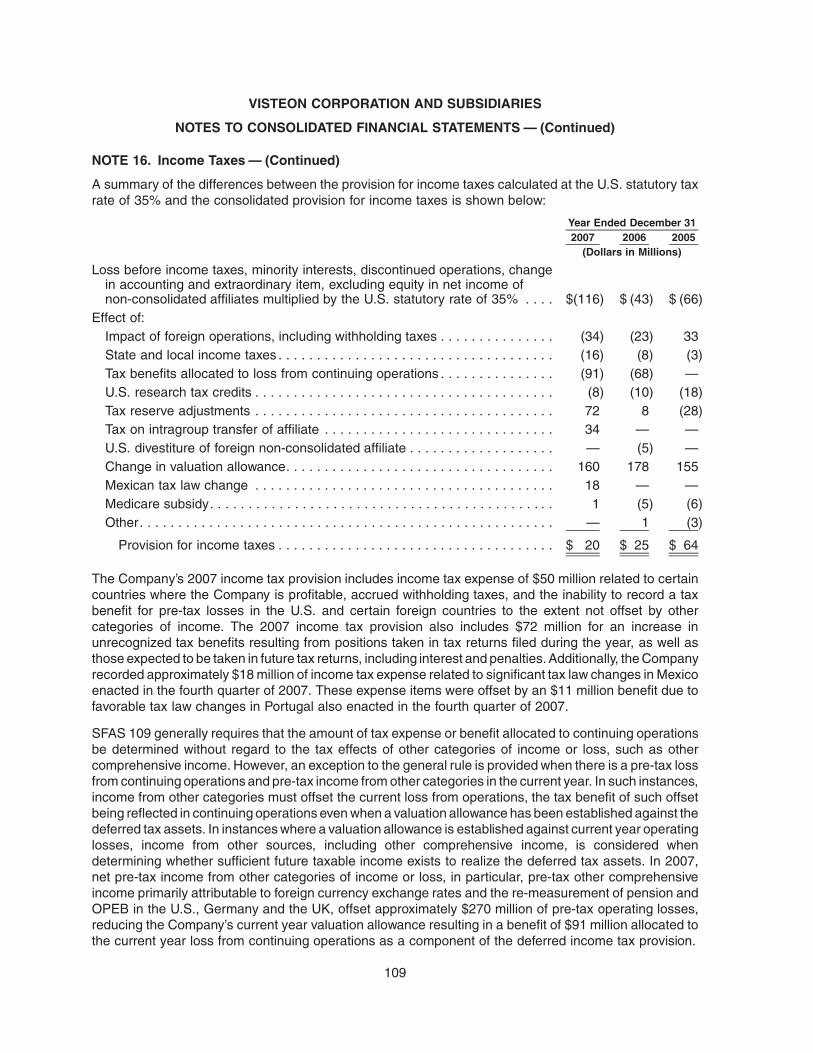
NOTE 16. Income Taxes — (Continued)
A summary of the differences between the provision for income taxes calculated at the U.S. statutory taxrate of 35% and the consolidated provision for income taxes is shown below:
2007 2006 2005Year Ended December 31
(Dollars in Millions)
Loss before income taxes, minority interests, discontinued operations, changein accounting and extraordinary item, excluding equity in net income ofnon-consolidated affiliates multiplied by the U.S. statutory rate of 35% . . . . $(116) $ (43) $ (66)
Effect of:Impact of foreign operations, including withholding taxes . . . . . . . . . . . . . . . (34) (23) 33State and local income taxes . . . . . . . . . . . . . . . . . . . . . . . . . . . . . . . . . . . . (16) (8) (3)Tax benefits allocated to loss from continuing operations . . . . . . . . . . . . . . . (91) (68) —U.S. research tax credits . . . . . . . . . . . . . . . . . . . . . . . . . . . . . . . . . . . . . . . (8) (10) (18)Tax reserve adjustments . . . . . . . . . . . . . . . . . . . . . . . . . . . . . . . . . . . . . . . 72 8 (28)Tax on intragroup transfer of affiliate . . . . . . . . . . . . . . . . . . . . . . . . . . . . . . 34 — —U.S. divestiture of foreign non-consolidated affiliate . . . . . . . . . . . . . . . . . . . — (5) —Change in valuation allowance. . . . . . . . . . . . . . . . . . . . . . . . . . . . . . . . . . . 160 178 155Mexican tax law change . . . . . . . . . . . . . . . . . . . . . . . . . . . . . . . . . . . . . . . 18 — —Medicare subsidy. . . . . . . . . . . . . . . . . . . . . . . . . . . . . . . . . . . . . . . . . . . . . 1 (5) (6)Other. . . . . . . . . . . . . . . . . . . . . . . . . . . . . . . . . . . . . . . . . . . . . . . . . . . . . . — 1 (3)
Provision for income taxes . . . . . . . . . . . . . . . . . . . . . . . . . . . . . . . . . . . . $ 20 $ 25 $ 64
The Company’s 2007 income tax provision includes income tax expense of $50 million related to certaincountries where the Company is profitable, accrued withholding taxes, and the inability to record a taxbenefit for pre-tax losses in the U.S. and certain foreign countries to the extent not offset by othercategories of income. The 2007 income tax provision also includes $72 million for an increase inunrecognized tax benefits resulting from positions taken in tax returns filed during the year, as well asthose expected to be taken in future tax returns, including interest and penalties. Additionally, the Companyrecorded approximately $18 million of income tax expense related to significant tax law changes in Mexicoenacted in the fourth quarter of 2007. These expense items were offset by an $11 million benefit due tofavorable tax law changes in Portugal also enacted in the fourth quarter of 2007.
SFAS 109 generally requires that the amount of tax expense or benefit allocated to continuing operationsbe determined without regard to the tax effects of other categories of income or loss, such as othercomprehensive income. However, an exception to the general rule is provided when there is a pre-tax lossfrom continuing operations and pre-tax income from other categories in the current year. In such instances,income from other categories must offset the current loss from operations, the tax benefit of such offsetbeing reflected in continuing operations even when a valuation allowance has been established against thedeferred tax assets. In instances where a valuation allowance is established against current year operatinglosses, income from other sources, including other comprehensive income, is considered whendetermining whether sufficient future taxable income exists to realize the deferred tax assets. In 2007,net pre-tax income from other categories of income or loss, in particular, pre-tax other comprehensiveincome primarily attributable to foreign currency exchange rates and the re-measurement of pension andOPEB in the U.S., Germany and the UK, offset approximately $270 million of pre-tax operating losses,reducing the Company’s current year valuation allowance resulting in a benefit of $91 million allocated tothe current year loss from continuing operations as a component of the deferred income tax provision.
109
VISTEON CORPORATION AND SUBSIDIARIES
NOTES TO CONSOLIDATED FINANCIAL STATEMENTS — (Continued)

NOTE 16. Income Taxes — (Continued)
In December 2007 Visteon redeemed its ownership interest in a newly formed Korean company inexchange for approximately $292 million as part of a legal restructuring of its climate control operations inAsia with Halla Climate Control Corporation (“HCCC”). As part of this restructuring, the Companyconcluded that a portion of HCCC’s earnings were permanently reinvested under AccountingPrinciples Board Opinion No. 23 “Accounting for Income Taxes-Special Areas” and recorded a$30 million income tax benefit related to the reduction of previously established withholding taxaccruals, partially offset by $12 million of income tax expense related to a taxable gain from therestructuring.
The Company’s 2006 provision of $25 million reflects a $68 million benefit related to offsetting U.S. pre-taxoperating losses against U.S. pre-tax other comprehensive income, as well as income tax expense relatedto those countries where the Company is profitable, accrued withholding taxes, certain non-recurring andother discrete tax items, and the inability to record a tax benefit for pre-tax losses in certain foreigncountries and pre-tax losses in the U.S. not offset by U.S. pre-tax other comprehensive income asdescribed above. Non-recurring and other discrete tax items recorded in 2006 resulted in a net benefit of$21 million. This includes a $14 million benefit recorded in the second quarter of 2006 related to therestoration of deferred tax assets associated with the Company’s operations in Brazil, a benefit of$15 million related to reducing the Company’s dividend withholding taxes accrued for the unremittedearnings of Spain and the Czech Republic as a result of a legal entity restructuring that was completed inthe fourth quarter of 2006, offset by a net $8 million in provisions recorded primarily to increase income taxreserves for prior year tax exposures in various foreign jurisdictions.
The Company’s 2005 provision of $64 million reflects income tax expense related to those countries wherethe Company is profitable, accrued withholding taxes, certain non-recurring and other discrete tax items,and the inability to record a tax benefit for pre-tax losses in the U.S. and certain foreign countries. Non-recurring and other discrete tax items recorded in 2005 resulted in a net benefit of $31 million. This includesa benefit of $28 million, primarily reflecting a reduction in income tax reserves corresponding with theconclusion of U.S. Federal income tax audits for 2002, 2003 and certain pre-spin periods, as well as a netbenefit of $3 million consisting primarily of benefits related to a change in the estimated benefit associatedwith tax losses in Canada and the favorable resolution of tax matters in Mexico, offset by net provisionsrecorded primarily to increase income tax reserves for prior year tax exposures.
Deferred income taxes and related valuation allowances
Deferred income taxes are provided for temporary differences between amounts of assets and liabilities forfinancial reporting purposes and the basis of such assets and liabilities as measured by tax laws andregulations, as well as net operating loss, tax credit and other carryforwards. Additionally, deferred taxeshave been provided for the net effect of repatriating earnings from certain consolidated foreignsubsidiaries. Statement of Financial Accounting Standards No. 109 (“SFAS 109”), “Accounting forIncome Taxes,” requires that deferred tax assets be reduced by a valuation allowance if, based on allavailable evidence, it is considered more likely than not that some portion or all of the recorded deferred taxassets will not be realized in future periods.
110
VISTEON CORPORATION AND SUBSIDIARIES
NOTES TO CONSOLIDATED FINANCIAL STATEMENTS — (Continued)

NOTE 16. Income Taxes — (Continued)
The components of deferred income tax assets and liabilities are as follows:
2007 2006December 31
(Dollars in Millions)
Deferred tax assetsEmployee benefit plans . . . . . . . . . . . . . . . . . . . . . . . . . . . . . . . . . . . . . . . . . . . $ 387 $ 423Capitalized expenditures for tax reporting . . . . . . . . . . . . . . . . . . . . . . . . . . . . . 165 202Net operating losses and carryforwards . . . . . . . . . . . . . . . . . . . . . . . . . . . . . . . 1,703 1,493All other . . . . . . . . . . . . . . . . . . . . . . . . . . . . . . . . . . . . . . . . . . . . . . . . . . . . . . 289 478
Subtotal . . . . . . . . . . . . . . . . . . . . . . . . . . . . . . . . . . . . . . . . . . . . . . . . . . . . . 2,544 2,596Valuation allowance. . . . . . . . . . . . . . . . . . . . . . . . . . . . . . . . . . . . . . . . . . . . . . (2,102) (2,103)
Total deferred tax assets. . . . . . . . . . . . . . . . . . . . . . . . . . . . . . . . . . . . . . . . . . . . 442 493
Deferred tax liabilitiesDepreciation and amortization . . . . . . . . . . . . . . . . . . . . . . . . . . . . . . . . . . . . . . 83 120All other . . . . . . . . . . . . . . . . . . . . . . . . . . . . . . . . . . . . . . . . . . . . . . . . . . . . . . 421 459
Total deferred tax liabilities . . . . . . . . . . . . . . . . . . . . . . . . . . . . . . . . . . . . . . . . . . 504 579
Net deferred tax liabilities . . . . . . . . . . . . . . . . . . . . . . . . . . . . . . . . . . . . . . . . . . . $ 62 $ 86
At December 31, 2007, the Company had available non-U.S. net operating loss and other carryforwards of$621 million, which have carryforward periods ranging from 5 years to indefinite. The Company hadavailable U.S. net operating loss and capital loss carryforwards of $489 million at December 31, 2007,which will expire at various dates between 2009 and 2027. U.S. foreign tax credit carryforwards are$471 million at December 31, 2007. These credits will begin to expire in 2011. U.S. research tax creditscarryforwards are $122 million at December 31, 2007. These credits will begin to expire in 2020. Theavailability of the Company’s federal net operating loss carryforward and other federal income taxattributes may be eliminated or significantly limited if a change of ownership of Visteon, within themeaning of Section 382 of the Internal Revenue Code, were to occur.
As of the end of 2007, valuation allowances totaling $2,102 million have been recorded against theCompany’s deferred tax assets. Of this amount, $1,518 million relates to the Company’s deferred taxassets in the U.S., including amounts related to foreign affiliates that are treated as pass-through entitiesfor U.S. tax purposes, and $584 million relates to net operating loss carryforwards and other deferred taxassets in certain foreign jurisdictions, where recovery of the carryforwards or assets is unlikely.
Going forward, the need to maintain valuation allowances against deferred tax assets in the U.S. and otheraffected countries will cause variability in the Company’s effective tax rate. The Company will maintain fullvaluation allowances against deferred tax assets in the U.S. and applicable foreign countries, whichinclude the UK and Germany, until sufficient positive evidence exists to reduce or eliminate them.
111
VISTEON CORPORATION AND SUBSIDIARIES
NOTES TO CONSOLIDATED FINANCIAL STATEMENTS — (Continued)

NOTE 16. Income Taxes — (Continued)
New accounting pronouncement
Effective January 1, 2007, the Company adopted FIN 48, which establishes a single model to addressaccounting for uncertain tax positions and clarifies the accounting for income taxes by prescribing aminimum recognition threshold a tax position is required to meet before being recognized in the financialstatements. FIN 48 also provides guidance on derecognition, measurement classification, interest andpenalties, accounting in interim periods, disclosure and transition. The adoption of FIN 48 did not have amaterial impact on the Company’s consolidated financial statements.
The Company’s gross unrecognized tax benefits at December 31, 2007 were $229 million and the amountof unrecognized tax benefits that, if recognized, would impact the effective tax rate were approximately$120 million. The gross unrecognized tax benefit differs from that which would impact the effective tax ratedue to uncertain tax positions embedded in other deferred tax attributes carrying a full valuation allowance.Since the uncertainty is expected to be resolved while a full valuation allowance is maintained, theseuncertain tax positions will not impact the effective tax rate in current or future periods. In connection withthe adoption of FIN 48 and beginning January 1, 2007, the Company classified all interest and penalties asincome tax expense. Prior to the adoption of FIN 48, the Company’s policy was to record interest andpenalties related to income tax contingencies as a component of income before taxes. Estimated interestand penalties related to the underpayment of income taxes totaled $14 million for the twelve-months endedDecember 31, 2007. Accrued interest and penalties were $20 million and $34 million as of January 1, 2007and December 31, 2007, respectively.
A reconciliation of the beginning and ending amount of unrecognized tax benefits is as follows:
(Dollars in Millions)
Beginning balance, January 1, 2007 . . . . . . . . . . . . . . . . . . . . . . . . . . . . . . . . . . . . $147Gross increases for tax positions of prior years . . . . . . . . . . . . . . . . . . . . . . . . . . . . 22Gross decreases for tax positions of prior years . . . . . . . . . . . . . . . . . . . . . . . . . . . (13)Gross increases for tax positions of current period . . . . . . . . . . . . . . . . . . . . . . . . . 77Decreases related to settlements. . . . . . . . . . . . . . . . . . . . . . . . . . . . . . . . . . . . . . . —Decreases resulting from the expiration of the statue of limitations . . . . . . . . . . . . . (4)
Ending balance, December 31, 2007 . . . . . . . . . . . . . . . . . . . . . . . . . . . . . . . . . . . . $229
The Company and its subsidiaries have operations in every major geographic region of the world and aresubject to income taxes in the U.S. and numerous foreign jurisdictions. Accordingly, the Company files taxreturns and is subject to examination by taxing authorities throughout the world, including such significantjurisdictions as Korea, India, Portugal, Spain, Czech Republic, Hungary, Mexico, Canada, Germany andthe United States. With few exceptions, the Company is no longer subject to U.S. federal tax examinationsfor years before 2004 or state and local, or non-U.S. income tax examinations for years before 2000.
It is reasonably possible that the amount of the Company’s unrecognized tax benefits may change withinthe next twelve months as a result of settlement of ongoing audits or for positions expected to be taken infuture tax returns, primarily related to transfer pricing-related initiatives. An estimate of the range ofreasonably possible outcomes, however, cannot be made at this time. Further, substantially all of theCompany’s unrecognized tax benefits relate to uncertain tax positions that are not currently under reviewby taxing authorities and therefore, the Company is unable to specify the future periods in which it may beobligated to settle such amounts.
112
VISTEON CORPORATION AND SUBSIDIARIES
NOTES TO CONSOLIDATED FINANCIAL STATEMENTS — (Continued)

NOTE 17. Shareholders’ Deficit
In conjunction with the October 1, 2005 ACH Transactions, the Company granted warrants to Ford for thepurchase of 25 million shares of the Company’s common stock at an exercise price of $6.90. The warrantsallow for either cash or share settlement at the sole discretion of the Company, were exercisable at anytime after October 1, 2006 and before the expiration date on October 1, 2013. The warrants were valued at$127 million using a Black-Scholes pricing model, adjusted for the estimated impact on fair value of therestrictions relating to the warrants, and are recorded as permanent equity in the Company’s consolidatedbalance sheets. On May 17, 2007, Visteon entered into a letter agreement (the “Letter Agreement”) withLB I Group, Inc., an affiliate of Lehman Brothers (“Lehman”), and Ford, pursuant to which, among otherthings, the Company consented to the transfer by Ford of the warrant to purchase 25 million shares ofVisteon common stock and waived a provision of the Stockholder Agreement, dated as of October 1, 2005,between Visteon and Ford, that would have prohibited such transfer. The Letter Agreement also restrictsLehman’s ability to enter into certain hedging transactions in respect of the shares underlying the Warrantfor the first two years following such transfer. In addition, the warrant was modified so that it will not beexercisable (except in the event of a change of control of Visteon) or transferable until May 17, 2009.
Accumulated other comprehensive income (loss) is comprised of the following:
2007 2006
December 31
(Dollars in Millions)
Foreign currency translation adjustments . . . . . . . . . . . . . . . . . . . . . . . . . . . . . . . . $297 $ 166Pension and other postretirement benefit adjustments, net of tax . . . . . . . . . . . . . . (10) (378)Unrealized losses on derivatives . . . . . . . . . . . . . . . . . . . . . . . . . . . . . . . . . . . . . . . (12) (4)
Total accumulated other comprehensive income (loss) . . . . . . . . . . . . . . . . . . . . $275 $(216)
Treasury stock is carried at an average cost basis, is purchased for employee benefit plans, and consists ofapproximately 1.3 million shares at December 31, 2007. During the fourth quarter of 2007, the Board ofDirectors authorized a treasury stock purchase program under which the Company was authorized topurchase up to 2 million shares of the Company’s common stock for re-issuance upon the exercise ofemployee stock options and for other compensation programs utilizing the Company’s stock. InDecember 2007, the Company purchased 150,000 shares under the program.
113
VISTEON CORPORATION AND SUBSIDIARIES
NOTES TO CONSOLIDATED FINANCIAL STATEMENTS — (Continued)

NOTE 18. Loss Per Share
Basic net loss per share of common stock is calculated by dividing reported net loss by the averagenumber of shares of common stock outstanding during the applicable period, adjusted for restricted stock.The calculation of diluted net loss per share takes into account the effect of dilutive potential commonstock, such as stock options and stock warrants, and contingently returnable shares, such as restrictedstock.
2007 2006 2005
December 31
(Dollars in Millions,Except Per Share Amounts)
Numerator:Net loss from continuing operations before change in accounting and
extraordinary item . . . . . . . . . . . . . . . . . . . . . . . . . . . . . . . . . . . . . . . . $ (348) $ (145) $ (262)Loss from discontinued operations, net of tax . . . . . . . . . . . . . . . . . . . . . 24 22 8
Net loss before change in accounting and extraordinary item. . . . . . . . . . (372) (167) (270)Cumulative effect of change in accounting, net of tax . . . . . . . . . . . . . . . — (4) —
Net loss before extraordinary item . . . . . . . . . . . . . . . . . . . . . . . . . . . . . . (372) (171) (270)Extraordinary item, net of tax. . . . . . . . . . . . . . . . . . . . . . . . . . . . . . . . . . — 8 —
Net loss. . . . . . . . . . . . . . . . . . . . . . . . . . . . . . . . . . . . . . . . . . . . . . . . . . $ (372) $ (163) $ (270)
Denominator:Average common stock outstanding . . . . . . . . . . . . . . . . . . . . . . . . . . . . 129.5 128.4 128.6
Less: Average restricted stock outstanding. . . . . . . . . . . . . . . . . . . . . . (0.1) (0.5) (2.6)
Basic shares . . . . . . . . . . . . . . . . . . . . . . . . . . . . . . . . . . . . . . . . . . . . . . 129.4 127.9 126.0Net dilutive effect of restricted stock and stock options . . . . . . . . . . . . . — — —
Diluted shares . . . . . . . . . . . . . . . . . . . . . . . . . . . . . . . . . . . . . . . . . . . . . 129.4 127.9 126.0
Basic and Diluted per Share Data:Basic and diluted loss per share from continuing operations before
change in accounting and extraordinary item . . . . . . . . . . . . . . . . . . . . $ (2.69) $ (1.13) $ (2.08)Loss from discontinued operations, net of tax . . . . . . . . . . . . . . . . . . . . . 0.18 0.17 0.06
Basic and diluted loss per share before change in accounting andextraordinary item . . . . . . . . . . . . . . . . . . . . . . . . . . . . . . . . . . . . . . . . (2.87) (1.30) (2.14)
Cumulative effect of change in accounting, net of tax . . . . . . . . . . . . . . . — (0.03) —
Basic and diluted loss per share before extraordinary item . . . . . . . . . . . (2.87) (1.33) (2.14)Extraordinary item, net of tax. . . . . . . . . . . . . . . . . . . . . . . . . . . . . . . . . . — 0.06 —
Basic and diluted loss per share . . . . . . . . . . . . . . . . . . . . . . . . . . . . . . . $ (2.87) $ (1.27) $ (2.14)
For 2007, 2006 and 2005, potential common stock of approximately 2.9 million shares, 2.4 million sharesand 2.8 million shares, respectively, are excluded from the calculation of diluted loss per share because theeffect of including them would have been anti-dilutive. In addition, options to purchase 13 million shares ofcommon stock at exercise prices ranging from $17.46 per share to $6.22 per share were outstanding for2007 but were not included in the computation of diluted loss per share because the options’ exercise pricewas greater than the average market price of the common shares. The options expire at various datesbetween 2009 and 2014.
114
VISTEON CORPORATION AND SUBSIDIARIES
NOTES TO CONSOLIDATED FINANCIAL STATEMENTS — (Continued)

NOTE 19. Financial Instruments
Derivative Financial Instruments
The Company follows Statement of Financial Accounting Standards No. 133 (“SFAS 133”), “Accounting forDerivative Instruments and Hedging Activities,” in accounting for financial instruments. Under SFAS 133,the criteria used to determine whether hedge accounting treatment is appropriate are the designation ofthe hedge to an underlying exposure, reduction of overall risk, and a highly effective relationship betweenthe hedging instrument and the hedged item or transaction.
The Company uses derivative financial instruments to reduce exposure to adverse fluctuations in interestrates and foreign currency exchange rates in connection with its risk management policies. The Companymonitors its exposure to interest rate risk principally in relation to fixed-rate and variable-rate debt.Accordingly, the Company has entered into certain fixed-for-variable and variable-for-fixed interest rateswap agreements to manage such interest rate exposures. Additionally, the Company monitors itsexposure to the risk that net cash inflows resulting from sales outside the country of manufacturingorigin will be adversely affected by changes in foreign currency exchange rates. Accordingly, the Companyenters into forward exchange contracts and purchase foreign currency options to hedge certain portions offorecasted cash flows denominated in foreign currencies.
At inception, the Company formally designates and documents the financial instrument as a hedge of aspecific underlying exposure, as well as the risk management objectives and strategies for undertaking thehedge transactions. The Company formally assesses, both at the inception and at least quarterlythereafter, whether the financial instruments that are used in hedging transactions are effective atoffsetting changes in either the fair value or cash flows of the related underlying exposure. Because ofthe high degree of effectiveness between the hedging instrument and the underlying exposure beinghedged, fluctuations in the value of the derivative instruments are generally offset by changes in the fairvalues or cash flows of the underlying exposures being hedged. Any ineffective portion of a financialinstrument’s change in fair value is immediately recognized in earnings. Derivatives not designated as ahedge are adjusted to fair value through operating results. The Company’s policy specifically prohibits theuse of derivatives for speculative purposes.
The Company recognizes all derivative instruments as either assets or liabilities in the consolidatedbalance sheets at fair value. The fair values of derivatives used to hedge the Company’s risks fluctuateover time, generally in relation to the fair values or cash flows of the underlying hedged transactions orexposures. The accounting for changes in fair value of a derivative instrument depends on whether it hasbeen designated and qualifies as part of a hedging relationship and, further, on the type of hedgingrelationship. At the inception of the hedging relationship, the Company must designate the instrument as afair value hedge, a cash flow hedge, or a hedge of a net investment in a foreign operation. This designationis based upon the exposure being hedged.
Fair Value Hedges
As of December 31, 2007 and 2006, respectively, the Company had interest rate swaps designated ashedges of the fair value of a portion of the 8.25% notes due August 1, 2010 ($125 million) and a portion ofthe 7.00% notes due March 10, 2014 ($225 million). These interest rate swaps effectively convert thedesignated portions of these notes from fixed interest rate to variable interest rate instruments inconnection with the Company’s risk management policies. The Company estimates the fair value ofthese interest rate swaps based on quoted market prices.
115
VISTEON CORPORATION AND SUBSIDIARIES
NOTES TO CONSOLIDATED FINANCIAL STATEMENTS — (Continued)

NOTE 19. Financial Instruments — (Continued)
The notional amount of these interest rate swaps was $350 million at December 31, 2007 and 2006. Thefair market value of the interest rate swaps was a liability of $2 million and $17 million at December 31, 2007and 2006, respectively. The effect of marking these contracts to market has been recorded in theCompany’s consolidated balance sheets as a direct adjustment to the underlying debt. Theadjustment does not affect the results of operations unless the contract is terminated, in which casethe resulting cash flow is offset by a valuation adjustment of the underlying debt and is amortized to interestexpense over the remaining life of the debt. During 2007, 2006 and 2005, there was no ineffectivenessrelated to these interest rate swaps.
Cash Flow Hedges
Derivative instruments that are designated and qualify as cash flow hedges of forecasted transactions arereflected as other assets or liabilities in the Company’s consolidated balance sheets. Changes in the fairvalue of cash flow hedges are initially recorded as a component of “Other comprehensive income (loss)”and reclassified to the consolidated statement of operations when the hedged transactions affect results ofoperations. At this time, a gain or loss on the cash flow hedge is recognized representing the excess of thecumulative change in the present value of future cash flows of the hedged item. Any ineffective portion of acash flow hedge is immediately recognized in earnings. The maximum length of time over which theCompany hedges the variability in future cash flows for forecasted transactions excluding those forecastedtransactions related to the payment of variable interest on existing debt is up to one year from the date ofthe forecasted transaction. The maximum length of time over which the Company hedges forecastedtransactions related to the payment of variable interest on existing debt is the term of the underlying debt.
As of December 31, 2007, the Company had interest rate swaps designated as hedges of forecasted cashflows related to future interest payments for a portion of the $1 billion seven-year term loan dueJune 13, 2013 ($200 million). These interest rate swaps effectively convert the designated portion ofthe seven-year term loan from a variable rate instrument to a fixed rate instrument in connection with theCompany’s risk management policies. The Company recorded $1 million and less than $1 million ofineffectiveness related to these interest rate swaps for the years ended December 31, 2007 and 2006,respectively. The notional amount of these interest rate swaps was $200 million at December 31, 2007 and2006. The fair market value of the interest rate swaps was a liability of $7 million and $1 million atDecember 31, 2007 and 2006, respectively.
As of December 31, 2007 and 2006, the net fair value of foreign currency instruments which are designatedas hedges of forecasted cash flows related to the sale of products in countries other than themanufacturing source, foreign currency denominated supplier payments, debt and other payables orsubsidiary dividends were a liability of $1 million and an asset of $8 million, respectively. The notionalamounts of foreign currency instruments in equivalent U.S. dollars were $515 million and $884 million atDecember 31, 2007 and 2006, respectively. The fair value of foreign currency instruments was estimatedusing current market rates provided by outside quotation services.
The net gain recognized in earnings related to cash flow hedges during the year ended December 31, 2007was less than $1 million; the net gain realized in December 31, 2006 and 2005 was $4 million and$21 million, respectively. Such amounts are recorded in the Company’s consolidated statements ofoperations under the classification “Cost of sales.” Within the next 12 months, the Company expects toreclassify approximately $1 million on a pre-tax basis from other comprehensive income (loss) to resultsfrom operations as the anticipated underlying transactions occur.
116
VISTEON CORPORATION AND SUBSIDIARIES
NOTES TO CONSOLIDATED FINANCIAL STATEMENTS — (Continued)

NOTE 19. Financial Instruments — (Continued)
Other
Subsequent to the ACH Transactions, the Company’s exposure to market risks from changes in the priceof natural gas and copper were substantially reduced. In the second quarter of 2005, the Companydiscontinued hedge accounting treatment for natural gas and copper forward contracts. Discontinuance ofhedge accounting for hedges on transactions that were not expected to occur resulted in a gain ofapproximately $8 million. These forward contracts were terminated during the third quarter of 2005.
The notional amounts of derivative financial instruments do not necessarily represent amounts exchangedby the parties and, therefore, are not a direct measure of the Company’s exposure to the financial risksdescribed above. The amounts exchanged are calculated by reference to the notional amounts and byother terms of the derivatives, such as interest rates, foreign currency exchange rates or other financialindices.
Fair Value of Financial Instruments
Disclosures related to estimated fair value amounts have been determined using available marketinformation and various valuation methods depending on the type of financial instrument. In evaluatingthe fair value information, considerable judgment is required to interpret the market data used to developthe estimates. The use of different market assumptions and/or different valuation techniques may have amaterial effect on the estimated fair value amounts. Further, it should be noted that fair value at a particularpoint in time gives no indication of future gain or loss, or what the dimensions of that gain or loss are likely tobe.
The fair value of debt excluding related interest rate swaps was approximately $2,655 million atDecember 31, 2007, based on quoted market prices or current rates for similar debt with the samecredit ratings and remaining maturities, compared with a carrying value of $2,838 million. The fair value ofdebt excluding related interest rate swaps was approximately $2,156 million at December 31, 2006,compared with a carrying value of $2,239 million.
The fair values of the Company’s derivative financial instruments are disclosed above. The carryingamounts of all other financial instruments approximate their fair values because of the relatively short-termmaturity of these instruments.
Concentrations of Credit Risk
Financial instruments, including cash equivalents, marketable securities, derivative contracts andaccounts receivable, expose the Company to counterparty credit risk for non-performance. TheCompany’s counterparties for cash equivalents, marketable securities and derivative contracts arebanks and financial institutions that meet the Company’s requirement of high credit standing. TheCompany’s counterparties for derivative contracts are substantial investment and commercial bankswith significant experience using such derivatives. The Company manages its credit risk through policiesrequiring minimum credit standing and limiting credit exposure to any one counterparty, and throughmonitoring counterparty credit risks. The Company’s concentration of credit risk related to derivativecontracts at December 31, 2007 was not significant.
117
VISTEON CORPORATION AND SUBSIDIARIES
NOTES TO CONSOLIDATED FINANCIAL STATEMENTS — (Continued)

NOTE 19. Financial Instruments — (Continued)
With the exception of the customers below, the Company’s credit risk with any individual customer doesnot exceed ten percent of total accounts receivable at December 31:
2007 2006
December 31
Ford and affiliates . . . . . . . . . . . . . . . . . . . . . . . . . . . . . . . . . . . . . . . . . . . . . . . . . . . . . . 18% 20%Hyundai Motor Company . . . . . . . . . . . . . . . . . . . . . . . . . . . . . . . . . . . . . . . . . . . . . . . . . 13% 11%PSA Peugeot Citroën. . . . . . . . . . . . . . . . . . . . . . . . . . . . . . . . . . . . . . . . . . . . . . . . . . . . 11% 12%
Management periodically performs credit evaluations of its customers and generally does not requirecollateral.
NOTE 20. Commitments and Contingencies
Commitments
Information Technology Agreement
Prior to January 2003 and since the Company’s separation from Ford, Ford had provided the Companywith and charged the Company for many of the Company’s information technology needs. In January 2003,the Company entered into a 10-year outsourcing agreement with International Business Machines (“IBM”)pursuant to which the Company outsources most of its information technology needs on a global basis,including mainframe support services, data centers, customer support centers, application developmentand maintenance, data network management, desktop support, disaster recovery and web hosting.During 2006, the Company and IBM modified this agreement, resulting in certain changes to the servicedelivery model and related service charges. The service charges under the outsourcing agreement areexpected to aggregate approximately $700 million during the remaining term of the agreement, subject tochanges based on the Company’s actual consumption of services to meet its then current business needs.The outsourcing agreement may also be terminated for the Company’s business convenience under theagreement for a scheduled termination fee. Associated expenses were approximately $200 million in both2007 and 2006.
Operating Leases
At December 31, 2007, the Company had the following minimum rental commitments under non-cancelable operating leases (in millions): 2008 — $48; 2009 — $42; 2010 — $31; 2011 — $16;2012 — $12; thereafter — $36. Rent expense was $80 million in 2007, $70 million in 2006 and$80 million in 2005.
Debt
Debt, including capital lease obligations, at December 31, 2007, included maturities as follows (in millions):2008 — $95 million; 2009 — $91 million; 2010 — $629 million; 2011 — $19 million; 2012 — $1 million;thereafter — $2,005 million.
Guarantees
The Company has guaranteed approximately $35 million of debt capacity held by subsidiaries, and$95 million for lifetime lease payments held by consolidated subsidiaries. In addition, atDecember 31, 2007, the Company has guaranteed certain Tier 2 suppliers’ debt and lease obligationsand other third-party service providers’ obligations of up to $2 million, to ensure the continued supply ofessential parts.
118
VISTEON CORPORATION AND SUBSIDIARIES
NOTES TO CONSOLIDATED FINANCIAL STATEMENTS — (Continued)

NOTE 20. Commitments and Contingencies — (Continued)
Contingencies
Litigation and Claims
In February 2005, a shareholder lawsuit was filed in the U.S. District Court for the Eastern District ofMichigan against the Company and certain current and former officers of the Company. In July 2005, thePublic Employees’ Retirement System of Mississippi was appointed as lead plaintiff in this matter. InSeptember 2005, the lead plaintiff filed an amended complaint, which alleges, among other things, that theCompany and its independent registered public accounting firm, PricewaterhouseCoopers LLP, mademisleading statements of material fact or omitted to state material facts necessary in order to make thestatements made, in light of the circumstances under which they were made, not misleading. The namedplaintiff seeks to represent a class consisting of purchasers of the Company’s securities during the periodbetween June 28, 2000 and January 31, 2005. Class action status has not yet been certified in thislitigation. On August 31, 2006, the defendants’ motion to dismiss the amended complaint for failure to statea claim was granted. The plaintiffs have appealed this decision.
In March 2005, a number of current and former directors and officers were named as defendants in twoshareholder derivative suits pending in the State of Michigan Circuit Court for the County of Wayne. As iscustomary in derivative suits, the Company has been named as a defendant in these actions. As a nominaldefendant, the Company is not liable for any damages in these suits nor is any specific relief sought againstthe Company. The complaints allege that, among other things, the individual defendants breached theirfiduciary duties of good faith and loyalty and aided and abetted such breaches during the period betweenJanuary 23, 2004 and January 31, 2005 in connection with the Company’s conduct concerning, amongother things, the matters alleged in the securities class action discussed immediately above. OnFebruary 15, 2008 the Court approved the settlement of the shareholder derivative suits and orderedtheir dismissal with prejudice. Pursuant to the settlement, the Company will, among other things, pay forthe defendants’ attorneys’ fees and expenses in the amount of $250,000.
The Company and its current and former directors and officers intend to contest the foregoing lawsuitvigorously. However, at this time the Company is not able to predict with certainty the final outcome of theforegoing lawsuit or its potential exposure with respect to such lawsuit. In the event of an unfavorableresolution of these matters, the Company’s earnings and cash flows in one or more periods could bematerially affected to the extent any such loss is not covered by insurance or applicable reserves.
119
VISTEON CORPORATION AND SUBSIDIARIES
NOTES TO CONSOLIDATED FINANCIAL STATEMENTS — (Continued)

NOTE 20. Commitments and Contingencies — (Continued)
Product Warranty and Recall
Amounts accrued for product warranty and recall claims are based on management’s best estimates of theamounts that will ultimately be required to settle such items. The Company’s estimates for productwarranty and recall obligations are developed with support from its sales, engineering, quality and legalfunctions and include due consideration of contractual arrangements, past experience, current claims andrelated information, production changes, industry and regulatory developments and various otherconsiderations. The Company can provide no assurances that it will not experience material claims inthe future or that it will not incur significant costs to defend or settle such claims beyond the amountsaccrued or beyond what the Company may recover from its suppliers. The following table provides areconciliation of changes in the product warranty claims liability for the selected periods:
2007 2006
December 31
(Dollars in Millions)Beginning balance . . . . . . . . . . . . . . . . . . . . . . . . . . . . . . . . . . . . . . . . . . . . . . . . . . $105 $148Accruals for products shipped . . . . . . . . . . . . . . . . . . . . . . . . . . . . . . . . . . . . . . . . . 48 41Changes in estimates . . . . . . . . . . . . . . . . . . . . . . . . . . . . . . . . . . . . . . . . . . . . . . . (16) 1Settlements . . . . . . . . . . . . . . . . . . . . . . . . . . . . . . . . . . . . . . . . . . . . . . . . . . . . . . . (29) (85)
Ending balance . . . . . . . . . . . . . . . . . . . . . . . . . . . . . . . . . . . . . . . . . . . . . . . . . . . . $108 $105
Environmental Matters
Costs related to environmental assessments and remediation efforts at operating facilities, previouslyowned or operated facilities, and Superfund or other waste site locations are accrued when it is probablethat a liability has been incurred and the amount of that liability can be reasonably estimated. Estimatedcosts are recorded at undiscounted amounts, based on experience and assessments, and are regularlyevaluated. The liabilities are recorded in “Other current liabilities” and “Other long-term liabilities” in theconsolidated balance sheets.
The Company is subject to the requirements of federal, state, local and foreign environmental andoccupational safety and health laws and regulations. These include laws regulating air emissions, waterdischarge and waste management. The Company is also subject to environmental laws requiring theinvestigation and cleanup of environmental contamination at properties it presently owns or operates andat third-party disposal or treatment facilities to which these sites send or arranged to send hazardouswaste.
At the time of spin-off, the Company and Ford agreed on a division of liability for, and responsibility formanagement and remediation of, environmental claims existing at that time, and, further, that theCompany would assume all liabilities for existing and future claims relating to sites that weretransferred to it and its operation of those sites, including off-site disposal, except as otherwisespecifically retained by Ford in the Master Transfer Agreement. In connection with the ACHTransactions, Ford agreed to re-assume these liabilities to the extent they arise from the ownership oroperation prior to the spin-off of the locations transferred to ACH (excluding any increase in costsattributable to the exacerbation of such liability by the Company or its affiliates).
120
VISTEON CORPORATION AND SUBSIDIARIES
NOTES TO CONSOLIDATED FINANCIAL STATEMENTS — (Continued)

NOTE 20. Commitments and Contingencies — (Continued)
The Company is aware of contamination at some of its properties and relating to various third-partySuperfund sites at which the Company or its predecessor has been named as a potentially responsibleparty. The Company is in various stages of investigation and cleanup at these sites. At December 31, 2007,the Company had recorded a reserve of approximately $9 million for this environmental investigation andcleanup. However, estimating liabilities for environmental investigation and cleanup is complex anddependent upon a number of factors beyond the Company’s control and which may changedramatically. Accordingly, although the Company believes its reserve is adequate based on currentinformation, the Company cannot provide any assurance that its ultimate environmental investigation andcleanup costs and liabilities will not exceed the amount of its current reserve.
Other Contingent Matters
Various other legal actions, governmental investigations and proceedings and claims are pending or maybe instituted or asserted in the future against the Company, including those arising out of alleged defects inthe Company’s products; governmental regulations relating to safety; employment-related matters;customer, supplier and other contractual relationships; intellectual property rights; product warranties;product recalls; and environmental matters. Some of the foregoing matters may involve compensatory,punitive or antitrust or other treble damage claims in very large amounts, or demands for recall campaigns,environmental remediation programs, sanctions, or other relief which, if granted, would require very largeexpenditures.
Contingencies are subject to many uncertainties, and the outcome of individual litigated matters is notpredictable with assurance. Reserves have been established by the Company for matters discussed in theimmediately foregoing paragraph where losses are deemed probable and reasonably estimable. It ispossible, however, that some of the matters discussed in the foregoing paragraph could be decidedunfavorably to the Company and could require the Company to pay damages or make other expendituresin amounts, or a range of amounts, that cannot be estimated at December 31, 2007 and that are in excessof established reserves. The Company does not reasonably expect, except as otherwise described herein,based on its analysis, that any adverse outcome from such matters would have a material effect on theCompany’s financial condition, results of operations or cash flows, although such an outcome is possible.
The Company enters into agreements that contain indemnification provisions in the normal course ofbusiness for which the risks are considered nominal and impracticable to estimate.
NOTE 21. Segment Information
Statement of Financial Accounting Standards No. 131 (“SFAS 131”), “Disclosures about Segments of anEnterprise and Related Information,” requires the Company to disclose certain financial and descriptiveinformation about its reportable segments. Reportable segments are defined as components of anenterprise for which discrete financial information is available that is evaluated regularly by the chiefoperating decision-maker, or a decision-making group, in deciding the allocation of resources and inassessing performance.
In late 2005, the Company announced a new operating structure to manage the business post the ACHTransactions. This operating structure is comprised of the following global product groups: Climate,Electronics, Interiors and Other. These global product groups have financial and operating responsibilityover the design, development and manufacture of the Company’s product portfolio. Regional customergroups are responsible for the marketing, sales and service of the Company’s product portfolio to itscustomer base. Certain functions such as procurement, information technology and other administrativeactivities are managed on a global basis with regional deployment.
121
VISTEON CORPORATION AND SUBSIDIARIES
NOTES TO CONSOLIDATED FINANCIAL STATEMENTS — (Continued)

NOTE 21. Segment Information — (Continued)
The Company revised its reportable segments in the first quarter of 2006. Additionally, pursuant to the ACHTransactions, the Company established and commenced operations of Visteon Services, a centralizedadministrative function to monitor and facilitate transactions with ACH for the costs of leased employeesand other services provided to ACH by the Company. As the activities of Visteon Services do not sharesimilar economic characteristics with the Company’s other business operations, the Company hasprovided separate disclosure of these operations as of December 31, 2007.
The Company’s reportable segments as of December 31, 2007 are as follows:
Climate — The Company’s Climate product group includes facilities that primarily manufacture climate airhandling modules, powertrain cooling modules, climate controls, heat exchangers, compressors, fluidtransport, and engine induction systems. Climate accounted for approximately 28%, 26%, and 25% of theCompany’s total net sales, excluding ACH and intra-product group eliminations, in 2007, 2006 and 2005,respectively.
Electronics — The Company’s Electronics product group includes facilities that primarily manufactureaudio systems, infotainment systems, driver information systems, powertrain and feature control modules,electronic control modules and lighting. Electronics accounted for approximately 30%, 29% and 31% of theCompany’s total net sales, excluding ACH and intra-product group eliminations, in 2007, 2006 and 2005,respectively.
Interiors — The Company’s Interiors product group includes facilities that primarily manufactureinstrument panels, cockpit modules, door trim and floor consoles. Interiors accounted forapproximately 26%, 25% and 27% of the Company’s total net sales, excluding ACH and intra-productgroup eliminations, in 2007, 2006 and 2005, respectively.
Other — The Company’s Other product group includes facilities that primarily manufacture fuel products,powertrain products, as well as parts sold and distributed to the automotive aftermarket. Other accountedfor approximately 11%, 15% and 16% of the Company’s total net sales, excluding ACH and intra-productgroup eliminations, in 2007, 2006 and 2005, respectively.
Services — The Company’s Services operations provide various transition services in support ofdivestiture transactions, principally related to the ACH Transactions and Chassis Divestiture. TheCompany supplies leased personnel and transition services as required by certain agreementsentered into by the Company with ACH as a part of the ACH Transactions. Pursuant to the MasterServices Agreement and the Salaried Employee Lease Agreement the Company, has agreed to provideACH with certain information technology, personnel and other services to enable ACH to conduct itsbusiness. Services to ACH are provided at a rate approximately equal to the Company’s cost until suchtime the services are no longer required by ACH or the expiration of the related agreement. In addition toservices provided to ACH, the Company has also agreed to provide certain transition services related tothe Chassis Divestiture for up to 18 months.
122
VISTEON CORPORATION AND SUBSIDIARIES
NOTES TO CONSOLIDATED FINANCIAL STATEMENTS — (Continued)

NOTE 21. Segment Information — (Continued)
The accounting policies for the reportable segments are the same as those described in the Note 2 to theCompany’s consolidated financial statements. Key financial measures of income (loss) before incometaxes and minority interests and fixed assets reviewed by the Company’s chief operating decision makersare as follows:
2007 2006 2005 2007 2006 2005
Net SalesYear Ended December 31
Gross MarginYear Ended December 31
(Dollars in Millions)
Climate . . . . . . . . . . . . . . . . . . . . . . . . . . . . $ 3,370 $ 3,123 $ 2,931 $233 $170 $175Electronics . . . . . . . . . . . . . . . . . . . . . . . . . 3,528 3,408 3,615 254 364 316Interiors. . . . . . . . . . . . . . . . . . . . . . . . . . . . 3,130 3,004 3,160 68 60 29Other. . . . . . . . . . . . . . . . . . . . . . . . . . . . . . 1,349 1,819 1,829 32 82 64Eliminations. . . . . . . . . . . . . . . . . . . . . . . . . (656) (648) (1,001) — — —
Total Products . . . . . . . . . . . . . . . . . . . . . 10,721 10,706 10,534 587 676 584Services . . . . . . . . . . . . . . . . . . . . . . . . . . . 545 547 164 6 5 1
Total Segments . . . . . . . . . . . . . . . . . . . . 11,266 11,253 10,698 593 681 585Reconciling ItemsACH . . . . . . . . . . . . . . . . . . . . . . . . . . . . . . — — 6,052 — — (41)Corporate . . . . . . . . . . . . . . . . . . . . . . . . . . — — — (20) 72 —
Total consolidated . . . . . . . . . . . . . . . . . . $11,266 $11,253 $16,750 $573 $753 $544
The above amounts include product sales of $4,131 million, $4,791 million and $10,252 million to FordMotor Company during the years ended December 31, 2007, 2006 and 2005, respectively. Additionally,during 2007 sales to Hyundai/Kia were approximately $1.7 billion, or 15% and sales to Nissan/Renaultwere approximately $1.2 billion or 11% of the Company’s total product sales.
Segment assets and related expenditures are included in the table below:
2007 2006 2005 2007 2006 2005
InventoriesYear Ended December 31
Property and Equipment, NetYear Ended December 31
Climate . . . . . . . . . . . . . . . . . . . . . . . . . . . . . . . $197 $161 $153 $ 947 $ 962 $ 882Electronics . . . . . . . . . . . . . . . . . . . . . . . . . . . . 142 135 146 758 796 797Interiors . . . . . . . . . . . . . . . . . . . . . . . . . . . . . . 56 62 65 528 478 430Other . . . . . . . . . . . . . . . . . . . . . . . . . . . . . . . . 100 162 173 62 259 260
Total Products . . . . . . . . . . . . . . . . . . . . . . . . 495 520 537 2,295 2,495 2,369Reconciling ItemsCorporate . . . . . . . . . . . . . . . . . . . . . . . . . . . . . — — — 498 539 604
Total consolidated . . . . . . . . . . . . . . . . . . . . . $495 $520 $537 $2,793 $3,034 $2,973
123
VISTEON CORPORATION AND SUBSIDIARIES
NOTES TO CONSOLIDATED FINANCIAL STATEMENTS — (Continued)
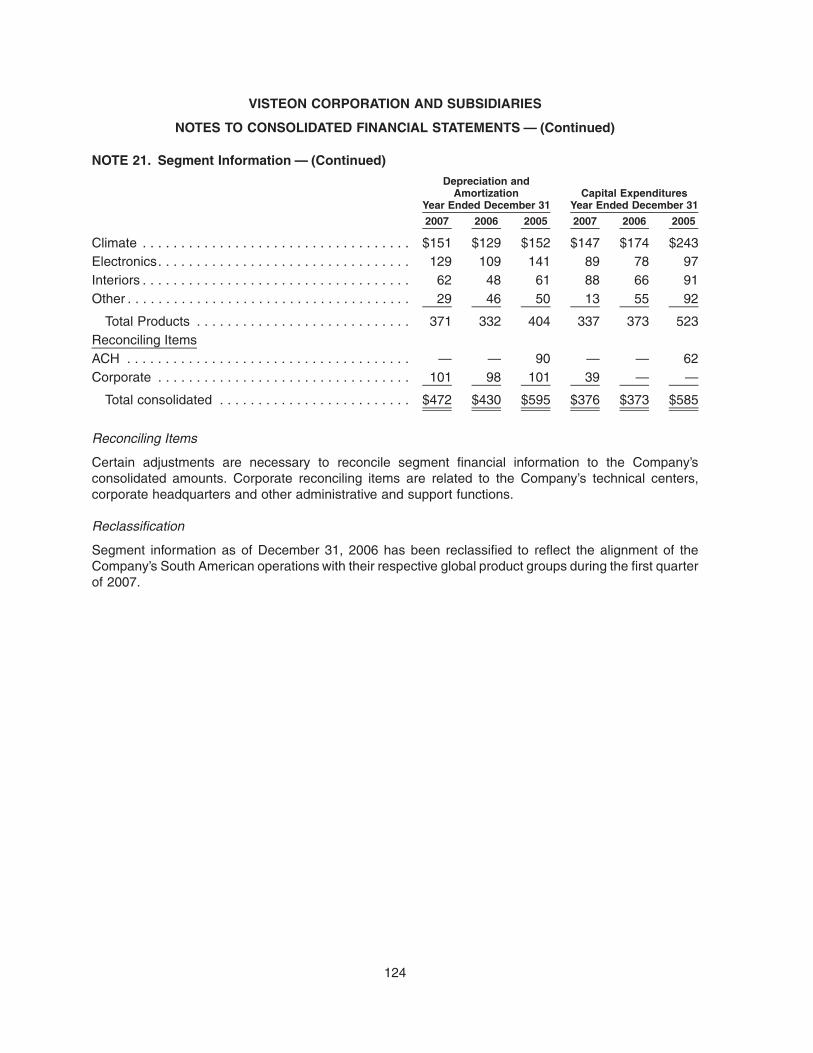
NOTE 21. Segment Information — (Continued)
2007 2006 2005 2007 2006 2005
Depreciation andAmortization
Year Ended December 31Capital Expenditures
Year Ended December 31
Climate . . . . . . . . . . . . . . . . . . . . . . . . . . . . . . . . . . . $151 $129 $152 $147 $174 $243Electronics. . . . . . . . . . . . . . . . . . . . . . . . . . . . . . . . . 129 109 141 89 78 97Interiors . . . . . . . . . . . . . . . . . . . . . . . . . . . . . . . . . . . 62 48 61 88 66 91Other . . . . . . . . . . . . . . . . . . . . . . . . . . . . . . . . . . . . . 29 46 50 13 55 92
Total Products . . . . . . . . . . . . . . . . . . . . . . . . . . . . 371 332 404 337 373 523Reconciling ItemsACH . . . . . . . . . . . . . . . . . . . . . . . . . . . . . . . . . . . . . — — 90 — — 62Corporate . . . . . . . . . . . . . . . . . . . . . . . . . . . . . . . . . 101 98 101 39 — —
Total consolidated . . . . . . . . . . . . . . . . . . . . . . . . . $472 $430 $595 $376 $373 $585
Reconciling Items
Certain adjustments are necessary to reconcile segment financial information to the Company’sconsolidated amounts. Corporate reconciling items are related to the Company’s technical centers,corporate headquarters and other administrative and support functions.
Reclassification
Segment information as of December 31, 2006 has been reclassified to reflect the alignment of theCompany’s South American operations with their respective global product groups during the first quarterof 2007.
124
VISTEON CORPORATION AND SUBSIDIARIES
NOTES TO CONSOLIDATED FINANCIAL STATEMENTS — (Continued)
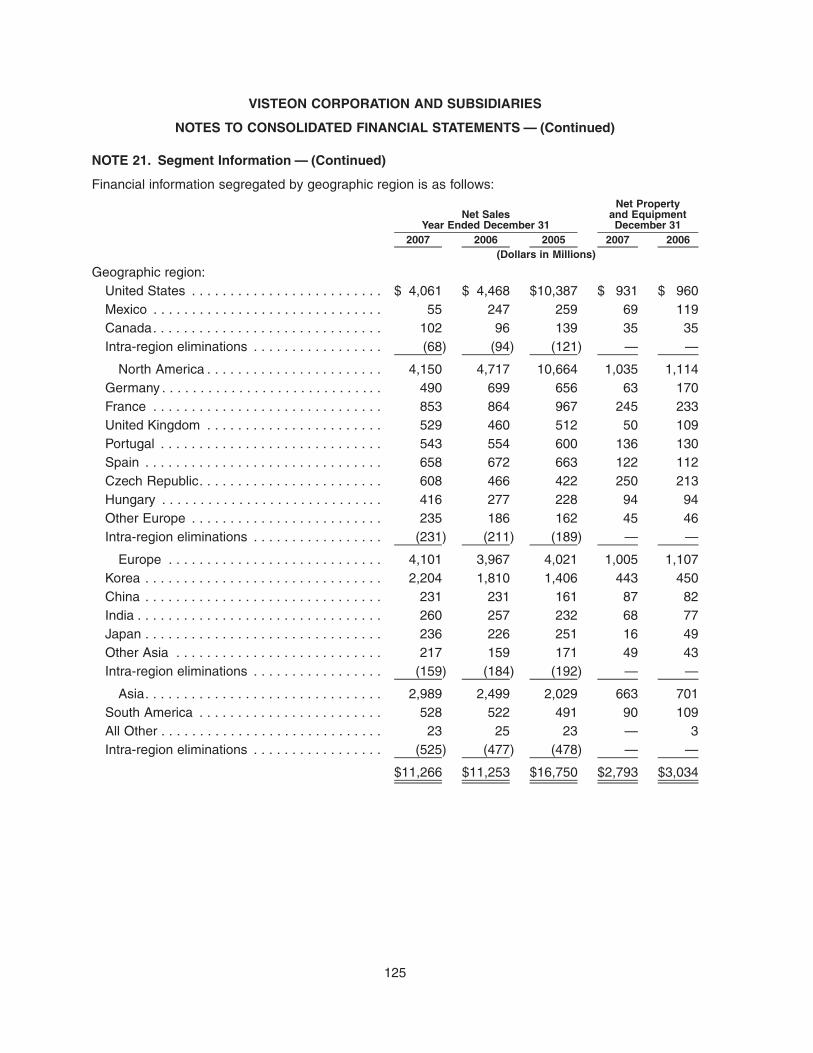
NOTE 21. Segment Information — (Continued)
Financial information segregated by geographic region is as follows:
2007 2006 2005 2007 2006
Net SalesYear Ended December 31
Net Propertyand EquipmentDecember 31
(Dollars in Millions)
Geographic region:United States . . . . . . . . . . . . . . . . . . . . . . . . . $ 4,061 $ 4,468 $10,387 $ 931 $ 960Mexico . . . . . . . . . . . . . . . . . . . . . . . . . . . . . . 55 247 259 69 119Canada. . . . . . . . . . . . . . . . . . . . . . . . . . . . . . 102 96 139 35 35Intra-region eliminations . . . . . . . . . . . . . . . . . (68) (94) (121) — —
North America . . . . . . . . . . . . . . . . . . . . . . . 4,150 4,717 10,664 1,035 1,114Germany . . . . . . . . . . . . . . . . . . . . . . . . . . . . . 490 699 656 63 170France . . . . . . . . . . . . . . . . . . . . . . . . . . . . . . 853 864 967 245 233United Kingdom . . . . . . . . . . . . . . . . . . . . . . . 529 460 512 50 109Portugal . . . . . . . . . . . . . . . . . . . . . . . . . . . . . 543 554 600 136 130Spain . . . . . . . . . . . . . . . . . . . . . . . . . . . . . . . 658 672 663 122 112Czech Republic. . . . . . . . . . . . . . . . . . . . . . . . 608 466 422 250 213Hungary . . . . . . . . . . . . . . . . . . . . . . . . . . . . . 416 277 228 94 94Other Europe . . . . . . . . . . . . . . . . . . . . . . . . . 235 186 162 45 46Intra-region eliminations . . . . . . . . . . . . . . . . . (231) (211) (189) — —
Europe . . . . . . . . . . . . . . . . . . . . . . . . . . . . 4,101 3,967 4,021 1,005 1,107Korea . . . . . . . . . . . . . . . . . . . . . . . . . . . . . . . 2,204 1,810 1,406 443 450China . . . . . . . . . . . . . . . . . . . . . . . . . . . . . . . 231 231 161 87 82India . . . . . . . . . . . . . . . . . . . . . . . . . . . . . . . . 260 257 232 68 77Japan . . . . . . . . . . . . . . . . . . . . . . . . . . . . . . . 236 226 251 16 49Other Asia . . . . . . . . . . . . . . . . . . . . . . . . . . . 217 159 171 49 43Intra-region eliminations . . . . . . . . . . . . . . . . . (159) (184) (192) — —
Asia. . . . . . . . . . . . . . . . . . . . . . . . . . . . . . . 2,989 2,499 2,029 663 701South America . . . . . . . . . . . . . . . . . . . . . . . . 528 522 491 90 109All Other . . . . . . . . . . . . . . . . . . . . . . . . . . . . . 23 25 23 — 3Intra-region eliminations . . . . . . . . . . . . . . . . . (525) (477) (478) — —
$11,266 $11,253 $16,750 $2,793 $3,034
125
VISTEON CORPORATION AND SUBSIDIARIES
NOTES TO CONSOLIDATED FINANCIAL STATEMENTS — (Continued)

NOTE 22. Summary Quarterly Financial Data (Unaudited)
The following tables present summary quarterly financial data.
FirstQuarter
SecondQuarter
ThirdQuarter
FourthQuarter
FirstQuarter
SecondQuarter
ThirdQuarter
FourthQuarter
2007 2006
(Dollars in Millions, Except Per Share Amounts)
Net sales . . . . . . . . . . . . . $2,888 $2,974 $2,546 $2,858 $2,911 $2,957 $2,580 $2,805Gross margin. . . . . . . . . . 117 155 99 202 248 313 52 140Income (loss) from
continuing operationsbefore change inaccounting andextraordinary item . . . . (136) (60) (109) (43) 12 44 (171) (30)
Loss from discountedoperations, net of tax . . 17 7 — — 5 2 6 9
Income (loss) beforechange in accountingand extraordinaryitem . . . . . . . . . . . . . . . (153) (67) (109) (43) 7 42 (177) (39)
Net income (loss). . . . . . . (153) (67) (109) (43) 3 50 (177) (39)Per Share DataIncome (loss) from
continuing operationsbefore change inaccounting andextraordinary itemBasic . . . . . . . . . . . . . . $ (1.06) $ (0.46) $ (0.84) $ (0.33) $ 0.09 $ 0.34 $ (1.33) $ (0.23)Diluted . . . . . . . . . . . . . $ (1.06) $ (0.46) $ (0.84) $ (0.33) $ 0.09 $ 0.34 $ (1.33) $ (0.23)
Loss from discontinuedoperations, net of taxBasic . . . . . . . . . . . . . . $ 0.13 $ 0.06 $ — $ — $ 0.04 $ 0.01 $ 0.05 $ 0.07Diluted . . . . . . . . . . . . . $ 0.13 $ 0.06 $ — $ — $ 0.04 $ 0.01 $ 0.05 $ 0.07
Income (loss) beforechange in accountingand extraordinary itemBasic . . . . . . . . . . . . . . $ (1.19) $ (0.52) $ (0.84) $ (0.33) $ 0.05 $ 0.33 $ (1.38) $ (0.30)Diluted . . . . . . . . . . . . . $ (1.19) $ (0.52) $ (0.84) $ (0.33) $ 0.05 $ 0.33 $ (1.38) $ (0.30)
Net income (loss) pershareBasic . . . . . . . . . . . . . . $ (1.19) $ (0.52) $ (0.84) $ (0.33) $ 0.02 $ 0.39 $ (1.38) $ (0.30)Diluted . . . . . . . . . . . . . $ (1.19) $ (0.52) $ (0.84) $ (0.33) $ 0.02 $ 0.39 $ (1.38) $ (0.30)
2007 Quarterly Financial Data
During 2007, the Company recorded income tax benefits of $91 million related to offsetting pre-taxoperating losses against current year pre-tax income from other categories of income or loss, in particular,pre-tax other comprehensive income primarily attributable to foreign currency exchange rates and the re-measurement of pension and OPEB in the U.S., Germany and the UK Of this amount, $37 million wasrecorded during the fourth quarter of 2007.
126
VISTEON CORPORATION AND SUBSIDIARIES
NOTES TO CONSOLIDATED FINANCIAL STATEMENTS — (Continued)
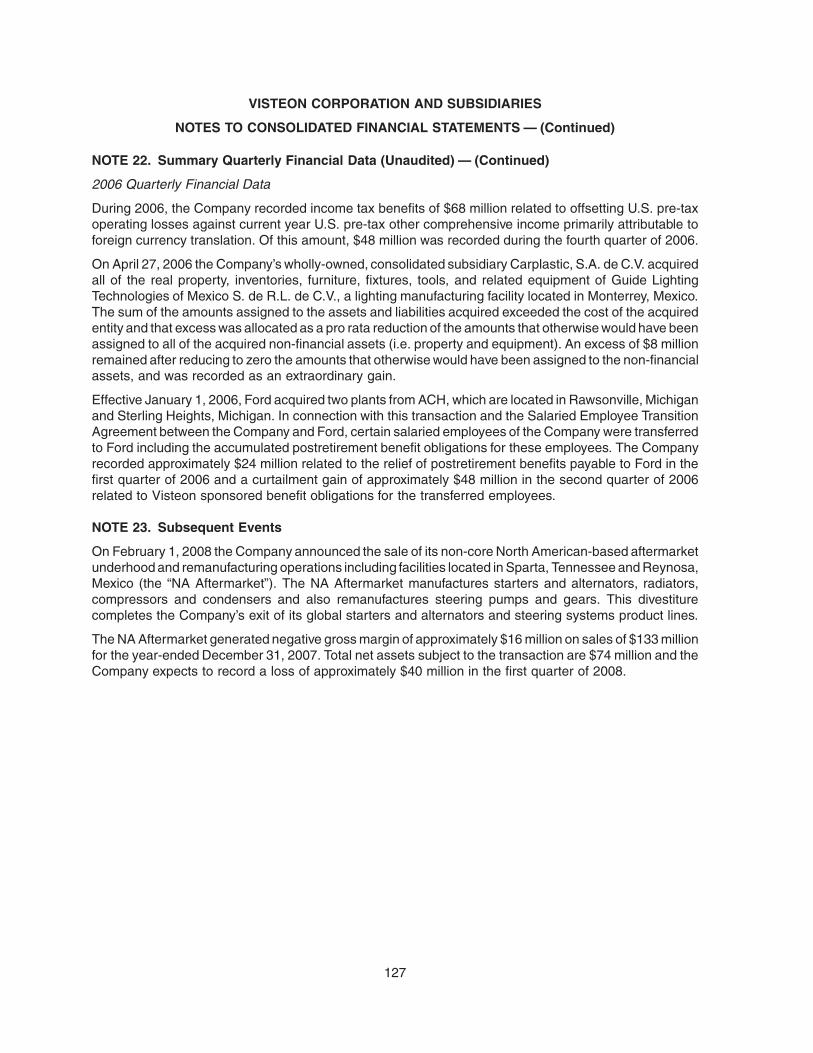
NOTE 22. Summary Quarterly Financial Data (Unaudited) — (Continued)
2006 Quarterly Financial Data
During 2006, the Company recorded income tax benefits of $68 million related to offsetting U.S. pre-taxoperating losses against current year U.S. pre-tax other comprehensive income primarily attributable toforeign currency translation. Of this amount, $48 million was recorded during the fourth quarter of 2006.
On April 27, 2006 the Company’s wholly-owned, consolidated subsidiary Carplastic, S.A. de C.V. acquiredall of the real property, inventories, furniture, fixtures, tools, and related equipment of Guide LightingTechnologies of Mexico S. de R.L. de C.V., a lighting manufacturing facility located in Monterrey, Mexico.The sum of the amounts assigned to the assets and liabilities acquired exceeded the cost of the acquiredentity and that excess was allocated as a pro rata reduction of the amounts that otherwise would have beenassigned to all of the acquired non-financial assets (i.e. property and equipment). An excess of $8 millionremained after reducing to zero the amounts that otherwise would have been assigned to the non-financialassets, and was recorded as an extraordinary gain.
Effective January 1, 2006, Ford acquired two plants from ACH, which are located in Rawsonville, Michiganand Sterling Heights, Michigan. In connection with this transaction and the Salaried Employee TransitionAgreement between the Company and Ford, certain salaried employees of the Company were transferredto Ford including the accumulated postretirement benefit obligations for these employees. The Companyrecorded approximately $24 million related to the relief of postretirement benefits payable to Ford in thefirst quarter of 2006 and a curtailment gain of approximately $48 million in the second quarter of 2006related to Visteon sponsored benefit obligations for the transferred employees.
NOTE 23. Subsequent Events
On February 1, 2008 the Company announced the sale of its non-core North American-based aftermarketunderhood and remanufacturing operations including facilities located in Sparta, Tennessee and Reynosa,Mexico (the “NA Aftermarket”). The NA Aftermarket manufactures starters and alternators, radiators,compressors and condensers and also remanufactures steering pumps and gears. This divestiturecompletes the Company’s exit of its global starters and alternators and steering systems product lines.
The NA Aftermarket generated negative gross margin of approximately $16 million on sales of $133 millionfor the year-ended December 31, 2007. Total net assets subject to the transaction are $74 million and theCompany expects to record a loss of approximately $40 million in the first quarter of 2008.
127
VISTEON CORPORATION AND SUBSIDIARIES
NOTES TO CONSOLIDATED FINANCIAL STATEMENTS — (Continued)

ITEM 9. CHANGES IN AND DISAGREEMENTS WITH ACCOUNTANTS ON ACCOUNTING ANDFINANCIAL DISCLOSURE
None.
ITEM 9A. CONTROLS AND PROCEDURES
Disclosure Controls and Procedures
The Company maintains disclosure controls and procedures that are designed to ensure that informationrequired to be disclosed in periodic reports filed with the SEC under the Securities Exchange Act of 1934 isrecorded, processed, summarized, and reported within the time periods specified in the SEC’s rules andforms, and that such information is accumulated and communicated to the Company’s management,including its Chief Executive Officer and Chief Financial Officer, as appropriate, to allow timely decisionsregarding required disclosure.
As of December 31, 2007, an evaluation was performed under the supervision and with the participation ofthe Company’s management, including its Chief Executive and Financial Officers, of the effectiveness ofthe design and operation of disclosure controls and procedures. Based on that evaluation, the ChiefExecutive Officer and the Chief Financial Officer concluded that the Company’s disclosure controls andprocedures were effective as of December 31, 2007.
Internal Control over Financial Reporting
Management’s report on internal control over financial reporting is presented in Item 8 of this AnnualReport on Form 10-K along with the report of PricewaterhouseCoopers LLP, the Company’s independentregistered public accounting firm, attestation regarding effectiveness of internal control over financialreporting, which are incorporated herein by reference.
There were no changes in the Company’s internal control over financial reporting during the quarter endedDecember 31, 2007 that have materially effected, or are reasonably likely to materially effect, theCompany’s internal control over financial reporting.
ITEM 9B. OTHER INFORMATION
2008 Incentive Plan Awards
On February 22, 2008, the Organization and Compensation Committee (the “Compensation Committee”)of the Board of Directors of the Company approved the performance criteria and relative weighting of eachcriterion that will be used to determine awards to eligible employees pursuant to the annual incentiveprogram for the 2008 fiscal year (the “2008 Annual Incentive”) and the long-term incentive program for the2008-2010 performance period (the “2008-2010 Long-Term Incentive”), each in accordance with the termsof the 2004 Incentive Plan.
128

Pursuant to the 2008 Annual Incentive, certain executives are eligible to receive a cash bonus based on theCompany’s financial performance relative to a target free cash flow metric (cash from operations minuscapital expenditures, subject to certain adjustments) and a target product quality metric (defects per millionas measured by the Company’s OEM customers). 75% of each eligible employee’s award will be based onthe free cash flow metric and 25% will be based on the product quality metric. The following table sets forththe 2008 Annual Incentive opportunity for the principal executive and financial officers as well as thosecurrent executive officers of the Company that were the “named executive officers” in the Company’s 2007proxy statement (the “Named Executives”):
Name and Position
Target2008 Annual Incentive Award asa Percentage of Base Salary(1)
Michael F. JohnstonChairman and Chief Executive Officer . . . . . . . . . . . . . . . . . . . . . . . . . 130%
Donald J. StebbinsPresident and Chief Operating Officer . . . . . . . . . . . . . . . . . . . . . . . . . 90%
William G. Quigley IIIExecutive Vice President and Chief Financial Officer . . . . . . . . . . . . . . 65%
John DonofrioSenior Vice President and General Counsel . . . . . . . . . . . . . . . . . . . . 60%
(1) Payments will be based on the base salary of the recipient as of December 31, 2008. Final paymentsmay be adjusted up to 200% based on the recipient’s individual performance with respect to individualobjectives. There is no maximum limit on the amount that may be paid in respect of a 2008 AnnualIncentive award, except that the 2004 Incentive Plan limits the amount payable in respect of allperformance cash awards to any Named Executive during a calendar year to $10 million.
The 2008-2010 Long-Term Incentive is comprised of several components designed to reward, motivateand retain key employees and to further align the interests of employees with the Company’s long-termbusiness objectives and the interests of stockholders. For the Named Executives, 25% of their total2008-2010 Long-Term Incentive opportunity is awarded in the form of stock appreciation rights and 50% isawarded in the form of restricted stock units. As a result, on February 22, 2008, the Company granted stockappreciation rights, which may be settled in cash or common stock of the Company at the election of theCompany, with an exercise price equal to the average of the high and low trading prices of Company’scommon stock on the New York Stock Exchange on such date and vesting in one-third increments on eachof January 1, 2009, January 1, 2010 and January 1, 2011, and restricted stock units, which will vest onDecember 31, 2010 and be paid in cash (or in common stock of the Company under certain circumstances,at the election of the Company) based on the average of the high and low trading prices of Company’scommon stock on the New York Stock Exchange on the vesting date.
In addition, 25% of the total 2008-2010 Long-Term Incentive opportunity is awarded in the form of a cashbonus based on the achievement of three successive annual performance metrics. The final bonusamount payable following the conclusion of the three-year performance period is based upon the numberof annual metrics achieved, with the achievement of each annual metric representing one-third of the totaltarget award. For the first year of the 2008-2010 Long-Term Incentive, the metric is based on a targetedimprovement in administrative and engineering expense. The Compensation Committee has thediscretion to modify or adjust the metrics to take into account currency fluctuations and other factors.Except under certain circumstances such as retirement or involuntary termination, an executive must beemployed in good standing with the Company at the conclusion of the three-year performance period to beentitled to a bonus payment.
129

The following table sets forth the total 2008-2010 Long-Term Incentive opportunity for the NamedExecutives:
Name and Position
Target 2008-2010Long-Term Incentive Award
as a Percentage of Base Salary(1)
Michael F. JohnstonChairman and Chief Executive Officer . . . . . . . . . . . . . . . . . . . . . . . . 475%
Donald J. StebbinsPresident and Chief Operating Officer . . . . . . . . . . . . . . . . . . . . . . . . 350%
William G. Quigley IIIExecutive Vice President and Chief Financial Officer . . . . . . . . . . . . . 250%
John DonofrioSenior Vice President and General Counsel . . . . . . . . . . . . . . . . . . . 175%
(1) Cash payments will be based on the base salary of the recipient as of December 31 of the fiscal yearpreceding payment.
2007-2009 Long-Term Incentive Performance Cash Metrics for 2008
In early 2007, the Compensation Committee awarded performance cash opportunities under the2007-2009 Long-Term Incentive program. Half of this bonus opportunity is based on the achievementof three successive annual “Restructuring” metrics, with the other half based on the achievement of threesuccessive annual “Grow the Business” metrics. The final bonus amount payable following the conclusionof the three-year performance period is based upon the number of annual metrics achieved, with theachievement of each annual metric representing one-third of the total target award. On February 22, 2008,the Compensation Committee approved metrics for the second year of this program. Namely, theRestructuring metric will be based on the accomplishment of restructuring actions at a minimumnumber of underperforming and non-strategic plants and/or businesses, and the Grow the Businessmetric will be based on a minimum level of incremental new business wins. The Compensation Committeehas the discretion to modify or adjust the metrics to take into account the disposition of businesses and/orfacilities and other factors. Except under certain circumstances such as retirement or involuntarytermination, an executive must be employed in good standing with the Company at the conclusion ofthe three-year performance period to be entitled to a bonus payment.
Other Awards
On February 22, 2008, the Compensation Committee also approved the payment of awards to eligibleemployees under the 2007 annual incentive bonus program based on the achievement of targetedoperational and financial metrics. In order to reward certain executives for their individual performance andcontributions during 2007, on February 22, 2008, the Compensation Committee made the followingadditional discretionary bonus awards:
Name and PositionIndividual Performance
Enhancement Award
Donald J. StebbinsPresident and Chief Operating Officer . . . . . . . . . . . . . . . . . . . . . . . . . . . . . . . $85,000
William G. Quigley IIIExecutive Vice President and Chief Financial Officer . . . . . . . . . . . . . . . . . . . . $45,000
John DonofrioSenior Vice President and General Counsel . . . . . . . . . . . . . . . . . . . . . . . . . . $90,000
On February 22, 2008, the Compensation Committee also approved an award of 100,000 stock options toMr. Johnston, with an exercise price equal to the average of the high and low trading prices of Company’scommon stock on the New York Stock Exchange on such date and vesting on the second anniversary ofthe grant date.
130

On February 22, 2008, the Compensation Committee also approved a special incentive program for alimited number of employee participants, including Mr. Johnston, Mr.Stebbins, Mr. Quigley andMr. Donofrio. Under such program, each of these executives is eligible to receive a bonus equal to hisbase salary in effect as of December 31, 2009 if the Company achieves a targeted free cash flow metric for2009.
Amendment to Non-Qualified Benefit Plan
On February 22, 2008, the Compensation Committee approved an amendment to the Company’sExecutive Separation Allowance Plan, which provides supplementary early retirement benefits toparticipants. The amendment modifies the eligibility requirements under the plan to align them withthe Company’s other qualified and non-qualified benefit plans. Following the amendment, to be eligible forbenefits a participant must, among other requirements, reach the age of 55 and have at least five years ofcontributory service under the traditional component of the Company’s qualified pension plan; previously,10 years of service was required.
Director Election
On February 22, 2008, Steven K. Hamp was elected to the Company’s Board of Directors effective as ofMarch 1, 2008. The Company’s press release relating to the foregoing is attached hereto as Exhibit 99.1and is incorporated herein by reference. Mr. Hamp has been appointed to the Corporate Responsibility andFinance Committees of the Board. Mr. Hamp will receive an annual board retainer paid equally in cash andstock units, each as described in the Company’s 2007 proxy statement. William Clay Ford, Jr., theExecutive Chairman of Ford Motor Company, is the brother-in-law of Mr. Hamp. Ford is currently theCompany’s largest customer and Ford and the registrant have engaged, and are expected to engage, in anumber of commercial and other transactions having values in excess of $120,000 in the ordinary courseof their businesses.
131

PART III
ITEM 10. DIRECTORS, EXECUTIVE OFFICERS AND CORPORATE GOVERNANCE
Except as set forth herein, the information required by Item 10 regarding its directors is incorporated byreference from the information under the captions “Item 1. Election of Directors,” “CorporateGovernance — Committees” and “Section 16(a) Beneficial Ownership Reporting Compliance” in its2008 Proxy Statement. The information required by Item 10 regarding its executive officers appearsas Item 4A under Part I of this Annual Report on Form 10-K.
The Company has adopted a code of ethics, as such phrase is defined in Item 406 of Regulation S-K, thatapplies to all directors, officers and employees of the Company and its subsidiaries, including theChairman and Chief Executive Officer, the Executive Vice President and Chief Financial Officer andthe Vice President and Chief Accounting Officer. The code, entitled “Ethics and Integrity Policy,” is availableon the Company’s website at www.visteon.com.
ITEM 11. EXECUTIVE COMPENSATION
The information required by Item 11 is incorporated by reference from the information under the captions“Compensation Committee Report,” “Executive Compensation” and “Director Compensation” in its 2008Proxy Statement.
ITEM 12. SECURITY OWNERSHIP OF CERTAIN BENEFICIAL OWNERS AND MANAGEMENTAND RELATED STOCKHOLDER MATTERS
The information required by Item 12 is incorporated by reference from the information under the caption“Stock Ownership” in its 2008 Proxy Statement.
The following table summarizes information as of December 31, 2007 relating to its equity compensationplans pursuant to which grants of stock options, stock appreciation rights, stock rights, restricted stock,restricted stock units and other rights to acquire shares of its common stock may be made from time totime.
Equity Compensation Plan Information
Plan Category
Number of Securitiesto be Issued Upon
Exercise ofOutstanding Options,
Warrants and Rights (a) (1)
Weighted-AverageExercise Price of
OutstandingOptions, Warrants
and Rights (b)
Number of SecuritiesRemaining Available forFuture Issuance UnderEquity Compensation
Plans (excludingsecurities reflected in
column (a))(c) (2)
Equity compensation plansapproved by security holders . . 12,927,920 $10.80 8,971,581
Equity compensation plans notapproved by security holders . . — —
Total . . . . . . . . . . . . . . . . . . . . . . 12,927,920 10.80 8,971,581
(1) Excludes 92,500 unvested shares of restricted common stock issued pursuant to the Visteon Corporation 2004 Incentive Plan.Also excludes stock appreciation rights and restricted stock units issued pursuant to the Visteon Corporation 2004 Incentive Planand Employees Equity Incentive Plan that by their terms may only be settled in cash.
(2) Excludes an indefinite number of deferred stock units that may be awarded under the Visteon Corporation Non-EmployeeDirector Stock Unit Plan, which units may be settled in cash or shares of the Company’s common stock. Such Plan provides for anannual, automatic grant of stock units worth $70,000 to each non-employee director of the Company. There is no maximumnumber of securities that may be issued under this Plan, however, the Plan will terminate on May 12, 2014 unless earlierterminated by the Board of Directors. This Plan was approved by stockholders on May 10, 2006.
132

ITEM 13. CERTAIN RELATIONSHIPS AND RELATED TRANSACTIONS, AND DIRECTORINDEPENDENCE
The information required by Item 13 is incorporated by reference from the information under the captions“Corporate Governance — Director Independence” and “Transactions with Related Persons” in its2008 Proxy Statement.
ITEM 14. PRINCIPAL ACCOUNTING FEES AND SERVICES
The information required by Item 14 is incorporated by reference from the information under the captions“Audit Fees” and “Audit Committee Pre-Approval Process and Policies” in its 2008 Proxy Statement.
PART IV
ITEM 15. EXHIBITS, FINANCIAL STATEMENT SCHEDULES
(a) The following documents are filed as part of this report:
1. Financial Statements
See “Index to Consolidated Financial Statements” in Part II, Item 8 hereof.
2. Financial Statement Schedules
Report of Independent Registered Public Accounting Firm on Financial Statement Schedules.
Schedule I — Condensed Financial Information of the Company
Schedule II — Valuation and Qualifying Accounts
All other financial statement schedules are omitted because they are not required or applicable underinstructions contained in Regulation S-X or because the information called for is shown in the financialstatements and notes thereto.
3. Exhibits
(b) The exhibits listed on the “Exhibit Index” on pages 141-146 are filed with this Annual Report onForm 10-K or incorporated by reference as set forth therein.
133

Report of Independent Registered Public Accounting Firm onFinancial Statement Schedules
To the Board of Directors and ShareholdersVisteon Corporation
Our audits of the consolidated financial statements and of the effectiveness of internal control overfinancial reporting referred to in our report dated February 22, 2008 appearing in this Annual Report onForm 10-K of Visteon Corporation also included an audit of the financial statement schedules listed inItem 15(a)(2) of this Form 10-K. In our opinion, these financial statement schedules present fairly, in allmaterial respects, the information set forth therein when read in conjunction with the related consolidatedfinancial statements.
/s/ PricewaterhouseCoopers LLP
PricewaterhouseCoopers LLPDetroit, MichiganFebruary 22, 2008
134

VISTEON CORPORATION AND SUBSIDIARIESSCHEDULE I — CONDENSED FINANCIAL INFORMATION OF THE PARENT COMPANY
CONDENSED STATEMENTS OF OPERATIONS
2007 2006 2005Year Ended December 31
(Dollars in Millions)
Net sales. . . . . . . . . . . . . . . . . . . . . . . . . . . . . . . . . . . . . . . . . . . . . . . . . $1,249 $1,316 $7,603Cost of sales . . . . . . . . . . . . . . . . . . . . . . . . . . . . . . . . . . . . . . . . . . . . . . 1,661 1,746 9,795Other expenses . . . . . . . . . . . . . . . . . . . . . . . . . . . . . . . . . . . . . . . . . . . . 872 828 775Gain on ACH Transactions . . . . . . . . . . . . . . . . . . . . . . . . . . . . . . . . . . . — — 1,912Equity in net income of consolidated subsidiaries and
non-consolidated affiliates . . . . . . . . . . . . . . . . . . . . . . . . . . . . . . . . . . 826 1,021 758
Loss from continuing operations before income taxes . . . . . . . . . . . (458) (237) (297)Benefit from income taxes . . . . . . . . . . . . . . . . . . . . . . . . . . . . . . . . . . . . (86) (74) (28)Loss from discontinued operations. . . . . . . . . . . . . . . . . . . . . . . . . . . . . . — — 1
Net loss . . . . . . . . . . . . . . . . . . . . . . . . . . . . . . . . . . . . . . . . . . . . . . . . . $ (372) $ (163) $ (270)
See accompanying notes to condensed financial information of the parent company.
135

VISTEON CORPORATION AND SUBSIDIARIESSCHEDULE I — CONDENSED FINANCIAL INFORMATION OF THE PARENT COMPANY
CONDENSED BALANCE SHEETS
2007 2006December 31
(Dollars in Millions)
ASSETSCash and equivalents . . . . . . . . . . . . . . . . . . . . . . . . . . . . . . . . . . . . . . . . . . . . . $ 1,173 $ 387Due from consolidated subsidiaries . . . . . . . . . . . . . . . . . . . . . . . . . . . . . . . . . . . 4,391 3,027Accounts receivable, net . . . . . . . . . . . . . . . . . . . . . . . . . . . . . . . . . . . . . . . . . . . 137 197Inventories, net . . . . . . . . . . . . . . . . . . . . . . . . . . . . . . . . . . . . . . . . . . . . . . . . . . 45 22Equity in net assets of subsidiaries and affiliates . . . . . . . . . . . . . . . . . . . . . . . . . 8,406 7,046Property and equipment, net . . . . . . . . . . . . . . . . . . . . . . . . . . . . . . . . . . . . . . . . 280 225Other assets . . . . . . . . . . . . . . . . . . . . . . . . . . . . . . . . . . . . . . . . . . . . . . . . . . . . 77 57
Total assets . . . . . . . . . . . . . . . . . . . . . . . . . . . . . . . . . . . . . . . . . . . . . . . . . . . . $14,509 $10,961
LIABILITIES AND SHAREHOLDERS’ DEFICITDebt . . . . . . . . . . . . . . . . . . . . . . . . . . . . . . . . . . . . . . . . . . . . . . . . . . . . . . . . . . $ 2,516 $ 2,005Due to consolidated subsidiaries . . . . . . . . . . . . . . . . . . . . . . . . . . . . . . . . . . . . . 11,086 8,050Other liabilities . . . . . . . . . . . . . . . . . . . . . . . . . . . . . . . . . . . . . . . . . . . . . . . . . . 997 1,094Shareholders’ deficit
Preferred stock (par value $1.00, 50 million shares authorized, noneoutstanding) . . . . . . . . . . . . . . . . . . . . . . . . . . . . . . . . . . . . . . . . . . . . . . . . . — —
Common stock (par value $1.00, 500 million shares authorized, 131 millionshares issued, 130 million and 129 million shares outstanding,respectively) . . . . . . . . . . . . . . . . . . . . . . . . . . . . . . . . . . . . . . . . . . . . . . . . . 131 131
Stock warrants. . . . . . . . . . . . . . . . . . . . . . . . . . . . . . . . . . . . . . . . . . . . . . . . . 127 127Additional paid in capital . . . . . . . . . . . . . . . . . . . . . . . . . . . . . . . . . . . . . . . . . 3,406 3,398Accumulated other comprehensive income (loss) and other . . . . . . . . . . . . . . . 262 (238)Accumulated deficit . . . . . . . . . . . . . . . . . . . . . . . . . . . . . . . . . . . . . . . . . . . . . (4,016) (3,606)
Total shareholders’ deficit . . . . . . . . . . . . . . . . . . . . . . . . . . . . . . . . . . . . . . . . . . (90) (188)
Total liabilities and shareholders’ deficit . . . . . . . . . . . . . . . . . . . . . . . . . . . . . $14,509 $10,961
See accompanying notes to condensed financial information of the parent company.
136

VISTEON CORPORATION AND SUBSIDIARIESSCHEDULE I — CONDENSED FINANCIAL INFORMATION OF THE PARENT COMPANY
CONDENSED STATEMENTS OF CASH FLOWS
2007 2006 2005Year Ended December 31
(Dollars in Millions)
Net cash provided from (used by) operating activities . . . . . . . . . . . . . $ 376 $ (383) $(141)Investing ActivitiesCapital expenditures . . . . . . . . . . . . . . . . . . . . . . . . . . . . . . . . . . . . . . . . . (66) (27) (86)Cash proceeds from ACH transactions . . . . . . . . . . . . . . . . . . . . . . . . . . . — 296Other, including proceeds from asset disposals . . . . . . . . . . . . . . . . . . . . . 1 (1) 12
Cash (used by) provided from investing activities . . . . . . . . . . . . . . . . . . . (65) (28) 222Financing ActivitiesOther short-term debt, net. . . . . . . . . . . . . . . . . . . . . . . . . . . . . . . . . . . . . — (347) 278Proceeds from issuance of other debt, net of issuance costs. . . . . . . . . . . 496 1,329 —Repurchase of unsecured debt securities . . . . . . . . . . . . . . . . . . . . . . . . . — (141) (250)Principal payments on other debt . . . . . . . . . . . . . . . . . . . . . . . . . . . . . . . (7) (358) (8)Other, including book overdrafts . . . . . . . . . . . . . . . . . . . . . . . . . . . . . . . . (14) 1 1
Net cash provided from financing activities . . . . . . . . . . . . . . . . . . . . . . . . 475 484 21
Net increase in cash and equivalents . . . . . . . . . . . . . . . . . . . . . . . . . . . . 786 73 102Cash and equivalents at beginning of year . . . . . . . . . . . . . . . . . . . . . . . . 387 314 212
Cash and equivalents at end of year . . . . . . . . . . . . . . . . . . . . . . . . . . . . . $1,173 $ 387 $ 314
Supplemental cash flow information:Cash dividends received from consolidated subsidiaries . . . . . . . . . . . . $ 3 $ 14 $ 97Cash dividends received from non-consolidated affiliates . . . . . . . . . . . . $ — $ — $ 2
See accompanying notes to condensed financial information of the parent company.
137
VISTEON CORPORATION AND SUBSIDIARIESSCHEDULE I — CONDENSED FINANCIAL INFORMATION OF THE PARENT COMPANY
NOTES TO CONDENSED FINANCIAL INFORMATION OF THE PARENT COMPANY
Note 1. Basis of Presentation
The accompanying condensed financial statements include the accounts of Visteon Corporation (the“Parent Company”) and, on an equity basis its subsidiaries and affiliates. These financial statementsshould be read in conjunction with the consolidated financial statements and the accompanying notesthereto of Visteon Corporation and Subsidiaries (the “Company”).
Sale of North American Facilities
On May 24, 2005, the Company and Ford Motor Company (“Ford”) entered into a non-bindingMemorandum of Understanding (“MOU”), setting forth a framework for the transfer of 23 NorthAmerican facilities and related assets and liabilities (the “Business”) to a Ford-controlled entity. InSeptember 2005, the Company and Ford entered into several definitive agreements and the Companycompleted the transfer of the Business to Automotive Components Holdings, LLC (“ACH”), an indirect,wholly-owned subsidiary of the Company.
Following the signing of the MOU and at June 30, 2005, the Company classified the manufacturing facilitiesand associated assets, including inventory, machinery, equipment and tooling, to be sold as “held for sale.”The liabilities to be assumed or forgiven by Ford pursuant to the ACH Transactions, including employeeliabilities and postemployment benefits payable to Ford, were classified as “Liabilities associated withassets held for sale” in the Company’s consolidated balance sheet following the signing of the MOU.Statement of Financial Accounting Standards No. 144 (“SFAS 144”), “Accounting for the Impairment orDisposal of Long-Lived Assets,” requires long-lived assets that are considered “held for sale” to bemeasured at the lower of their carrying value or fair value less cost to sell and future depreciation of suchassets is ceased. During the second quarter of 2005, the Company’s Automotive Operations recorded animpairment charge of $920 million to write-down those assets considered “held for sale” to their aggregateestimated fair value less cost to sell.
On October 1, 2005, Ford acquired from the Company all of the issued and outstanding shares of commonstock of the parent of ACH in exchange for Ford’s payment to the Company of approximately $300 million,as well as the forgiveness of certain other postretirement employee benefit (“OPEB”) liabilities and otherobligations relating to hourly employees associated with the Business, and the assumption of certain otherliabilities with respect to the Business (together, the “ACH Transactions”).
Reclassifications: Certain prior year amounts have been reclassified to conform to current yearpresentation.
Other liabilities: Pension liabilities and other postretirement employee benefits of $106 and $151,respectively for 2007 and $141 and $155, respectively for 2006, are included in “Other liabilities.”
138

VISTEON CORPORATION AND SUBSIDIARIESSCHEDULE I — CONDENSED FINANCIAL INFORMATION OF THE PARENT COMPANY
NOTES TO CONDENSED FINANCIAL INFORMATION OF THE PARENT COMPANY
Note 2. Debt
Short and long-term debt consisted of the following:
Maturity 2007 2006 2007 2006
WeightedAverage
Interest Rate Book Value
(Dollars in Millions)
Short-term debtCurrent portion of long-term debt . . . . . . . . . . . . . . . 7.6% 7.6% $ 6 $ 6
Long-term debt8.25% notes due August 1, 2010 . . . . . . . . . . . . . . . 2010 8.4% 8.4% 553 550Term loan due June 13, 2013 . . . . . . . . . . . . . . . . . 2013 8.5% 8.5% 1,000 1,000Term loan due December 13, 2013 . . . . . . . . . . . . . 2013 8.6% — 500 —7.00% notes due March 10, 2014 . . . . . . . . . . . . . . 2014 7.7% 7.4% 449 439Other . . . . . . . . . . . . . . . . . . . . . . . . . . . . . . . . . . . . 2008-2025 7.6% 7.6% 8 10
Total long-term debt . . . . . . . . . . . . . . . . . . . . . . . 2,510 1,999
Total debt . . . . . . . . . . . . . . . . . . . . . . . . . . . . . . . $2,516 $2,005
Aggregate annual maturities of debt, including capital lease obligations at December 31, 2007, were asfollows (in millions): 2008 — $6 million; 2009 — $4 million; 2010 — $553 million; 2011 — $1 million;thereafter — $1,952 million.
139

VISTEON CORPORATION AND SUBSIDIARIESSCHEDULE II — VALUATION AND QUALIFYING ACCOUNTS
Balance atBeginning
of Year
(Benefits)/Charges to
Income Deductions (a) Other (b)
Balanceat Endof Year
(Dollars in Millions)
Year Ended December 31, 2007:Allowance for doubtful accounts . . . . . $ 44 $ (19) $ (7) $ — $ 18Valuation allowance for deferred
taxes . . . . . . . . . . . . . . . . . . . . . . . . 2,103 160 — (161) 2,102Year Ended December 31, 2006:
Allowance for doubtful accounts . . . . . $ 77 $ 4 $(20) $ (17) $ 44Valuation allowance for deferred
taxes . . . . . . . . . . . . . . . . . . . . . . . . 1,961 178 — (36) 2,103Year Ended December 31, 2005:
Allowance for doubtful accounts . . . . . $ 44 $ 45 $(12) $ — $ 77Valuation allowance for deferred
taxes . . . . . . . . . . . . . . . . . . . . . . . . 1,949 155 — (143) 1,961
(a) Deductions represent uncollectible accounts charged off.
(b) Valuation allowance for deferred taxes
Other represents adjustments recorded through other comprehensive income. Other also includes adjustments to theCompany’s U.S. residual tax liability on assumed repatriation of foreign earnings and tax return true-up adjustments, bothof which impact deferred taxes and the related valuation allowances. In 2007, other also includes adjustments related to thedeferred tax attributes adjusted for uncertain tax positions carrying a full valuation allowance.
Allowance for doubtful accounts
Other represents a reduction of allowance amounts upon entering into the European securitization agreement as thosereceivables are recorded at fair value.
140
EXHIBIT INDEX
ExhibitNumber Exhibit Name
3.1 Amended and Restated Certificate of Incorporation of Visteon Corporation (“Visteon”) isincorporated herein by reference to Exhibit 3.1 to the Current Report on Form 8-K of Visteondated May 22, 2007.
3.2 Amended and Restated By-laws of Visteon as in effect on the date hereof is incorporated hereinby reference to Exhibit 3.2 to the Current Report on Form 8-K of Visteon dated May 22, 2007.
4.1 Amended and Restated Indenture dated as of March 10, 2004 between Visteon and J.P. MorganTrust Company, as Trustee, is incorporated herein by reference to Exhibit 4.01 to the CurrentReport on Form 8-K of Visteon dated March 3, 2004 (filed as of March 19, 2004).
4.2 Supplemental Indenture dated as of March 10, 2004 between Visteon and J.P. MorganTrust Company, as Trustee, is incorporated herein by reference to Exhibit 4.02 to the CurrentReport on Form 8-K of Visteon dated March 3, 2004 (filed as of March 19, 2004).
4.3 Form of Common Stock Certificate of Visteon is incorporated herein by reference to Exhibit 4.1to Amendment No. 1 to the Registration Statement on Form 10 of Visteon dated May 19, 2000.
4.4 Warrant to purchase 25 million shares of common stock of Visteon, dated as of May 17, 2007, isincorporated herein by reference to Exhibit 4.1 to the Current Report on Form 8-K of Visteondated May 18, 2007.
4.5 Form of Stockholder Agreement, dated as of October 1, 2005, between Visteon and Ford MotorCompany (“Ford”) is incorporated herein by reference to Exhibit 4.2 to the Current Report onForm 8-K of Visteon dated September 16, 2005.
4.6 Letter Agreement, dated as of May 17, 2007, among Visteon, LB I Group, Inc. and Ford MotorCompany is incorporated herein by reference to Exhibit 4.2 to the Current Report on Form 8-K ofVisteon dated May 18, 2007.
4.7 Term sheet dated July 31, 2000 establishing the terms of Visteon’s 8.25% Notes dueAugust 1, 2010, is incorporated herein by reference to Exhibit 4.2 to the Current Report onForm 8-K of Visteon dated August 16, 2000.
10.1 Master Transfer Agreement dated as of March 30, 2000 between Visteon and Ford isincorporated herein by reference to Exhibit 10.2 to the Registration Statement on Form S-1of Visteon dated June 2, 2000 (File No. 333-38388).
10.2 Master Separation Agreement dated as of June 1, 2000 between Visteon and Ford isincorporated herein by reference to Exhibit 10.4 to Amendment No. 1 to the RegistrationStatement on Form S-1 of Visteon dated June 6, 2000 (File No. 333-38388).
10.3 Amended and Restated Employee Transition Agreement dated as of April 1, 2000, as amendedand restated as of December 19, 2003, between Visteon and Ford is incorporated herein byreference to Exhibit 10.7 to the Annual Report on Form 10-K of Visteon for the period endedDecember 31, 2003.
10.3.1 Amendment Number Two, effective as of October 1, 2005, to Amended and Restated EmployeeTransition Agreement, dated as of April 1, 2000 and restated as of December 19, 2003, betweenVisteon and Ford is incorporated herein by reference to Exhibit 10.15 to the Current Report onForm 8-K of Visteon dated October 6, 2005.
10.4 Tax Sharing Agreement dated as of June 1, 2000 between Visteon and Ford is incorporatedherein by reference to Exhibit 10.8 to the Registration Statement on Form S-1 of Visteon datedJune 2, 2000 (File No. 333-38388).
10.5 Visteon Corporation 2004 Incentive Plan, as amended and restated, is incorporated herein byreference to Appendix C to the Proxy Statement of Visteon dated March 30, 2006.*
10.5.1 Amendment to the Visteon Corporation 2004 Incentive Plan, effective as of June 14, 2007, isincorporated herein by reference to Exhibit 10.1 to the Current Report on Form 8-K of Visteondated June 20, 2007.*
10.5.2 Form of Terms and Conditions of Nonqualified Stock Options is incorporated herein by referenceto Exhibit 10.5.2 to the Quarterly Report on Form 10-Q of Visteon dated November 8, 2007.*
141

ExhibitNumber Exhibit Name
10.5.3 Form of Terms and Conditions of Restricted Stock Grants is incorporated herein by reference toExhibit 10.5.2 to the Quarterly Report on Form 10-Q of Visteon dated May 9, 2007.*
10.5.4 Form of Terms and Conditions of Restricted Stock Units is incorporated herein by reference toExhibit 10.5.3 to the Quarterly Report on Form 10-Q of Visteon dated May 9, 2007.*
10.5.5 Form of Terms and Conditions of Stock Appreciation Rights is incorporated herein by referenceto Exhibit 10.5.4 to the Quarterly Report on Form 10-Q of Visteon dated May 9, 2007.*
10.6 Form of Revised Change in Control Agreement is incorporated herein by reference toExhibit 10.10 to the Annual Report on Form 10-K of Visteon for the period endedDecember 31, 2000.*
10.6.1 Form of Amendment to Revised Change in Control Agreement constituting Exhibit 10.6 hereto isincorporated herein by reference to Exhibit 10.6.1 to the Annual Report on Form 10-K of Visteonfor the period ended December 31, 2006.*
10.6.2 Schedule identifying substantially identical agreements to Revised Change in ControlAgreement constituting Exhibit 10.6 and Amendment to Revised Change of ControlAgreement constituting Exhibit 10.6.1 hereto entered into by Visteon with Messrs. Johnston,Stebbins, Donofrio, and Quigley and Ms. Stephenson.*
10.7 Visteon Corporation Deferred Compensation Plan for Non-Employee Directors, as amended, isincorporated herein by reference to Exhibit 10.14 to the Annual Report on Form 10-K of Visteonfor the period ended December 31, 2003.*
10.7.1 Amendments to the Visteon Corporation Deferred Compensation Plan for Non-EmployeeDirectors, effective as of December 14, 2005 is incorporated herein by reference toExhibit 10.14.1 to the Annual Report on Form 10-K of Visteon for the period endedDecember 31, 2005.*
10.8 Visteon Corporation Restricted Stock Plan for Non-Employee Directors, as amended, isincorporated herein by reference to Exhibit 10.15 to the Annual Report on Form 10-K ofVisteon for the period ended December 31, 2003.*
10.8.1 Amendments to the Visteon Corporation Restricted Stock Plan for Non-Employee Directors,effective as of January 1, 2005 is incorporated herein by reference to Exhibit 10.15.1 to theAnnual Report on Form 10-K of Visteon for the period ended December 31, 2005.*
10.8.2 Amendment to the Visteon Corporation Restricted Stock Plan for Non-Employee Directors,effective as of May 10, 2006, is incorporated herein by reference to Exhibit 10.3 to the CurrentReport on Form 8-K of Visteon dated May 12, 2006.*
10.9 Visteon Corporation Deferred Compensation Plan, as amended, is incorporated herein byreference to Exhibit 10.16 to the Annual Report on Form 10-K of Visteon for the period endedDecember 31, 2002.*
10.9.1 Amendments to the Visteon Corporation Deferred Compensation Plan, effective as ofDecember 23, 2005 is incorporated herein by reference to Exhibit 10.16.1 to the AnnualReport on Form 10-K of Visteon for the period ended December 31, 2005.*
10.10 Employment Agreement dated as of December 7, 2004 between Visteon andWilliam G. Quigley III is incorporated herein by reference to Exhibit 10.17 to the AnnualReport on Form 10-K of Visteon for the period ended December 31, 2005.*
10.11 Visteon Corporation Pension Parity Plan, as amended through February 9, 2005, is incorporatedherein by reference to Exhibit 10.4 to the Current Report on Form 8-K of Visteon datedFebruary 15, 2005.*
10.11.1 Amendments to the Visteon Corporation Pension Parity Plan, effective as of January 1, 2005 isincorporated herein by reference to Exhibit 10.18.1 to the Annual Report on Form 10-K ofVisteon for the period ended December 31, 2005.*
10.12 Visteon Corporation Supplemental Executive Retirement Plan, as amended throughFebruary 9, 2005, is incorporated herein by reference to Exhibit 10.2 to the Current Reporton Form 8-K of Visteon dated February 15, 2005.*
142

ExhibitNumber Exhibit Name
10.12.1 Amendments to the Visteon Corporation Supplemental Executive Retirement Plan, effective asof January 1, 2005 is incorporated herein by reference to Exhibit 10.19.1 to the Annual Report onForm 10-K of Visteon for the period ended December 31, 2005.*
10.12.2 Amendments to the Visteon Corporation Supplemental Executive Retirement Plan, effective asof June 30, 2006, is incorporated herein by reference to Exhibit 10.1 to the Current Report onForm 8-K of Visteon dated June 19, 2006.*
10.13 Amended and Restated Employment Agreement, effective as of March 1, 2007, betweenVisteon and Michael F. Johnston is incorporated herein by reference to Exhibit 10.13 to theAnnual Report on Form 10-K of Visteon for the period ended December 31, 2006.*
10.14 Reserved10.15 Visteon Corporation Executive Separation Allowance Plan, as amended through
February 9, 2005, is incorporated herein by reference to Exhibit 10.3 to the Current Reporton Form 8-K of Visteon dated February 15, 2005.*
10.15.1 Amendments to the Visteon Corporation Executive Separation Allowance Plan, effective as ofJanuary 1, 2005 is incorporated herein by reference to Exhibit 10.22.1 to the Annual Report onForm 10-K of Visteon for the period ended December 31, 2005.*
10.16 Trust Agreement dated as of February 7, 2003 between Visteon and The NorthernTrust Company establishing a grantor trust for purposes of paying amounts to certaindirectors and executive officers under the plans constituting Exhibits 10.6, 10.6.1, 10.7,10.7.1, 10.9, 10.9.1, 10.11, 10.11.1, 10.12, 10.12.1, 10.12.2, 10.15 and 10.15.1 hereto isincorporated herein by reference to Exhibit 10.23 to the Annual Report on Form 10-K of Visteonfor the period ended December 31, 2002.*
10.17 Credit Agreement, dated as of August 14, 2006, among Visteon, certain subsidiaries of Visteon,the several banks and other financial institutions or entities from time to time party thereto, Bankof America, NA, Sumitomo Mitsui Banking Corporation, New York, and Wachovia CapitalFinance Corporation (Central), as co-documentation agents, Citicorp USA, Inc., assyndication agent, and JPMorgan Chase Bank, N.A., as administrative agent, isincorporated herein by reference to Exhibit 10.17 to the Quarterly Report on Form 10-Q ofVisteon dated November 7, 2006.
10.17.1 First Amendment to Credit Agreement and Consent, dated as of November 27, 2006, to theCredit Agreement, dated as of August 14, 2006, among Visteon, certain subsidiaries of Visteon,the several banks and other financial institutions or entities from time to time party thereto, Bankof America, NA, Sumitomo Mitsui Banking Corporation, New York, and Wachovia CapitalFinance Corporation (Central), as co-documentation agents, Citicorp USA, Inc., assyndication agent, and JPMorgan Chase Bank, N.A., as administrative agent, isincorporated herein by reference to Exhibit 10.3 to the Current Report on Form 8-K ofVisteon dated December 1, 2006.
10.17.2 Second Amendment to Credit Agreement and Consent, dated as of April 10, 2007, to the CreditAgreement, dated as of August 14, 2006, among Visteon, certain subsidiaries of Visteon, theseveral banks and other financial institutions or entities from time to time party thereto, Bank ofAmerica, NA, Sumitomo Mitsui Banking Corporation, New York, and Wachovia Capital FinanceCorporation (Central), as co-documentation agents, Citicorp USA, Inc., as syndication agent,and JPMorgan Chase Bank, N.A., as administrative agent, is incorporated herein by reference toExhibit 10.3 to the Current Report on Form 8-K of Visteon dated April 16, 2007.
10.18 Amended and Restated Credit Agreement, dated as of April 10, 2007, among Visteon, theseveral banks and other financial institutions or entities from time to time party thereto, CreditSuisse Securities (USA) LLC and Sumitomo Mitsui Banking Corporation, as co-documentationagents, Citicorp USA, Inc., as syndication agent, and JPMorgan Chase Bank, N.A., asadministrative agent, is incorporated herein by reference to Exhibit 10.1 to the CurrentReport on Form 8-K of Visteon dated April 16, 2007.
143

ExhibitNumber Exhibit Name
10.18.1 Agreement to Amend and Restate, dated as of April 10, 2007, among Visteon, the several banksand other financial institutions or entities party to the Credit Agreement, dated as ofJune 13, 2006, Citicorp USA, Inc., as syndication agent, and JPMorgan Chase Bank, N.A.,as administrative agent, is incorporated herein by reference to Exhibit 10.2 to the Current Reporton Form 8-K of Visteon dated April 16, 2007.
10.19 Reserved10.20 Hourly Employee Conversion Agreement dated as of December 22, 2003 between Visteon and
Ford is incorporated herein by reference to Exhibit 10.28 to the Annual Report on Form 10-K ofVisteon for the period ended December 31, 2003.
10.21 Letter Agreement, effective as of May 23, 2005, between Visteon and Mr. Donald J. Stebbins isincorporated herein by reference to Exhibit 10.1 to the Current Report on Form 8-K of Visteondated May 23, 2005.*
10.22 Visteon Corporation Non-Employee Director Stock Unit Plan is incorporated herein by referenceto Appendix D to the Proxy Statement of Visteon dated March 30, 2006.*
10.23 Settlement Agreement, dated as of July 27, 2007 between Visteon Systemes Interieurs, Visteonand Joel Coque (unofficial translation).*
10.24 Visteon Executive Severance Plan is incorporated herein by reference to Exhibit 10.1 to theCurrent Report on Form 8-K of Visteon dated February 15, 2005.*
10.25 Form of Executive Retiree Health Care Agreement is incorporated herein by reference toExhibit 10.28 to the Current Report on Form 8-K of Visteon dated December 9, 2004.*
10.25.1 Schedule identifying substantially identical agreements to Executive Retiree Health CareAgreement constituting Exhibit 10.25 hereto entered into by Visteon with Messrs. Johnstonand Stebbins and Ms. D. Stephenson.*
10.26 Contribution Agreement, dated as of September 12, 2005, between Visteon and VHF Holdings,Inc. is incorporated herein by reference to Exhibit 10.2 to the Current Report on Form 8-K ofVisteon dated September 16, 2005.
10.27 Visteon “A” Transaction Agreement, dated as of September 12, 2005, between Visteon and Fordis incorporated herein by reference to Exhibit 10.3 to the Current Report on Form 8-K of Visteondated September 16, 2005.
10.28 Visteon “B” Purchase Agreement, dated as of September 12, 2005, between Visteon and Ford isincorporated herein by reference to Exhibit 10.4 to the Current Report on Form 8-K of Visteondated September 16, 2005.
10.29 Escrow Agreement, dated as of October 1, 2005, among Visteon, Ford and Deutsche BankTrust Company Americas, as escrow agent, is incorporated herein by reference to Exhibit 10.11to the Current Report on Form 8-K of Visteon dated October 6, 2005.
10.30 Reimbursement Agreement, dated as of October 1, 2005, between Visteon and Ford isincorporated herein by reference to Exhibit 10.12 to the Current Report on Form 8-K ofVisteon dated October 6, 2005.
10.31 Master Services Agreement, dated as of September 30, 2005, between Visteon and AutomotiveComponents Holdings, LLC is incorporated herein by reference to Exhibit 10.1 to the CurrentReport on Form 8-K of Visteon dated October 6, 2005.
10.32 Visteon Hourly Employee Lease Agreement, effective as of October 1, 2005, between Visteonand Automotive Components Holdings, LLC is incorporated herein by reference to Exhibit 10.2to the Current Report on Form 8-K of Visteon dated October 6, 2005.
10.33 Visteon Hourly Employee Conversion Agreement, dated effective as of October 1, 2005,between Visteon and Ford is incorporated herein by reference to Exhibit 10.9 to the CurrentReport on Form 8-K of Visteon dated October 6, 2005.
10.34 Visteon Salaried Employee Lease Agreement, effective as of October 1, 2005, between Visteonand Automotive Components Holdings, LLC is incorporated herein by reference to Exhibit 10.3to the Current Report on Form 8-K of Visteon dated October 6, 2005.
144
ExhibitNumber Exhibit Name
10.34.1 Amendment to Salaried Employee Lease Agreement and Payment Acceleration Agreement,dated as of March 30, 2006, among Visteon, Ford Motor Company and Automotive ComponentsHoldings, LLC is incorporated herein by reference to Exhibit 10.46.1 to the Quarterly Report onForm 10-Q of Visteon dated May 10, 2006.
10.35 Visteon Salaried Employee Lease Agreement (Rawsonville/Sterling), dated as ofOctober 1, 2005, between Visteon and Ford is incorporated herein by reference toExhibit 10.8 to the Current Report on Form 8-K of Visteon dated October 6, 2005.
10.36 Visteon Salaried Employee Transition Agreement, dated effective as of October 1, 2005,between Visteon and Ford is incorporated herein by reference to Exhibit 10.10 to theCurrent Report on Form 8-K of Visteon dated October 6, 2005.
10.36.1 Amendment Number One to Visteon Salaried Employee Transition Agreement, effective as ofMarch 1, 2006, between Visteon and Ford is incorporated herein by reference to Exhibit 10.36.1to the Quarterly Report on Form 10-Q of Visteon dated August 8, 2006.
10.37 Purchase and Supply Agreement, dated as of September 30, 2005, between Visteon (as seller)and Automotive Components Holdings, LLC (as buyer) is incorporated herein by reference toExhibit 10.4 to the Current Report on Form 8-K of Visteon dated October 6, 2005.†
10.38 Purchase and Supply Agreement, dated as of September 30, 2005, between AutomotiveComponents Holdings, LLC (as seller) and Visteon (as buyer) is incorporated herein byreference to Exhibit 10.5 to the Current Report on Form 8-K of Visteon dated October 6, 2005.†
10.39 Purchase and Supply Agreement, dated as of October 1, 2005, between Visteon (as seller) andFord (as buyer) is incorporated herein by reference to Exhibit 10.13 to the Current Report onForm 8-K of Visteon dated October 6, 2005.†
10.40 Intellectual Property Contribution Agreement, dated as of September 30, 2005, among Visteon,Visteon Global Technologies, Inc., Automotive Components Holdings, Inc. and AutomotiveComponents Holdings, LLC is incorporated herein by reference to Exhibit 10.6 to the CurrentReport on Form 8-K of Visteon dated October 6, 2005.
10.40.1 Amendment to Intellectual Property Contribution Agreement, dated as of December 11, 2006,among Visteon, Visteon Global Technologies, Inc., Automotive Components Holdings, Inc. andAutomotive Components Holdings, LLC, is incorporated herein by reference to Exhibit 10.40.1 tothe Annual Report on Form 10-K of Visteon for the period ended December 31, 2006.
10.41 Software License and Contribution Agreement, dated as of September 30, 2005, amongVisteon, Visteon Global Technologies, Inc. and Automotive Components Holdings, Inc. isincorporated herein by reference to Exhibit 10.7 to the Current Report on Form 8-K ofVisteon dated October 6, 2005.
10.42 Intellectual Property License Agreement, dated as of October 1, 2005, among Visteon,Visteon Global Technologies, Inc. and Ford is incorporated herein by reference toExhibit 10.14 to the Current Report on Form 8-K of Visteon dated October 6, 2005.
10.43 Master Agreement, dated as of September 12, 2005, between Visteon and Ford is incorporatedherein by reference to Exhibit 10.1 to the Current Report on Form 8-K of Visteon datedSeptember 16, 2005.
10.44 Master Receivables Purchase & Servicing Agreement, dated as of August 14, 2006, by andamong Visteon UK Limited, Visteon Deutschland GmbH, Visteon Sistemas Interiores EspanaS.L., Cadiz Electronica SA, Visteon Portuguesa Limited, Visteon Financial Centre P.L.C., TheLaw Debenture Trust Corporation P.L.C., Citibank, N.A., Citibank International Plc, CiticorpUSA, Inc., and Visteon is incorporated herein by reference to Exhibit 10.44 to the QuarterlyReport on Form 10-Q of Visteon dated November 7, 2006.
10.45 Variable Funding Agreement, dated as of August 14, 2006, by and among Visteon UK Limited,Visteon Financial Centre P.L.C., The Law Debenture Trust Corporation P.L.C., CitibankInternational PLC, and certain financial institutions listed therein, is incorporated herein byreference to Exhibit 10.45 to the Quarterly Report on Form 10-Q of Visteon datedNovember 7, 2006.
145
ExhibitNumber Exhibit Name
10.46 Subordinated VLN Facility Agreement, dated as of August 14, 2006, by and amongVisteon Netherlands Finance B.V., Visteon Financial Centre P.L.C., The Law DebentureTrust Corporation P.L.C., and Citibank International PLC is incorporated herein by referenceto Exhibit 10.46 to the Quarterly Report on Form 10-Q of Visteon dated November 7, 2006.
10.47 Master Definitions and Framework Deed, dated as of August 14, 2006, by and among Visteon,Visteon Netherlands Finance B.V., Visteon UK Limited, Visteon Deutschland GmbH,Visteon Systemes Interieurs SAS, Visteon Ardennes Industries SAS,Visteon Sistemas Interiores Espana S.L., Cadiz Electronica SA, Visteon Portuguesa Limited,Visteon Financial Centre P.L.C., The Law Debenture Trust Corporation P.L.C., Citibank, N.A.,Citibank International PLC, Citicorp USA, Inc., Wilmington Trust SP Services (Dublin) Limited,and certain financial institutions and other entities listed therein, is incorporated herein byreference to Exhibit 10.47 to the Quarterly Report on Form 10-Q of Visteon datedNovember 7, 2006.
12.1 Statement re: Computation of Ratios.14.1 Visteon Corporation — Ethics and Integrity Policy, as amended effective September 23, 2005
(code of business conduct and ethics) is incorporated herein by reference to Exhibit 14.1 to theCurrent Report on Form 8-K of Visteon dated September 28, 2005.
21.1 Subsidiaries of Visteon.23.1 Consent of Independent Registered Public Accounting Firm, PricewaterhouseCoopers LLP.24.1 Powers of Attorney relating to execution of this Annual Report on Form 10-K.31.1 Rule 13a-14(a) Certification of Chief Executive Officer dated February 22, 2008.31.2 Rule 13a-14(a) Certification of Chief Financial Officer dated February 22, 2008.32.1 Section 1350 Certification of Chief Executive Officer dated February 22, 2008.32.2 Section 1350 Certification of Chief Financial Officer dated February 22, 2008.99.1 Press release dated February 22, 2008.
† Portions of these exhibits have been redacted pursuant to confidential treatment requests filed with the Secretary of the Securitiesand Exchange Commission pursuant to Rule 24b-2 under the Securities Exchange Act of 1934, as amended. The redactedmaterial was filed separately with the Securities and Exchange Commission.
* Indicates that exhibit is a management contract or compensatory plan or arrangement.
In lieu of filing certain instruments with respect to long-term debt of the kind described in Item 601(b)(4) ofRegulation S-K, Visteon agrees to furnish a copy of such instruments to the Securities and ExchangeCommission upon request.
146

SIGNATURES
Pursuant to the requirements of Section 13 of the Securities Exchange Act of 1934, Visteon Corporationhas duly caused this Report to be signed on its behalf by the undersigned, thereunto duly authorized.
VISTEON CORPORATION
By: /s/ MICHAEL F. JOHNSTONMichael F. Johnston
Date: February 22, 2008
Pursuant to the requirements of the Securities Exchange Act of 1934, this Report has been signed belowon February 22, 2008, by the following persons on behalf of Visteon Corporation and in the capacitiesindicated.
Signature Title
/s/ MICHAEL F. JOHNSTON
Michael F. Johnston
Chairman of the Board and Chief Executive Officer(Principal Executive Officer)
/s/ WILLIAM G. QUIGLEY IIIWilliam G. Quigley III
Executive Vice President and Chief Financial Officer(Principal Financial Officer)
/s/ MICHAEL J. WIDGREN
Michael J. Widgren
Vice President, Corporate Controller and ChiefAccounting Officer (Principal Accounting Officer)
/s/ WILLIAM H. GRAY, III*William H. Gray, III
Director
/s/ PATRICIA L. HIGGINS*Patricia L. Higgins
Director
/s/ KARL J. KRAPEK*Karl J. Krapek
Director
/s/ CHARLES L. SCHAFFER*Charles L. Schaffer
Director
/s/ DONALD J. STEBBINS*Donald J. Stebbins
Director, President and Chief Operating Officer
/s/ RICHARD J. TAGGART*Richard J. Taggart
Director
/s/ JAMES D. THORNTON*James D. Thornton
Director
/s/ KENNETH B. WOODROW*Kenneth B. Woodrow
Director
*By: /s/ WILLIAM G. QUIGLEY IIIWilliam G. Quigley III
Attorney-in-Fact
147
Michael F. JohnstonChairman and Chief Executive Officer
Donald J. StebbinsPresident and Chief Operating Officer
William H. Gray, IIIChairmanAmani Group
Steven K. HampPrincipal Hamp Advisors, LLC
Patricia L. HigginsFormer President and CEO Switch and Data
Karl J. KrapekFormer President and COO United Technologies Corporation
Charles L. SchafferFormer COOUnited Parcel Service, Inc.
Richard J. TaggartFormer Executive Vice President and CFO Weyerhaeuser Company
James D. ThorntonFormer Senior Executive Vice PresidentMBNA America Bank, N.A.
Kenneth B. WoodrowFormer Vice ChairmanTarget Corporation
Corporate Officers(as of 3/1/08):
Michael F. JohnstonChairman and Chief Executive Officer Donald J. StebbinsPresident and Chief Operating Officer
William G. Quigley IIIExecutive Vice Presidentand Chief Financial Officer John DonofrioSenior Vice President and General Counsel
Robert C. PallashSenior Vice President Dorothy L. StephensonSenior Vice President Michael J. WidgrenVice President, Corporate Controller and Chief Accounting Officer
Directors and Officers of Visteon Corporation
Directors(as of 3/1/08):
2007 Annual Report
2010ProfitableInnovative, flexible and profitable with the momentum and focus for long-term growth
Drivers: Diverse Customer Base, Innovation, Market-Leading Technology, Cost-Competitive Footprint
Visteon Timeline – Where We’re Going, Where We’ve Been
2011Sustainable Business Model
2009Free Cash Flow PositiveRealize benefits of three-year plan – Visteon is a lean and productive business
2006Launched Restructuring PlanThree-year plan launched – focused on restructuring, improving base operations, growing the business
2008Creating Our FutureHeavy restructuring year with focus on transformation into a lean, flexible company well-positioned to thrive in a global market
2007 Exceeded CommitmentsRestructuring on track, operations and cost structure improved along with new business wins – performed better than guidance
2005Reached New Structural Agreement with FordReshaped company to leaner, smaller, more competitive organization
Visteon Cover.indd 2 3/12/08 5:39:30 PM

We supply the world.
2007 Annual Report
Visteon 2007 A
nnual Report
www.visteon.com
Visteon Cover.indd 1 3/12/08 5:39:26 PM