Embed Size (px)
Citation preview

2007 Annual Report
Argo Investments LimitedABN 35 007 519 520
DirectorsChristopher L. Harris, ChairmanRobert T. Rich, Deputy ChairmanRobert J. Patterson, Managing DirectorMarina S. DarlingIan R. JohnsonG. Ian Martin
Chief Financial Officer and Company SecretaryBrenton R. Aird
Investment ExecutivesJason BeddowChristopher C. Hall
AuditorsPricewaterhouseCoopers
Registered Office and Share RegistryLevel 12, 11-19 Grenfell Street, Adelaide,South Australia 5000 GPO Box 2692, Adelaide, South Australia 5001Telephone: (08) 8212 2055 Facsimile: (08) 8212 1658 Email: [email protected]: www.argoinvestments.com.au
Sydney OfficeLevel 17, 264 George Street, Sydney,New South Wales 2000GPO Box 4313, Sydney, New South Wales 2001Telephone: (02) 9247 8900 Facsimile: (02) 9247 6088
Share purchase planacceptances due 27 September, 2007
Annual general meeting:-Adelaide Convention Centre,North Terrace, Adelaide at 10 a.m.
29 October, 2007
Information meetings:-MelbourneThe Age Theatre, Melbourne Museum,11 Nicholson Street, Carlton at 10.30 a.m.
30 October, 2007SydneyThe Tattersalls Club,181 Elizabeth Street, Sydney at 10 a.m.
31 October, 2007
Half yearly result announced 4 February, 2008
Objective“Argo’s objective is to maximise long-term secure returns to
shareholders through a balance of capital and dividend growth from a diversified Australian investment portfolio.”
1
Directory Calendar
Investments as at 30 June, 2005
NO. OF MARKETSHARES VALUE
OR UNITS $M
A.B.C. Learning Centres Ltd. 250,000 1.4Aberdeen Leaders Ltd. 9,294,377 11.1Adelaide Bank Ltd. 1,297,501 14.9Adelaide Bank Ltd. reset preference 17,000 1.8Adelaide Brighton Ltd 3,445,062 6.4Adsteam Marine Ltd. 1,062,172 2.1ALE Property Group 610,000 1.3Alesco Corporation Ltd. 2,047,350 15.1Alinta Ltd. 862,006 8.4Alinta Ltd. reset conv. preference 10,000 1.6Allco Equity Partners Ltd. party paid 397,247 0.6Allco Hybrid Investment Trust 10,000 0.9Alumina Ltd. 1,997,023 11.1Amalgamated Holdings Ltd. 752,392 3.3Amcor Ltd. 5,051,511 33.8AMP Ltd. 6,175,099 40.0Angus & Coote (Holdings) Ltd. 422,028 3.4 Ansell Ltd. 665,685 6.7A.P. Eagers Ltd. 667,106 4.9APN News & Media Ltd. 3,038,370 15.6APN News & Media Ltd. 7.25% conv. notes 323,474 1.7Aristocrat Leisure Ltd. 850,000 9.9Austal Ltd. 1,200,000 2.2Australand Property Group 1,550,000 2.1Australia and New Zealand Banking Group Ltd. 4,264,272 92.7Australian Foundation Investment Company Ltd. 396,842 1.5Australian Gas Light Company (The) 2,091,664 29.8Australian Infrastructure Fund 2,123,823 5.5Australian Pipeline Trust 311,912 1.2Australian United Investment Company Ltd. 14,398,018 80.2AXA Asia Pacific Holdings Ltd. 4,131,109 18.1
3 Five years of growth
4 Portfolio allocation and 20 largestinvestments
5 Company profile
6 Shareholder benefits
7 Directors’ Report
23 Auditor’s Independence Declaration
24 Corporate governance
28 Income Statement
29 Balance Sheet
30 Statement of Changes in Equity
31 Cash Flow Statement
32 Notes to the Financial Statements
52 Directors’ Declaration
53 Independent Audit Report
56 Shareholding details
57 List of investments
64 Securities issued since 19 September, 1985
~ Net operating profit before realised
gains on sale of long-term
investments a record $147.9 million,
an increase of 20.1%.
~ Profit of $171.5 million including net
realised gains on sale of long-term
investments.
~ Total portfolio return 28.4%.
~ Record year-end asset backing of
$8.28 per share compared with
$6.85 per share on 30 June, 2006.
~ Dividends of 27 cents per share, fully
franked (including LIC capital gain
dividend of 2 cents per share),
compared with 24 cents per share
last year.
~ Management expense ratio reduced to
0.12% of average assets at market
value.
~ Capital raisings of $445.4 million from
1 for 8 rights issue at $7.20 per
share, $35.5 million from the Share
Purchase Plan and $24.3 million from
the Dividend Reinvestment Plan.
Contents 2007 Highlights
2
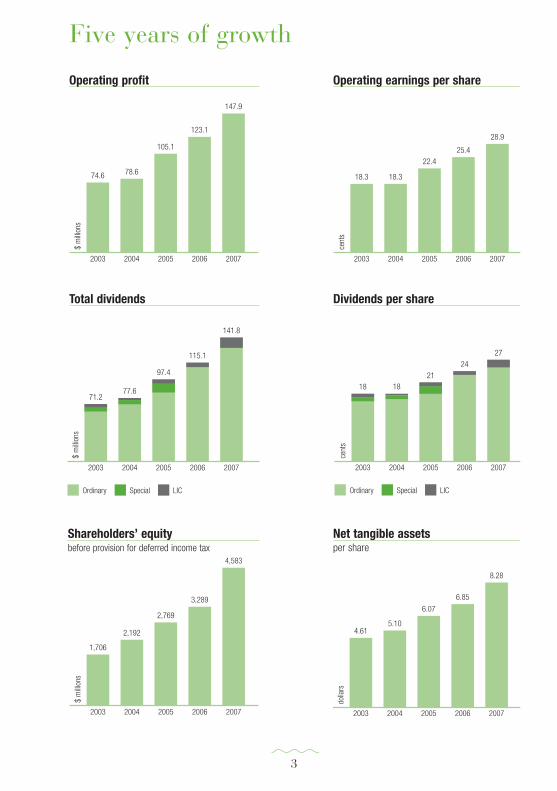
Five years of growth
Operating earnings per shareOperating profit
Dividends per shareTotal dividends
Net tangible assetsper share
Shareholders’ equitybefore provision for deferred income tax
3
4
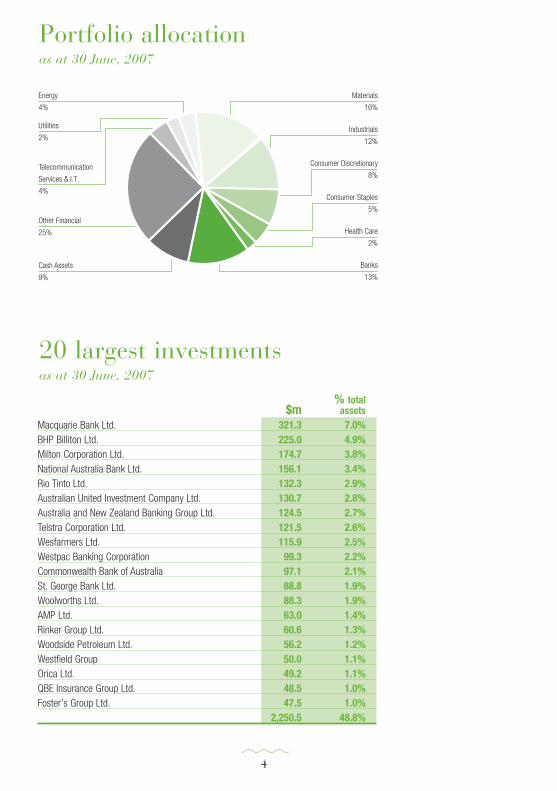
% total$m assets
Macquarie Bank Ltd. 321.3 7.0%BHP Billiton Ltd. 225.0 4.9%Milton Corporation Ltd. 174.7 3.8%National Australia Bank Ltd. 156.1 3.4%Rio Tinto Ltd. 132.3 2.9%Australian United Investment Company Ltd. 130.7 2.8%Australia and New Zealand Banking Group Ltd. 124.5 2.7%Telstra Corporation Ltd. 121.5 2.6%Wesfarmers Ltd. 115.9 2.5%Westpac Banking Corporation 99.3 2.2%Commonwealth Bank of Australia 97.1 2.1%St. George Bank Ltd. 88.8 1.9%Woolworths Ltd. 88.3 1.9%AMP Ltd. 63.0 1.4%Rinker Group Ltd. 60.6 1.3%Woodside Petroleum Ltd. 56.2 1.2%Westfield Group 50.0 1.1%Orica Ltd. 49.2 1.1%QBE Insurance Group Ltd. 48.5 1.0%Foster's Group Ltd. 47.5 1.0%
2,250.5 48.8%
Portfolio allocation as at 30 June, 2007
20 largest investments as at 30 June, 2007
5
Company profile
Argo Investments Limited wasestablished in 1946 and is a leadingAustralian listed investment companywith a market capitalisation as at 30June, 2007 of $4.5 billion.
The shares of a listed investment companyoffer investors a professionally managed entryto the sharemarket.
Argo is ranked by market capitalisation in thetop 100 companies listed on the AustralianSecurities Exchange (ASX code ARG).
At 30 June, 2007 Argo had 553.2 millionshares on issue.
Argo has 59,000 shareholders who areseeking capital growth and a regular income.
Argo’s assets were $4.6 billion as at 30 June,2007 and are invested predominantly in theshares of companies listed on the AustralianSecurities Exchange.
The investment policy followed by Argo issimple. Rather than attempt to gainspectacular rewards in the short term fromhigh-risk situations, the management aim toprovide safe, steady and satisfactory progress,secured by a spread of investments over awide range of the Australian economy. Theportfolio contains investments in about 190companies and trusts representing a crosssection of Australia’s enterprises, including anumber with substantial overseas operations.A long-term investment philosophy is adoptedin selecting the portfolio which extends beyondthe larger companies to include smallercompanies where there is good qualitymanagement and prospects for soundearnings growth.
Argo has an experienced Board of Directorsand a stable management team which areessential for the effective surveillance of along-term investment portfolio. The Boardconsists of six highly qualified Directors, one of whom is an executive Director. In 61 yearsof operation, Argo has only had two ChiefExecutives.
Shares in Argo are particularly suitable for newand passive sharemarket investors due to thespread of investments within its portfolio, forthose investors who are too busy to monitortheir own investment portfolios and for self-managed superannuation funds.
Argo shares can be purchased through anysharebroker and the market price of theshares is reported daily in the press. There isno initial service fee charged to invest in Argo.Being a securities exchange listed company,only normal sharebrokers’ charges apply.
We encourage investors to visit the Argo internetsite at www.argoinvestments.com.auand read our Owner’s Manual to obtain furtherinformation on the Company’s operations.
6
Shareholder benefits
Low Management CostsArgo’s management costs are extremely lowwhen compared with many other managedinvestment products. For the year ended 30June, 2007, total operating costs were 0.12%of average assets at market value.
Franked DividendsArgo has paid a dividend in every year sinceits inception.
Franking credits on dividends received by Argoare passed on to Argo shareholders throughdividends paid that are fully or substantiallyfranked, depending on tax credits available tothe Company. The franked portion of Argo’sdividends are largely tax free for tax-payingAustralian shareholders. Certain Australianresident shareholders can also claim a taxbenefit where the dividend is sourced fromrealised eligible LIC capital gains. Overseasshareholders also benefit, since withholdingtax is not deducted from franked dividends.
Share Purchase PlanArgo has a Share Purchase Plan (SPP) whichallows eligible shareholders the opportunity toacquire additional small parcels of shares at adiscount, currently 2.5%, from the marketprice. No brokerage or other transaction costsare payable. The maximum amount that ashareholder can invest in any 12 month periodpursuant to a SPP is $5,000. The Directorsdecide when the SPP will operate andcurrently the Directors offer the SPP toshareholders each half-year at which time up to $2,500 can be invested, making amaximum total of $5,000 in any year.
Dividend Reinvestment PlanArgo has a Dividend Reinvestment Plan (DRP)which allows eligible shareholders theopportunity to reinvest their dividends,currently at a 2.5% discount from the marketprice of Argo shares as defined by the DRP.
New Share IssuesArgo has a history of making new issues ofshares on a pro-rata basis to existingshareholders at a discount to the market price.These issues have resulted in an increase inthe amount of dividends received byshareholders. In the case of renounceablerights issues, a shareholder who does not wish to apply for additional shares may sell the entitlement.
Share Price PerformanceInformation produced by Goldman Sachs JBWere Pty. Limited, sharebrokers, reveals thefollowing share price performance, assumingthat all dividends and the proceeds from thesale of rights had been reinvested in Argoshares:-
10 years to30 June, 2007
$1,000 invested in Argo shares $4,081
Compound annual growth rate
Argo shares 15.1% p.a.
ASX all ordinariesaccumulation index 13.1% p.a.
Consumer price index 2.7% p.a.
Performance statistics for various periods of timeare regularly updated on Argo’s internet site.
7
Directors’ Report
The Directors present their Sixty FirstAnnual Report together with the financialreport of Argo Investments Limited (“theCompany”) for the financial year ended30 June, 2007 including the independentAudit Report thereon.
Operating and Financial ReviewThe Company’s objective is to maximise long-term secure returns to shareholders through abalance of capital and dividend growth from adiversified Australian investment portfolio. Thisis achieved through building a portfolio of long-term investments, currently about 190 stocks,representing a cross section of Australia’senterprises, where there is good qualitymanagement and prospects for soundearnings and dividend growth.
A number of key performance indicators areused by the Directors and management in theirassessment of the Company’s performance,including growth in operating profit, operatingearnings per share, dividends paid toshareholders, shareholders’ equity, assetbacking per share, total portfolio return andcontrol of management costs.
The Company has no debt and has substantialliquid funds on deposit at balance dateavailable for additional long-term investment.
Operating profit for the financial year, afterproviding for income tax and before realisedgains on the sale of long-term investments,increased 20.1% to a record $147,854,674compared with $123,123,625 in the previousfinancial year.
Factors contributing to the record 2006-2007profit performance included:
- strong growth in income from ordinarydividends, interest and trust distributions,including approximately three monthsincome from the $445,402,852 of capitalraised in the oversubscribed 1 for 8 rightsissue at $7.20 per share in March 2007;
- a continuing focus on managing costs whichhas resulted in the management expenseratio (MER) for the year reducing to 0.12%of average assets at market value.
The Company’s result reflects the analyticalstrength and disciplined approach adopted bythe Argo management team in evaluating andselecting long-term investment opportunities inthe Australian share market. The diverseinvestment portfolio is generally performingwell with many stocks recording solid profitgrowth resulting in the receipt of increaseddistributions. The policy of only investing inAustralian companies, many of which haveextensive overseas interests, enables theCompany’s investment analysts to maintain a strong and close relationship with thecompanies in which we invest.
Accounting Standards now require realisedgains on the sale of long-term investments tobe included in the reported profit of theCompany. We do not consider these gains arepart of the Company’s ordinary activities andthey have been identified separately from itsoperating profit. Realised gains on the sale oflong-term investments after tax amounted to$23,682,436 (last year $21,159,945).
Profit for the year including realised gains onthe sale of long-term investments amounted to$171,537,110 compared with $144,283,570last year. The net realised gains on the sale of
8
Directors’ Report
long-term investments for the year ended 30 June, 2007 have been transferred to the Company’s capital profits reserve.
For the last ten years the Company’s investmentportfolio has produced a compound annualreturn of 14.7% as measured by the movementin net asset backing per share plus dividendsreinvested, compared with 13.1% from the S&PASX All Ordinaries Accumulation Index. Thisincludes a total return of 28.4% from theCompany’s investment portfolio in the last year.
Operating earnings per share which does notinclude realised gains on the sale of long-terminvestments rose 13.8% to 28.9 cents,compared with 25.4 cents in the previous yearafter adjusting for the March 2007 rights issue.
The Company intends to continue itsinvestment activities in future years as it hasdone in the past. The results of theseinvestment activities depend upon theperformance of the stocks in the Company’sinvestment portfolio. Their performance isinfluenced by many economic factors,including economic growth rates, inflation,interest rates, exchange rates and taxationlevels. There are also specific issues such asmanagement competence, capital strength,industry economics and competitive behaviour.
The Company will continue to focus onproducing results that accord with its statedobjective.
DividendsA fully franked interim dividend of 12 cents pershare was paid on 9 March, 2007.
On 6 August, 2007, the Directors declared thefollowing fully franked dividends totalling 15
cents per share payable on 5 September,2007 on the capital enlarged by the March2007 rights issue:
~ a final dividend of 13 cents per share;
~ a 2 cents per share Listed InvestmentCompany (LIC) capital gain dividend. Thisdividend will give rise to an attributable partof 2.86 cents per share, which will alloweligible shareholders to claim a portion ofthe attributable part as a deduction in their2007-2008 income tax returns.
Total fully franked dividends for the yearamount to a record 27 cents per share,including an LIC capital gain dividend of 2cents per share. This compares with 24 centsper share last year, which included an LICcapital gain dividend of 1 cent per share.
The dividends total $141,767,582 andcompare with $115,088,347 in the previousyear, an increase of 23.2%.
Dividend Reinvestment PlanThe Dividend Reinvestment Plan (DRP) raised$24,340,472 of new capital for investmentduring the year.
The DRP will operate for the dividendpayments totalling 15 cents per share payableon 5 September, 2007 and the Directors haveresolved that the shares will be allotted toeligible shareholders participating in the DRPat a discount of 2.5% from the market price ofArgo shares, as defined by the DRP.
Share Buy-BackThe Company has an on-market share buy-back in place in order that its shares can bebought back and cancelled where they are
9
Directors’ Report
able to be purchased at a significant discountto the net tangible asset backing of theCompany. Any such purchases have the resultof increasing the value of the remaining shareson issue.
During the year, the share buy-back was notactivated.
Share Purchase PlanDuring the year, shareholders supported theShare Purchase Plan (SPP) on offer and anadditional $35,478,408 of new capital wasraised for investment.
The SPP is again being offered to eligibleshareholders in September 2007 at a discountof 2.5%, as defined by the SPP.
Asset BackingThe net tangible asset backing per Argo sharebefore providing for deferred capital gains taxon unrealised gains within the investmentportfolio rose to $8.28 as at 30 June, 2007,compared with $6.85 as at 30 June, 2006after adjusting for the 1 for 8 rights issue at$7.20 per share in March 2007.
Additional statutory information
1. (a) The names of the Directors in office atthe date of the report are as follows:
Christopher Lee Harris BEc, FCPA, FAICD
Non-executive Chairman – Independent
Mr. Harris joined the Board of ArgoInvestments Limited in 1994 and wasappointed Chairman in 1998. He is currentlythe Chairman of the Nomination andRemuneration Committee and is a memberof the Corporate Governance Committee.
Mr. Harris holds Board positions on otherlisted companies, having been appointedChairman of EvoGenix Limited in 2004 anda non-executive Director of AdelaideBrighton Ltd in 1995. He was alsoappointed a non-executive Director ofMcGuigan Simeon Wines Limited in 2002,after being a non-executive Director ofSimeon Wines Limited from 1994 to 2002.
He has a company management andcorporate finance background and was aformer Group Managing Director and ChiefExecutive Officer of F.H. Faulding & Co.Limited.
Robert Tom Rich FCA, MAICD
Non-executive Deputy Chairman – Non-independent
Mr. Rich joined the Board of ArgoInvestments Limited in 1992, was anexecutive Director until 1998 when hebecame a non-executive Director and wasappointed Deputy Chairman. He is currentlyChairman of the Corporate GovernanceCommittee and a member of theNomination and Remuneration Committeeand the Audit Committee.
He has a chartered accounting backgroundand was previously the Managing Directorof Stoddarts Holdings Limited.
Robert John Patterson FAICD
Managing Director – Non-independent
Mr. Patterson began his career with ArgoInvestments Limited in 1969 and held theposition of Company Secretary from 1969to 1985.
10
Directors’ Report
He was appointed Chief Executive in 1982,joined the Board as an executive Director in1983 and was appointed Managing Directorof the Company in 1992.
He has had over 38 years experience in theinvestment industry.
Marina Santini Darling BA (Hons), LLB, FAICD
Non-executive – Independent
Mrs. Darling joined the Board of ArgoInvestments Limited in 1999 and iscurrently a member of the CorporateGovernance Committee.
Mrs. Darling holds a Board position onanother listed company, having beenappointed a non-executive Director ofSouthern Cross Broadcasting (Australia)Limited in 1999.
She has commercial, legal and corporateadvisory experience.
Ian Rutledge Johnson BSc (Hons), FAICD
Non-executive – Independent
Mr. Johnson joined the Board of ArgoInvestments Limited in 2006 and iscurrently a member of the Audit Committee.
Mr. Johnson retired as a group executive ofCRA Limited in 1996 after more than 25years with the company. He was a non-executive Director of Fonterra CooperativeGroup Limited from 2004 to 2005, a non-executive Director of Leighton HoldingsLimited from 1997 to 2004 and was a non-executive Director and Chairman of NewcrestMining Limited from 1998 to 2006.
He has a resource sector background withexperience in management and geology.
Geoffrey Ian Martin BEc (Hons), FAICD
Non-executive – Independent
Mr. Martin joined the Board of ArgoInvestments Limited in 2004, is currentlyChairman of the Audit Committee and amember of the Nomination andRemuneration Committee.
Mr. Martin holds Board positions on otherlisted companies, having been appointed anon-executive Director of Babcock andBrown Limited in 2004 and GPT Group in2005.
He has a background in economics,investment management and investmentbanking.
(b) Directors’ relevant interests
Directors’ relevant interests in shares andperformance rights, as notified by theDirectors to the Australian SecuritiesExchange in accordance with theCorporations Act 2001, at the date of thisreport are as follows:-
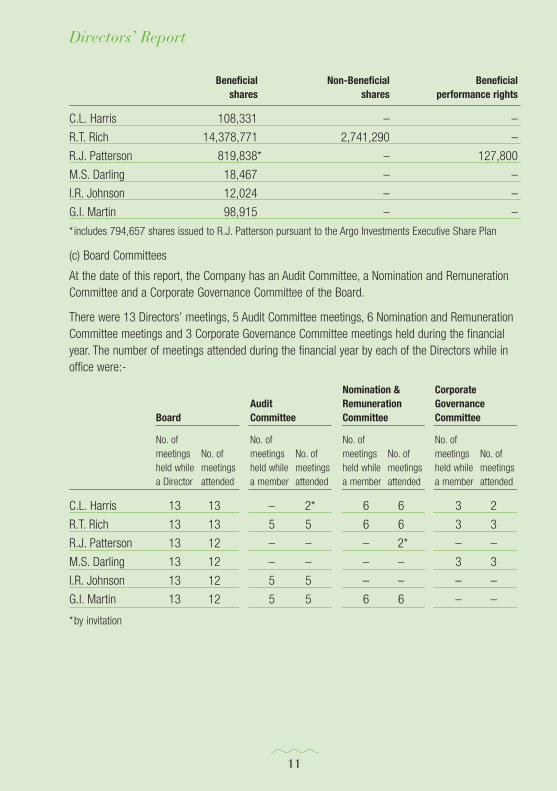
Beneficial Non-Beneficial Beneficialshares shares performance rights
C.L. Harris 108,331 – –
R.T. Rich 14,378,771 2,741,290 –
R.J. Patterson 819,838* – 127,800
M.S. Darling 18,467 – –
I.R. Johnson 12,024 – –
G.I. Martin 98,915 – –
*includes 794,657 shares issued to R.J. Patterson pursuant to the Argo Investments Executive Share Plan
(c) Board Committees
At the date of this report, the Company has an Audit Committee, a Nomination and RemunerationCommittee and a Corporate Governance Committee of the Board.
There were 13 Directors’ meetings, 5 Audit Committee meetings, 6 Nomination and RemunerationCommittee meetings and 3 Corporate Governance Committee meetings held during the financialyear. The number of meetings attended during the financial year by each of the Directors while inoffice were:-
Nomination & CorporateAudit Remuneration Governance
Board Committee Committee Committee
No. of No. of No. of No. ofmeetings No. of meetings No. of meetings No. of meetings No. ofheld while meetings held while meetings held while meetings held while meetingsa Director attended a member attended a member attended a member attended
C.L. Harris 13 13 – 2* 6 6 3 2
R.T. Rich 13 13 5 5 6 6 3 3
R.J. Patterson 13 12 – – – 2* – –
M.S. Darling 13 12 – – – – 3 3
I.R. Johnson 13 12 5 5 – – – –
G.I. Martin 13 12 5 5 6 6 – –
*by invitation
11
Directors’ Report
12
Directors’ Report
2. The name of the Company Secretary in officeat the date of the report is as follows:-
Brenton Raymond Aird FPNA
Mr. Aird joined the Company in 1986 andhas been Company Secretary since thattime. He was alternate executive Director forMr. R.J. Patterson from 1992 to 2004 andwas appointed Chief Financial Officer in2004. Mr. Aird has an accounting andinvestment background.
3. The principal activities of the Companyduring the financial year were theinvestment of funds in Australian listedsecurities and short-term interest bearingsecurities. No significant change in thenature of these activities occurred duringthe financial year. No significant change inthe state of affairs of the Company occurredduring the financial year other than thosementioned in this report.
4. The dividends paid by the Company for thefinancial year ended 30 June, 2006 of$62,779,472 (including an LIC capital gaindividend of $4,829,190) and referred to inthe Directors’ Report dated 25 August,2006 were paid on 8 September, 2006.
5. The Directors are not aware of any matteror circumstance that has arisen since theend of the financial year that hassignificantly affected or may significantlyaffect the Company’s operations, the resultsof those operations or the Company’s stateof affairs in future financial years except asstated elsewhere in this report.
6. The Directors do not anticipate anyparticular developments in the operations of
the Company which will affect the results offuture financial years other than thosementioned in this report.
7. The Company has paid a premium inrespect of a Directors’ and Officers’insurance policy covering the liability ofpast, present or future Directors andOfficers, including executive officers of theCompany. The terms of the policy prohibitsdisclosure of the details of the amount ofinsurance cover and the premium paid.
8. The shareholders in general meeting inNovember 1999 approved that theCompany indemnify its current and futureDirectors against liabilities arising out of theDirectors’ position as a Director of theCompany, except where the liability arisesout of conduct involving a lack of good faith.The deed stipulates that the Company willmeet the full amount of any such liabilities,including costs and expenses.
9. Remuneration Report
The Company has established a Nominationand Remuneration Committee to review andadvise the Board on remuneration issues forthe non-executive Directors, the ManagingDirector (an executive Director) and seniorexecutives. A comprehensive review wascarried out during the year which resulted inchanges to the existing remunerationstructure and where applicable, details ofthe changes are provided below. TheNomination and Remuneration Committeereceived independent advice from MercerHuman Resource Consulting Pty. Ltd.(Mercer) when considering the review of theCompany’s remuneration framework.
13
Directors’ Report
Non-executive Directors’ remuneration Non-executive Directors are remunerated byfees within the aggregate limit approved byshareholders from time to time. The Board,after taking into account therecommendations of the Nomination andRemuneration Committee, determines thenature and amount of emoluments of non-executive Directors within the limit approvedby shareholders. The Board receives advicefrom independent remuneration consultantsto ensure non-executive Directors’ fees areappropriate and in line with the externalmarket.
At the Annual General Meeting held inOctober 2005, shareholders approved$600,000 as the maximum aggregateamount of remuneration available perannum for distribution to non-executiveDirectors.
The current fee structure for non-executiveDirectors is $72,500 per Director, per year,other than the Chairman who receivesremuneration of $150,000 per year(inclusive of any Committee fees). Anadditional fee of $2,500 is paid for eachCommittee appointment, except that theChairman of the Audit Committee receivesan additional fee of $5,000. In addition,contributions are made by the Company onbehalf of non-executive Directors to externalsuperannuation funds nominated by them incompliance with the relevant legislation.
The Managing Director does not receiveDirectors’ fees.
The Company has entered into anagreement with each non-executive Directorholding office prior to 31 December, 2003
for payment of a retirement benefit upontermination of office, within the limitscontemplated by the Corporations Act 2001and in accordance with principlesestablished by resolution of theshareholders. The agreements were variedas at 31 December, 2003 and entitlementsto that date were frozen. As the amountsdue for Directors’ retiring benefits havebeen determined, the balances are shownas non-current payables and are disclosedin note 9 to the financial statements.
Managing Director and seniorexecutives’ remunerationThe remuneration framework to reward theManaging Director and senior executivesincludes a mix of fixed remuneration andshort and long-term performance basedincentives with the proportions of thoseelements of the person’s remunerationbeing considered appropriate having regardto industry and commercial practices. Thebroad remuneration policy is to ensureremuneration packages properly reflect aperson’s duties and responsibilities, and thatremuneration is competitive in attracting,retaining and motivating people of thehighest quality who are able to create valuefor shareholders.
(a) fixed remuneration and benefitsThe terms of employment for all executivemanagement contain a fixed remunerationcomponent (inclusive of superannuation)together with certain non-monetary benefitswhich can include motor vehicle expensesand the benefit of receiving interest freeloans to assist the purchase of sharespursuant to the Argo Investments Executive
14
Directors’ Report
Share Plan. The fixed amount ofremuneration and benefits are determinedin line with market factors and independentprofessional advice is considered.
(b) short-term performance incentiveFor the year ended 30 June, 2007, theManaging Director and senior executiveswere entitled to receive an annual short-term performance incentive bonus of up to20% of their base salaries (inclusive ofsuperannuation and any agreed salarysacrifice arrangements), subject to achievingfinancial and non-financial performanceobjectives.
30% of the bonus was earned on the basis ofa collective achievement, where Argo’s TotalPortfolio Return (TPR) (calculated by themovement in gross net tangible asset backingper share plus dividends reinvested) exceededthe twelve month performance of the S&PASX All Ordinaries Accumulation Index.
30% of the bonus was based on anassessment by the Managing Director of thesenior executives’ management skills intheir key areas of responsibility and theNomination and Remuneration Committeemade the assessment in the case of theManaging Director.
The remaining 40% of the bonus was basedon a qualitative assessment by theManaging Director of the senior executives’contribution to the investment andadministration processes and theNomination and Remuneration Committeemade the assessment in the case of theManaging Director.
These performance conditions were chosen
as their mix were considered appropriate tomeasure the short-term performance of theCompany’s senior executives.
The Company generally uses the S&P ASXAll Ordinaries Accumulation Index as itsbenchmark for performance and therefore itwas appropriate and consistent that thisIndex was chosen as the method ofassessing the performance condition.
The assessments by the Managing Directorand Nomination and RemunerationCommittee, as the case may be, werechosen as it was considered that they werebest qualified to provide an objectiveassessment of an individual’s performance.
The independent advice received fromMercer during the year by the Nominationand Remuneration Committee concludedthat the short-term performance incentivewas low by industry standards anduncompetitive.
From 1 July, 2007, the Board has resolved toamend the current short-term performanceincentive arrangement such that theManaging Director and senior executives areentitled to receive an annual short-termperformance incentive bonus of up to 50% oftheir Total Fixed Remuneration (TFR) which isinclusive of superannuation and any agreedsalary sacrifice arrangements.
Under these new arrangements, the amountavailable to the Managing Director andsenior executives is determined based onthe Company’s performance and keyperformance indicators which have beentailored for each individual to take accountof their specific role and responsibilities.
15
Directors’ Report
A number of key performance indicators areused to assess the Company’s performance,including growth in operating profit,operating earnings per share, dividends paidto shareholders, shareholders’ equity, assetbacking per share, total portfolio return andcontrol of management costs.
Where applicable, the assessment of anindividual’s performance is made by theBoard, the Nomination and RemunerationCommittee, the Chairman or the ManagingDirector.
The Board considers the amendments to theshort-term performance incentives, includingthe performance hurdles and the method ofassessing performance, are appropriate in acompetitive remuneration environment andwill assist to retain and attract qualityexecutives who can drive Companyperformance and shareholder returns.
(c) long-term performance incentiveArgo Investments Executive Share PlanPrior to 28 October, 2004, the ManagingDirector and senior executives were providedwith longer term incentives through the ArgoInvestments Executive Share Plan. Theshares pursuant to this Plan were issued atthe market price on the day of issue with theassistance of an interest free loan from theCompany and had regard to the executives’contribution to the Company’s performance.The dividends paid on the shares, less anamount equal to the estimated tax payableby the executives on the dividends, areutilised to repay the loan.
No further new allotments have been or willbe made under the Plan following the
approval of the Argo Investments LimitedExecutive Performance Rights Plan at theCompany’s Annual General Meeting held on28 October, 2004.
Argo Investments Limited ExecutivePerformance Rights PlanThe Argo Investments Limited ExecutivePerformance Rights Plan was introduced in2004 to increase the motivation of seniormanagement and create a stronger linkbetween increasing shareholder value andemployee reward. The Plan allows the Boardto grant performance rights to acquireshares in the Company to senior executivesto a monetary value of up to 50% of theirbase salaries (inclusive of superannuationand any agreed salary sacrificearrangements). It is considered that theperformance linked design of this Plan isappropriate in the contemporary businessenvironment.
The performance condition required that theCompany’s TPR, calculated by anindependent expert, must outperform theS&P ASX All Ordinaries Accumulation Index(AI) on a stepped scale as follows:-
Portfolio performance Portion of grantabove AI that vests
<1% nil>1% <2% one third>2% <3% two thirds>3% total grant
At the time of determining the performance condition, the Board reviewed independent surveys of the performance of a range of managers of Australian share funds and believed that the selected performance condition was appropriate for the Company.
16
Directors’ Report
The Company generally uses the S&P ASXAll Ordinaries Accumulation Index as itsbenchmark for performance and therefore itis appropriate and consistent that this Indexwas chosen as the method of assessing theperformance condition.
A service condition also applied whichmakes the performance rights subject to the individual executives remaining inservice until the rights vest.
Any rights that did not vest at the applicabletime of measurement thereupon lapsed.
Five year performance rights issued in threeequal tranches (structured as zero exerciseprice options) with vesting opportunitiesoccurring in the third, fourth and fifth year were granted by the Company on 25 November, 2004 as remunerationpursuant to the Plan to the ManagingDirector and the Company executives.
Further details regarding the performancerights are disclosed on page 21.
The comprehensive review of theCompany’s remuneration policy, whichincluded the independent advice fromMercer, has resulted in the followingchanges to the five year performance rights mentioned above and granted on 25 November, 2004:-
(a) the performance condition has beenamended so that pro-rata vesting of theperformance rights will occur where theCompany’s TPR outperforms the S&PASX All Ordinaries Accumulation Indexmovement over a scale from 0.1%through to 3% for the measurementperiod;
(b) the introduction of re-testing of theperformance condition to provide for re-measurement of tranche 1 rights (expirydate 25 November, 2007) in the fourthand fifth years to the extent that theyhave not vested and tranche 2 rights(expiry date 25 November, 2008) willsimilarly be re-measured in the fifthyear; and
(c) the introduction of Board discretion toenable performance rights to continuebeyond cessation of employment incertain circumstances which couldinclude death, retirement, etc.
The Board believes that these changessignificantly improve the Plan by:-
- bringing it more in line with generalmarket remuneration practices;
- eliminating the unevenness of the steppedscale of the performance conditions underthe former arrangement where marginaldifferences in Company performancecould produce quite different outcomes for executives’ rewards; and
- minimising the impact of short-term sharemarket volatility.
The Company operates in a highlycompetitive employment industry and theBoard considers that these changes to thelong-term performance incentive plan arenecessary to retain and attract qualityexecutives who are able to improve theCompany’s performance and createshareholder wealth.
17
Directors’ Report
In accordance with the requirements of theASX Listing Rules, shareholder approval ofthe above amendments to the performancerights already issued to the ManagingDirector will be sought at the Company’sforthcoming Annual General Meeting (AGM).
The Directors intend to grant further issuesof performance rights to the ManagingDirector and Company executives followingthe Company’s forthcoming AGM. Theseperformance rights will be issued under theCompany’s Executive Performance RightsPlan which will incorporate the aboveamendments. These and future performancerights will be granted annually on the basisthat they are three year performance rightswith the performance condition tested at theend of the third year and re-tested in thefourth and fifth years to the extent that theyhave not yet vested. Shareholders will beasked to approve the granting of theperformance rights to the Managing Directorat this year’s AGM.
The investment industry provides numerousopportunities for executives to be wellremunerated and to accumulate significantequity positions in their employer. In thisenvironment, it is essential that theCompany offers competitive remunerationpackages which will attract and retain highcalibre executives who are able to providesuperior returns to shareholders.
Following the independent advice receivedfrom Mercer, the Directors intend to issue atotal of 195,000 restricted share rights, tobe allocated between certain key investmentpersonnel. These share rights will vest inthree, four and five years, subject to
continued service with the Company. TheBoard will have the discretion to allow theshare rights to vest in certain othercircumstances. No restricted share rightswill be granted to the Managing Director.
DirectorsThe names of persons who were non-executive Directors of the Company duringthe financial year are Mr. C.L. Harris(Chairman), Mr. R.T. Rich (Deputy Chairman),Mrs. M.S. Darling, Mr. I.R. Johnson and Mr.G.I. Martin.
Mr. R.J. Patterson (Managing Director) wasan executive Director during the financialyear.
Senior ExecutivesBesides the non-executive Directors and theManaging Director, the Company hascurrently only three executives for whom thekey management personnel disclosuresrequired by Accounting Standard AASB 124“Related Party Disclosures” and theCorporations Act 2001 apply being Mr. B.R.Aird (Chief Financial Officer and CompanySecretary), Mr. J. Beddow (InvestmentExecutive) and Mr. C.C. Hall (InvestmentExecutive).
18
Directors’ Report
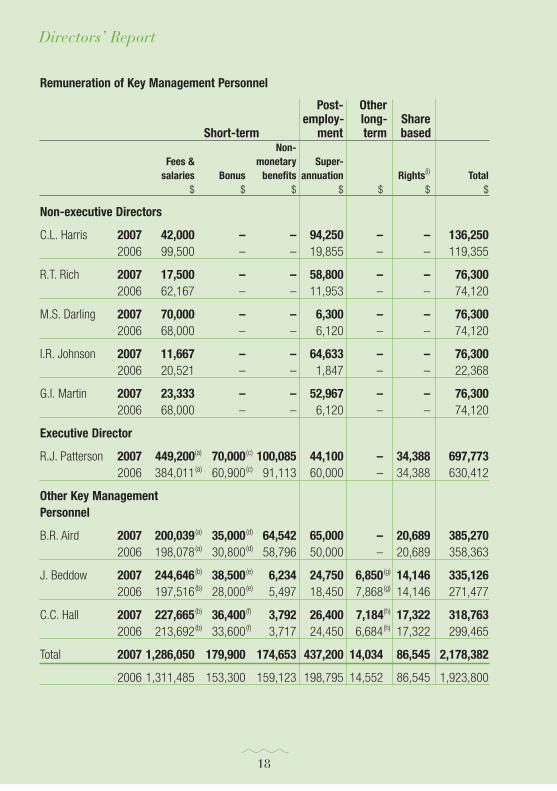
Remuneration of Key Management Personnel
Post- Otheremploy- long- Share
Short-term ment term basedNon-
Fees & monetary Super-salaries Bonus benefits annuation Rights(i) Total
$ $ $ $ $ $ $
Non-executive Directors
C.L. Harris 2007 42,000 – – 94,250 – – 136,2502006 99,500 – – 19,855 – – 119,355
R.T. Rich 2007 17,500 – – 58,800 – – 76,3002006 62,167 – – 11,953 – – 74,120
M.S. Darling 2007 70,000 – – 6,300 – – 76,3002006 68,000 – – 6,120 – – 74,120
I.R. Johnson 2007 11,667 – – 64,633 – – 76,3002006 20,521 – – 1,847 – – 22,368
G.I. Martin 2007 23,333 – – 52,967 – – 76,3002006 68,000 – – 6,120 – – 74,120
Executive Director
R.J. Patterson 2007 449,200(a) 70,000.(c) 100,085 44,100 – 34,388 697,7732006 384,011.(a) 60,900.(c) 91,113 60,000 – 34,388 630,412
Other Key Management Personnel
B.R. Aird 2007 200,039.(a) 35,000.(d) 64,542 65,000 – 20,689 385,2702006 198,078.(a) 30,800.(d) 58,796 50,000 – 20,689 358,363
J. Beddow 2007 244,646.(b) 38,500.(e) 6,234 24,750 6,850.(g) 14,146 335,1262006 197,516.(b) 28,000.(e) 5,497 18,450 7,868.(g) 14,146 271,477
C.C. Hall 2007 227,665.(b) 36,400.(f) 3,792 26,400 7,184(h) 17,322 318,7632006 213,692.(b) 33,600.(f) 3,717 24,450 6,684.(h) 17,322 299,465
Total 2007 1,286,050 179,900 174,653 437,200 14,034 86,545 2,178,382
2006 1,311,485. 153,300. 159,123 198,795 14,552 86,545 1,923,800
19
Directors’ Report
(a) Fees and salaries include the movement for the year in the provision for annual leave andlong service leave (where qualification for long service leave has been met and is entitled to be taken).
(b) Fees and salaries include the movement for the year in the provision for annual leave.
(c) Mr. R.J. Patterson received 70% of the amount payable pursuant to the short-termperformance incentive bonus scheme and it was paid as an additional superannuationcontribution. In 2006, 70% was received and paid as an additional superannuationcontribution.
(d) Mr. B.R. Aird received 70% of the amount payable pursuant to the short-term performanceincentive bonus scheme and it was paid as an additional superannuation contribution. In2006, 70% was received and paid as an additional superannuation contribution.
(e) Mr. J. Beddow received 70% of the amount payable pursuant to the short-term performanceincentive bonus scheme and $35,035 was paid in cash and $3,465 paid as an additionalsuperannuation contribution. In 2006, 70% was received and $25,480 was paid in cash and$2,520 paid as an additional superannuation contribution.
(f) Mr. C.C. Hall received 70% of the amount payable pursuant to the short-term performanceincentive bonus scheme and $32,760 was paid in cash and $3,640 paid as an additionalsuperannuation contribution. In 2006, 70% was received and $30,240 was paid in cash and$3,360 paid as an additional superannuation contribution.
(g) Other long-term benefits include the movement for the year in the provision for long serviceleave where qualification has been met on a pro-rata basis but is not entitled to be taken.
(h) Other long-term benefits include the movement for the year in the provision for long serviceleave where qualification has not been met and therefore not entitled to be taken.
(i) The fair value of the rights was calculated at the grant date using the Monte Carlomethodology and allocated to each reporting period evenly over the period from grant date tovesting date. The value disclosed is the portion of the fair value of the rights allocated to thisreporting period.
(j) The Directors’ and Officers’ liability insurance contract does not specify premiums in respectof individual Directors and Officers and the policy also prohibits disclosure of the premiumpaid.
20
Directors’ Report
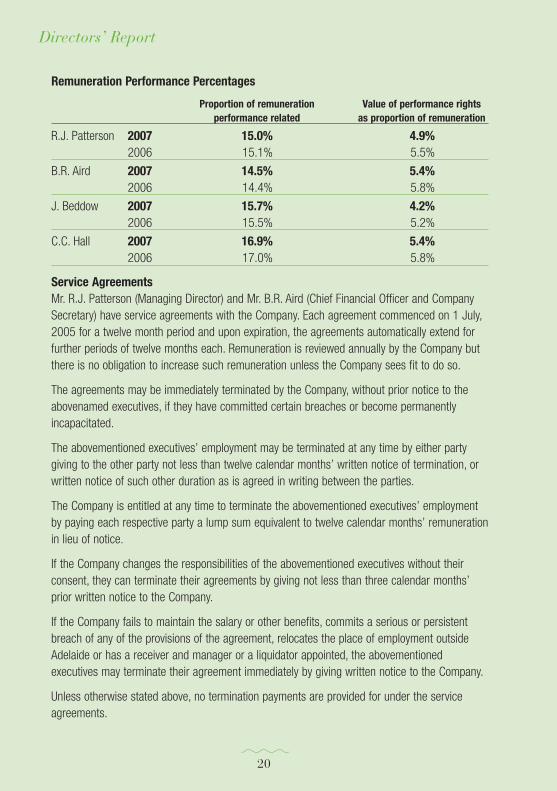
Remuneration Performance Percentages
Proportion of remuneration Value of performance rightsperformance related as proportion of remuneration
R.J. Patterson 2007 15.0% 4.9%2006 15.1% 5.5%
B.R. Aird 2007 14.5% 5.4%2006 14.4% 5.8%
J. Beddow 2007 15.7% 4.2%2006 15.5% 5.2%
C.C. Hall 2007 16.9% 5.4%2006 17.0% 5.8%
Service AgreementsMr. R.J. Patterson (Managing Director) and Mr. B.R. Aird (Chief Financial Officer and CompanySecretary) have service agreements with the Company. Each agreement commenced on 1 July,2005 for a twelve month period and upon expiration, the agreements automatically extend forfurther periods of twelve months each. Remuneration is reviewed annually by the Company butthere is no obligation to increase such remuneration unless the Company sees fit to do so.
The agreements may be immediately terminated by the Company, without prior notice to theabovenamed executives, if they have committed certain breaches or become permanentlyincapacitated.
The abovementioned executives’ employment may be terminated at any time by either partygiving to the other party not less than twelve calendar months’ written notice of termination, orwritten notice of such other duration as is agreed in writing between the parties.
The Company is entitled at any time to terminate the abovementioned executives’ employmentby paying each respective party a lump sum equivalent to twelve calendar months’ remunerationin lieu of notice.
If the Company changes the responsibilities of the abovementioned executives without theirconsent, they can terminate their agreements by giving not less than three calendar months’prior written notice to the Company.
If the Company fails to maintain the salary or other benefits, commits a serious or persistentbreach of any of the provisions of the agreement, relocates the place of employment outsideAdelaide or has a receiver and manager or a liquidator appointed, the abovementionedexecutives may terminate their agreement immediately by giving written notice to the Company.
Unless otherwise stated above, no termination payments are provided for under the serviceagreements.
21
Directors’ Report
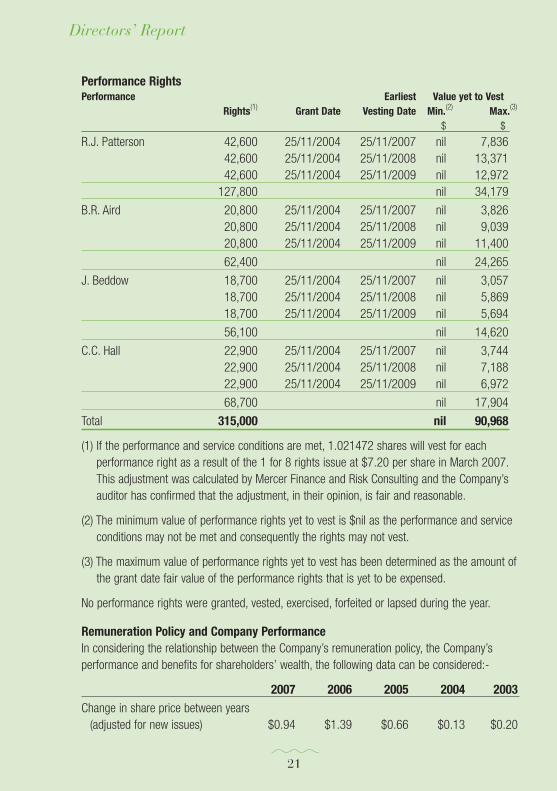
Performance RightsPerformance Earliest Value yet to Vest
Rights(1) Grant Date Vesting Date Min.(2) Max.(3)
$ $
R.J. Patterson 42,600 25/11/2004 25/11/2007 nil 7,83642,600 25/11/2004 25/11/2008 nil 13,37142,600 25/11/2004 25/11/2009 nil 12,972
127,800 nil 34,179
B.R. Aird 20,800 25/11/2004 25/11/2007 nil 3,82620,800 25/11/2004 25/11/2008 nil 9,03920,800 25/11/2004 25/11/2009 nil 11,400
62,400 nil 24,265
J. Beddow 18,700 25/11/2004 25/11/2007 nil 3,05718,700 25/11/2004 25/11/2008 nil 5,86918,700 25/11/2004 25/11/2009 nil 5,694
56,100 nil 14,620
C.C. Hall 22,900 25/11/2004 25/11/2007 nil 3,74422,900 25/11/2004 25/11/2008 nil 7,18822,900 25/11/2004 25/11/2009 nil 6,972
68,700 nil 17,904
Total 315,000 nil 90,968
(1) If the performance and service conditions are met, 1.021472 shares will vest for eachperformance right as a result of the 1 for 8 rights issue at $7.20 per share in March 2007.This adjustment was calculated by Mercer Finance and Risk Consulting and the Company’sauditor has confirmed that the adjustment, in their opinion, is fair and reasonable.
(2) The minimum value of performance rights yet to vest is $nil as the performance and serviceconditions may not be met and consequently the rights may not vest.
(3) The maximum value of performance rights yet to vest has been determined as the amount ofthe grant date fair value of the performance rights that is yet to be expensed.
No performance rights were granted, vested, exercised, forfeited or lapsed during the year.
Remuneration Policy and Company PerformanceIn considering the relationship between the Company’s remuneration policy, the Company’sperformance and benefits for shareholders’ wealth, the following data can be considered:-
2007 2006 2005 2004 2003Change in share price between years
(adjusted for new issues) $0.94 $1.39 $0.66 $0.13 $0.20
22
Directors’ Report
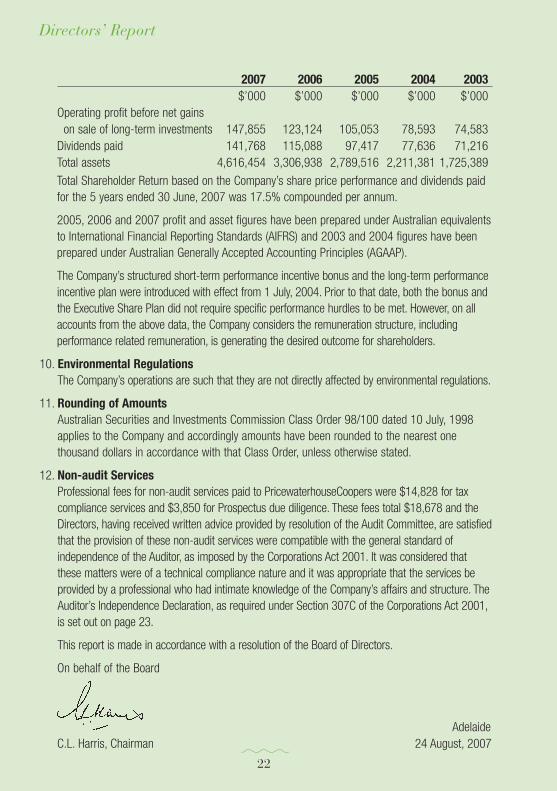
2007 2006 2005 2004 2003$’000 $’000 $’000 $’000 $’000
Operating profit before net gains on sale of long-term investments 147,855 123,124 105,053 78,593 74,583
Dividends paid 141,768 115,088 97,417 77,636 71,216Total assets 4,616,454 3,306,938 2,789,516 2,211,381 1,725,389
Total Shareholder Return based on the Company’s share price performance and dividends paidfor the 5 years ended 30 June, 2007 was 17.5% compounded per annum.
2005, 2006 and 2007 profit and asset figures have been prepared under Australian equivalentsto International Financial Reporting Standards (AIFRS) and 2003 and 2004 figures have beenprepared under Australian Generally Accepted Accounting Principles (AGAAP).
The Company’s structured short-term performance incentive bonus and the long-term performanceincentive plan were introduced with effect from 1 July, 2004. Prior to that date, both the bonus andthe Executive Share Plan did not require specific performance hurdles to be met. However, on allaccounts from the above data, the Company considers the remuneration structure, includingperformance related remuneration, is generating the desired outcome for shareholders.
10. Environmental RegulationsThe Company’s operations are such that they are not directly affected by environmental regulations.
11. Rounding of AmountsAustralian Securities and Investments Commission Class Order 98/100 dated 10 July, 1998applies to the Company and accordingly amounts have been rounded to the nearest onethousand dollars in accordance with that Class Order, unless otherwise stated.
12. Non-audit ServicesProfessional fees for non-audit services paid to PricewaterhouseCoopers were $14,828 for taxcompliance services and $3,850 for Prospectus due diligence. These fees total $18,678 and theDirectors, having received written advice provided by resolution of the Audit Committee, are satisfiedthat the provision of these non-audit services were compatible with the general standard ofindependence of the Auditor, as imposed by the Corporations Act 2001. It was considered thatthese matters were of a technical compliance nature and it was appropriate that the services beprovided by a professional who had intimate knowledge of the Company’s affairs and structure. TheAuditor’s Independence Declaration, as required under Section 307C of the Corporations Act 2001,is set out on page 23.
This report is made in accordance with a resolution of the Board of Directors.
On behalf of the Board
AdelaideC.L. Harris, Chairman 24 August, 2007
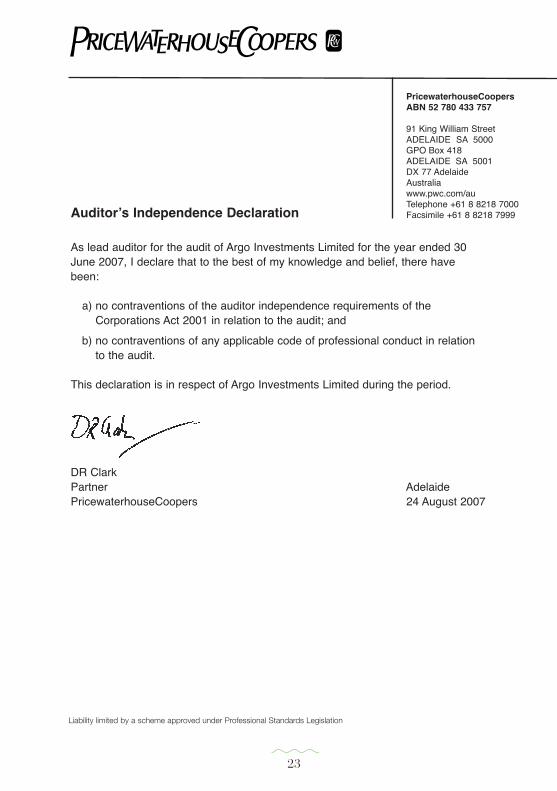
Auditorʼs Independence Declaration
As lead auditor for the audit of Argo Investments Limited for the year ended 30June 2007, I declare that to the best of my knowledge and belief, there havebeen:
a) no contraventions of the auditor independence requirements of theCorporations Act 2001 in relation to the audit; and
b) no contraventions of any applicable code of professional conduct in relationto the audit.
This declaration is in respect of Argo Investments Limited during the period.
DR Clark Partner AdelaidePricewaterhouseCoopers 24 August 2007
23
PricewaterhouseCoopers
ABN 52 780 433 757
91 King William StreetADELAIDE SA 5000GPO Box 418ADELAIDE SA 5001DX 77 AdelaideAustraliawww.pwc.com/auTelephone +61 8 8218 7000Facsimile +61 8 8218 7999
Liability limited by a scheme approved under Professional Standards Legislation
24
Corporate governance
Our experienced Board of Directors and senior executives are committed to responsible financial and businesspractices to protect and advanceshareholders’ interests. Consistent with this aim, the Company has followedthe principles and best practicerecommendations established by the ASX Corporate Governance Council.
The Board has adopted these ASX principlesand recommendations, however it believes thatthese rules and regulations are of limited valueunless supported by a foundation of honestyand integrity.
Charters and policies referred to in thisStatement are available on request or can be found in the corporate governance section of the Company’s internet site atwww.argoinvestments.com.au
The Board’s primary role is to ensure the long-term health and prosperity of the Companywhich is accomplished by:-
~ setting objectives, goals and strategicdirection for management with a view tomaximising shareholder value.
~ adopting an annual budget and monitoringfinancial performance.
~ ensuring adequate internal controls exist andare appropriately monitored for compliance.
~ ensuring significant business risks areidentified and appropriately managed.
~ approving the interim and final financialstatements and related reports and othercommunications to the ASX andshareholders.
~ appointing the Managing Director andreviewing his performance.
~ setting appropriate business standards andcode for ethical behaviour.
The Board currently comprises the ManagingDirector and five non-executive Directors ofwhom four are independent as defined by theASX Corporate Governance Council’sprinciples. It is the policy of the Board thatthere be a majority of non-executive,independent Directors and that there be aseparation of the roles of Chairman andManaging Director. Information about theDirectors and Board Committees, as requiredby the ASX Corporate Governance Council’sprinciples, is contained in the relevant sectionsof the Directors’ Report.
The composition of the Board is monitored bythe Nomination and Remuneration Committeeto ensure that the Board has a balance of skilland experience appropriate to the needs of theCompany.
Directors (other than the Managing Director)are elected by shareholders and, inaccordance with the provisions of theConstitution, no Director holds office for aperiod longer than three years withoutstanding for re-election by the shareholders.
In June each year, every Director is providedwith and completes an evaluation form inrelation to the performance of the Board. Theevaluation form addresses all key aspects ofthe Board’s operations.
The Chairman meets individually with eachDirector on an annual basis to review theirperformance and give Directors the opportunity
25
Corporate governance
to raise any particular concerns or issues notaddressed by the review of the Board as awhole.
The evaluation of the Chairman’s performanceis made by each Director on an annual basis,with the responses collated by the Chairman of the Corporate Governance Committee whoreviews the Chairman’s performance.
Managing Business RiskThe Board monitors the business risk andguides the affairs of the Company in thedischarge of its stewardship responsibilities.Responsibility for managing and progressingthe profitable operation and development ofthe Company, consistent with the directionsand standards set by the Board, is delegatedto the Managing Director, who is accountableand reports to the Board.
The Board also delegates some of its functionsto Board Committees, which are accountableto the Board.
Matters which are not covered by delegationsrequire Board approval. Such matters includethe prior approval of investment transactionsand scrip lending exposures above delegatedlevels.
The monthly Board reports advise the Board ofcurrent and forthcoming issues relevant to theCompany’s operations and performance. Inaddition to the monthly Board consideration ofthe investment portfolio, there is in each sixmonths a formal Board review of theinvestment portfolio with the investment andanalytical executives of the Company inattendance.
Audit CommitteeThe Audit Committee of the Board, comprisingthree non-executive Directors of whom two areindependent as defined by the ASX CorporateGovernance Council’s principles, works todefined terms of reference in compliance withall the regulatory requirements. The externalaudit firm partner responsible for the Companyaudit attends meetings by invitation. TheCommittee formally reports to the Board aftereach of its meetings.
The Committee primarily provides assistanceto the Board in fulfilling its responsibilities inrelation to the Company’s financial reporting,internal control structure, risk managementsystems and the external audit functions.The process for approval of the financialstatements involves the sign-offs by variouslevels of senior management, including theManaging Director. The Company’s externalaudit is undertaken byPricewaterhouseCoopers and the auditengagement partner is required to be changedat regular intervals.
Derek Clark, a partner ofPricewaterhouseCoopers, is the partnerresponsible for the external audit of theCompany for the 2007 financial year.
Nomination and Remuneration CommitteeThe Nomination and Remuneration Committeecomprises three non-executive Directors. It isresponsible for the evaluation of the Board toensure that it comprises individuals who arebest able to discharge the duties of Directorshaving regard to complementary skills,experience and qualifications together withhigh standards of corporate governance. It also
26
Corporate governance
reviews and advises the Board onremuneration for the non-executive Directors,the Managing Director and the seniorexecutives. The Committee assesses theappropriateness of the nature and amount ofremuneration of such officers on a periodicbasis by reference to relevant employmentmarket conditions with the overall objective ofensuring maximum shareholder benefit fromthe retention of a high quality Board andexecutive team.
To assist in achieving these objectives, theCompany’s remuneration policy links thenature and amount of the Managing Director’sand senior executives’ remuneration to theCompany’s financial and operationalperformance. The Company’s remunerationpolicy, its relationship with Companyperformance and the details of theremuneration of each Director and seniorexecutive can be found in the RemunerationReport which forms part of the Directors’Report, commencing on page 12. There areonly three current senior executives for whichthis disclosure is required.
Directors’ ShareholdingsDirectors are not required to hold a minimumnumber of shares pursuant to the Company’sConstitution. However, their current relevantinterests in the Company’s shares are shownin the Directors’ Report on page 11.
The Board has adopted a policy for dealings inthe Company’s shares by Directors, officersand designated employees and entitiescontrolled by them. On the basis that they arenot in possession of price sensitive confidentialinformation which is not generally available,the policy permits the purchase or sale of
shares in the Company in the followingperiods:-
(a) a period of six weeks commencing on theday following the announcement of thehalf-yearly results;
(b) a period of six weeks commencing on theday following the announcement of theannual results; and
(c) a period of six weeks commencing on theday following the Annual General Meeting.
A Director or an entity controlled by a Directoris not permitted to purchase or sell shares inthe Company at other times without priorconsent of the Board.
Officers and designated employees are notpermitted to purchase or sell shares in theCompany at other times without the priorconsent of the Company Secretary (or in thecase of intended dealing by the CompanySecretary, the Chairman).
This policy does not preclude a Director, officeror designated employee or an entity controlledby them from taking up or renouncing anentitlement to the Company’s shares orparticipating in the Company’s Share PurchasePlan or Dividend Reinvestment Plan.
Conflict of InterestDirectors are required to disclose to the Boarddetails of transactions which may create aconflict of interest.
IndemnitiesIn accordance with the Company’s Constitutionand as approved by shareholders, eachDirector and officer is indemnified to the extentpermitted by law.
27
Corporate governance
Directors and officers of the Company arecovered by insurance against certain liabilitiesthey may incur in carrying out their duties forthe Company.
Each Director has the right to seekindependent professional advice at theCompany’s expense. However, prior approval of the Chairman is required, which is not to be unreasonably withheld.
Shareholder CommunicationThe Company has an obligation under the ASXListing Rules and aims to keep shareholdersinformed of the Company’s performance andall major developments on an ongoing basis.Information is communicated to shareholdersthrough:-
~ the Annual Report which is distributed to allshareholders (unless specifically requestedotherwise);
~ a letter providing details of the half-yearlyresult;
~ the Owner’s Manual and website; and
~ other correspondence regarding mattersimpacting on shareholders as required.
All documents that are released publicly aremade available on the Company’s internet site.
Shareholders are also encouraged toparticipate in the Annual General Meeting toensure a high level of accountability andidentification with the Company’s strategiesand goals. Important issues are presented toshareholders as single resolutions. Shareholderinformation meetings are also held each yearfollowing the Annual General Meeting, in bothSydney and Melbourne, providing an informal
forum where shareholders are given theopportunity to raise questions and participatein general discussion about the Company.
Corporate Governance CommitteeThe Corporate Governance Committeecomprises three non-executive Directors.
The Board believes the Company engages insound corporate governance practices whichhave regard to the ASX Corporate GovernanceCouncil’s Principles of Good CorporateGovernance and Best PracticeRecommendations. The Corporate GovernanceCommittee makes recommendations to the Board where it considers there areopportunities for the further enhancement of its corporate governance procedures.
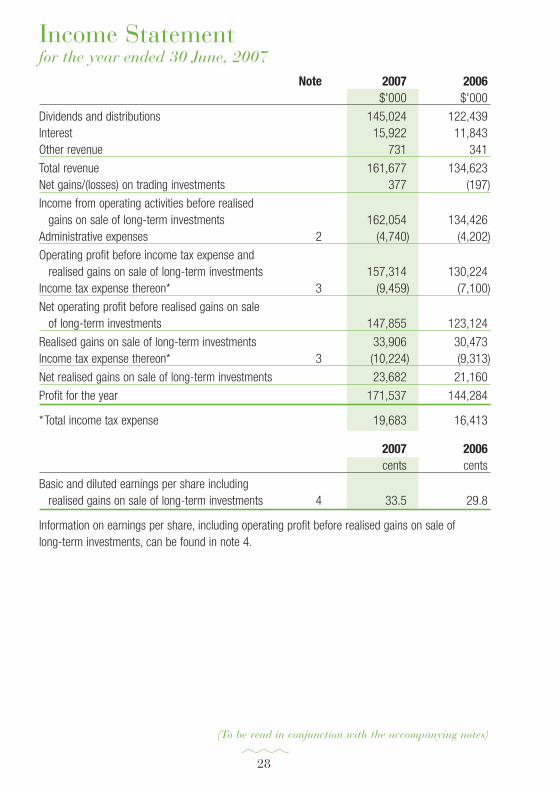
Income Statementfor the year ended 30 June, 2007
(To be read in conjunction with the accompanying notes)
28
Note 2007 2006$'000 $'000
Dividends and distributions 145,024 122,439Interest 15,922 11,843Other revenue 731 341
Total revenue 161,677 134,623Net gains/(losses) on trading investments 377 (197)
Income from operating activities before realised gains on sale of long-term investments 162,054 134,426
Administrative expenses 2 (4,740) (4,202)
Operating profit before income tax expense and realised gains on sale of long-term investments 157,314 130,224
Income tax expense thereon* 3 (9,459) (7,100)
Net operating profit before realised gains on sale of long-term investments 147,855 123,124
Realised gains on sale of long-term investments 33,906 30,473Income tax expense thereon* 3 (10,224) (9,313)
Net realised gains on sale of long-term investments 23,682 21,160
Profit for the year 171,537 144,284
*Total income tax expense 19,683 16,413
2007 2006cents cents
Basic and diluted earnings per share including realised gains on sale of long-term investments 4 33.5 29.8
Information on earnings per share, including operating profit before realised gains on sale of long-term investments, can be found in note 4.
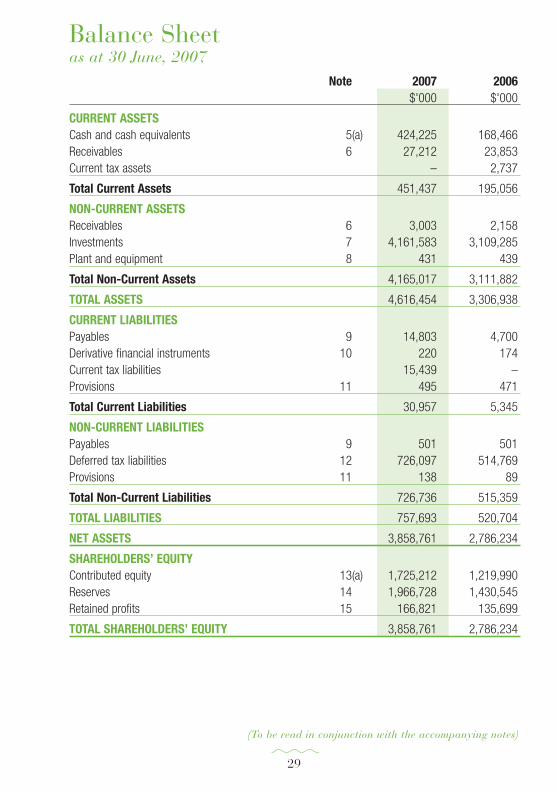
Balance Sheetas at 30 June, 2007
Note 2007 2006$'000 $'000
CURRENT ASSETSCash and cash equivalents 5(a) 424,225 168,466Receivables 6 27,212 23,853Current tax assets – 2,737
Total Current Assets 451,437 195,056
NON-CURRENT ASSETSReceivables 6 3,003 2,158Investments 7 4,161,583 3,109,285Plant and equipment 8 431 439
Total Non-Current Assets 4,165,017 3,111,882
TOTAL ASSETS 4,616,454 3,306,938
CURRENT LIABILITIESPayables 9 14,803 4,700Derivative financial instruments 10 220 174Current tax liabilities 15,439 –Provisions 11 495 471
Total Current Liabilities 30,957 5,345
NON-CURRENT LIABILITIESPayables 9 501 501Deferred tax liabilities 12 726,097 514,769Provisions 11 138 89
Total Non-Current Liabilities 726,736 515,359
TOTAL LIABILITIES 757,693 520,704
NET ASSETS 3,858,761 2,786,234
SHAREHOLDERS’ EQUITYContributed equity 13(a) 1,725,212 1,219,990Reserves 14 1,966,728 1,430,545Retained profits 15 166,821 135,699
TOTAL SHAREHOLDERS’ EQUITY 3,858,761 2,786,234
(To be read in conjunction with the accompanying notes)
29
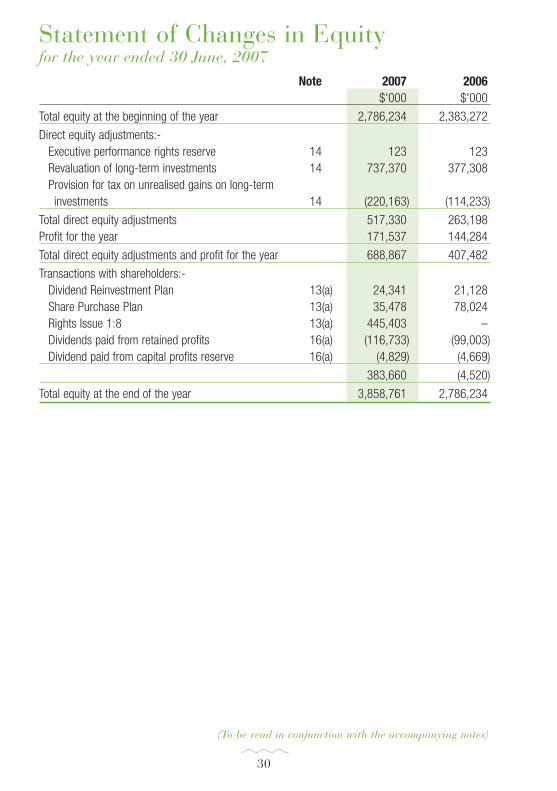
Statement of Changes in Equityfor the year ended 30 June, 2007
(To be read in conjunction with the accompanying notes)
30
Note 2007 2006$'000 $'000
Total equity at the beginning of the year 2,786,234 2,383,272
Direct equity adjustments:-Executive performance rights reserve 14 123 123Revaluation of long-term investments 14 737,370 377,308Provision for tax on unrealised gains on long-terminvestments 14 (220,163) (114,233)
Total direct equity adjustments 517,330 263,198Profit for the year 171,537 144,284
Total direct equity adjustments and profit for the year 688,867 407,482
Transactions with shareholders:-Dividend Reinvestment Plan 13(a) 24,341 21,128Share Purchase Plan 13(a) 35,478 78,024Rights Issue 1:8 13(a) 445,403 –Dividends paid from retained profits 16(a) (116,733) (99,003)Dividend paid from capital profits reserve 16(a) (4,829) (4,669)
383,660 (4,520)
Total equity at the end of the year 3,858,761 2,786,234
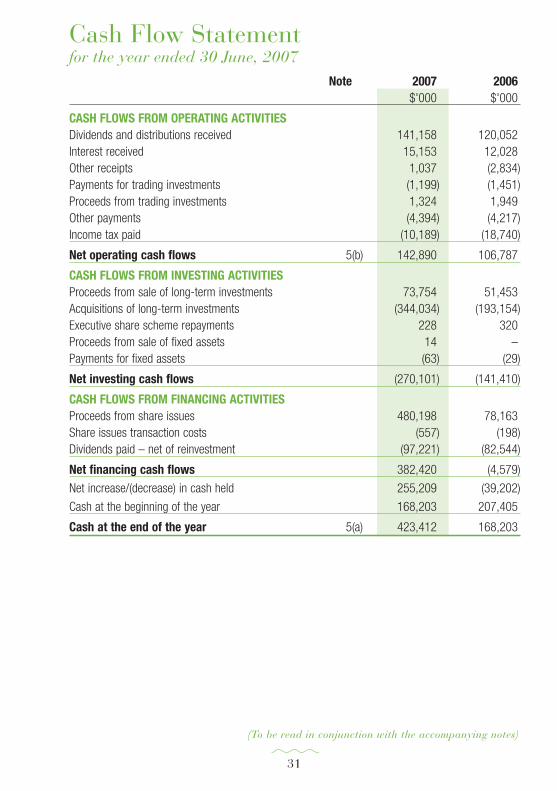
Cash Flow Statementfor the year ended 30 June, 2007
Note 2007 2006$'000 $'000
CASH FLOWS FROM OPERATING ACTIVITIESDividends and distributions received 141,158 120,052Interest received 15,153 12,028Other receipts 1,037 (2,834)Payments for trading investments (1,199) (1,451)Proceeds from trading investments 1,324 1,949Other payments (4,394) (4,217)Income tax paid (10,189) (18,740)
Net operating cash flows 5(b) 142,890 106,787
CASH FLOWS FROM INVESTING ACTIVITIESProceeds from sale of long-term investments 73,754 51,453Acquisitions of long-term investments (344,034) (193,154)Executive share scheme repayments 228 320Proceeds from sale of fixed assets 14 –Payments for fixed assets (63) (29)
Net investing cash flows (270,101) (141,410)
CASH FLOWS FROM FINANCING ACTIVITIESProceeds from share issues 480,198 78,163Share issues transaction costs (557) (198)Dividends paid – net of reinvestment (97,221) (82,544)
Net financing cash flows 382,420 (4,579)
Net increase/(decrease) in cash held 255,209 (39,202)
Cash at the beginning of the year 168,203 207,405
Cash at the end of the year 5(a) 423,412 168,203
(To be read in conjunction with the accompanying notes)
31
Notes to the Financial Statementsfor the year ended 30 June, 20071. STATEMENT OF SIGNIFICANT ACCOUNTING POLICIES
The significant accounting policies which have been adopted in the preparation of this financialreport are set out below. The policies have been consistently applied to all the years presented,unless otherwise stated.
(a) Basis of PreparationThis general purpose financial report has been prepared in accordance with AustralianAccounting Standards, other authoritative pronouncements of the Australian AccountingStandards Board, Urgent Issues Group Interpretations and the Corporations Act 2001.Australian Accounting Standards include Australian equivalents to International FinancialReporting Standards (AIFRS) and compliance with AIFRS ensures that the financialstatements and notes comply with International Financial Reporting Standards (IFRS).
These financial statements have been prepared using the conventional historical cost basisexcept for the fair value accounting of investments detailed in note 1(b)(2) and exchangetraded options in note 1(c).
Where necessary, the comparative figures have been adjusted to conform with the currentyear.
(b) Investments(1) Classification
Purchases and sales of investments are recognised on trade-date being the date theCompany commits to purchase or sell the asset.
Current AssetsInvestments classified as Current Assets comprise holdings of trading securities andare categorised as financial assets measured at fair value through the profit and loss.Investments are initially recognised at fair value and transaction costs are expensed.An investment is classified in this category if acquired principally for the purpose ofselling in the short-term.
Non-Current AssetsInvestments classified as Non-Current Assets comprise holdings of long-termsecurities and are categorised as available-for-sale financial assets. Investments areinitially recognised at fair value plus transaction costs.
(2) Valuation of InvestmentsTrading securities and long-term securities are continuously carried at fair value.
Securities which are not listed on a securities exchange are valued using appropriatevaluation techniques as reasonably determined by the Directors.
32
Notes to the Financial Statements for the year ended 30 June, 2007
(3) Gains and Losses on Investments
Current AssetsUnrealised gains and losses arising from changes in the fair value of the tradinginvestments are included in the Income Statement in the period in which they arise.
Realised gains and losses from the sale of trading investments are included in theIncome Statement in the period in which they arise.
Non-Current AssetsUnrealised gains and losses arising from changes in the fair value of long-terminvestments are recognised in equity in the investment revaluation reserve.
When long-term investments are sold or impaired, the realised gains and losses onthe sale or impairment of long-term investments are recorded in the IncomeStatement. Long-term investments are considered to have been sold when contractualrights to the investment expire or contractual rights to receive cash flows have beentransferred and substantially all the risk and rewards of ownership have not beenretained. The cumulative gain or loss, net of tax, is then transferred from retainedprofits to the capital profits reserve.
(4) Securities LendingThe Company earns income from lending various investment holdings in accordancewith securities lending agreements.
Where investments have been lent at balance date, the relevant investments are notphysically held by the Company but the investments are still recorded in theCompany’s Balance Sheet. The Company holds as collateral sufficient cash in a trustaccount to secure the borrower’s obligation to return an equivalent parcel ofinvestments to those which were lent.
(c) Exchange Traded OptionsThe Company sells Australian Securities Exchange traded options to earn income. Wherethe Company sells a call option, it is obligated to deliver securities at an agreed price if theholder exercises the option. Where the Company sells a put option, it is obligated topurchase securities at an agreed price if the holder exercises the option.
The premium received for selling options is not brought to account as revenue but isrecognised in the Balance Sheet as a liability. When the option expires, is exercised or isrepurchased from the holder, the premium received is brought to account and is included innet gains on trading investments in the Income Statement.
Open option positions at balance date are carried at their fair market price and unrealisedgains and losses are included in the Income Statement.
33
Notes to the Financial Statements for the year ended 30 June, 2007
(d) Bills of ExchangeBills of exchange and investment grade promissory notes, which have been purchased inthe market at a discount to face value, are deemed to be held-to-maturity investmentswhich are measured at amortised cost using the effective interest method.
(e) RevenueRevenue is recognised when the right to receive payment is established.
(f) Plant and EquipmentItems of plant, equipment and vehicles are depreciated over their estimated useful lives tothe Company using the straight line method of deprecation at rates ranging from 7.5% to33.3%.
(g) Income TaxThe income tax expense is the tax payable on the current year’s taxable income based onthe company tax rate adjusted by changes in deferred tax assets and liabilities attributableto temporary differences between the tax bases of assets and liabilities and their carryingamounts in the financial statements, and to unused tax losses.
Deferred tax assets are recognised for deductible temporary differences and unused taxlosses only if it is probable that future taxable amounts will be available to utilise thosetemporary differences and losses.
Deferred tax assets and liabilities are offset when there is a legally enforceable right tooffset current tax assets and liabilities.
Deferred tax assets and liabilities are recognised for temporary differences at the tax ratesexpected to apply when the assets are recovered or liabilities are settled, based on thosetax rates which are enacted or substantively enacted. The relevant tax rates are applied tothe cumulative amounts of deductible and taxable temporary differences to measure thedeferred tax asset or liability. An exception is made for certain temporary differences arisingfrom the initial recognition of an asset or a liability. No deferred tax asset or liability isrecognised in relation to these temporary differences if they arose in a transaction, otherthan a business combination, that at the time of the transaction did not affect eitheraccounting profit or taxable profit or loss.
Current and deferred tax balances attributable to revaluation amounts recognised directly inequity through the investment revaluation reserve are also recognised directly in equitythrough the investment revaluation reserve. The revaluation of investments is net of tax onunrealised capital gains by recognising a deferred tax liability. Where the Company disposesof securities in the investment portfolio, tax is calculated on the net gains made accordingto the particular parcels allocated to the sale for tax purposes, offset against any capitallosses carried forward. The tax recognised directly in equity is then transferred to the
34
Notes to the Financial Statements for the year ended 30 June, 2007
Income Statement as income tax expense. The associated deferred tax liability is similarlyadjusted and transferred to tax payable.
(h) Employee EntitlementsProvision is made for benefits accruing to employees in respect of wages, salaries, annualleave and long service leave (based on wage rates expected at the time of settling theliability) when it is probable that settlement will be required and they are capable of beingreliably measured.
(i) Argo Executive Performance Rights PlanThe share based performance rights are required to be measured at fair value, andrecorded as an expense on a straight line basis over the period between grant date and theexpected date that the rights will vest. The fair value of the performance rights is calculatedusing the Monte-Carlo model.
(j) Executive Share Plan LoansThe interest free loans issued to executives pursuant to the Argo Investments Executive SharePlan are recognised initially at fair value and subsequently measured at amortised cost.
(k) ReceivablesReceivables include dividends, distributions and securities sold where settlement has notoccurred at the end of the reporting period. Amounts are generally received within 30 daysof recognition.
(l) PayablesPayables include liabilities for goods and services provided to the Company and forsecurities purchased where settlement has not occurred at the end of the reporting period.Amounts are usually paid within 30 days of recognition.
(m) Operating LeasesPayments made under operating leases are accounted for on a straight-line basis over theperiod of the lease.
(n) Cash and Cash EquivalentsFor the purposes of the Cash Flow Statement, cash and cash equivalents include depositsheld at call with financial institutions, other short-term, highly liquid investments withmaturities of three months or less that are readily convertible to known amounts of cashand which are subject to an insignificant risk of changes in value, and bank overdrafts.
(o) Earnings per ShareBasic earnings per share including realised gains on the sale of long-term investments iscalculated by dividing the profit for the year by the weighted average number of ordinaryshares outstanding during the period.
35
Notes to the Financial Statements for the year ended 30 June, 2007
Basic operating earnings per share excluding realised gains on the sale of long-terminvestments is calculated by dividing operating profit before realised gains on the sale oflong-term investments by the weighted average number of ordinary shares outstandingduring the period.
If applicable, diluted earnings per share adjusts the figures used in determination of basicearnings per share to take into account the after income tax effect of interest and otherfinancing costs associated with dilutive potential ordinary shares and the weighted averagenumber of shares assumed to have been issued for no consideration in relation to dilutivepotential ordinary shares.
(p) Contributed EquityOrdinary shares are classified as equity. Incremental costs directly attributable to the issueof new shares are shown in equity as a deduction, net of tax, from the proceeds.
(q) Provision for DividendA provision for dividend is only made for any amount of any dividend declared by theDirectors on or before the end of the financial year but not distributed at balance date.
(r) Rounding of AmountsAustralian Securities and Investments Commission Class Order 98/100 dated 10 July,1998 applies to the Company and accordingly amounts have been rounded to the nearestone thousand dollars in accordance with that Class Order, unless otherwise stated.
(s) New Accounting StandardsCertain new Accounting Standards and UIG interpretations have been published that are notmandatory for the 30 June, 2007 reporting period. The Company’s assessment of theimpact of these new standards and interpretations is set out below.
Accounting Standard AASB 7 “Financial Instruments: Disclosures” will apply for annualreporting periods beginning on or after 1 January, 2007 and the Company has not adoptedthis standard early. Application of the standard will not affect any of the amountsrecognised in the financial statements, but will impact the type of information disclosed inrelation to the Company’s financial instruments.
All other inoperative Accounting Standards and UIG interpretations have been assessed andthe impact on the Company’s financial statements when they become operative is notexpected to be material.
(t) Critical Accounting Estimates and JudgementsThere are no key assumptions or sources of estimation uncertainty that have a risk ofcausing a material adjustment to the carrying amounts of assets and liabilities within thenext reporting period.
36
Notes to the Financial Statements for the year ended 30 June, 2007
37
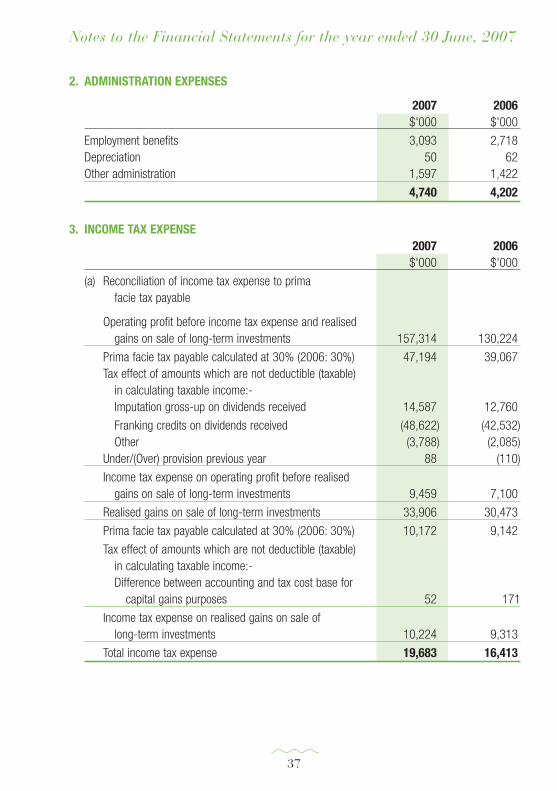
2. ADMINISTRATION EXPENSES
2007 2006$'000 $'000
Employment benefits 3,093 2,718Depreciation 50 62Other administration 1,597 1,422
4,740 4,202
3. INCOME TAX EXPENSE2007 2006$'000 $'000
(a) Reconciliation of income tax expense to prima facie tax payable
Operating profit before income tax expense and realisedgains on sale of long-term investments 157,314 130,224
Prima facie tax payable calculated at 30% (2006: 30%) 47,194 39,067Tax effect of amounts which are not deductible (taxable)
in calculating taxable income:-Imputation gross-up on dividends received 14,587 12,760
Franking credits on dividends received (48,622) (42,532)Other (3,788) (2,085)
Under/(Over) provision previous year 88 (110)
Income tax expense on operating profit before realisedgains on sale of long-term investments 9,459 7,100
Realised gains on sale of long-term investments 33,906 30,473
Prima facie tax payable calculated at 30% (2006: 30%) 10,172 9,142
Tax effect of amounts which are not deductible (taxable)in calculating taxable income:-Difference between accounting and tax cost base for
capital gains purposes 52 171
Income tax expense on realised gains on sale oflong-term investments 10,224 9,313
Total income tax expense 19,683 16,413
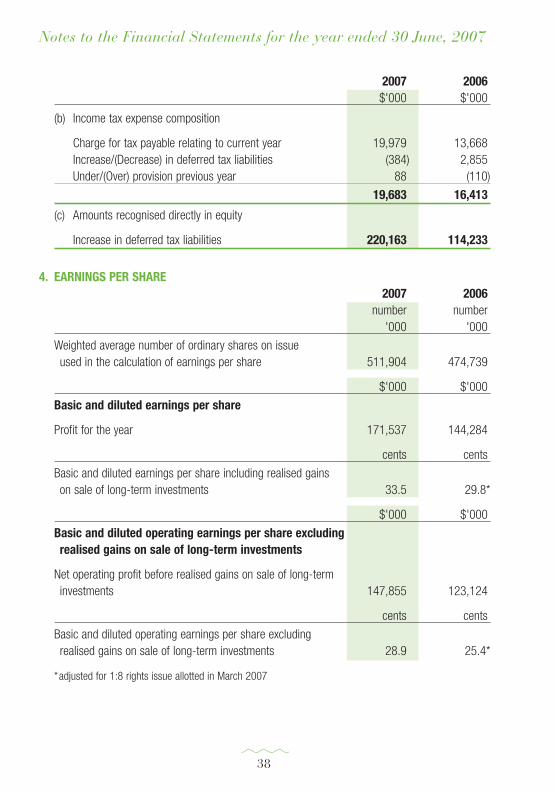
Notes to the Financial Statements for the year ended 30 June, 2007
38
2007 2006$'000 $'000
(b) Income tax expense composition
Charge for tax payable relating to current year 19,979 13,668Increase/(Decrease) in deferred tax liabilities (384) 2,855Under/(Over) provision previous year 88 (110)
19,683 16,413
(c) Amounts recognised directly in equity
Increase in deferred tax liabilities 220,163 114,233
4. EARNINGS PER SHARE2007 2006
number number'000 '000
Weighted average number of ordinary shares on issue used in the calculation of earnings per share 511,904 474,739
$'000 $'000
Basic and diluted earnings per share
Profit for the year 171,537 144,284
cents cents
Basic and diluted earnings per share including realised gains on sale of long-term investments 33.5 29.8*
$'000 $'000
Basic and diluted operating earnings per share excluding realised gains on sale of long-term investments
Net operating profit before realised gains on sale of long-terminvestments 147,855 123,124
cents cents
Basic and diluted operating earnings per share excluding realised gains on sale of long-term investments 28.9 25.4*
*adjusted for 1:8 rights issue allotted in March 2007
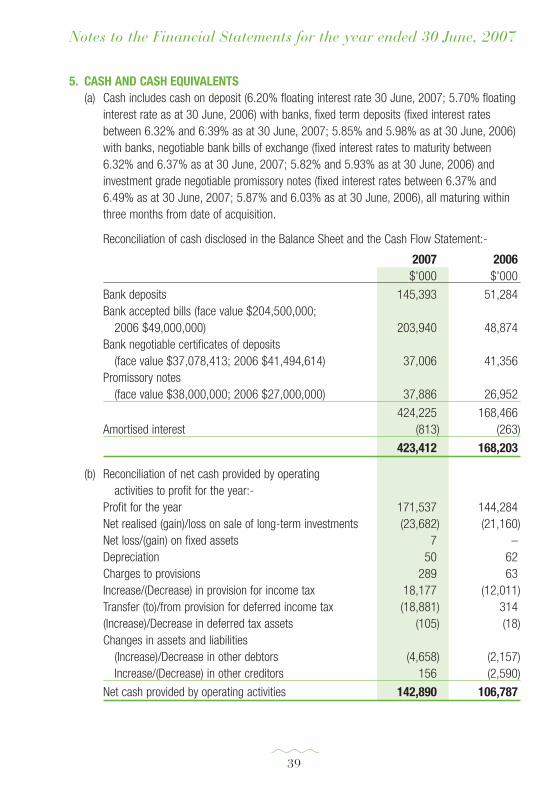
Notes to the Financial Statements for the year ended 30 June, 2007
39
5. CASH AND CASH EQUIVALENTS(a) Cash includes cash on deposit (6.20% floating interest rate 30 June, 2007; 5.70% floating
interest rate as at 30 June, 2006) with banks, fixed term deposits (fixed interest ratesbetween 6.32% and 6.39% as at 30 June, 2007; 5.85% and 5.98% as at 30 June, 2006)with banks, negotiable bank bills of exchange (fixed interest rates to maturity between6.32% and 6.37% as at 30 June, 2007; 5.82% and 5.93% as at 30 June, 2006) andinvestment grade negotiable promissory notes (fixed interest rates between 6.37% and6.49% as at 30 June, 2007; 5.87% and 6.03% as at 30 June, 2006), all maturing withinthree months from date of acquisition.
Reconciliation of cash disclosed in the Balance Sheet and the Cash Flow Statement:-
2007 2006$'000 $'000
Bank deposits 145,393 51,284Bank accepted bills (face value $204,500,000;
2006 $49,000,000) 203,940 48,874Bank negotiable certificates of deposits
(face value $37,078,413; 2006 $41,494,614) 37,006 41,356Promissory notes
(face value $38,000,000; 2006 $27,000,000) 37,886 26,952
424,225 168,466Amortised interest (813) (263)
423,412 168,203
(b) Reconciliation of net cash provided by operating activities to profit for the year:-
Profit for the year 171,537 144,284Net realised (gain)/loss on sale of long-term investments (23,682) (21,160)Net loss/(gain) on fixed assets 7 –Depreciation 50 62Charges to provisions 289 63Increase/(Decrease) in provision for income tax 18,177 (12,011)Transfer (to)/from provision for deferred income tax (18,881) 314(Increase)/Decrease in deferred tax assets (105) (18)Changes in assets and liabilities
(Increase)/Decrease in other debtors (4,658) (2,157)Increase/(Decrease) in other creditors 156 (2,590)
Net cash provided by operating activities 142,890 106,787
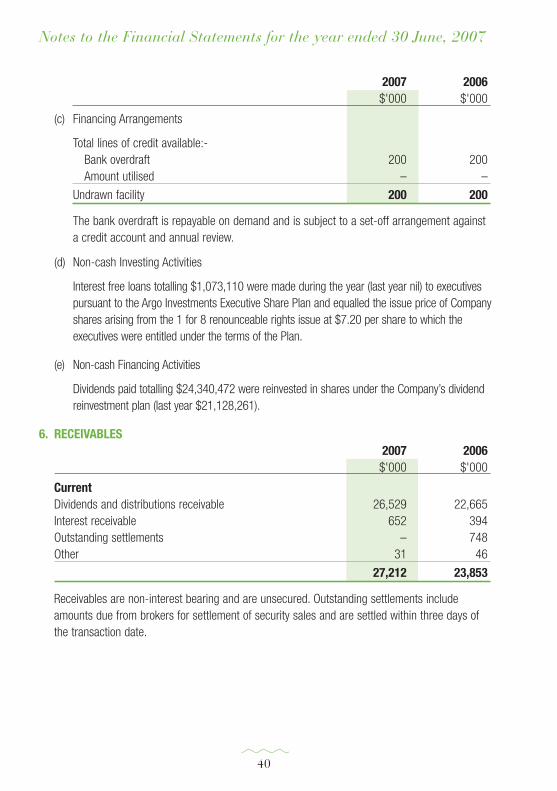
Notes to the Financial Statements for the year ended 30 June, 2007
40
2007 2006$'000 $'000
(c) Financing Arrangements
Total lines of credit available:-Bank overdraft 200 200Amount utilised – –
Undrawn facility 200 200
The bank overdraft is repayable on demand and is subject to a set-off arrangement againsta credit account and annual review.
(d) Non-cash Investing Activities
Interest free loans totalling $1,073,110 were made during the year (last year nil) to executivespursuant to the Argo Investments Executive Share Plan and equalled the issue price of Companyshares arising from the 1 for 8 renounceable rights issue at $7.20 per share to which theexecutives were entitled under the terms of the Plan.
(e) Non-cash Financing Activities
Dividends paid totalling $24,340,472 were reinvested in shares under the Company’s dividendreinvestment plan (last year $21,128,261).
6. RECEIVABLES2007 2006
$'000 $'000
CurrentDividends and distributions receivable 26,529 22,665Interest receivable 652 394Outstanding settlements – 748Other 31 46
27,212 23,853
Receivables are non-interest bearing and are unsecured. Outstanding settlements includeamounts due from brokers for settlement of security sales and are settled within three days ofthe transaction date.
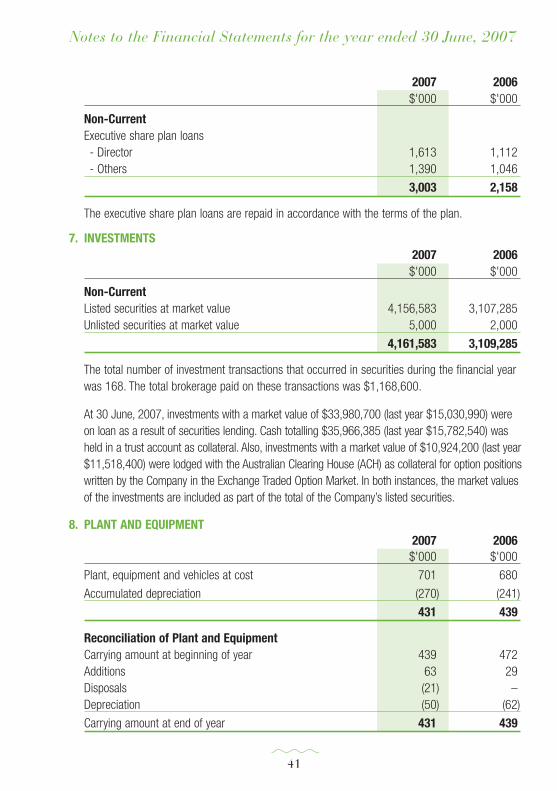
Notes to the Financial Statements for the year ended 30 June, 2007
41
2007 2006$'000 $'000
Non-CurrentExecutive share plan loans- Director 1,613 1,112- Others 1,390 1,046
3,003 2,158
The executive share plan loans are repaid in accordance with the terms of the plan.
7. INVESTMENTS2007 2006$'000 $'000
Non-CurrentListed securities at market value 4,156,583 3,107,285Unlisted securities at market value 5,000 2,000
4,161,583 3,109,285
The total number of investment transactions that occurred in securities during the financial yearwas 168. The total brokerage paid on these transactions was $1,168,600.
At 30 June, 2007, investments with a market value of $33,980,700 (last year $15,030,990) wereon loan as a result of securities lending. Cash totalling $35,966,385 (last year $15,782,540) washeld in a trust account as collateral. Also, investments with a market value of $10,924,200 (last year$11,518,400) were lodged with the Australian Clearing House (ACH) as collateral for option positionswritten by the Company in the Exchange Traded Option Market. In both instances, the market valuesof the investments are included as part of the total of the Company’s listed securities.
8. PLANT AND EQUIPMENT2007 2006
$'000 $'000
Plant, equipment and vehicles at cost 701 680
Accumulated depreciation (270) (241)
431 439
Reconciliation of Plant and EquipmentCarrying amount at beginning of year 439 472Additions 63 29Disposals (21) –Depreciation (50) (62)
Carrying amount at end of year 431 439
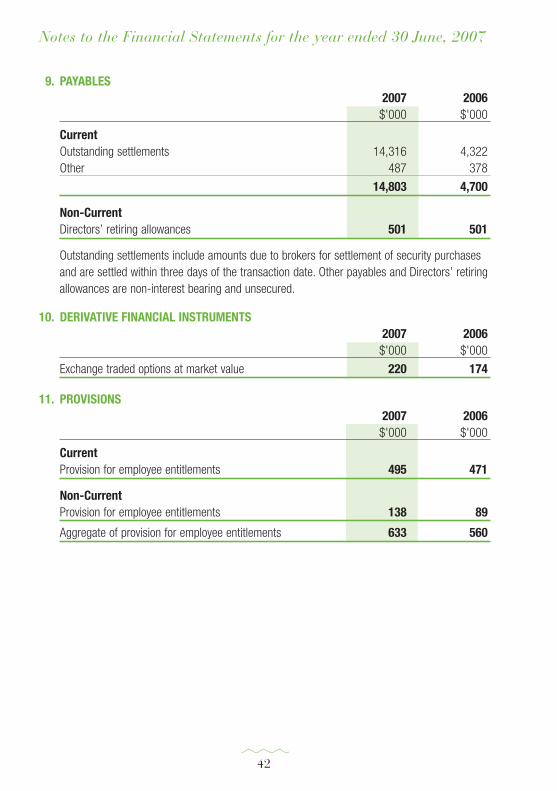
Notes to the Financial Statements for the year ended 30 June, 2007
42
9. PAYABLES2007 2006$'000 $'000
CurrentOutstanding settlements 14,316 4,322Other 487 378
14,803 4,700
Non-CurrentDirectors’ retiring allowances 501 501
Outstanding settlements include amounts due to brokers for settlement of security purchasesand are settled within three days of the transaction date. Other payables and Directors’ retiringallowances are non-interest bearing and unsecured.
10. DERIVATIVE FINANCIAL INSTRUMENTS2007 2006
$'000 $'000
Exchange traded options at market value 220 174
11. PROVISIONS2007 2006$'000 $'000
CurrentProvision for employee entitlements 495 471
Non-CurrentProvision for employee entitlements 138 89
Aggregate of provision for employee entitlements 633 560
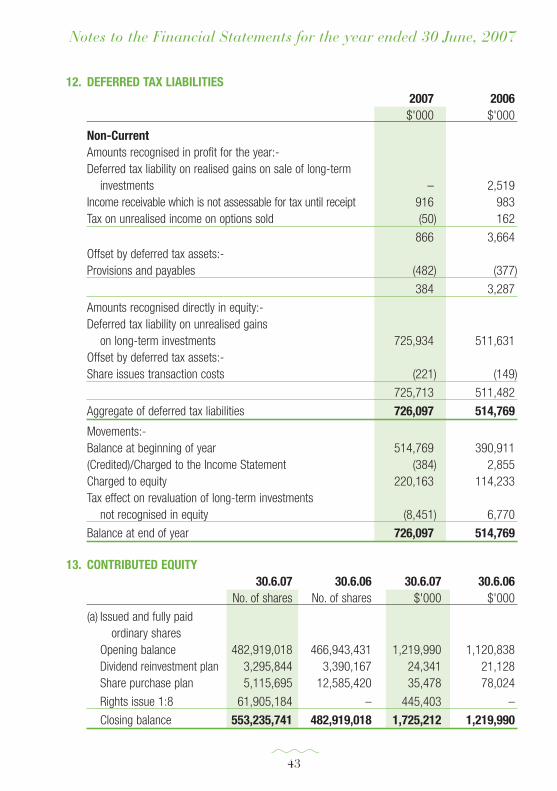
Notes to the Financial Statements for the year ended 30 June, 2007
43
12. DEFERRED TAX LIABILITIES2007 2006
$'000 $'000
Non-CurrentAmounts recognised in profit for the year:-Deferred tax liability on realised gains on sale of long-term
investments – 2,519Income receivable which is not assessable for tax until receipt 916 983Tax on unrealised income on options sold (50) 162
866 3,664Offset by deferred tax assets:-Provisions and payables (482) (377)
384 3,287
Amounts recognised directly in equity:-Deferred tax liability on unrealised gains
on long-term investments 725,934 511,631Offset by deferred tax assets:-Share issues transaction costs (221) (149)
725,713 511,482
Aggregate of deferred tax liabilities 726,097 514,769
Movements:-Balance at beginning of year 514,769 390,911(Credited)/Charged to the Income Statement (384) 2,855Charged to equity 220,163 114,233Tax effect on revaluation of long-term investments
not recognised in equity (8,451) 6,770
Balance at end of year 726,097 514,769
13. CONTRIBUTED EQUITY30.6.07 30.6.06 30.6.07 30.6.06
No. of shares No. of shares $'000 $'000
(a) Issued and fully paid ordinary shares
Opening balance 482,919,018 466,943,431 1,219,990 1,120,838Dividend reinvestment plan 3,295,844 3,390,167 24,341 21,128Share purchase plan 5,115,695 12,585,420 35,478 78,024
Rights issue 1:8 61,905,184 – 445,403 –
Closing balance 553,235,741 482,919,018 1,725,212 1,219,990
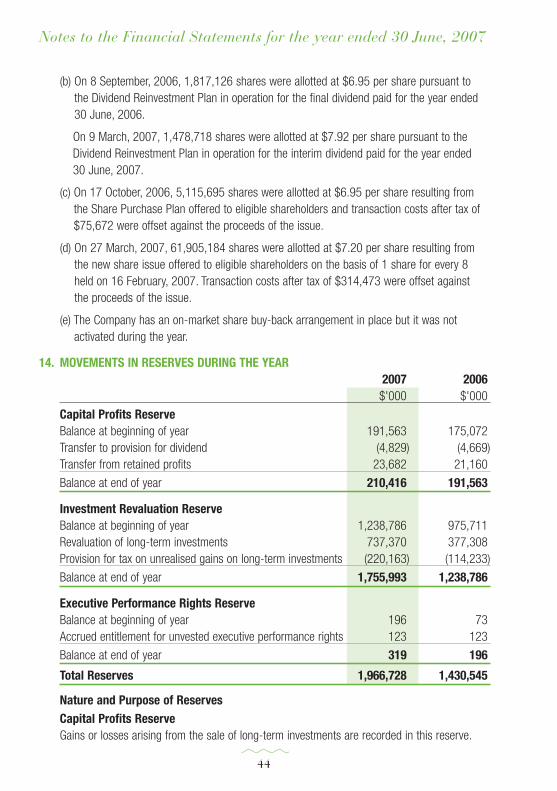
Notes to the Financial Statements for the year ended 30 June, 2007
44
(b) On 8 September, 2006, 1,817,126 shares were allotted at $6.95 per share pursuant to the Dividend Reinvestment Plan in operation for the final dividend paid for the year ended30 June, 2006.
On 9 March, 2007, 1,478,718 shares were allotted at $7.92 per share pursuant to theDividend Reinvestment Plan in operation for the interim dividend paid for the year ended 30 June, 2007.
(c) On 17 October, 2006, 5,115,695 shares were allotted at $6.95 per share resulting from the Share Purchase Plan offered to eligible shareholders and transaction costs after tax of$75,672 were offset against the proceeds of the issue.
(d) On 27 March, 2007, 61,905,184 shares were allotted at $7.20 per share resulting from the new share issue offered to eligible shareholders on the basis of 1 share for every 8 held on 16 February, 2007. Transaction costs after tax of $314,473 were offset against the proceeds of the issue.
(e) The Company has an on-market share buy-back arrangement in place but it was notactivated during the year.
14. MOVEMENTS IN RESERVES DURING THE YEAR2007 2006
$'000 $'000
Capital Profits ReserveBalance at beginning of year 191,563 175,072Transfer to provision for dividend (4,829) (4,669)Transfer from retained profits 23,682 21,160
Balance at end of year 210,416 191,563
Investment Revaluation ReserveBalance at beginning of year 1,238,786 975,711Revaluation of long-term investments 737,370 377,308Provision for tax on unrealised gains on long-term investments (220,163) (114,233)
Balance at end of year 1,755,993 1,238,786
Executive Performance Rights ReserveBalance at beginning of year 196 73Accrued entitlement for unvested executive performance rights 123 123
Balance at end of year 319 196
Total Reserves 1,966,728 1,430,545
Nature and Purpose of ReservesCapital Profits ReserveGains or losses arising from the sale of long-term investments are recorded in this reserve.
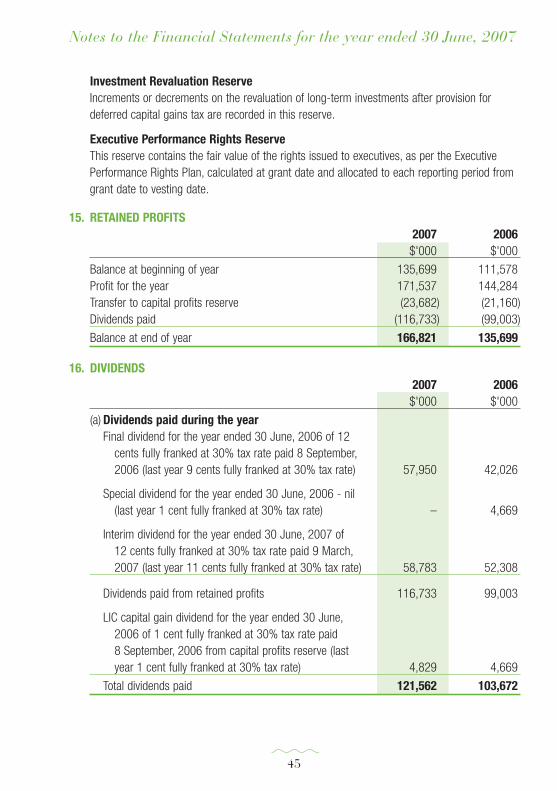
Notes to the Financial Statements for the year ended 30 June, 2007
Investment Revaluation ReserveIncrements or decrements on the revaluation of long-term investments after provision fordeferred capital gains tax are recorded in this reserve.
Executive Performance Rights ReserveThis reserve contains the fair value of the rights issued to executives, as per the ExecutivePerformance Rights Plan, calculated at grant date and allocated to each reporting period fromgrant date to vesting date.
15. RETAINED PROFITS2007 2006
$'000 $'000
Balance at beginning of year 135,699 111,578Profit for the year 171,537 144,284Transfer to capital profits reserve (23,682) (21,160)Dividends paid (116,733) (99,003)
Balance at end of year 166,821 135,699
16. DIVIDENDS2007 2006
$'000 $'000
(a) Dividends paid during the yearFinal dividend for the year ended 30 June, 2006 of 12
cents fully franked at 30% tax rate paid 8 September,2006 (last year 9 cents fully franked at 30% tax rate) 57,950 42,026
Special dividend for the year ended 30 June, 2006 - nil (last year 1 cent fully franked at 30% tax rate) – 4,669
Interim dividend for the year ended 30 June, 2007 of 12 cents fully franked at 30% tax rate paid 9 March,2007 (last year 11 cents fully franked at 30% tax rate) 58,783 52,308
Dividends paid from retained profits 116,733 99,003
LIC capital gain dividend for the year ended 30 June,2006 of 1 cent fully franked at 30% tax rate paid 8 September, 2006 from capital profits reserve (last year 1 cent fully franked at 30% tax rate) 4,829 4,669
Total dividends paid 121,562 103,672
45
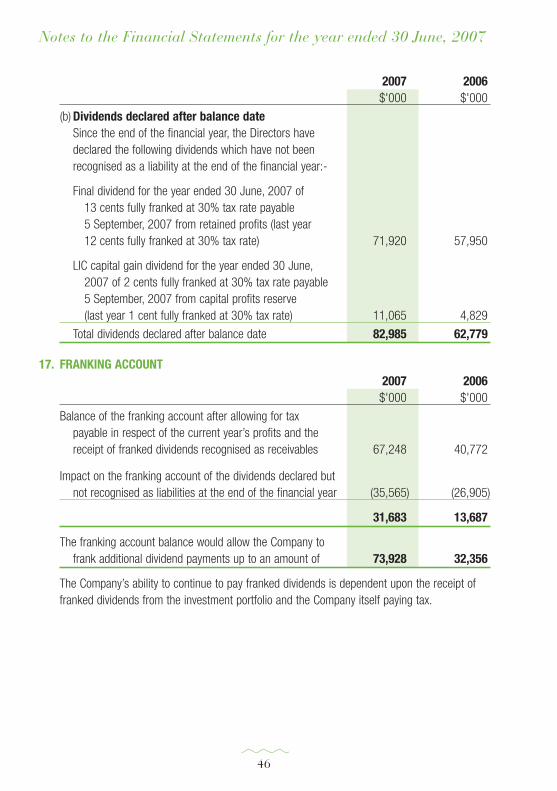
Notes to the Financial Statements for the year ended 30 June, 2007
46
2007 2006$'000 $'000
(b) Dividends declared after balance dateSince the end of the financial year, the Directors havedeclared the following dividends which have not beenrecognised as a liability at the end of the financial year:-
Final dividend for the year ended 30 June, 2007 of 13 cents fully franked at 30% tax rate payable 5 September, 2007 from retained profits (last year 12 cents fully franked at 30% tax rate) 71,920 57,950
LIC capital gain dividend for the year ended 30 June,2007 of 2 cents fully franked at 30% tax rate payable 5 September, 2007 from capital profits reserve (last year 1 cent fully franked at 30% tax rate) 11,065 4,829
Total dividends declared after balance date 82,985 62,779
17. FRANKING ACCOUNT2007 2006
$'000 $'000
Balance of the franking account after allowing for taxpayable in respect of the current year’s profits and thereceipt of franked dividends recognised as receivables 67,248 40,772
Impact on the franking account of the dividends declared but not recognised as liabilities at the end of the financial year (35,565) (26,905)
31,683 13,687
The franking account balance would allow the Company to frank additional dividend payments up to an amount of 73,928 32,356
The Company’s ability to continue to pay franked dividends is dependent upon the receipt offranked dividends from the investment portfolio and the Company itself paying tax.
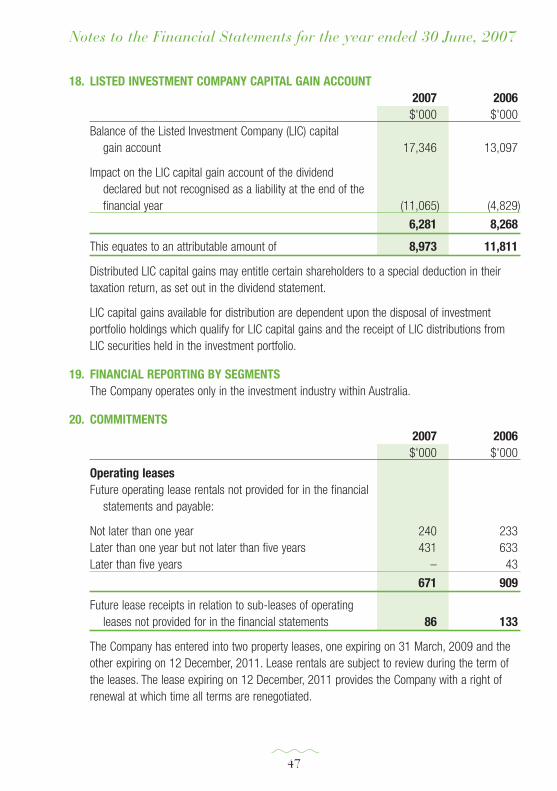
Notes to the Financial Statements for the year ended 30 June, 2007
47
18. LISTED INVESTMENT COMPANY CAPITAL GAIN ACCOUNT2007 2006
$'000 $'000Balance of the Listed Investment Company (LIC) capital
gain account 17,346 13,097
Impact on the LIC capital gain account of the dividend declared but not recognised as a liability at the end of the financial year (11,065) (4,829)
6,281 8,268
This equates to an attributable amount of 8,973 11,811
Distributed LIC capital gains may entitle certain shareholders to a special deduction in theirtaxation return, as set out in the dividend statement.
LIC capital gains available for distribution are dependent upon the disposal of investmentportfolio holdings which qualify for LIC capital gains and the receipt of LIC distributions fromLIC securities held in the investment portfolio.
19. FINANCIAL REPORTING BY SEGMENTSThe Company operates only in the investment industry within Australia.
20. COMMITMENTS2007 2006
$'000 $'000
Operating leasesFuture operating lease rentals not provided for in the financial
statements and payable:
Not later than one year 240 233Later than one year but not later than five years 431 633Later than five years – 43
671 909
Future lease receipts in relation to sub-leases of operating leases not provided for in the financial statements 86 133
The Company has entered into two property leases, one expiring on 31 March, 2009 and theother expiring on 12 December, 2011. Lease rentals are subject to review during the term ofthe leases. The lease expiring on 12 December, 2011 provides the Company with a right ofrenewal at which time all terms are renegotiated.
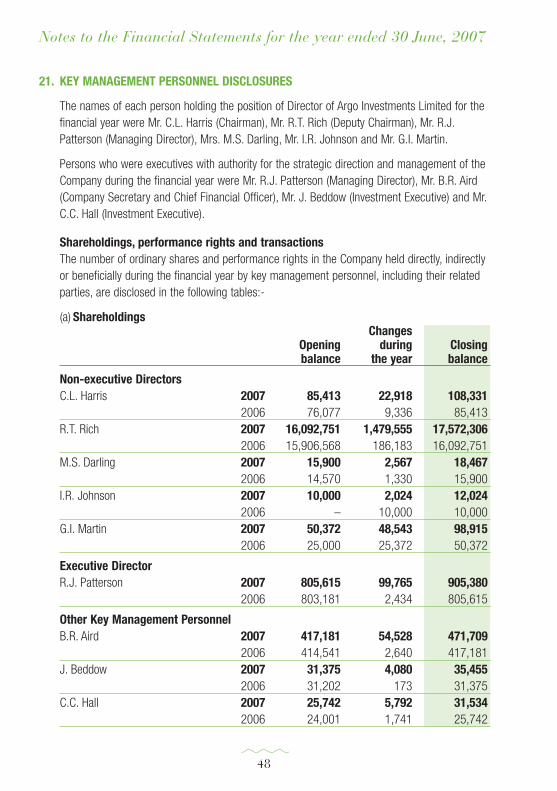
21. KEY MANAGEMENT PERSONNEL DISCLOSURES
The names of each person holding the position of Director of Argo Investments Limited for thefinancial year were Mr. C.L. Harris (Chairman), Mr. R.T. Rich (Deputy Chairman), Mr. R.J.Patterson (Managing Director), Mrs. M.S. Darling, Mr. I.R. Johnson and Mr. G.I. Martin.
Persons who were executives with authority for the strategic direction and management of theCompany during the financial year were Mr. R.J. Patterson (Managing Director), Mr. B.R. Aird(Company Secretary and Chief Financial Officer), Mr. J. Beddow (Investment Executive) and Mr.C.C. Hall (Investment Executive).
Shareholdings, performance rights and transactionsThe number of ordinary shares and performance rights in the Company held directly, indirectlyor beneficially during the financial year by key management personnel, including their relatedparties, are disclosed in the following tables:-
(a) ShareholdingsChanges
Opening during Closingbalance the year balance
Non-executive DirectorsC.L. Harris 2007 85,413 22,918 108,331
2006 76,077 9,336 85,413R.T. Rich 2007 16,092,751 1,479,555 17,572,306
2006 15,906,568 186,183 16,092,751M.S. Darling 2007 15,900 2,567 18,467
2006 14,570 1,330 15,900I.R. Johnson 2007 10,000 2,024 12,024
2006 – 10,000 10,000G.I. Martin 2007 50,372 48,543 98,915
2006 25,000 25,372 50,372
Executive DirectorR.J. Patterson 2007 805,615 99,765 905,380
2006 803,181 2,434 805,615
Other Key Management PersonnelB.R. Aird 2007 417,181 54,528 471,709
2006 414,541 2,640 417,181J. Beddow 2007 31,375 4,080 35,455
2006 31,202 173 31,375C.C. Hall 2007 25,742 5,792 31,534
2006 24,001 1,741 25,742
Notes to the Financial Statements for the year ended 30 June, 2007
48
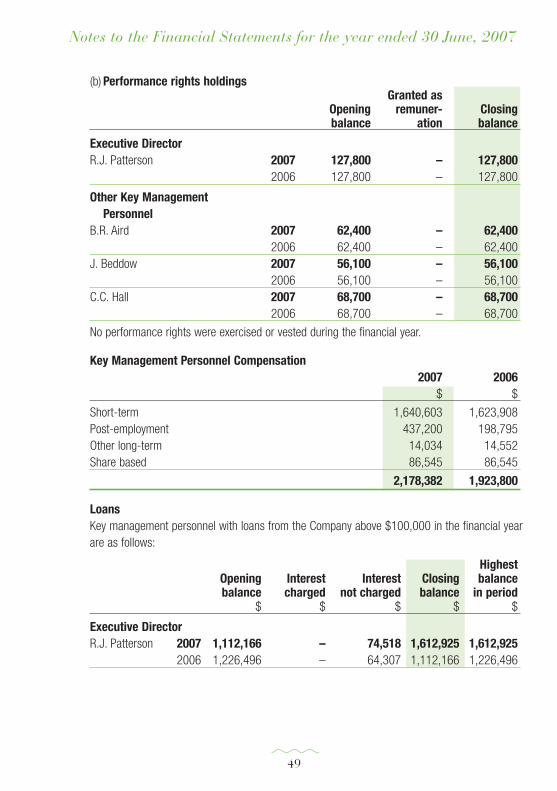
Notes to the Financial Statements for the year ended 30 June, 2007
49
(b) Performance rights holdingsGranted as
Opening remuner- Closingbalance ation balance
Executive DirectorR.J. Patterson 2007 127,800 – 127,800
2006 127,800 – 127,800
Other Key ManagementPersonnel
B.R. Aird 2007 62,400 – 62,4002006 62,400 – 62,400
J. Beddow 2007 56,100 – 56,1002006 56,100 – 56,100
C.C. Hall 2007 68,700 – 68,7002006 68,700 – 68,700
No performance rights were exercised or vested during the financial year.
Key Management Personnel Compensation2007 2006
$ $
Short-term 1,640,603 1,623,908Post-employment 437,200 198,795Other long-term 14,034 14,552Share based 86,545 86,545
2,178,382 1,923,800
LoansKey management personnel with loans from the Company above $100,000 in the financial yearare as follows:
HighestOpening Interest Interest Closing balancebalance charged not charged balance in period
$ $ $ $ $
Executive DirectorR.J. Patterson 2007 1,112,166 – 74,518 1,612,925 1,612,925
2006 1,226,496 – 64,307 1,112,166 1,226,496
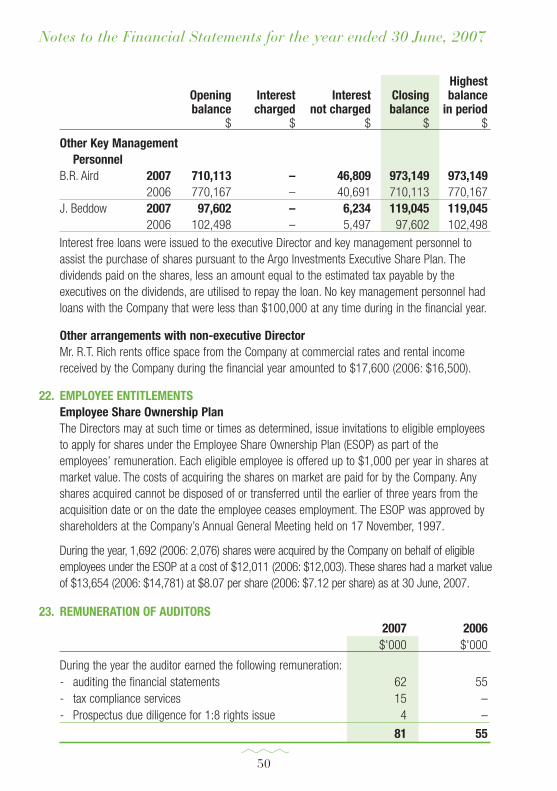
Notes to the Financial Statements for the year ended 30 June, 2007
50
HighestOpening Interest Interest Closing balancebalance charged not charged balance in period
$ $ $ $ $
Other Key Management Personnel
B.R. Aird 2007 710,113 – 46,809 973,149 973,1492006 770,167 – 40,691 710,113 770,167
J. Beddow 2007 97,602 – 6,234 119,045 119,0452006 102,498 – 5,497 97,602 102,498
Interest free loans were issued to the executive Director and key management personnel toassist the purchase of shares pursuant to the Argo Investments Executive Share Plan. Thedividends paid on the shares, less an amount equal to the estimated tax payable by theexecutives on the dividends, are utilised to repay the loan. No key management personnel hadloans with the Company that were less than $100,000 at any time during in the financial year.
Other arrangements with non-executive DirectorMr. R.T. Rich rents office space from the Company at commercial rates and rental incomereceived by the Company during the financial year amounted to $17,600 (2006: $16,500).
22. EMPLOYEE ENTITLEMENTSEmployee Share Ownership PlanThe Directors may at such time or times as determined, issue invitations to eligible employeesto apply for shares under the Employee Share Ownership Plan (ESOP) as part of theemployees’ remuneration. Each eligible employee is offered up to $1,000 per year in shares atmarket value. The costs of acquiring the shares on market are paid for by the Company. Anyshares acquired cannot be disposed of or transferred until the earlier of three years from theacquisition date or on the date the employee ceases employment. The ESOP was approved byshareholders at the Company’s Annual General Meeting held on 17 November, 1997.
During the year, 1,692 (2006: 2,076) shares were acquired by the Company on behalf of eligibleemployees under the ESOP at a cost of $12,011 (2006: $12,003). These shares had a market valueof $13,654 (2006: $14,781) at $8.07 per share (2006: $7.12 per share) as at 30 June, 2007.
23. REMUNERATION OF AUDITORS2007 2006
$'000 $'000
During the year the auditor earned the following remuneration:- auditing the financial statements 62 55- tax compliance services 15 –- Prospectus due diligence for 1:8 rights issue 4 –
81 55
Notes to the Financial Statements for the year ended 30 June, 2007
24. ADDITIONAL FINANCIAL INSTRUMENTS DISCLOSURE
The Company’s activities expose it to financial risks involving the Company’s investments,receivables and payables.
Credit Risk In relation to cash and deposits, the credit risk exposure is the carrying amount and anyinterest accrued. In relation to negotiable bank bills of exchange and promissory notes, thecredit risk exposure is the carrying value which comprises the cost of these investments plusthe interest accrued.
The Company’s cash investments are managed internally under Board approved guidelines.Funds are invested for the short-term where the issuer has a Standard & Poor’s short-termrating of A1+, A1 or A2 and each rating category has a maximum amount that can be investedin any one issuer. No maturity is greater than three months.
In relation to convertible notes and other interest related securities, the credit risk is the extentof their carrying values in the event of a shortfall on the winding-up of the issuing companies.
Liquidity RiskThe Company has no borrowings and monitors its cash flow requirements daily.
The assets of the Company are largely in the form of tradable securities which, if necessary,could be sold on-market.
Market RiskThe Company is a listed investment company that invests in tradable securities. Due to thenature of its business, the Company will always be subject to market risk as it invests itscapital in securities which have fluctuating market prices.
The Company seeks to reduce the market risk of the investment portfolio by ensuring that it isnot, in the opinion of the Board, overly exposed to one company or one particular sector of themarket. The relative weightings of the individual securities and market sectors are reviewed andrisk is appropriately managed. The Company does not have set parameters as to a minimum ormaximum amount of the investment portfolio that can be invested in a single company orsector.
The Company is not exposed to interest rate risk on its cash investments as they mature in theshort-term and have a fixed interest rate. The interest rate risk on the Company’s convertiblenotes and other interest bearing securities is reflected in their market value.
51
52
Directors’ DeclarationIn the opinion of the Directors of Argo Investments Limited:
a) the financial statements and notes set out on pages 28 to 51 are in accordance with theCorporations Act 2001 including:-
(i) complying with Accounting Standards, the Corporations Regulations 2001 and othermandatory professional reporting requirements; and
(ii) giving a true and fair view of the financial position of the Company as at 30 June, 2007 andof its performance for the financial year ended on that date; and
b) there are reasonable grounds to believe that the Company will be able to pay its debts as andwhen they become due and payable; and
c) the audited remuneration disclosures set out on pages 12 to 20 of the Directors’ Report complywith Accounting Standard AASB 124 “Related Party Disclosures” and the CorporationsRegulations 2001.
The Directors have been given the declarations required by section 295A of the Corporations Act2001 from the Chief Executive Officer and the Chief Financial Officer for the financial year ended 30 June, 2007.
Dated at Adelaide this 24th day of August, 2007
Signed in accordance with a resolution of the Directors
C.L. HarrisChairman
53
Independent audit report to the members of
Argo Investments Limited
Report on the financial report and the AASB 124
Remuneration disclosures contained in the Directorsʼ report
We have audited the accompanying financial report of Argo Investment Limited(the company), which comprises the balance sheet as at 30 June 2007, and theincome statement, statement of changes in equity and cash flow statement for the year ended on that date, a summary of significant accounting policies, otherexplanatory notes and the directorsʼ declaration for Argo Investments Limited.
We have also audited the remuneration disclosures contained in the directorsʼreport. As permitted by the Corporations Regulations 2001, the company hasdisclosed information about the remuneration of directors and executives(“remuneration disclosures”), required by Accounting Standard AASB 124 Related Party Disclosures, under the heading “remuneration report” in pages 12 to 20 of the directorsʼ report and not in the financial report.
Directorsʼ responsibility for the financial report and the AASB 124 Remunerationdisclosures contained in the directors' report
The directors of the company are responsible for the preparation and fairpresentation of the financial report in accordance with Australian AccountingStandards (including the Australian Accounting Interpretations) and theCorporations Act 2001. This responsibility includes establishing and maintaininginternal control relevant to the preparation and fair presentation of the financialreport that is free from material misstatement, whether due to fraud or error;selecting and applying appropriate accounting policies; and making accountingestimates that are reasonable in the circumstances. In Note 1, the directors alsostate, in accordance with Accounting Standard AASB 101 Presentation ofFinancial Statements, that compliance with the Australian equivalents toInternational Financial Reporting Standards ensures that the financial report,comprising the financial statements and notes, complies with InternationalFinancial Reporting Standards.
PricewaterhouseCoopers
ABN 52 780 433 757
91 King William StreetADELAIDE SA 5000GPO Box 418ADELAIDE SA 5001DX 77 AdelaideAustraliawww.pwc.com/auTelephone +61 8 8218 7000Facsimile +61 8 8218 7999
Liability limited by a scheme approved under Professional Standards Legislation
54
The directors of the company are also responsible for the remuneration disclosurescontained in the directorsʼ report.
Auditorʼs responsibility
Our responsibility is to express an opinion on the financial report based on our audit. Weconducted our audit in accordance with Australian Auditing Standards. These AuditingStandards require that we comply with relevant ethical requirements relating to auditengagements and plan and perform the audit to obtain reasonable assurance whetherthe financial report is free from material misstatement. Our responsibility is to alsoexpress an opinion on the remuneration disclosures contained in the directorsʼ reportbased on our audit.
An audit involves performing procedures to obtain audit evidence about the amounts anddisclosures in the financial report and the remuneration disclosures contained in thedirectorsʼ report. The procedures selected depend on the auditorʼs judgement, includingthe assessment of the risks of material misstatement of the financial report and theremuneration disclosures contained in the directorsʼ report, whether due to fraud or error.In making those risk assessments, the auditor considers internal control relevant to theentityʼs preparation and fair presentation of the financial report and the remunerationdisclosures contained in the directorsʼ report in order to design audit procedures that areappropriate in the circumstances, but not for the purpose of expressing an opinion on theeffectiveness of the entityʼs internal control. An audit also includes evaluating theappropriateness of accounting policies used and the reasonableness of accountingestimates made by the directors, as well as evaluating the overall presentation of thefinancial report and the remuneration disclosures contained in the directorsʼ report.
Our procedures include reading the other information in the Annual Report to determinewhether it contains any material inconsistencies with the financial report.
For further explanation of an audit, visit our websitehttp://www.pwc.com/au/financialstatementaudit.
Our audit did not involve an analysis of the prudence of business decisions made bydirectors or management.
We believe that the audit evidence we have obtained is sufficient and appropriate toprovide a basis for our audit opinions.Independence
In conducting our audit, we have complied with the independence requirements of theCorporations Act 2001.
5555
Auditorʼs opinion on the financial report
In our opinion:
(a) the financial report of Argo Investments Limited is in accordance with theCorporations Act 2001, including:
(i) giving a true and fair view of the companyʼs financial position as at 30 June 2007and of its performance for the year ended on that date; and
(ii) complying with Australian Accounting Standards (including the AustralianAccounting Interpretations) and the Corporations Regulations 2001; and
(b) the financial report also complies with International Financial Reporting Standards asdisclosed in Note 1.
Auditorʼs opinion on the AASB 124 Remuneration disclosures contained in the directorsʼreport
In our opinion, the remuneration disclosures that are contained in pages 12 to 20 of thedirectorsʼ report comply with Accounting Standard AASB 124.
PricewaterhouseCoopers
DR Clark AdelaidePartner 24 August 2007
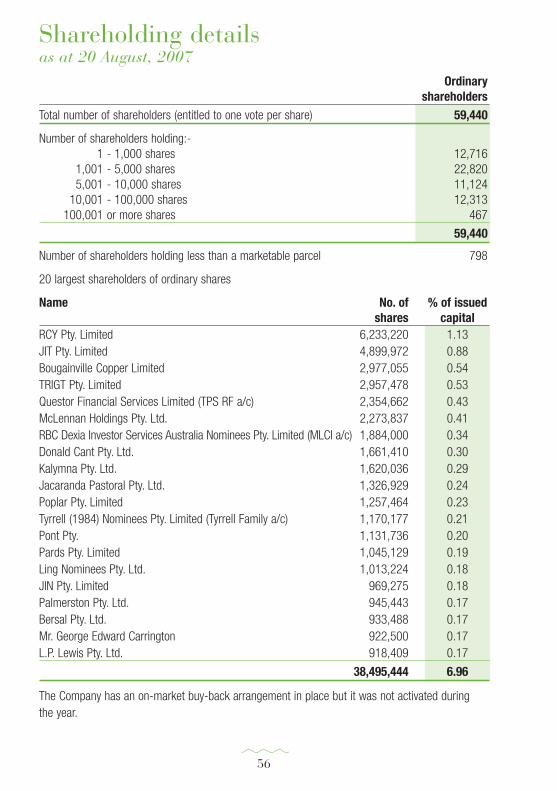
56
Shareholding detailsas at 20 August, 2007
Ordinary shareholders
Total number of shareholders (entitled to one vote per share) 59,440
Number of shareholders holding:-1 - 1,000 shares 12,716
1,001 - 5,000 shares 22,8205,001 - 10,000 shares 11,124
10,001 - 100,000 shares 12,313100,001 or more shares 467
59,440
Number of shareholders holding less than a marketable parcel 798
20 largest shareholders of ordinary shares
Name No. of % of issuedshares capital
RCY Pty. Limited 6,233,220 1.13JIT Pty. Limited 4,899,972 0.88Bougainville Copper Limited 2,977,055 0.54TRIGT Pty. Limited 2,957,478 0.53Questor Financial Services Limited (TPS RF a/c) 2,354,662 0.43McLennan Holdings Pty. Ltd. 2,273,837 0.41RBC Dexia Investor Services Australia Nominees Pty. Limited (MLCI a/c) 1,884,000 0.34Donald Cant Pty. Ltd. 1,661,410 0.30Kalymna Pty. Ltd. 1,620,036 0.29Jacaranda Pastoral Pty. Ltd. 1,326,929 0.24Poplar Pty. Limited 1,257,464 0.23Tyrrell (1984) Nominees Pty. Limited (Tyrrell Family a/c) 1,170,177 0.21Pont Pty. 1,131,736 0.20Pards Pty. Limited 1,045,129 0.19Ling Nominees Pty. Ltd. 1,013,224 0.18JIN Pty. Limited 969,275 0.18Palmerston Pty. Ltd. 945,443 0.17Bersal Pty. Ltd. 933,488 0.17Mr. George Edward Carrington 922,500 0.17L.P. Lewis Pty. Ltd. 918,409 0.17
38,495,444 6.96
The Company has an on-market buy-back arrangement in place but it was not activated during the year.
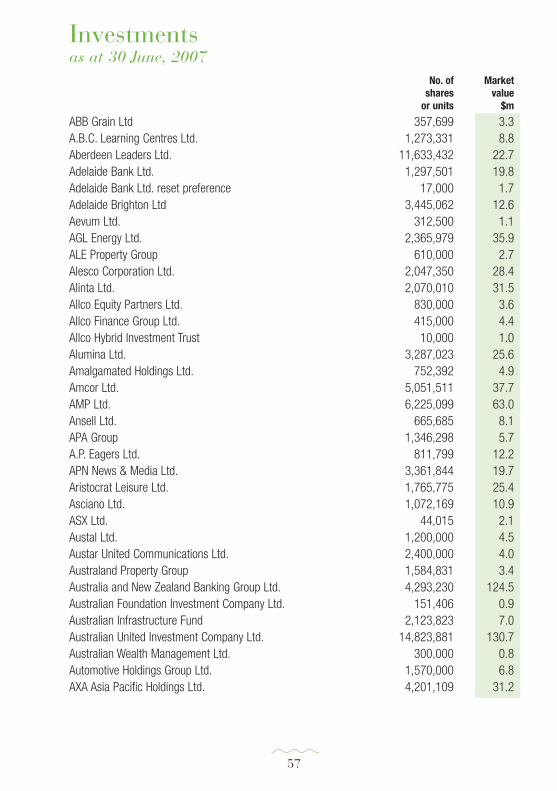
57
No. of Marketshares value
or units $m
ABB Grain Ltd 357,699 3.3A.B.C. Learning Centres Ltd. 1,273,331 8.8Aberdeen Leaders Ltd. 11,633,432 22.7Adelaide Bank Ltd. 1,297,501 19.8Adelaide Bank Ltd. reset preference 17,000 1.7Adelaide Brighton Ltd 3,445,062 12.6Aevum Ltd. 312,500 1.1AGL Energy Ltd. 2,365,979 35.9ALE Property Group 610,000 2.7Alesco Corporation Ltd. 2,047,350 28.4Alinta Ltd. 2,070,010 31.5Allco Equity Partners Ltd. 830,000 3.6Allco Finance Group Ltd. 415,000 4.4Allco Hybrid Investment Trust 10,000 1.0Alumina Ltd. 3,287,023 25.6Amalgamated Holdings Ltd. 752,392 4.9Amcor Ltd. 5,051,511 37.7AMP Ltd. 6,225,099 63.0Ansell Ltd. 665,685 8.1APA Group 1,346,298 5.7A.P. Eagers Ltd. 811,799 12.2APN News & Media Ltd. 3,361,844 19.7Aristocrat Leisure Ltd. 1,765,775 25.4Asciano Ltd. 1,072,169 10.9ASX Ltd. 44,015 2.1Austal Ltd. 1,200,000 4.5Austar United Communications Ltd. 2,400,000 4.0Australand Property Group 1,584,831 3.4Australia and New Zealand Banking Group Ltd. 4,293,230 124.5Australian Foundation Investment Company Ltd. 151,406 0.9Australian Infrastructure Fund 2,123,823 7.0Australian United Investment Company Ltd. 14,823,881 130.7Australian Wealth Management Ltd. 300,000 0.8Automotive Holdings Group Ltd. 1,570,000 6.8AXA Asia Pacific Holdings Ltd. 4,201,109 31.2
Investments as at 30 June, 2007
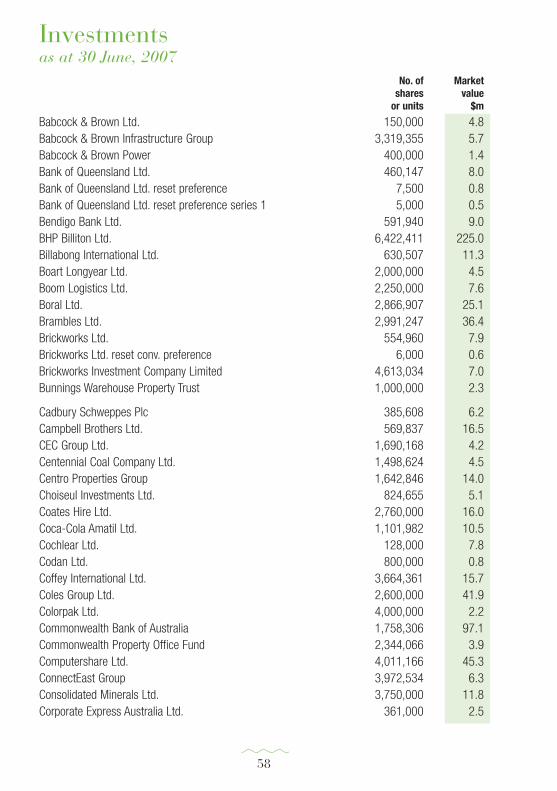
58
Investments as at 30 June, 2007
No. of Marketshares value
or units $m
Babcock & Brown Ltd. 150,000 4.8Babcock & Brown Infrastructure Group 3,319,355 5.7Babcock & Brown Power 400,000 1.4Bank of Queensland Ltd. 460,147 8.0Bank of Queensland Ltd. reset preference 7,500 0.8Bank of Queensland Ltd. reset preference series 1 5,000 0.5Bendigo Bank Ltd. 591,940 9.0BHP Billiton Ltd. 6,422,411 225.0Billabong International Ltd. 630,507 11.3Boart Longyear Ltd. 2,000,000 4.5Boom Logistics Ltd. 2,250,000 7.6Boral Ltd. 2,866,907 25.1Brambles Ltd. 2,991,247 36.4Brickworks Ltd. 554,960 7.9Brickworks Ltd. reset conv. preference 6,000 0.6Brickworks Investment Company Limited 4,613,034 7.0Bunnings Warehouse Property Trust 1,000,000 2.3
Cadbury Schweppes Plc 385,608 6.2Campbell Brothers Ltd. 569,837 16.5CEC Group Ltd. 1,690,168 4.2Centennial Coal Company Ltd. 1,498,624 4.5Centro Properties Group 1,642,846 14.0Choiseul Investments Ltd. 824,655 5.1Coates Hire Ltd. 2,760,000 16.0Coca-Cola Amatil Ltd. 1,101,982 10.5Cochlear Ltd. 128,000 7.8Codan Ltd. 800,000 0.8Coffey International Ltd. 3,664,361 15.7Coles Group Ltd. 2,600,000 41.9Colorpak Ltd. 4,000,000 2.2Commonwealth Bank of Australia 1,758,306 97.1Commonwealth Property Office Fund 2,344,066 3.9Computershare Ltd. 4,011,166 45.3ConnectEast Group 3,972,534 6.3Consolidated Minerals Ltd. 3,750,000 11.8Corporate Express Australia Ltd. 361,000 2.5
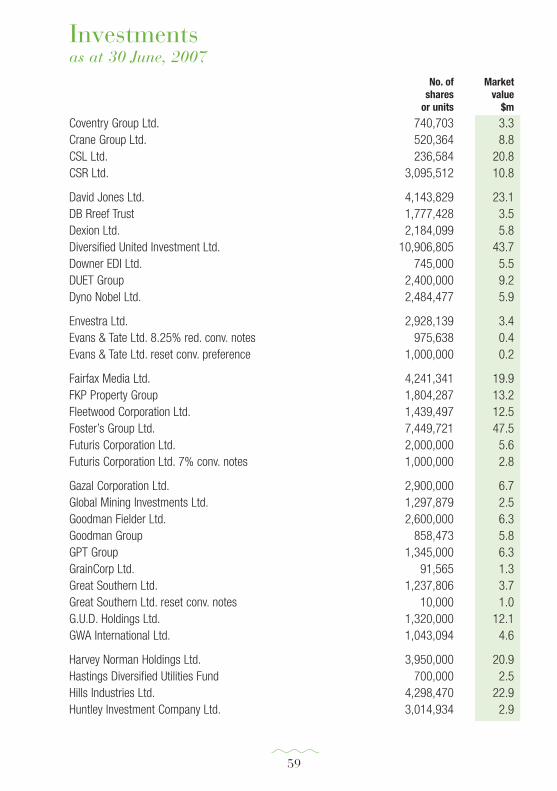
59
Investments as at 30 June, 2007
No. of Marketshares value
or units $m
Coventry Group Ltd. 740,703 3.3Crane Group Ltd. 520,364 8.8CSL Ltd. 236,584 20.8CSR Ltd. 3,095,512 10.8
David Jones Ltd. 4,143,829 23.1DB Rreef Trust 1,777,428 3.5Dexion Ltd. 2,184,099 5.8Diversified United Investment Ltd. 10,906,805 43.7Downer EDI Ltd. 745,000 5.5DUET Group 2,400,000 9.2Dyno Nobel Ltd. 2,484,477 5.9
Envestra Ltd. 2,928,139 3.4Evans & Tate Ltd. 8.25% red. conv. notes 975,638 0.4Evans & Tate Ltd. reset conv. preference 1,000,000 0.2
Fairfax Media Ltd. 4,241,341 19.9FKP Property Group 1,804,287 13.2Fleetwood Corporation Ltd. 1,439,497 12.5Foster’s Group Ltd. 7,449,721 47.5Futuris Corporation Ltd. 2,000,000 5.6Futuris Corporation Ltd. 7% conv. notes 1,000,000 2.8
Gazal Corporation Ltd. 2,900,000 6.7Global Mining Investments Ltd. 1,297,879 2.5Goodman Fielder Ltd. 2,600,000 6.3Goodman Group 858,473 5.8GPT Group 1,345,000 6.3GrainCorp Ltd. 91,565 1.3Great Southern Ltd. 1,237,806 3.7Great Southern Ltd. reset conv. notes 10,000 1.0G.U.D. Holdings Ltd. 1,320,000 12.1GWA International Ltd. 1,043,094 4.6
Harvey Norman Holdings Ltd. 3,950,000 20.9Hastings Diversified Utilities Fund 700,000 2.5Hills Industries Ltd. 4,298,470 22.9Huntley Investment Company Ltd. 3,014,934 2.9
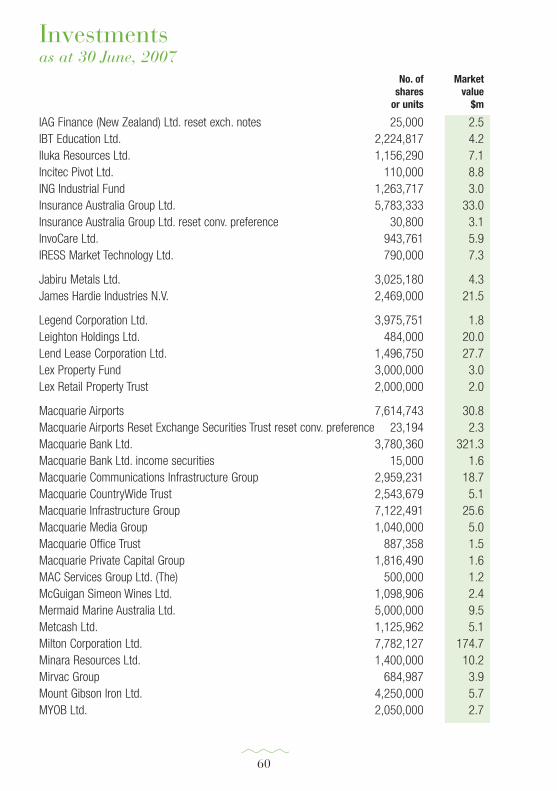
60
Investments as at 30 June, 2007
No. of Marketshares value
or units $m
IAG Finance (New Zealand) Ltd. reset exch. notes 25,000 2.5IBT Education Ltd. 2,224,817 4.2Iluka Resources Ltd. 1,156,290 7.1Incitec Pivot Ltd. 110,000 8.8ING Industrial Fund 1,263,717 3.0Insurance Australia Group Ltd. 5,783,333 33.0Insurance Australia Group Ltd. reset conv. preference 30,800 3.1InvoCare Ltd. 943,761 5.9IRESS Market Technology Ltd. 790,000 7.3
Jabiru Metals Ltd. 3,025,180 4.3James Hardie Industries N.V. 2,469,000 21.5
Legend Corporation Ltd. 3,975,751 1.8Leighton Holdings Ltd. 484,000 20.0Lend Lease Corporation Ltd. 1,496,750 27.7Lex Property Fund 3,000,000 3.0Lex Retail Property Trust 2,000,000 2.0
Macquarie Airports 7,614,743 30.8Macquarie Airports Reset Exchange Securities Trust reset conv. preference 23,194 2.3Macquarie Bank Ltd. 3,780,360 321.3Macquarie Bank Ltd. income securities 15,000 1.6Macquarie Communications Infrastructure Group 2,959,231 18.7Macquarie CountryWide Trust 2,543,679 5.1Macquarie Infrastructure Group 7,122,491 25.6Macquarie Media Group 1,040,000 5.0Macquarie Office Trust 887,358 1.5Macquarie Private Capital Group 1,816,490 1.6MAC Services Group Ltd. (The) 500,000 1.2McGuigan Simeon Wines Ltd. 1,098,906 2.4Mermaid Marine Australia Ltd. 5,000,000 9.5Metcash Ltd. 1,125,962 5.1Milton Corporation Ltd. 7,782,127 174.7Minara Resources Ltd. 1,400,000 10.2Mirvac Group 684,987 3.9Mount Gibson Iron Ltd. 4,250,000 5.7MYOB Ltd. 2,050,000 2.7
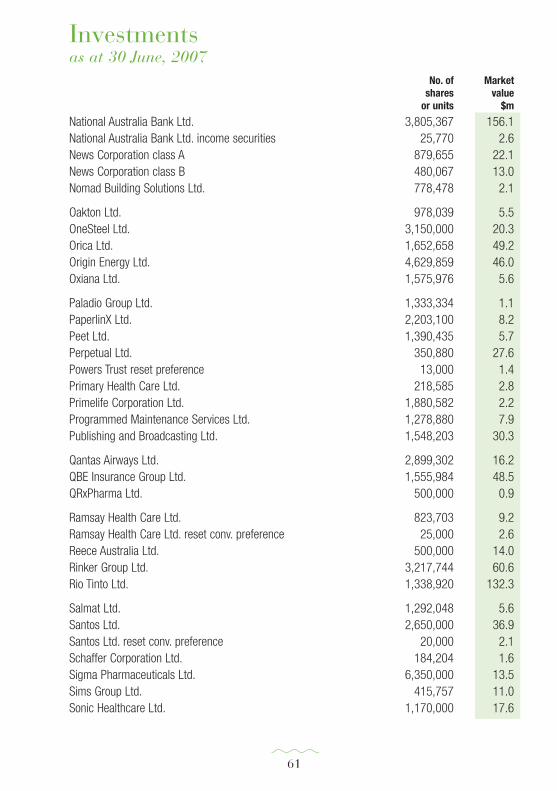
61
Investments as at 30 June, 2007
No. of Marketshares value
or units $m
National Australia Bank Ltd. 3,805,367 156.1National Australia Bank Ltd. income securities 25,770 2.6News Corporation class A 879,655 22.1News Corporation class B 480,067 13.0Nomad Building Solutions Ltd. 778,478 2.1
Oakton Ltd. 978,039 5.5OneSteel Ltd. 3,150,000 20.3Orica Ltd. 1,652,658 49.2Origin Energy Ltd. 4,629,859 46.0Oxiana Ltd. 1,575,976 5.6
Paladio Group Ltd. 1,333,334 1.1PaperlinX Ltd. 2,203,100 8.2Peet Ltd. 1,390,435 5.7Perpetual Ltd. 350,880 27.6Powers Trust reset preference 13,000 1.4Primary Health Care Ltd. 218,585 2.8Primelife Corporation Ltd. 1,880,582 2.2Programmed Maintenance Services Ltd. 1,278,880 7.9Publishing and Broadcasting Ltd. 1,548,203 30.3
Qantas Airways Ltd. 2,899,302 16.2QBE Insurance Group Ltd. 1,555,984 48.5QRxPharma Ltd. 500,000 0.9
Ramsay Health Care Ltd. 823,703 9.2Ramsay Health Care Ltd. reset conv. preference 25,000 2.6Reece Australia Ltd. 500,000 14.0Rinker Group Ltd. 3,217,744 60.6Rio Tinto Ltd. 1,338,920 132.3
Salmat Ltd. 1,292,048 5.6Santos Ltd. 2,650,000 36.9Santos Ltd. reset conv. preference 20,000 2.1Schaffer Corporation Ltd. 184,204 1.6Sigma Pharmaceuticals Ltd. 6,350,000 13.5Sims Group Ltd. 415,757 11.0Sonic Healthcare Ltd. 1,170,000 17.6

62
Investments as at 30 June, 2007
No. of Marketshares value
or units $m
Soul, (Washington H.) Pattinson & Company Ltd. 1,532,507 15.5Southern Cross Broadcasting (Australia) Ltd. 743,475 11.9St. George Bank Ltd. 2,431,137 86.1St. George Bank Ltd. reset conv. preference (SAINTS) 12,000 1.2St. George Bank Ltd. reset conv. preference 15,000 1.5Stockland 1,266,934 10.3Straits Resources Ltd. 2,500,130 11.5Structural Systems Ltd. 1,669,916 4.7Suncorp-Metway Ltd. 1,584,667 32.0Suncorp-Metway Ltd. reset conv. preference 32,000 3.3Symbion Health Ltd. 3,471,070 14.2
Tabcorp Holdings Ltd. 1,784,810 30.6Talent 2 International Ltd. 1,126,374 3.2TAPS Trust reset preferred 5,000 0.5Tattersall’s Ltd. 1,299,000 6.1Technology One Ltd. 3,290,564 4.0Telstra Corporation Ltd. 19,704,800 90.4Telstra Corporation Ltd. instalment receipts 10,000,000 31.1Ten Network Holdings Ltd. 2,051,523 5.6Thakral Holdings Group 3,432,000 3.8ThinkSmart Limited 720,000 1.6Timbercorp Ltd. 1,600,000 3.4Timbercorp Ltd. reset conv. notes 4,450 0.4Timbercorp Ltd. reset preference 1,000,000 2.1Toll Holdings Ltd. 1,072,169 15.5Toll Holdings Ltd. reset conv. preference 5,000 1.0Transfield Services Ltd. 746,490 8.3Transfield Services Infrastructure Fund 350,000 0.8Transurban Group 2,540,319 20.3
United Group Ltd. 1,194,681 19.9
Walter Diversified Services Ltd. 1,150,000 2.9Wattyl Ltd. 497,421 1.6Wesfarmers Ltd. 2,535,000 115.9West Australian Newspapers Holdings Ltd. 911,871 12.5Westfield Group 2,278,068 45.5
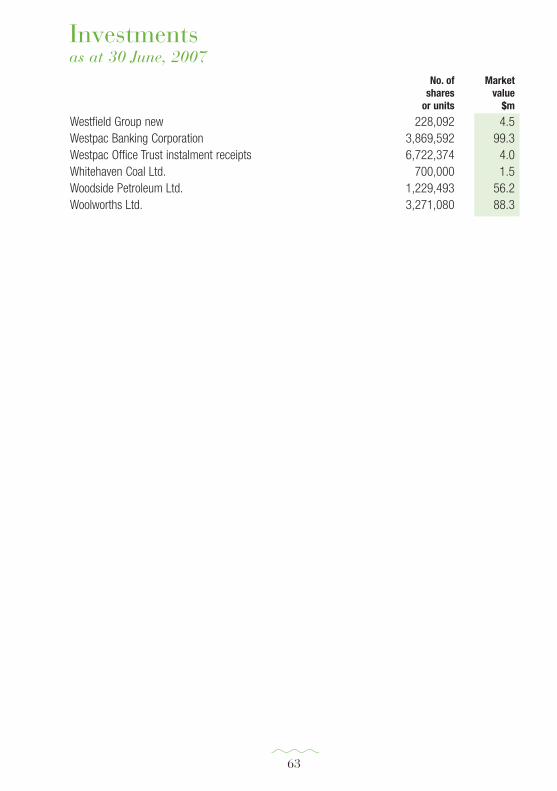
63
Investments as at 30 June, 2007
No. of Marketshares value
or units $m
Westfield Group new 228,092 4.5Westpac Banking Corporation 3,869,592 99.3Westpac Office Trust instalment receipts 6,722,374 4.0Whitehaven Coal Ltd. 700,000 1.5Woodside Petroleum Ltd. 1,229,493 56.2Woolworths Ltd. 3,271,080 88.3
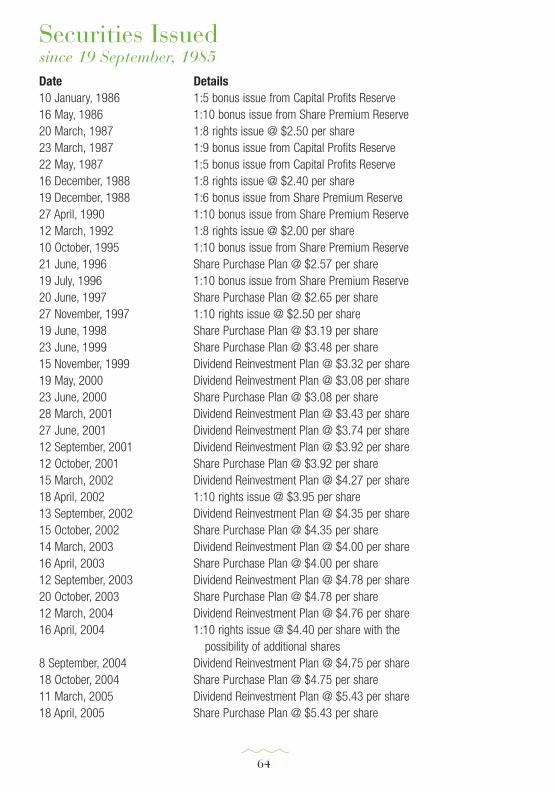
Date Details10 January, 1986 1:5 bonus issue from Capital Profits Reserve16 May, 1986 1:10 bonus issue from Share Premium Reserve 20 March, 1987 1:8 rights issue @ $2.50 per share 23 March, 1987 1:9 bonus issue from Capital Profits Reserve22 May, 1987 1:5 bonus issue from Capital Profits Reserve16 December, 1988 1:8 rights issue @ $2.40 per share19 December, 1988 1:6 bonus issue from Share Premium Reserve27 April, 1990 1:10 bonus issue from Share Premium Reserve12 March, 1992 1:8 rights issue @ $2.00 per share10 October, 1995 1:10 bonus issue from Share Premium Reserve21 June, 1996 Share Purchase Plan @ $2.57 per share19 July, 1996 1:10 bonus issue from Share Premium Reserve20 June, 1997 Share Purchase Plan @ $2.65 per share27 November, 1997 1:10 rights issue @ $2.50 per share19 June, 1998 Share Purchase Plan @ $3.19 per share23 June, 1999 Share Purchase Plan @ $3.48 per share15 November, 1999 Dividend Reinvestment Plan @ $3.32 per share19 May, 2000 Dividend Reinvestment Plan @ $3.08 per share23 June, 2000 Share Purchase Plan @ $3.08 per share28 March, 2001 Dividend Reinvestment Plan @ $3.43 per share27 June, 2001 Dividend Reinvestment Plan @ $3.74 per share12 September, 2001 Dividend Reinvestment Plan @ $3.92 per share12 October, 2001 Share Purchase Plan @ $3.92 per share15 March, 2002 Dividend Reinvestment Plan @ $4.27 per share18 April, 2002 1:10 rights issue @ $3.95 per share13 September, 2002 Dividend Reinvestment Plan @ $4.35 per share15 October, 2002 Share Purchase Plan @ $4.35 per share14 March, 2003 Dividend Reinvestment Plan @ $4.00 per share16 April, 2003 Share Purchase Plan @ $4.00 per share12 September, 2003 Dividend Reinvestment Plan @ $4.78 per share 20 October, 2003 Share Purchase Plan @ $4.78 per share12 March, 2004 Dividend Reinvestment Plan @ $4.76 per share16 April, 2004 1:10 rights issue @ $4.40 per share with the
possibility of additional shares8 September, 2004 Dividend Reinvestment Plan @ $4.75 per share18 October, 2004 Share Purchase Plan @ $4.75 per share11 March, 2005 Dividend Reinvestment Plan @ $5.43 per share18 April, 2005 Share Purchase Plan @ $5.43 per share
64
Securities Issued since 19 September, 1985
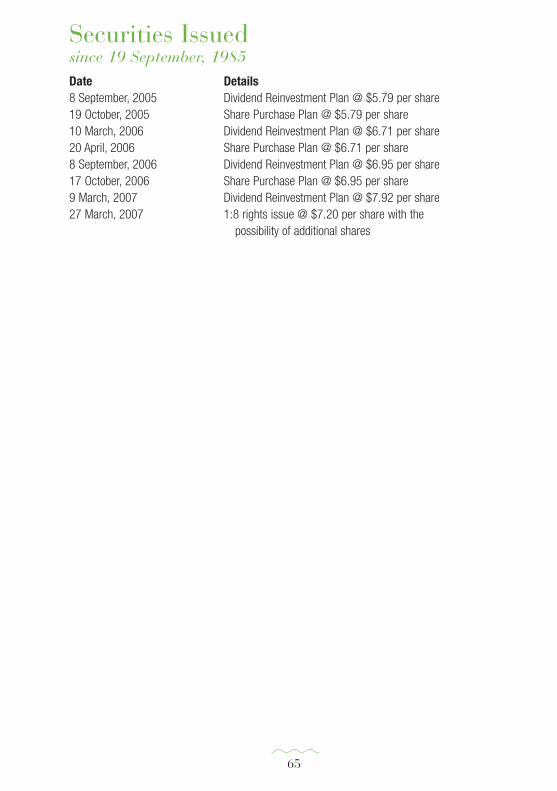
65
Securities Issued since 19 September, 1985 Date Details8 September, 2005 Dividend Reinvestment Plan @ $5.79 per share19 October, 2005 Share Purchase Plan @ $5.79 per share10 March, 2006 Dividend Reinvestment Plan @ $6.71 per share20 April, 2006 Share Purchase Plan @ $6.71 per share8 September, 2006 Dividend Reinvestment Plan @ $6.95 per share17 October, 2006 Share Purchase Plan @ $6.95 per share9 March, 2007 Dividend Reinvestment Plan @ $7.92 per share27 March, 2007 1:8 rights issue @ $7.20 per share with the
possibility of additional shares