Embed Size (px)
Citation preview

2007 ANNUAL REPORT

ABOUT MACK-CALI
Mack-Cali Realty Corporation is a fully integrated,
self-administered, self-managed real estate invest-
ment trust (REIT) providing management, leasing,
development, construction and other tenant-related
services for its class A real estate portfolio. The
Company, serving approximately 2,200 tenants, owns
or has interests in 294 properties totaling approxi-
mately 34 million square feet plus land for the devel-
opment of an additional 11.3 million square feet of
commercial space. Mack-Cali’s holdings are located in
the Northeast and Mid-Atlantic regions and include
approximately 28.3 million square feet of office space,
5.0 million square feet of office/flex space, and
387,400 square feet of industrial/warehouse space.
OUR MISSION
Mack-Cali Realty Corporation, an industry leader in
office properties, strives to provide superior work
environments and services to its clients. Through
dynamic teamwork, Mack-Cali will continue to assert
itself as the office owner of choice in its core markets,
and, by anticipating the evolving needs of business,
will maximize value for its investors and employees.
2007 2006 2005 2004 2003
Total revenues $808,350 $732,012 $591,991 $529,225 $509,099Property expenses* $270,913 $253,667 $207,558 $168,021 $156,073Direct construction costs $ 85,180 $ 53,602 — — —General and administrative $ 52,162 $ 49,074 $ 32,432 $ 31,305 $ 30,827Interest expense $126,672 $134,964 $119,070 $109,211 $114,919Net income available to
common shareholders $108,466 $142,666 $ 93,488 $100,453 $141,381Net income per share — basic $ 1.62 $ 2.29 $ 1.52 $ 1.66 $ 2.45Net income per share — diluted $ 1.61 $ 2.28 $ 1.51 $ 1.65 $ 2.43Dividends declared per
common share $ 2.56 $ 2.54 $ 2.52 $ 2.52 $ 2.52Basic weighted average
shares outstanding 67,026 62,237 61,477 60,351 57,724Diluted weighted average
shares outstanding 82,500 77,901 74,189 68,743 65,980
* Property expenses are calculated by taking the sum of real estate taxes, utilities and operating services for each of the periods presented.
FINANCIAL SUMMARY
(In thousands, except per share amounts)
On the cover, clockwise from top left: One Bridge Plaza, Fort Lee, N.J.; 6411 Ivy Lane, Capital Office Park, Greenbelt, Md.;
50 Main Street, Westchester Financial Center, White Plains, N.Y.; 101 Hudson Street, Jersey City, N.J.

To Our Shareholders
Mitchell E. Hersh
President and Chief Executive Officer
1 2007 Annual Report
For Mack-Cali, 2007 was a year
of sound accomplishment. Our
Company improved occupancies,
enhanced and extended its Northeast
presence, and delivered solid financial
results. And we remained focused on
our core business—providing our ten-
ants with superior work environments.
The year began with a continua-
tion of intense investor appetite for
commercial real estate and with exten-
sive merger and buyout activity. But as
2007 progressed, the effects of the
subprime lending crisis that hit the
housing sector earlier in the year began
to spill over to commercial real estate,
and the investment sales market and
transaction activity cooled as the
markets felt the effects of tightening
lending standards and reduced liquidity.
These conditions have contributed to
a great deal of economic uncertainty.
This uncertainty, along with a slowing
economy, naturally causes a slowing of
strategic decision-making on the part of
office space users.
Mack-Cali has always adhered to
conservative financial principles of
modest leverage, strong debt service
coverage ratios, and a high ratio of
unencumbered assets. Combined with
our other strengths—a well-leased
portfolio, high-credit-quality tenants
and superior assets—these principles
have helped us succeed in both strong
and weak economic conditions.
Refining Our PortfolioOur Company’s overall corporate
strategy is to expand our critical mass in
high-barrier-to-entry markets in the
Northeast and Mid-Atlantic regions.
Mack-Cali’s vast market knowledge,
deep relationships, and almost 60 years
of experience in these core markets
allow us to make smart strategic
decisions, better identify and serve our
tenants’ critical needs, increase operat-
ing efficiencies, and pursue opportuni-
ties for growth.
During the year, we continued to
refine our property portfolio, and
extended our reach into a significant
new market. We added five New Jersey
properties to our holdings through
both acquisitions and development. But
clearly our most significant transaction
in 2007 was our acquisition of interests
in 125 Broad Street, marking our
entrance into the adjacent downtown
Manhattan market. We acquired a 40
percent ownership interest, or 524,500
square feet, in this stunning 40-story
property from SL Green for $273 million.
The 15 floors we own at the property are
100 percent leased to blue-chip tenants
such as Citigroup and Oppenheimer
& Co., at rents well below market—
offering significant upside potential.
We believe that 125 Broad Street
provides us with an excellent starting
point in the attractive downtown market.
It offers synergies with our properties on

1000 Madison Avenue, Lower Providence, Pa.
2 2007 Annual Report
the Jersey City waterfront, which are
located directly across, and just one
PATH train stop away, from downtown
Manhattan. These markets share the
same tenant base, with similar office
space requirements; and many firms
lease space on both sides of the river.
Coupled with this relationship-
driven, opportunistic acquisition, we
sold our only asset in Greenwich,
Connecticut—a 121,250 square-foot
building at 500 West Putnam Avenue—
to SL Green for $56 million. As with
the Broad Street deal, this was a trans-
action that made strategic sense for
both parties.
During the year, we sold three
additional office buildings that allowed
us to capitalize on the favorable invest-
ment sales market and harvest value,
while exiting submarkets that did not
offer us competitive advantages or
significant growth opportunities. We
sold for $17 million another building in
Connecticut, 1000 Bridgeport Avenue
in Shelton, which totaled 133,000 square
feet; and our only two office properties
in Atlantic County, New Jersey, located
at 100 and 200 Decadon Drive in Egg
Harbor Township. The buildings totaled
80,344 square feet and were sold for
$12.5 million. On an on-going basis, we
will continue to improve our portfolio by
exiting such submarkets, selling assets
to create value, and exploring adjacent
new markets.
Putting Tenants’ Needs First Mack-Cali is first and foremost a real
estate operator. Our core business is to
own and manage exceptional office
properties and to serve our tenants. We
provide them with attractive, comfort-
able, well-managed and conveniently
located facilities to help them effectively
run their businesses—which is why so
many companies have made Mack-Cali
their preferred provider of office space.
Our tenant roster is filled with
leading companies from a variety of
industries that have located and
retained their offices in Mack-Cali
properties year after year. And, as their
businesses have grown, many of these
tenants have expanded within our
portfolio. Just some of our 2007 leasing
activity included transactions with
Daiichi Sankyo, Inc.; Deutsche Bank; the
U.S. General Services Administration;
Allstate Insurance; Citigroup Global
Markets, Inc.; Montefiore Medical
Center; WithumSmith+Brown; American
International Group; Cablevision
Lightpath; Lehman Brothers; The RBA
Group; and Bank of Tokyo-Mitsubishi,
Ltd. Equally important were the
numerous small businesses that signed
leases during the year, as they help to
add significant stability to our portfolio.
Despite the challenging economic
climate in 2007, we were able to increase
our portfolio’s leased percentage from
92.0 to 92.7 percent—a six-year high.
Mack-Cali Centre III, 140 East RidgewoodAvenue, Paramus, N.J.
01020304050607080
TOTAL REVENUES
In Millions
03 04 05 06 07
$808.4
$529.2
$732.0
$509.1
$592.0

A RENOVATION
Harborside Financial Center Plaza 1, Jersey City, N.J.
After being repositioned for multi-tenant use in 2005, Harborside Plaza 1 reached
full occupancy in 2007. One tenant, a global bulge bracket bank, expanded its space
twice since the renovation, and now leases over 281,000 square feet at the 400,000
square-foot waterfront building.

200 Stevens Drive, Airport Business Center, Lester, Pa.
4 2007 Annual Report
Our leased rates continued to exceed
the average in most of our core markets,
including Northern and Central New
Jersey, Westchester County, Suburban
Philadelphia, and Washington, D.C., as
well as downtown Manhattan.
Both our Company and our
properties were honored with several
awards in 2007. Three Mack-Cali proper-
ties were recognized by local chapters of
the Building Owners and Managers
Association (BOMA). Based on excel-
lence in office building management,
The Office Building of the Year (TOBY)
award was given to 5 Wood Hollow
Road in Parsippany, N.J., in the category
of office buildings from 250,000 to
499,999 square feet. Stamford Executive
Park in Stamford, Conn., also garnered
a TOBY award, in the industrial park
category. At Westchester Financial
Center in the White Plains central
business district, 50 Main Street
received a “Best of BOMA” award for its
exterior space design and ease of use.
Mack-Cali was also named one of
“New Jersey’s Finest” by NJBIZ maga-
zine, which honored the state’s fastest
growing companies; and was recog-
nized by the New Jersey Chapter of
the National Association of Industrial
and Office Properties with its Chairman’s
Award for our 2006 acquisition of the
Gale Company.
During the year, Mack-Cali made
environmentally friendly materials and
work practices standard for our tenant
build-outs. This has improved tenant
comfort and reduced environmental
waste without increasing costs, due to
our vast buying capacity.
Disciplined DevelopmentAs a disciplined developer, Mack-Cali
pursues development projects that can
limit risk and maximize returns. Our land
bank, which can accommodate over 11
million square feet of additional office
development, continues to prove its
value. Most of the land is adjacent to
existing properties, allowing us to
accommodate tenant expansions and
create added value for our portfolio.
Our 2007 land acquisitions fit this
profile. We purchased land near our
Horizon Center Business Park in
Hamilton Township, N.J., and adjacent
to our Capital Office Park in Greenbelt,
Md., outside of Washington, D.C.—
two acquisitions that will enable us to
develop up to 819,000 square feet of
additional office space.
At Mack-Cali Business Campus in
Parsippany, N.J., on a land site we
acquired with the Campus in 1998, we are
currently developing, on a build-to-suit
basis, a corporate headquarters building
for Wyndham Worldwide Corporation.
Wyndham, a long-time tenant at another
building in the Campus, pre-leased the
three-story, 250,000 square-foot class A
office building for 15 years.
4 Becker Farm Road, 280 Corporate Center, Roseland, N.J.
DIVIDENDS DECLARED
Per Common Share
03 04 05 06 07
$2.56
$2.52 $2.52 $2.52
$2.54

AN ACQUISITION
125 Broad Street, New York, N.Y.
Mack-Cali’s acquisition of interests in 125 Broad Street marked the Company’s
entrance into the adjacent and robust downtown Manhattan office market.
The 40-story waterfront office tower, located in the financial district, also
complements Mack-Cali’s presence on the Jersey City waterfront.

6406 Ivy Lane, Capital Office Park, Greenbelt, Md.
141 West Front Street, Red Bank Corporate Plaza, Red Bank, N.J.
6 2007 Annual Report
During 2007 we also completed
a build-to-suit project for AAA Mid-
Atlantic that utilized one of our land
sites at Horizon Center Business Park.
The 120,000 square-foot class A office
building was pre-leased by AAA for 15
years. Along with this transaction, we
acquired from AAA two office buildings
and land sites close to the Park, as
mentioned previously.
Besides build-to-suit projects,
partnering with other land owners and
institutional capital providers is another
way to reduce development risk. In a
joint venture with The PRC Group, we
completed construction of a 92,900
square-foot class A office building in
vibrant downtown Red Bank, N.J. This
project was built for Hovnanian
Enterprises, which fully pre-leased the
building for 10 years.
We also partnered with JPMorgan
Asset Management and The Hampshire
Companies to develop a 100,000
square-foot class A office building at
One Jefferson Road at The Center of
Morris County in Parsippany, N.J. We
have a limited ownership interest of 8.3
percent in this speculative project,
which is being developed, managed
and leased by our Gale subsidiary and is
expected to be completed late this
year. Development was completed on
another building at the complex, 100
Kimball Drive, a 175,000 square-foot
class A office building that is owned by
the same partnership and is 91.4 percent
leased to Deloitte & Touche USA.
Our partnership to redevelop the
Filene’s Basement site in downtown
Boston purchased the land site for
the project in 2007, and is progressing
on the beginning stages of develop-
ment. Mack-Cali owns 15 percent of
this joint venture, and has teamed up
with Vornado Realty Trust, Gale
International, and a JPMorgan fund on
this exciting 1.2 million square-foot
mixed-use project.
Benefiting From Sound FinancialsOur diverse and strong credit-quality
tenant base produces stable, high-qual-
ity earnings for our Company. In 2007,
this helped fuel another year of solid
performance, with our revenues increas-
ing 10 percent, from $732.0 million to
$808.4 million.
Mack-Cali continued to enjoy the
confidence of the financial community,
and our balance sheet remains one of
the industry’s strongest. In February
2007, we completed our first equity
offering in nine years, selling 4.65 mil-
lion shares of common stock and gener-
ating $252 million in proceeds. We
extended and modified our unsecured
revolving credit facility with 23 lender
banks in June, adding two years to its
term and reducing its interest rate by 10
basis points, to LIBOR plus 55 basis
points. In September, we expanded the
0
20
40
60
80
100
MACK-CALI VS. MARKET
OCCUPANCIES
g Mack-Cali g Market*% leased at 12/31/07, Office Propertiesin Core Markets
86.6%
92.4%
* Source: Cushman & Wakefield, Direct Vacancies, All Classes
Northern/ Westchester Suburban Washington, Central N.J. County, N.Y. Philadelphia D.C.
87.3%
95.7%
86.2%
90.8% 94.0%
100%

A LEASE
2 Hilton Court, Mack-Cali Business Campus, Parsippany, N.J.
Daiichi Sankyo, Inc. leased this entire building for its U.S. corporate headquarters in
2007. A tenant of the building since 1997, the pharmaceutical firm made a long-term
commitment to more than double its space, to over 186,000 square feet. The property
offers a prime headquarters for Daiichi Sankyo in Morris County’s corporate corridor.

300 Tice Boulevard, Woodcliff Lake, N.J.
Wyndham Worldwide Headquarters, 22 Sylvan Way, Mack-Cali Business Campus,Parsippany, N.J.
8 2007 Annual Report
facility by $175 million to $775 million.
As REIT stocks declined late in the year,
we saw an opportunity to create value
for shareholders by aggressively buying
back 2.9 million shares of our common
stock for $104 million.
These transactions allowed us to
strengthen our balance sheet, create
shareholder value, and enhance our
Company’s financial flexibility, helping
to ensure we are well positioned to act
quickly as new opportunities arise.
Results For ShareholdersConsistent with the broad decline of
REIT stock prices, Mack-Cali’s stock
showed a negative total return for the
year. However, our total return since
our initial public offering stood at
400.7 percent, still above the 291.8
percent total return for that period for
the S&P 500. Our annualized dividend
to shareholders, at $2.56, yielded 7.53
percent at year-end—far exceeding the
average S&P 500 dividend yield of just
1.89 percent.
Mack-Cali continues to offer an
excellent opportunity for those looking
to invest in a professionally managed,
institutional-quality commercial real
estate portfolio and to benefit from
the strong dividends, liquidity and
transparency that public real estate
companies provide.
Building On Success As 2008 continues to unfold, the nation’s
economic outlook remains unclear.
Recognizing that, we have positioned
the company well, with strong occupan-
cies, a stable revenue stream backed
by high-credit-quality tenants, minimal
near-term debt maturities, and a power-
ful balance sheet. We will carefully mon-
itor our markets and act only when
opportunities are clearly compelling.
And, most importantly, we will continue
to concentrate on providing our tenants
with superior work environments. We
believe these strengths, along with our
focused and proven strategy, will contin-
ue to result in success for our Company
and value for our shareholders.
We are able to accomplish our
goals only through the hard work of our
employees, the loyalty of our tenants,
and the confidence of our investors.
Thank you to all who have played a role in
helping us achieve our leading position.
We look forward to the year
ahead and to sharing our success with
you in the future.
Sincerely,
Mitchell E. Hersh
President and Chief Executive Officer
P.S. Please remember to visit our Web site,www.mack-cali.com, for updates on ourCompany’s progress throughout the year.

A SUCCESS STORY
101 Hudson Street, Jersey City, N.J.
This 42-story waterfront office tower, acquired in 2005, continues to be a magnet
for world-class businesses. In 2007, National Union Fire Insurance Company of
Pittsburgh, PA—an AIG subsidiary—expanded its space for the fifth time at the
property, to almost 395,000 square feet. Other top tenants at 101 Hudson Street
include Lehman Brothers and Merrill Lynch.

n One of the lowest vacancy rates of majorU.S. markets
n Well-located, high-quality propertiesn Significant barriers to entry in marketn Strong local economy, government growthn Strong tenant base—government/law firms
n Potential for acquisitionsn Land for development of 722,000
square feet
n Good highway access to propertiesn Recovering market
n Properties with value-add opportunitiesn Potential for acquisitions
COMPETITIVE STRENGTHS GROWTH OPPORTUNITIESMARKETS
n Dominant market sharen State’s largest owner of class A office spacen Prime locations/diverse submarkets n Product diversity—office and office/flex space n Broad-based tenancyn Well-leased propertiesn Excellent highway access to propertiesn Significant barriers to entry in market
n Land for development of 9.8 million square feet
n Diverse regional economy n Select submarkets favored for cost-effective
options to Manhattann Country’s fourth largest office market—
offers abundant acquisition opportunities
n Dominant market sharen Prime locations/diverse submarkets n Product diversity—office, office/flex and
industrial/warehouse space n Broad-based tenancyn Industry diversityn Well-leased propertiesn Good highway access to propertiesn Significant barriers to entry in market
n Land for development of 582,250 square feet
n Diverse regional economyn Potential for acquisitionsn Select submarkets favored for cost-effective
options to Manhattan
n High-quality office assetsn Broad-based tenancyn Prime locations, diverse submarketsn Excellent highway access to properties
n Land for development of 150,200 square feet
n Potential for acquisitions
New Jersey
23.4 million square feet ofspace in 179 primarilyclass A office andoffice/flex properties
Westchester County,New York; andFairfield County,Connecticut
5.4 million square feet ofspace in 77 primarily classA office, office/flex andindustrial/warehouseproperties
Suburban Philadelphia
2.0 million square feet ofspace in 18 class A officeproperties
Washington, D.C., and Maryland
1.3 million square feet in10 class A office properties
Boston
667,000 square feet inseven office andoffice/R&D properties
MACK-CALI AT A GLANCE
n One of the lowest vacancy rates of majorU.S. markets
n Well-located, high-quality propertyn Significant barriers to entry in market
n Below-market rents on in-place leasesDowntown Manhattan
524,500 square feet in oneoffice property
10 2007 Annual Report
The Company, serving approximately 2,200 tenants, owns or has interests in 294 properties totaling approximately
34 million square feet plus land for the development of 11.3 million square feet of commercial space. Mack-Cali’s
holdings are located in the Northeast and Mid-Atlantic regions and include approximately 28.3 million square feet of
office space, 5.0 million square feet of office/flex space, and 387,400 square feet of industrial/warehouse space.

PA
NJ
NYCT
MDBOSTON
DC
Clockwise from upper left: One Bridge Plaza, Fort Lee, N.J.; 10 Mountainview Road, Upper Saddle River, N.J.; Harborside Financial Center Plaza 1,
Jersey City, N.J.; 11 Martine Avenue, Westchester Financial Center, White Plains, N.Y.; 1235 Westlakes Drive, Westlakes Office Park, Berwyn, Pa.;
8 Campus Drive, Mack-Cali Business Campus, Parsippany, N.J.
11 2007 Annual Report
Mack-Cali is focused in high-barrier-to-entry markets in the Northeast and Mid-Atlantic regions.
n Mack-Cali Property
Insets below: Washington, D.C./Maryland and Boston, Mass.

Corporate Officers
Mitchell E. HershPresident, Chief Executive Officerand Director
Barry LefkowitzExecutive Vice President and Chief Financial Officer
Michael A. GrossmanExecutive Vice President
Mark YeagerExecutive Vice President
Roger W. ThomasExecutive Vice President, General Counsel and Secretary
John J. CrandallSenior Vice President, Development
Anthony KrugSenior Vice President, Finance
Dean CingolaniFirst Vice President, Property Management
Anthony P. DeCaro, Jr.First Vice President, Property Management
John AdderlyVice President, Leasing
James A. BellVice President, Property Management
Diane ChayesVice President, Leasing
James CorriganVice President, Property Management
Giovanni M. DeBariVice President, Corporate Controller
Christopher DeLorenzoVice President, Leasing
William FitzpatrickVice President, Treasury
John J. MarazzoVice President, Property Management
Nicholas Mitarotonda, Jr.Vice President, Information Systems
Virginia SobolVice President, Marketing and Public Relations
Janice TorchinskyVice President, Human Resources
Daniel WagnerVice President and Senior Associate General Counsel
Jeffrey WarnerVice President, Leasing
Board of Directors
William L. MackChairman of the Board of Directors and Chairman of the Executive Committeeof the Board of Directors, Mack-Cali RealtyCorporation; President and SeniorManaging Partner, The Mack Company; and Managing Partner, Apollo Real Estate Advisors
Martin S. BergerChairman, Robert Martin Company, L.L.C.
Alan S. BernikowChairman of the Audit Committee of theBoard of Directors, Mack-Cali RealtyCorporation; and Former Deputy ChiefExecutive Officer, Deloitte & Touche LLP
John R. CaliMember of the Executive Committee of the Board of Directors, Mack-Cali RealtyCorporation; and Member, Cali Futures
Kenneth M. DubersteinChairman and Chief Executive Officer, The Duberstein Group
Nathan GantcherMember of the Executive Committee of the Board of Directors, Mack-Cali RealtyCorporation; and private investor
Mitchell E. HershPresident, Chief Executive Officer andMember of the Executive Committee of the Board of Directors, Mack-Cali Realty Corporation
David S. MackSenior Partner, The Mack Company
Alan G. PhilibosianAttorney at Law
Dr. Irvin D. ReidPresident, Wayne State University
Vincent TeseChairman, Wireless Cable International, Inc.
Roy J. ZuckerbergMember of the Executive Committee of the Board of Directors, Mack-Cali RealtyCorporation; Senior Director, Goldman Sachs Group, Inc.; andChairman, Samson Capital Advisors
OFFICERS AND DIRECTORS
12 2007 Annual Report

UNITED STATES SECURITIES AND EXCHANGE COMMISSION WASHINGTON, D.C. 20549
FORM 10-K [X] ANNUAL REPORT PURSUANT TO SECTION 13 OR 15(d) OF THE SECURITIES EXCHANGE ACT OF 1934
For the fiscal year ended December 31, 2007 [ ] TRANSITION REPORT PURSUANT TO SECTION 13 OR 15(d) OF THE SECURITIES EXCHANGE ACT OF 1934
Commission File Number: 1-13274
MACK-CALI REALTY CORPORATION (Exact Name of Registrant as specified in its charter)
Maryland 22-3305147 (State or other jurisdiction of (IRS Employer incorporation or organization) Identification No.) 343 Thornall Street, Edison, New Jersey 08837-2206
(Address of principal executive offices) (Zip code)
(732) 590-1000 (Registrant’s telephone number, including area code)
Securities registered pursuant to Section 12(b) of the Act:
(Title of Each Class) (Name of Each Exchange on Which Registered) Common Stock, $0.01 par value New York Stock Exchange Preferred Share Purchase Rights Securities registered pursuant to Section 12(g) of the Act: None
Indicate by check mark if the registrant is a well-known seasoned issuer, as defined in Rule 405 of the Securities Act. Yes X No ___
Indicate by check mark if the registrant is not required to file reports pursuant to Section 13 or Section 15(d) of the Exchange Act. Yes ___ No X
Indicate by check mark whether the registrant (1) has filed all reports required to be filed by Section 13 or 15(d) of the Securities Exchange Act of 1934 during the preceding 12 months (or for such shorter period that the registrant was required to file such reports), and (2) has been subject to such filing requirements for the past 90 days. Yes X No ___
Indicate by check mark if disclosure of delinquent filers pursuant to Item 405 of Regulation S-K is not contained herein, and will not be contained, to the best of the registrant’s knowledge, in definitive proxy or information statements incorporated by reference in Part III of this Form 10-K or any amendments to this Form 10-K. [ X ]
Indicate by check mark whether the registrant is a large accelerated filer, an accelerated filer, a non-accelerated filer or a smaller reporting company. See definition of “accelerated filer,” “large accelerated filer” and “smaller reporting company” in Rule 12b-2 of the Exchange Act. (Check One):
Large accelerated filer X Accelerated filer ___ Non-accelerated filer ___ Smaller reporting company ___
Indicate by check mark whether the registrant is a shell company (as defined in Rule 12b-2 of the Exchange Act.) Yes ___ No X
As of June 30, 2007, the aggregate market value of the voting stock held by non-affiliates of the registrant was $2,922,992,821. The aggregate market value was computed with reference to the closing price on the New York Stock Exchange on such date. This calculation does not reflect a determination that persons are affiliates for any other purpose.
As of February 8, 2008, 65,664,851 shares of common stock, $0.01 par value, of the Company (“Common Stock”) were outstanding.
LOCATION OF EXHIBIT INDEX: The index of exhibits is contained herein on page number 122.
DOCUMENTS INCORPORATED BY REFERENCE: Portions of the registrant’s definitive proxy statement for fiscal year ended December 31, 2007 to be
issued in conjunction with the registrant’s annual meeting of shareholders expected to be held on May 21, 2008 are incorporated by reference in Part III of this Form 10-K. The definitive proxy statement will be filed by the registrant with the SEC not later than 120 days from the end of the registrant’s fiscal year ended December 31, 2007.

2
FORM 10-K Table of Contents PART I Page No. Item 1 Business 3 Item 1A Risk Factors 8 Item 1B Unresolved Staff Comments 16 Item 2 Properties 17 Item 3 Legal Proceedings 37 Item 4 Submission of Matters to a Vote of Security Holders 37 PART II Item 5 Market for Registrant’s Common Equity, Related Stockholder Matters and Issuer Purchases of Equity Securities 38 Item 6 Selected Financial Data 41 Item 7 Management’s Discussion and Analysis of Financial Condition and Results of Operations 42 Item 7A Quantitative and Qualitative Disclosures About Market Risk 61 Item 8 Financial Statements and Supplementary Data 62 Item 9 Changes in and Disagreements with Accountants on Accounting and Financial Disclosure 62 Item 9A Controls and Procedures 62 Item 9B Other Information 63 PART III Item 10 Directors, Executive Officers and Corporate Governance 63 Item 11 Executive Compensation 63 Item 12 Security Ownership of Certain Beneficial Owners and Management and Related Stockholder Matters 63 Item 13 Certain Relationships and Related Transactions, and Director Independence 63 Item 14 Principal Accounting Fees and Services 63 PART IV Item 15 Exhibits and Financial Statement Schedules 64
SIGNATURES 120 EXHIBIT INDEX 122

3
PART I
ITEM 1. BUSINESS GENERAL Mack-Cali Realty Corporation, a Maryland corporation (together with its subsidiaries, the “Company”), is a fully-integrated, self-administered and self-managed real estate investment trust (“REIT”) that owns and operates a real estate portfolio comprised predominantly of Class A office and office/flex properties located primarily in the Northeast. The Company performs substantially all commercial real estate leasing, management, acquisition, development and construction services on an in-house basis. Mack-Cali Realty Corporation was incorporated on May 24, 1994. The Company’s executive offices are located at 343 Thornall Street, Edison, New Jersey 08837-2206, and its telephone number is (732) 590-1000. The Company has an internet website at www.mack-cali.com. As of December 31, 2007, the Company owned or had interests in 294 properties, aggregating approximately 33.7 million square feet, plus developable land (collectively, the “Properties”), which are leased to approximately 2,200 tenants. The Properties are comprised of: (a) 255 wholly-owned or Company-controlled properties consisting of 150 office buildings and 95 office/flex buildings aggregating approximately 28.8 million square feet, six industrial/warehouse buildings totaling approximately 387,400 square feet, two stand-alone retail properties totaling approximately 17,300 square feet, and two land leases (collectively, the “Consolidated Properties”); and (b) 38 buildings, which are primarily office properties, aggregating approximately 4.5 million square feet, and a 350-room hotel, which are owned by unconsolidated joint ventures in which the Company has investment interests. Unless otherwise indicated, all references to square feet represent net rentable area. As of December 31, 2007, the office, office/flex, industrial/warehouse and stand-alone retail properties included in the Consolidated Properties were 92.7 percent leased. Percentage leased includes all leases in effect as of the period end date, some of which have commencement dates in the future (including, at December 31, 2007, a lease with a commencement date substantially in the future consisting of 8,590 square feet scheduled to commence in 2009), and leases that expire at the period end date. Leases that expire as of December 31, 2007 aggregate 146,261 square feet, or 0.5 percent of the net rentable square footage. The Properties are located in six states, primarily in the Northeast, and the District of Columbia. See Item 2: Properties. The Company’s strategy has been to focus its operations, acquisition and development of office properties in high-barrier-to-entry markets and sub-markets where it believes it is, or can become, a significant and preferred owner and operator. The Company plans to continue this strategy by expanding through acquisitions and/or development in Northeast markets where it has, or can achieve, similar status. The Company believes that its Properties have excellent locations and access and are well-maintained and professionally managed. As a result, the Company believes that its Properties attract high quality tenants and achieve among the highest rental, occupancy and tenant retention rates within their markets. The Company also believes that its extensive market knowledge provides it with a significant competitive advantage, which is further enhanced by its strong reputation for, and emphasis on, delivering highly responsive, professional management services. See “Business Strategies.” As of December 31, 2007, executive officers and directors of the Company and their affiliates owned approximately 9 percent of the Company’s outstanding shares of Common Stock (including Units redeemable into shares of Common Stock). As used herein, the term “Units” refers to limited partnership interests in Mack-Cali Realty, L.P., a Delaware limited partnership (the “Operating Partnership”) through which the Company conducts its real estate activities. The Company’s executive officers have been employed by the Company and/or its predecessor companies for an average of approximately 20 years. BUSINESS STRATEGIES Operations Reputation: The Company has established a reputation as a highly-regarded landlord with an emphasis on delivering quality tenant services in buildings it owns and/or manages. The Company believes that its continued success depends in part on enhancing its reputation as an operator of choice, which will facilitate the retention of current tenants and the attraction of new tenants. The Company believes it provides a superior level of service to its tenants, which should in turn, allow the Company to outperform the market with respect to occupancy rates, as well as improve tenant retention.

4
Communication with tenants: The Company emphasizes frequent communication with tenants to ensure first-class service to the Properties. Property management personnel generally are located on site at the Properties to provide convenient access to management and to ensure that the Properties are well-maintained. Property management’s primary responsibility is to ensure that buildings are operated at peak efficiency in order to meet both the Company’s and tenants’ needs and expectations. Property management personnel additionally budget and oversee capital improvements and building system upgrades to enhance the Properties’ competitive advantages in their markets and to maintain the quality of the Company’s properties. Additionally, the Company’s in-house leasing representatives develop and maintain long-term relationships with the Company’s diverse tenant base and coordinate leasing, expansion, relocation and build-to-suit opportunities within the Company’s portfolio. This approach allows the Company to offer office space in the appropriate size and location to current or prospective tenants in any of its sub-markets. Growth The Company plans to continue to own and operate a portfolio of properties in high-barrier-to-entry markets, with a primary focus in the Northeast. The Company’s primary objectives are to maximize operating cash flow and to enhance the value of its portfolio through effective management, acquisition, development and property sales strategies, as follows: Internal Growth: The Company seeks to maximize the value of its existing portfolio through implementing operating strategies designed to produce the highest effective rental and occupancy rates and lowest tenant installation cost within the markets that it operates. The Company continues to pursue internal growth through re-leasing space at higher effective rents with contractual rent increases and developing or redeveloping space for its diverse base of high credit tenants, including New Cingular Wireless PCS LLC, Morgan Stanley and The United States of America - GSA. In addition, the Company seeks economies of scale through volume discounts to take advantage of its size and dominance in particular sub-markets, and operating efficiencies through the use of in-house management, leasing, marketing, financing, accounting, legal, development and construction services. Acquisitions: The Company also believes that growth opportunities exist through acquiring operating properties or properties for redevelopment with attractive returns in its core Northeast sub-markets where, based on its expertise in leasing, managing and operating properties, it believes it is, or can become, a significant and preferred owner and operator. The Company intends either directly or through joint ventures to acquire, invest in or redevelop additional properties that: (i) are expected to provide attractive initial yields with potential for growth in cash flow from operations; (ii) are well-located, of high quality and competitive in their respective sub-markets; (iii) are located in its existing sub-markets or in sub-markets in which the Company can become a significant and preferred owner and operator; and (iv) it believes have been under-managed or are otherwise capable of improved performance through intensive management, capital improvements and/or leasing that should result in increased effective rental and occupancy rates. Development: The Company seeks to selectively develop additional properties either directly or through joint ventures where it believes such development will result in a favorable risk-adjusted return on investment in coordination with the above operating strategies. Such development primarily will occur: (i) when leases have been executed prior to construction; (ii) in stable core Northeast sub-markets where the demand for such space exceeds available supply; and (iii) where the Company is, or can become, a significant and preferred owner and operator. Property Sales: While management’s principal intention is to own and operate its properties on a long-term basis, it periodically assesses the attributes of each of its properties, with a particular focus on the supply and demand fundamentals of the sub-markets in which they are located. Based on these ongoing assessments, the Company may, from time to time, decide to sell any of its properties. Financial The Company currently intends to maintain a ratio of debt-to-undepreciated assets (total debt of the Company as a percentage of total undepreciated assets) of 50 percent or less. As of December 31, 2007 and 2006, the Company’s total debt constituted approximately 40.2 and 41.4 percent of total undepreciated assets of the Company, respectively. The Company has three investment grade credit ratings. Standard & Poor’s Rating Services (“S&P”) and Fitch, Inc. (“Fitch”) have each assigned their BBB rating to existing and prospective senior unsecured debt of the Operating Partnership. S&P and Fitch have also assigned their BBB- rating to existing and prospective preferred stock offerings of the Company. Moody’s Investors Service (“Moody’s”) has assigned its Baa2 rating to existing and prospective senior

5
unsecured debt of the Operating Partnership and its Baa3 rating to existing and prospective preferred stock offerings of the Company. Although there is no limit in the Company’s organizational documents on the amount of indebtedness that the Company may incur or a requirement for the maintenance of investment grade credit ratings, the Company has entered into certain financial agreements which contain covenants that limit the Company’s ability to incur indebtedness under certain circumstances. The Company intends to conduct its operations so as to best be able to maintain its investment grade rated status. The Company intends to utilize the most appropriate sources of capital for future acquisitions, development, capital improvements and other investments, which may include funds from operating activities, proceeds from property and land sales, short-term and long-term borrowings (including draws on the Company’s revolving credit facility), and the issuance of additional debt or equity securities. EMPLOYEES As of December 31, 2007, the Company had approximately 485 full-time employees. COMPETITION The leasing of real estate is highly competitive. The Properties compete for tenants with lessors and developers of similar properties located in their respective markets primarily on the basis of location, rent charged, services provided, and the design and condition of the Properties. The Company also experiences competition when attempting to acquire or dispose of real estate, including competition from domestic and foreign financial institutions, other REITs, life insurance companies, pension trusts, trust funds, partnerships, individual investors and others. REGULATIONS Many laws and governmental regulations are applicable to the Properties and changes in these laws and regulations, or their interpretation by agencies and the courts, occur frequently. Under various laws and regulations relating to the protection of the environment, an owner of real estate may be held liable for the costs of removal or remediation of certain hazardous or toxic substances located on or in the property. These laws often impose liability without regard to whether the owner was responsible for, or even knew of, the presence of such substances. The presence of such substances may adversely affect the owner’s ability to rent or sell the property or to borrow using such property as collateral and may expose it to liability resulting from any release of, or exposure to, such substances. Persons who arrange for the disposal or treatment of hazardous or toxic substances at another location may also be liable for the costs of removal or remediation of such substances at the disposal or treatment facility, whether or not such facility is owned or operated by such person. Certain environmental laws impose liability for the release of asbestos-containing materials into the air, and third parties may also seek recovery from owners or operators of real properties for personal injury associated with asbestos-containing materials and other hazardous or toxic substances. In connection with the ownership (direct or indirect), operation, management and development of real properties, the Company may be considered an owner or operator of such properties or as having arranged for the disposal or treatment of hazardous or toxic substances and, therefore, potentially liable for removal or remediation costs, as well as certain other related costs, including governmental penalties and injuries to persons and property. There can be no assurance that (i) future laws, ordinances or regulations will not impose any material environmental liability, (ii) the current environmental condition of the Properties will not be affected by tenants, by the condition of land or operations in the vicinity of the Properties (such as the presence of underground storage tanks), or by third parties unrelated to the Company, or (iii) the Company’s assessments reveal all environmental liabilities and that there are no material environmental liabilities of which the Company is aware. If compliance with the various laws and regulations, now existing or hereafter adopted, exceeds the Company’s budgets for such items, the Company’s ability to make expected distributions to stockholders could be adversely affected. There are no other laws or regulations which have a material effect on the Company’s operations, other than typical federal, state and local laws affecting the development and operation of real property, such as zoning laws. INDUSTRY SEGMENTS The Company operates in two industry segments: (i) real estate; and (ii) construction services. As of December 31,

6
2007, the Company does not have any foreign operations and its business is not seasonal. In May 2006, in conjunction with the Company’s acquisition of the Gale Company and related businesses, the Company acquired a business specializing solely in construction and related services whose operations comprise the Company’s construction services segment. Please see our financial statements attached hereto and incorporated by reference herein for financial information relating to our industry segments. RECENT DEVELOPMENTS The Company’s core markets continue to be weak. The percentage leased in the Company’s consolidated portfolio of stabilized operating properties was 92.7 percent at December 31, 2007 as compared to 92.0 percent at December 31, 2006 and 91.0 percent at December 31, 2005. Percentage leased includes all leases in effect as of the period end date, some of which have commencement dates in the future (including, at December 31, 2007, a lease with a commencement date substantially in the future consisting of 8,590 square feet scheduled to commence in 2009), and leases that expire at the period end date. Leases that expired as of December 31, 2007, 2006 and 2005 aggregate 146,261, 103,477 and 311,623 square feet, respectively, or 0.5, 0.4 and 1.1 percentage of the net rentable square footage, respectively. Rental rates on the Company’s space that was re-leased (based on first rents payable) during the year ended December 31, 2007 decreased an average of 0.2 percent compared to rates that were in effect under the prior leases, as compared to a 0.2 percent decrease in 2006 and an 8.2 percent decrease in 2005. The Company believes that vacancy rates may continue to increase in some of its markets in 2008. As a result, the Company’s future earnings and cash flow may continue to be negatively impacted by current market conditions. Property Acquisitions The Company acquired the following office properties during the year ended December 31, 2007: (dollars in thousands) Acquisition # of Rentable Acquisition Date Property/Address Location Bldgs. Square Feet Cost 05/08/07 AAA Properties (a) (c) Hamilton Township, New Jersey 2 69,232 $ 9,048 06/11/07 125 Broad Street (b) (c) New York, New York 1 524,476 274,091 Total Property Acquisitions: 3 593,708 $283,139 (a) Included in this transaction was the acquisition of two parcels of developable land aggregating approximately 13 acres. (b) Acquisition represented two units of office condominium interests, which collectively comprise floors 2 through 16, or
39.6 percent, of the 40-story, 1.2 million square-foot building. (c) Transaction was funded primarily through borrowing on the Company’s revolving credit facility. Properties Commencing Initial Operations The following office property commenced initial operations during the year ended December 31, 2007 (dollars in thousands): # of Rentable Investment by Date Property/Address Location Bldgs. Square Feet Company (a) 05/08/07 700 Horizon Drive Hamilton Township, New Jersey 1 120,000 $16,751 Total Properties Commencing Initial Operations: 1 120,000 $16,751 (a) Development costs were funded primarily through borrowing on the Company’s revolving credit facility. Amounts are as
of December 31, 2007. Land Acquisition In February 2007, the Company exercised its option to acquire approximately 43 acres of land sites within its Capital Office Park complex in Greenbelt, Maryland, which is able to accommodate the development of up to 600,000 square feet of office space, for $13 million. On May 25, 2007, the Company completed the purchase of the land for approximately $13 million, which consisted of 114,911 common operating partnership units valued at $5.2 million, and the remainder in cash. Sales The Company sold the following office properties during the year ended December 31, 2007: (dollars in thousands)

7
Rentable Net Net Sale # of Square Sales Book Realized Date Property/Address Location Bldgs. Feet Proceeds Value Gain 05/10/07 1000 Bridgeport Avenue Shelton, Connecticut 1 133,000 $16,411 $13,782 $ 2,62906/11/07 500 W. Putnam Avenue Greenwich, Connecticut 1 121,250 54,344 18,113 36,23107/13/07 100 & 200 Decadon Drive Egg Harbor, New Jersey 2 80,344 11,448 5,894 5,554 Total Office Property Sales: 4 334,594 $82,203 $37,789 $44,414 FINANCING ACTIVITY On February 7, 2007, the Company completed an underwritten offer and sale of 4,650,000 shares of its common stock and used the net proceeds, which totaled approximately $252 million (after offering costs), primarily to pay down its outstanding borrowings under the Company’s revolving credit facility and for general corporate purposes. On September 12, 2007, the Board of Directors authorized an increase to the Company’s repurchase program under which the Company was permitted to purchase up to $150 million of the Company’s outstanding common stock (“Repurchase Program”). During the year ended December 31, 2007 and through February 8, 2008, the Company purchased and retired 2,893,630 shares of its outstanding common stock for an aggregate cost of approximately $104 million. The Company has a remaining authorization to repurchase up to approximately $46 million of its outstanding common stock, which it may repurchase from time to time in open market transactions at prevailing prices or through privately negotiated transactions. AVAILABLE INFORMATION The Company’s internet website is www.mack-cali.com. The Company makes available free of charge on or through its website its annual reports on Form 10-K, quarterly reports on Form 10-Q, current reports on Form 8-K and amendments to those reports filed or furnished pursuant to Section 13(a) of the Securities Exchange Act of 1934, as amended, as soon as reasonably practicable after it electronically files or furnishes such materials to the Securities and Exchange Commission. In addition, the Company’s internet website includes other items related to corporate governance matters, including, among other things, the Company’s corporate governance guidelines, charters of various committees of the Board of Directors, and the Company’s code of business conduct and ethics applicable to all employees, officers and directors. The Company intends to disclose on its internet website any amendments to or waivers from its code of business conduct and ethics as well as any amendments to its corporate governance principles or the charters of various committees of the Board of Directors. Copies of these documents may be obtained, free of charge, from our internet website. Any shareholder also may obtain copies of these documents, free of charge, by sending a request in writing to: Mack-Cali Investor Relations Department, 343 Thornall Street, Edison, NJ 08837-2206. DISCLOSURE REGARDING FORWARD-LOOKING STATEMENTS We consider portions of this report, including the documents incorporated by reference, to be forward-looking statements within the meaning of Section 21E of the Securities Exchange Act of 1934, as amended. We intend such forward-looking statements to be covered by the safe harbor provisions for forward-looking statements contained in Section 21E of such act. Such forward-looking statements relate to, without limitation, our future economic performance, plans and objectives for future operations and projections of revenue and other financial items. Forward-looking statements can be identified by the use of words such as “may,” “will,” “plan,” “should,” “expect,” “anticipate,” “estimate,” “continue” or comparable terminology. Forward-looking statements are inherently subject to risks and uncertainties, many of which we cannot predict with accuracy and some of which we might not even anticipate. Although we believe that the expectations reflected in such forward-looking statements are based upon reasonable assumptions at the time made, we can give no assurance that such expectations will be achieved. Future events and actual results, financial and otherwise, may differ materially from the results discussed in the forward-looking statements. Readers are cautioned not to place undue reliance on these forward-looking statements.
Among the factors about which we have made assumptions are:
• changes in the general economic climate and conditions, including those affecting industries in

8
which our principal tenants operate; • the extent of any tenant bankruptcies or of any early lease terminations; • our ability to lease or re-lease space at current or anticipated rents; • changes in the supply of and demand for office, office/flex and industrial/warehouse properties; • changes in interest rate levels; • changes in operating costs; • our ability to obtain adequate insurance, including coverage for terrorist acts; • the availability of financing; • changes in governmental regulation, tax rates and similar matters; and • other risks associated with the development and acquisition of properties, including risks that the
development may not be completed on schedule, that the tenants will not take occupancy or pay rent, or that development or operating costs may be greater than anticipated.
For further information on factors which could impact us and the statements contained herein, see Item 1A: Risk Factors. We assume no obligation to update and supplement forward-looking statements that become untrue because of subsequent events, new information or otherwise. ITEM 1A. RISK FACTORS Our results from operations and ability to make distributions on our equity and debt service on our indebtedness may be affected by the risk factors set forth below. All investors should consider the following risk factors before deciding to purchase securities of the Company. The Company refers to itself as “we” or “our” in the following risk factors. Declines in economic activities in the Northeastern office markets could adversely affect our operating results. A majority of our revenues are derived from our properties located in the Northeast, particularly in New Jersey, New York and Pennsylvania. Adverse economic developments in this region could adversely impact the operations of our properties and, therefore, our profitability. Because our portfolio consists primarily of office and office/flex buildings (as compared to a more diversified real estate portfolio), a decline in the economy and/or a decline in the demand for office space may adversely affect our ability to make distributions or payments to our investors. Our performance is subject to risks associated with the real estate industry. General: Our business and our ability to make distributions or payments to our investors depend on the ability of our properties to generate funds in excess of operating expenses (including scheduled principal payments on debt and capital expenditures). Events or conditions that are beyond our control may adversely affect our operations and the value of our properties. Such events or conditions could include:
• changes in the general economic climate; • changes in local conditions, such as an oversupply of office space, a reduction in demand for office
space, or reductions in office market rental rates; • decreased attractiveness of our properties to tenants; • competition from other office and office/flex properties; • our inability to provide adequate maintenance; • increased operating costs, including insurance premiums, utilities and real estate taxes, due to inflation
and other factors which may not necessarily be offset by increased rents; • changes in laws and regulations (including tax, environmental, zoning and building codes, and housing
laws and regulations) and agency or court interpretations of such laws and regulations and the related costs of compliance;
9
• changes in interest rate levels and the availability of financing; • the inability of a significant number of tenants to pay rent; • our inability to rent office space on favorable terms; and • civil unrest, earthquakes, acts of terrorism and other natural disasters or acts of God that may result in
uninsured losses. We may suffer adverse consequences if our revenues decline since our operating costs do not necessarily decline in proportion to our revenue: We earn a significant portion of our income from renting our properties. Our operating costs, however, do not necessarily fluctuate in relation to changes in our rental revenue. This means that our costs will not necessarily decline even if our revenues do. Our operating costs could also increase while our revenues do not. If our operating costs increase but our rental revenues do not, we may be forced to borrow to cover our costs, we may incur losses and we may not have cash available for distributions to our stockholders. Financially distressed tenants may be unable to pay rent: If a tenant defaults, we may experience delays and incur substantial costs in enforcing our rights as landlord and protecting our investments. If a tenant files for bankruptcy, a potential court judgment rejecting and terminating such tenant’s lease could adversely affect our ability to make distributions or payments to our investors. Renewing leases or re-letting space could be costly: If a tenant does not renew its lease upon expiration or terminates its lease early, we may not be able to re-lease the space. If a tenant does renew its lease or we re-lease the space, the terms of the renewal or new lease, including the cost of required renovations or concessions to the tenant, may be less favorable than the current lease terms, which could adversely affect our ability to make distributions or payments to our investors. Our insurance coverage on our properties may be inadequate: We currently carry comprehensive insurance on all of our properties, including insurance for liability, fire and flood. We cannot guarantee that the limits of our current policies will be sufficient in the event of a catastrophe to our properties. We cannot guarantee that we will be able to renew or duplicate our current insurance coverage in adequate amounts or at reasonable prices. In addition, while our current insurance policies insure us against loss from terrorist acts and toxic mold, in the future, insurance companies may no longer offer coverage against these types of losses, or, if offered, these types of insurance may be prohibitively expensive. If any or all of the foregoing should occur, we may not have insurance coverage against certain types of losses and/or there may be decreases in the limits of insurance available. Should an uninsured loss or a loss in excess of our insured limits occur, we could lose all or a portion of the capital we have invested in a property or properties, as well as the anticipated future revenue from the property or properties. Nevertheless, we might remain obligated for any mortgage debt or other financial obligations related to the property or properties. We cannot guarantee that material losses in excess of insurance proceeds will not occur in the future. If any of our properties were to experience a catastrophic loss, it could seriously disrupt our operations, delay revenue and result in large expenses to repair or rebuild the property. Such events could adversely affect our ability to make distributions or payments to our investors. Illiquidity of real estate limits our ability to act quickly: Real estate investments are relatively illiquid. Such illiquidity may limit our ability to react quickly in response to changes in economic and other conditions. If we want to sell an investment, we might not be able to dispose of that investment in the time period we desire, and the sales price of that investment might not recoup or exceed the amount of our investment. The prohibition in the Internal Revenue Code of 1986, as amended (the “Code”), and related regulations on a real estate investment trust holding property for sale also may restrict our ability to sell property. In addition, we acquired a significant number of our properties from individuals to whom we issued Units as part of the purchase price. In connection with the acquisition of these properties, in order to preserve such individual’s income tax deferral, we contractually agreed not to sell or otherwise transfer the properties for a specified period of time, except in a manner which does not result in recognition of any built-in-gain (which may result in an income tax liability) or which reimburses the appropriate individuals for the income tax consequences of the recognition of such built-in-gains. As of December 31, 2007, 13 of our properties, with an aggregate net book value of approximately $220.9 million, were subject to these restrictions, which expire periodically through 2016. For those properties where such restrictions have lapsed, we are generally required to use commercially reasonable efforts to prevent any sale, transfer or other disposition of the subject properties from resulting in the recognition of built-in gain to the appropriate individuals. 124 of our properties, with an aggregate net book value of approximately $1.9 billion, have lapsed restrictions and are subject to these conditions. The above limitations on our ability to sell our investments could adversely affect our ability to make distributions or payments to our investors.

10
Americans with Disabilities Act compliance could be costly: Under the Americans with Disabilities Act of 1990 (“ADA”), all public accommodations and commercial facilities must meet certain federal requirements related to access and use by disabled persons. Compliance with the ADA requirements could involve removal of structural barriers from certain disabled persons’ entrances. Other federal, state and local laws may require modifications to or restrict further renovations of our properties with respect to such accesses. Although we believe that our properties are substantially in compliance with present requirements, noncompliance with the ADA or related laws or regulations could result in the United States government imposing fines or private litigants being awarded damages against us. Such costs may adversely affect our ability to make distributions or payments to our investors. Environmental problems are possible and may be costly: Various federal, state and local laws and regulations subject property owners or operators to liability for the costs of removal or remediation of certain hazardous or toxic substances located on or in the property. These laws often impose liability without regard to whether the owner or operator was responsible for or even knew of the presence of such substances. The presence of or failure to properly remediate hazardous or toxic substances (such as toxic mold) may adversely affect our ability to rent, sell or borrow against contaminated property and may impose liability upon us for personal injury to persons exposed to such substances. Various laws and regulations also impose liability on persons who arrange for the disposal or treatment of hazardous or toxic substances at another location for the costs of removal or remediation of such substances at the disposal or treatment facility. These laws often impose liability whether or not the person arranging for such disposal ever owned or operated the disposal facility. Certain other environmental laws and regulations impose liability on owners or operators of property for injuries relating to the release of asbestos-containing or other materials into the air, water or otherwise into the environment. As owners and operators of property and as potential arrangers for hazardous substance disposal, we may be liable under such laws and regulations for removal or remediation costs, governmental penalties, property damage, personal injuries and related expenses. Payment of such costs and expenses could adversely affect our ability to make distributions or payments to our investors. Competition for acquisitions may result in increased prices for properties: We plan to acquire additional properties in New Jersey, New York and Pennsylvania and in the Northeast generally. We may be competing for investment opportunities with entities that have greater financial resources. Several office building developers and real estate companies may compete with us in seeking properties for acquisition, land for development and prospective tenants. Such competition may adversely affect our ability to make distributions or payments to our investors by:
• reducing the number of suitable investment opportunities offered to us; • increasing the bargaining power of property owners; • interfering with our ability to attract and retain tenants; • increasing vacancies which lowers market rental rates and limits our ability to negotiate rental rates;
and/or • adversely affecting our ability to minimize expenses of operation.
New acquisitions may fail to perform as expect: We may require new office properties, assuming we are able to obtain capital on favorable terms. Such newly acquired properties may not perform as expected. Inaccurate assumptions regarding future rental or occupancy rates could result in overly optimistic estimates of future revenues. In addition, future operating expenses or the costs necessary to bring an acquired property up to standards established for its intended market position may be underestimated. Development of real estate could be costly: As part of our operating strategy, we may acquire land for development or construct on owned land, under certain conditions. Included among the risks of the real estate development business are the following, which may adversely affect our ability to make distributions or payments to our investors:
• financing for development projects may not be available on favorable terms; • long-term financing may not be available upon completion of construction; and • failure to complete construction on schedule or within budget may increase debt service expense and
construction costs. Property ownership through joint ventures could subject us to the contrary business objectives of our co-venturers: We, from time to time, invest in joint ventures or partnerships in which we do not hold a controlling interest in the assets underlying the entities in which we invest, including joint ventures in which (i) we own a direct interest in an entity

11
which controls such assets, or (ii) we own a direct interest in an equity which owns indirect interests, through one or more intermediaries, of such assets. These investments involve risks that do not exist with properties in which we own a controlling interest with respect to the underlying assets, including the possibility that our co-venturers or partners may, at any time, have business, economic or other objectives that are inconsistent with our objectives. Because we lack a controlling interest, our co-venturers or partners may be in a position to take action contrary to our instructions or requests or contrary to our policies or objectives. While we seek protective rights against such contrary actions, there can be no assurance that we will be successful in procuring any such protective rights, or if procured, that the rights will be sufficient to fully protect us against contrary actions. Our organizational documents do not limit the amount of available funds that we may invest in joint ventures or partnerships. If the objectives of our co-venturers or partners are inconsistent with ours, it may adversely affect our ability to make distributions or payments to our investors. Our real estate construction management activities are subject to risks particular to third-party construction projects. As a result of the Gale/Green Transactions, we now perform fixed price construction services for third parties and we are subject to a variety of risks unique to these activities. If construction costs of a project exceed original estimates, such costs may have to be absorbed by us, thereby making the project less profitable than originally estimated, or possibly not profitable at all. In addition, a construction project may be delayed due to government or regulatory approvals, supply shortages, or other events and circumstances beyond our control, or the time required to complete a construction project may be greater than originally anticipated. If any such excess costs or project delays were to be material, such events may adversely effect our cash flow and liquidity and thereby impact our ability to pay dividends or make distributions to our investors. Debt financing could adversely affect our economic performance. Scheduled debt payments and refinancing could adversely affect our financial condition: We are subject to the risks normally associated with debt financing. These risks, including the following, may adversely affect our ability to make distributions or payments to our investors:
• our cash flow may be insufficient to meet required payments of principal and interest; • payments of principal and interest on borrowings may leave us with insufficient cash resources to pay
operating expenses; • we may not be able to refinance indebtedness on our properties at maturity; and • if refinanced, the terms of refinancing may not be as favorable as the original terms of the related
indebtedness. As of December 31, 2007, we had total outstanding indebtedness of $2.2 billion comprised of $1.6 billion of senior unsecured notes, outstanding borrowings of $250 million under our $775 million revolving credit facility and approximately $329 million of mortgage loans payable and other obligations indebtedness. We may have to refinance the principal due on our current or future indebtedness at maturity, and we may not be able to do so. If we are unable to refinance our indebtedness on acceptable terms, or at all, events or conditions that may adversely affect our ability to make distributions or payments to our investors include the following:
• we may need to dispose of one or more of our properties upon disadvantageous terms; • prevailing interest rates or other factors at the time of refinancing could increase interest rates and,
therefore, our interest expense; • if we mortgage property to secure payment of indebtedness and are unable to meet mortgage
payments, the mortgagee could foreclose upon such property or appoint a receiver to receive an assignment of our rents and leases; and
• foreclosures upon mortgaged property could create taxable income without accompanying cash proceeds and, therefore, hinder our ability to meet the real estate investment trust distribution requirements of the Internal Revenue Code.
We are obligated to comply with financial covenants in our indebtedness that could restrict our range of operating activities: The mortgages on our properties contain customary negative covenants, including limitations on our ability, without the prior consent of the lender, to further mortgage the property, to enter into new leases outside of stipulated guidelines or to materially modify existing leases. In addition, our credit facility contains customary requirements,

12
including restrictions and other limitations on our ability to incur debt, debt to assets ratios, secured debt to total assets ratios, interest coverage ratios and minimum ratios of unencumbered assets to unsecured debt. The indentures under which our senior unsecured debt have been issued contain financial and operating covenants including coverage ratios and limitations on our ability to incur secured and unsecured debt. These covenants limit our flexibility in conducting our operations and create a risk of default on our indebtedness if we cannot continue to satisfy them. Rising interest rates may adversely affect our cash flow: As of December 31, 2007, outstanding borrowings of approximately $250 million under our revolving credit facility bear interest at variable rates. We may incur additional indebtedness in the future that also bears interest at variable rates. Variable rate debt creates higher debt service requirements if market interest rates increase. Higher debt service requirements could adversely affect our ability to make distributions or payments to our investors and/or cause us to default under certain debt covenants. Our degree of leverage could adversely affect our cash flow: We fund acquisition opportunities and development partially through short-term borrowings (including our revolving credit facility), as well as from proceeds from property sales and undistributed cash. We expect to refinance projects purchased with short-term debt either with long-term indebtedness or equity financing depending upon the economic conditions at the time of refinancing. Our Board of Directors has a general policy of limiting the ratio of our indebtedness to total undepreciated assets (total debt as a percentage of total undepreciated assets) to 50 percent or less, although there is no limit in Mack-Cali Realty, L.P.’s or our organizational documents on the amount of indebtedness that we may incur. However, we have entered into certain financial agreements which contain financial and operating covenants that limit our ability under certain circumstances to incur additional secured and unsecured indebtedness. The Board of Directors could alter or eliminate its current policy on borrowing at any time at its discretion. If this policy were changed, we could become more highly leveraged, resulting in an increase in debt service that could adversely affect our cash flow and our ability to make distributions or payments to our investors and/or could cause an increased risk of default on our obligations. We are dependent on external sources of capital for future growth: To qualify as a real estate investment trust, we must distribute to our shareholders each year at least 90 percent of our net taxable income, excluding any net capital gain. Because of this distribution requirement, it is not likely that we will be able to fund all future capital needs, including for acquisitions and developments, from income from operations. Therefore, we will have to rely on third-party sources of capital, which may or may not be available on favorable terms or at all. Our access to third-party sources of capital depends on a number of things, including the market’s perception of our growth potential and our current and potential future earnings. Moreover, additional equity offerings may result in substantial dilution of our shareholders’ interests, and additional debt financing may substantially increase our leverage. Competition for skilled personnel could increase our labor costs. We compete with various other companies in attracting and retaining qualified and skilled personnel. We depend on our ability to attract and retain skilled management personnel who are responsible for the day-to-day operations of our company. Competitive pressures may require that we enhance our pay and benefits package to compete effectively for such personnel. We may not be able to offset such added costs by increasing the rates we charge our tenants. If there is an increase in these costs or if we fail to attract and retain qualified and skilled personnel, our business and operating results could be harmed. We are dependent on our key personnel whose continued service is not guaranteed. We are dependent upon our executive officers for strategic business direction and real estate experience. While we believe that we could find replacements for these key personnel, loss of their services could adversely affect our operations. We have entered into an employment agreement (including non-competition provisions) which provides for a continuous four-year employment term with each of Mitchell E. Hersh, Barry Lefkowitz and Roger W. Thomas, a continuous one-year employment term with Michael A. Grossman, and a three-year employment term with Mark Yeager which, as of May 9, 2009, shall convert to a continuous one-year employment term. We do not have key man life insurance for our executive officers. Certain provisions of Maryland law and our charter and bylaws as well as our stockholder rights plan could hinder, delay or prevent changes in control. Certain provisions of Maryland law, our charter and our bylaws, as well as our stockholder rights plan have the effect of discouraging, delaying or preventing transactions that involve an actual or threatened change in control. These provisions include the following:
13
Classified Board of Directors: Our Board of Directors is divided into three classes with staggered terms of office of three years each. The classification and staggered terms of office of our directors make it more difficult for a third party to gain control of our board of directors. At least two annual meetings of stockholders, instead of one, generally would be required to affect a change in a majority of the board of directors. Removal of Directors: Under our charter, subject to the rights of one or more classes or series of preferred stock to elect one or more directors, a director may be removed only for cause and only by the affirmative vote of at least two-thirds of all votes entitled to be cast by our stockholders generally in the election of directors. Neither the Maryland General Corporation Law nor our charter define the term “cause.” As a result, removal for “cause” is subject to Maryland common law and to judicial interpretation and review in the context of the facts and circumstances of any particular situation. Number of Directors, Board Vacancies, Terms of Office: We have, in our bylaws, elected to be subject to certain provisions of Maryland law which vest in the Board of Directors the exclusive right to determine the number of directors and the exclusive right, by the affirmative vote of a majority of the remaining directors, even if the remaining directors do not constitute a quorum, to fill vacancies on the board. These provisions of Maryland law, which are applicable even if other provisions of Maryland law or the charter or bylaws provide to the contrary, also provide that any director elected to fill a vacancy shall hold office for the remainder of the full term of the class of directors in which the vacancy occurred, rather than the next annual meeting of stockholders as would otherwise be the case, and until his or her successor is elected and qualifies. Stockholder Requested Special Meetings: Our bylaws provide that our stockholders have the right to call a special meeting only upon the written request of the stockholders entitled to cast not less than a majority of all the votes entitled to be cast by the stockholders at such meeting. Advance Notice Provisions for Stockholder Nominations and Proposals: Our bylaws require advance written notice for stockholders to nominate persons for election as directors at, or to bring other business before, any meeting of stockholders. This bylaw provision limits the ability of stockholders to make nominations of persons for election as directors or to introduce other proposals unless we are notified in a timely manner prior to the meeting. Exclusive Authority of the Board to Amend the Bylaws: Our bylaws provide that our board of directors has the exclusive power to adopt, alter or repeal any provision of the bylaws or to make new bylaws. Thus, our stockholders may not effect any changes to our bylaws. Preferred Stock: Under our charter, our Board of Directors has authority to issue preferred stock from time to time in one or more series and to establish the terms, preferences and rights of any such series of preferred stock, all without approval of our stockholders. Duties of Directors with Respect to Unsolicited Takeovers: Maryland law provides protection for Maryland corporations against unsolicited takeovers by limiting, among other things, the duties of the directors in unsolicited takeover situations. The duties of directors of Maryland corporations do not require them to (a) accept, recommend or respond to any proposal by a person seeking to acquire control of the corporation, (b) authorize the corporation to redeem any rights under, or modify or render inapplicable, any stockholders rights plan, (c) make a determination under the Maryland Business Combination Act or the Maryland Control Share Acquisition Act, or (d) act or fail to act solely because of the effect of the act or failure to act may have on an acquisition or potential acquisition of control of the corporation or the amount or type of consideration that may be offered or paid to the stockholders in an acquisition. Moreover, under Maryland law, the act of a director of a Maryland corporation relating to or affecting an acquisition or potential acquisition of control is not subject to any higher duty or greater scrutiny than is applied to any other act of a director. Maryland law also contains a statutory presumption that an act of a director of a Maryland corporation satisfies the applicable standards of conduct for directors under Maryland law. Ownership Limit: In order to preserve our status as a real estate investment trust under the Code, our charter generally prohibits any single stockholder, or any group of affiliated stockholders, from beneficially owning more than 9.8 percent of our outstanding capital stock unless our Board of Directors waives or modifies this ownership limit. Maryland Business Combination Act: The Maryland Business Combination Act provides that unless exempted, a Maryland corporation may not engage in business combinations, including mergers, dispositions of 10 percent or more of

14
its assets, certain issuances of shares of stock and other specified transactions, with an “interested stockholder” or an affiliate of an interested stockholder, for five years after the most recent date on which the interested stockholder became an interested stockholder, and thereafter unless specified criteria are met. An interested stockholder is generally a person owning or controlling, directly or indirectly, 10 percent or more of the voting power of the outstanding stock of the Maryland corporation. Our board of directors has exempted from this statute business combinations between the Company and certain affiliated individuals and entities. However, unless our board adopts other exemptions, the provisions of the Maryland Business Combination Act will be applicable to business combinations with other persons. Maryland Control Share Acquisition Act: Maryland law provides that “control shares” of a corporation acquired in a “control share acquisition” shall have no voting rights except to the extent approved by a vote of two-thirds of the votes eligible to cast on the matter under the Maryland Control Share Acquisition Act. “Control Shares” means shares of stock that, if aggregated with all other shares of stock previously acquired by the acquirer, would entitle the acquirer to exercise voting power in electing directors within one of the following ranges of the voting power: one-tenth or more but less than one-third, one-third or more but less than a majority or a majority or more of all voting power. A “control share acquisition” means the acquisition of control shares, subject to certain exceptions. If voting rights of control shares acquired in a control share acquisition are not approved at a stockholder’s meeting, then subject to certain conditions and limitations, the issuer may redeem any or all of the control shares for fair value. If voting rights of such control shares are approved at a stockholder’s meeting and the acquirer becomes entitled to vote a majority of the shares of stock entitled to vote, all other stockholders may exercise appraisal rights. Our bylaws contain a provision exempting from the Maryland Control Share Acquisition Act any acquisitions of shares by certain affiliated individuals and entities, any directors, officers or employees of the Company and any person approved by the board of directors prior to the acquisition by such person of control shares. Any control shares acquired in a control share acquisition which are not exempt under the foregoing provisions of our bylaws will be subject to the Maryland Control Share Acquisition Act. Stockholder Rights Plan: We have adopted a stockholder rights plan that may discourage any potential acquirer from acquiring more than 15 percent of our outstanding common stock since, upon this type of acquisition without approval of our board of directors, all other common stockholders will have the right to purchase a specified amount of common stock at a substantial discount from market price. Consequences of failure to qualify as a real estate investment trust could adversely affect our financial condition. Failure to maintain ownership limits could cause us to lose our qualification as a real estate investment trust: In order for us to maintain our qualification as a real estate investment trust, not more than 50 percent in value of our outstanding stock may be actually and/or constructively owned by five or fewer individuals (as defined in the Code to include certain entities). We have limited the ownership of our outstanding shares of our common stock by any single stockholder to 9.8 percent of the outstanding shares of our common stock. Our Board of Directors could waive this restriction if they were satisfied, based upon the advice of tax counsel or otherwise, that such action would be in our best interests and would not affect our qualification as a real estate investment trust. Common stock acquired or transferred in breach of the limitation may be redeemed by us for the lesser of the price paid and the average closing price for the 10 trading days immediately preceding redemption or sold at the direction of us. We may elect to redeem such shares of common stock for Units, which are nontransferable except in very limited circumstances. Any transfer of shares of common stock which, as a result of such transfer, causes us to be in violation of any ownership limit, will be deemed void. Although we currently intend to continue to operate in a manner which will enable us to continue to qualify as a real estate investment trust, it is possible that future economic, market, legal, tax or other considerations may cause our Board of Directors to revoke the election for us to qualify as a real estate investment trust. Under our organizational documents, our Board of Directors can make such revocation without the consent of our stockholders. In addition, the consent of the holders of at least 85 percent of Mack-Cali Realty, L.P.’s partnership units is required: (i) to merge (or permit the merger of) us with another unrelated person, pursuant to a transaction in which Mack-Cali Realty, L.P. is not the surviving entity; (ii) to dissolve, liquidate or wind up Mack-Cali Realty, L.P.; or (iii) to convey or otherwise transfer all or substantially all of Mack-Cali Realty, L.P.’s assets. As of February 8, 2008, as general partner, we own approximately 81.4 percent of Mack-Cali Realty, L.P.’s outstanding common partnership units. Tax liabilities as a consequence of failure to qualify as a real estate investment trust: We have elected to be treated and have operated so as to qualify as a real estate investment trust for federal income tax purposes since our taxable year ended December 31, 1994. Although we believe we will continue to operate in such manner, we cannot guarantee that
15
we will do so. Qualification as a real estate investment trust involves the satisfaction of various requirements (some on an annual and some on a quarterly basis) established under highly technical and complex tax provisions of the Internal Revenue Code. Because few judicial or administrative interpretations of such provisions exist and qualification determinations are fact sensitive, we cannot assure you that we will qualify as a real estate investment trust for any taxable year. If we fail to qualify as a real estate investment trust in any taxable year, we will be subject to the following:
• we will not be allowed a deduction for dividends paid to shareholders; • we will be subject to federal income tax at regular corporate rates, including any alternative minimum
tax, if applicable; and • unless we are entitled to relief under certain statutory provisions, we will not be permitted to qualify as
a real estate investment trust for the four taxable years following the year during which we were disqualified.
A loss of our status as a real estate investment trust could have an adverse effect on us. Failure to qualify as a real estate investment trust also would eliminate the requirement that we pay dividends to our stockholders. Other tax liabilities: Even if we qualify as a real estate investment trust, we are subject to certain federal, state and local taxes on our income and property and, in some circumstances, certain other state and local taxes. In addition, our taxable REIT subsidiaries will be subject to federal, state and local income tax for income received in connection with certain non-customary services performed for tenants and/or third parties. Risk of changes in the tax law applicable to real estate investment trusts: Since the Internal Revenue Service, the United States Treasury Department and Congress frequently review federal income tax legislation, we cannot predict whether, when or to what extent new federal tax laws, regulations, interpretations or rulings will be adopted. Any of such legislative action may prospectively or retroactively modify our and Mack-Cali Realty, L.P.’s tax treatment and, therefore, may adversely affect taxation of us, Mack-Cali Realty, L.P., and/or our investors. Changes in market conditions could adversely affect the market price of our common stock. As with other publicly traded equity securities, the value of our common stock depends on various market conditions, which may change from time to time. Among the market conditions that may affect the value of our common stock are the following:
• the extent of your interest in us; • the general reputation of REITs and the attractiveness of our equity securities in comparison to other
equity securities, including securities issued by other real estate-based companies; • our financial performance; and • general stock and bond market conditions.
The market value of our common stock is based primarily upon the market’s perception of our growth potential and our current and potential future earnings and cash dividends. Consequently, our common stock may trade at prices that are higher or lower than our net asset value per share of common stock. ITEM 1B. UNRESOLVED STAFF COMMENTS None.

16
ITEM 2. PROPERTIES PROPERTY LIST
As of December 31, 2007, the Company’s Consolidated Properties consisted of 251 in-service office, office/flex and industrial/warehouse properties, as well as two stand-alone retail properties and two land leases. The Consolidated Properties are located primarily in the Northeast. The Consolidated Properties are easily accessible from major thoroughfares and are in close proximity to numerous amenities. The Consolidated Properties contain a total of approximately 29.2 million square feet, with the individual properties ranging from 6,216 to 1,246,283 square feet. The Consolidated Properties, managed by on-site employees, generally have attractively landscaped sites and atriums in addition to quality design and construction. The Company’s tenants include many service sector employers, including a large number of professional firms and national and international businesses. The Company believes that all of its properties are well-maintained and do not require significant capital improvements.

17
Office Properties
2007 Percentage 2007 2007 Average Net Leased Base Average Effective Rentable as of Rent Percentage Base Rent Rent Year Area 12/31/07 ($000’s) of Total 2007 Per Sq. Ft. Per Sq. Ft. Property Location Built (Sq. Ft.) (%) (a) (b) (c) Base Rent (%) ($) (c) (d) ($) (c) (e) NEW JERSEY Bergen County Fair Lawn 17-17 Route 208 North 1987 143,000 68.6 3,144 0.55 32.05 27.79 Fort Lee One Bridge Plaza 1981 200,000 72.7 2,784 0.48 19.15 17.75 2115 Linwood Avenue 1981 68,000 40.2 865 0.15 31.64 30.40 Little Ferry 200 Riser Road 1974 286,628 100.0 2,071 0.36 7.23 6.67 Montvale 95 Chestnut Ridge Road 1975 47,700 100.0 796 0.14 16.69 15.28 135 Chestnut Ridge Road 1981 66,150 100.0 1,520 0.26 22.98 19.09 Paramus 15 East Midland Avenue 1988 259,823 80.5 5,235 0.91 25.03 24.27 140 East Ridgewood Avenue 1981 239,680 98.4 4,846 0.84 20.55 18.73 461 From Road 1988 253,554 98.6 6,125 1.06 24.50 24.42 650 From Road 1978 348,510 92.2 7,786 1.36 24.23 21.42 61 South Paramus Avenue 1985 269,191 100.0 7,208 1.25 26.78 23.99 Ridgefield Park 105 Challenger Road 1992 150,050 87.5 4,250 0.74 32.37 29.72 Rochelle Park 120 Passaic Street 1972 52,000 99.6 1,402 0.24 27.07 25.53 365 West Passaic Street 1976 212,578 100.0 4,473 0.78 21.04 18.78 395 West Passaic Street 1979 100,589 96.9 2,217 0.39 22.75 19.64 Upper Saddle River 1 Lake Street 1973/94 474,801 100.0 7,465 1.30 15.72 15.72 10 Mountainview Road 1986 192,000 98.2 4,328 0.75 22.95 20.84 Woodcliff Lake 400 Chestnut Ridge Road 1982 89,200 100.0 1,950 0.34 21.86 16.32 470 Chestnut Ridge Road 1987 52,500 100.0 1,107 0.19 21.09 19.83 530 Chestnut Ridge Road 1986 57,204 100.0 1,199 0.21 20.96 20.40 50 Tice Boulevard 1984 235,000 98.7 6,140 1.07 26.47 23.93 300 Tice Boulevard 1991 230,000 99.8 5,880 1.02 25.62 23.18 Burlington County Moorestown 224 Strawbridge Drive 1984 74,000 98.4 1,521 0.26 20.89 18.35 228 Strawbridge Drive 1984 74,000 100.0 1,043 0.18 14.09 12.11 232 Strawbridge Drive 1986 74,258 98.8 1,461 0.25 19.91 16.22 Essex County Millburn 150 J.F. Kennedy Parkway 1980 247,476 100.0 7,539 1.31 30.46 26.58

18
Office Properties (Continued)
2007 Percentage 2007 2007 Average Net Leased Base Average Effective Rentable as of Rent Percentage Base Rent Rent Year Area 12/31/07 ($000’s) of Total 2007 Per Sq. Ft. Per Sq. Ft. Property Location Built (Sq. Ft.) (%) (a) (b) (c) Base Rent (%) ($) (c) (d) ($) (c) (e) Roseland 101 Eisenhower Parkway 1980 237,000 95.8 5,642 0.98 24.85 22.33 103 Eisenhower Parkway 1985 151,545 78.6 2,934 0.51 24.63 21.53 105 Eisenhower Parkway 2001 220,000 91.9 4,636 0.81 22.93 17.23 Hudson County Jersey City Harborside Financial Center Plaza 1 1983 400,000 100.0 10,016 1.74 25.04 22.48 Harborside Financial Center Plaza 2 1990 761,200 100.0 18,987 3.30 24.94 22.12 Harborside Financial Center Plaza 3 1990 725,600 99.1 17,983 3.12 25.01 22.16 Harborside Financial Center Plaza 4-A 2000 207,670 97.7 6,206 1.08 30.59 26.31 Harborside Financial Center Plaza 5 2002 977,225 99.9 34,428 5.99 35.27 29.08 101 Hudson Street 1992 1,246,283 99.2 26,528 4.61 21.46 18.80 Mercer County Hamilton Township 3 AAA Drive (f) 1981 35,270 62.6 124 0.02 8.61 8.06 2 South Gold Drive (f) 1974 33,962 64.5 258 0.04 18.06 17.22 600 Horizon Drive 2002 95,000 100.0 1,373 0.24 14.45 14.45 700 Horizon Drive (f) 2007 120,000 100.0 1,593 0.28 20.36 19.22 Princeton 103 Carnegie Center 1984 96,000 72.5 1,837 0.32 26.39 21.98 3 Independence Way 1983 111,300 50.7 1,102 0.19 19.53 15.40 100 Overlook Center 1988 149,600 100.0 4,859 0.84 32.48 28.36 5 Vaughn Drive 1987 98,500 100.0 2,391 0.42 24.27 21.43 Middlesex County East Brunswick 377 Summerhill Road 1977 40,000 100.0 353 0.06 8.83 8.65 Edison 343 Thornall Street (c) 1991 195,709 100.0 4,008 0.70 20.48 17.58 Piscataway 30 Knightsbridge Road, Bldg 3 1977 160,000 100.0 2,465 0.43 15.41 15.41 30 Knightsbridge Road, Bldg 4 1977 115,000 100.0 1,771 0.31 15.40 15.40 30 Knightsbridge Road, Bldg 5 1977 332,607 62.9 2,437 0.42 11.65 8.30 30 Knightsbridge Road, Bldg 6 1977 72,743 63.8 172 0.03 3.71 1.90 Plainsboro 500 College Road East 1984 158,235 95.7 4,261 0.74 28.14 25.91 Woodbridge 581 Main Street 1991 200,000 100.0 5,268 0.92 26.34 23.15 Monmouth County Freehold 2 Paragon Way 1989 44,524 38.1 374 0.06 22.05 13.85 3 Paragon Way 1991 66,898 100.0 785 0.14 11.73 9.55 4 Paragon Way 2002 63,989 100.0 1,097 0.19 17.14 12.96 100 Willbowbrook 1988 60,557 74.8 880 0.15 19.43 16.62 Holmdel 23 Main Street 1977 350,000 100.0 4,012 0.70 11.46 8.64

19
Office Properties (Continued)
2007 Percentage 2007 2007 Average Net Leased Base Average Effective Rentable as of Rent Percentage Base Rent Rent Year Area 12/31/07 ($000’s) of Total 2007 Per Sq. Ft. Per Sq. Ft. Property Location Built (Sq. Ft.) (%) (a) (b) (c) Base Rent (%) ($) (c) (d) ($) (c) (e) Middletown One River Center Bldg 1 1983 122,594 100.0 3,097 0.54 25.26 21.22 One River Center Bldg 2 1983 120,360 100.0 2,874 0.50 23.88 22.75 One River Center Bldg 3 1984 214,518 93.6 4,593 0.80 22.87 22.57 Neptune 3600 Route 66 1989 180,000 100.0 2,400 0.42 13.33 12.06 Wall Township 1305 Campus Parkway 1988 23,350 77.3 443 0.08 24.54 23.66 1350 Campus Parkway 1990 79,747 91.9 1,571 0.27 21.44 18.83 Morris County Florham Park 325 Columbia Turnpike 1987 168,144 96.1 4,005 0.70 24.79 21.96 Morris Plains 250 Johnson Road 1977 75,000 100.0 1,579 0.27 21.05 18.47 201 Littleton Road 1979 88,369 88.6 1,750 0.30 22.35 19.92 Morris Township 412 Mt. Kemble Avenue 1986 475,100 36.7 2,664 0.46 15.28 12.78 Parsippany 4 Campus Drive 1983 147,475 94.3 3,298 0.57 23.71 21.01 6 Campus Drive 1983 148,291 75.1 2,422 0.42 21.75 17.94 7 Campus Drive 1982 154,395 67.8 979 0.17 9.35 8.75 8 Campus Drive 1987 215,265 100.0 6,249 1.09 29.03 25.66 9 Campus Drive 1983 156,495 93.6 3,483 0.61 23.78 19.93 4 Century Drive 1981 100,036 78.9 1,641 0.29 20.79 18.70 5 Century Drive 1981 79,739 97.3 1,293 0.22 16.67 16.54 6 Century Drive 1981 100,036 72.4 1,351 0.23 18.65 11.87 2 Dryden Way 1990 6,216 100.0 96 0.02 15.44 15.44 4 Gatehall Drive 1988 248,480 89.6 5,655 0.98 25.40 22.66 2 Hilton Court 1991 181,592 100.0 4,224 0.73 23.26 20.58 1633 Littleton Road 1978 57,722 100.0 1,131 0.20 19.59 19.59 600 Parsippany Road 1978 96,000 92.4 1,596 0.28 17.99 13.96 1 Sylvan Way 1989 150,557 100.0 3,621 0.63 24.05 21.41 5 Sylvan Way 1989 151,383 100.0 4,157 0.72 27.46 24.69 7 Sylvan Way 1987 145,983 100.0 3,219 0.56 22.05 19.29 35 Waterview Boulevard 1990 172,498 96.2 4,460 0.78 26.88 24.03 5 Wood Hollow Road 1979 317,040 96.7 6,118 1.07 19.96 17.10 Passaic County Clifton 777 Passaic Avenue 1983 75,000 100.0 1,627 0.28 21.69 19.53 Totowa 999 Riverview Drive 1988 56,066 100.0 1,084 0.19 19.33 17.21 Somerset County Basking Ridge 222 Mt. Airy Road 1986 49,000 60.7 615 0.11 20.68 15.53 233 Mt. Airy Road 1987 66,000 100.0 1,315 0.23 19.92 16.71

20
Office Properties (Continued)
2007 Percentage 2007 2007 Average Net Leased Base Average Effective Rentable as of Rent Percentage Base Rent Rent Year Area 12/31/07 ($000’s) of Total 2007 Per Sq. Ft. Per Sq. Ft. Property Location Built (Sq. Ft.) (%) (a) (b) (c) Base Rent (%) ($) (c) (d) ($) (c) (e) Bernards 106 Allen Road 2000 132,010 96.2 3,149 0.55 24.80 18.74 Bridgewater 721 Route 202/206 1989 192,741 81.2 3,817 0.66 24.39 22.93 Union County Clark 100 Walnut Avenue 1985 182,555 98.5 4,624 0.80 25.72 22.67 Cranford 6 Commerce Drive 1973 56,000 84.1 1,029 0.18 21.85 19.05 11 Commerce Drive 1981 90,000 71.3 1,389 0.24 21.65 18.73 12 Commerce Drive 1967 72,260 95.1 967 0.17 14.07 11.54 14 Commerce Drive 1971 67,189 64.3 1,031 0.18 23.86 23.12 20 Commerce Drive 1990 176,600 99.8 4,531 0.79 25.71 22.60 25 Commerce Drive 1971 67,749 90.1 1,333 0.23 21.84 20.30 65 Jackson Drive 1984 82,778 97.5 1,857 0.32 23.01 19.99 New Providence 890 Mountain Avenue 1977 80,000 95.1 1,797 0.31 23.62 22.31 Total New Jersey Office 17,646,642 92.4 373,269 64.88 22.94 20.22 NEW YORK New York County New York 125 Broad Street (f) 1970 524,476 100.0 11,579 2.02 39.50 35.69 Rockland County Suffern 400 Rella Boulevard 1988 180,000 91.4 3,752 0.65 22.81 19.18 Westchester County Elmsford 100 Clearbrook Road (c) 1975 60,000 94.4 1,083 0.19 19.12 17.39 101 Executive Boulevard 1971 50,000 43.0 513 0.09 23.86 21.77 555 Taxter Road 1986 170,554 100.0 4,263 0.74 25.00 20.87 565 Taxter Road 1988 170,554 98.8 4,138 0.72 24.56 20.37 570 Taxter Road 1972 75,000 77.8 1,648 0.29 28.24 26.24 Hawthorne 1 Skyline Drive 1980 20,400 99.0 340 0.06 16.84 15.70 2 Skyline Drive 1987 30,000 98.9 490 0.09 16.51 14.19 7 Skyline Drive 1987 109,000 98.7 2,570 0.45 23.89 21.90 17 Skyline Drive 1989 85,000 100.0 871 0.15 10.25 10.15 19 Skyline Drive 1982 248,400 100.0 4,471 0.78 18.00 16.80
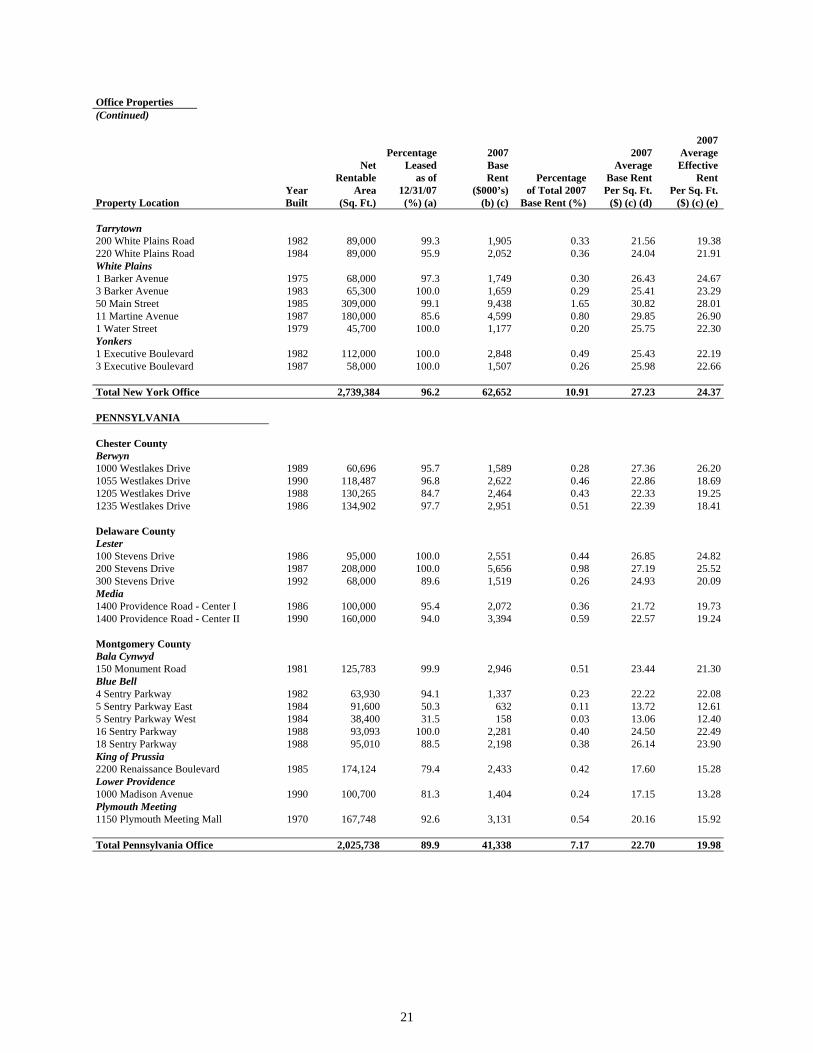
21
Office Properties (Continued)
2007 Percentage 2007 2007 Average Net Leased Base Average Effective Rentable as of Rent Percentage Base Rent Rent Year Area 12/31/07 ($000’s) of Total 2007 Per Sq. Ft. Per Sq. Ft. Property Location Built (Sq. Ft.) (%) (a) (b) (c) Base Rent (%) ($) (c) (d) ($) (c) (e) Tarrytown 200 White Plains Road 1982 89,000 99.3 1,905 0.33 21.56 19.38 220 White Plains Road 1984 89,000 95.9 2,052 0.36 24.04 21.91 White Plains 1 Barker Avenue 1975 68,000 97.3 1,749 0.30 26.43 24.67 3 Barker Avenue 1983 65,300 100.0 1,659 0.29 25.41 23.29 50 Main Street 1985 309,000 99.1 9,438 1.65 30.82 28.01 11 Martine Avenue 1987 180,000 85.6 4,599 0.80 29.85 26.90 1 Water Street 1979 45,700 100.0 1,177 0.20 25.75 22.30 Yonkers 1 Executive Boulevard 1982 112,000 100.0 2,848 0.49 25.43 22.19 3 Executive Boulevard 1987 58,000 100.0 1,507 0.26 25.98 22.66 Total New York Office 2,739,384 96.2 62,652 10.91 27.23 24.37 PENNSYLVANIA Chester County Berwyn 1000 Westlakes Drive 1989 60,696 95.7 1,589 0.28 27.36 26.20 1055 Westlakes Drive 1990 118,487 96.8 2,622 0.46 22.86 18.69 1205 Westlakes Drive 1988 130,265 84.7 2,464 0.43 22.33 19.25 1235 Westlakes Drive 1986 134,902 97.7 2,951 0.51 22.39 18.41 Delaware County Lester 100 Stevens Drive 1986 95,000 100.0 2,551 0.44 26.85 24.82 200 Stevens Drive 1987 208,000 100.0 5,656 0.98 27.19 25.52 300 Stevens Drive 1992 68,000 89.6 1,519 0.26 24.93 20.09 Media 1400 Providence Road - Center I 1986 100,000 95.4 2,072 0.36 21.72 19.73 1400 Providence Road - Center II 1990 160,000 94.0 3,394 0.59 22.57 19.24 Montgomery County Bala Cynwyd 150 Monument Road 1981 125,783 99.9 2,946 0.51 23.44 21.30 Blue Bell 4 Sentry Parkway 1982 63,930 94.1 1,337 0.23 22.22 22.08 5 Sentry Parkway East 1984 91,600 50.3 632 0.11 13.72 12.61 5 Sentry Parkway West 1984 38,400 31.5 158 0.03 13.06 12.40 16 Sentry Parkway 1988 93,093 100.0 2,281 0.40 24.50 22.49 18 Sentry Parkway 1988 95,010 88.5 2,198 0.38 26.14 23.90 King of Prussia 2200 Renaissance Boulevard 1985 174,124 79.4 2,433 0.42 17.60 15.28 Lower Providence 1000 Madison Avenue 1990 100,700 81.3 1,404 0.24 17.15 13.28 Plymouth Meeting 1150 Plymouth Meeting Mall 1970 167,748 92.6 3,131 0.54 20.16 15.92 Total Pennsylvania Office 2,025,738 89.9 41,338 7.17 22.70 19.98

22
Office Properties (Continued)
2007 Percentage 2007 2007 Average Net Leased Base Average Effective Rentable as of Rent Percentage Base Rent Rent Year Area 12/31/07 ($000’s) of Total 2007 Per Sq. Ft. Per Sq. Ft. Property Location Built (Sq. Ft.) (%) (a) (b) (c) Base Rent (%) ($) (c) (d) ($) (c) (e) CONNECTICUT Fairfield County Norwalk 40 Richards Avenue 1985 145,487 76.6 2,446 0.43 21.95 19.35 Stamford 1266 East Main Street 1984 179,260 73.3 3,615 0.63 27.51 24.64 Total Connecticut Office 324,747 74.8 6,061 1.06 24.96 22.21 DISTRICT OF COLUMBIA Washington 1201 Connecticut Avenue, NW 1940 169,549 100.0 6,742 1.18 39.76 36.86 1400 L Street, NW 1987 159,000 100.0 5,539 0.96 34.84 29.81 Total District of Columbia Office 328,549 100.0 12,281 2.14 37.38 33.45 MARYLAND Prince George’s County Greenbelt 9200 Edmonston Road 1973 38,690 100.0 911 0.16 23.55 21.19 6301 Ivy Lane 1979 112,003 87.2 2,104 0.37 21.54 18.54 6303 Ivy Lane 1980 112,047 62.2 2,182 0.38 31.31 27.74 6305 Ivy Lane 1982 112,022 70.2 1,610 0.28 20.47 16.63 6404 Ivy Lane 1987 165,234 77.9 2,637 0.46 20.49 15.98 6406 Ivy Lane 1991 163,857 100.0 2,905 0.50 17.73 16.58 6411 Ivy Lane 1984 138,405 88.5 2,854 0.50 23.30 20.17 Lanham 4200 Parliament Place 1989 122,000 85.8 2,719 0.47 25.98 24.08 Total Maryland Office 964,258 83.4 17,922 3.12 22.28 19.44 TOTAL OFFICE PROPERTIES 24,029,318 92.2 513,523 89.28 23.65 20.89

23
Office/Flex Properties
2007 Percentage 2007 2007 Average Net Leased Base Average Effective Rentable as of Rent Percentage Base Rent Rent Year Area 12/31/07 ($000’s) of Total 2007 Per Sq. Ft. Per Sq. Ft. Property Location Built (Sq. Ft.) (%) (a) (b) (c) Base Rent (%) ($) (c) (d) ($) (c) (e) NEW JERSEY Burlington County Burlington 3 Terri Lane 1991 64,500 100.0 507 0.09 7.86 4.40 5 Terri Lane 1992 74,555 100.0 627 0.11 8.41 7.01 Moorestown 2 Commerce Drive 1986 49,000 21.3 145 0.03 13.89 9.29 101 Commerce Drive 1988 64,700 100.0 275 0.05 4.25 3.85 102 Commerce Drive 1987 38,400 100.0 209 0.04 5.44 4.27 201 Commerce Drive 1986 38,400 75.0 173 0.03 6.01 4.24 202 Commerce Drive 1988 51,200 100.0 252 0.04 4.92 3.54 1 Executive Drive 1989 20,570 81.1 157 0.03 9.41 6.41 2 Executive Drive 1988 60,800 100.0 430 0.07 7.07 5.00 101 Executive Drive 1990 29,355 90.2 296 0.05 11.18 9.18 102 Executive Drive 1990 64,000 100.0 383 0.07 5.98 5.38 225 Executive Drive 1990 50,600 67.6 232 0.04 6.78 5.06 97 Foster Road 1982 43,200 50.0 113 0.02 5.23 4.54 1507 Lancer Drive 1995 32,700 100.0 134 0.02 4.10 3.79 1245 North Church Street 1998 52,810 90.5 313 0.05 6.55 6.19 1247 North Church Street 1998 52,790 58.1 281 0.05 9.16 8.12 1256 North Church Street 1984 63,495 100.0 452 0.08 7.12 5.83 840 North Lenola Road 1995 38,300 100.0 367 0.06 9.58 7.96 844 North Lenola Road 1995 28,670 100.0 180 0.03 6.28 5.06 915 North Lenola Road 1998 52,488 100.0 290 0.05 5.53 4.46 2 Twosome Drive 2000 48,600 100.0 429 0.07 8.83 8.29 30 Twosome Drive 1997 39,675 89.9 226 0.04 6.34 5.13 31 Twosome Drive 1998 84,200 100.0 468 0.08 5.56 5.51 40 Twosome Drive 1996 40,265 100.0 291 0.05 7.23 5.84 41 Twosome Drive 1998 43,050 100.0 231 0.04 5.37 5.16 50 Twosome Drive 1997 34,075 100.0 249 0.04 7.31 6.96 Gloucester County West Deptford 1451 Metropolitan Drive 1996 21,600 100.0 148 0.03 6.85 6.85 Mercer County Hamilton Township 100 Horizon Center Boulevard 1989 13,275 100.0 193 0.03 14.54 12.58 200 Horizon Drive 1991 45,770 100.0 591 0.10 12.91 11.73 300 Horizon Drive 1989 69,780 100.0 1,155 0.20 16.55 13.43 500 Horizon Drive 1990 41,205 100.0 620 0.11 15.05 14.51

24
Office/Flex Properties (Continued)
2007 Percentage 2007 2007 Average Net Leased Base Average Effective Rentable as of Rent Percentage Base Rent Rent Year Area 12/31/07 ($000’s) of Total 2007 Per Sq. Ft. Per Sq. Ft. Property Location Built (Sq. Ft.) (%) (a) (b) (c) Base Rent (%) ($) (c) (d) ($) (c) (e) Monmouth County Wall Township 1325 Campus Parkway 1988 35,000 100.0 655 0.11 18.71 14.06 1340 Campus Parkway 1992 72,502 100.0 948 0.16 13.08 9.75 1345 Campus Parkway 1995 76,300 100.0 947 0.16 12.41 9.12 1433 Highway 34 1985 69,020 76.4 525 0.09 9.96 8.08 1320 Wyckoff Avenue 1986 20,336 100.0 178 0.03 8.75 8.31 1324 Wyckoff Avenue 1987 21,168 100.0 229 0.04 10.82 10.16 Passaic County Totowa 1 Center Court 1999 38,961 100.0 534 0.09 13.71 11.06 2 Center Court 1998 30,600 99.3 373 0.06 12.28 10.89 11 Commerce Way 1989 47,025 100.0 576 0.10 12.25 11.50 20 Commerce Way 1992 42,540 100.0 330 0.06 7.76 6.44 29 Commerce Way 1990 48,930 100.0 711 0.12 14.53 11.44 40 Commerce Way 1987 50,576 72.1 564 0.10 15.47 14.53 45 Commerce Way 1992 51,207 96.4 428 0.07 8.67 6.89 60 Commerce Way 1988 50,333 73.6 519 0.09 14.01 12.61 80 Commerce Way 1996 22,500 100.0 311 0.05 13.82 12.80 100 Commerce Way 1996 24,600 66.9 340 0.06 20.66 19.20 120 Commerce Way 1994 9,024 100.0 125 0.02 13.85 12.74 140 Commerce Way 1994 26,881 99.5 374 0.06 13.98 12.86 Total New Jersey Office/Flex 2,189,531 91.9 19,084 3.27 9.49 7.95 NEW YORK Westchester County Elmsford 11 Clearbrook Road 1974 31,800 100.0 427 0.07 13.43 12.26 75 Clearbrook Road 1990 32,720 100.0 702 0.12 21.45 20.35 125 Clearbrook Road 2002 33,000 100.0 712 0.12 21.58 17.94 150 Clearbrook Road 1975 74,900 100.0 1,181 0.21 15.77 14.46 175 Clearbrook Road 1973 98,900 100.0 1,592 0.28 16.10 14.93 200 Clearbrook Road 1974 94,000 99.8 1,288 0.22 13.73 12.47 250 Clearbrook Road 1973 155,000 97.3 1,416 0.25 9.39 8.47 50 Executive Boulevard 1969 45,200 98.2 490 0.09 11.04 10.63 77 Executive Boulevard 1977 13,000 100.0 183 0.03 14.08 13.31 85 Executive Boulevard 1968 31,000 93.8 546 0.09 18.78 16.20 300 Executive Boulevard 1970 60,000 100.0 415 0.07 6.92 6.45 350 Executive Boulevard 1970 15,400 98.8 296 0.05 19.45 17.88 399 Executive Boulevard 1962 80,000 100.0 922 0.16 11.53 11.09 400 Executive Boulevard 1970 42,200 100.0 774 0.13 18.34 16.21 500 Executive Boulevard 1970 41,600 78.3 585 0.10 17.96 16.15

25
Office/Flex Properties (Continued)
2007 Percentage 2007 2007 Average Net Leased Base Average Effective Rentable as of Rent Percentage Base Rent Rent Year Area 12/31/07 ($000’s) of Total 2007 Per Sq. Ft. Per Sq. Ft. Property Location Built (Sq. Ft.) (%) (a) (b) (c) Base Rent (%) ($) (c) (d) ($) (c) (e) 525 Executive Boulevard 1972 61,700 83.6 814 0.14 15.78 13.76 1 Westchester Plaza 1967 25,000 100.0 335 0.06 13.40 12.72 2 Westchester Plaza 1968 25,000 100.0 514 0.09 20.56 19.32 3 Westchester Plaza 1969 93,500 100.0 636 0.11 6.80 5.90 4 Westchester Plaza 1969 44,700 93.1 467 0.08 11.22 9.80 5 Westchester Plaza 1969 20,000 88.9 292 0.05 16.42 14.45 6 Westchester Plaza 1968 20,000 100.0 322 0.06 16.10 15.00 7 Westchester Plaza 1972 46,200 100.0 765 0.13 16.56 16.26 8 Westchester Plaza 1971 67,200 100.0 921 0.16 13.71 12.31 Hawthorne 200 Saw Mill River Road 1965 51,100 100.0 684 0.12 13.39 12.23 4 Skyline Drive 1987 80,600 92.2 1,319 0.23 17.75 14.98 5 Skyline Drive 1980 124,022 99.3 1,642 0.29 13.33 11.90 6 Skyline Drive 1980 44,155 100.0 571 0.10 12.93 12.86 8 Skyline Drive 1985 50,000 85.3 768 0.13 18.01 10.39 10 Skyline Drive 1985 20,000 100.0 368 0.06 18.40 13.00 11 Skyline Drive 1989 45,000 100.0 803 0.14 17.84 16.91 12 Skyline Drive 1999 46,850 100.0 676 0.12 14.43 10.82 15 Skyline Drive 1989 55,000 88.2 920 0.16 18.97 18.04 Yonkers 100 Corporate Boulevard 1987 78,000 98.3 1,391 0.24 18.14 17.10 200 Corporate Boulevard South 1990 84,000 99.8 1,569 0.27 18.72 17.82 4 Executive Plaza 1986 80,000 100.0 1,374 0.24 17.18 14.15 6 Executive Plaza 1987 80,000 95.7 1,391 0.24 18.17 16.90 1 Odell Plaza 1980 106,000 99.9 1,495 0.26 14.12 13.35 3 Odell Plaza 1984 71,065 100.0 1,597 0.28 22.47 20.84 5 Odell Plaza 1983 38,400 74.4 445 0.08 15.58 14.67 7 Odell Plaza 1984 42,600 99.6 740 0.13 17.44 16.80 Total New York Office/Flex 2,348,812 97.1 34,348 5.96 15.06 13.59 CONNECTICUT Fairfield County Stamford 419 West Avenue 1986 88,000 100.0 1,360 0.24 15.45 13.81 500 West Avenue 1988 25,000 82.3 375 0.07 18.23 15.89 550 West Avenue 1990 54,000 100.0 858 0.15 15.89 15.80 600 West Avenue 1999 66,000 100.0 804 0.14 12.18 11.62 650 West Avenue 1998 40,000 100.0 609 0.11 15.23 14.55 Total Connecticut Office/Flex 273,000 98.4 4,006 0.71 14.92 13.94 TOTAL OFFICE/FLEX PROPERTIES 4,811,343 94.8 57,438 9.94 12.59 11.12

26
Industrial/Warehouse, Retail and Land Lease Properties
2007 Percentage 2007 2007 Average Net Leased Base Average Effective Rentable as of Rent Percentage Base Rent Rent Year Area 12/31/07 ($000’s) of Total 2007 Per Sq. Ft. Per Sq. Ft. Property Location Built (Sq. Ft.) (%) (a) (b) (c) Base Rent (%) ($) (c) (d) ($) (c) (e) NEW YORK Westchester County Elmsford 1 Warehouse Lane 1957 6,600 100.0 86 0.01 13.03 12.73 2 Warehouse Lane 1957 10,900 100.0 161 0.03 14.77 13.03 3 Warehouse Lane 1957 77,200 100.0 324 0.06 4.20 3.80 4 Warehouse Lane 1957 195,500 97.4 1,738 0.30 9.13 8.11 5 Warehouse Lane 1957 75,100 97.1 963 0.17 13.21 11.78 6 Warehouse Lane 1982 22,100 100.0 513 0.09 23.21 22.62 Total Industrial/Warehouse Properties 387,400 98.1 3,785 0.66 9.96 9.00 Westchester County Tarrytown 230 White Plains Road 1984 9,300 100.0 195 0.03 20.97 19.68 Yonkers 2 Executive Boulevard 1986 8,000 100.0 223 0.04 27.88 27.88 Total Retail Properties 17,300 100.0 418 0.07 24.16 23.47 Westchester County Elmsford 700 Executive Boulevard -- -- -- 114 0.02 -- -- Yonkers 1 Enterprise Boulevard -- -- -- 185 0.03 -- -- Total Land Leases -- -- 299 0.05 -- -- TOTAL PROPERTIES 29,245,361 92.7 575,463 100.00 21.61 19.09 (a) Percentage leased includes all leases in effect as of the period end date, some of which have commencement dates in the future (including, at
December 31, 2007, a lease with a commencement date substantially in the future consisting of 8,590 square feet scheduled to commence in 2009), and leases expiring December 31, 2007 aggregating 146,261 square feet (representing 0.5 percent of the Company’s total net rentable square footage) for which no new leases were signed.
(b) Total base rent for 2007, determined in accordance with generally accepted accounting principles (“GAAP”). Substantially all of the leases provide for annual base rents plus recoveries and escalation charges based upon the tenant’s proportionate share of and/or increases in real estate taxes and certain operating costs, as defined, and the pass through of charges for electrical usage.
(c) Excludes space leased by the Company. (d) Base rent for 2007 divided by net rentable square feet leased at December 31, 2007. For those properties acquired during 2007, amounts are
annualized, as per Note f. (e) Total base rent for 2007 minus total 2007 amortization of tenant improvements, leasing commissions and other concessions and costs, determined
in accordance with GAAP, divided by net rentable square feet leased at December 31, 2007. For those properties acquired during 2007, amounts are annualized, as described in Note f.
(f) As this property was acquired by the Company during 2007, the amounts represented in 2007 base rent and 2007 effective rent reflect only that portion of the year during which the Company owned the property. Accordingly, these amounts may not be indicative of the property’s full year results. For comparison purposes, the amounts represented in 2007 average base rent per sq. ft. and 2007 average effective rent per sq. ft. for this property have been calculated by taking 2007 base rent and 2007 effective rent for such property and annualizing these partial-year results, dividing such annualized amounts by the net rentable square feet leased at December 31, 2007. These annualized per square foot amounts may not be indicative of the property’s results had the Company owned the property for the entirety of 2007.

27
PERCENTAGE LEASED The following table sets forth the year-end percentages of square feet leased in the Company’s stabilized operating Consolidated Properties for the last five years:
Percentage of December 31, Square Feet Leased (%) (a) 2007 92.7 2006 92.0 2005 91.0 2004 91.2 2003 91.5
(a) Percentage of square-feet leased includes all leases in effect as of the period end date, some of which have commencement dates in the future
and leases that expire at the period end date.

28
SIGNIFICANT TENANTS The following table sets forth a schedule of the Company’s 50 largest tenants for the Consolidated Properties as of December 31, 2007 based upon annualized base rental revenue:
Percentage of Annualized Company Square Percentage Year of Number of Base Rental Annualized Base Feet Total Company Lease Properties Revenue ($) (a) Rental Revenue (%) Leased Leased Sq. Ft. (%) Expiration Citigroup Global Markets, Inc. 6 14,276,232 2.4 466,489 1.8 2018 (b)DB Services New Jersey, Inc. 2 10,861,093 1.8 402,068 1.5 2017National Union Fire Insurance 1 10,490,646 1.8 394,849 1.5 2012Morgan Stanley & Co., Inc. 5 9,493,227 1.6 381,576 1.4 2013 (c)New Cingular Wireless PCS, LLC 4 9,144,930 1.5 410,313 1.6 2014 (d)United States Of America-GSA 11 8,993,139 1.5 283,685 1.1 2017 (e)Keystone Mercy Health Plan 2 8,003,134 1.3 303,149 1.1 2015Prentice-Hall, Inc. 1 7,694,097 1.3 474,801 1.9 2014Forest Laboratories, Inc. 2 7,463,777 1.3 202,857 0.8 2017 (f)American Institute of Certified Public Accountants 1 6,653,005 1.1 249,768 0.9 2012ICAP Securities USA, LLC 1 6,236,408 1.0 159,834 0.6 2017Toys 'R' Us – NJ, Inc. 1 6,072,651 1.0 242,518 0.9 2012Lehman Brothers Holdings, Inc. 1 5,839,982 1.0 270,063 1.0 2018 (g)Allstate Insurance Company 10 5,713,563 1.0 237,559 0.9 2017 (h)TD Ameritrade Online Holdings 1 5,701,671 1.0 184,222 0.7 2015Merrill Lynch Pierce Fenner 3 5,294,084 0.9 306,125 1.1 2017 (i)Credit Suisse First Boston 1 5,212,307 0.9 153,464 0.6 2012 (j)KPMG, LLP 3 5,024,296 0.8 181,025 0.7 2012 (k)National Financial Services 1 4,798,621 0.8 112,964 0.4 2012IBM Corporation 3 4,788,402 0.8 310,263 1.2 2012 (l)Daiichi Sankyo, Inc. 3 4,009,822 0.7 136,366 0.5 2022 (m)Bank Of Tokyo-Mitsubishi, Ltd. 1 3,872,785 0.6 137,076 0.5 2019Vonage America, Inc. 1 3,857,000 0.6 350,000 1.3 2017AT&T Corp. 1 3,805,000 0.6 275,000 1.0 2014Wyndham Worldwide Corporation 1 3,773,775 0.6 150,951 0.6 2009Samsung Electronics America 1 3,678,028 0.6 131,300 0.5 2010Montefiore Medical Center 5 3,533,233 0.6 170,064 0.6 2019 (n)Hewlett-Packard Company 2 3,520,179 0.6 166,977 0.6 2010 (o)SSB Realty, LLC 1 3,492,830 0.6 114,519 0.4 2009Wyndham Worldwide Operations 1 3,211,626 0.5 145,983 0.5 2011E*Trade Financial Corporation 1 3,124,160 0.5 106,573 0.4 2022Dow Jones & Company, Inc. 1 3,057,773 0.5 92,312 0.3 2012High Point Safety & Insurance 2 2,727,009 0.5 116,889 0.4 2020American Home Assurance Co. 2 2,686,732 0.5 131,174 0.5 2019 (p)SunAmerica Asset Management 1 2,680,409 0.4 69,621 0.3 2018Moody’s Investors Service 1 2,671,149 0.4 91,344 0.3 2011 (q)Oppenheimer & Co., Inc. 1 2,636,192 0.4 104,008 0.4 2013Barr Laboratories, Inc. 2 2,579,597 0.4 109,510 0.4 2015 (r)United States Life Insurance Co. 1 2,520,000 0.4 180,000 0.7 2013AAA Mid-Atlantic, Inc. 2 2,517,680 0.4 129,784 0.5 2022 (s)New Jersey Turnpike Authority 1 2,455,463 0.4 100,223 0.4 2017Natixis North America, Inc. 1 2,408,679 0.4 83,629 0.3 2021Regus Business Centre Corp. 2 2,321,656 0.4 79,805 0.3 2011Movado Group, Inc 1 2,283,547 0.4 90,050 0.3 2013Deloitte & Touche USA, LLP 1 2,171,275 0.4 86,851 0.3 2008UBS Financial Services, Inc. 3 2,127,185 0.4 79,530 0.3 2016 (t)Thomson Tradeweb, LLC 1 2,116,075 0.4 56,547 0.2 2017Ark Asset Management Co., Inc. 1 2,094,608 0.4 67,568 0.3 2017Nextel of New York, Inc. 2 2,093,440 0.4 97,436 0.4 2014 (u)GAB Robins North America Inc. 2 2,087,199 0.4 84,649 0.3 2009 (v) Totals 233,869,371 39.2 9,463,331 35.5
See footnotes on subsequent page.

29
Significant Tenants Footnotes
(a) Annualized base rental revenue is based on actual December, 2007 billings times 12. For leases whose rent commences after January 1, 2008, annualized base rental revenue is based on the first full month’s billing times 12. As annualized base rental revenue is not derived from historical GAAP results, historical results may differ from those set forth above.
(b) 4,412 square feet expire in 2008; 38,196 square feet expire in 2009; 330,900 square feet expire in 2010; 26,834 square feet expire in 2014; 26,262 square feet expire in 2016; 39,885 square feet expire in 2018.
(c) 19,500 square feet expire in 2008; 7,000 square feet expire in 2009; 48,906 square feet expire in 2010; 306,170 square feet expire in 2013. (d) 4,783 square feet expire in 2008; 333,145 square feet expire in 2013; 72,385 square feet expire in 2014. (e) 7,008 square feet expire in 2008; 4,950 square feet expire in 2010; 9,901 square feet expire in 2011; 11,216 square feet expire in 2012; 58,392
square feet expire in 2013; 4,879 square feet expire in 2014; 180,729 square feet expire in 2015; 6,610 square feet expire in 2017. (f) 22,785 square feet expire in 2010; 180,072 square feet expire in 2017. (g) 198,559 square feet expire in 2010; 71,504 square feet expire in 2018. (h) 2,138 square feet expire in 2008; 22,185 square feet expire in 2009; 46,555 square feet expire in 2010; 83,693 square feet expire in 2011;
29,005 square feet expire in 2013; 53,983 square feet expire in 2017. (i) 7,485 square feet expire in 2008; 4,451 square feet expire in 2009; 294,189 square feet expire in 2017. (j) 71,511 square feet expire in 2011; 81,953 square feet expire in 2012. (k) 46,440 square feet expire in 2009; 57,204 square feet expire in 2010; 77,381 square feet expire in 2012. (l) 61,864 square feet expire in 2010; 248,399 square feet expire in 2012. (m) 46,000 square feet expire in 2009; 5,315 square feet expire in 2011; 85,051 square feet expire in 2022. (n) 6,800 square feet expire in 2009; 5,850 square feet expire in 2014; 7,200 square feet expire in 2016; 30,872 square feet expire in 2017; 6,535
square feet expire in 2018; 112,807 square feet expire in 2019. (o) 163,857 square feet expire in 2008; 3,120 square feet expire in 2010. (p) 14,056 square feet expire in 2008; 117,118 square feet expire in 2019. (q) 43,344 square feet expire in 2009; 36,193 square feet expire in 2010; 11,807 square feet expire in 2011. (r) 20,000 square feet expire in 2008; 89,510 square feet expire in 2015. (s) 9,784 square feet expire in 2017; 120,000 square feet expire in 2022. (t) 21,554 square feet expire in 2010; 20,811 square feet expire in 2013; 37,165 square feet expire in 2016. (u) 62,436 square feet expire in 2010; 35,000 square feet expire in 2014. (v) 75,049 square feet expire in 2008; 9,600 square feet expire in 2009.

30
SCHEDULE OF LEASE EXPIRATIONS: ALL CONSOLIDATED PROPERTIES The following table sets forth a schedule of lease expirations for the total of the Company’s office, office/flex, industrial/warehouse and stand-alone retail properties included in the Consolidated Properties beginning January 1, 2008, assuming that none of the tenants exercise renewal or termination options: Average Annual Percentage Of Rent Per Net Net Rentable Total Leased Annualized Rentable Percentage Of Area Subject Square Feet Base Rental Square Foot Annual Base Number Of To Expiring Represented Revenue Under Represented Rent Under Year Of Leases Leases By Expiring Expiring By Expiring Expiring Expiration Expiring (a) (Sq. Ft.) Leases (%) Leases ($) (b) Leases ($) Leases (%) 2008 (c) 293 1,930,173 7.2 40,605,709 21.04 6.8 2009 361 2,397,663 9.0 53,293,256 22.23 8.9 2010 376 3,208,062 12.0 73,768,677 22.99 12.4 2011 358 3,386,416 12.7 76,565,941 22.61 12.9 2012 261 2,855,408 10.7 67,133,300 23.51 11.3 2013 225 3,095,963 11.6 66,615,433 21.52 11.2 2014 114 1,719,904 6.4 37,835,190 22.00 6.3 2015 72 2,281,276 8.6 50,220,025 22.01 8.4 2016 64 904,243 3.4 17,907,753 19.80 3.0 2017 75 2,278,116 8.6 54,153,943 23.77 9.1 2018 47 811,852 3.1 20,054,181 24.70 3.4 2019 and thereafter 55 1,784,202 6.7 37,833,109 21.20 6.3 Totals/Weighted Average 2,301 26,653,278 (d) 100.0 595,986,517 22.36 100.0 (a) Includes office, office/flex, industrial/warehouse and stand-alone retail property tenants only. Excludes leases for amenity, retail, parking
and month-to-month tenants. Some tenants have multiple leases. (b) Annualized base rental revenue is based on actual December 2007 billings times 12. For leases whose rent commences after January 1,
2008, annualized base rental revenue is based on the first full month’s billing times 12. As annualized base rental revenue is not derived from historical GAAP results, historical results may differ from those set forth above.
(c) Includes leases expiring December 31, 2007 aggregating 146,261 square feet and representing annualized rent of $2,237,232 for which no new leases were signed.
(d) Reconciliation to Company’s total net rentable square footage is as follows:
Square Feet Square footage leased to commercial tenants 26,653,278 Square footage used for corporate offices, management offices, building use, retail tenants, food services, other ancillary service tenants and occupancy adjustments 452,348 Square footage unleased 2,139,735 Total net rentable square footage (does not include land leases) 29,245,361

31
SCHEDULE OF LEASE EXPIRATIONS: OFFICE PROPERTIES The following table sets forth a schedule of lease expirations for the office properties beginning January 1, 2008, assuming that none of the tenants exercise renewal or termination options: Average Annual Percentage Of Rent Per Net Net Rentable Total Leased Annualized Rentable Percentage Of Area Subject Square Feet Base Rental Square Foot Annual Base Number Of To Expiring Represented By Revenue Under Represented Rent Under Year Of Leases Leases Expiring Expiring By Expiring Expiring Expiration Expiring (a) (Sq. Ft.) Leases (%) Leases ($) (b) Leases ($) Leases (%) 2008 (c) 226 1,442,795 6.6 34,349,088 23.81 6.4 2009 275 1,763,173 8.1 44,595,505 25.29 8.4 2010 288 2,382,681 11.0 62,482,351 26.22 11.8 2011 295 2,853,419 13.2 70,304,107 24.64 13.2 2012 192 2,246,355 10.4 59,201,643 26.35 11.1 2013 171 2,414,424 11.1 58,168,960 24.09 11.0 2014 96 1,533,173 7.1 35,278,848 23.01 6.6 2015 62 2,131,479 9.8 48,736,523 22.87 9.2 2016 50 587,594 2.7 13,725,094 23.36 2.6 2017 62 2,116,810 9.8 51,506,338 24.33 9.7 2018 32 612,032 2.8 17,424,818 28.47 3.3 2019 and thereafter 47 1,615,268 7.4 35,478,909 21.96 6.7 Totals/Weighted Average 1,796 21,699,203 (c) 100.0 531,252,184 24.48 100.0 (a) Includes office tenants only. Excludes leases for amenity, retail, parking and month-to-month tenants. Some tenants have multiple leases. (b) Annualized base rental revenue is based on actual December 2007 billings times 12. For leases whose rent commences after January 1, 2008, annualized base
rental revenue is based on the first full month’s billing times 12. As annualized base rental revenue is not derived from historical GAAP results, historical results may differ from those set forth above.
(c) Includes leases expiring December 31, 2007 aggregating 14,273 square feet and representing annualized rent of $316,943 for which no new leases were signed..

32
SCHEDULE OF LEASE EXPIRATIONS: OFFICE/FLEX PROPERTIES The following table sets forth a schedule of lease expirations for the office/flex properties beginning January 1, 2008, assuming that none of the tenants exercise renewal or termination options: Average Annual Percentage Of Rent Per
Net
Net Rentable Total Leased Annualized Rentable Percentage Of Area Subject Square Feet Base Rental Square Foot Annual Base Number Of To Expiring Represented By Revenue Under Represented Rent Under Year Of Leases Leases Expiring Expiring By Expiring Expiring Expiration Expiring (a) (Sq. Ft.) Leases (%) Leases ($) (b) Leases ($) Leases (%) 2008 (c) 65 480,138 10.6 6,173,940 12.86 10.2 2009 81 582,845 12.8 7,772,201 13.33 12.9 2010 86 792,431 17.4 10,889,226 13.74 18.1 2011 62 525,397 11.5 6,166,834 11.74 10.2 2012 68 602,415 13.2 7,867,932 13.06 13.1 2013 44 533,124 11.7 7,198,386 13.50 11.9 2014 18 186,731 4.1 2,556,342 13.69 4.2 2015 10 149,797 3.3 1,483,502 9.90 2.5 2016 12 181,567 4.0 2,764,298 15.22 4.6 2017 13 161,306 3.5 2,647,605 16.41 4.4 2018 14 191,820 4.2 2,404,363 12.53 4.0 2019 and thereafter 8 168,934 3.7 2,354,200 13.94 3.9 Totals/Weighted Average 481 4,556,505 (c) 100.0 60,278,829 13.23 100.0 (a) Includes office/flex tenants only. Excludes leases for amenity, retail, parking and month-to-month tenants. Some tenants have multiple
leases. (b) Annualized base rental revenue is based on actual December 2007 billings times 12. For leases whose rent commences after January 1, 2008,
annualized base rental revenue is based on the first full month’s billing times 12. As annualized base rental revenue is not derived from historical GAAP results, historical results may differ from those set forth above. Includes office/flex tenants only. Excludes leases for amenity, retail, parking and month-to-month tenants. Some tenants have multiple leases.
(c) Includes leases expiring December 31, 2007 aggregating 131,988 square feet and representing annualized rent of $1,920,290 for which no new leases were signed.

33
SCHEDULE OF LEASE EXPIRATIONS: INDUSTRIAL/WAREHOUSE PROPERTIES The following table sets forth a schedule of lease expirations for the industrial/warehouse properties beginning January 1, 2008, assuming that none of the tenants exercise renewal or termination options: Average Annual Percentage Of Rent Per Net Net Rentable Total Leased Annualized Rentable Percentage Of Area Subject Square Feet Base Rental Square Foot Annual Base Number Of To Expiring Represented By Revenue Under Represented Rent Under Year Of Leases Leases Expiring Expiring By Expiring Expiring Expiration Expiring (a) (Sq. Ft.) Leases (%) Leases ($) (b) Leases ($) Leases (%) 2008 2 7,240 1.9 82,681 11.42 2.0 2009 4 42,345 11.1 730,550 17.25 18.1 2010 2 32,950 8.7 397,100 12.05 9.8 2011 1 7,600 2.0 95,000 12.50 2.4 2012 1 6,638 1.8 63,725 9.60 1.6 2013 10 148,415 39.0 1,248,087 8.41 30.9 2016 2 135,082 35.5 1,418,361 10.50 35.2 Totals/Weighted Average 22 380,270 100.0 4,035,504 10.61 100.0 (a) Includes industrial/warehouse tenants only. Excludes leases for amenity, retail, parking and month-to-month industrial/warehouse tenants.
Some tenants have multiple leases. (b) Annualized base rental revenue is based on actual December 2007 billings times 12. For leases whose rent commences after January 1, 2008,
annualized base rental revenue is based on the first full month’s billing times 12. As annualized base rental revenue is not derived from historical GAAP results, the historical results may differ from those set forth above.
SCHEDULE OF LEASE EXPIRATIONS: STAND-ALONE RETAIL PROPERTIES The following table sets forth a schedule of lease expirations for the stand-alone retail properties beginning January 1, 2008, assuming that none of the tenants exercise renewal or termination options: Average Annual Percentage Of Rent Per Net Net Rentable Total Leased Annualized Rentable Percentage Of Area Subject Square Feet Base Rental Square Foot Annual Base Number Of To Expiring Represented By Revenue Under Represented Rent Under Year Of Leases Leases Expiring Expiring By Expiring Expiring Expiration Expiring (a) (Sq. Ft.) Leases (%) Leases ($) (b) Leases ($) Leases (%) 2009 1 9,300 53.8 195,000 20.97 46.4 2018 1 8,000 46.2 225,000 28.13 53.6 Totals/Weighted Average 2 17,300 100.0 420,000 24.28 100.0
(a) Includes stand-alone retail property tenants only. (b) Annualized base rental revenue is based on actual December 2007 billings times 12. For leases whose rent commences after January 1,
2008 annualized base rental revenue is based on the first full month’s billing times 12. As annualized base rental revenue is not derived from historical GAAP results, historical results may differ from those set forth above.

34
INDUSTRY DIVERSIFICATION The following table lists the Company’s 30 largest industry classifications based on annualized contractual base rent of the Consolidated Properties: Annualized Percentage of Percentage of Base Rental Company Square Total Company Revenue Annualized Base Feet Leased Industry Classification (a) ($) (b) (c) (d) Rental Revenue (%) Leased (d) Sq. Ft. (%) Securities, Commodity Contracts & Other Financial 116,331,972 19.5 4,183,589 15.6 Insurance Carriers & Related Activities 48,755,385 8.2 2,118,350 7.9 Manufacturing 47,051,663 7.9 2,216,972 8.3 Computer System Design Services 28,484,708 4.8 1,364,041 5.1 Credit Intermediation & Related Activities 27,705,517 4.6 1,119,532 4.2 Telecommunications 27,147,675 4.6 1,315,096 4.9 Legal Services 24,070,028 4.0 955,919 3.6 Health Care & Social Assistance 24,012,704 4.0 1,198,337 4.5 Wholesale Trade 21,961,034 3.7 1,422,646 5.3 Scientific Research/Development 21,549,733 3.6 937,094 3.5 Other Professional 20,466,810 3.4 885,610 3.3 Accounting/Tax Prep. 18,109,960 3.0 727,704 2.7 Public Administration 16,234,770 2.7 617,621 2.3 Retail Trade 15,563,071 2.6 933,701 3.5 Advertising/Related Services 15,206,639 2.6 619,917 2.3 Other Services (except Public Administration) 14,935,857 2.5 789,184 3.0 Information Services 10,146,488 1.7 436,007 1.6 Arts, Entertainment & Recreation 9,361,518 1.6 566,414 2.1 Architectural/Engineering 9,193,910 1.5 409,436 1.5 Real Estate & Rental & Leasing 8,844,972 1.5 413,448 1.6 Construction 8,584,162 1.4 395,943 1.5 Broadcasting 7,603,641 1.3 475,740 1.8 Utilities 7,206,837 1.2 339,377 1.3 Admin & Support, Waste Mgt. & Remediation Services 6,951,228 1.2 400,488 1.5 Data Processing Services 5,845,322 1.0 240,585 0.9 Transportation 5,830,219 1.0 308,274 1.2 Educational Services 5,508,496 0.9 282,336 1.1 Specialized Design Services 4,175,140 0.7 183,273 0.7 Management of Companies & Finance 3,664,372 0.6 147,079 0.6 Publishing Industries 3,557,304 0.6 185,610 0.7 Other 11,925,382 2.1 463,955 1.9
Totals 595,986,517 100.0 26,653,278 100.0 (a) The Company’s tenants are classified according to the U.S. Government’s North American Industrial Classification System (NAICS)
which has replaced the Standard Industrial Code (SIC) system. (b) Annualized base rental revenue is based on actual December 2007 billings times 12. For leases whose rent commences after January 1,
2008, annualized base rental revenue is based on the first full month’s billing times 12. As annualized base rental revenue is not derived from historical GAAP results, historical results may differ from those set forth above.
(c) Includes office, office/flex, industrial/warehouse and stand-alone retail tenants only. Excludes leases for amenity, retail, parking and month-to-month tenants. Some tenants have multiple leases.
(d) Includes leases in effect as of the period end date, some of which have commencement dates in the future (including, at December 31, 2007, a lease with a commencement date substantially in the future consisting of 8,590 square feet scheduled to commence in 2009), and leases expiring December 31, 2007 aggregating 146,261 square feet and representing annualized rent of $2,237,232 for which no new leases were signed.

35
MARKET DIVERSIFICATION The following table lists the Company’s markets (MSAs), based on annualized contractual base rent of the Consolidated Properties: Percentage Of Company Annualized Base Annualized Total Property Rental Revenue Base Rental Size Rentable Percentage Of Market (MSA) ($) (a) (b) (c) Revenue (%) Area (b) (c) Rentable Area (%) Jersey City, NJ 117,129,345 19.6 4,317,978 14.8 Newark, NJ (Essex-Morris-Union Counties) 116,048,183 19.5 5,847,318 20.0 Westchester-Rockland, NY 92,728,821 15.6 4,968,420 17.0 Bergen-Passaic, NJ 91,792,074 15.4 4,602,401 15.7 Philadelphia, PA-NJ 55,501,093 9.3 3,529,994 12.1 Washington, DC-MD-VA-WV 31,191,296 5.2 1,292,807 4.4 Monmouth-Ocean, NJ 26,235,892 4.4 1,620,863 5.5 Trenton, NJ 20,568,550 3.5 956,597 3.3 Middlesex-Somerset-Hunterdon, NJ 19,567,698 3.3 986,760 3.4 New York, NY (Manhattan) 15,442,033 2.6 524,476 1.8 Stamford-Norwalk, CT 7,305,712 1.2 452,260 1.5 Bridgeport, CT 2,475,820 0.4 145,487 0.5
Totals 595,986,517 100.0 29,245,361 100.0 (a) Annualized base rental revenue is based on actual December 2007 billings times 12. For leases whose rent commences after January 1,
2008, annualized base rental revenue is based on the first full month’s billing times 12. As annualized base rental revenue is not derived from historical GAAP results, historical results may differ from those set forth above.
(b) Includes leases in effect as of the period end date, some of which have commencement dates in the future (including, at December 31, 2007, a lease with a commencement date substantially in the future consisting of 8,590 square feet scheduled to commence in 2009), and leases expiring December 31, 2007 aggregating 146,261 feet and representing annualized rent of $2,237,232 for which no new leases were signed.
(c) Includes office, office/flex, industrial/warehouse and stand-alone retail tenants only. Excludes leases for amenity, retail, parking and month-to-month tenants. Some tenants have multiple leases.

36
ITEM 3. LEGAL PROCEEDINGS There are no material pending legal proceedings, other than ordinary routine litigation incidental to its business, to which the Company is a party or to which any of the Properties is subject. ITEM 4. SUBMISSION OF MATTERS TO A VOTE OF SECURITY HOLDERS Not Applicable.

37
PART II ITEM 5. MARKET FOR REGISTRANT’S COMMON EQUITY, RELATED STOCKHOLDER MATTERS
AND ISSUER PURCHASES OF EQUITY SECURITIES MARKET INFORMATION The shares of the Company’s Common Stock are traded on the New York Stock Exchange (“NYSE”) under the symbol “CLI.” The following table sets forth the quarterly high, low, and closing price per share of Common Stock reported on the NYSE for the years ended December 31, 2007 and 2006, respectively:
For the Year Ended December 31, 2007: High Low Close First Quarter $56.52 $46.89 $47.63 Second Quarter $50.83 $42.33 $43.49 Third Quarter $44.98 $36.80 $41.10 Fourth Quarter $46.51 $30.41 $34.00 For the Year Ended December 31, 2006: High Low Close First Quarter $48.37 $42.34 $48.00 Second Quarter $47.47 $42.17 $45.92 Third Quarter $53.66 $45.47 $51.80 Fourth Quarter $55.37 $48.24 $51.00
On February 8, 2008, the closing Common Stock price reported on the NYSE was $33.67 per share. On June 20, 2007, the Company filed with the NYSE its annual CEO Certification and Annual Written Affirmation pursuant to Section 303A.12 of the NYSE Listed Company Manual, each certifying that the Company was in compliance with all of the listing standards of the NYSE. HOLDERS On February 8, 2008, the Company had 585 common shareholders of record. RECENT SALES OF UNREGISTERED SECURITIES; USES OF PROCEEDS FROM REGISTERED SECURITIES During the three months ended December 31, 2007, the Company issued 261,090 shares of common stock to holders of common units in the Operating Partnership upon the redemption of such common units in private offerings pursuant to Section 4(2) of the Securities Act. The holders of the common units were limited partners of the Operating Partnership and accredited investors under Rule 501 of the Securities Act. The common units were converted into an equal number of shares of common stock. The Company has registered the resale of such shares under the Securities Act. DIVIDENDS AND DISTRIBUTIONS During the year ended December 31, 2007, the Company declared four quarterly common stock dividends and common unit distributions in the amounts of $0.64, $0.64, $0.64 and $0.64 per share and per unit from the first to the fourth quarter, respectively. Additionally, in 2007, the Company declared quarterly preferred stock dividends of $50.00 per preferred share from the first to the fourth quarter.
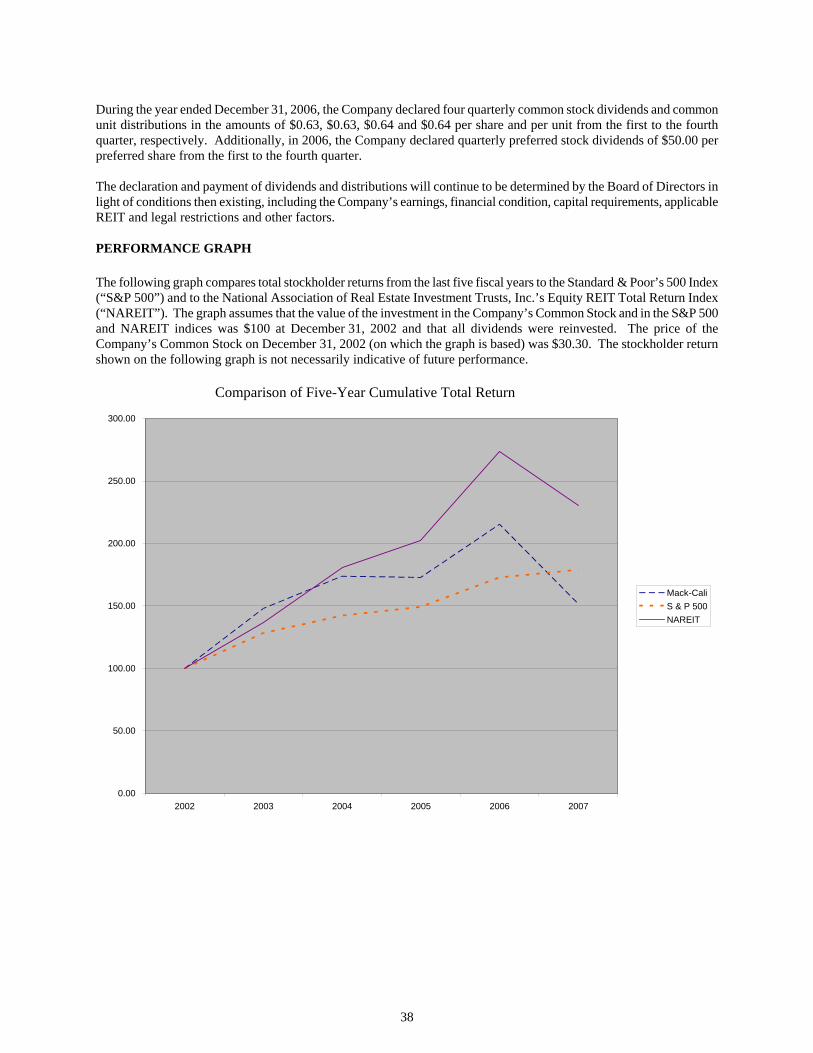
38
During the year ended December 31, 2006, the Company declared four quarterly common stock dividends and common unit distributions in the amounts of $0.63, $0.63, $0.64 and $0.64 per share and per unit from the first to the fourth quarter, respectively. Additionally, in 2006, the Company declared quarterly preferred stock dividends of $50.00 per preferred share from the first to the fourth quarter. The declaration and payment of dividends and distributions will continue to be determined by the Board of Directors in light of conditions then existing, including the Company’s earnings, financial condition, capital requirements, applicable REIT and legal restrictions and other factors. PERFORMANCE GRAPH The following graph compares total stockholder returns from the last five fiscal years to the Standard & Poor’s 500 Index (“S&P 500”) and to the National Association of Real Estate Investment Trusts, Inc.’s Equity REIT Total Return Index (“NAREIT”). The graph assumes that the value of the investment in the Company’s Common Stock and in the S&P 500 and NAREIT indices was $100 at December 31, 2002 and that all dividends were reinvested. The price of the Company’s Common Stock on December 31, 2002 (on which the graph is based) was $30.30. The stockholder return shown on the following graph is not necessarily indicative of future performance.
Comparison of Five-Year Cumulative Total Return
0.00
50.00
100.00
150.00
200.00
250.00
300.00
2002 2003 2004 2005 2006 2007
Mack-CaliS & P 500NAREIT

39
SECURITIES AUTHORIZED FOR ISSUANCE UNDER EQUITY COMPENSATION PLANS Information regarding securities authorized for issuance under our equity compensation plans is disclosed in Item 12: Security Ownership of Certain Beneficial Owners and Management and Related Stockholder Matters. PURCHASES OF EQUITY SECURITIES BY THE ISSUER AND AFFILIATED PURCHASERS
Total Number of Maximum Dollar Value Total Number of Shares Purchased as of Shares That May Yet Shares Average Price Part of Publicly be Purchase under the
Period Purchased Paid Per Share Announced Plan (1) Announced Plan (1) October 1, 2007 to October 31, 2007 -- N/A -- $138,829,930.70 November 1, 2007 November 30, 2007 1,633,700 $36.28 1,633,700 $ 79,512,789.61 December 1, 2007 to December 31, 2007 976,230 $34.32 976,230 $ 45,983,692.60 Total: 2,609,930 $35.54 2,609,930 $ 45,983,692.60 (1) The Board of Directors of the Company adopted a $100 million share repurchase program on August 6, 1998 and re-authorized
and increased the share repurchase program to $150 million on September 13, 2000. From September 2000 through August 2007, approximately $105.5 million of shares of the Company’s common stock were repurchased. On September 12, 2007, theBoard of Directors of the Company further re-authorized and increased the share repurchase program to $150 million. The share repurchase program authorizes repurchases from time to time in open market transactions at prevailing prices or throughprivately negotiated transactions and is not subject to an expiration date.

40
ITEM 6. SELECTED FINANCIAL DATA The following table sets forth selected financial data on a consolidated basis for the Company. The consolidated selected operating, balance sheet and other data of the Company as of December 31, 2007, 2006, 2005, 2004 and 2003, and for the years then ended have been derived from the Company’s financial statements for the respective periods. Operating Data (a) Year Ended December 31, In thousands, except per share data 2007 2006 2005 2004 2003 Total revenues $ 808,350 $ 732,012 $ 591,991 $ 529,225 $ 509,099 Property expenses (b) $ 270,913 $ 253,667 $ 207,558 $ 168,021 $ 156,073 Direct construction costs $ 85,180 $ 53,602 -- -- -- General and administrative $ 52,162 $ 49,074 $ 32,432 $ 31,305 $ 30,827 Interest expense $ 126,672 $ 134,964 $ 119,070 $ 109,211 $ 114,919 Income from continuing operations $ 73,129 $ 84,679 $ 73,987 $ 77,977 $ 110,731 Net income available to common shareholders $ 108,466 $ 142,666 $ 93,488 $ 100,453 $ 141,381 Income from continuing operations per share – basic $ 1.06 $ 1.33 $ 1.17 $ 1.26 $ 1.89 Income from continuing operations per share – diluted $ 1.06 $ 1.32 $ 1.16 $ 1.25 $ 1.88 Net income per share – basic $ 1.62 $ 2.29 $ 1.52 $ 1.66 $ 2.45 Net income per share – diluted $ 1.61 $ 2.28 $ 1.51 $ 1.65 $ 2.43 Dividends declared per common share $ 2.56 $ 2.54 $ 2.52 $ 2.52 $ 2.52 Basic weighted average shares outstanding 67,026 62,237 61,477 60,351 57,724 Diluted weighted average shares outstanding 82,500 77,901 74,189 68,743 65,980 Balance Sheet Data December 31, In thousands 2007 2006 2005 2004 2003 Rental property, before accumulated depreciation and amortization $4,885,429 $4,573,587 $4,491,752 $4,160,959 $3,954,632 Rental property held for sale, net -- -- -- $ 19,132 -- Total assets $4,593,202 $4,422,889 $4,247,502 $3,850,165 $3,749,570 Total debt (c) $2,211,735 $2,159,959 $2,126,181 $1,702,300 $1,628,584 Total liabilities $2,492,797 $2,412,762 $2,335,396 $1,877,096 $1,779,983 Minority interests $ 457,850 $ 482,220 $ 400,819 $ 427,958 $ 428,099 Stockholders’ equity $1,642,555 $1,527,907 $1,511,287 $1,545,111 $1,541,488 ________________________ (a) Certain reclassifications have been made to prior period amounts in order to conform with current period presentation. (b) Property expenses is calculated by taking the sum of real estate taxes, utilities and operating services for each of the periods presented. (c) Total debt is calculated by taking the sum of senior unsecured notes, revolving credit facilities, and mortgages, loans payable and other
obligations.

41
ITEM 7. MANAGEMENT’S DISCUSSION AND ANALYSIS OF FINANCIAL CONDITION AND RESULTS OF OPERATIONS
The following discussion should be read in conjunction with the Consolidated Financial Statements of Mack-Cali Realty Corporation and the notes thereto (collectively, the “Financial Statements”). Certain defined terms used herein have the meaning ascribed to them in the Financial Statements.
Executive Overview Mack-Cali Realty Corporation (the “Company”) is one of the largest real estate investment trusts (REITs) in the United States, with a total market capitalization of approximately $5.0 billion at December 31, 2007. The Company has been involved in all aspects of commercial real estate development, management and ownership for over 50 years and has been a publicly-traded REIT since 1994. The Company owns or has interests in 294 properties (collectively, the “Properties”), primarily class A office and office/flex buildings, totaling approximately 33.7 million square feet, leased to approximately 2,200 tenants. The properties are located primarily in suburban markets of the Northeast, some with adjacent, Company-controlled developable land sites able to accommodate up to 11.3 million square feet of additional commercial space. The Company’s strategy is to be a significant real estate owner and operator in its core, high-barriers-to-entry markets, primarily in the Northeast. As an owner of real estate, almost all of the Company’s earnings and cash flow is derived from rental revenue received pursuant to leased space at the Properties. Key factors that affect the Company’s business and financial results include the following:
• the general economic climate; • the occupancy rates of the Properties; • rental rates on new or renewed leases; • tenant improvement and leasing costs incurred to obtain and retain tenants; • the extent of early lease terminations; • operating expenses; • cost of capital; and • the extent of acquisitions, development and sales of real estate.
Any negative effects of the above key factors could potentially cause a deterioration in the Company’s revenue and/or earnings. Such negative effects could include: (1) failure to renew or execute new leases as current leases expire; (2) failure to renew or execute new leases with rental terms at or above the terms of in-place leases; and (3) tenant defaults. A failure to renew or execute new leases as current leases expire or to execute new leases with rental terms at or above the terms of in-place leases may be affected by several factors such as: (1) the local economic climate, which may be adversely impacted by business layoffs or downsizing, industry slowdowns, changing demographics and other factors; and (2) local real estate conditions, such as oversupply of office and office/flex space or competition within the market. The Company’s core markets continue to be weak. The percentage leased in the Company’s consolidated portfolio of stabilized operating properties was 92.7 percent at December 31, 2007 as compared to 92.0 percent at December 31, 2006 and 91.0 percent at December 31, 2005. Percentage leased includes all leases in effect as of the period end date, some of which have commencement dates in the future (including, at December 31, 2007, a lease with a commencement date substantially in the future consisting of 8,590 square feet scheduled to commence in 2009), and leases that expire at the period end date. Leases that expired as of December 31, 2007, 2006 and 2005 aggregate 146,261, 103,477 and 311,623 square feet, respectively, or 0.5, 0.4 and 1.1 percentage of the net rentable square footage, respectively. Rental rates on the Company’s space that was re-leased (based on first rents payable) during the year ended December 31, 2007 decreased an average of 0.2 percent compared to rates that were in effect under the prior leases, as compared to a 0.2 percent decrease in 2006 and an 8.2 percent decrease in 2005. The Company believes that vacancy rates may continue to increase in some of its markets in 2008. As a result, the Company’s future earnings and cash flow may continue to be negatively impacted by current market conditions.

42
The remaining portion of this Management’s Discussion and Analysis of Financial Condition and Results of Operations should help the reader understand:
• property transactions during the period; • critical accounting policies and estimates; • results of operations for the year ended December 31, 2007 as compared to the year ended
December 31, 2006; • results of operations for the year ended December 31, 2006 as compared to the year ended
December 31, 2005; and • liquidity and capital resources.
Summary of 2007 Transactions Property Acquisitions The Company acquired the following office properties during the year ended December 31, 2007 (dollars in thousands): Acquisition # of Rentable Acquisition Date Property/Address Location Bldgs. Square Feet Cost 05/08/07 AAA Properties (a) (c) Hamilton Township, New Jersey 2 69,232 $ 9,048 06/11/07 125 Broad Street (b) (c) New York, New York 1 524,476 274,091 Total Property Acquisitions: 3 593,708 $283,139 (a) Included in this transaction was the acquisition of two parcels of developable land aggregating approximately 13 acres. (b) Acquisition represented two units of office condominium interests, which collectively comprise floors 2 through 16, or
39.6 percent, of the 40-story, 1.2 million square-foot building. (c) Transaction was funded primarily through borrowing on the Company’s revolving credit facility. Properties Commencing Initial Operations The following office property commenced initial operations during the year ended December 31, 2007 (dollars in thousands): # of Rentable Investment by Date Property/Address Location Bldgs. Square Feet Company (a) 05/08/07 700 Horizon Drive Hamilton Township, New Jersey 1 120,000 $16,751 Total Properties Commencing Initial Operations: 1 120,000 $16,751 (a) Development costs were funded primarily through borrowing on the Company’s revolving credit facility. Amounts are as
of December 31, 2007. Land Acquisition In February 2007, the Company exercised its option to acquire approximately 43 acres of land sites within its Capital Office Park complex in Greenbelt, Maryland, which is able to accommodate the development of up to 600,000 square feet of office space, for $13 million. On May 25, 2007, the Company completed the purchase of the land for approximately $13 million, which consisted of 114,911 common operating partnership units valued at $5.2 million, and the remainder in cash.

43
Property Sales The Company sold the following office properties during the year ended December 31, 2007 (dollars in thousands): Rentable Net Net Sale # of Square Sales Book Realized Date Property/Address Location Bldgs. Feet Proceeds Value Gain 05/10/07 1000 Bridgeport Avenue Shelton, Connecticut 1 133,000 $16,411 $13,782 $ 2,62906/11/07 500 W. Putnam Avenue Greenwich, Connecticut 1 121,250 54,344 18,113 36,23107/13/07 100& 200 Decadon Drive Egg Harbor, New Jersey 2 80,344 11,448 5,894 5,554 Total Office Property Sales: 4 334,594 $82,203 $37,789 $44,414
Critical Accounting Policies and Estimates The Financial Statements have been prepared in conformity with generally accepted accounting principles. The preparation of the Financial Statements requires management to make estimates and assumptions that affect the reported amounts of assets and liabilities and disclosure of contingent assets and liabilities at the date of the Financial Statements, and the reported amounts of revenues and expenses during the reported period. These estimates and assumptions are based on management’s historical experience that are believed to be reasonable at the time. However, because future events and their effects cannot be determined with certainty, the determination of estimates requires the exercise of judgment. The Company’s critical accounting policies are those which require assumptions to be made about matters that are highly uncertain. Different estimates could have a material effect on the Company’s financial results. Judgments and uncertainties affecting the application of these policies and estimates may result in materially different amounts being reported under different conditions and circumstances. Rental Property: Rental properties are stated at cost less accumulated depreciation and amortization. Costs directly related to the acquisition, development and construction of rental properties are capitalized. Capitalized development and construction costs include pre-construction costs essential to the development of the property, development and construction costs, interest, property taxes, insurance, salaries and other project costs incurred during the period of development. Interest capitalized by the Company for the years ended December 31, 2007, 2006 and 2005 was $5.1 million, $6.1, million and $5.5 million, respectively. Ordinary repairs and maintenance are expensed as incurred; major replacements and betterments, which improve or extend the life of the asset, are capitalized and depreciated over their estimated useful lives. Fully-depreciated assets are removed from the accounts. The Company considers a construction project as substantially completed and held available for occupancy upon the completion of tenant improvements, but no later than one year from cessation of major construction activity (as distinguished from activities such as routine maintenance and cleanup). If portions of a rental project are substantially completed and occupied by tenants, or held available for occupancy, and other portions have not yet reached that stage, the substantially completed portions are accounted for as a separate project. The Company allocates costs incurred between the portions under construction and the portions substantially completed and held available for occupancy and capitalizes only those costs associated with the portion under construction. Properties are depreciated using the straight-line method over the estimated useful lives of the assets. The estimated useful lives are as follows:
Leasehold interests Remaining lease term Buildings and improvements 5 to 40 years Tenant improvements The shorter of the term of the
related lease or useful life Furniture, fixtures and equipment 5 to 10 years

44
Upon acquisition of rental property, the Company estimates the fair value of acquired tangible assets, consisting of land, building and improvements, and identified intangible assets and liabilities generally consisting of the fair value of (i) above and below market leases, (ii) in-place leases and (iii) tenant relationships. The Company allocates the purchase price to the assets acquired and liabilities assumed based on their relative fair values. In estimating the fair value of the tangible and intangible assets acquired, the Company considers information obtained about each property as a result of its due diligence and marketing and leasing activities, and utilizes various valuation methods, such as estimated cash flow projections utilizing appropriate discount and capitalization rates, estimates of replacement costs net of depreciation, and available market information. The fair value of the tangible assets of an acquired property considers the value of the property as if it were vacant. Above-market and below-market lease values for acquired properties are recorded based on the present value (using a discount rate which reflects the risks associated with the leases acquired) of the difference between (i) the contractual amounts to be paid pursuant to each in-place lease and (ii) management’s estimate of fair market lease rates for each corresponding in-place lease, measured over a period equal to the remaining term of the lease for above-market leases and the remaining initial term plus the term of any below-market fixed rate renewal options for below-market leases. The capitalized above-market lease values are amortized as a reduction of base rental revenue over the remaining term of the respective leases, and the capitalized below-market lease values are amortized as an increase to base rental revenue over the remaining initial terms plus the terms of any below-market fixed rate renewal options of the respective leases. Other intangible assets acquired include amounts for in-place lease values and tenant relationship values which are based on management’s evaluation of the specific characteristics of each tenant’s lease and the Company’s overall relationship with the respective tenant. Factors to be considered by management in its analysis of in-place lease values include an estimate of carrying costs during hypothetical expected lease-up periods considering current market conditions, and costs to execute similar leases. In estimating carrying costs, management includes real estate taxes, insurance and other operating expenses and estimates of lost rentals at market rates during the expected lease-up periods, depending on local market conditions. In estimating costs to execute similar leases, management considers leasing commissions, legal and other related expenses. Characteristics considered by management in valuing tenant relationships include the nature and extent of the Company’s existing business relationships with the tenant, growth prospects for developing new business with the tenant, the tenant’s credit quality and expectations of lease renewals. The value of in-place leases are amortized to expense over the remaining initial terms of the respective leases. The value of tenant relationship intangibles will be amortized to expense over the anticipated life of the relationships. On a periodic basis, management assesses whether there are any indicators that the value of the Company’s rental properties may be impaired. A property’s value is impaired only if management’s estimate of the aggregate future cash flows (undiscounted and without interest charges) to be generated by the property is less than the carrying value of the property. To the extent impairment has occurred, the loss shall be measured as the excess of the carrying amount of the property over the fair value of the property. The Company’s estimates of aggregate future cash flows expected to be generated by each property are based on a number of assumptions that are subject to economic and market uncertainties including, among others, demand for space, competition for tenants, changes in market rental rates, and costs to operate each property. As these factors are difficult to predict and are subject to future events that may alter management’s assumptions, the future cash flows estimated by management in its impairment analyses may not be achieved. Management does not believe that the value of any of the Company’s rental properties is impaired. Rental Property Held for Sale and Discontinued Operations: When assets are identified by management as held for sale, the Company discontinues depreciating the assets and estimates the sales price, net of selling costs, of such assets. If, in management’s opinion, the net sales price of the assets which have been identified as held for sale is less than the net book value of the assets, a valuation allowance is established. Properties identified as held for sale and/or sold are presented in discontinued operations for all periods presented. If circumstances arise that previously were considered unlikely and, as a result, the Company decides not to sell a property previously classified as held for sale, the property is reclassified as held and used. A property that is reclassified is measured and recorded individually at the lower of (a) its carrying amount before the property was classified as held for sale, adjusted for any depreciation (amortization) expense that would have been recognized had the property been continuously classified as held and used, or (b) the fair value at the date of the subsequent decision not to sell.

45
Revenue Recognition: Base rental revenue is recognized on a straight-line basis over the terms of the respective leases. Unbilled rents receivable represents the amount by which straight-line rental revenue exceeds rents currently billed in accordance with the lease agreements. Above-market and below-market lease values for acquired properties are recorded based on the present value (using a discount rate which reflects the risks associated with the leases acquired) of the difference between (i) the contractual amounts to be paid pursuant to each in-place lease and (ii) management’s estimate of fair market lease rates for each corresponding in-place lease, measured over a period equal to the remaining term of the lease for above-market leases and the initial term plus the term of any below-market fixed-rate renewal options for below-market leases. The capitalized above-market lease values for acquired properties are amortized as a reduction of base rental revenue over the remaining term of the respective leases, and the capitalized below-market lease values are amortized as an increase to base rental revenue over the remaining initial terms plus the terms of any below-market fixed-rate renewal options of the respective leases. Escalations and recoveries from tenants are received from tenants for certain costs as provided in the lease agreements. These costs generally include real estate taxes, utilities, insurance, common area maintenance and other recoverable costs. Construction services revenue includes fees earned and reimbursements received by the Company for providing construction management and general contractor services to clients. Construction services revenue is recognized on the percentage of completion method. Using this method, profits are recorded on the basis of our estimates of the overall profit and percentage of completion of individual contracts. A portion of the estimated profits is accrued based upon estimates of the percentage of completion of the construction contract. This revenue recognition method involves inherent risks relating to profit and cost estimates. Real estate services revenue includes property management, facilities management, leasing commission fees and other services, and payroll and related costs reimbursed from clients. Other income includes income from parking spaces leased to tenants, income from tenants for additional services arranged for the Company and income from tenants for early lease terminations. Allowance for Doubtful Accounts: Management periodically performs a detailed review of amounts due from tenants to determine if accounts receivable balances are impaired based on factors affecting the collectibility of those balances. Management’s estimate of the allowance for doubtful accounts requires management to exercise significant judgment about the timing, frequency and severity of collection losses, which affects the allowance and net income.
46
Results From Operations The following comparisons for the year ended December 31, 2007 (“2007”), as compared to the year ended December 31, 2006 (“2006”), and for 2006, as compared to the year ended December 31, 2005 (“2005”), make reference to the following: (i) the effect of the “Same-Store Properties,” which represents all in-service properties owned by the Company at December 31, 2005, (for the 2007 versus 2006 comparison) and which represents all in-service properties owned by the Company at December 31, 2004, (for the 2006 versus 2005 comparison), excluding properties sold or held for sale through December 31, 2007, and (ii) the effect of the “Acquired Properties,” which represents all properties acquired by the Company or commencing initial operations from January 1, 2006 through December 31, 2007 (for the 2007 versus 2006 comparison) and which represent all properties acquired by the Company or commencing initial operation from January 1, 2005 through December 31, 2006 (for the 2006 versus 2005 comparison).

47
Year Ended December 31, 2007 Compared to Year Ended December 31, 2006
Year Ended
December 31, Dollar Percent (dollars in thousands) 2007 2006 Change Change Revenue from rental operations: Base rents $575,463 $532,879 $ 42,584 8.0% Escalations and recoveries from tenants 104,781 90,214 14,567 16.1 Other income 22,070 21,649 421 1.9 Total revenues from rental operations 702,314 644,742 57,572 8.9 Property expenses: Real estate taxes 90,895 85,999 4,896 5.7 Utilities 73,072 59,788 13,284 22.2 Operating services 106,946 107,880 (934) (0.9) Total property expenses 270,913 253,667 17,246 6.8 Non-property revenues: Construction services 88,066 56,225 31,841 56.6 Real estate services 17,970 31,045 (13,075) (42.1) Total non-property revenues 106,036 87,270 18,766 21.5 Non-property expenses: Direct constructions costs 85,179 53,602 31,577 58.9 General and administrative 52,162 49,074 3,088 6.3 Depreciation and amortization 183,564 159,096 24,468 15.4 Total non-property expenses 320,905 261,772 59,133 22.6 Operating Income 216,532 216,573 (41) -- Other (expense) income: Interest expense (126,672) (134,964) 8,292 6.1 Interest and other investment income 4,670 3,054 1,616 52.9 Equity in earnings (loss) of unconsolidated joint ventures (5,918) (5,556) (362) (6.5) Minority interest in consolidated joint ventures 643 218 425 195.0 Gain on sale of investment in marketable securities -- 15,060 (15,060) (100.0) Gain on sale of investment in joint ventures -- 10,831 (10,831) (100.0) Gain/(loss) on sale of land and other assets -- (416) 416 100.0 Total other (expense) income (127,277) (111,773) (15,504) (13.9) Income from continuing operations before minority interest in Operating Partnership 89,255 104,800 (15,545) (14.8) Minority interest in Operating Partnership (16,126) (20,121) 3,995 19.9 Income from continuing operations 73,129 84,679 (11,550) (13.6) Discontinued operations (net of minority interest): Income (loss) from discontinued operations 1,057 12,272 (11,215) (91.4) Realized gains (losses) and unrealized losses on disposition of rental property, net 36,280 47,715 (11,435) (24.0) Total discontinued operations, net 37,337 59,987 (22,650) (37.8) Net income 110,466 144,666 (34,200) (23.6) Preferred stock dividends (2,000) (2,000) -- -- Net income available to common shareholders $108,466 $142,666 $(34,200) (24.0)%

48
The following is a summary of the changes in revenue from rental operations and property expenses in 2007 as compared to 2006 divided into Same-Store Properties and Acquired Properties (dollars in thousands): Total Company Same-Store Properties Acquired Properties Dollar Percent Dollar Percent Dollar Percent Change Change Change Change Change Change Revenue from rental operations: Base rents $42,584 8.0% $19,823 3.7% $ 22,761 4.3% Escalations and recoveries from tenants 14,567 16.1 9,086 10.1 5,481 6.0 Other income 421 1.9 2,037 9.4 (1,616) (7.5) Total $57,572 8.9% $30,946 4.8% $ 26,626 4.1% Property expenses: Real estate taxes $ 4,896 5.7% $1,660 1.9% $3,236 3.8% Utilities 13,284 22.2 10,878 18.2 2,406 4.0 Operating services (934) (0.9) 8,884 8.2 (9,818) (9.1) Total $17,246 6.8% $21,422 8.4% $ (4,176) (1.6)% OTHER DATA: Number of Consolidated Properties 255 240 15 Square feet (in thousands) 29,245 27,070 2,175 Base rents for the Same-Store Properties increased $19.8 million, or 3.7 percent, for 2007 as compared to 2006, due primarily to an increase in the percentage of space leased at the properties in 2007 from 2006. Escalations and recoveries from tenants for the Same-Store Properties increased $9.1 million, or 10.1 percent, for 2007 over 2006, due primarily to an increased amount of total property expenses in 2007. Other income for the Same-Store Properties increased $2.0 million, or 9.4 percent, due primarily to an increase in lease termination fees in 2007. Real estate taxes on the Same-Store Properties increased $1.7 million, or 1.9 percent, for 2007 as compared to 2006, due primarily to property tax rate increases in certain municipalities in 2007, partially offset by reduced assessments on certain properties in 2007. Utilities for the Same-Store Properties increased $10.9 million, or 18.2 percent, for 2007 as compared to 2006, due primarily to increased electric rates in 2007 as compared to 2006. Operating services for the Same-Store Properties increased $8.9 million, or 8.2 percent, due primarily to increases in maintenance costs of $3.9 million, snow removal costs of $2.0 million, salaries and related expenses of $1.0 million, and property insurance expense of $0.7 million in 2007 as compared to 2006. Construction services revenue increased $31.8 million in 2007 as compared to 2006, due to the effect of the Gale/Green transactions completed in May 2006 (“Gale/Green Transactions”). Real estate services revenues decreased by $13.1 million, or 42.1 percent, for 2007 as compared to 2006, due primarily to the contribution of the Gale facilities management business to an unconsolidated joint venture in late 2006. Direct construction costs increased $31.6 million in 2007 as compared to 2006, due primarily to the effect of the Gale/Green Transactions. General and administrative increased by $3.1 million, or 6.3 percent, for 2007 as compared to 2006 due primarily to the effect of the Gale/Green Transactions. Depreciation and amortization increased by $24.5 million, or 15.4 percent, for 2007 over 2006. Of this increase, $8.8 million, or 5.5 percent, was attributable to the Same-Store Properties and $15.7 million, or 9.9 percent, was due to the Acquired Properties.

49
Interest expense decreased $8.3 million, or 6.1 percent, for 2007 as compared to 2006. This decrease was primarily as a result of lower average debt balances in 2007 as compared to 2006, partially due to the use of proceeds from the common stock offering in February 2007 to repay outstanding borrowings. Interest and other investment income increased $1.6 million, or 52.9 percent, for 2007 as compared to 2006. This increase was due primarily to higher cash balances invested in 2007. Equity in earnings of unconsolidated joint ventures decreased $0.4 million, or 6.5 percent, for 2007 as compared to 2006. The decrease was due primarily to an increased loss of $2.1 million in the Route 93 joint venture and an increased loss of $1.7 million in the Mack-Green joint venture. These losses were partially offset by 2006 losses of $1.9 million in the Meadowlands Xanadu venture and $0.9 million in the G&G Martco venture, with no activity for these ventures in 2007, and an increased net income of $0.4 million in 2007 in the 12 Vreeland venture. The Company recognized a gain on sale of investment in marketable securities of $15.1 million in 2006. Gain on sale of investment in unconsolidated joint ventures amounted to $10.8 million in 2006 from the sale of the Company’s interest in the G&G Martco joint venture. Gain (loss) on sale of land and other assets amounted to a loss of $0.4 million in 2006 due to a loss on the sale of Gale Global Facilities and related companies in 2006 of $1.5 million, partially offset by a gain of $1.1 million from the sale of a parcel of land in Hamilton, New Jersey. Income from continuing operations before minority interest in Operating Partnership decreased to approximately $89.2 million in 2007 from $104.8 million in 2006. The decrease of approximately $15.6 million was due to the factors discussed above. Net income available to common shareholders decreased by $34.2 million, or 24.0 percent, from $142.7 million in 2006 to $108.5 million in 2007. This decrease was primarily the result of realized gains on disposition of rental property of $47.7 million in 2006, decrease in income from continuing operations before minority interest in Operating Partnership of approximately $15.6 million and a decrease in income from discontinued operations of $11.2 million for 2007 as compared to 2006. These were partially offset by realized gains on disposition of rental property of $36.3 million in 2007, and a decrease in minority interest in Operating Partnership in 2007 of $4.0 million as compared to 2006.

50
Year Ended December 31, 2006 Compared to Year Ended December 31, 2005
Year Ended December 31, Dollar Percent (dollars in thousands) 2006 2005 Change Change Revenue from rental operations: Base rents $532,879 $497,358 $35,521 7.1% Escalations and recoveries from tenants 90,214 77,109 13,105 17.0 Other income 21,649 14,607 7,042 48.2 Total revenues from rental operations 644,742 589,074 55,668 9.5 Property expenses: Real estate taxes 85,999 76,653 9,346 12.2 Utilities 59,788 51,720 8,068 15.6 Operating services 107,880 79,185 28,695 36.2 Total property expenses 253,667 207,558 46,109 22.2 Non-property revenues: Construction services 56,225 -- 56,225 -- Real estate services 31,045 2,917 28,128 964.3 Total non-property revenues 87,270 2,917 84,353 2,891.8 Non-property expenses: Direct constructions costs 53,602 -- 53,602 -- General and administrative 49,074 32,432 16,642 51.3 Depreciation and amortization 159,096 141,771 17,325 12.2 Total non-property expenses 261,772 174,203 87,569 50.3 Operating Income 216,573 210,230 6,343 3.0 Other (expense) income: Interest expense (134,964) (119,070) (15,894) (13.3) Interest and other investment income 3,054 856 2,198 256.8 Equity in earnings (loss) of unconsolidated joint ventures (5,556) 248 (5,804) (2,340.3) Minority interest in consolidated joint ventures 218 (74) 292 394.6 Gain on sale of investment in marketable 15,060 -- 15,060 -- securities 10,831 35 10,796 30,845.7 Gain on sale of investment in joint ventures (416) -- (416) -- Total other (expense) income (111,773) (118,005) 6,232 5.3 Income from continuing operations before minority interest in Operating Partnership 104,800 92,225 12,575 13.6 Minority interest in Operating Partnership (20,121) (18,238) (1,883) (10.3) Income from continuing operations 84,679 73,987 10,692 14.5 Discontinued operations (net of minority interest): Income (loss) from discontinued operations 12,272 17,075 (4,803) (28.1) Realized gains (losses) and unrealized losses on disposition of rental property, net 47,715 4,426 43,289 978.1 Total discontinued operations, net 59,987 21,501 38,486 179.0 Net income 144,666 95,488 49,178 51.5 Preferred stock dividends (2,000) (2,000) -- -- Net income available to common shareholders $142,666 $ 93,488 $49,178 52.6%

51
The following is a summary of the changes in revenue from rental operations and property expenses in 2006 as compared to 2005 divided into Same-Store Properties and Acquired Properties (dollars in thousands): Total Company Same-Store Properties Acquired Properties Dollar Percent Dollar Percent Dollar Percent Change Change Change Change Change ChangeRevenue from rental operations: Base rents $35,521 7.1% $ 6,155 1.2% $29,366 5.9% Escalations and recoveries from tenants 13,105 17.0 6,557 8.5 6,548 8.5 Other income 7,042 48.2 6,181 42.3 861 5.9 Total $55,668 9.5% $18,893 3.2% $36,775 6.3% Property expenses: Real estate taxes $ 9,346 12.2% $ 5,215 6.8% $ 4,131 5.4% Utilities 8,068 15.6 3,803 7.4 4,265 8.2 Operating services 28,695 36.2 1,778 2.2 26,917 34.0 Total $46,109 22.2% $10,796 5.2% $35,313 17.0% OTHER DATA: Number of Consolidated Properties 251 234 17 Square feet (in thousands) 28,531 25,238 3,293 Base rents for the Same-Store Properties increased $6.2 million, or 1.2 percent, for 2006 as compared to 2005, due primarily to an increase in the percentage of space leased at the properties in 2006 from 2005. Escalations and recoveries from tenants for the Same-Store Properties increased $6.6 million, or 8.5 percent, for 2006 over 2005, due primarily to an increased amount of total property expenses in 2006. Other income for the Same-Store Properties increased $6.2 million, or 42.3 percent, due primarily to an increase in lease breakage fees. Real estate taxes on the Same-Store Properties increased $5.2 million, or 6.8 percent, for 2006 as compared to 2005, due primarily to property tax rate increases in certain municipalities in 2006. Utilities for the Same-Store Properties increased $3.8 million, or 7.4 percent, for 2006 as compared to 2005, due primarily to increased electric rates in 2006 as compared to 2005. Operating services for the Same-Store Properties increased $1.8 million, or 2.2 percent, due primarily to increased maintenance and related labor costs of $5.1 million for 2006 as compared to 2005, partially offset by a decrease in snow removal costs in 2006 of $3.1 million. Construction services amounted to $56.2 million in 2006, due to the effect of the Gale/Green Transactions. Real estate services increased by $28.1 million, or 964.3 percent, for 2006 as compared to 2005, also due primarily to the effect of the Gale/Green Transactions. Direct construction costs totaled $53.6 million in 2006, due primarily to the effect of the Gale/Green Transactions. General and administrative increased by $16.6 million, or 51.3 percent, for 2006 as compared to 2005 due primarily to the effect of the Gale/Green Transactions. Depreciation and amortization increased by $17.3 million, or 12.2 percent, for 2006 over 2005. Of this increase, $2.9 million, or 2.1 percent, was attributable to the Same-Store Properties and $14.4 million, or 10.1 percent, was due to the Acquired Properties. Interest expense increased $15.9 million, or 13.3 percent, for 2006 as compared to 2005. This increase was primarily as a result of higher average debt balances in 2006, as compared to 2005. Interest and other investment income increased $2.2 million, or 256.8 percent, for 2006 as compared to 2005. This increase was due primarily to the receipt of approximately $0.9 million in dividends on the Company’s investment in marketable securities, as well as higher cash balances invested in 2006 due primarily to property sales proceeds as compared to 2005.

52
Equity in earnings of unconsolidated joint ventures decreased $5.8 million, or 2,340.3 percent, for 2006 as compared to 2005. The decrease was due primarily to a loss of $4.9 million in 2006 in the Mack-Green joint venture and a loss of $1.9 million in 2006 in the Meadowlands Xanadu joint venture, partially offset by an increase of $1.1 million in the Harborside South Pier joint venture. The Company recognized a gain on sale of investment in marketable securities of $15.1 million in 2006. Gain on sale of investment in unconsolidated joint ventures amounted to $10.8 million in 2006 from the sale of the Company’s interest in the G&G Martco joint venture. Gain on sale of investment in unconsolidated joint ventures amounted to $35,000 in 2005 from the sale of the Company’s interest in the Ashford Loop joint venture. Gain (loss) on sale of land and other assets amounted to a loss of $0.4 million in 2006 due to a loss on the sale of Gale Global Facilities and related companies in 2006 of $1.5 million, partially offset by a gain of $1.1 million from the sale of a parcel of land in Hamilton, New Jersey. Income from continuing operations before minority interest in Operating Partnership increased to $104.8 million in 2006 from $92.2 million in 2005. The increase of approximately $12.6 million was due to the factors discussed above. Net income available to common shareholders increased by $49.2 million, or 52.6 percent, from $93.5 million in 2005 to $142.7 million in 2006. This increase was primarily the result of realized gains on disposition of rental property of $47.7 million in 2006 and an increase in income from continuing operations before minority interest in Operating Partnership of $12.6 million. These were partially offset by a decrease in income from discontinued operations of $4.8 million in 2006 as compared to 2005, realized gains on disposition of rental property of $4.4 million in 2005, and an increase in minority interest in Operating Partnership in 2006 of $1.9 million as compared to 2005. LIQUIDITY AND CAPITAL RESOURCES
Liquidity Overview: Historically, rental revenue has been the principal source of funds to pay operating expenses, debt service, capital expenditures and dividends, excluding non-recurring capital expenditures. To the extent that the Company’s cash flow from operating activities is insufficient to finance its non-recurring capital expenditures such as property acquisitions, development and construction costs and other capital expenditures, the Company has and expects to continue to finance such activities through borrowings under its revolving credit facility and other debt and equity financings. The Company believes that with the general downturn in the Company’s markets in recent years, it is reasonably likely that vacancy rates may continue to increase, effective rental rates on new and renewed leases may continue to decrease and tenant installation costs, including concessions, may continue to increase in most or all of its markets in 2008. As a result of the potential negative effects on the Company’s revenue from the overall reduced demand for office space, the Company’s cash flow could be insufficient to cover increased tenant installation costs over the short-term. If this situation were to occur, the Company expects that it would finance any shortfalls through borrowings under its revolving credit facility and other debt and equity financings. The Company expects to meet its short-term liquidity requirements generally through its working capital, net cash provided by operating activities and from its revolving credit facility. The Company frequently examines potential property acquisitions and development projects and, at any given time, one or more of such acquisitions or development projects may be under consideration. Accordingly, the ability to fund property acquisitions and development projects is a major part of the Company’s financing requirements. The Company expects to meet its financing requirements through funds generated from operating activities, proceeds from property sales, long-term and short-term borrowings (including draws on the Company’s revolving credit facility) and the issuance of additional debt and/or equity securities.

53
Construction Projects: The Company owns a 15 percent indirect interest in a joint venture which plans to develop approximately 1.2 million square foot mixed-use project in downtown Boston consisting of office and retail space, condominium apartments, a hotel and garage. The development project, which is subject to government approval, is currently projected to cost approximately $710 million, of which the Company is currently projected to invest a total of approximately $26 million (of which the Company has invested $18.8 million through February 8, 2008). On February 22, 2007, the Company announced that it agreed to develop a 250,000 square-foot class A office building for Wyndham Worldwide Corporation for its corporate headquarters. In July 2007, the Company commenced construction on the building, which Wyndham Worldwide pre-leased for 15 years, on a land site located in the Company’s Mack-Cali Business Campus in Parsippany, New Jersey. The building is expected to be completed in the fourth quarter 2008 at a total estimated cost of approximately $64.8 million. On June 9, 2006, the Company entered into a joint venture with a Gale Affiliate to form 55 Corporate Partners L.L.C. (“55 Corporate”). 55 Corporate was formed for the sole purpose of acquiring from a Gale Affiliate a 50 percent interest in SLG 55 Corporate Drive II LLC (“SLG 55”), an entity presently holding a 100 percent indirect condominium interest in a vacant land parcel located in Bridgewater, New Jersey, which can accommodate development of an approximately 200,000 square foot office building (the “55 Corporate Property”). The remaining 50 percent in SLG 55 is owned by SLG Gale 55 Corporate LLC, an affiliate of SL Green Realty Corp (“SLG Gale 55”). In November 2007, Sanofi-Aventis U.S. Inc. (“Sanofi”), which occupies neighboring buildings, exercised its option to cause the venture to construct a building on the Property and has signed a lease thereof. The lease has a term of fifteen years, subject to three five-year extension options. The construction of the building, estimated to cost approximately $58 million, is not required to commence until July 1, 2009 for a July 2011 delivery; however, if Sanofi gives a Construction Start Date Acceleration Notice in accordance with the provisions of its lease, then construction shall promptly commence after the necessary permits are obtained, even if such construction start date shall occur prior to July 1, 2009. Gale Earn-Out and Agreement: The agreement to acquire the Gale Company (“Gale Agreement”), which was completed as part of the Gale/Green transactions on May 9, 2006, contained earn-out provisions (“Earn-Out”) providing for the payment of contingent purchase consideration of up to $18 million in cash based upon the achievement of Gross Income and NOI (as such terms were defined in the Gale Agreement) targets and other events for the three years following the closing date. On May 23, 2007, the Company entered into an amendment (the “Amendment”) to the Gale Agreement. The Amendment eliminated the Earn-Out and substituted an aggregate of $14 million in payments by the Company consisting of the following: (1) $8 million, which was paid on May 31, 2007; (2) $3 million on May 9, 2008; and (3) $3 million on May 9, 2009. In October 2007, the Company reached an agreement with Stanley C. Gale, the seller of the Gale Company, Mark Yeager, an executive officer of the Company, and certain affiliates of Messrs. Gale and Yeager, which are parties to certain non-portfolio interest joint ventures with the Company, to provide primarily for the following:
(1) The Company agreed to satisfy the requirements for the $3 million payment due on May 9, 2008 and the $3 million payment due on May 9, 2009 as of October 31, 2007 by:
(a) paying $4 million in cash; and (b) transferring to an entity whose beneficial owners includes Messrs. Gale and Yeager a 49.8 percent
interest in an entity that owns one of the non-portfolio interests in a development project located in Belmar, New Jersey, which the Company acquired in June 2006 pursuant to the Gale Agreement for $1.6 million. In 2007, the Company wrote off $2.1 million of costs related to this project, as it believes the project is no longer viable, which is included in general and administrative expense for the year ended December 31, 2007.
(2) Under the Gale Agreement, the Company is obligated to acquire from an entity whose beneficial owners
include Messrs. Gale and Yeager (the “Florham Entity”), a 50 percent interest in a venture which owns a

54
developable land parcel in Florham Park, New Jersey (the “Florham Park Land”) for a maximum purchase price of up to $10.5 million, subject to reduction based on developable square feet approved and other conditions, with the completion of such acquisition subject to the Florham Entity obtaining final development permits and approvals and related conditions necessary to allow for office development expected to be 600,000 square feet. The Company has agreed to waive its contractual rights for reimbursement from the Florham Entity for certain costs incurred by the Company securing approvals for the development of the Florham Park Land and to defer collection of other costs. Such deferred other costs, including a carrying charge of six percent per annum, will be credited against the purchase price of the Florham Park Land at closing. In the event the acquisition of the Florham Park Land does not close by May 9, 2009, subject to certain conditions, the Florham Entity will be obligated to pay the deferred other costs and an additional $1 million to the Company at that time.
(3) The Company has agreed to settle a dispute and treat the right to receive certain commission payments in the
approximate amount of $2.3 million as an excluded asset under the Gale Agreement, which commissions may become payable in connection with Sanofi-Aventis’ exercise of its option to cause the 55 Corporate venture (see Note 4: Investment in Unconsolidated Joint Ventures) to construct a building for Sanofi-Aventis will lease on a long-term basis, as well as the completion of certain related events. The Company has agreed to pay directly to an entity whose beneficial owners include Messrs. Gale and Yeager up to $769,000 of these commissions when due.
REIT Restrictions: To maintain its qualification as a REIT, the Company must make annual distributions to its stockholders of at least 90 percent of its REIT taxable income, determined without regard to the dividends paid deduction and by excluding net capital gains. Moreover, the Company intends to continue to make regular quarterly distributions to its common stockholders which, based upon current policy, in the aggregate would equal approximately $173.9 million on an annualized basis. However, any such distribution, whether for federal income tax purposes or otherwise, would only be paid out of available cash, including borrowings and other sources, after meeting operating requirements, preferred stock dividends and distributions, and scheduled debt service on the Company’s debt. Property Lock-Ups: The Company may not dispose of or distribute certain of its properties, currently comprising 11 properties with an aggregate net book value of approximately $208.1 million, which were originally contributed by the sellers of certain properties to the Company, without the express written consent of a representative of the contributors of such properties, except in a manner which does not result in recognition of any built-in-gain (which may result in an income tax liability) or which reimburses the appropriate members for the tax consequences of the recognition of such built-in-gains. These transfer restrictions are scheduled to expire periodically through 2016. Additionally, the Company may not dispose of or distribute two properties with an aggregate net book value of approximately $12.8 million, which were originally contributed by members of the Cali Group (which includes John R. Cali, director, and John J. Cali, a former director) under similar terms and conditions, for which such restrictions are scheduled to expire in June 2008. The aforementioned restrictions do not apply in the event that the Company sells all of its properties or in connection with a sale transaction which the Company’s Board of Directors determines is reasonably necessary to satisfy a material monetary default on any unsecured debt, judgment or liability of the Company or to cure any material monetary default on any mortgage secured by a property. Upon expiration, the Company generally is required to use commercially reasonable efforts to prevent any sale, transfer or other disposition of the subject properties from resulting in the recognition of built-in gain to the contributors of the properties. 124 of the Company’s properties which were originally contributed by members of either the Mack Group (which includes William L. Mack, Chairman of the Company’s Board of Directors; David S. Mack, director; Earle I. Mack, a former director; and Mitchell E. Hersh, president, chief executive officer and director), the Robert Martin Group (which includes Martin S. Berger, director; Robert F. Weinberg, a former director; and Timothy M. Jones, former president), the Cali Group (which includes John R. Cali, director, and John J. Cali, a former director) or certain other common unitholders, with an aggregate net book value of approximately $1.9 billion, have lapsed restrictions and are subject to these conditions. Unencumbered Properties: As of December 31, 2007, the Company had 238 unencumbered properties, totaling 25.7 million square feet, representing 87.7 percent of the Company’s total portfolio on a square footage basis.

55
Credit Ratings: The Company has three investment grade credit ratings. Standard & Poor’s Rating Services (“S&P”) and Fitch, Inc. (“Fitch”) have each assigned their BBB rating to existing and prospective senior unsecured debt of the Operating Partnership. S&P and Fitch have also assigned their BBB- rating to existing and prospective preferred stock offerings of the Company. Moody’s Investors Service (“Moody’s”) has assigned its Baa2 rating to existing and prospective senior unsecured debt of the Operating Partnership and its Baa3 rating to its existing and prospective preferred stock offerings of the Company.
Cash Flows Cash and cash equivalents decreased by $76.5 million to $24.7 million at December 31, 2007, compared to $101.2 million at December 31, 2006. This decrease is comprised of the following net cash flow items:
(1) $260 million provided by operating activities.
(2) $355.9 million used in investing activities, consisting primarily of the following: (a) $382.7 million used for additions to rental property; minus (b) $29 million used for investments in unconsolidated joint ventures; minus (c) $4.9 million used for the purchase of marketable securities; plus (d) $57.2 million received from proceeds from sale of rental properties; plus (e) $0.6 million received from proceeds from the sale of investment in unconsolidated joint ventures;
plus (f) $1 million received from distributions from investments in unconsolidated joint ventures.
(3) $19.3 million provided by financing activities, consisting primarily of the following: (a) $539 million from borrowings under the revolving credit facility; minus (b) $251.7 million from proceeds received from stock options and warrants exercised; plus (c) $434 million used for repayments of borrowings under the Company’s unsecured credit facility;
plus (d) $211.5 million used for payments of dividends and distributions; plus (e) $29 million used for repayments of mortgages, loans payable and other obligations; plus (f) $98.8 million used for the repurchase of common stock.
Debt Financing Summary of Debt: The following is a breakdown of the Company’s debt between fixed and variable-rate financing as of December 31, 2007: Balance Weighted Average Weighted Average Maturity ($000’s) % of Total Interest Rate (a) in Years Fixed Rate Unsecured Debt $1,660,204 75.07% 6.29% 4.31 Fixed Rate Secured Debt and Other Obligations 301,531 13.63% 5.36% 4.02 Variable Rate Unsecured Debt 250,000 11.30% 5.55% 3.48 Totals/Weighted Average: $2,211,735 100.00% 6.08% 4.18 Debt Maturities: Scheduled principal payments and related weighted average annual interest rates for the Company’s debt as of December 31, 2007 are as follows:

56
Scheduled Principal Weighted Avg. Amortization Maturities Total Interest Rate of Period ($000’s) ($000’s) ($000’s) Future Repayments (a) 2008 $21,191 $ 12,563 $ 33,754 5.21% 2009 11,471 300,000 311,471 7.40% 2010 2,583 334,500 337,083 5.26% 2011 2,745 550,000 552,745 6.84% 2012 2,864 210,148 213,012 6.13% Thereafter 5,702 760,618 766,320 5.41% Sub-total 46,556 2,167,829 2,214,385 6.08% Adjustment for unamortized debt discount/premium, net, as of December 31, 2007 (2,650) 0 (2,650) Totals/Weighted Average $43,906 $2,167,829 $2,211,735 6.08% (a) Actual weighted average LIBOR contract rates relating to the Company’s outstanding debt as of December 31, 2007 of 5.01
percent was used in calculating revolving credit facility. Senior Unsecured Notes: The terms of the Company’s senior unsecured notes (which totaled approximately $1.6 billion as of December 31, 2007) include certain restrictions and covenants which require compliance with financial ratios relating to the maximum amount of debt leverage, the maximum amount of secured indebtedness, the minimum amount of debt service coverage and the maximum amount of unsecured debt as a percent of unsecured assets. Unsecured Revolving Credit Facility: The Company has an unsecured revolving credit facility with a borrowing capacity of $775 million (expandable to $800 million). The interest rate on outstanding borrowings (not electing the Company’s competitive bid feature) under the unsecured facility is currently LIBOR plus 55 basis points. The facility has a competitive bid feature, which allows the Company to solicit bids from lenders under the facility to borrow up to $300 million at interest rates less than the current LIBOR plus 55 basis point spread. As of December 31, 2007, the Company’s outstanding borrowings carried a weighted average interest rate of LIBOR plus 55 basis points. The Company may also elect an interest rate representing the higher of the lender’s prime rate or the Federal Funds rate plus 50 basis points. The unsecured facility, which also requires a 15 basis point facility fee on the current borrowing capacity payable quarterly in arrears, is scheduled to mature in June 2011 and has an extension option of one year, which would require a payment of 15 basis points of the then borrowing capacity of the facility upon exercise. As of February 8, 2008, the Company had $291 million of outstanding borrowings under its unsecured revolving credit facility. The interest rate and the facility fee are subject to adjustment, on a sliding scale, based upon the operating partnership’s unsecured debt ratings. In the event of a change in the Operating Partnership’s unsecured debt rating, the interest and facility fee rates will be adjusted in accordance with the following table: Operating Partnership’s Interest Rate – Unsecured Debt Ratings: Applicable Basis Points Facility Fee S&P Moody’s/Fitch (a) Above LIBOR Basis Points No ratings or less than BBB-/Baa3/BBB- 100.0 25.0 BBB-/Baa3/BBB- 75.0 20.0 BBB/Baa2/BBB (current) 55.0 15.0 BBB+/Baa1/BBB+ 42.5 15.0 A-/A3/A- or higher 37.5 12.5

57
(a) If the Operating Partnership has debt ratings from two rating agencies, one of which is Standard & Poor’s Rating Services (“S&P”) or Moody’s Investors Service (“Moody’s”), the rates per the above table shall be based on the lower of such ratings. If the Operating Partnership has debt ratings from three rating agencies, one of which is S&P or Moody’s, the rates per the above table shall be based on the lower of the two highest ratings. If the Operating Partnership has debt ratings from only one agency, it will be considered to have no rating or less than BBB-/Baa3/BBB- per the above table.
The terms of the unsecured facility include certain restrictions and covenants which limit, among other things, the payment of dividends (as discussed below), the incurrence of additional indebtedness, the incurrence of liens and the disposition of real estate properties (to the extent that: (i) such property dispositions cause the Company to default on any of the financial ratios of the facility described below, or (ii) the property dispositions are completed while the Company is under an event of default under the facility, unless, under certain circumstances, such disposition is being carried out to cure such default), and which require compliance with financial ratios relating to the maximum leverage ratio, the maximum amount of secured indebtedness, the minimum amount of tangible net worth, the minimum amount of fixed charge coverage, the maximum amount of unsecured indebtedness, the minimum amount of unencumbered property interest coverage and certain investment limitations. The dividend restriction referred to above provides that, if an event of default has occurred and is continuing, the Company will not make any excess distributions with respect to common stock or other common equity interests except to enable the Company to continue to qualify as a REIT under the Code. The lending group for the credit facility consists of: JPMorgan Chase Bank, N.A., as administrative agent (the “Agent”); Bank of America, N.A., as syndication agent; Scotiabanc, Inc., Wachovia Bank, National Association, and Wells Fargo Bank, National Association, as documentation agents; SunTrust Bank, as senior managing agent; US Bank National Association, Citicorp North America, Inc. and PNC Bank, National Association, as managing agents; and Bank of China, New York Branch, The Bank of New York; Chevy Chase Bank, F.S.B., The Royal Bank of Scotland PLC, Mizuho Corporate Bank, Ltd., The Bank of Tokyo-Mitsubishi UFJ, Ltd. (Successor by merger to UFJ Bank Limited), North Fork Bank, Bank Hapoalim B.M., Comerica Bank, Chang Hwa Commercial Bank, Ltd., New York Branch, First Commercial Bank, New York Agency, Mega International Commercial Bank Co. Ltd., New York Branch, Deutsche Bank Trust Company Americas and Hua Nan Commercial Bank, New York Agency, as participants. Mortgages, Loans Payable and Other Obligations: The Company has mortgages, loans payable and other obligations which consist of various loans collateralized by certain of the Company’s rental properties. Payments on mortgages, loans payable and other obligations are generally due in monthly installments of principal and interest, or interest only. Debt Strategy: The Company does not intend to reserve funds to retire the Company’s senior unsecured notes or its mortgages, loans payable and other obligations upon maturity. Instead, the Company will seek to refinance such debt at maturity or retire such debt through the issuance of additional equity or debt securities on or before the applicable maturity dates. If it cannot raise sufficient proceeds to retire the maturing debt, the Company may draw on its revolving credit facility to retire the maturing indebtedness, which would reduce the future availability of funds under such facility. As of February 8, 2008, the Company had $291 million in outstanding borrowings under its $775 million unsecured revolving credit facility. The Company is reviewing various refinancing options, including the purchase of its senior unsecured notes in privately-negotiated transactions, the issuance of additional, or exchange of current, unsecured debt, preferred stock, and/or obtaining additional mortgage debt, some or all of which may be completed during 2008. The Company anticipates that its available cash and cash equivalents and cash flows from operating activities, together with cash available from borrowings and other sources, will be adequate to meet the Company’s capital and liquidity needs both in the short and long-term. However, if these sources of funds are insufficient or unavailable, the Company’s ability to make the expected distributions discussed below may be adversely affected.

58
Equity Financing and Registration Statements
Equity Activity: The following table presents the changes in the Company’s issued and outstanding shares of Common Stock and the Operating Partnership’s common units since December 31, 2006: Common Common Stock Units Total Outstanding at December 31, 2006 62,925,191 15,342,283 78,267,474
Common Stock offering 4,650,000 -- 4,650,000 Stock options exercised 132,770 -- 132,770 Common units redeemed for Common Stock 471,656 (471,656) -- Common units issued -- 114,911 114,911 Shares issued under Dividend Reinvestment and Stock Purchase Plan 7,738 -- 7,738 Restricted shares issued 113,118 -- 113,118 Repurchase of Common Stock (2,742,400) -- (2,742,400)
Outstanding at December 31, 2007 65,558,073 14,985,538 80,543,611 Share Repurchase Program: The Company has a share repurchase program to purchase up to $150 million of the Company’s outstanding common stock (“Repurchase Program”), which it may repurchase from time to time in open market transactions at prevailing prices or through privately negotiated transactions. From January 1, 2007 through February 8, 2008, the Company purchased and retired 2,893,630 shares of its outstanding common stock for a cost of approximately $104 million, with a remaining authorization under the Repurchase Program of approximately $46 million. Shelf Registration Statements: The Company has an effective shelf registration statement on Form S-3 filed with the Securities and Exchange Commission (“SEC”) for an aggregate amount of $2.0 billion in common stock, preferred stock, depositary shares, and/or warrants of the Company, under which $260.1 million of securities have been sold through December 31, 2007 and $1.7 billion remains available for future issuances. The Company and the Operating Partnership also have an effective shelf registration statement on Form S-3 filed with the SEC for an aggregate amount of $2.5 billion in common stock, preferred stock, depositary shares and guarantees of the Company and debt securities of the Operating Partnership, under which $600 million of securities have been sold through February 8, 2008 and $1.9 billion remains available for future issuances.
Off-Balance Sheet Arrangements Unconsolidated Joint Venture Debt: The debt of the Company’s unconsolidated joint ventures aggregating $535 million at December 31, 2007, is non-recourse to the Company except for customary exceptions pertaining to such matters as intentional misuse of funds, environmental conditions and material misrepresentations. The Company has also posted a $7.0 million letter of credit in support of the Harborside South Pier joint venture, $3.5 million of which is indemnified by Hyatt. The Company’s off-balance sheet arrangements are further discussed in Note 4: Investments in Unconsolidated Joint Ventures to the Financial Statements.
Contractual Obligations The following table outlines the timing of payment requirements related to the Company’s debt (principal and interest), PILOT agreements, ground lease and other agreements as of December 31, 2007:

59
Payments Due by Period Less than 1 1 – 3 4 – 5 6 – 10 After 10 (dollars in thousands) Total Year Years Years Years Years Senior unsecured notes $2,097,254 $100,494 $629,576 $597,402 $769,782 -- Revolving credit facility 299,168 13,884 27,769 256,942 573 -- Mortgages, loans payable and other obligations 394,021 50,386 206,324 33,950 75,140 $28,221 Payments in lieu of taxes (PILOT) 65,909 4,194 12,780 8,697 23,835 16,403 Operating lease payments 81 62 19 -- -- -- Ground lease payments 37,442 486 1,503 1,002 2,418 32,033 Total $2,893,875 $169,506 $877,971 $897,993 $871,748 $76,657
Inflation The Company’s leases with the majority of its tenants provide for recoveries and escalation charges based upon the tenant’s proportionate share of, and/or increases in, real estate taxes and certain operating costs, which reduce the Company’s exposure to increases in operating costs resulting from inflation. DISCLOSURE REGARDING FORWARD-LOOKING STATEMENTS We consider portions of this information, including the documents incorporated by reference, to be forward-looking statements within the meaning of Section 21E of the Securities Exchange Act of 1934, as amended. We intend such forward-looking statements to be covered by the safe harbor provisions for forward-looking statements contained in Section 21E of such act. Such forward-looking statements relate to, without limitation, our future economic performance, plans and objectives for future operations and projections of revenue and other financial items. Forward-looking statements can be identified by the use of words such as “may,” “will,” “plan,” “should,” “expect,” “anticipate,” “estimate,” “continue” or comparable terminology. Forward-looking statements are inherently subject to risks and uncertainties, many of which we cannot predict with accuracy and some of which we might not even anticipate. Although we believe that the expectations reflected in such forward-looking statements are based upon reasonable assumptions at the time made, we can give no assurance that such expectations will be achieved. Future events and actual results, financial and otherwise, may differ materially from the results discussed in the forward-looking statements. Readers are cautioned not to place undue reliance on these forward-looking statements.
Among the factors about which we have made assumptions are:
• changes in the general economic climate and conditions, including those affecting industries in which our principal tenants compete;
• the extent of any tenant bankruptcies or of any early lease terminations; • our ability to lease or re-lease space at current or anticipated rents; • changes in the supply of and demand for office, office/flex and industrial/warehouse properties; • changes in interest rate levels; • changes in operating costs; • our ability to obtain adequate insurance, including coverage for terrorist acts; • the availability of financing;

60
• changes in governmental regulation, tax rates and similar matters; and • other risks associated with the development and acquisition of properties, including risks that the
development may not be completed on schedule, that the tenants will not take occupancy or pay rent, or that development or operating costs may be greater than anticipated.
ITEM 7A. QUANTITATIVE AND QUALITATIVE DISCLOSURES ABOUT MARKET RISK Market risk is the exposure to loss resulting from changes in interest rates, foreign currency exchange rates, commodity prices and equity prices. In pursuing its business plan, the primary market risk to which the Company is exposed is interest rate risk. Changes in the general level of interest rates prevailing in the financial markets may affect the spread between the Company’s yield on invested assets and cost of funds and, in turn, its ability to make distributions or payments to its investors. Approximately $2.0 billion of the Company’s long-term debt bears interest at fixed rates and therefore the fair value of these instruments is affected by changes in market interest rates. The following table presents principal cash flows (in thousands) based upon maturity dates of the debt obligations and the related weighted-average interest rates by expected maturity dates for the fixed rate debt. The average interest rate on the variable rate debt as of December 31, 2007 was LIBOR plus 55 basis points. December 31, 2007 Debt, including current portion ($’s in thousands)
2008 2009 2010 2011 2012 Thereafter Total Fair Value
Fixed Rate $32,782 $310,568 $336,407 $302,329 $212,806 $766,843 $1,961,735 $1,906,615 Average Interest Rate 5.21% 7.40% 5.26% 7.91% 6.13% 5.41% 6.15% Variable Rate $250,000 $ 250,000 $ 250,000 While the Company has not experienced any significant credit losses, in the event of a significant rising interest rate environment and/or economic downturn, defaults could increase and result in losses to the Company which could adversely affect its operating results and liquidity.

61
ITEM 8. FINANCIAL STATEMENTS AND SUPPLEMENTARY DATA The information required by Item 8 is contained in the Consolidated Financial Statements and Report of PricewaterhouseCoopers LLP, together with the notes to the Consolidated Financial Statements and the report of independent registered public accounting firm, filed with this annual report on Form 10-K, see Item 15: Exhibits and Financial Statements. ITEM 9. CHANGES IN AND DISAGREEMENTS WITH ACCOUNTANTS ON ACCOUNTING
AND FINANCIAL DISCLOSURE None. ITEM 9A. CONTROLS AND PROCEDURES Disclosure Controls and Procedures. The Company’s management, with the participation of the Company’s chief executive officer and chief financial officer, has evaluated the effectiveness of the Company's disclosure controls and procedures (as such term is defined in Rules 13a-15(e) and 15d-15(e) under the Securities Exchange Act of 1934, as amended (the “Exchange Act”)) as of the end of the period covered by this report. Based on such evaluation, the Company's chief executive officer and chief financial officer have concluded that, as of the end of such period, the Company's disclosure controls and procedures were effective in recording, processing, summarizing and reporting, on a timely basis, information required to be disclosed by the Company in the reports that it files or submits under the Exchange Act. Management’s Report on Internal Control Over Financial Reporting. Internal control over financial reporting, as such term is defined in Rules 13a-15(f) and 15d-15(f) under the Exchange Act, is a process designed by, or under the supervision of, the Company’s chief executive officer and chief financial officer, or persons performing similar functions, and effected by the Company’s board of directors, management and other personnel, to provide reasonable assurance regarding the reliability of financial reporting and the preparation of financial statements for external purposes in accordance with generally accepted accounting principles. The Company’s management, with the participation of the Company’s chief executive officer and chief financial officer, has established and maintained policies and procedures designed to maintain the adequacy of the Company’s internal control over financial reporting, and includes those policies and procedures that:
(1) Pertain to the maintenance of records that in reasonable detail accurately and fairly reflect the transactions and dispositions of the assets of the Company;
(2) Provide reasonable assurance that transactions are recorded as necessary to permit preparation of financial
statements in accordance with generally accepted accounting principles, and that receipts and expenditures of the Company are being made only in accordance with authorizations of management and directors of the Company; and
(3) Provide reasonable assurance regarding prevention or timely detection of unauthorized acquisition, use or
disposition of the Company’s assets that could have a material effect on the financial statements. The Company’s management has evaluated the effectiveness of the Company’s internal control over financial reporting as of December 31, 2007 based on the criteria established in a report entitled Internal Control—Integrated Framework, issued by the Committee of Sponsoring Organizations of the Treadway Commission (COSO). Based on our assessment and those criteria, the Company’s management has concluded that the Company’s internal control over financial reporting was effective as of December 31, 2007. Because of its inherent limitations, internal control over financial reporting may not prevent or detect misstatements. Also, projections of any evaluation of effectiveness to future periods are subject to the risk that controls may become

62
inadequate because of changes in conditions, or that the degree or compliance with the policies or procedures may deteriorate. The effectiveness of the Company’s internal control over financial reporting as of December 31, 2007 has been audited by PricewaterhouseCoopers LLP, an independent registered public accounting firm, as stated in their report which appears herein. Changes In Internal Control Over Financial Reporting. There have not been any changes in the Company’s internal control over financial reporting (as such term is defined in Rules 13a-15(f) and 15d-15(f) under the Exchange Act) during the fourth fiscal quarter to which this report relates that have materially affected, or are reasonably likely to materially affect, the Company's internal control over financial reporting. ITEM 9B. OTHER INFORMATION Not Applicable.
PART III ITEM 10. DIRECTORS, EXECUTIVE OFFICERS AND CORPORATE GOVERNANCE The information required by Item 10 will be set forth in the Company’s definitive proxy statement for its annual meeting of shareholders expected to be held on May 21, 2008, and is incorporated herein by reference. ITEM 11. EXECUTIVE COMPENSATION The information required by Item 11 will be set forth in the Company’s definitive proxy statement for its annual meeting of shareholders expected to be held on May 21, 2008, and is incorporated herein by reference. ITEM 12. SECURITY OWNERSHIP OF CERTAIN BENEFICIAL OWNERS AND MANAGEMENT AND
RELATED STOCKHOLDER MATTERS The information required by Item 12 will be set forth in the Company’s definitive proxy statement for its annual meeting of shareholders expected to be held on May 21, 2008, and is incorporated herein by reference. ITEM 13. CERTAIN RELATIONSHIPS AND RELATED TRANSACTIONS, AND DIRECTOR
INDEPENDENCE The information required by Item 13 will be set forth in the Company’s definitive proxy statement for its annual meeting of shareholders expected to be held on May 21, 2008, and is incorporated herein by reference. ITEM 14. PRINCIPAL ACCOUNTING FEES AND SERVICES The information required by Item 14 will be set forth in the Company’s definitive proxy statement for its annual meeting of shareholders expected to be held on May 21, 2008, and is incorporated herein by reference.

63
PART IV ITEM 15. EXHIBITS AND FINANCIAL STATEMENT SCHEDULES (a) 1. All Financial Statements
Report of Independent Registered Public Accounting Firm Consolidated Balance Sheets as of December 31, 2007 and 2006
Consolidated Statements of Operations for the Years Ended December 31, 2007, 2006 and 2005 Consolidated Statements of Changes in Stockholders’ Equity for the Years Ended December 31, 2007, 2006 and 2005
Consolidated Statements of Cash Flows for the Years Ended December 31, 2007, 2006 and 2005 Notes to Consolidated Financial Statements
(a) 2. Financial Statement Schedules
Schedule III - Real Estate Investments and Accumulated Depreciation as of December 31, 2007
All other schedules are omitted because they are not required or the required information is shown in the financial statements or notes thereto.
(a) 3. Exhibits The exhibits required by this item are set forth on the Exhibit Index attached hereto.

64
REPORT OF INDEPENDENT REGISTERED PUBLIC ACCOUNTING FIRM
To Board of Directors and Shareholders of Mack-Cali Realty Corporation: In our opinion, the consolidated financial statements listed in the index appearing under Item 15(a)(1) present fairly, in all material respects, the financial position of Mack-Cali Realty Corporation and its subsidiaries (collectively, the "Company") at December 31, 2007 and 2006, and the results of their operations and their cash flows for each of the three years in the period ended December 31, 2007 in conformity with accounting principles generally accepted in the United States of America. In addition, in our opinion, the financial statement schedule listed in the index appearing under Item 15(a)(2) presents fairly, in all material respects, the information set forth therein when read in conjunction with the related consolidated financial statements. Also in our opinion, the Company maintained, in all material respects, effective internal control over financial reporting as of December 31, 2007, based on criteria established in Internal Control - Integrated Framework issued by the Committee of Sponsoring Organizations of the Treadway Commission (COSO). The Company's management is responsible for these financial statements and financial statement schedule, for maintaining effective internal control over financial reporting and for its assessment of the effectiveness of internal control over financial reporting, included in Management’s Report on Internal Controls Over Financial Reporting appearing under Item 9A. Our responsibility is to express opinions on these financial statements, on the financial statement schedule, and on the Company's internal control over financial reporting based on our integrated audits. We conducted our audits in accordance with the standards of the Public Company Accounting Oversight Board (United States). Those standards require that we plan and perform the audits to obtain reasonable assurance about whether the financial statements are free of material misstatement and whether effective internal control over financial reporting was maintained in all material respects. Our audits of the financial statements included examining, on a test basis, evidence supporting the amounts and disclosures in the financial statements, assessing the accounting principles used and significant estimates made by management, and evaluating the overall financial statement presentation. Our audit of internal control over financial reporting included obtaining an understanding of internal control over financial reporting, assessing the risk that a material weakness exists, and testing and evaluating the design and operating effectiveness of internal control based on the assessed risk. Our audits also included performing such other procedures as we considered necessary in the circumstances. We believe that our audits provide a reasonable basis for our opinions. A company’s internal control over financial reporting is a process designed to provide reasonable assurance regarding the reliability of financial reporting and the preparation of financial statements for external purposes in accordance with generally accepted accounting principles. A company’s internal control over financial reporting includes those policies and procedures that (i) pertain to the maintenance of records that, in reasonable detail, accurately and fairly reflect the transactions and dispositions of the assets of the company; (ii) provide reasonable assurance that transactions are recorded as necessary to permit preparation of financial statements in accordance with generally accepted accounting principles, and that receipts and expenditures of the company are being made only in accordance with authorizations of management and directors of the company; and (iii) provide reasonable assurance regarding prevention or timely detection of unauthorized acquisition, use, or disposition of the company’s assets that could have a material effect on the financial statements. Because of its inherent limitations, internal control over financial reporting may not prevent or detect misstatements. Also, projections of any evaluation of effectiveness to future periods are subject to the risk that controls may become inadequate because of changes in conditions, or that the degree of compliance with the policies or procedures may deteriorate. /s/ PricewaterhouseCoopers LLP New York, New York February 13, 2008

65
MACK-CALI REALTY CORPORATION AND SUBSIDIARIES CONSOLIDATED BALANCE SHEETS (in thousands, except per share amounts)
December 31, ASSETS 2007 2006 Rental property
Land and leasehold interests $ 726,253 $ 659,169 Buildings and improvements 3,753,088 3,549,699 Tenant improvements 397,132 356,495 Furniture, fixtures and equipment 8,956 8,224
4,885,429 4,573,587 Less – accumulated depreciation and amortization (907,013) (796,793)
Net investment in rental property 3,978,416 3,776,794 Cash and cash equivalents 24,716 101,223 Marketable securities available for sale at fair value 4,839 -- Investments in unconsolidated joint ventures 181,066 160,301 Unbilled rents receivable, net 107,761 100,847 Deferred charges and other assets, net 246,386 240,637 Restricted cash 13,613 15,448 Accounts receivable, net of allowance for doubtful accounts
of $1,576 and $1,260 36,405 27,639 Total assets $4,593,202 $4,422,889 LIABILITIES AND STOCKHOLDERS’ EQUITY Senior unsecured notes $1,632,547 $1,631,482 Revolving credit facilities 250,000 145,000 Mortgages, loans payable and other obligations 329,188 383,477 Dividends and distributions payable 52,099 50,591 Accounts payable, accrued expenses and other liabilities 142,778 122,134 Rents received in advance and security deposits 51,992 45,972 Accrued interest payable 34,193 34,106
Total liabilities 2,492,797 2,412,762 Minority interests: Operating Partnership 456,436 480,103 Consolidated joint ventures 1,414 2,117 Total minority interests 457,850 482,220 Commitments and contingencies Stockholders’ equity: Preferred stock, $0.01 par value, 5,000,000 shares authorized, 10,000
and 10,000 shares outstanding, at liquidation preference 25,000 25,000 Common stock, $0.01 par value, 190,000,000 shares authorized,
65,558,073 and 62,925,191 shares outstanding 656 629 Additional paid-in capital 1,886,467 1,708,053 Dividends in excess of net earnings (269,521) (205,775) Accumulated other comprehensive loss (47) --
Total stockholders’ equity 1,642,555 1,527,907 Total liabilities and stockholders’ equity $4,593,202 $4,422,889 The accompanying notes are an integral part of these consolidated financial statements.

66
MACK-CALI REALTY CORPORATION AND SUBSIDIARIES CONSOLIDATED STATEMENTS OF OPERATIONS (in thousands, except per share amounts) Year Ended December 31, REVENUES 2007 2006 2005 Base rents $575,463 $532,879 $497,358 Escalations and recoveries from tenants 104,781 90,214 77,109 Construction services 88,066 56,225 -- Real estate services 17,970 31,045 2,917 Other income 22,070 21,649 14,607
Total revenues 808,350 732,012 591,991 EXPENSES Real estate taxes 90,895 85,999 76,653 Utilities 73,072 59,788 51,720 Operating services 106,946 107,880 79,185 Direct construction costs 85,179 53,602 -- General and administrative 52,162 49,074 32,432 Depreciation and amortization 183,564 159,096 141,771
Total expenses 591,818 515,439 381,761 Operating Income 216,532 216,573 210,230 OTHER (EXPENSE) INCOME Interest expense (126,672) (134,964) (119,070) Interest and other investment income 4,670 3,054 856 Equity in earnings (loss) of unconsolidated joint ventures (5,918) (5,556) 248 Minority interest in consolidated joint ventures 643 218 (74) Gain on sale of investment in marketable securities -- 15,060 -- Gain on sale of investment in unconsolidated joint ventures -- 10,831 35 Gain/(loss) on sale of land and other assets -- (416) --
Total other (expense) income (127,277) (111,773) (118,005) Income from continuing operations before minority interest
in Operating Partnership 89,255 104,800 92,225 Minority interest in Operating Partnership (16,126) (20,121) (18,238) Income from continuing operations 73,129 84,679 73,987 Discontinued operations (net of minority interest):
Income from discontinued operations 1,057 12,272 17,075 Realized gains (losses) and unrealized losses on disposition of rental property, net 36,280 47,715 4,426
Total discontinued operations, net 37,337 59,987 21,501 Net income 110,466 144,666 95,488
Preferred stock dividends (2,000) (2,000) (2,000) Net income available to common shareholders $108,466 $142,666 $ 93,488 Basic earnings per common share: Income from continuing operations $ 1.06 $ 1.33 $ 1.17 Discontinued operations 0.56 0.96 0.35 Net income available to common shareholders $ 1.62 $ 2.29 $ 1.52 Diluted earnings per common share: Income from continuing operations $ 1.06 $ 1.32 $ 1.16 Discontinued operations 0.55 0.96 0.35 Net income available to common shareholders $ 1.61 $ 2.28 $ 1.51 Dividends declared per common share $ 2.56 $ 2.54 $ 2.52 Basic weighted average shares outstanding 67,026 62,237 61,477 Diluted weighted average shares outstanding 82,500 77,901 74,189 The accompanying notes are an integral part of these consolidated financial statements.

67
MACK-CALI REALTY CORPORATION AND SUBSIDIARIES CONSOLIDATED STATEMENT OF CHANGES IN STOCKHOLDERS’ EQUITY (in thousands)
Accumulated Additional Unamortized Dividends in Other Total Preferred Stock Common Stock Paid-In Stock Excess of Comprehensive Stockholders’ Comprehensive Shares Amount Shares Par Value Capital Compensation Net Earnings Income (Loss) Equity Income Balance at January 1, 2005 10 $25,000 61,039 $610 $1,650,834 $(3,968) $(127,365) -- $1,545,111 -- Net income -- -- -- -- -- -- 95,488 -- 95,488 $ 95,488 Preferred stock dividends -- -- -- -- -- -- (2,000) -- (2,000) -- Common stock dividends -- -- -- -- -- -- (155,702) -- (155,702) -- Redemption of common units for common stock -- -- 235 2 6,788 -- -- -- 6,790 -- Shares issued under Dividend Reinvestment and Stock Purchase Plan -- -- 9 -- 390 -- -- -- 390 -- Stock options exercised -- -- 574 6 16,597 -- -- -- 16,603 -- Stock options expense -- -- -- -- 448 -- -- -- 448 -- Comprehensive Loss: Unrealized holding loss on marketable securities available for sale -- -- -- -- -- -- -- (790) (790) (790) Directors Deferred comp. plan -- -- 5 -- 288 -- -- -- 288 -- Issuance of restricted stock -- -- 166 2 7,189 (7,191) -- -- -- -- Amortization of stock comp. -- -- -- -- -- 4,661 -- -- 4,661 -- Adj. to fair value of restricted stock -- -- -- -- (37) 37 -- -- -- -- Cancellation of restricted stock -- -- (8) -- (356) 356 -- -- -- -- Balance at December 31, 2005 10 $25,000 62,020 $620 $1,682,141 $(6,105) $(189,579) $(790) $1,511,287 $ 94,698 Reclassification upon the adoption of FASB No. 123(R) -- -- -- -- (6,105) 6,105 -- -- -- -- Net income -- -- -- -- -- -- 144,666 -- 144,666 144,666 Preferred stock dividends -- -- -- -- -- -- (2,000) -- (2,000) -- Common stock dividends -- -- -- -- -- -- (158,862) -- (158,862) -- Redemption of common units for common stock -- -- 475 5 14,669 -- -- -- 14,674 -- Shares issued under Dividend Reinvestment and Stock Purchase Plan -- -- 5 -- 244 -- -- -- 244 -- Stock options exercised -- -- 353 3 10,442 -- -- -- 10,445 -- Stock options expense -- -- -- -- 465 -- -- -- 465 -- Comprehensive Gain: Unrealized holding gain on marketable securities available for sale -- -- -- -- -- -- -- 15,850 15,850 15,850 Directors Deferred comp. plan -- -- -- -- 302 -- -- -- 302 -- Issuance of restricted stock -- -- 81 1 -- -- -- -- 1 -- Amortization of stock comp. -- -- -- -- 5,895 -- -- -- 5,895 -- Cancellation of restricted stock -- -- (9) -- -- -- -- -- -- -- Reclassification adjustment for realized gain included in net income -- -- -- -- -- -- -- (15,060) (15,060) (15,060) Balance at December 31, 2006 10 $25,000 62,925 $629 $1,708,053 -- $(205,775) -- $1,527,907 $145,456 Net income -- -- -- -- -- -- 110,466 -- 110,466 110,466 Preferred stock dividends -- -- -- -- -- -- (2,000) -- (2,000) -- Common stock dividends -- -- -- -- -- -- (172,212) -- (172,212) -- Common stock offering -- -- 4,650 47 251,685 -- -- -- 251,732 -- Redemption of common units for common stock -- -- 472 5 14,618 -- -- -- 14,623 -- Shares issued under Dividend Reinvestment and Stock -- -- Purchase Plan 7 -- 311 -- -- -- 311 -- Stock options exercised -- -- 133 1 3,801 -- -- -- 3,802 -- Stock options expense -- -- -- -- 132 -- -- -- 132 -- Comprehensive Gain: Unrealized holding gain on marketable securities available for sale -- -- -- -- -- -- -- $(47) (47) (47) Directors Deferred comp. plan -- -- -- -- 323 -- -- -- 323 -- Issuance of restricted stock -- -- 113 1 2,851 -- -- -- 2,852 -- Amortization of stock comp. -- -- -- -- 3,487 -- -- -- 3,487 -- Cancellation of restricted stock -- -- -- -- Repurchase of common stock -- -- (2,742) (27) (98,794) -- -- -- (98,821) -- Balance at December 31, 2007 10 $25,000 65,558 $656 $1,886,467 -- $(269,521) $(47) $1,642,555 2
5 $110,419
The accompanying notes are an integral part of these consolidated financial statements.

68
MACK-CALI REALTY CORPORATION AND SUBSIDIARIES CONSOLIDATED STATEMENTS OF CASH FLOWS (in thousands)
Year Ended December 31, CASH FLOWS FROM OPERATING ACTIVITIES 2007 2006 2005 Net income $ 110,466 $ 144,666 $ 95,488 Adjustments to reconcile net income to net cash provided by
Operating activities: Depreciation and amortization, including related intangible assets 179,705 156,987 138,047 Depreciation and amortization on discontinued operations 424 8,853 14,327 Stock options expense 132 465 448 Amortization of stock compensation 3,487 5,895 4,661 Amortization of deferred financing costs and debt discount 2,808 3,157 3,271 Equity in earnings of unconsolidated joint venture, net 5,918 5,556 (248) Gain on sale of investment in unconsolidated joint ventures -- (10,831) (35) Gain on sale of marketable securities available for sale -- (15,060) -- Loss on sale of land and other assets -- 416 -- (Realized gains) unrealized losses on disposition of rental property
(net of minority interest) (36,280) (47,715) (4,426) Distributions of cumulative earnings from unconsolidated joint ventures 1,875 2,302 -- Minority interest in Operating Partnership 16,126 20,533 18,758 Minority interest in consolidated joint ventures (643) (218) 74 Minority interest in income from discontinued operations 240 2,603 2,777
Changes in operating assets and liabilities: Increase in unbilled rents receivable, net (7,490) (15,989) (13,283) Increase in deferred charges and other assets, net (20,665) (37,975) (36,841) (Increase) decrease in accounts receivable, net (8,766) 3,162 (1,237) Increase in accounts payable, accrued expenses and other liabilities 6,532 4,598 15,674 Increase (decrease) in rents received in advance and security deposits 6,020 (1,713) (253) Increase in accrued interest payable 87 6,235 5,727
Net cash provided by operating activities $ 259,976 $ 235,927 $ 242,929
CASH FLOWS FROM INVESTING ACTIVITIES Additions to rental property, related intangibles and service companies $ (382,742) $ (217,804) $ (451,335) Repayment of mortgage note receivable 159 150 81 Investment in unconsolidated joint ventures (29,017) (163,428) (17,788) Distributions from unconsolidated joint ventures 992 39,982 -- Proceeds from sale of investment in unconsolidated joint venture 575 16,324 2,676 Acquisition of minority interest in consolidated joint venture -- -- (7,713) Proceeds from sales of rental property and service company 57,204 338,546 102,980 Purchase of marketable securities available for sale (4,884) (11,912) (51,637) Proceeds from sale of marketable securities available for sale -- 78,609 -- Decrease (increase) in restricted cash 1,835 (6,227) 1,256
Net cash (used in) provided by investing activities $ (355,878) $ 74,240 $ (421,480) CASH FLOW FROM FINANCING ACTIVITIES Borrowings from revolving credit facility $ 539,000 $ 983,250 $1,041,560 Proceeds from senior unsecured notes -- 199,914 398,480 Proceeds from mortgages -- -- 58,500 Repurchase of common stock (98,821) -- -- Repayment of revolving credit facility (434,000) (1,104,643) (921,560) Repayment of mortgages, loans payable and other obligations (29,038) (160,626) (169,935) Payment of financing costs (1,797) (646) (5,071) Proceeds from stock options exercised 3,802 10,445 16,603 Proceeds from issuance of common stock 251,732 -- -- Payment of dividends and distributions (211,483) (197,035) (191,899)
Net cash provided by (used in) financing activities $ 19,395 $ (269,341) $ 226,678 Net (decrease) increase in cash and cash equivalents $ (76,507) $ 40,826 $ 48,127 Cash and cash equivalents, beginning of period 101,223 60,397 12,270 Cash and cash equivalents, end of period $ 24,716 $ 101,223 $ 60,397 The accompanying notes are an integral part of these consolidated financial statements.

69
MACK-CALI REALTY CORPORATION AND SUBSIDIARIES NOTES TO CONSOLIDATED FINANCIAL STATEMENTS
1. ORGANIZATION AND BASIS OF PRESENTATION ORGANIZATION Mack-Cali Realty Corporation, a Maryland corporation, together with its subsidiaries (collectively, the “Company”), is a fully-integrated, self-administered, self-managed real estate investment trust (“REIT”) providing leasing, management, acquisition, development, construction and tenant-related services for its properties. As of December 31, 2007, the Company owned or had interests in 294 properties plus developable land (collectively, the “Properties”). The Properties aggregate approximately 33.7 million square feet, which are comprised of 283 buildings, primarily office and office/flex buildings totaling approximately 33.3 million square feet (which include 38 buildings, primarily office buildings aggregating approximately 4.5 million square feet owned by unconsolidated joint ventures in which the Company has investment interests), six industrial/warehouse buildings totaling approximately 387,400 square feet, two retail properties totaling approximately 17,300 square feet, one hotel (which is owned by an unconsolidated joint venture in which the Company has an investment interest) and two parcels of land leased to others. The Properties are located in six states, primarily in the Northeast, plus the District of Columbia. BASIS OF PRESENTATION The accompanying consolidated financial statements include all accounts of the Company, its majority-owned and/or controlled subsidiaries, which consist principally of Mack-Cali Realty, L.P. (the “Operating Partnership”) and variable interest entities for which the Company has determined itself to be the primary beneficiary, if any. See Note 2: Significant Accounting Policies – Investments in Unconsolidated Joint Ventures, Net for the Company’s treatment of unconsolidated joint venture interests. Intercompany accounts and transactions have been eliminated. The preparation of financial statements in conformity with generally accepted accounting principles (“GAAP”) requires management to make estimates and assumptions that affect the reported amounts of assets and liabilities and disclosure of contingent assets and liabilities at the date of the financial statements and the reported amounts of revenues and expenses during the reporting period. Actual results could differ from those estimates. Certain reclassifications have been made to prior period amounts in order to conform with current period presentation. 2. SIGNIFICANT ACCOUNTING POLICIES Rental Property Rental properties are stated at cost less accumulated depreciation and amortization. Costs directly
related to the acquisition, development and construction of rental properties are capitalized. Capitalized development and construction costs include pre-construction costs essential to the development of the property, development and construction costs, interest, property taxes, insurance, salaries and other project costs incurred during the period of development. Included in total rental property is construction and development in-progress of $126,470,000 and $116,151,000 (including land of $68,328,000 and $63,136,000) as of December 31, 2007 and 2006, respectively. Ordinary repairs and maintenance are expensed as incurred; major replacements and betterments, which improve or extend the life of the asset, are capitalized and depreciated over their estimated useful lives. Fully-depreciated assets are removed from the accounts.
The Company considers a construction project as substantially completed and held available for occupancy upon the completion of tenant improvements, but no later than one year from cessation of major construction activity (as distinguished from activities such as routine maintenance and cleanup). If portions of a rental project are substantially completed and occupied by tenants, or held available for occupancy, and other portions have not yet reached that stage, the substantially completed portions are accounted for as a separate project. The Company allocates costs incurred between the portions under construction and the portions substantially completed and held

70
available for occupancy, and capitalizes only those costs associated with the portion under construction. Properties are depreciated using the straight-line method over the estimated useful lives of the assets. The estimated useful lives are as follows:
Leasehold interests Remaining lease term Buildings and improvements 5 to 40 years Tenant improvements The shorter of the term of the
related lease or useful life Furniture, fixtures and equipment 5 to 10 years
Upon acquisition of rental property, the Company estimates the fair value of acquired tangible assets, consisting of land, building and improvements, and identified intangible assets and liabilities, generally consisting of the fair value of (i) above and below market leases, (ii) in-place leases and (iii) tenant relationships. The Company allocates the purchase price to the assets acquired and liabilities assumed based on their relative fair values. In estimating the fair value of the tangible and intangible assets acquired, the Company considers information obtained about each property as a result of its due diligence and marketing and leasing activities, and utilizes various valuation methods, such as estimated cash flow projections utilizing appropriate discount and capitalization rates, estimates of replacement costs net of depreciation, and available market information. The fair value of the tangible assets of an acquired property considers the value of the property as if it were vacant.
Above-market and below-market lease values for acquired properties are recorded based on the present value, (using a discount rate which reflects the risks associated with the leases acquired) of the difference between (i) the contractual amounts to be paid pursuant to each in-place lease and (ii) management’s estimate of fair market lease rates for each corresponding in-place lease, measured over a period equal to the remaining term of the lease for above-market leases and the initial term plus the term of any below-market fixed rate renewal options for below-market leases. The capitalized above-market lease values are amortized as a reduction of base rental revenue over the remaining term of the respective leases, and the capitalized below-market lease values are amortized as an increase to base rental revenue over the remaining initial terms plus the terms of any below-market fixed rate renewal options of the respective leases.
Other intangible assets acquired include amounts for in-place lease values and tenant relationship values, which are based on management’s evaluation of the specific characteristics of each tenant’s lease and the Company’s overall relationship with the respective tenant. Factors to be considered by management in its analysis of in-place lease values include an estimate of carrying costs during hypothetical expected lease-up periods considering current market conditions, and costs to execute similar leases. In estimating carrying costs, management includes real estate taxes, insurance and other operating expenses and estimates of lost rentals at market rates during the expected lease-up periods, depending on local market conditions. In estimating costs to execute similar leases, management considers leasing commissions, legal and other related expenses. Characteristics considered by management in valuing tenant relationships include the nature and extent of the Company’s existing business relationships with the tenant, growth prospects for developing new business with the tenant, the tenant’s credit quality and expectations of lease renewals. The value of in-place leases are amortized to expense over the remaining initial terms of the respective leases. The value of tenant relationship intangibles are amortized to expense over the anticipated life of the relationships.
On a periodic basis, management assesses whether there are any indicators that the value of the Company’s real estate properties held for use may be impaired. A property’s value is impaired only if management’s estimate of the aggregate future cash flows (undiscounted and without interest charges) to be generated by the property is less than the carrying value of the property.

71
To the extent impairment has occurred, the loss shall be measured as the excess of the carrying amount of the property over the fair value of the property. The Company’s estimates of aggregate future cash flows expected to be generated by each property are based on a number of assumptions that are subject to economic and market uncertainties including, among others, demand for space, competition for tenants, changes in market rental rates, and costs to operate each property. As these factors are difficult to predict and are subject to future events that may alter management’s assumptions, the future cash flows estimated by management in its impairment analyses may not be achieved. Management does not believe that the value of any of the Company’s rental properties is impaired.
Rental Property Held for Sale and Discontinued Operations When assets are identified by management as held for sale, the Company discontinues
depreciating the assets and estimates the sales price, net of selling costs, of such assets. If, in management’s opinion, the net sales price of the assets which have been identified as held for sale is less than the net book value of the assets, a valuation allowance is established. Properties identified as held for sale and/or sold are presented in discontinued operations for all periods presented. See Note 7: Discontinued Operations.
If circumstances arise that previously were considered unlikely and, as a result, the Company decides not to sell a property previously classified as held for sale, the property is reclassified as held and used. A property that is reclassified is measured and recorded individually at the lower of (a) its carrying amount before the property was classified as held for sale, adjusted for any depreciation (amortization) expense that would have been recognized had the property been continuously classified as held and used, or (b) the fair value at the date of the subsequent decision not to sell.
Investments in Unconsolidated Joint Ventures, Net The Company accounts for its investments in unconsolidated joint ventures for which Financial
Accounting Standards Board (“FASB”) Interpretation No. 46 (revised December 2003), Consolidation of Variable Interest Entities (“FIN 46”) does not apply under the equity method of accounting as the Company exercises significant influence, but does not control these entities. These investments are recorded initially at cost, as Investments in Unconsolidated Joint Ventures, and subsequently adjusted for equity in earnings and cash contributions and distributions.
FIN 46 provides guidance on the identification of entities for which control is achieved through
means other than voting rights (“variable interest entities” or “VIEs”) and the determination of which business enterprise, if any, should consolidate the VIE (the “primary beneficiary”). Generally, FIN 46 applies when either (1) the equity investors (if any) lack one or more of the essential characteristics of a controlling financial interest, (2) the equity investment at risk is insufficient to finance that entity’s activities without additional subordinated financial support or (3) the equity investors have voting rights that are not proportionate to their economic interests and the activities of the entity involve or are conducted on behalf of an investor with a disproportionately small voting interest.
On a periodic basis, management assesses whether there are any indicators that the value of the Company’s investments in unconsolidated joint ventures may be impaired. An investment is impaired only if management’s estimate of the value of the investment is less than the carrying value of the investment, and such decline in value is deemed to be other than temporary. To the extent impairment has occurred, the loss shall be measured as the excess of the carrying amount of the investment over the value of the investment. Management does not believe that the value of any of the Company’s investments in unconsolidated joint ventures is impaired. See Note 4: Investments in Unconsolidated Joint Ventures.

72
Cash and Cash Equivalents All highly liquid investments with a maturity of three months or less when purchased are
considered to be cash equivalents. Marketable Securities The Company classifies its marketable securities among three categories: Held-to-maturity,
trading and available-for-sale. Unrealized holding gains and losses relating to available-for-sale securities are excluded from earnings and reported as other comprehensive income (loss) in stockholders’ equity until realized. A decline in the market value of any marketable security below cost that is deemed to be other than temporary results in a reduction in the carrying amount to fair value. Any impairment would be charged to earnings and a new cost basis for the security established. The Company’s marketable securities at December 31, 2007 carried a value of $4.8 million and consisted of common equity securities. The Company’s marketable securities at December 31, 2007 were classified as available-for-sale and were carried at fair value based on quoted market prices. The Company recorded an unrealized holding loss of $46,000 as other comprehensive loss in 2007. The Company received dividend income of approximately $130,000 from its holdings in marketable securities during the year ended December 31, 2007, which is included in interest and other investment income.
Deferred Financing Costs Costs incurred in obtaining financing are capitalized and amortized on a straight-line basis, which
approximates the effective interest method, over the term of the related indebtedness. Amortization of such costs is included in interest expense and was $2,808,000, $3,157,000, and $3,271,000 for the years ended December 31, 2007, 2006 and 2005, respectively.
Deferred Leasing Costs Costs incurred in connection with leases are capitalized and amortized on a straight-line basis
over the terms of the related leases and included in depreciation and amortization. Unamortized deferred leasing costs are charged to amortization expense upon early termination of the lease. Certain employees of the Company are compensated for providing leasing services to the Properties. The portion of such compensation, which is capitalized and amortized, approximated $4,132,000, $3,749,000 and $3,855,000 for the years ended December 31, 2007, 2006 and 2005, respectively.
Derivative Instruments The Company measures derivative instruments, including certain derivative instruments
embedded in other contracts, at fair value and records them as an asset or liability, depending on the Company’s rights or obligations under the applicable derivative contract. For derivatives designated and qualifying as fair value hedges, the changes in the fair value of both the derivative instrument and the hedged item are recorded in earnings. For derivatives designated as cash flow hedges, the effective portions of the derivative are reported in other comprehensive income (“OCI”) and are subsequently reclassified into earnings when the hedged item affects earnings. Changes in fair value of derivative instruments not designated as hedging and ineffective portions of hedges are recognized in earnings in the affected period.
Revenue Recognition Base rental revenue is recognized on a straight-line basis over the terms of the respective leases.
Unbilled rents receivable represents the amount by which straight-line rental revenue exceeds rents currently billed in accordance with the lease agreements. Above-market and below-market lease values for acquired properties are recorded based on the present value (using a discount rate

73
which reflects the risks associated with the leases acquired) of the difference between (i) the contractual amounts to be paid pursuant to each in-place lease and (ii) management’s estimate of fair market lease rates for each corresponding in-place lease, measured over a period equal to the remaining term of the lease for above-market leases and the initial term plus the term of any below-market fixed-rate renewal options for below-market leases. The capitalized above-market lease values for acquired properties are amortized as a reduction of base rental revenue over the remaining term of the respective leases, and the capitalized below-market lease values are amortized as an increase to base rental revenue over the remaining initial terms plus the terms of any below-market fixed-rate renewal options of the respective leases. Escalations and recoveries from tenants are received from tenants for certain costs as provided in the lease agreements. These costs generally include real estate taxes, utilities, insurance, common area maintenance and other recoverable costs. See Note 15: Tenant Leases. Construction services revenue includes fees earned and reimbursements received by the Company for providing construction management and general contractor services to clients. Construction services revenue is recognized on the percentage of completion method. Using this method, profits are recorded on the basis of estimates of the overall profit and percentage of completion of individual contracts. A portion of the estimated profits is accrued based upon estimates of the percentage of completion of the construction contract. This revenue recognition method involves inherent risks relating to profit and cost estimates. Real estate services revenue includes property management, facilities management, leasing commission fees and other services, and payroll and related costs reimbursed from clients. Other income includes income from parking spaces leased to tenants, income from tenants for additional services arranged for by the Company and income from tenants for early lease terminations.
Allowance for Doubtful Accounts Management periodically performs a detailed review of amounts due from tenants to determine if
accounts receivable balances are impaired based on factors affecting the collectibility of those balances. Management’s estimate of the allowance for doubtful accounts requires management to exercise significant judgment about the timing, frequency and severity of collection losses, which affects the allowance and net income.
Income and Other Taxes The Company has elected to be taxed as a REIT under Sections 856 through 860 of the Internal
Revenue Code of 1986, as amended (the “Code”). As a REIT, the Company generally will not be subject to corporate federal income tax (including alternative minimum tax) on net income that it currently distributes to its shareholders, provided that the Company satisfies certain organizational and operational requirements including the requirement to distribute at least 90 percent of its REIT taxable income to its shareholders. The Company has elected to treat certain of its corporate subsidiaries as taxable REIT subsidiaries (each a “TRS”). In general, a TRS of the Company may perform additional services for tenants of the Company and generally may engage in any real estate or non-real estate related business (except for the operation or management of health care facilities or lodging facilities or the providing to any person, under a franchise, license or otherwise, rights to any brand name under which any lodging facility or health care facility is operated). A TRS is subject to corporate federal income tax. If the Company fails to qualify as a REIT in any taxable year, the Company will be subject to federal income tax (including any applicable alternative minimum tax) on its taxable income at regular corporate tax rates. The Company is subject to certain state and local taxes.
The Company adopted the provisions of FASB Interpretation No. 48 (“FIN 48”), Accounting for
Uncertainty in Income Taxes, an interpretation of FASB Statement No. 109 (“FAS No. 109”) on January 1, 2007. As a result of the implementation of FIN 48, the Company recognized no material adjustments regarding its tax accounting treatment. The Company expects to recognize interest and penalties related to uncertain tax positions, if any, as income tax expense, which is included in general and administrative expense.

74
Earnings Per Share The Company presents both basic and diluted earnings per share (“EPS”). Basic EPS excludes
dilution and is computed by dividing net income available to common shareholders by the weighted average number of shares outstanding for the period. Diluted EPS reflects the potential dilution that could occur if securities or other contracts to issue common stock were exercised or converted into common stock, where such exercise or conversion would result in a lower EPS amount.
Dividends and Distributions Payable The dividends and distributions payable at December 31, 2007 represents dividends payable to
preferred shareholders (10,000 shares) and common shareholders (65,637,709 shares), and distributions payable to minority interest common unitholders of the Operating Partnership (14,985,538 common units) for all such holders of record as of January 4, 2008 with respect to the fourth quarter 2007. The fourth quarter 2007 preferred stock dividends of $50.00 per share, common stock dividends and common unit distributions of $0.64 per common share and unit were approved by the Board of Directors on December 4, 2007. The common stock dividends and common unit distributions payable were paid on January 14, 2008. The preferred stock dividends payable were paid on January 15, 2008.
The dividends and distributions payable at December 31, 2006 represents dividends payable to preferred shareholders (10,000 shares) and common shareholders (62,925,271 shares), and distributions payable to minority interest common unitholders of the Operating Partnership (15,342,283 common units) for all such holders of record as of January 4, 2007 with respect to the fourth quarter 2006. The fourth quarter 2006 preferred stock dividends of $50.00 per share, common stock dividends and common unit distributions of $0.64 per common share and unit were approved by the Board of Directors on December 5, 2006. The common stock dividends and common unit distributions payable were paid on January 12, 2007. The preferred stock dividends payable were paid on January 16, 2007. The Company has determined that the $2.56 dividend per common share paid during the year ended December 31, 2007 represented approximately 80 percent ordinary income and approximately 20 percent capital gain to its stockholders; the $2.53 dividend per common share paid during the year ended December 31, 2006 represented 81 percent ordinary income and approximately 19 percent capital gain to its stockholders; and the $2.52 dividend per common share paid during the year ended December 31, 2005 represented approximately 100 percent ordinary income to its stockholders.
Costs Incurred For Stock Issuances Costs incurred in connection with the Company’s stock issuances are reflected as a reduction of
additional paid-in capital. Stock Compensation The Company accounts for stock options and restricted stock awards granted prior to 2002 using
the intrinsic value method prescribed in Accounting Principles Board Opinion No. 25, “Accounting for Stock Issued to Employees,” and related Interpretations (“APB No. 25”). Under APB No. 25, compensation cost for stock options is measured as the excess, if any, of the quoted market price of the Company’s stock at the date of grant over the exercise price of the option granted. Compensation cost for stock options is recognized ratably over the vesting period. The Company’s policy is to grant options with an exercise price equal to the quoted closing market price of the Company’s stock on the business day preceding the grant date. Accordingly, no compensation cost has been recognized under the Company’s stock option plans for the granting of stock options made prior to 2002. Restricted stock awards granted prior to 2002 are valued at the vesting dates of such awards with compensation cost for such awards recognized ratably over

75
the vesting period.
In 2002, the Company adopted the provisions of FASB No. 123, and in 2006, the Company adopted the provisions of FASB No. 123(R), which did not have a material effect on the Company’s financial position and results of operations. These provisions require that the estimated fair value of restricted stock (“Restricted Stock Awards”) and stock options at the grant date be amortized ratably into expense over the appropriate vesting period. For the years ended December 31, 2007, 2006 and 2005, the Company recorded restricted stock and stock options expense of $6,470,000, $6,360,000 and $5,109,000, respectively. FASB No. 148, Accounting for Stock-Based Compensation – Transition and Disclosure, was issued in December 2002 and amends FASB No. 123, Accounting for Stock Based Compensation. FASB No. 148 provides alternative methods of transition for a voluntary change to the fair value based method of accounting for stock based compensation. In addition, this Statement amends the disclosure requirements of FASB No. 123 to require prominent disclosures in both annual and interim financial statements about the method of accounting for stock-based employee compensation and the effect of the method used on reported results. FASB No. 148 disclosure requirements are presented below:
The following table illustrates the effect on net income and earnings per share if the fair value based method had been applied to all outstanding and unvested stock awards for the year ended December 31, 2005: (dollars in thousands) Net income, as reported $95,488 Add: Stock-based compensation expense included in reported net income (net of minority interest) 4,260 Deduct: Total stock-based compensation expense determined under fair value based method for all awards (5,391) Add: Minority interest on stock-based compensation expense under fair value based method 896 Pro forma net income 95,253 Deduct: Preferred stock dividends (2,000) Pro forma net income available to common shareholders – basic $93,253 Earnings Per Share: Basic – as reported $ 1.52 Basic – pro forma $ 1.52 Diluted – as reported $ 1.51 Diluted – pro forma $ 1.51 Other Comprehensive Income Other comprehensive income (loss) includes items that are recorded in equity, such as unrealized
holding gains or losses on marketable securities available for sale.

76
3. REAL ESTATE TRANSACTIONS Property Acquisitions The Company acquired the following office properties during the year ended December 31, 2007 (dollars in thousands): Acquisition # of Rentable Acquisition Date Property/Address Location Bldgs. Square Feet Cost 05/08/07 AAA Properties (a) (c) Hamilton Township, New Jersey 2 69,232 $ 9,048 06/11/07 125 Broad Street (b) (c) New York, New York 1 524,476 274,091 Total Property Acquisitions: 3 593,708 $283,139 (a) Included in this transaction was the acquisition of two parcels of developable land aggregating approximately 13 acres. (b) Acquisition represented two units of office condominium interests, which collectively comprise floors 2 through 16, or
39.6 percent, of the 40-story, 1.2 million square-foot building. (c) Transaction was funded primarily through borrowing on the Company’s revolving credit facility. Properties Commencing Initial Operations The following office property commenced initial operations during the year ended December 31, 2007 (dollars in thousands): # of Rentable Investment by Date Property/Address Location Bldgs. Square Feet Company (a) 05/08/07 700 Horizon Drive Hamilton Township, New Jersey 1 120,000 $16,751 Total Properties Commencing Initial Operations: 1 120,000 $16,751 (a) Development costs were funded primarily through borrowing on the Company’s revolving credit facility. Amounts are as
of December 31, 2007. Land Acquisition In February 2007, the Company exercised its option to acquire approximately 43 acres of land sites within its Capital Office Park complex in Greenbelt, Maryland, which is able to accommodate the development of up to 600,000 square feet of office space, for $13 million. On May 25, 2007, the Company completed the purchase of the land for approximately $13 million, which consisted of 114,911 common operating partnership units valued at $5.2 million, and the remainder in cash. Property Sales The Company sold the following office properties during the year ended December 31, 2007 (dollars in thousands): Rentable Net Net Sale # of Square Sales Book Realized Date Property/Address Location Bldgs. Feet Proceeds Value Gain 05/10/07 1000 Bridgeport Avenue Shelton, Connecticut 1 133,000 $16,411 $13,782 $ 2,62906/11/07 500 W. Putnam Avenue Greenwich, Connecticut 1 121,250 54,344 18,113 36,23107/13/07 100& 200 Decadon Drive Egg Harbor, New Jersey 2 80,344 11,448 5,894 5,554 Total Office Property Sales: 4 334,594 $82,203 $37,789 $44,414 Gale Earn-Out and Agreement: The agreement to acquire the Gale Company (“Gale Agreement”), which was completed as part of the Gale/Green transactions on May 9, 2006, contained earn-out provisions (“Earn-Out”) providing for the payment of contingent purchase consideration of up to $18 million in cash based upon the achievement of Gross Income and NOI (as such terms were defined in the Gale Agreement) targets and other events for the three years following the closing date. On May 23, 2007, the Company entered into an amendment (the “Amendment”) to the Gale Agreement. The

77
Amendment eliminated the Earn-Out and substituted an aggregate of $14 million in payments by the Company consisting of the following: (1) $8 million, which was paid on May 31, 2007; (2) $3 million on May 9, 2008; and (3) $3 million on May 9, 2009. In October 2007, the Company reached an agreement with Stanley C. Gale, the seller of the Gale Company, Mark Yeager, an executive officer of the Company, and certain affiliates of Messrs. Gale and Yeager, which are parties to certain non-portfolio interest joint ventures with the Company, to provide primarily for the following:
(1) The Company agreed to satisfy the requirements for the $3 million payment due on May 9, 2008 and the $3 million payment due on May 9, 2009 as of October 31, 2007 by:
(a) paying $4 million in cash; and (b) transferring to an entity whose beneficial owners includes Messrs. Gale and Yeager a 49.8 percent
interest in an entity that owns one of the non-portfolio interests in a development project located in Belmar, New Jersey, which the Company acquired in June 2006 pursuant to the Gale Agreement for $1.6 million. In 2007, the Company wrote off $2.1 million of costs related to this project, as it believes the project is no longer viable, which is included in general and administrative expense for the year ended December 31, 2007.
(2) Under the Gale Agreement, the Company is obligated to acquire from an entity whose beneficial owners
include Messrs. Gale and Yeager (the “Florham Entity”), a 50 percent interest in a venture which owns a developable land parcel in Florham Park, New Jersey (the “Florham Park Land”) for a maximum purchase price of up to $10.5 million, subject to reduction based on developable square feet approved and other conditions, with the completion of such acquisition subject to the Florham Entity obtaining final development permits and approvals and related conditions necessary to allow for office development expected to be 600,000 square feet. The Company has agreed to waive its contractual rights for reimbursement from the Florham Entity for certain costs incurred by the Company securing approvals for the development of the Florham Park Land and to defer collection of other costs. Such deferred other costs, including a carrying charge of six percent per annum, will be credited against the purchase price of the Florham Park Land at closing. In the event the acquisition of the Florham Park Land does not close by May 9, 2009, subject to certain conditions, the Florham Entity will be obligated to pay the deferred other costs and an additional $1 million to the Company at that time.\
(3) The Company has agreed to settle a dispute and treat the right to receive certain commission payments in the
approximate amount of $2.3 million as an excluded asset under the Gale Agreement, which commissions may become payable in connection with Sanofi-Aventis’ exercise of its option to cause the 55 Corporate venture (see Note 4: Investment in Unconsolidated Joint Ventures) to construct a building for Sanofi-Aventis will lease on a long-term basis, as well as the completion of certain related events. The Company has agreed to pay directly to an entity whose beneficial owners include Messrs. Gale and Yeager up to $769,000 of these commissions when due.
4. INVESTMENTS IN UNCONSOLIDATED JOINT VENTURES The debt of the Company’s unconsolidated joint ventures aggregating $535 million as of December 31, 2007 is non-recourse to the Company, except for customary exceptions pertaining to such matters as intentional misuse of funds, environmental conditions and material misrepresentations, and except as otherwise indicated below. PLAZA VIII AND IX ASSOCIATES, L.L.C. Plaza VIII and IX Associates, L.L.C. is a joint venture between the Company and Columbia Development Company, L.L.C. (“Columbia”). The venture was formed to acquire land for future development, located on the Hudson River waterfront in Jersey City, New Jersey, adjacent to the Company’s Harborside Financial Center office complex. The Company and Columbia each hold a 50 percent interest in the venture. Among other things, the partnership agreement provides for a preferred return on the Company’s invested capital in the venture, in addition to the Company’s proportionate share of the venture’s profit, as defined in the agreement. The venture owns undeveloped land currently

78
used as a parking facility. RAMLAND REALTY ASSOCIATES L.L.C. (One Ramland Road) On August 20, 1998, the Company entered into a joint venture with S.B. New York Realty Corp. to form Ramland Realty Associates L.L.C. The venture was formed to own, manage and operate One Ramland Road, a 232,000 square foot office/flex building and adjacent developable land, located in Orangeburg, New York. In August 1999, the joint venture completed redevelopment of the property and placed the office/flex building in service. The Company holds a 50 percent interest in the joint venture. The venture has a mortgage loan with a $14.8 million balance at December 31, 2007 collateralized by its office/flex property. The mortgage bears interest at a rate of LIBOR plus 175 basis points and is scheduled to mature in January 2009. The Company performs management, leasing and other services for the property owned by the joint venture and recognized $63,000, $100,000 and $93,000 in fees for such services in the years ended December 31, 2007, 2006 and 2005, respectively. SOUTH PIER AT HARBORSIDE – HOTEL DEVELOPMENT On November 17, 1999, the Company entered into a joint venture with Hyatt Corporation (“Hyatt”) to develop a 350-room hotel on the South Pier at Harborside Financial Center, Jersey City, New Jersey, which was completed and commenced initial operations in July 2002. The Company owns a 50 percent interest in the venture. The venture has a $70.0 million mortgage loan (with a balance as of December 31, 2007 of $69.1 million) collateralized by the hotel property. The loan carries an interest rate of 6.15 percent and matures in November 2016. The venture has a loan with a balance as of December 31, 2007 of $7.0 million with the City of Jersey City, provided by the U.S. Department of Housing and Urban Development. The loan currently bears interest at fixed rates ranging from 6.09 percent to 6.62 percent and matures in August 2020. The Company has posted a $7.0 million letter of credit in support of this loan, $3.5 million of which is indemnified by Hyatt. RED BANK CORPORATE PLAZA L.L.C./RED BANK CORPORATE PLAZA II, L.L.C. On March 23, 2006, the Company entered into a joint venture with The PRC Group (“PRC”) to form Red Bank Corporate Plaza L.L.C. The venture was formed to develop Red Bank Corporate Plaza, a 92,878 square foot office building located in Red Bank, New Jersey, which has been fully pre-leased to Hovnanian Enterprises, Inc. for a 10-year term. The Company holds a 50 percent interest in the venture. PRC contributed the vacant land for the development of the office building as its initial capital in the venture. The Company funded the costs of development up to the value of the land contributed by PRC of $3.5 million as its initial capital. On October 20, 2006, the venture entered into a $22.0 million construction loan with a commercial bank collateralized by the land and development project. The loan (with a balance as of December 31, 2007 of $18.1 million), carries an interest rate of LIBOR plus 130 basis points and matures in April 2009. The interest rate will be reduced to LIBOR plus 125 basis points in April 2008. The loan currently has two one-year extension options subject to certain conditions, each of which requires payment of a fee. In September 2007, the joint venture completed development of the property and placed the office building in service. The Company performs management, leasing and other services for the property owned by the joint venture and recognized $678,000 in fees for such services during the year ended December 31, 2007. On July 20, 2006, the Company entered into a second joint venture agreement with PRC to form Red Bank Corporate Plaza II L.L.C. The venture was formed to hold land on which it plans to develop Red Bank Corporate Plaza II, an 18,561 square foot office building located in Red Bank, New Jersey. The Company holds a 50 percent interest in the venture. The terms of the venture are similar to Red Bank Corporate Plaza L.L.C. PRC contributed the vacant land as its initial capital in the venture. MACK-GREEN-GALE LLC On May 9, 2006, as part of the Gale/Green transactions completed in May 2006, the Company entered into a joint venture, Mack-Green-Gale LLC (“Mack-Green”), with SL Green, pursuant to which Mack-Green holds a 96 percent interest in and acts as general partner of Gale SLG NJ Operating Partnership, L.P. (the “OP LP”). The Company’s

79
acquisition cost for its interest in Mack-Green was approximately $125 million, which was funded primarily through borrowing under the Company’s revolving credit facility. The OP LP owns 100 percent of entities which own 25 office properties (the “OP LP Properties”) which aggregate 3.5 million square feet (consisting of 17 office properties aggregating 2.3 million square feet located in New Jersey and eight properties aggregating 1.2 million square feet located in Troy, Michigan), as well as a minor, non-controlling interest in four office properties aggregating 419,000 square feet located in Naperville, Illinois, which was subsequently sold. In December 2007, the OP LP sold its eight properties located in Troy, Michigan for $83.5 million. The venture recognized a loss of approximately $22.3 million from the sale. Included in the Company’s equity in earnings in 2007 was $223,000 in loss related to the sale. As defined in the Mack-Green operating agreement, the Company shares decision-making equally with SL Green regarding: (i) all major decisions involving the operations of Mack-Green; and (ii) overall general partner responsibilities in operating the OP LP. The Mack-Green operating agreement generally provides for profits and losses to be allocated as follows:
(i) 99 percent of Mack-Green’s share of the profits and losses from 10 specific OP LP Properties allocable to the Company and one percent allocable to SL Green;
(ii) one percent of Mack-Green’s share of the profits and losses from eight specific OP LP Properties and its minor interest in four office properties allocable to the Company and 99 percent allocable to SL Green; and
(iii) 50 percent of all other profits and losses allocable to the Company and 50 percent allocable to SL Green. Substantially all of the OP LP Properties are encumbered by mortgage loans with an aggregate outstanding principal balance of $282 million at December 31, 2007. $188.2 million of the mortgage loans bear interest at a weighted average fixed interest rate of 6.26 percent per annum and mature at various times through May 2016. $93.6 million of the mortgage loans bear interest at a floating rate ranging from LIBOR plus 275 basis points to LIBOR plus 400 basis points per annum and mature at various times through January 2009. Included in the floating rate mortgage loans are $90.3 million provided by an affiliate of SL Green. The Company performs management, leasing, and construction services for the properties owned by the joint venture and recognized $3.9 million and $2.3 million in income (net of $974,000 and $2.2 million in direct costs) for such services in the years ended December 31, 2007, and 2006, respectively. GE/GALE FUNDING LLC (PFV) The Gale agreement signed as part of the Gale/Green transactions in May 2006 provides for the Company to acquire certain ownership interests in real estate projects (the “Non-Portfolio Properties”), subject to obtaining certain third party consents and the satisfaction of various project-related and/or other conditions. Each of the Company’s acquired interests in the Non-Portfolio Properties provide for the initial distributions of net cash flow solely to the Company, and thereafter an affiliate of Mr. Gale (“Gale Affiliate”) has participation rights (“Gale Participation Rights”) in 50 percent of the excess net cash flow remaining after the distribution to the Company of the aggregate amount equal to the sum of: (a) the Company’s capital contributions, plus (b) an internal rate of return (“IRR”) of 10 percent per annum, accruing on the date or dates of the Company’s investments. On May 9, 2006, as part of the Gale/Green transactions, the Company acquired from a Gale Affiliate for $1.8 million a 50 percent controlling interest in GMW Village Associates, LLC (“GMW Village”). GMW Village holds a 20 percent interest in GE/Gale Funding LLC (“GE Gale”). GE Gale owns a 100 percent interest in the entity owning Princeton Forrestal Village, a mixed-use, office/retail complex aggregating 527,015 square feet and located in Plainsboro, New Jersey (“Princeton Forrestal Village” or “PFV”). In addition to the cash consideration paid to acquire the interest, the Company provided a Gale affiliate with the Gale Participation Rights. The operating agreement of GE Gale, which is owned 80 percent by GEBAM, Inc., provides for, among other things, distributions of net cash flow, initially, in proportion to each member’s interest and subject to adjustment upon achievement of certain financial goals, as defined in the operating agreement.

80
GE Gale has a mortgage loan with a balance of $52.8 million at December 31, 2007. The loan bears interest at a rate of LIBOR plus 275 basis points and matures on January 9, 2009, with an extension option through January 9, 2011. The Company performs management, leasing, and construction services for PFV and recognized $1.1 million and $956,000 in income (net of $1.6 million and $7.0 million in direct costs) for such services in the years ended December 31, 2007 and 2006, respectively. ROUTE 93 MASTER LLC (“Route 93 Participant”)/ROUTE 93 BEDFORD MASTER LLC (with the Route 93 Participant, collectively, the “Route 93 Venture”) On June 1, 2006, the Route 93 Venture was formed between the Route 93 Participant, a majority-owned subsidiary of the Company, having a 30 percent interest and the Commingled Pension Trust Fund (Special Situation Property) of JPMorgan Chase Bank having a 70 percent interest, for the purpose of acquiring seven office buildings, aggregating 666,697 square feet, located in the towns of Andover, Bedford and Billerica, Massachusetts. Profits and losses are shared by the partners in proportion to their respective interests until the investment yields an 11 percent IRR, then sharing will shift to 40/60, and when the IRR reaches 15 percent, then sharing will shift to 50/50. The Route 93 Participant is a joint venture between the Company and a Gale affiliate. Profits and losses are shared by the partners under this venture in proportion to their respective interests (83.3/16.7) until the investment yields an 11 percent IRR, then sharing will shift to 50/50. The Route 93 Ventures has a mortgage loan with an amount not to exceed $58.6 million, with a $42.5 million balance at December 31, 2007 collateralized by its office properties. The loan provides the venture the ability to draw additional monies for qualified leasing and capital improvement costs. The loan bears interest at a rate of LIBOR plus 220 basis points and matures on July 11, 2008, with three one-year extension options. GALE KIMBALL, L.L.C. On June 15, 2006, the Company entered into a joint venture with a Gale Affiliate to form M-C Kimball, LLC (“M-C Kimball”). M-C Kimball was formed for the sole purpose of acquiring a Gale Affiliate’s 33.33 percent membership interest in Gale Kimball, L.L.C. (“Gale Kimball”), an entity holding a 25 percent interest in 100 Kimball Drive LLC (“100 Kimball”), which developed and placed in service a 175,000 square foot office property that has been substantially pre-leased to a single tenant, located at 100 Kimball Drive, Parsippany, New Jersey (the “Kimball Property”). The operating agreement of M-C Kimball provides, among other things, for the Gale Participation Rights (of which Mark Yeager, an Executive Vice President of the Company, has a direct 26 percent interest). Gale Kimball is owned 33.33 percent by M-C Kimball and 66.67 percent by the Hampshire Generational Fund, L.L.C. (“Hampshire”). The operating agreement of Gale Kimball provides, among other things, for the distribution of net cash flow, initially, in accordance with its members’ respective membership interests and, upon achievement of certain financial conditions, 50 percent to each of the Company and Hampshire. 100 Kimball is owned 25 percent by Gale Kimball and 75 percent by 100 Kimball Drive Realty Member LLC, an affiliate of JPMorgan (“JPM”). The operating agreement of 100 Kimball provides, among other things, for the distributions to be made in the following order:
(i) first, to JPM, such that JPM is provided with an annual 12 percent compound preferred return on Preferred Equity Capital Contributions (as such term is defined in the operating agreement of 100 Kimball and largely comprised of development and construction costs);
(ii) second, to JPM, as return of Preferred Equity Capital Contributions until complete repayment of such Preferred Equity Capital Contributions;
(iii) third, to each of JPM and Gale Kimball in proportion to their respective membership interests until each member is provided, as a result of such distributions, with an annual twelve percent compound return on the Member’s Capital Contributions (as defined in the operating agreement of 100 Kimball, and excluding Preferred Equity Capital Contributions, if any); and
(iv) fourth, 50 percent to each of JPM and Gale Kimball.

81
On September 21, 2007, the venture obtained a mortgage loan which allows a maximum principal amount of $47 million (with a balance of $40.4 million at December 31, 2007). The loan provides the ability to draw funds for qualified leasing and capital improvement costs. The loan bears interest at a rate of 5.95 percent and matures in September 2012. The Company performs management, leasing, construction and development services for the property owned by 100 Kimball for which it recognized $1.7 million and $271,000 in income (net of $9.4 million and $6.6 million in direct costs) in the years ended December 31, 2007, and 2006, respectively. 55 CORPORATE PARTNERS, LLC On June 9, 2006, the Company entered into a joint venture with a Gale Affiliate to form 55 Corporate Partners L.L.C. (“55 Corporate”). 55 Corporate was formed for the sole purpose of acquiring from a Gale Affiliate a 50 percent interest in SLG 55 Corporate Drive II LLC (“SLG 55”), an entity presently holding a 100 percent indirect condominium interest in a vacant land parcel located in Bridgewater, New Jersey, which can accommodate development of an approximately 200,000 square foot office building (the “55 Corporate Property”). The remaining 50 percent in SLG 55 is owned by SLG Gale 55 Corporate LLC, an affiliate of SL Green Realty Corp. (“SLG Gale 55”). In November 2007, Sanofi-Aventis U.S. Inc. (“Sanofi”), which occupies neighboring buildings, exercised its option to cause the venture to construct a building on the Property and has signed a lease thereof. The lease has a term of fifteen years, subject to three five-year extension options. The construction of the building, estimated to cost approximately $58 million, is not required to commence until July 1, 2009 for a July 2011 delivery; however, if Sanofi gives a Construction Start Date Acceleration Notice in accordance with the provisions of its lease, then construction shall promptly commence after the necessary permits are obtained, even if such construction start date shall occur prior to July 1, 2009. The operating agreement of 55 Corporate provides, among other things, for the Gale Participation Rights (of which Mr. Yeager has a direct 26 percent interest). If Mr. Gale receives any commission payments with respect to a Sanofi lease on the development property, Mr. Gale has agreed to pay to Mr. Yeager 26 percent of such payments. The operating agreement of SLG 55 provides, among other things, for the distribution of the available net cash flow to each of 55 Corporate and SLG Gale 55 in proportion to their respective membership interests in SLG 55 (50 percent each). 12 VREELAND ASSOCIATES, L.L.C. On September 8, 2006, the Company entered into a joint venture with a Gale Affiliate to form M-C Vreeland, LLC (“M-C Vreeland”). M-C Vreeland was formed for the sole purpose of acquiring a Gale Affiliate’s 50 percent membership interest in 12 Vreeland Associates, L.L.C., an entity owning an office property located at 12 Vreeland Road, Florham Park, New Jersey. The operating agreement of M-C Vreeland provides, among other things, for the Gale Participation Rights (of which Mr. Yeager has a direct 15 percent interest). The office property at 12 Vreeland is a 139,750 square foot office building that is fully leased to a single tenant through June 15, 2012. The property is subject to a mortgage loan, which matures on July 1, 2012, and bears interest at 6.9 percent per annum. As of December 31, 2007 the outstanding balance on the mortgage note was $8.8 million. Under the operating agreement of 12 Vreeland Associates, L.L.C., M-C Vreeland has a 50 percent interest, with S/K Florham Park Associates, L.L.C. (the managing member) and its affiliate holding the other 50 percent. BOSTON-FILENES On October 20, 2006, the Company formed a joint venture (the “MC/Gale JV LLC”) with Gale International/426 Washington St. LLC (“Gale/426”), which, in turn, entered into a joint venture (the “Vornado JV LLC”) with VNO 426 Washington Street JV LLC (“Vornado”), an affiliate of Vornado Realty LP, which was formed to acquire and redevelop the Filenes property located in the Downtown Crossing district of Boston, Massachusetts (the “Filenes Property”). On January 25, 2007, (i) each of M-C/Gale JV LLC, Gale and Washington Street Realty Member LLC (“JPM”) formed a joint venture (“JPM JV LLC”), (ii) M-C/Gale JV LLC assigned its entire 50 percent ownership interest in the Vornado

82
JV LLC to JPM JV LLC, (iii) the Limited Liability Company Agreement of Vornado JV LLC was amended to reflect, among other things, the change in the ownership structure described in subsection (ii) above, and (iv) the Limited Liability Company Agreement of MC/Gale JV LLC was amended and restated to reflect, among other things, the change in the ownership structure described in subsection (ii) above. The Vornado JV LLC acquired the Filenes Property on January 29, 2007, for approximately $100 million. As a result of the foregoing transactions, as of January 29, 2007, (i) the Filenes Property is owned by Vornado JV LLC, (ii) Vornado JV LLC is owned 50 percent by each of Vornado and JPM JV LLC, (iii) JPM JV LLC is owned 30 percent by M-C/Gale JV LLC, 70 percent by JPM and managed by Gale/426, which has no ownership interest in JPM JV LLC, and (iv) M-C/Gale JV LLC is owned 99.99 percent by the Company and 0.01 percent by Gale/426. Thus, the Company holds approximately a 15 percent indirect ownership interest in the Vornado JV LLC and the Filenes Property. Distributions are made (i) by Vornado JV LLC in proportion to its members’ respective ownership interests, (ii) by JPM JV LLC (a) initially, in proportion to its members’ respective ownership interests until JPM’s investment yields an 11 percent IRR, (b) thereafter, 60/40 to JPM and MC/Gale JV LLC, respectively, until JPM’s investment yields a 15 percent IRR and (c) thereafter, 50/50 to JPM and MC/Gale JV LLC, respectively, and (iii) by MC/Gale JV LLC (w) initially, in proportion to its members’ respective ownership interests until each member has received a 10 percent IRR on its investment, (x) thereafter, 65/35 to the Company and Gale/426, respectively, until the Company’s investment yields a 15 percent IRR, (y) if by the time the Company receives a 15 percent IRR on its investment, Gale/426 has not done so, 100 percent to Gale/426 until Gale/426’s investment yields a 15 percent IRR, and (z) thereafter, 50/50 to each of the Company and Gale/426. The joint venture’s current plans for the development of the Filenes Property include approximately 1.2 million square feet consisting of office, retail, condominium apartments, hotel and a garage. The project is subject to governmental approvals. NKFGMS OWNERS, LLC On December 28, 2006, the Company contributed its facilities management business, which was acquired on May 9, 2006 as part of the Gale/Green transactions, to a newly-formed joint venture called NKFGMS Owners, LLC. With the contribution, the Company received $600,000 in cash and a 40 percent interest in the joint venture. In connection with the Contribution, the Company recognized a loss of approximately $1.5 million. The joint venture operating agreement provided for, among other things, profits and losses generally to be allocated in proportion to each member’s interest. On September 21, 2007, the Company sold its 40 percent interest in NKFGMS to its joint venture partner for net proceeds of $575,000, and recorded a gain of $19,000 on the sale. GALE JEFFERSON, L.L.C. On August 22, 2007, the Company entered into a joint venture with a Gale Affiliate to form M-C Jefferson, L.L.C. (“M-C Jefferson”). M-C Jefferson was formed for the sole purpose of acquiring a Gale Affiliate’s 33.33 percent membership interest in Gale Jefferson, L.L.C. (“Gale Jefferson”), an entity holding a 25 percent interest in One Jefferson Road LLC (“One Jefferson”), which is developing a 100,000 square foot office property located at 1 Jefferson Road, Parsippany, New Jersey (the “Jefferson Property”). The operating agreement of M-C Jefferson provides, among other things, for the Gale Participation Rights (of which Mark Yeager, an Executive Vice President of the Company, has a direct 26 percent interest). Gale Jefferson is owned 33.33 percent by M-C Jefferson and 66.67 percent by the Hampshire Generational Fund, L.L.C. (“Hampshire”). The operating agreements of Gale Jefferson provides, among other things, for the distribution of net cash flow, first, in accordance with its member’s respective interests until each member is provided, as a result of such distributions, with an annual 12 percent compound return on the Member’s Capital Contributions, as defined in the operating agreement and secondly, 50 percent to each of the Company and Hampshire. One Jefferson is owned 25 percent by Gale Jefferson and 75 percent by One Jefferson Road Realty Member LLC, an affiliate of JPMorgan (“JPM”). The operating agreement of One Jefferson provides, among other things, for the distribution of net cash flow, first, in accordance with its members’ respective interests until each member is provided, as a result of such distributions, with an annual 12 percent compound return on the Member’s Capital Contributions, as

83
defined in the operating agreement and secondly, 50 percent to JPM and Gale Jefferson. One Jefferson has a construction loan in an amount not to exceed $21 million (with no balance drawn as of December 31, 2007), bearing interest at a rate of LIBOR plus 160 basis points and maturing on October 24, 2010 with a one-year extension option. The Company performs management, leasing and construction services for Gale Jefferson and recognized $102,000 in income (net of $4.0 million in direct costs) for such services in the year ended December 31, 2007. MEADOWLANDS XANADU On November 25, 2003, the Company and affiliates of The Mills Corporation (“Mills”) entered into a joint venture agreement (“Meadowlands Xanadu Venture Agreement”) to form Meadowlands Mills/Mack-Cali Limited Partnership (“Meadowlands Venture”) for the purpose of developing a $1.3 billion family entertainment, recreation and retail complex with an office and hotel component to be built at the Meadowlands sports complex in East Rutherford, New Jersey (“Meadowlands Xanadu”). Meadowlands Xanadu’s approximately 4.76 million-square-foot complex is expected to feature a family entertainment, recreation and retail destination comprising five themed zones: sports; entertainment; children’s education; fashion; and food and home, in addition to four office buildings, aggregating approximately 1.8 million square feet, and a 520-room hotel. The Company and Mills owned a 20 percent and 80 percent interest, respectively, in the Meadowlands Venture. The Meadowlands Xanadu Venture Agreement required the Company to make an equity contribution up to a maximum of $32.5 million, which it fulfilled in April 2005. On August 21, 2006, Mills announced that it had signed a non-binding letter of intent with Colony Capital Acquisitions, LLC (“Colony”) and Kan Am USA Management XXII Limited Partnership (“Kan Am”) under which Colony would arrange for construction financing for Meadowlands Xanadu and make a significant equity infusion into the Meadowlands Venture, and Mills would not have any financial obligations post closing (“Colony Transaction”). Kan Am had been a partner with Mills in the Meadowlands Venture since the formation of the venture. On November 22, 2006, the Company entered into and consummated a Redemption Agreement (the “Redemption Agreement”) with the Meadowlands Venture, Meadowlands Developer Holding Corp., a limited partner in the Meadowlands Venture, and the Meadowlands Limited Partnership (f/k/a Meadowlands/Mills Limited Partnership, and hereafter “MLP”), a general partner and a limited partner in the Meadowlands Venture. Immediately prior to entering into the Redemption Agreement, the investors in MLP undertook a restructuring of MLP whereby Colony became an indirect owner of MLP. In connection with the Colony Transaction and pursuant to the Redemption Agreement, the Meadowlands Venture redeemed (the “Redemption”) the Company’s entire interest in the Meadowlands Venture and its right to participate in the development of the ERC component in exchange for (i) $22.5 million in cash and (ii) a non-economic partner interest in each of the office and hotel components of Meadowlands Xanadu. In connection with the Redemption, the Operating Partnership also received a non-interest bearing promissory note for an additional $2.5 million, which note is payable in full by MLP only at such time as the Operating Partnership exercises one of its options to develop the first of the office and hotel components of Meadowlands Xanadu. The Company’s remaining investment of approximately $11.9 million is included in deferred charges and other assets, net, as of December 31, 2007 and 2006. Concurrent with the execution of the Redemption Agreement, the Company also entered into the Mack-Cali Rights, Obligations and Option Agreement (the “Rights Agreement”) by and among the Meadowlands Venture, MLP, Meadowlands Mack-Cali GP, L.L.C., Mack-Cali, Baseball Meadowlands Limited Partnership, A-B Office Meadowlands Mack-Cali Limited Partnership, C-D Office Meadowlands Limited Partnership, Hotel Meadowlands Mack-Cali Limited Partnership and ERC Meadowlands Mills/Mack-Cali Limited Partnership. Pursuant to the Rights Agreement, the Operating Partnership retained certain rights and obligations it held under the Meadowlands Xanadu Venture Agreement with respect to the development of the office and hotel components of Meadowlands Xanadu, including an option to develop any of the office or hotel components of Meadowlands Xanadu (each, a “Take Down Option”). Upon the exercise of an initial Take Down Option, the Operating Partnership will receive economic interests in each of the office or hotel component partnerships as both a general partner and a limited partner in the applicable office or hotel component, and following receipt of $2.5 million in full payment of the note from MLP, the Operating Partnership’s ownership interest in each of the office or hotel component partnerships will be reduced from 80 percent (as provided in

84
the Meadowlands Xanadu Venture Agreement) to 75 percent. G&G MARTCO (Convention Plaza) The Company held a 50 percent interest in G&G Martco, which owns Convention Plaza, a 305,618 square foot office building, located in San Francisco, California. On November 6, 2006, the Company sold substantially all of its interest in the venture to an affiliate of its joint venture partner for approximately $16.3 million, realizing a gain on the sale of approximately $10.8 million. The Company performed management and leasing services for the property owned by the joint venture through the date of sale and recognized $132,000 and $161,000 in fees for such services in the years ended December 31, 2006 and 2005, respectively.

85
SUMMARIES OF UNCONSOLIDATED JOINT VENTURES The following is a summary of the financial position of the unconsolidated joint ventures in which the Company had investment interests as of December 31, 2007 and 2006: (dollars in thousands) December 31, 2007 Plaza Red Bank Mack- Princeton NKFGMS VIII & IX Ramland Harborside Corporate Gale- Forrestal Route 93 Gale 55 12 Boston- Owners Gale Combined Associates Realty South Pier Plaza I & II Green Village Portfolio Kimball Corporate Vreeland Filenes LLC Jefferson Total Assets: Rental property, net $ 10,787 $ 11,522 $ 64,882 $ 23,594 $ 368,028 $ 42,713 $ 56,226 $ 7,785 $ 17,000 $ 7,954 -- -- $ 1,838 $ 612,329 Other assets 2,250 762 15,039 2,843 52,741 25,471 2,307 1,809 -- 851 $ 65,134 -- 80 169,287 Total assets $ 13,037 $ 12,284 $ 79,921 $ 26,437 $ 420,769 $ 68,184 $ 58,533 $ 9,594 $ 17,000 $ 8,805 $ 65,134 -- $ 1,918 $ 781,616 Liabilities and partners’/members’ capital (deficit): Mortgages, loans payable and other obligations -- $ 14,771 $ 76,072 $ 18,116 $ 281,746 $ 52,800 $ 42,495 $ 10,103 -- $ 8,761 -- -- -- $ 504,864 Other liabilities $ 532 365 2,711 133 23,809 6,923 857 30 -- -- $ 4,171 -- $ 80 39,611 Partners’/members’ capital (deficit) 12,505 (2,852) 1,138 8,188 115,214 8,461 15,181 (539) $ 17,000 44 60,963 -- 1,838 237,141 Total liabilities and partners’/members’ capital (deficit) $ 13,037 $ 12,284 $ 79,921 $ 26,437 $ 420,769 $ 68,184 $ 58,533 $ 9,594 $ 17,000 $ 8,805 $ 65,134 -- $ 1,918 $ 781,616 Company’s investment in unconsolidated joint ventures, net $ 6,175 -- $ 513 $ 3,703 $ 128,107 $ 2,029 $ 4,729 -- $ 8,518 $ 7,752 $ 18,828 -- $ 712 $ 181,066 December 31, 2006 Plaza Red Bank Mack- Princeton NKFGMS VIII & IX Ramland Harborside Corporate Gale- Forrestal Route 93 Gale 55 12 Boston- Owners Gale Combined Associates Realty South Pier Plaza I & II Green Village Portfolio Kimball Corporate Vreeland Filenes LLC Jefferson Total Assets: Rental property, net $ 11,404 $ 12,141 $ 69,303 $ 13,205 $ 479,245 $ 39,538 $ 54,866 $ 6,650 $ 17,000 $ 8,221 -- $ 239 -- $ 711,812 Other assets 1,408 851 11,170 3,320 76,704 24,830 6,857 164 -- 909 $ 10,500 2,638 -- 139,351 Total assets $ 12,812 $ 12,992 $ 80,473 $ 16,525 $ 555,949 $ 64,368 $ 61,723 $ 6,814 $ 17,000 $ 9,130 $ 10,500 $ 2,877 -- $ 851,163 Liabilities and partners’/members’ capital (deficit): Mortgages, loans payable and other obligations -- $ 14,936 $ 77,217 $ 8,673 $ 358,063 $ 47,761 $ 39,435 $ 3,838 -- $ 10,253 -- -- -- $ 560,176 Other liabilities $ 532 259 4,944 13 40,106 5,972 846 -- -- -- -- $ 1,329 -- 54,001 Partners’/members’ capital (deficit) 12,280 (2,203) (1,688) 7,839 157,780 10,635 21,442 2,976 $ 17,000 (1,123) $ 10,500 1,548 -- 236,986 Total liabilities and partners’/members’ capital (deficit) $ 12,812 $ 12,992 $ 80,473 $ 16,525 $ 555,949 $ 64,368 $ 61,723 $ 6,814 $ 17,000 $ 9,130 $ 10,500 $ 2,877 -- $ 851,163 Company’s investment in unconsolidated joint ventures, net $ 6,060 -- -- $ 3,647 $ 119,061 $ 2,560 $ 6,669 $ 1,024 $ 8,500 $ 7,130 $ 5,250 $ 400 -- $ 160,301

86
SUMMARIES OF UNCONSOLIDATED JOINT VENTURES The following is a summary of the results of operations of the unconsolidated joint ventures for the period in which the Company had investment interests during the years ended December 31, 2007, 2006 and 2005: (dollars in thousands) Year Ended December 31, 2007 Plaza Red Bank Mack- Princeton NKFGMS VIII & IX Ramland Ashford Harborside Corporate Green- Forrestal Route 93 Gale 55 12 Boston- Owners Gale Meadowlands G&G Combined Associates Realty Loop South Pier Plaza I & II Gale Village Portfolio Kimball Corporate Vreeland Filenes LLC Jefferson Xanadu Martco Total Total revenues $ 1,015 $ 1,903 -- $ 43,952 $ 1,098 $ 67,113 $ 12,637 $ 2,541 $ 12 -- $ 2,280 $ 664 -- -- -- -- $ 133,215 Operating and other expenses (174) (1,528) -- (26,661) (237) (53,123) (6,471) (3,674) (83) -- (65) (698) -- -- -- -- (92,714) Depreciation and amortization (616) (727) -- (5,929) (208) (24,751) (3,589) (2,794) (146) -- (352) -- -- -- -- -- (39,112) Interest expense -- (1,047) -- (4,785) (367) (26,706) (4,751) (3,429) (324) -- (663) -- -- -- -- -- (42,072) Net income $ 225 $ (1,399) -- $ 6,577 $ 286 $ (37,467) $ (2,174) $ (7,356) $ (541) -- $ 1,200 $ (34) -- -- -- -- $ (40,683) Company’s equity in earnings (loss) of unconsolidated joint ventures $ 113 $ (375) -- $ 3,182 $ 143 $ (6,677) $ (531) $ (2,236) $ (180) -- $ 600 $ (10) $53 -- -- -- $ (5,918) Year Ended December 31, 2006 Plaza Red Bank Mack- Princeton NKFGMS VIII & IX Ramland Ashford Harborside Corporate Green- Forrestal Route 93 Gale 55 12 Boston- Owners Gale Meadowlands G&G Combined Associates Realty Loop South Pier Plaza I & II Gale Village Portfolio Kimball Corporate Vreeland Filenes LLC Jefferson Xanadu Martco Total Total revenues $ 755 $ 2,058 -- $ 39,229 $ 15 $ 44,262 $ 9,495 $ 3,486 $ 1 -- $ 2,102 -- -- -- -- $ 5,990 $ 107,393 Operating and other expenses (186) (1,496) -- (23,591) (6) (19,136) (5,925) (1,585) -- -- (76) -- -- -- -- (2,702) (54,703) Depreciation and amortization (616) (736) -- (5,853) -- (21,129) (2,908) (622) -- -- (352) -- -- -- -- (1,216) (33,432) Interest expense -- (1,022) -- (4,078) -- (17,117) (3,063) (1,969) -- -- (755) -- -- -- -- (2,499) (30,503) Net income $ (47) $ (1,196) -- $ 5,707 $ 9 $ (13,120) $ (2,401) $ (690) $ 1 -- $ 919 -- -- -- -- $ (427) $ (11,245) Company’s equity in earnings (loss) of unconsolidated joint ventures $ (24) $ (225) -- $ 2,820 -- $ (4,945) $ (436) $ (148) -- -- $ 208 -- -- -- $ (1,876) $ (930) $ (5,556) Year Ended December 31, 2005 Plaza Red Bank Mack- Princeton NKFGMS VIII & IX Ramland Ashford Harborside Corporate Green- Forrestal Route 93 Gale 55 12 Boston- Owners Gale Meadowlands G&G Combined Associates Realty Loop South Pier Plaza I & II Gale Village Portfolio Kimball Corporate Vreeland Filenes LLC Jefferson Xanadu Martco Total Total revenues $ 396 $ 2,028 -- $ 35,198 -- -- -- -- -- -- -- -- -- -- -- $ 6,767 $ 44,389 Operating and other expenses (169) (1,407) -- (22,251) -- -- -- -- -- -- -- -- -- -- -- (3,662) (27,489) Depreciation and amortization (616) (638) -- (5,778) -- -- -- -- -- -- -- -- -- -- -- (1,205) (8,237) Interest expense -- (759) -- (4,176) -- -- -- -- -- -- -- -- -- -- -- (2,270) (7,205) Net income $ (389) $ (776) -- $ 2,993 -- -- -- -- -- -- -- -- -- -- -- $ (370) $ 1,458 Company’s equity in earnings (loss) of unconsolidated joint ventures $ (196) -- $ (30) $ 1,693 -- -- -- -- -- -- -- -- -- -- -- $ (1,219) $ 248

87
5. DEFERRED CHARGES AND OTHER ASSETS December 31, (dollars in thousands) 2007 2006 Deferred leasing costs $202,282 $184,175 Deferred financing costs 22,922 21,252 225,204 205,427 Accumulated amortization (90,482) (76,407) Deferred charges, net 134,722 129,020 Notes receivable 11,610 11,769 In-place lease values and related intangible assets, net 64,212 58,495 Prepaid expenses and other assets, net 35,842 41,353 Total deferred charges and other assets, net $246,386 $240,637 6. RESTRICTED CASH Restricted cash includes security deposits for certain of the Company’s properties, and escrow and reserve funds for debt service, real estate taxes, property insurance, capital improvements, tenant improvements, and leasing costs established pursuant to certain mortgage financing arrangements, and is comprised of the following: (dollars in thousands) December 31, 2007 2006 Security deposits $ 8,710 $ 8,496 Escrow and other reserve funds 4,903 6,952 Total restricted cash $13,613 $15,448
7. DISCONTINUED OPERATIONS On May 10, 2007, the Company sold its 133,000 square-foot office building located at 1000 Bridgeport Avenue in Shelton, Connecticut for net sales proceeds of approximately $16.4 million and recognized a gain of approximately $2.6 million on the sale. On June 11, 2007, the Company sold its 121,250 square-foot office building located at 500 West Putnam Avenue in Greenwich, Connecticut for net sales proceeds of approximately $54.3 million and recognized a gain of approximately $36.2 million on the sale. On July 13, 2007, the Company sold two office buildings in Egg Harbor Township, New Jersey, totaling 80,344 square feet, for approximately $12.5 million and recognized a gain of approximately $5.6 million. The Company has presented these assets as discontinued operations in its statements of operations for the periods presented. As the Company sold 300 Westage Business Center Drive in Fishkill, New York, 1510 Lancer Drive in Moorestown, New Jersey; a Colorado portfolio in various cities throughout Colorado; and a portfolio in San Francisco, California during the year ended December 31, 2006, the Company has presented these assets as discontinued operations in its statements of operations for all periods presented. As the Company sold 300 Westage Business Center Drive in Fishkill, New York; 1510 Lancer Drive in Moorestown, New Jersey; the entire Colorado portfolio; and its entire California portfolio during the year ended December 31, 2006; and 111 East Shore Road and 600 Community Drive in North Hempstead, New York; 210 South 16th Street in Omaha, Nebraska; 3600 South Yosemite in Denver Colorado; 201 Willowbrook Boulevard in Wayne, New Jersey; 1122 Alma Road in Richardson, Texas; and 3 Skyline Drive in Hawthorne, New York during the year ended December 31, 2005; the Company has presented these assets as discontinued operations in the statement of operations for all periods presented.

88
There are no properties identified as held for sale as of December 31, 2007. The following tables summarize income from discontinued operations (net of minority interest) and the related realized gains (losses) and unrealized losses on disposition of rental property (net of minority interest), net for the years ended December 31, 2007, 2006 and 2005: (dollars in thousands) Year Ended December 31, 2007 2006 2005 Total revenues $ 3,881 $ 43,645 $ 56,667 Operating and other expenses (1,638) (18,214) (21,744) Depreciation and amortization (424) (8,853) (14,327) Interest expense (net of interest income) (522) (1,291) (224) Minority interest (240) (3,015) (3,297) Income from discontinued operations (net of minority interest) $ 1,057 $ 12,272 $ 17,075 Year Ended December 31, 2007 2006 2005 Realized gains (losses) on disposition of rental property, net $44,414 $ 59,605 $ 7,136 Unrealized losses on disposition of rental property -- -- (1,613) Minority interest (8,134) (11,890) (1,097) Realized gains (losses) and unrealized losses on disposition of rental property (net of minority interest), net $ 36,280 $ 47,715 $ 4,426 8. SENIOR UNSECURED NOTES A summary of the Company’s senior unsecured notes as of December 31, 2007 and 2006 is as follows: (dollars in thousands) December 31, Effective 2007 2006 Rate (a) 7.250% Senior Unsecured Notes, due March 15, 2009 $ 299,716 $ 299,481 7.49% 5.050% Senior Unsecured Notes, due April 15, 2010 149,874 149,819 5.27% 7.835% Senior Unsecured Notes, due December 15, 2010 15,000 15,000 7.95% 7.750% Senior Unsecured Notes, due February 15, 2011 299,468 299,295 7.93% 5.250% Senior Unsecured Notes, due January 15, 2012 99,210 99,015 5.46% 6.150% Senior Unsecured Notes, due December 15, 2012 92,472 91,981 6.89% 5.820% Senior Unsecured Notes, due March 15, 2013 25,530 25,420 6.45% 4.600% Senior Unsecured Notes, due June 15, 2013 99,844 99,815 4.74% 5.125% Senior Unsecured Notes, due February 15, 2014 201,468 201,708 5.11% 5.125% Senior Unsecured Notes, due January 15, 2015 149,349 149,256 5.30% 5.800% Senior Unsecured Notes, due January 15, 2016 200,616 200,692 5.81% Total Senior Unsecured Notes $1,632,547 $1,631,482 6.28% (a) Interest rate for unsecured notes reflects effective rate of debt, including cost of treasury lock agreement (if any), offering and
other transaction costs and the discount on the notes, as applicable. 9. UNSECURED REVOLVING CREDIT FACILITY

89
On June 22, 2007, the Company extended and modified its unsecured credit facility with a group of 23 Lenders. Amongst other modifications, the facility was extended for an additional two years and matures in June 2011, with an extension option of one year, which would require a payment of 15 basis points of the then borrowing capacity of the facility upon exercise. In addition, the interest rate on outstanding borrowings (not electing the Company’s competitive bid feature) was reduced by 10 basis points to LIBOR plus 55 basis points at the BBB/Baa2 pricing level. As of December 31, 2007, the Company’s outstanding borrowings carried a weighted average interest rate of LIBOR plus 55 basis points. On September 21, 2007, the Company exercised an option to expand the borrowing capacity under its unsecured credit facility from $600 million to $775 million (further expandable to $800 million). The facility has a competitive bid feature, which allows the Company to solicit bids from lenders under the facility to borrow up to $300 million at interest rates less than the current LIBOR plus 55 basis point spread. The Company may also elect an interest rate representing the higher of the lender’s prime rate or the Federal Funds rate plus 50 basis points. The unsecured facility also requires a 15 basis point facility fee on the current borrowing capacity payable quarterly in arrears. The interest rate and the facility fee are subject to adjustment, on a sliding scale, based upon the operating partnership’s unsecured debt ratings. In the event of a change in the Operating Partnership’s unsecured debt rating, the interest and facility fee rates will be adjusted in accordance with the following table: Operating Partnership’s Interest Rate – Unsecured Debt Ratings: Applicable Basis Points Facility Fee S&P Moody’s/Fitch (a) Above LIBOR Basis Points No ratings or less than BBB-/Baa3/BBB- 100.0 25.0 BBB-/Baa3/BBB- 75.0 20.0 BBB/Baa2/BBB (current) 55.0 15.0 BBB+/Baa1/BBB+ 42.5 15.0 A-/A3/A- or higher 37.5 12.5 (a) If the Operating Partnership has debt ratings from two rating agencies, one of which is Standard & Poor’s Rating Services
(“S&P”) or Moody’s Investors Service (“Moody’s”), the rates per the above table shall be based on the lower of such ratings. If the Operating Partnership has debt ratings from three rating agencies, one of which is S&P or Moody’s, the rates per the above table shall be based on the lower of the two highest ratings. If the Operating Partnership has debt ratings from only one agency, it will be considered to have no rating or less than BBB-/Baa3/BBB- per the above table.
The terms of the unsecured facility include certain restrictions and covenants which limit, among other things, the payment of dividends (as discussed below), the incurrence of additional indebtedness, the incurrence of liens and the disposition of real estate properties (to the extent that: (i) such property dispositions cause the Company to default on any of the financial ratios of the facility described below, or (ii) the property dispositions are completed while the Company is under an event of default under the facility, unless, under certain circumstances, such disposition is being carried out to cure such default), and which require compliance with financial ratios relating to the maximum leverage ratio, the maximum amount of secured indebtedness, the minimum amount of tangible net worth, the minimum amount of fixed charge coverage, the maximum amount of unsecured indebtedness, the minimum amount of unencumbered property interest coverage and certain investment limitations. The dividend restriction referred to above provides that, if an event of default has occurred and is continuing, the Company will not make any excess distributions with respect to common stock or other common equity interests except to enable the Company to continue to qualify as a REIT under the Code. The lending group for the credit facility consists of: JPMorgan Chase Bank, N.A., as administrative agent (the “Agent”); Bank of America, N.A., as syndication agent; Scotiabanc, Inc., Wachovia Bank, National Association, and Wells Fargo Bank, National Association, as documentation agents; SunTrust Bank, as senior managing agent; US Bank National Association, Citicorp North America, Inc. and PNC Bank, National Association, as managing agents; and Bank of China, New York Branch, The Bank of New York; Chevy Chase Bank, F.S.B., The Royal Bank of Scotland PLC, Mizuho Corporate Bank, Ltd., The Bank of Tokyo-Mitsubishi UFJ, Ltd. (Successor by merger to UFJ Bank Limited), North Fork Bank, Bank Hapoalim B.M., Comerica Bank, Chang Hwa Commercial Bank, Ltd., New York Branch, First Commercial Bank, New York Agency, Mega International Commercial Bank Co. Ltd., New York Branch, Deutsche Bank Trust

90
Company Americas and Hua Nan Commercial Bank, New York Agency, as participants. SUMMARY As of December 31, 2007 and 2006, the Company had outstanding borrowings of $250 million and $145 million, respectively, under its unsecured revolving credit facility. 10. MORTGAGES, LOANS PAYABLE AND OTHER OBLIGATIONS The Company has mortgages, loans payable and other obligations which primarily consist of various loans collateralized by certain of the Company’s rental properties. As of December 31, 2007, 19 of the Company’s properties, with a total book value of approximately $548 million, are encumbered by the Company’s mortgages and loans payable. Payments on mortgages, loans payable and other obligations are generally due in monthly installments of principal and interest, or interest only. A summary of the Company’s mortgages, loans payable and other obligations as of December 31, 2007 and 2006 is as follows: (dollars in thousands)
Effective Principal Balance at Interest December 31, Property Name Lender Rate (a) 2007 2006 Maturity Mack-Cali Airport Allstate Life Insurance Co. 7.05% -- $ 9,422 04/01/07 (b) 6303 Ivy Lane State Farm Life Insurance Co. 5.57% -- 6,020 07/01/07 (c) 6404 Ivy Lane Wachovia CMBS 5.58% $ 13,029 13,665 08/01/08 Assumed obligations Various 4.92% 27,657 38,742 05/01/09 (d) Various (e) Prudential Insurance Co. 4.84% 150,000 150,000 01/15/10 105 Challenger Road Archon Financial CMBS 6.24% 18,968 18,748 06/06/10 2200 Renaissance Boulevard Wachovia CMBS 5.89% 17,442 17,819 12/01/12 Soundview Plaza Morgan Stanley CMBS 6.02% 17,575 18,013 01/01/13 9200 Edmonston Road Principal Commercial Funding, L.L.C. 5.53% 5,096 5,232 05/01/13 6305 Ivy Lane John Hancock Life Insurance Co. 5.53% 7,098 7,285 01/01/14 395 West Passaic State Farm Life Insurance Co. 6.00% 12,596 12,996 05/01/14 6301 Ivy Lane John Hancock Life Insurance Co. 5.52% 6,655 6,821 07/01/14 35 Waterview Wachovia CMBS 6.35% 20,104 20,318 08/11/14 500 West Putnam Avenue New York Life Ins. Co. 5.57% -- 25,000 01/10/16 (f) 23 Main Street JP Morgan CMBS 5.59% 32,968 33,396 09/01/18 Total Mortgages, loans payable and other obligations: $329,188 $383,477 (a) Effective interest rate for mortgages loans payable and other obligations reflects effective rate of debt, including deferred financing
costs, comprised of the cost of terminated treasury lock agreements (if any), debt initiation costs and other transaction costs, as applicable.
(b) On February 5, 2007, the Company repaid this mortgage loan at par, using available cash. (c) On February 15, 2007, the Company repaid this mortgage loan at par, using available cash. (d) The obligations mature at various times through May 2009. (e) Mortgage is collateralized by seven properties. (f) On June 11, 2007, the Company assigned this loan with the sale of the property and the purchaser assumed this obligation.. SCHEDULED PRINCIPAL PAYMENTS Scheduled principal payments and related weighted average annual interest rates for the Company’s senior unsecured notes (see Note 8), unsecured revolving credit facility and mortgages, loans payable and other obligations as of December 31, 2007 are as follows: (dollars in thousands)

91
Weighted Avg. Scheduled Principal Interest Rate of Period Amortization Maturities Total Future Repayments (a) 2008 $21,191 $ 12,563 $ 33,754 5.21% 2009 11,471 300,000 311,471 7.40% 2010 2,583 334,500 337,083 5.26% 2011 2,745 550,000 552,745 6.84% 2012 2,864 210,148 213,012 6.13% Thereafter 5,702 760,618 766,320 5.41% Sub-total 46,556 2,167,829 2,214,385 6.08% Adjustment for unamortized debt discount/premium, net, as of December 31, 2007 (2,650) 0 (2,650) Totals/Weighted Average $43,906 $2,167,829 $2,211,735 6.08% (a) Actual weighted average LIBOR contract rates relating to the Company’s outstanding debt as of December 31, 2007 of 5.01
percent was used in calculating revolving credit facility and other variable rate debt interest rates. CASH PAID FOR INTEREST AND INTEREST CAPITALIZED Cash paid for interest for the years ended December 31, 2007, 2006 and 2005 was $128,678,000, $132,904,000, and $115,359,000, respectively. Interest capitalized by the Company for the years ended December 31, 2007, 2006 and 2005 was $5,101,000, $6,058,000 and $5,518,000, respectively. SUMMARY OF INDEBTEDNESS As of December 31, 2007 the Company’s total indebtedness of $2,211,735,000 (weighted average interest rate of 6.08 percent) was comprised of $250,000,000 of revolving credit facility borrowings (weighted average rate of 5.55 percent) and fixed rate debt and other obligations of $1,961,735,000 (weighted average rate of 6.15 percent). As of December 31, 2006, the Company’s total indebtedness of $2,159,959,000 (weighted average interest rate of 6.11 percent) was comprised of $145,000,000 of revolving credit facility borrowings (weighted average rate of 5.76 percent) and fixed rate debt and other obligations of $2,014,959,000 (weighted average rate of 6.14 percent). 11. MINORITY INTERESTS OPERATING PARTNERSHIP Minority interests in the accompanying consolidated financial statements relate to (i) preferred units (“Preferred Units”) and common units in the Operating Partnership, held by parties other than the Company, and (ii) interests in consolidated joint ventures for the portion of such properties not owned by the Company. Preferred Units The Operating Partnership has one class of outstanding Preferred Units, the Series C Preferred Units, and one class of Preferred Units, the Series B Preferred Units, which were converted to common units on June 13, 2005, each of which are described as follows: Series C In connection with the Company’s issuance of $25 million of Series C cumulative redeemable perpetual preferred stock, the Company acquired from the Operating Partnership $25 million of Series C Preferred Units (the “Series C Preferred Units”), which have terms essentially identical to the Series C preferred stock. See Note 16: Stockholders’ Equity – Preferred Stock.

92
Series B The Series B Preferred Units had a stated value of $1,000 per unit and were preferred as to assets over any class of common units or other class of preferred units of the Company, based on circumstances per the applicable unit certificates. The quarterly distribution on each Series B Preferred Unit was an amount equal to the greater of (i) $16.875 (representing 6.75 percent of the Series B Preferred Unit stated value of an annualized basis) or (ii) the quarterly distribution attributable to a Series B Preferred Unit determined as if such unit had been converted into common units, subject to adjustment for customary anti-dilution rights. On June 13, 2005, the Operating Partnership caused the mandatory conversion (the “Conversion”) of all 215,018 outstanding Series B Preferred Units into 6,205,425.72 Common Units. Each Series B Preferred Unit was converted into whole and fractional Common Units equal to (x) the $1,000 stated value, divided by (y) the conversion price of $34.65. A description of the rights, preferences and privileges of the Common Units is set forth below. Common Units Certain individuals and entities own common units in the Operating Partnership. A common unit and a share of common stock of the Company have substantially the same economic characteristics in as much as they effectively share equally in the net income or loss of the Operating Partnership. Common units are redeemable by the common unitholders at their option, subject to certain restrictions, on the basis of one common unit for either one share of common stock or cash equal to the fair market value of a share at the time of the redemption. The Company has the option to deliver shares of common stock in exchange for all or any portion of the cash requested. The common unitholders may not put the units for cash to the Company or the Operating Partnership. When a unitholder redeems a common unit, minority interest in the Operating Partnership is reduced and the Company’s investment in the Operating Partnership is increased. Unit Transactions The following table sets forth the changes in minority interest which relate to the Series B Preferred Units and common units in the Operating Partnership for the years ended December 31, 2007, 2006 and 2005: (dollars in thousands) Series B Series B Preferred Common Preferred Common Units Units Unitholders Unitholders Total Balance at January 1, 2005 215,018 7,616,447 $220,547 $196,308 $416,855 Net income -- -- 3,909 18,722 22,631 Distributions -- -- (3,909) (30,754) (34,663) Conversion of Preferred Units into common units (215,018) 6,205,426 (220,547) 220,547 -- Issuance of common units -- 63,328 -- 2,786 2,786 Redemption of common units for shares of common stock -- (234,762) -- (6,790) (6,790) Balance at December 31, 2005 -- 13,650,439 -- $400,819 $400,819 Net income -- -- -- 35,026 35,026 Distributions -- -- -- (38,585) (38,585) Issuance of common units -- 2,167,053 -- 97,517 97,517 Redemption of common units for shares of common stock -- (475,209) -- (14,674) (14,674) Balance at December 31, 2006 -- 15,342,283 -- $480,103 $480,103 Net income -- -- -- 24,500 24,500 Distributions -- -- -- (38,788) (38,788) Issuance of common units -- 114,911 -- 5,244 5,244 Redemption of common units for shares of common stock -- (471,656) -- (14,623) (14,623) Balance at December 31, 2007 -- 14,985,538 -- $456,436 $456,436 Minority Interest Ownership As of December 31, 2007 and December 31, 2006, the minority interest common unitholders owned 18.5 percent and

93
19.6 percent of the Operating Partnership, respectively. CONSOLIDATED JOINT VENTURES The Company has ownership interests in certain joint ventures which it consolidates. Various entities and/or individuals hold minority interests in many of these ventures. 12. EMPLOYEE BENEFIT 401(k) PLANS Employees of the Company who meet certain minimum age and period of service requirements are eligible to participate in a 401(k) defined contribution plan (the “401(k) Plan”). The 401(k) Plan allows eligible employees to defer from 1 to 30 percent of their annual compensation, subject to certain limitations imposed by federal law. The amounts contributed by employees are immediately vested and non-forfeitable. The Company, at management’s discretion, may match employee contributions and/or make discretionary contributions. Total expense recognized by the Company for the 401(k) Plan for each of the three years ended December 31, 2007, 2006 and 2005 was $400,000. All employees of the Gale Company and other affiliated participating employers, other than certain employees who are represented for collective bargaining purposes by a labor organization, who meet certain minimum age and period of service requirements are eligible to participate in a 401(k) defined contribution plan (the “Gale Plan”). The Gale Plan allows eligible employees to defer from their annual compensation, the maximum amount permitted under federal law. The amounts contributed by employees are immediately vested and non-forfeitable. The Gale Company or the participant’s employer matches the employee’s deferral at the rate of 50 percent on the first six percent of the employee’s annual compensation for employees who have at least 1,000 hours of service and are employed on the last day of the plan year. In addition, the Company, at management’s discretion, may make discretionary contributions. Participants become 50 percent vested in employer contributions after two years of service and become 100 percent vested after three years of service. Effective April 1, 2007, the Gale Plan was merged into the 401(k) Plan. In accordance with the Gale/Green transactions, the Company continued to make matching contributions to former Gale Plan participants under the Gale Plan matching contribution formula through the payroll period ending May 4, 2007. Moreover, federal law requires the Company to preserve (i) the Gale Plan vesting schedule for certain Gale Plan participants with three or more years of service as of May 4, 2007 and (ii) certain benefits previously offered under the Gale Plan. Total expense recognized after the completion of the Gale/Green Transactions by the Company for the Gale Plan for the years ended December 31, 2007 and 2006 was $111,000 and $370,000, respectively. 13. DISCLOSURE OF FAIR VALUE OF FINANCIAL INSTRUMENTS The following disclosure of estimated fair value was determined by management using available market information and appropriate valuation methodologies. However, considerable judgment is necessary to interpret market data and develop estimated fair value. Accordingly, the estimates presented herein are not necessarily indicative of the amounts the Company could realize on disposition of the financial instruments at December 31, 2007 and 2006. The use of different market assumptions and/or estimation methodologies may have a material effect on the estimated fair value amounts. Cash equivalents, marketable securities, receivables, accounts payable, and accrued expenses and other liabilities are carried at amounts which reasonably approximate their fair values as of December 31, 2007 and 2006. The fair value of the fixed-rate mortgage debt and unsecured notes as of December 31, 2007 and 2006 approximated the book value of approximately $2.0 billion as of December 31, 2007 and 2006. The fair value of the mortgage debt and the unsecured notes was determined by discounting the future contractual interest and principal payments by a market rate. Disclosure about fair value of financial instruments is based on pertinent information available to management as of December 31, 2007 and 2006. Although management is not aware of any factors that would significantly affect the fair value amounts, such amounts have not been comprehensively revalued for purposes of these financial statements since December 31, 2007 and current estimates of fair value may differ significantly from the amounts presented herein. 14. COMMITMENTS AND CONTINGENCIES

94
TAX ABATEMENT AGREEMENTS Harborside Financial Center Pursuant to agreements with the City of Jersey City, New Jersey, the Company is required to make payments in lieu of property taxes (“PILOT”) on certain of its properties located in Jersey City, as follows:
The Harborside Plaza 4-A agreement, which commenced in 2000, is for a term of 20 years. The PILOT is equal to two percent of Total Project costs, as defined, and increases by 10 percent in years 7, 10 and 13 and by 50 percent in year 16. Total Project costs, as defined, are $45.5 million. The PILOT totaled $1,001,000 for the year ended December 31, 2007 and $910,000 for each of the years ended December 31, 2006 and 2005.
The Harborside Plaza 5 agreement, as amended, which commenced in 2002 upon substantial completion of the property, as defined, is for a term of 20 years. The PILOT is equal to two percent of Total Project Costs. Total Project Costs, as defined, are $159.6 million. The PILOT totaled $3.2 million for each of the years ended December 31, 2007, 2006 and 2005.
At the conclusion of the above-referenced PILOT agreements, it is expected that the properties will be assessed by the municipality and be subject to real estate taxes at the then prevailing rates. LITIGATION The Company is a defendant in litigation arising in the normal course of its business activities. Management does not believe that the ultimate resolution of these matters will have a materially adverse effect upon the Company’s financial condition taken as whole. GROUND LEASE AGREEMENTS Future minimum rental payments under the terms of all non-cancelable ground leases under which the Company is the lessee, as of December 31, 2007, are as follows: (dollars in thousands) Year Amount 2008 $ 486 2009 501 2010 501 2011 501 2012 501 2013 through 2084 34,952 Total $37,442 Ground lease expense incurred by the Company during the years ended December 31, 2007, 2006 and 2005 amounted to $663,000, $698,000 and $606,000, respectively. OTHER The Company may not dispose of or distribute certain of its properties, currently comprising 11 properties with an aggregate net book value of approximately $208.1 million, which were originally contributed by the sellers of certain properties to the Company, without the express written consent of a representative of the contributors of such properties, except in a manner which does not result in recognition of any built-in-gain (which may result in an income tax liability) or which reimburses the appropriate members for the tax consequences of the recognition of such built-in-gains. These transfer restrictions are scheduled to expire periodically through 2016. Additionally, the Company may not dispose of or distribute two properties with an aggregate net book value of approximately $12.8 million, which were originally contributed by members of the Cali Group (which includes John R. Cali, director, and John J. Cali, a former director) under similar terms and conditions, for which such restrictions are scheduled to expire in June 2008. The aforementioned restrictions do not apply in the event that the Company sells all of its properties or in connection with a sale transaction which the Company’s Board of Directors determines is reasonably necessary to satisfy a material monetary default on any unsecured debt, judgment or liability of the Company or to cure any material monetary default on any mortgage secured by a property. Upon expiration, the Company generally is required to use commercially reasonable efforts to

95
prevent any sale, transfer or other disposition of the subject properties from resulting in the recognition of built-in gain to the contributors of the properties. 124 of the Company’s properties which were originally contributed by members of either the Mack Group (which includes William L. Mack, Chairman of the Company’s Board of Directors; David S. Mack, director; Earle I. Mack, a former director; and Mitchell E. Hersh, president, chief executive officer and director), the Robert Martin Group (which includes Martin S. Berger, director; Robert F. Weinberg, a former director; and Timothy M. Jones, former president), the Cali Group (which includes John R. Cali, director, and John J. Cali, a former director) or certain other common unitholders, with an aggregate net book value of approximately $1.9 billion, have lapsed restrictions and are subject to these conditions. 15. TENANT LEASES The Properties are leased to tenants under operating leases with various expiration dates through 2026. Substantially all of the leases provide for annual base rents plus recoveries and escalation charges based upon the tenant’s proportionate share of and/or increases in real estate taxes and certain operating costs, as defined, and the pass-through of charges for electrical usage. Future minimum rentals to be received under non-cancelable operating leases at December 31, 2007 are as follows: (dollars in thousands) Year Amount 2008 $ 574,203 2009 540,826 2010 478,828 2011 410,746 2012 342,727 2013 and thereafter 1,068,116 Total $3,415,446 16. STOCKHOLDERS’ EQUITY To maintain its qualification as a REIT, not more than 50 percent in value of the outstanding shares of the Company may be owned, directly or indirectly, by five or fewer individuals at any time during the last half of any taxable year of the Company, other than its initial taxable year (defined to include certain entities), applying certain constructive ownership rules. To help ensure that the Company will not fail this test, the Company’s Articles of Incorporation provide for, among other things, certain restrictions on the transfer of common stock to prevent further concentration of stock ownership. Moreover, to evidence compliance with these requirements, the Company must maintain records that disclose the actual ownership of its outstanding common stock and demands written statements each year from the holders of record of designated percentages of its common stock requesting the disclosure of the beneficial owners of such common stock. COMMON STOCK On February 7, 2007, the Company completed an underwritten offer and sale of 4,650,000 shares of its common stock and used the net proceeds, which totaled approximately $252 million (after offering costs), primarily to pay down its outstanding borrowings under the Company’s revolving credit facility and general corporate purposes. PREFERRED STOCK On March 14, 2003, in a publicly registered transaction with a single institutional buyer, the Company completed the sale and issuance of 10,000 shares of eight-percent Series C cumulative redeemable perpetual preferred stock (“Series C Preferred Stock”) in the form of 1,000,000 depositary shares ($25 stated value per depositary share). Each depositary share represents 1/100th of a share of Series C Preferred Stock. The Company received net proceeds of approximately $24.8 million from the sale. See Note 11: Minority Interests – Operating Partnership – Preferred Units.

96
The Series C Preferred Stock has preference rights with respect to liquidation and distributions over the common stock. Holders of the Series C Preferred Stock, except under certain limited conditions, will not be entitled to vote on any matters. In the event of a cumulative arrearage equal to six quarterly dividends, holders of the Series C Preferred Stock will have the right to elect two additional members to serve on the Company’s Board of Directors until dividends have been paid in full. At December 31, 2007, there were no dividends in arrears. The Company may issue unlimited additional preferred stock ranking on a parity with the Series C Preferred Stock but may not issue any preferred stock senior to the Series C Preferred Stock without the consent of two-thirds of its holders. The Series C Preferred Stock is essentially on an equivalent basis in priority with the Preferred Units. Except under certain conditions relating to the Company’s qualification as a REIT, the Series C Preferred Stock is not redeemable prior to March 14, 2008. On and after such date, the Series C Preferred Stock will be redeemable at the option of the Company, in whole or in part, at $25 per depositary share, plus accrued and unpaid dividends. SHARE REPURCHASE PROGRAM On September 12, 2007, the Board of Directors authorized an increase to the Company’s repurchase program under which the Company was permitted to purchase up to $150 million of the Company’s outstanding common stock (“Repurchase Program”). During the year ended December 31, 2007 and through February 8, 2008, the Company purchased and retired 2,893,630 shares of its outstanding common stock for an aggregate cost of approximately $104 million. The Company has a remaining authorization to repurchase up to approximately $46 million of its outstanding common stock, which it may repurchase from time to time in open market transactions at prevailing prices or through privately negotiated transactions. DIVIDEND REINVESTMENT AND STOCK PURCHASE PLAN The Company has a dividend reinvestment and stock purchase plan, which commenced in March 1999. SHAREHOLDER RIGHTS PLAN On June 10, 1999, the Board of Directors of the Company authorized a dividend distribution of one preferred share purchase right (“Right”) for each outstanding share of common stock which were distributed to all holders of record of the common stock on July 6, 1999. Each Right entitles the registered holder to purchase from the Company one one-thousandth of a share of Series A junior participating preferred stock, par value $0.01 per share (“Preferred Shares”), at a price of $100.00 per one one-thousandth of a Preferred Share (“Purchase Price”), subject to adjustment as provided in the rights agreement. The Rights expire on July 6, 2009, unless the expiration date is extended or the Right is redeemed or exchanged earlier by the Company. The Rights are attached to each share of common stock. The Rights are generally exercisable only if a person or group becomes the beneficial owner of 15 percent or more of the outstanding common stock or announces a tender offer for 15 percent or more of the outstanding common stock (“Acquiring Person”). In the event that a person or group becomes an Acquiring Person, each holder of a Right will have the right to receive, upon exercise, common stock having a market value equal to two times the Purchase Price of the Right. STOCK OPTION PLANS In May 2004, the Company established the 2004 Incentive Stock Plan under which a total of 2,500,000 shares have been reserved for issuance. No options have been granted through December 31, 2007 under this plan. In September 2000, the Company established the 2000 Employee Stock Option Plan (“2000 Employee Plan”) and the Amended and Restated 2000 Director Stock Option Plan (“2000 Director Plan”). In May 2002, shareholders of the Company approved amendments to both plans to increase the total shares reserved for issuance under both of the 2000 plans from 2,700,000 to 4,350,000 shares of the Company’s common stock (from 2,500,000 to 4,000,000 shares under the 2000 Employee Plan and from 200,000 to 350,000 shares under the 2000 Director Plan). In 1994, and as subsequently amended, the Company established the Mack-Cali Employee Stock Option Plan (“Employee Plan”) and the Mack-Cali Director Stock Option Plan (“Director Plan”) under which a total of 5,380,188 shares (subject to adjustment) of the Company’s common stock had been reserved for issuance (4,980,188 shares under the Employee Plan and 400,000 shares under the Director Plan). As the Employee Plan and Director Plan expired in 2004, stock options may no longer be issued under those plans. Stock options granted under the Employee Plan in 1994 and 1995 became exercisable over a three-year period. Stock options granted under the 2000 Employee Plan and those options granted subsequent to 1995 under the Employee Plan become exercisable over a five-year period. All stock options granted under both the 2000 Director Plan and Director
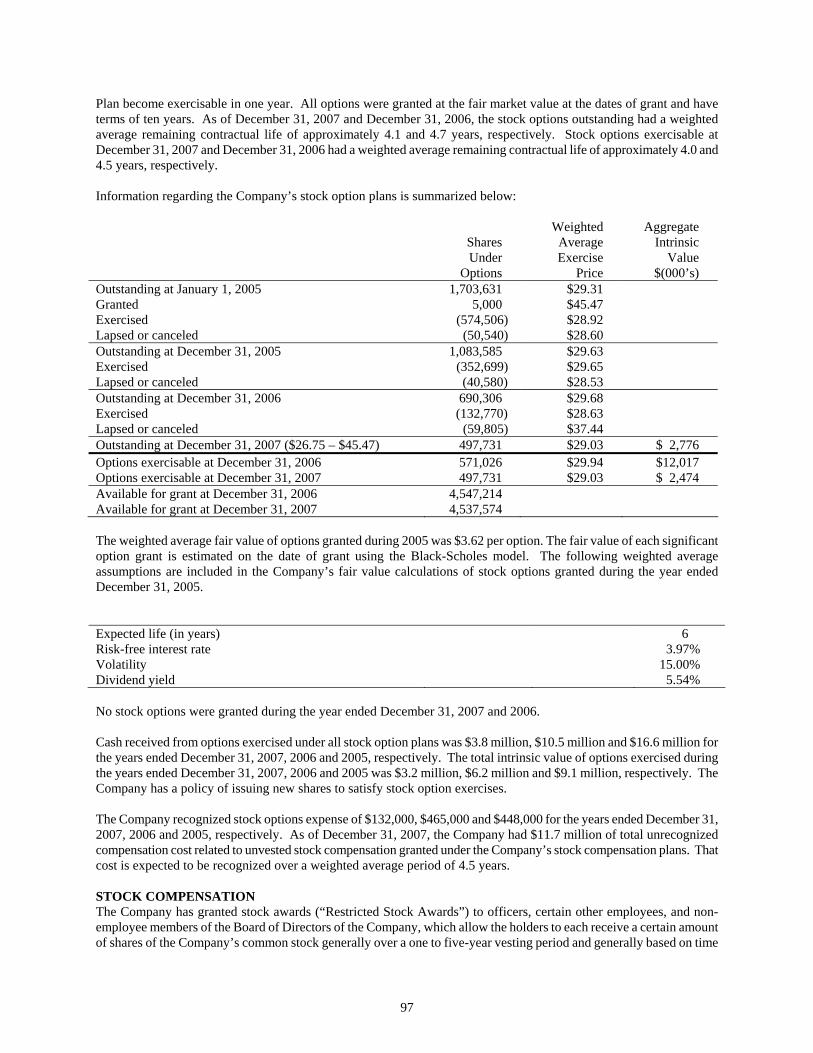
97
Plan become exercisable in one year. All options were granted at the fair market value at the dates of grant and have terms of ten years. As of December 31, 2007 and December 31, 2006, the stock options outstanding had a weighted average remaining contractual life of approximately 4.1 and 4.7 years, respectively. Stock options exercisable at December 31, 2007 and December 31, 2006 had a weighted average remaining contractual life of approximately 4.0 and 4.5 years, respectively. Information regarding the Company’s stock option plans is summarized below: Weighted Aggregate Shares Average Intrinsic Under Exercise Value Options Price $(000’s) Outstanding at January 1, 2005 1,703,631 $29.31 Granted 5,000 $45.47 Exercised (574,506) $28.92 Lapsed or canceled (50,540) $28.60 Outstanding at December 31, 2005 1,083,585 $29.63 Exercised (352,699) $29.65 Lapsed or canceled (40,580) $28.53 Outstanding at December 31, 2006 690,306 $29.68 Exercised (132,770) $28.63 Lapsed or canceled (59,805) $37.44 Outstanding at December 31, 2007 ($26.75 – $45.47) 497,731 $29.03 $ 2,776 Options exercisable at December 31, 2006 571,026 $29.94 $12,017 Options exercisable at December 31, 2007 497,731 $29.03 $ 2,474 Available for grant at December 31, 2006 4,547,214 Available for grant at December 31, 2007 4,537,574 The weighted average fair value of options granted during 2005 was $3.62 per option. The fair value of each significant option grant is estimated on the date of grant using the Black-Scholes model. The following weighted average assumptions are included in the Company’s fair value calculations of stock options granted during the year ended December 31, 2005. Expected life (in years) 6 Risk-free interest rate 3.97% Volatility 15.00% Dividend yield 5.54% No stock options were granted during the year ended December 31, 2007 and 2006. Cash received from options exercised under all stock option plans was $3.8 million, $10.5 million and $16.6 million for the years ended December 31, 2007, 2006 and 2005, respectively. The total intrinsic value of options exercised during the years ended December 31, 2007, 2006 and 2005 was $3.2 million, $6.2 million and $9.1 million, respectively. The Company has a policy of issuing new shares to satisfy stock option exercises. The Company recognized stock options expense of $132,000, $465,000 and $448,000 for the years ended December 31, 2007, 2006 and 2005, respectively. As of December 31, 2007, the Company had $11.7 million of total unrecognized compensation cost related to unvested stock compensation granted under the Company’s stock compensation plans. That cost is expected to be recognized over a weighted average period of 4.5 years. STOCK COMPENSATION The Company has granted stock awards (“Restricted Stock Awards”) to officers, certain other employees, and non-employee members of the Board of Directors of the Company, which allow the holders to each receive a certain amount of shares of the Company’s common stock generally over a one to five-year vesting period and generally based on time

98
and service, of which 170,811 shares were outstanding at December 31, 2007. Of the outstanding Restricted Stock Awards granted to executive officers and senior management, 49,673 are contingent upon the Company meeting certain performance and/or stock price appreciation objectives. All Restricted Stock Awards provided to the officers and certain other employees were granted under the 2000 Employee Plan and the Employee Plan. Restricted Stock Awards granted to directors were granted under the 2000 Director Plan. Information regarding the Restricted Stock Awards is summarized below: Weighted-Average Grant – Date Shares Fair Value Outstanding at January 1, 2005 198,703 $ 33.19 Granted (a) 165,660 $ 43.41 Vested (109,419) $ 40.36 Forfeited (8,000) $ 43.85 Outstanding at December 31, 2005 246,944 $ 37.17 Granted (b) 81,034 $ 52.94 Vested (102,808) $ 43.72 Forfeited (8,550) $ 43.59 Outstanding at December 31, 2006 216,620 $ 39.78 Granted (c) 113,118 $ 36.29 Vested (158,927) $ 42.10 Outstanding at December 31, 2007 170,811 $ 35.32
(a) Included in the 165,660 Restricted Stock Awards granted in 2005 were 37,960 awards granted to the Company’s four
executive officers, Mitchell E. Hersh, Barry Lefkowitz, Roger W. Thomas and Michael Grossman. (b) Included in the 81,034 Restricted Stock Awards granted in 2006 were 67,834 awards granted to the Company’s five
executive officers, Mitchell E. Hersh, Barry Lefkowitz, Roger W. Thomas, Michael Grossman and Mark Yeager. (c) Included in the 113,118 Restricted Stock Awards granted in 2007 were 82,518 awards granted to the Company’s five
executive officers, Mitchell E. Hersh, Barry Lefkowitz, Roger W. Thomas, Michael Grossman and Mark Yeager. On September 12, 2007, the Board of Directors of the Company approved the recommendations and ratified the determinations of the Executive Compensation and Option Committee of the Board of Directors (the “Committee”) with respect to new Restricted Stock Awards totaling 230,586 shares for its executive officers. The Restricted Stock Awards may vest commencing January 1, 2009, with the number of Restricted Stock Awards scheduled to be vested and earned on each vesting date on an annual basis over a five to seven year vesting schedule, with each annual vesting of each tranche of Restricted Stock Awards is subject to the attainment of annual performance goals to be set by the Committee for each year. In connection with the authorization of the Restricted Stock Awards, the Company also authorized the entering into of tax gross-up agreements with each of the executive officers. DEFERRED STOCK COMPENSATION PLAN FOR DIRECTORS The Deferred Compensation Plan for Directors, which commenced January 1, 1999, allows non-employee directors of the Company to elect to defer up to 100 percent of their annual retainer fee into deferred stock units. The deferred stock units are convertible into an equal number of shares of common stock upon the directors’ termination of service from the Board of Directors or a change in control of the Company, as defined in the plan. Deferred stock units are credited to each director quarterly using the closing price of the Company’s common stock on the applicable dividend record date for the respective quarter. Each participating director’s account is also credited for an equivalent amount of deferred stock units based on the dividend rate for each quarter. During the years ended December 31, 2007, 2006 and 2005, 8,054, 6,266 and 6,655 deferred stock units were earned, respectively. As of December 31, 2007 and 2006, there were 44,179 and 37,263 director stock units outstanding, respectively.

99
EARNINGS PER SHARE Basic EPS excludes dilution and is computed by dividing net income available to common shareholders by the weighted average number of shares outstanding for the period. Diluted EPS reflects the potential dilution that could occur if securities or other contracts to issue common stock were exercised or converted into common stock. The following information presents the Company’s results for the years ended December 31, 2007, 2006 and 2005 in accordance with FASB No. 128: (dollars in thousands) Year Ended December 31, Computation of Basic EPS 2007 2006 2005 Income from continuing operations $ 73,129 $ 84,679 $ 73,987 Deduct: Preferred stock dividends (2,000) (2,000) (2,000) Income from continuing operations available to common shareholders 71,129 82,679 71,987 Income from discontinued operations 37,337 59,987 21,501 Net income available to common shareholders $108,466 $142,666 $ 93,488 Weighted average common shares 67,026 62,237 61,477 Basic EPS: Income from continuing operations $ 1.06 $ 1.33 $ 1.17 Income from discontinued operations 0.56 0.96 0.35 Net income available to common shareholders $ 1.62 $ 2.29 $ 1.52 Year Ended December 31, Computation of Diluted EPS 2007 2006 2005 Income from continuing operations available to common shareholders $ 71,129 $ 82,679 $ 71,987 Add: Income from continuing operations attributable to
Operating Partnership – common units 16,126 20,121 14,329 Income from continuing operations for diluted earnings per share 87,255 102,800 86,316 Income from discontinued operations for diluted earnings per share 45,711 74,892 25,894 Net income available to common shareholders $132,966 $177,692 $112,210 Weighted average common shares 82,500 77,901 74,189 Diluted EPS: Income from continuing operations $ 1.06 $ 1.32 $ 1.16 Income from discontinued operations 0.55 0.96 0.35 Net income available to common shareholders $ 1.61 $ 2.28 $ 1.51

100
The following schedule reconciles the shares used in the basic EPS calculation to the shares used in the diluted EPS calculation: Year Ended December 31, 2007 2006 2005 Basic EPS shares 67,026 62,237 61,477 Add: Operating Partnership – common units 15,190 15,286 12,252
Stock options 185 310 401 Restricted Stock Awards 99 68 59 Stock Warrants -- -- --
Diluted EPS Shares 82,500 77,901 74,189 Not included in the computations of diluted EPS were 5,000, 0, and 1,507 stock options as such securities were anti-dilutive during the years ended December 31, 2007, 2006 and 2005, respectively. Also excluded from diluted EPS computations was 1,530,105 Series B Preferred Units, on an as converted basis into common units, as such securities were anti-dilutive during the year ended December 31, 2005. Unvested restricted stock outstanding as of December 31, 2007, 2006 and 2005 were 170,811, 216,620 and 246,944, respectively.

101
17. SEGMENT REPORTING The Company operates in two business segments: (i) real estate and (ii) construction services. The Company provides leasing, property and facilities management, acquisition, development, construction and tenant-related services for its portfolio. In May 2006, in conjunction with the Company’s acquisition of the Gale Company and related businesses, the Company acquired a business specializing solely in construction and related services whose operations comprise the Company’s construction services segment. The Company had no revenues from foreign countries recorded for the year ended December 31, 2007. Included in the Company’s revenues for the year ended December 31, 2006 was $4,806,000 derived from foreign countries. The Company had no long lived assets in foreign locations as of December 31, 2007 and 2006. The accounting policies of the segments are the same as those described in Note 2: Significant Accounting Policies, excluding depreciation and amortization. The Company evaluates performance based upon net operating income from the combined properties in the real estate segment and net operating income from its construction services segment.

102
Selected results of operations for the years ended December 31, 2007, 2006 and 2005 and selected asset information as of December 31, 2007 and 2006 regarding the Company’s operating segments are as follows: (dollars in thousands)
Real Estate
Construction Services
Corporate & Other (d)
Total
Company
Total revenues: 2007 $ 716,932 $97,951 $ (6,533) $ 808,350 2006 668,297 56,582 7,133 732,012 2005 589,242 -- 2,749 591,991 Total operating and interest expenses (a): 2007 $ 263,175 $96,699 $ 170,382 $ 530,256 (e) 2006 257,688 55,871 174,694 488,253 (f) 2005 207,522 -- 150,682 358,204 (g) Equity in earnings of unconsolidated joint ventures: 2007 $ (5,918) -- -- $ ( 5,918) 2006 (5,556) -- -- (5,556) 2005 248 -- -- 248 Net operating income (b): 2007 $ 447,839 $ 1,252 $(176,915) $ 272,176 (e) 2006 405,053 711 (167,561) 238,203 (f) 2005 381,968 -- (147,933) 234,035 (g) Total assets: 2007 $4,633,500 $35,019 $ (75,317) $4,593,202 2006 4,281,222 28,353 113,314 4,422,889 Total long-lived assets (c): 2007 $4,268,260 -- $ (1,017) $4,267,243 2006 4,036,393 -- 1,550 4,037,943 (a) Total operating and interest expenses represent the sum of: real estate taxes; utilities; operating services; direct construction
costs; real estate services salaries, wages and other costs; general and administrative and interest expense (net of interest income). All interest expense, net of interest income, (including for property-level mortgages) is excluded from segment amounts and classified in Corporate & Other for all periods.
(b) Net operating income represents total revenues less total operating and interest expenses [as defined in Note (a)], plus equity in earnings (loss) of unconsolidated joint ventures, for the period.
(c) Long-lived assets are comprised of net investment in rental property, unbilled rents receivable and investments in unconsolidated joint ventures.
(d) Corporate & Other represents all corporate-level items (including interest and other investment income, interest expense and non-property general and administrative expense) as well as intercompany eliminations necessary to reconcile to consolidated Company totals.
(e) Excludes $183,564 of depreciation and amortization. (f) Excludes $159,096 of depreciation and amortization. (g) Excludes $141,771 of depreciation and amortization.

103
18. RELATED PARTY TRANSACTIONS William L. Mack, Chairman of the Board of Directors of the Company (“W. Mack”), David S. Mack, a director of the Company, and Earle I. Mack, a former director of the Company (“E. Mack”), are the executive officers, directors and stockholders of a corporation that leases approximately 7,801 square feet at one of the Company’s office properties, which is scheduled to expire in November 2008. The Company has recognized $233,000, $228,000 and $242,000 in revenue under this lease for the years ended December 31, 2007, 2006 and 2005, respectively, and had no accounts receivable from the corporation as of December 31, 2007 and 2006. The Company has conducted business with certain entities (“RMC Entity” or “RMC Entities”), whose principals include Timothy M. Jones, Martin S. Berger and Robert F. Weinberg, each of whom are affiliated with the Company as the former president of the Company, a current member of the Board of Directors and a former member of the Board of Directors of the Company, respectively. In connection with the Company’s acquisition of 65 Class A properties from The Robert Martin Company (“Robert Martin”) on January 31, 1997, as subsequently modified, the Company granted Robert Martin the right to designate one seat on the Company’s Board of Directors (“RM Board Seat”), which right has since expired. The RM Board Seat had historically been shared between Robert F. Weinberg and Martin S. Berger, each of whom had agreed that, for so long as either of them serves on the Board of Directors, that such board seat would be rotated among Mr. Berger and Mr. Weinberg annually at the time of each annual meeting of stockholders. At the Company’s 2003 annual meeting of stockholders, Mr. Berger was elected to the Board of Directors and he continued to share his board seat with Mr. Weinberg. At the Company’s 2006 annual meeting of stockholders, Mr. Weinberg was elected to the Board of Directors and he resigned after the Company’s 2007 annual meeting of stockholder and Mr. Berger was appointed to his board seat. The business that the Company has conducted with RMC Entities was as follows:
(1) The Company provides management, leasing and construction-related services to properties in which RMC
Entities have an ownership interest. The Company recognized approximately $2 million, $2 million and $1.1 million in revenue from RMC Entities for the years ended December 31, 2007, 2006 and 2005, respectively. As of December 31, 2007 and 2006, respectively, the Company had $319,000 and $131,000 accounts receivable from RMC Entities.
(2) An RMC Entity leased space at one of the Company’s office properties for approximately 3,330 square feet, which, after a three-year renewal and expansion signed with the Company in 2005, now leases 4,860 square feet which is scheduled to expire in October 2008. The Company has recognized $132,000, $119,000 and $89,000, in revenue under this lease for the years ended December 31, 2007, 2006 and 2005, respectively, and had zero accounts receivable due from the RMC Entity, as of December 31, 2007 and 2006, respectively.
Through June 2007, Mr. Berger held a 24 percent interest, acted as chairman and chief executive officer, Mr. Weinberg also held a 24 percent interest and was a director, and W. Mack held a nine percent interest and was a director of City and Suburban Federal Savings Bank and/or one of its affiliates, which leases a 12,842 square feet of space at one of the Company’s office properties, which was scheduled to expire in April 2013. In July 2007, Mssrs. Berger, Weinberg and Mack sold their interests and no longer are directors of City and Suburban Federal Savings Bank and/or its affiliates. The Company recognized $190,000, $404,000 and $396,000 in revenue under the leases for the years ended December 31, 2007, 2006 and 2005, respectively, and had no accounts receivable from the company as of December 31, 2007 and 2006. Pursuant to an agreement between the Company and certain members and associates of the Cali family executed June 27, 2000, John J. Cali served as the Chairman Emeritus and a Board member of the Company, and as a consultant to the Company and was paid an annual salary of $150,000 from June 27, 2000 through June 27, 2003. Additionally, the Company provided office space and administrative support to John J. Cali and Ed Leshowitz, his business partner (the “Cali Group”). Such services were in effect from June 27, 2000 through June 27, 2004. From June 27, 2004 through June 26, 2005, the Company agreed to provide office space at no cost to the Cali Group. The Company also provides administrative support and related services for which it was reimbursed $192,000, $184,000 and $115,000 from the Cali Group for the years ended December 31, 2007, 2006 and 2005, respectively. On June 27, 2005, an affiliate of the Cali Group entered into a three-year lease for 1,825 square feet of space at one of the Company’s office properties, which is scheduled to expire at the end of 2011. On September 18, 2006, an affiliate of the Cali Group entered into another lease agreement for 806 additional square feet, in the same building, commencing on December 29, 2006, which is scheduled

104
to expire at the end of 2011. The Company recognized approximately $68,000, $47,000 and $24,000 in total revenue under the leases for the year ended December 31, 2007, 2006 and 2005, respectively, and had no accounts receivable from the affiliate as of December 31, 2007 and 2006. 19. IMPACT OF RECENTLY-ISSUED ACCOUNTING STANDARDS FASB Statement No. 157 (“FASB No. 157”), Fair Value Measurements FASB No. 157 defines fair value, establishes a framework for measuring fair value in generally accepted accounting principles (GAAP), and expands disclosures about fair value measurements. FASB No. 157 applies under other accounting pronouncements that require or permit fair value measurements, FASB having previously concluded in those accounting pronouncements that fair value is their relevant measurement attribute. Accordingly, this FASB No. 157 does not require any new fair value measurements. However, for some entities, the application of this FASB No. 157 will change current practice. This statement is effective for financial statements for fiscal years beginning after November 15, 2007. The Company does not expect that the implementation of FASB No. 157 will have a material effect on the Company’s consolidated financial position or results of operations. FINANCIAL ACCOUNTING STANDARDS BOARD (FASB) Statement No. 159 (“FASB No. 159”), The Fair Value Option for Financial Assets and Financial Liabilities—Including an amendment of FASB Statement No. 115 FASB No. 159 permits entities to choose to measure many financial instruments and certain other items at fair value. The objective is to improve financial reporting by providing entities with the opportunity to mitigate volatility in reported earnings caused by measuring related assets and liabilities differently without having to apply complex hedge accounting provisions. FASB No. 159 is expected to expand the use of fair value measurement, which is consistent with FASB’s long-term measurement objectives for accounting for financial instruments. This Statement applies to all entities, including not-for-profit organizations. Most of the provisions of this Statement apply only to entities that elect the fair value option. However, the amendment to FASB Statement No. 115, Accounting for Certain Investments in Debt and Equity Securities, applies to all entities with available-for-sale and trading securities. Some requirements apply differently to entities that do not report net income. The following are eligible items for the measurement option established by FASB No. 159.
1. Recognized financial assets and financial liabilities except: a. An investment in a subsidiary that the entity is required to consolidate; b. An interest in a variable interest entity that the entity is required to consolidate; c. Employers’ and plans’ obligations (or assets representing net overfunded positions) for pension
benefits, other postretirement benefits (including health care and life insurance benefits), postemployment benefits, employee stock option and stock purchase plans, and other forms of deferred compensation arrangements, as defined in FASB Statements No. 35, Accounting and Reporting by Defined Benefit Pension Plans, No. 87, Employers’ Accounting for Pensions, No. 106, Employers’ Accounting for Postretirement Benefits Other Than Pensions, No. 112, Employers’ Accounting for Postemployment Benefits, No. 123 (revised December 2004), Share-Based Payment, No. 43, Accounting for Compensated Absences, No. 146, Accounting for Costs Associated with Exit or Disposal Activities, and No. 158, Employers’ Accounting for Defined Benefit Pension and Other Postretirement Plans, and APB Opinion No. 12, Omnibus Opinion—1967;
d. Financial assets and financial liabilities recognized under leases as defined in FASB Statement No. 13, Accounting for Leases (This exception does not apply to a guarantee of a third-party lease obligation or a contingent obligation arising from a cancelled lease.);
e. Deposit liabilities, withdrawable on demand, of banks, savings and loan associations, credit unions, and other similar depository institutions; and
f. Financial instruments that are, in whole or in part, classified by the issuer as a component of shareholder’s equity (including “temporary equity”). An example is a convertible debt security with a noncontingent beneficial conversion feature.
2. Firm commitments that would otherwise not be recognized at inception and that involve only financial instruments.

105
3. Nonfinancial insurance contracts and warranties that the insurer can settle by paying a third party to provide those goods or services.
4. Host financial instruments resulting from separation of an embedded nonfinancial derivative instrument from a nonfinancial hybrid instrument.
The fair value option established by FASB No. 159 permits all entities to choose to measure eligible items at fair value at specified election dates. A business entity shall report unrealized gains and losses on items for which the fair value option has been elected in earnings (or another performance indicator if the business entity does not report earnings) at each subsequent reporting date. FASB No. 159 is effective as of the beginning of an entity’s first fiscal year that begins after November 15, 2007. The Company does not expect that the implementation of FASB No. 159 will have a material effect on the Company’s consolidated financial position or results of operations. FASB Statement No. 141(R) – (revised 2007), (“FASB No. 141(R)”), Business Combinations In December 2007, the FASB issued FASB No. 141(R) which establishes principles and requirements for how the acquirer shall recognize and measure in its financial statements the identifiable assets acquired, liabilities assumed, any noncontrolling interest in the acquiree and goodwill acquired in a business combination. This statement is effective for business combinations for which the acquisition date is on or after the beginning of the first annual reporting period beginning on or after December 15, 2008. The Company is currently assessing the potential impact that the adoption of FASB No. 141(R) will have on its financial position and results of operations. FASB Statement No. 160 (“FASB No. 160”), Noncontrolling Interests in Consolidated Financial Statements — an Amendment of ARB No. 51 In December 2007, the FASB issued No. 160, which establishes and expands accounting and reporting standards for minority interests, which will be recharacterized as noncontrolling interests, in a subsidiary and the deconsolidation of a subsidiary. FASB 160 is effective for business combinations for which the acquisition date is on or after the beginning of the first annual reporting period beginning on or after December 15, 2008. This statement is effective for fiscal years beginning on or after December 15, 2008. The Company is currently assessing the potential impact that the adoption of FASB No. 160 will have on its financial position and results of operations.

106
20. CONDENSED QUARTERLY FINANCIAL INFORMATION (unaudited) The following summarizes the condensed quarterly financial information for the Company: (dollars in thousands) Quarter Ended 2007: December 31 September 30 June 30 March 31 Total revenues $201,682 $212,881 $200,530 $193,257 Operating and other expenses 67,281 71,462 66,529 65,641 Direct construction costs 19,155 22,479 22,634 20,911 General and administrative 14,811 13,411 12,870 11,070 Depreciation and amortization 48,500 49,790 43,823 41,451 Total expenses 149,747 157,142 145,856 139,073 Operating Income 51,935 55,739 54,674 54,184 Interest expense (32,240) (32,163) (31,333) (30,936) Interest and other investment income 497 985 1,571 1,617 Equity in earnings (loss) of unconsolidated joint ventures (432) (1,559) (1,696) (2,231) Minority interest in consolidated joint ventures 151 51 214 227 Gain on sale of investment in marketable securities -- -- -- -- Gain on sale of investment in unconsolidated joint ventures -- -- -- -- Gain/(loss) on sale of land and other assets -- -- -- -- Total other (expense) income (32,024) (32,686) (31,244) (31,323) Income from continuing operations before minority interest in Operating Partnership 19,911 23,053 23,430 22,861 Minority interest in Operating Partnership (3,562) (4,146) (4,197) (4,221) Income from continuing operations 16,349 18,907 19,233 18,640 Discontinued operations (net of minority interest): Income from discontinued operations -- 20 598 439 Realized gains (losses) and unrealized losses on disposition of rental property, net -- 4,533 31,747 -- Total discontinued operations, net -- 4,553 32,345 439 Net income 16,349 23,460 51,578 19,079 Preferred stock dividends (500) (500) (500) (500) Net income available to common shareholders $ 15,849 $ 22,960 $ 51,078 $ 18,579 Basic earnings per common share: Income from continuing operations $ 0.24 $ 0.27 $ 0.28 $ 0.27 Discontinued operations -- 0.07 0.48 0.01 Net income available to common shareholders $ 0.24 $ 0.34 $ 0.76 $ 0.28 Diluted earnings per common share: Income from continuing operations $ 0.24 $ 0.27 $ 0.28 $ 0.27 Discontinued operations -- 0.07 0.47 0.01 Net income available to common shareholders $ 0.24 $ 0.34 $ 0.75 $ 0.28 Dividends declared per common share $ 0.64 $ 0.64 $ 0.64 $ 0.64

107
Quarter Ended 2006: December 31 September 30 June 30 March 31 Total revenues $ 196,082 $ 201,252 $ 182,789 $ 151,889 Operating and other expenses 67,134 70,895 60,256 55,382 Direct construction costs 18,454 22,569 12,579 -- General and administrative 16,280 12,173 11,846 8,775 Depreciation and amortization 43,415 39,726 39,476 36,479 Total expenses 145,283 145,363 124,157 100,636 Operating Income 50,799 55,889 58,632 51,253 Interest expense (35,390) (35,466) (33,034) (31,075) Interest and other investment income 696 514 399 1,446 Equity in earnings (loss) of unconsolidated joint ventures (200) (4,757) (846) 247 Minority interest in consolidated joint ventures 75 113 30 -- Gain on sale of investment in marketable securities -- -- -- 15,060 Gain on sale of investment in unconsolidated joint ventures 10,831 -- -- -- Gain/(loss) on sale of land and other assets (416) -- -- -- Total other (expense) income (24,404) (39,596) (33,451) (14,322) Income from continuing operations before minority interest in Operating Partnership 26,395 16,293 25,181 36,931 Minority interest in Operating Partnership (5,162) (3,169) (4,950) (6,840) Income from continuing operations 21,233 13,124 20,231 30,091 Discontinued operations (net of minority interest): Income from discontinued operations 2,897 3,387 2,982 3,006 Realized gains (losses) and unrealized losses on disposition of rental property, net 43,794 -- 3,921 -- Total discontinued operations, net 46,691 3,387 6,903 3,006 Net income 67,924 16,511 27,134 33,097 Preferred stock dividends (500) (500) (500) (500) Net income available to common shareholders $ 67,424 $ 16,011 $ 26,634 $ 32,597 Basic earnings per common share: Income from continuing operations $ 0.33 $ 0.20 $ 0.32 $ 0.48 Discontinued operations 0.75 0.06 0.11 0.04 Net income available to common shareholders $ 1.08 $ 0.26 $ 0.43 $ 0.52 Diluted earnings per common share: Income from continuing operations $ 0.32 $ 0.20 $ 0.32 $ 0.48 Discontinued operations 0.75 0.06 0.11 0.04 Net income available to common shareholders $ 1.07 $ 0.26 $ 0.43 $ 0.52 Dividends declared per common share $ 0.64 $ 0.64 $ 0.63 $ 0.63
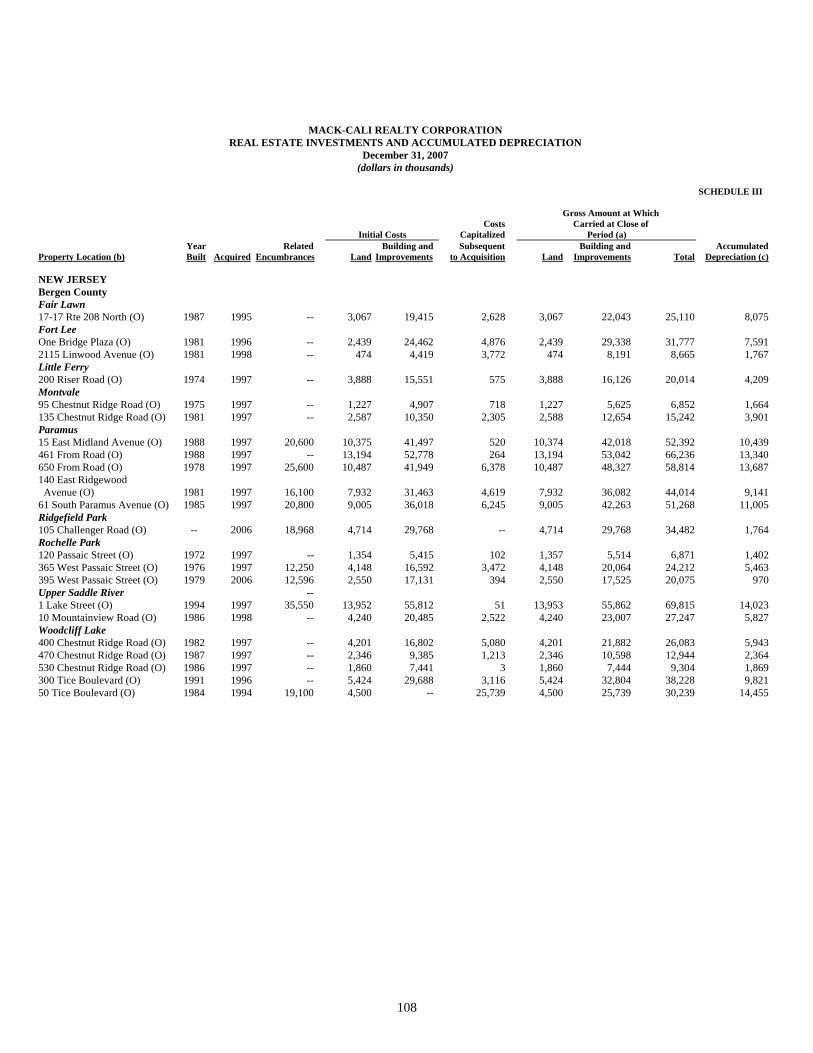
108
MACK-CALI REALTY CORPORATION REAL ESTATE INVESTMENTS AND ACCUMULATED DEPRECIATION
December 31, 2007 (dollars in thousands)
SCHEDULE III Gross Amount at Which Costs Carried at Close of Initial Costs Capitalized Period (a) Year Related Building and Subsequent Building and Accumulated Property Location (b) Built Acquired Encumbrances Land Improvements to Acquisition Land Improvements Total Depreciation (c) NEW JERSEY Bergen County Fair Lawn 17-17 Rte 208 North (O) 1987 1995 -- 3,067 19,415 2,628 3,067 22,043 25,110 8,075 Fort Lee One Bridge Plaza (O) 1981 1996 -- 2,439 24,462 4,876 2,439 29,338 31,777 7,591 2115 Linwood Avenue (O) 1981 1998 -- 474 4,419 3,772 474 8,191 8,665 1,767 Little Ferry 200 Riser Road (O) 1974 1997 -- 3,888 15,551 575 3,888 16,126 20,014 4,209 Montvale 95 Chestnut Ridge Road (O) 1975 1997 -- 1,227 4,907 718 1,227 5,625 6,852 1,664 135 Chestnut Ridge Road (O) 1981 1997 -- 2,587 10,350 2,305 2,588 12,654 15,242 3,901 Paramus 15 East Midland Avenue (O) 1988 1997 20,600 10,375 41,497 520 10,374 42,018 52,392 10,439 461 From Road (O) 1988 1997 -- 13,194 52,778 264 13,194 53,042 66,236 13,340 650 From Road (O) 1978 1997 25,600 10,487 41,949 6,378 10,487 48,327 58,814 13,687 140 East Ridgewood Avenue (O) 1981 1997 16,100 7,932 31,463 4,619 7,932 36,082 44,014 9,141 61 South Paramus Avenue (O) 1985 1997 20,800 9,005 36,018 6,245 9,005 42,263 51,268 11,005 Ridgefield Park 105 Challenger Road (O) -- 2006 18,968 4,714 29,768 -- 4,714 29,768 34,482 1,764 Rochelle Park 120 Passaic Street (O) 1972 1997 -- 1,354 5,415 102 1,357 5,514 6,871 1,402 365 West Passaic Street (O) 1976 1997 12,250 4,148 16,592 3,472 4,148 20,064 24,212 5,463 395 West Passaic Street (O) 1979 2006 12,596 2,550 17,131 394 2,550 17,525 20,075 970 Upper Saddle River -- 1 Lake Street (O) 1994 1997 35,550 13,952 55,812 51 13,953 55,862 69,815 14,023 10 Mountainview Road (O) 1986 1998 -- 4,240 20,485 2,522 4,240 23,007 27,247 5,827 Woodcliff Lake 400 Chestnut Ridge Road (O) 1982 1997 -- 4,201 16,802 5,080 4,201 21,882 26,083 5,943 470 Chestnut Ridge Road (O) 1987 1997 -- 2,346 9,385 1,213 2,346 10,598 12,944 2,364 530 Chestnut Ridge Road (O) 1986 1997 -- 1,860 7,441 3 1,860 7,444 9,304 1,869 300 Tice Boulevard (O) 1991 1996 -- 5,424 29,688 3,116 5,424 32,804 38,228 9,821 50 Tice Boulevard (O) 1984 1994 19,100 4,500 -- 25,739 4,500 25,739 30,239 14,455
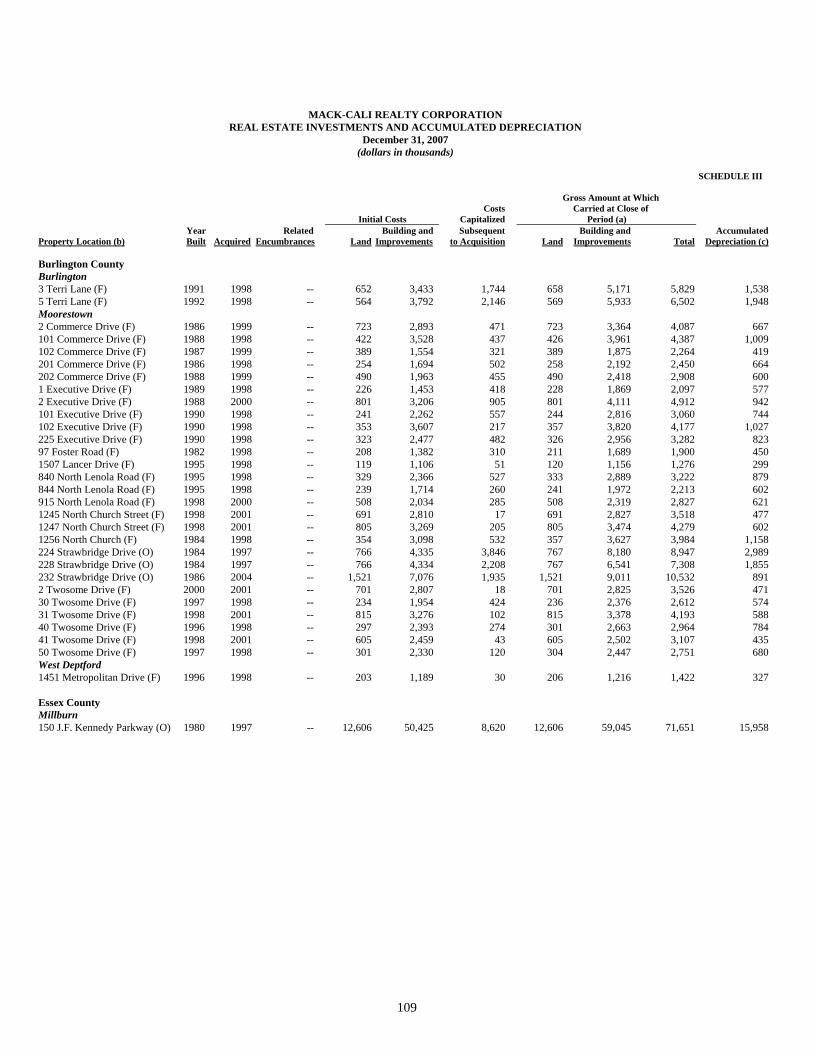
109
MACK-CALI REALTY CORPORATION
REAL ESTATE INVESTMENTS AND ACCUMULATED DEPRECIATION December 31, 2007
(dollars in thousands) SCHEDULE III Gross Amount at Which Costs Carried at Close of Initial Costs Capitalized Period (a) Year Related Building and Subsequent Building and Accumulated Property Location (b) Built Acquired Encumbrances Land Improvements to Acquisition Land Improvements Total Depreciation (c) Burlington County Burlington 3 Terri Lane (F) 1991 1998 -- 652 3,433 1,744 658 5,171 5,829 1,538 5 Terri Lane (F) 1992 1998 -- 564 3,792 2,146 569 5,933 6,502 1,948 Moorestown 2 Commerce Drive (F) 1986 1999 -- 723 2,893 471 723 3,364 4,087 667 101 Commerce Drive (F) 1988 1998 -- 422 3,528 437 426 3,961 4,387 1,009 102 Commerce Drive (F) 1987 1999 -- 389 1,554 321 389 1,875 2,264 419 201 Commerce Drive (F) 1986 1998 -- 254 1,694 502 258 2,192 2,450 664 202 Commerce Drive (F) 1988 1999 -- 490 1,963 455 490 2,418 2,908 600 1 Executive Drive (F) 1989 1998 -- 226 1,453 418 228 1,869 2,097 577 2 Executive Drive (F) 1988 2000 -- 801 3,206 905 801 4,111 4,912 942 101 Executive Drive (F) 1990 1998 -- 241 2,262 557 244 2,816 3,060 744 102 Executive Drive (F) 1990 1998 -- 353 3,607 217 357 3,820 4,177 1,027 225 Executive Drive (F) 1990 1998 -- 323 2,477 482 326 2,956 3,282 823 97 Foster Road (F) 1982 1998 -- 208 1,382 310 211 1,689 1,900 450 1507 Lancer Drive (F) 1995 1998 -- 119 1,106 51 120 1,156 1,276 299 840 North Lenola Road (F) 1995 1998 -- 329 2,366 527 333 2,889 3,222 879 844 North Lenola Road (F) 1995 1998 -- 239 1,714 260 241 1,972 2,213 602 915 North Lenola Road (F) 1998 2000 -- 508 2,034 285 508 2,319 2,827 621 1245 North Church Street (F) 1998 2001 -- 691 2,810 17 691 2,827 3,518 477 1247 North Church Street (F) 1998 2001 -- 805 3,269 205 805 3,474 4,279 602 1256 North Church (F) 1984 1998 -- 354 3,098 532 357 3,627 3,984 1,158 224 Strawbridge Drive (O) 1984 1997 -- 766 4,335 3,846 767 8,180 8,947 2,989 228 Strawbridge Drive (O) 1984 1997 -- 766 4,334 2,208 767 6,541 7,308 1,855 232 Strawbridge Drive (O) 1986 2004 -- 1,521 7,076 1,935 1,521 9,011 10,532 891 2 Twosome Drive (F) 2000 2001 -- 701 2,807 18 701 2,825 3,526 471 30 Twosome Drive (F) 1997 1998 -- 234 1,954 424 236 2,376 2,612 574 31 Twosome Drive (F) 1998 2001 -- 815 3,276 102 815 3,378 4,193 588 40 Twosome Drive (F) 1996 1998 -- 297 2,393 274 301 2,663 2,964 784 41 Twosome Drive (F) 1998 2001 -- 605 2,459 43 605 2,502 3,107 435 50 Twosome Drive (F) 1997 1998 -- 301 2,330 120 304 2,447 2,751 680 West Deptford 1451 Metropolitan Drive (F) 1996 1998 -- 203 1,189 30 206 1,216 1,422 327 Essex County Millburn 150 J.F. Kennedy Parkway (O) 1980 1997 -- 12,606 50,425 8,620 12,606 59,045 71,651 15,958

110
MACK-CALI REALTY CORPORATION
REAL ESTATE INVESTMENTS AND ACCUMULATED DEPRECIATION December 31, 2007
(dollars in thousands) SCHEDULE III Gross Amount at Which Costs Carried at Close of Initial Costs Capitalized Period (a) Year Related Building and Subsequent Building and Accumulated Property Location (b) Built Acquired Encumbrances Land Improvements to Acquisition Land Improvements Total Depreciation (c) Roseland 101 Eisenhower Parkway (O) 1980 1994 -- 228 -- 15,969 228 15,969 16,197 10,288 103 Eisenhower Parkway (O) 1985 1994 -- -- -- 14,971 2,300 12,671 14,971 7,353 105 Eisenhower Parkway (O) 2001 2001 -- 4,430 42,898 2,363 -- 49,691 49,691 10,701 Hudson County Jersey City Harborside Financial Center Plaza 1 (O) 1983 1996 -- 3,923 51,013 25,709 3,923 76,722 80,645 15,176 Harborside Financial Center Plaza 2 (O) 1990 1996 -- 17,655 101,546 16,663 15,057 120,807 135,864 34,410 Harborside Financial Center Plaza 3 (O) 1990 1996 -- 17,655 101,878 16,332 15,058 120,807 135,865 34,411 Harborside Financial Center Plaza 4A (O) 2000 2000 -- 1,244 56,144 8,722 1,244 64,866 66,110 13,574 Harborside Financial Center Plaza 5 (O) 2002 2002 -- 6,218 170,682 55,712 5,705 226,907 232,612 34,175 101 Hudson Street (O) 1992 2004 -- 45,530 271,376 4,422 45,530 275,798 321,328 27,024 Mercer County Hamilton Township 3 AAA Drive (O) 1981 2007 -- 242 3,218 346 242 3,564 3,806 54 100 Horizon Drive (F) 1989 1995 -- 205 1,676 83 172 1,792 1,964 554 200 Horizon Drive (F) 1991 1995 -- 205 3,027 213 205 3,240 3,445 1,060 300 Horizon Drive (F) 1989 1995 -- 379 4,355 1,104 379 5,459 5,838 1,834 500 Horizon Drive (F) 1990 1995 -- 379 3,395 641 344 4,071 4,415 1,353 600 Horizon Drive (F) 2002 2002 -- -- 7,549 651 685 7,515 8,200 955 700 Horizon Drive (O) 2007 2007 -- 490 43 16,990 1,355 16,168 17,523 238 2 South Gold Drive (O) 1974 2007 -- 476 3,487 25 476 3,512 3,988 58 Princeton 103 Carnegie Center (O) 1984 1996 -- 2,566 7,868 2,025 2,566 9,893 12,459 3,152 100 Overlook Center (O) 1988 1997 -- 2,378 21,754 4,468 2,378 26,222 28,600 7,108 5 Vaughn Drive (O) 1987 1995 -- 657 9,800 1,732 657 11,532 12,189 4,181 Middlesex County East Brunswick 377 Summerhill Road (O) 1977 1997 -- 649 2,594 374 649 2,968 3,617 751 Edison 343 Thornall Street (O) 1991 2006 -- 6,027 39,101 4,620 6,027 43,721 49,748 2,212 Piscataway 30 Knightsbridge Road, Building 3 (O) 1977 2004 -- 1,030 7,269 316 1,034 7,581 8,615 657 30 Knightsbridge Road, Building 4 (O) 1977 2004 -- 1,433 10,121 344 1,429 10,469 11,898 908
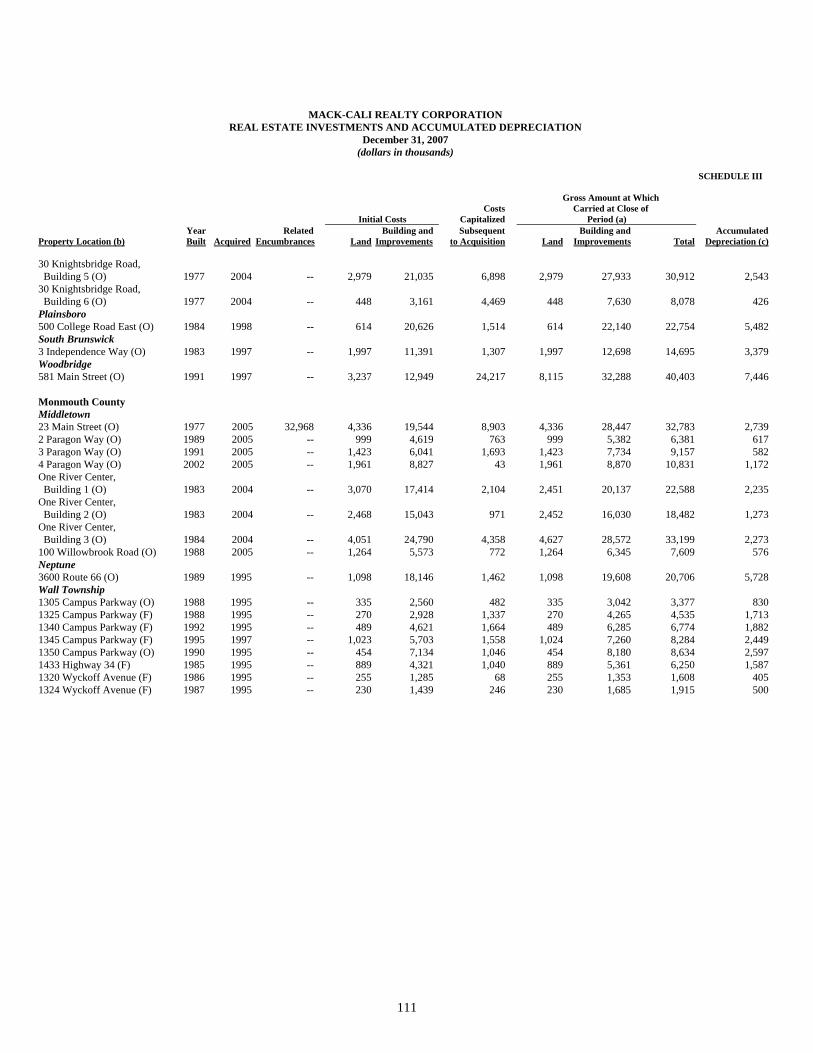
111
MACK-CALI REALTY CORPORATION
REAL ESTATE INVESTMENTS AND ACCUMULATED DEPRECIATION December 31, 2007
(dollars in thousands) SCHEDULE III Gross Amount at Which Costs Carried at Close of Initial Costs Capitalized Period (a) Year Related Building and Subsequent Building and Accumulated Property Location (b) Built Acquired Encumbrances Land Improvements to Acquisition Land Improvements Total Depreciation (c) 30 Knightsbridge Road, Building 5 (O) 1977 2004 -- 2,979 21,035 6,898 2,979 27,933 30,912 2,543 30 Knightsbridge Road, Building 6 (O) 1977 2004 -- 448 3,161 4,469 448 7,630 8,078 426 Plainsboro 500 College Road East (O) 1984 1998 -- 614 20,626 1,514 614 22,140 22,754 5,482 South Brunswick 3 Independence Way (O) 1983 1997 -- 1,997 11,391 1,307 1,997 12,698 14,695 3,379 Woodbridge 581 Main Street (O) 1991 1997 -- 3,237 12,949 24,217 8,115 32,288 40,403 7,446 Monmouth County Middletown 23 Main Street (O) 1977 2005 32,968 4,336 19,544 8,903 4,336 28,447 32,783 2,739 2 Paragon Way (O) 1989 2005 -- 999 4,619 763 999 5,382 6,381 617 3 Paragon Way (O) 1991 2005 -- 1,423 6,041 1,693 1,423 7,734 9,157 582 4 Paragon Way (O) 2002 2005 -- 1,961 8,827 43 1,961 8,870 10,831 1,172 One River Center, Building 1 (O) 1983 2004 -- 3,070 17,414 2,104 2,451 20,137 22,588 2,235 One River Center, Building 2 (O) 1983 2004 -- 2,468 15,043 971 2,452 16,030 18,482 1,273 One River Center, Building 3 (O) 1984 2004 -- 4,051 24,790 4,358 4,627 28,572 33,199 2,273 100 Willowbrook Road (O) 1988 2005 -- 1,264 5,573 772 1,264 6,345 7,609 576 Neptune 3600 Route 66 (O) 1989 1995 -- 1,098 18,146 1,462 1,098 19,608 20,706 5,728 Wall Township 1305 Campus Parkway (O) 1988 1995 -- 335 2,560 482 335 3,042 3,377 830 1325 Campus Parkway (F) 1988 1995 -- 270 2,928 1,337 270 4,265 4,535 1,713 1340 Campus Parkway (F) 1992 1995 -- 489 4,621 1,664 489 6,285 6,774 1,882 1345 Campus Parkway (F) 1995 1997 -- 1,023 5,703 1,558 1,024 7,260 8,284 2,449 1350 Campus Parkway (O) 1990 1995 -- 454 7,134 1,046 454 8,180 8,634 2,597 1433 Highway 34 (F) 1985 1995 -- 889 4,321 1,040 889 5,361 6,250 1,587 1320 Wyckoff Avenue (F) 1986 1995 -- 255 1,285 68 255 1,353 1,608 405 1324 Wyckoff Avenue (F) 1987 1995 -- 230 1,439 246 230 1,685 1,915 500

112
MACK-CALI REALTY CORPORATION
REAL ESTATE INVESTMENTS AND ACCUMULATED DEPRECIATION December 31, 2007
(dollars in thousands) SCHEDULE III Gross Amount at Which Costs Carried at Close of Initial Costs Capitalized Period (a) Year Related Building and Subsequent Building and Accumulated Property Location (b) Built Acquired Encumbrances Land Improvements to Acquisition Land Improvements Total Depreciation (c) Morris County Florham Park 325 Columbia Parkway (O) 1987 1994 -- 1,564 -- 14,847 1,564 14,847 16,411 7,400 Morris Plains 250 Johnson Road (O) 1977 1997 -- 2,004 8,016 1,175 2,004 9,191 11,195 2,354 201 Littleton Road (O) 1979 1997 -- 2,407 9,627 1,096 2,407 10,723 13,130 2,916 Morris Township 412 Mt. Kemble Avenue (O) 1985 2004 -- 4,360 33,167 5,884 4,360 39,051 43,411 3,286 Parsippany 4 Campus Drive (O) 1983 2001 -- 5,213 20,984 1,665 5,213 22,649 27,862 4,160 6 Campus Drive (O) 1983 2001 -- 4,411 17,796 2,604 4,411 20,400 24,811 3,927 7 Campus Drive (O) 1982 1998 -- 1,932 27,788 2,176 1,932 29,964 31,896 6,893 8 Campus Drive (O) 1987 1998 -- 1,865 35,456 4,123 1,865 39,579 41,444 10,685 9 Campus Drive (O) 1983 2001 -- 3,277 11,796 17,370 5,842 26,601 32,443 6,710 4 Century Drive (O) 1981 2004 -- 1,787 9,575 1,067 1,787 10,642 12,429 974 5 Century Drive (O) 1981 2004 -- 1,762 9,341 446 1,762 9,787 11,549 718 6 Century Drive (O) 1981 2004 -- 1,289 6,848 2,596 1,289 9,444 10,733 946 2 Dryden Way (O) 1990 1998 -- 778 420 110 778 530 1,308 116 4 Gatehall Drive (O) 1988 2000 -- 8,452 33,929 3,810 8,452 37,739 46,191 7,630 2 Hilton Court (O) 1991 1998 -- 1,971 32,007 3,069 1,971 35,076 37,047 9,201 1633 Littleton Road (O) 1978 2002 -- 2,283 9,550 163 2,355 9,641 11,996 1,807 600 Parsippany Road (O) 1978 1994 -- 1,257 5,594 3,128 1,257 8,722 9,979 2,954 1 Sylvan Way (O) 1989 1998 -- 1,689 24,699 394 1,021 25,761 26,782 7,794 5 Sylvan Way (O) 1989 1998 -- 1,160 25,214 2,250 1,161 27,463 28,624 7,037 7 Sylvan Way (O) 1987 1998 -- 2,084 26,083 2,092 2,084 28,175 30,259 7,521 35 Waterview Boulevard (O) 1990 2006 20,104 5,133 28,059 605 5,133 28,664 33,797 1,762 5 Wood Hollow Road (O) 1979 2004 -- 5,302 26,488 12,578 5,302 39,066 44,368 3,592 Passaic County Clifton 777 Passaic Avenue (O) 1983 1994 -- -- -- 6,981 1,100 5,881 6,981 3,147 Totowa 1 Center Court (F) 1999 1999 -- 270 1,824 627 270 2,451 2,721 971 2 Center Court (F) 1998 1998 -- 191 -- 2,255 191 2,255 2,446 519 11 Commerce Way (F) 1989 1995 -- 586 2,986 95 586 3,081 3,667 960 20 Commerce Way (F) 1992 1995 -- 516 3,108 81 516 3,189 3,705 978 29 Commerce Way (F) 1990 1995 -- 586 3,092 950 586 4,042 4,628 1,467 40 Commerce Way (F) 1987 1995 -- 516 3,260 85 516 3,345 3,861 1,012 45 Commerce Way (F) 1992 1995 -- 536 3,379 515 536 3,894 4,430 1,192 60 Commerce Way (F) 1988 1995 -- 526 3,257 431 526 3,688 4,214 1,231

113
MACK-CALI REALTY CORPORATION
REAL ESTATE INVESTMENTS AND ACCUMULATED DEPRECIATION December 31, 2007
(dollars in thousands) SCHEDULE III Gross Amount at Which Costs Carried at Close of Initial Costs Capitalized Period (a) Year Related Building and Subsequent Building and Accumulated Property Location (b) Built Acquired Encumbrances Land Improvements to Acquisition Land Improvements Total Depreciation (c) 80 Commerce Way (F) 1996 1996 -- 227 -- 1,513 453 1,287 1,740 480 100 Commerce Way (F) 1996 1996 -- 226 -- 1,060 -- 1,286 1,286 480 120 Commerce Way (F) 1994 1995 -- 228 -- 1,574 457 1,345 1,802 414 140 Commerce Way (F) 1994 1995 -- 229 -- 1,016 -- 1,245 1,245 414 999 Riverview Drive (O) 1988 1995 -- 476 6,024 626 476 6,650 7,126 2,143 Somerset County Basking Ridge 106 Allen Road (O) 2000 2000 -- 3,853 14,465 3,806 4,093 18,031 22,124 5,407 222 Mt. Airy Road (O) 1986 1996 -- 775 3,636 2,162 775 5,798 6,573 1,461 233 Mt. Airy Road (O) 1987 1996 -- 1,034 5,033 1,646 1,034 6,679 7,713 2,384 Bridgewater 721 Route 202/206 (O) 1989 1997 -- 6,730 26,919 8,278 6,730 35,197 41,927 7,094 Union County Clark 100 Walnut Avenue (O) 1985 1994 -- -- -- 16,750 1,822 14,928 16,750 8,494 Cranford 6 Commerce Drive (O) 1973 1994 -- 250 -- 2,948 250 2,948 3,198 1,895 11 Commerce Drive (O) 1981 1994 -- 470 -- 5,749 470 5,749 6,219 3,559 12 Commerce Drive (O) 1967 1997 -- 887 3,549 1,851 887 5,400 6,287 1,723 14 Commerce Drive (O) 1971 2003 -- 1,283 6,344 49 1,283 6,393 7,676 683 20 Commerce Drive (O) 1990 1994 -- 2,346 -- 20,714 2,346 20,714 23,060 8,425 25 Commerce Drive (O) 1971 2002 -- 1,520 6,186 320 1,520 6,506 8,026 1,651 65 Jackson Drive (O) 1984 1994 -- 541 -- 6,374 542 6,373 6,915 3,367 New Providence 890 Mountain Road (O) 1977 1997 -- 2,796 11,185 5,021 3,765 15,237 19,002 3,803 NEW YORK New York County New York 125 Broad Street (O) 1970 2007 50,191 207,002 7,309 50,191 214,311 264,502 4,135 Rockland County Suffern 400 Rella Boulevard (O) 1988 1995 -- 1,090 13,412 3,019 1,090 16,431 17,521 5,836 Westchester County Elmsford 11 Clearbrook Road (F) 1974 1997 -- 149 2,159 425 149 2,584 2,733 699 75 Clearbrook Road (F) 1990 1997 -- 2,314 4,716 107 2,314 4,823 7,137 1,306 100 Clearbrook Road (O) 1975 1997 -- 220 5,366 1,262 220 6,628 6,848 1,893 125 Clearbrook Road (F) 2002 2002 -- 1,055 3,676 (51) 1,055 3,625 4,680 931 150 Clearbrook Road (F) 1975 1997 -- 497 7,030 1,198 497 8,228 8,725 2,241

114
MACK-CALI REALTY CORPORATION
REAL ESTATE INVESTMENTS AND ACCUMULATED DEPRECIATION December 31, 2007
(dollars in thousands) SCHEDULE III Gross Amount at Which Costs Carried at Close of Initial Costs Capitalized Period (a) Year Related Building and Subsequent Building and Accumulated Property Location (b) Built Acquired Encumbrances Land Improvements to Acquisition Land Improvements Total Depreciation (c) 175 Clearbrook Road (F) 1973 1997 -- 655 7,473 907 655 8,380 9,035 2,444 200 Clearbrook Road (F) 1974 1997 -- 579 6,620 1,031 579 7,651 8,230 2,273 250 Clearbrook Road (F) 1973 1997 -- 867 8,647 1,476 867 10,123 10,990 2,927 50 Executive Boulevard (F) 1969 1997 -- 237 2,617 235 237 2,852 3,089 749 77 Executive Boulevard (F) 1977 1997 -- 34 1,104 154 34 1,258 1,292 374 85 Executive Boulevard (F) 1968 1997 -- 155 2,507 539 155 3,046 3,201 798 101 Executive Boulevard (O) 1971 1997 -- 267 5,838 868 267 6,706 6,973 1,884 300 Executive Boulevard (F) 1970 1997 -- 460 3,609 322 460 3,931 4,391 1,058 350 Executive Boulevard (F) 1970 1997 -- 100 1,793 153 100 1,946 2,046 618 399 Executive Boulevard (F) 1962 1997 -- 531 7,191 62 531 7,253 7,784 1,977 400 Executive Boulevard (F) 1970 1997 -- 2,202 1,846 450 2,202 2,296 4,498 783 500 Executive Boulevard (F) 1970 1997 -- 258 4,183 781 258 4,964 5,222 1,563 525 Executive Boulevard (F) 1972 1997 -- 345 5,499 724 345 6,223 6,568 1,856 700 Executive Boulevard (L) N/A 1997 -- 970 -- -- 970 -- 970 -- 3 Odell Plaza (O) 1984 2003 -- 1,322 4,777 2,100 1,322 6,877 8,199 1,061 5 Skyline Drive (F) 1980 2001 -- 2,219 8,916 1,555 2,219 10,471 12,690 2,157 6 Skyline Drive (F) 1980 2001 -- 740 2,971 24 740 2,995 3,735 949 555 Taxter Road (O) 1986 2000 -- 4,285 17,205 5,603 4,285 22,808 27,093 4,980 565 Taxter Road (O) 1988 2000 -- 4,285 17,205 3,580 4,233 20,837 25,070 4,620 570 Taxter Road (O) 1972 1997 -- 438 6,078 951 438 7,029 7,467 2,208 1 Warehouse Lane (I) 1957 1997 -- 3 268 234 3 502 505 124 2 Warehouse Lane (I) 1957 1997 -- 4 672 188 4 860 864 309 3 Warehouse Lane (I) 1957 1997 -- 21 1,948 526 21 2,474 2,495 784 4 Warehouse Lane (I) 1957 1997 -- 84 13,393 2,704 85 16,096 16,181 4,435 5 Warehouse Lane (I) 1957 1997 -- 19 4,804 1,436 19 6,240 6,259 1,703 6 Warehouse Lane (I) 1982 1997 -- 10 4,419 328 10 4,747 4,757 1,279 1 Westchester Plaza (F) 1967 1997 -- 199 2,023 187 199 2,210 2,409 618 2 Westchester Plaza (F) 1968 1997 -- 234 2,726 226 234 2,952 3,186 805 3 Westchester Plaza (F) 1969 1997 -- 655 7,936 527 655 8,463 9,118 2,415 4 Westchester Plaza (F) 1969 1997 -- 320 3,729 404 320 4,133 4,453 1,083 5 Westchester Plaza (F) 1969 1997 -- 118 1,949 200 118 2,149 2,267 691 6 Westchester Plaza (F) 1968 1997 -- 164 1,998 226 164 2,224 2,388 691 7 Westchester Plaza (F) 1972 1997 -- 286 4,321 214 286 4,535 4,821 1,237 8 Westchester Plaza (F) 1971 1997 -- 447 5,262 995 447 6,257 6,704 1,675 Hawthorne 200 Saw Mill River Road (F) 1965 1997 -- 353 3,353 487 353 3,840 4,193 1,105 1 Skyline Drive (O) 1980 1997 -- 66 1,711 301 66 2,012 2,078 571 2 Skyline Drive (O) 1987 1997 -- 109 3,128 471 109 3,599 3,708 1,154 4 Skyline Drive (F) 1987 1997 -- 363 7,513 1,738 363 9,251 9,614 2,615 7 Skyline Drive (O) 1987 1998 -- 330 13,013 1,440 330 14,453 14,783 3,706

115
MACK-CALI REALTY CORPORATION
REAL ESTATE INVESTMENTS AND ACCUMULATED DEPRECIATION December 31, 2007
(dollars in thousands) SCHEDULE III Gross Amount at Which Costs Carried at Close of Initial Costs Capitalized Period (a) Year Related Building and Subsequent Building and Accumulated Property Location (b) Built Acquired Encumbrances Land Improvements to Acquisition Land Improvements Total Depreciation (c) 8 Skyline Drive (F) 1985 1997 -- 212 4,410 1,967 212 6,377 6,589 2,251 10 Skyline Drive (F) 1985 1997 -- 134 2,799 605 134 3,404 3,538 830 11 Skyline Drive (F) 1989 1997 -- -- 4,788 430 -- 5,218 5,218 1,580 12 Skyline Drive (F) 1999 1999 -- 1,562 3,254 1,142 1,320 4,638 5,958 1,536 14 Skyline Drive (L) N/A 2002 -- 964 16 980 -- 980 -- 15 Skyline Drive (F) 1989 1997 -- -- 7,449 344 7,793 7,793 2,233 16 Skyline Drive (L) N/A 2002 -- 850 -- 31 881 -- 881 -- 17 Skyline Drive (O) 1989 1997 -- -- 7,269 776 -- 8,045 8,045 2,051 19 Skyline Drive (O) 1982 1997 -- 2,355 34,254 3,536 2,356 37,789 40,145 12,185 Tarrytown 200 White Plains Road (O) 1982 1997 -- 378 8,367 1,258 378 9,625 10,003 2,666 220 White Plains Road (O) 1984 1997 -- 367 8,112 1,246 367 9,358 9,725 2,591 230 White Plains Road (R) 1984 1997 -- 124 1,845 107 124 1,952 2,076 508 White Plains 1 Barker Avenue (O) 1975 1997 -- 208 9,629 1,145 207 10,775 10,982 3,074 3 Barker Avenue (O) 1983 1997 -- 122 7,864 2,003 122 9,867 9,989 3,071 50 Main Street (O) 1985 1997 -- 564 48,105 7,642 564 55,747 56,311 16,029 11 Martine Avenue (O) 1987 1997 -- 127 26,833 4,896 127 31,729 31,856 9,740 1 Water Street (O) 1979 1997 -- 211 5,382 1,177 211 6,559 6,770 1,906 Yonkers 100 Corporate Boulevard (F) 1987 1997 -- 602 9,910 870 602 10,780 11,382 3,152 200 Corporate Boulevard South (F) 1990 1997 -- 502 7,575 456 502 8,031 8,533 2,146 250 Corporate Boulevard South (L) N/A 2002 -- 1,028 -- 255 1,139 144 1,283 1 Enterprise Boulevard (L) N/A 1997 -- 1,379 -- 1 1,380 -- 1,380 -- 1 Executive Boulevard (O) 1982 1997 -- 1,104 11,904 2,021 1,105 13,924 15,029 4,055 2 Executive Plaza (R) 1986 1997 -- 89 2,439 3 89 2,442 2,531 666 3 Executive Plaza (O) 1987 1997 -- 385 6,256 1,728 385 7,984 8,369 2,753 4 Executive Plaza (F) 1986 1997 -- 584 6,134 1,859 584 7,993 8,577 2,348 6 Executive Plaza (F) 1987 1997 -- 546 7,246 384 546 7,630 8,176 2,119 1 Odell Plaza (F) 1980 1997 -- 1,206 6,815 880 1,206 7,695 8,901 2,100 5 Odell Plaza (F) 1983 1997 -- 331 2,988 270 331 3,258 3,589 902 7 Odell Plaza (F) 1984 1997 -- 419 4,418 470 419 4,888 5,307 1,307 PENNSYLVANIA Chester County Berwyn 1000 Westlakes Drive (O) 1989 1997 -- 619 9,016 570 619 9,586 10,205 2,768 1055 Westlakes Drive (O) 1990 1997 -- 1,951 19,046 4,218 1,951 23,264 25,215 7,164

116
MACK-CALI REALTY CORPORATION
REAL ESTATE INVESTMENTS AND ACCUMULATED DEPRECIATION December 31, 2007
(dollars in thousands) SCHEDULE III Gross Amount at Which Costs Carried at Close of Initial Costs Capitalized Period (a) Year Related Building and Subsequent Building and Accumulated Property Location (b) Built Acquired Encumbrances Land Improvements to Acquisition Land Improvements Total Depreciation (c) 1205 Westlakes Drive (O) 1988 1997 -- 1,323 20,098 2,643 1,323 22,741 24,064 6,275 1235 Westlakes Drive (O) 1986 1997 -- 1,417 21,215 3,433 1,418 24,647 26,065 6,902 Delaware County Lester 100 Stevens Drive (O) 1986 1996 -- 1,349 10,018 3,154 1,349 13,172 14,521 4,101 200 Stevens Drive (O) 1987 1996 -- 1,644 20,186 4,748 1,644 24,934 26,578 7,752 300 Stevens Drive (O) 1992 1996 -- 491 9,490 1,919 491 11,409 11,900 3,683 Media 1400 Providence Rd, Center I (O) 1986 1996 -- 1,042 9,054 2,457 1,042 11,511 12,553 3,724 1400 Providence Rd, Center II (O) 1990 1996 -- 1,543 16,464 3,138 1,544 19,601 21,145 6,455 Montgomery County Bala Cynwyd 150 Monument Road (O) 1981 2004 -- 2,845 14,780 3,352 2,845 18,132 20,977 1,455 Blue Bell 4 Sentry Parkway (O) 1982 2003 -- 1,749 7,721 189 1,749 7,910 9,659 854 16 Sentry Parkway (O) 1988 2002 -- 3,377 13,511 1,344 3,377 14,855 18,232 3,138 18 Sentry Parkway (O) 1988 2002 -- 3,515 14,062 1,544 3,515 15,606 19,121 3,172 King of Prussia 2200 Renaissance Blvd (O) 1985 2002 22,034 5,347 21,453 2,696 5,347 24,149 29,496 5,709 Lower Providence 1000 Madison Avenue (O) 1990 1997 -- 1,713 12,559 2,539 1,714 15,097 16,811 3,887 Plymouth Meeting 1150 Plymouth Meeting Mall (O) 1970 1997 -- 125 499 31,117 6,219 25,522 31,741 6,973 Five Sentry Parkway East (O) 1984 1996 -- 642 7,992 1,306 642 9,298 9,940 2,419 Five Sentry Parkway West (O) 1984 1996 -- 268 3,334 543 268 3,877 4,145 957 CONNETICUT Fairfield County Norwalk 40 Richards Avenue (O) 1985 1998 -- 1,087 18,399 3,363 1,087 21,762 22,849 5,213 Stamford 1266 East Main Street (O) 1984 2002 17,575 6,638 26,567 3,565 6,638 30,132 36,770 5,499

117
MACK-CALI REALTY CORPORATION
REAL ESTATE INVESTMENTS AND ACCUMULATED DEPRECIATION December 31, 2007
(dollars in thousands) SCHEDULE III Gross Amount at Which Costs Carried at Close of Initial Costs Capitalized Period (a) Year Related Building and Subsequent Building and Accumulated Property Location (b) Built Acquired Encumbrances Land Improvements to Acquisition Land Improvements Total Depreciation (c) 419 West Avenue (F) 1986 1997 -- 4,538 9,246 1,241 4,538 10,487 15,025 3,131 500 West Avenue (F) 1988 1997 -- 415 1,679 165 415 1,844 2,259 564 550 West Avenue (F) 1990 1997 -- 1,975 3,856 59 1,975 3,915 5,890 1,057 600 West Avenue (F) 1999 1999 -- 2,305 2,863 839 2,305 3,702 6,007 761 650 West Avenue (F) 1998 1998 -- 1,328 -- 4,260 1,328 4,260 5,588 1,690 DISTRICT OF COLUMBIA Washington, 1201 Connecticut Avenue, NW (O) 1940 1999 -- 14,228 18,571 3,153 14,228 21,724 35,952 4,773 1400 L Street, NW (O) 1987 1998 -- 13,054 27,423 6,441 13,054 33,864 46,918 7,570 MARYLAND Prince George’s County Greenbelt 9200 Edmonston Road (O) 1973/03 2006 5,096 1,547 4,131 51 1,547 4,182 5,729 327 6301 Ivy Lane (O) 1979/95 2006 6,655 5,168 14,706 360 5,168 15,066 20,234 1,130 6303 Ivy Lane (O) 1980/03 2006 -- 5,115 13,860 155 5,115 14,015 19,130 1,016 6305 Ivy Lane (O) 1982/95 2006 7,098 5,615 14,420 389 5,615 14,809 20,424 1,163 6404 Ivy Lane (O) 1987 2006 13,029 7,578 20,785 462 7,578 21,247 28,825 1,860 6406 Ivy Lane (O) 1991 2006 -- 7,514 21,152 145 7,514 21,297 28,811 1,349 6411 Ivy Lane (O) 1984/05 2006 -- 6,867 17,470 337 6,867 17,807 24,674 1,393 Lanham 4200 Parliament Place (O) 1989 1998 -- 2,114 13,546 626 1,393 14,893 16,286 4,227 Projects Under Development and Developable Land -- 122,796 17,949 -- 122,796 17,949 140,745 297 Furniture, Fixtures and Equipment -- -- -- 8,956 -- 8,956 8,956 6,810 TOTALS 306,123 716,382 3,436,947 732,100 726,253 4,159,176 4,885,429 907,013 (a) The aggregate cost for federal income tax purposes at December 31, 2007 was approximately $3.0 billion.
(b) Legend of Property Codes:
(O)=Office Property (R)=Stand-alone Retail Property (F)=Office/Flex Property (L)=Land Lease (I)=Industrial/Warehouse Property
(c) Depreciation of the buildings and improvements are calculated over lives ranging from the life of the lease to 40 years.

118
MACK-CALI REALTY CORPORATION NOTE TO SCHEDULE III
Changes in rental properties and accumulated depreciation for the periods ended December 31, 2007, 2006 and 2005 are as follows: (dollars in thousands) 2007 2006 2005 Rental Properties Balance at beginning of year $4,573,587 $4,491,752 $4,160,959 Additions 372,793 405,883 485,680 Properties sold (47,394) (313,345) (120,755) Retirements/disposals (19,488) (10,703) (34,132) Balance at end of year $4,879,498 $4,573,587 $4,491,752 Accumulated Depreciation Balance at beginning of year $ 796,793 $ 722,980 $ 641,626 Depreciation expense 140,240 131,848 128,814 Properties sold (11,224) (53,037) (16,691) Retirements/disposals (18,796) (4,998) (30,769) Balance at end of year $ 907,013 $ 796,793 $ 722,980

119
MACK-CALI REALTY CORPORATION
Signatures Pursuant to the requirements of Section 13 or 15(d) of the Securities Exchange Act of 1934, the Registrant has duly caused this report to be signed on its behalf by the undersigned thereunto duly authorized.
Mack-Cali Realty Corporation (Registrant)
Date: February 13, 2008 /s/ BARRY LEFKOWITZ
Barry Lefkowitz Executive Vice President and Chief Financial Officer
Pursuant to the requirements of the Securities Exchange Act of 1934, this report has been signed below by the following persons on behalf of the Registrant and in the capacities and on the dates indicated: Name Title Date /S/ WILLIAM L. MACK Chairman of the Board February 13, 2008 William L. Mack /S/ MITCHELL E. HERSH President and Chief Executive February 13, 2008 Mitchell E. Hersh Officer and Director /S/ BARRY LEFKOWITZ Executive Vice President and February 13, 2008 Barry Lefkowitz Chief Financial Officer /S/ MARTIN S. BERGER Director February 13, 2008 Martin S. Berger /S/ ALAN S. BERNIKOW Director February 13, 2008 Alan S. Bernikow /S/ JOHN R. CALI Director February 13, 2008 John R. Cali /S/ KENNETH M. DUBERSTEIN Director February 13, 2008 Kenneth M. Duberstein

120
Name Title Date /S/ NATHAN GANTCHER Director February 13, 2008 Nathan Gantcher /S/ DAVID S. MACK Director February 13, 2008 David S. Mack /S/ ALAN G. PHILIBOSIAN Director February 13, 2008 Alan G. Philibosian /S/ IRVIN D. REID Director February 13, 2008 Irvin D. Reid /S/ VINCENT TESE Director February 13, 2008 Vincent Tese /S/ ROY J. ZUCKERBERG Director February 13, 2008 Roy J. Zuckerberg

121
MACK-CALI REALTY CORPORATION
EXHIBIT INDEX Exhibit Number Exhibit Title
3.1
Restated Charter of Mack-Cali Realty Corporation dated June 11, 2001 (filed as Exhibit 3.1 to the Company’s Form 10-Q dated June 30, 2001 and incorporated herein by reference).
3.2
Amended and Restated Bylaws of Mack-Cali Realty Corporation dated June 10, 1999 (filed as Exhibit 3.2 to the Company’s Form 8-K dated June 10, 1999 and incorporated herein by reference).
3.3
Amendment No. 1 to the Amended and Restated Bylaws of Mack-Cali Realty Corporation dated March 4, 2003, (filed as Exhibit 3.3 to the Company’s Form 10-Q dated March 31, 2003 and incorporated herein by reference).
3.4
Amendment No. 2 to the Mack-Cali Realty Corporation Amended and Restated Bylaws dated May 24, 2006 (filed as Exhibit 3.1 to the Company’s Form 8-K dated May 24, 2006 and incorporated herein by reference).
3.5
Second Amended and Restated Agreement of Limited Partnership of Mack-Cali Realty, L.P. dated December 11, 1997 (filed as Exhibit 10.110 to the Company’s Form 8-K dated December 11, 1997 and incorporated herein by reference).
3.6
Amendment No. 1 to the Second Amended and Restated Agreement of Limited Partnership of Mack-Cali Realty, L.P. dated August 21, 1998 (filed as Exhibit 3.1 to the Company’s and the Operating Partnership’s Registration Statement on Form S-3, Registration No. 333-57103, and incorporated herein by reference).
3.7
Second Amendment to the Second Amended and Restated Agreement of Limited Partnership of Mack-Cali Realty, L.P. dated July 6, 1999 (filed as Exhibit 10.1 to the Company’s Form 8-K dated July 6, 1999 and incorporated herein by reference).
3.8
Third Amendment to the Second Amended and Restated Agreement of Limited Partnership of Mack-Cali Realty, L.P. dated September 30, 2003 (filed as Exhibit 3.7 to the Company’s Form 10-Q dated September 30, 2003 and incorporated herein by reference).
3.9
Certificate of Designation of Series B Preferred Operating Partnership Units of Limited Partnership Interest of Mack-Cali Realty, L.P. (filed as Exhibit 10.101 to the Company’s Form 8-K dated December 11, 1997 and incorporated herein by reference).
3.10
Articles Supplementary for the 8% Series C Cumulative Redeemable Perpetual Preferred Stock dated March 11, 2003 (filed as Exhibit 3.1 to the Company’s Form 8-K dated March 14, 2003 and incorporated herein by reference).
3.11
Certificate of Designation for the 8% Series C Cumulative Redeemable Perpetual Preferred Operating Partnership Units dated March 14, 2003 (filed as Exhibit 3.2 to the Company’s Form 8-K dated March 14, 2003 and incorporated herein by reference).

122
Exhibit Number Exhibit Title
4.1
Amended and Restated Shareholder Rights Agreement, dated as of March 7, 2000, between Mack-Cali Realty Corporation and EquiServe Trust Company, N.A., as Rights Agent (filed as Exhibit 4.1 to the Company’s Form 8-K dated March 7, 2000 and incorporated herein by reference).
4.2
Amendment No. 1 to the Amended and Restated Shareholder Rights Agreement, dated as of June 27, 2000, by and among Mack-Cali Realty Corporation and EquiServe Trust Company, N.A. (filed as Exhibit 4.1 to the Company’s Form 8-K dated June 27, 2000 and incorporated herein by reference).
4.3
Indenture dated as of March 16, 1999, by and among Mack-Cali Realty, L.P., as issuer, Mack-Cali Realty Corporation, as guarantor, and Wilmington Trust Company, as trustee (filed as Exhibit 4.1 to the Operating Partnership’s Form 8-K dated March 16, 1999 and incorporated herein by reference).
4.4
Supplemental Indenture No. 1 dated as of March 16, 1999, by and among Mack-Cali Realty, L.P., as issuer, and Wilmington Trust Company, as trustee (filed as Exhibit 4.2 to the Operating Partnership’s Form 8-K dated March 16, 1999 and incorporated herein by reference).
4.5
Supplemental Indenture No. 2 dated as of August 2, 1999, by and among Mack-Cali Realty, L.P., as issuer, and Wilmington Trust Company, as trustee (filed as Exhibit 4.4 to the Operating Partnership’s Form 10-Q dated June 30, 1999 and incorporated herein by reference).
4.6
Supplemental Indenture No. 3 dated as of December 21, 2000, by and among Mack-Cali Realty, L.P., as issuer, and Wilmington Trust Company, as trustee (filed as Exhibit 4.2 to the Operating Partnership’s Form 8-K dated December 21, 2000 and incorporated herein by reference).
4.7
Supplemental Indenture No. 4 dated as of January 29, 2001, by and among Mack-Cali Realty, L.P., as issuer, and Wilmington Trust Company, as trustee (filed as Exhibit 4.2 to the Operating Partnership’s Form 8-K dated January 29, 2001 and incorporated herein by reference).
4.8
Supplemental Indenture No. 5 dated as of December 20, 2002, by and between Mack-Cali Realty, L.P., as issuer, and Wilmington Trust Company, as trustee (filed as Exhibit 4.2 to the Operating Partnership’s Form 8-K dated December 20, 2002 and incorporated herein by reference).
4.9
Supplemental Indenture No. 6 dated as of March 14, 2003, by and between Mack-Cali Realty, L.P., as issuer, and Wilmington Trust Company, as trustee (filed as Exhibit 4.2 to the Company’s Form 8-K dated March 14, 2003 and incorporated herein by reference).
4.10
Supplemental Indenture No. 7 dated as of June 12, 2003, by and between Mack-Cali Realty, L.P., as issuer, and Wilmington Trust Company, as trustee (filed as Exhibit 4.2 to the Company’s Form 8-K dated June 12, 2003 and incorporated herein by reference).
4.11
Supplemental Indenture No. 8 dated as of February 9, 2004, by and between Mack-Cali Realty, L.P., as issuer, and Wilmington Trust Company, as trustee (filed as Exhibit 4.2 to the Company’s Form 8-K dated February 9, 2004 and incorporated herein by reference).

123
Exhibit Number Exhibit Title
4.12
Supplemental Indenture No. 9 dated as of March 22, 2004, by and between Mack-Cali Realty, L.P., as issuer, and Wilmington Trust Company, as trustee (filed as Exhibit 4.2 to the Company’s Form 8-K dated March 22, 2004 and incorporated herein by reference).
4.13
Supplemental Indenture No. 10 dated as of January 25, 2005, by and between Mack-Cali Realty, L.P., as issuer, and Wilmington Trust Company, as trustee (filed as Exhibit 4.2 to the Company’s Form 8-K dated January 25, 2005 and incorporated herein by reference).
4.14
Supplemental Indenture No. 11 dated as of April 15, 2005, by and between Mack-Cali Realty, L.P., as issuer, and Wilmington Trust Company, as trustee (filed as Exhibit 4.2 to the Company’s Form 8-K dated April 15, 2005 and incorporated herein by reference).
4.15
Supplemental Indenture No. 12 dated as of November 30, 2005, by and between Mack-Cali Realty, L.P., as issuer, and Wilmington Trust Company, as trustee (filed as Exhibit 4.2 to the Company’s Form 8-K dated November 30, 2005 and incorporated herein by reference).
4.16
Supplemental Indenture No. 13 dated as of January 24, 2006, by and between Mack-Cali Realty, L.P., as issuer, and Wilmington Trust Company, as trustee (filed as Exhibit 4.2 to the Company’s Form 8-K dated January 18, 2006 and incorporated herein by reference).
4.17
Deposit Agreement dated March 14, 2003 by and among Mack-Cali Realty Corporation, EquiServe Trust Company, N.A., and the holders from time to time of the Depositary Receipts described therein (filed as Exhibit 4.1 to the Company’s Form 8-K dated March 14, 2003 and incorporated herein by reference).
10.1
Amended and Restated Employment Agreement dated as of July 1, 1999 between Mitchell E. Hersh and Mack-Cali Realty Corporation (filed as Exhibit 10.2 to the Company’s Form 10-Q dated June 30, 1999 and incorporated herein by reference).
10.2
Second Amended and Restated Employment Agreement dated as of July 1, 1999 between Barry Lefkowitz and Mack-Cali Realty Corporation (filed as Exhibit 10.6 to the Company’s Form 10-Q dated June 30, 1999 and incorporated herein by reference).
10.3
Second Amended and Restated Employment Agreement dated as of July 1, 1999 between Roger W. Thomas and Mack-Cali Realty Corporation (filed as Exhibit 10.7 to the Company’s Form 10-Q dated June 30, 1999 and incorporated herein by reference).
10.4
Employment Agreement dated as of December 5, 2000 between Michael Grossman and Mack-Cali Realty Corporation (filed as Exhibit 10.5 to the Company’s Form 10-K for the year ended December 31, 2000 and incorporated herein by reference).
10.5
Employment Agreement dated as of May 9, 2006 by and between Mark Yeager and Mack-Cali Realty Corporation (filed as Exhibit 10.15 to the Company’s Form 8-K dated May 9, 2006 and incorporated herein by reference).

124
Exhibit Number Exhibit Title
10.6
Restricted Share Award Agreement dated as of July 1, 1999 between Mitchell E. Hersh and Mack-Cali Realty Corporation (filed as Exhibit 10.8 to the Company’s Form 10-Q dated June 30, 1999 and incorporated herein by reference).
10.7
Restricted Share Award Agreement dated as of July 1, 1999 between Barry Lefkowitz and Mack-Cali Realty Corporation (filed as Exhibit 10.12 to the Company’s Form 10-Q dated June 30, 1999 and incorporated herein by reference).
10.8
Restricted Share Award Agreement dated as of July 1, 1999 between Roger W. Thomas and Mack-Cali Realty Corporation (filed as Exhibit 10.13 to the Company’s Form 10-Q dated June 30, 1999 and incorporated herein by reference).
10.9
Restricted Share Award Agreement dated as of March 12, 2001 between Roger W. Thomas and Mack-Cali Realty Corporation (filed as Exhibit 10.10 to the Company’s Form 10-Q dated March 31, 2001 and incorporated herein by reference).
10.10
Restricted Share Award Agreement dated as of March 12, 2001 between Michael Grossman and Mack-Cali Realty Corporation (filed as Exhibit 10.11 to the Company’s Form 10-Q dated March 31, 2001 and incorporated herein by reference).
10.11
Restricted Share Award Agreement effective as of January 2, 2003 by and between Mack-Cali Realty Corporation and Mitchell E. Hersh (filed as Exhibit 10.1 to the Company’s Form 8-K dated January 2, 2003 and incorporated herein by reference).
10.12
Tax Gross Up Agreement effective as of January 2, 2003 by and between Mack-Cali Realty Corporation and Mitchell E. Hersh (filed as Exhibit 10.2 to the Company’s Form 8-K dated January 2, 2003 and incorporated herein by reference).
10.13
First Amendment effective as of January 2, 2003 to the Restricted Share Award Agreement dated July 1, 1999 between Mack-Cali Realty Corporation and Mitchell E. Hersh (filed as Exhibit 10.3 to the Company’s Form 8-K dated January 2, 2003 and incorporated herein by reference).
10.14
Restricted Share Award Agreement effective as of January 2, 2003 by and between Mack-Cali Realty Corporation and Barry Lefkowitz (filed as Exhibit 10.7 to the Company’s Form 8-K dated January 2, 2003 and incorporated herein by reference).
10.15
Tax Gross Up Agreement effective as of January 2, 2003 by and between Mack-Cali Realty Corporation and Barry Lefkowitz (filed as Exhibit 10.8 to the Company’s Form 8-K dated January 2, 2003 and incorporated herein by reference).
10.16
First Amendment effective as of January 2, 2003 to the Restricted Share Award Agreement dated July 1, 1999 between Mack-Cali Realty Corporation and Barry Lefkowitz (filed as Exhibit 10.9 to the Company’s Form 8-K dated January 2, 2003 and incorporated herein by reference).

125
Exhibit Number Exhibit Title
10.17
Restricted Share Award Agreement effective as of January 2, 2003 by and between Mack-Cali Realty Corporation and Roger W. Thomas (filed as Exhibit 10.10 to the Company’s Form 8-K dated January 2, 2003 and incorporated herein by reference).
10.18
Tax Gross Up Agreement effective as of January 2, 2003 by and between Mack-Cali Realty Corporation and Roger W. Thomas (filed as Exhibit 10.11 to the Company’s Form 8-K dated January 2, 2003 and incorporated herein by reference).
10.19
First Amendment effective as of January 2, 2003 to the Restricted Share Award Agreement dated July 1, 1999 between Mack-Cali Realty Corporation and Roger W. Thomas (filed as Exhibit 10.12 to the Company’s Form 8-K dated January 2, 2003 and incorporated herein by reference).
10.20
First Amendment effective as of January 2, 2003 to the Restricted Share Award Agreement dated March 12, 2001 between Mack-Cali Realty Corporation and Roger W. Thomas (filed as Exhibit 10.13 to the Company’s Form 8-K dated January 2, 2003 and incorporated herein by reference).
10.21
Restricted Share Award Agreement effective as of January 2, 2003 by and between Mack-Cali Realty Corporation and Michael A. Grossman (filed as Exhibit 10.14 to the Company’s Form 8-K dated January 2, 2003 and incorporated herein by reference).
10.22
Tax Gross Up Agreement effective as of January 2, 2003 by and between Mack-Cali Realty Corporation and Michael A. Grossman (filed as Exhibit 10.15 to the Company’s Form 8-K dated January 2, 2003 and incorporated herein by reference).
10.23
Restricted Share Award Agreement dated December 6, 1999 by and between Mack-Cali Realty Corporation and Michael A. Grossman (filed as Exhibit 10.16 to the Company’s Form 8-K dated January 2, 2003 and incorporated herein by reference).
10.24
First Amendment effective as of January 2, 2003 to the Restricted Share Award Agreement dated December 6, 1999 between Mack-Cali Realty Corporation and Michael A. Grossman (filed as Exhibit 10.17 to the Company’s Form 8-K dated January 2, 2003 and incorporated herein by reference).
10.25
First Amendment effective as of January 2, 2003 to the Restricted Share Award Agreement dated March 12, 2001 between Mack-Cali Realty Corporation and Michael A. Grossman (filed as Exhibit 10.18 to the Company’s Form 8-K dated January 2, 2003 and incorporated herein by reference).
10.26
Restricted Share Award Agreement effective as of December 2, 2003 by and between Mack-Cali Realty Corporation and Mitchell E. Hersh (filed as Exhibit 10.1 to the Company’s Form 8-K dated December 2, 2003 and incorporated herein by reference).

126
Exhibit Number Exhibit Title
10.27
Tax Gross Up Agreement effective as of December 2, 2003 by and between Mack-Cali Realty Corporation and Mitchell E. Hersh (filed as Exhibit 10.2 to the Company’s Form 8-K dated December 2, 2003 and incorporated herein by reference).
10.28
Restricted Share Award Agreement effective as of December 2, 2003 by and between Mack-Cali Realty Corporation and Barry Lefkowitz (filed as Exhibit 10.5 to the Company’s Form 8-K dated December 2, 2003 and incorporated herein by reference).
10.29
Tax Gross Up Agreement effective as of December 2, 2003 by and between Mack-Cali Realty Corporation and Barry Lefkowitz (filed as Exhibit 10.6 to the Company’s Form 8-K dated December 2, 2003 and incorporated herein by reference).
10.30
Restricted Share Award Agreement effective as of December 2, 2003 by and between Mack-Cali Realty Corporation and Roger W. Thomas (filed as Exhibit 10.7 to the Company’s Form 8-K dated December 2, 2003 and incorporated herein by reference).
10.31
Tax Gross Up Agreement effective as of December 2, 2003 by and between Mack-Cali Realty Corporation and Roger W. Thomas (filed as Exhibit 10.8 to the Company’s Form 8-K dated December 2, 2003 and incorporated herein by reference).
10.32
Restricted Share Award Agreement effective as of December 2, 2003 by and between Mack-Cali Realty Corporation and Michael Grossman (filed as Exhibit 10.9 to the Company’s Form 8-K dated December 2, 2003 and incorporated herein by reference).
10.33
Tax Gross Up Agreement effective as of December 2, 2003 by and between Mack-Cali Realty Corporation and Michael Grossman (filed as Exhibit 10.10 to the Company’s Form 8-K dated December 2, 2003 and incorporated herein by reference).
10.34
Restricted Share Award Agreement effective December 7, 2004 by and between Mack-Cali Realty Corporation and Mitchell E. Hersh (filed as Exhibit 10.2 to the Company’s Form 8-K dated December 7, 2004 and incorporated herein by reference).
10.35
Tax Gross Up Agreement effective December 7, 2004 by and between Mack-Cali Realty Corporation and Mitchell E. Hersh (filed as Exhibit 10.3 to the Company’s Form 8-K dated December 7, 2004 and incorporated herein by reference).
10.36
Restricted Share Award Agreement effective December 7, 2004 by and between Mack-Cali Realty Corporation and Barry Lefkowitz (filed as Exhibit 10.4 to the Company’s Form 8-K dated December 7, 2004 and incorporated herein by reference).
10.37
Tax Gross Up Agreement effective December 7, 2004 by and between Mack-Cali Realty Corporation and Barry Lefkowitz (filed as Exhibit 10.5 to the Company’s Form 8-K dated December 7, 2004 and incorporated herein by reference).

127
Exhibit Number Exhibit Title
10.38
Restricted Share Award Agreement effective December 7, 2004 by and between Mack-Cali Realty Corporation and Roger W. Thomas (filed as Exhibit 10.6 to the Company’s Form 8-K dated December 7, 2004 and incorporated herein by reference).
10.39
Tax Gross Up Agreement effective December 7, 2004 by and between Mack-Cali Realty Corporation and Roger W. Thomas (filed as Exhibit 10.7 to the Company’s Form 8-K dated December 7, 2004 and incorporated herein by reference).
10.40
Restricted Share Award Agreement effective December 7, 2004 by and between Mack-Cali Realty Corporation and Michael A. Grossman (filed as Exhibit 10.8 to the Company’s Form 8-K dated December 7, 2004 and incorporated herein by reference).
10.41
Tax Gross Up Agreement effective December 7, 2004 by and between Mack-Cali Realty Corporation and Michael A. Grossman (filed as Exhibit 10.9 to the Company’s Form 8-K dated December 7, 2004 and incorporated herein by reference).
10.42
Restricted Share Award Agreement effective December 6, 2005 by and between Mack-Cali Realty Corporation and Mitchell E. Hersh (filed as Exhibit 10.2 to the Company’s Form 8-K dated December 6, 2005 and incorporated herein by reference).
10.43
Tax Gross Up Agreement effective December 6, 2005 by and between Mack-Cali Realty Corporation and Mitchell E. Hersh (filed as Exhibit 10.3 to the Company’s Form 8-K dated December 6, 2005 and incorporated herein by reference).
10.44
Restricted Share Award Agreement effective December 6, 2005 by and between Mack-Cali Realty Corporation and Barry Lefkowitz (filed as Exhibit 10.4 to the Company’s Form 8-K dated December 6, 2005 and incorporated herein by reference).
10.45
Tax Gross Up Agreement effective December 6, 2005 by and between Mack-Cali Realty Corporation and Barry Lefkowitz (filed as Exhibit 10.5 to the Company’s Form 8-K dated December 6, 2005 and incorporated herein by reference).
10.46
Restricted Share Award Agreement effective December 6, 2005 by and between Mack-Cali Realty Corporation and Roger W. Thomas (filed as Exhibit 10.6 to the Company’s Form 8-K dated December 6, 2005 and incorporated herein by reference).
10.47
Tax Gross Up Agreement effective December 6, 2005 by and between Mack-Cali Realty Corporation and Roger W. Thomas (filed as Exhibit 10.7 to the Company’s Form 8-K dated December 6, 2005 and incorporated herein by reference).
10.48
Restricted Share Award Agreement effective December 6, 2005 by and between Mack-Cali Realty Corporation and Michael A. Grossman (filed as Exhibit 10.8 to the Company’s Form 8-K dated December 6, 2005 and incorporated herein by reference).
128
Exhibit Number Exhibit Title
10.49
Tax Gross Up Agreement effective December 6, 2005 by and between Mack-Cali Realty Corporation and Michael A. Grossman (filed as Exhibit 10.9 to the Company’s Form 8-K dated December 6, 2005 and incorporated herein by reference).
10.50
Restricted Share Award Agreement by and between Mack-Cali Realty Corporation and Mark Yeager (filed as Exhibit 10.16 to the Company’s Form 8-K dated May 9, 2006 and incorporated herein by reference).
10.51
Restricted Share Award Agreement effective December 5, 2006 by and between Mack-Cali Realty Corporation and Mitchell E. Hersh (filed as Exhibit 10.1 to the Company’s Form 8-K dated December 5, 2006 and incorporated herein by reference).
10.52
Tax Gross Up Agreement effective December 5, 2006 by and between Mack-Cali Realty Corporation and Mitchell E. Hersh (filed as Exhibit 10.2 to the Company’s Form 8-K dated December 5, 2006 and incorporated herein by reference).
10.53
Restricted Share Award Agreement effective December 5, 2006 by and between Mack-Cali Realty Corporation and Mitchell E. Hersh (filed as Exhibit 10.3 to the Company’s Form 8-K dated December 5, 2006 and incorporated herein by reference).
10.54
Tax Gross Up Agreement effective December 5, 2006 by and between Mack-Cali Realty Corporation and Mitchell E. Hersh (filed as Exhibit 10.4 to the Company’s Form 8-K dated December 5, 2006 and incorporated herein by reference).
10.55
Restricted Share Award Agreement effective December 5, 2006 by and between Mack-Cali Realty Corporation and Barry Lefkowitz (filed as Exhibit 10.5 to the Company’s Form 8-K dated December 5, 2006 and incorporated herein by reference).
10.56
Tax Gross Up Agreement effective December 5, 2006 by and between Mack-Cali Realty Corporation and Barry Lefkowitz (filed as Exhibit 10.6 to the Company’s Form 8-K dated December 5, 2006 and incorporated herein by reference).
10.57
Restricted Share Award Agreement effective December 5, 2006 by and between Mack-Cali Realty Corporation and Barry Lefkowitz (filed as Exhibit 10.7 to the Company’s Form 8-K dated December 5, 2006 and incorporated herein by reference).
10.58
Tax Gross Up Agreement effective December 5, 2006 by and between Mack-Cali Realty Corporation and Barry Lefkowitz (filed as Exhibit 10.8 to the Company’s Form 8-K dated December 5, 2006 and incorporated herein by reference).

129
Exhibit Number Exhibit Title
10.59
Restricted Share Award Agreement effective December 5, 2006 by and between Mack-Cali Realty Corporation and Roger W. Thomas (filed as Exhibit 10.9 to the Company’s Form 8-K dated December 5, 2006 and incorporated herein by reference).
10.60
Tax Gross Up Agreement effective December 5, 2006 by and between Mack-Cali Realty Corporation and Roger W. Thomas (filed as Exhibit 10.10 to the Company’s Form 8-K dated December 5, 2006 and incorporated herein by reference).
10.61
Restricted Share Award Agreement effective December 5, 2006 by and between Mack-Cali Realty Corporation and Roger W. Thomas (filed as Exhibit 10.11 to the Company’s Form 8-K dated December 5, 2006 and incorporated herein by reference).
10.62
Tax Gross Up Agreement effective December 5, 2006 by and between Mack-Cali Realty Corporation and Roger W. Thomas (filed as Exhibit 10.12 to the Company’s Form 8-K dated December 5, 2006 and incorporated herein by reference).
10.63
Restricted Share Award Agreement effective December 5, 2006 by and between Mack-Cali Realty Corporation and Michael A. Grossman (filed as Exhibit 10.13 to the Company’s Form 8-K dated December 5, 2006 and incorporated herein by reference).
10.64
Tax Gross Up Agreement effective December 5, 2006 by and between Mack-Cali Realty Corporation and Michael A. Grossman (filed as Exhibit 10.14 to the Company’s Form 8-K dated December 5, 2006 and incorporated herein by reference).
10.65
Restricted Share Award Agreement effective December 5, 2006 by and between Mack-Cali Realty Corporation and Michael A. Grossman (filed as Exhibit 10.15 to the Company’s Form 8-K dated December 5, 2006 and incorporated herein by reference).
10.66
Tax Gross Up Agreement effective December 5, 2006 by and between Mack-Cali Realty Corporation and Michael A. Grossman (filed as Exhibit 10.16 to the Company’s Form 8-K dated December 5, 2006 and incorporated herein by reference).
10.67
Restricted Share Award Agreement effective December 5, 2006 by and between Mack-Cali Realty Corporation and Mark Yeager (filed as Exhibit 10.17 to the Company’s Form 8-K dated December 5, 2006 and incorporated herein by reference).
10.68
Tax Gross Up Agreement effective December 5, 2006 by and between Mack-Cali Realty Corporation and Mark Yeager (filed as Exhibit 10.18 to the Company’s Form 8-K dated December 5, 2006 and incorporated herein by reference).
10.69
Restricted Share Award Agreement effective December 5, 2006 by and between Mack-Cali Realty Corporation and Mark Yeager (filed as Exhibit 10.19 to the Company’s Form 8-K dated December 5, 2006 and incorporated herein by reference).

130
Exhibit Number Exhibit Title
10.70
Tax Gross Up Agreement effective December 5, 2006 by and between Mack-Cali Realty Corporation and Mark Yeager (filed as Exhibit 10.20 to the Company’s Form 8-K dated December 5, 2006 and incorporated herein by reference).
10.71
Form of Multi-Year Restricted Share Award Agreement (filed as Exhibit 10.1 to the Company’s Form 8-K dated September 12, 2007 and incorporated herein by reference).
10.72
Form of Tax Gross-Up Agreement (filed as Exhibit 10.2 to the Company’s Form 8-K dated September 12, 2007 and incorporated herein by reference).
10.73
Form of Restricted Share Award Agreement effective December 4, 2007 by and between Mack-Cali Realty Corporation and each of Mitchell E. Hersh, Barry Lefkowitz, Michael Grossman, Mark Yeager and Roger W. Thomas (filed as Exhibit 10.1 to the Company’s Form 8-K dated December 4, 2007 and incorporated herein by reference).
10.74
Form of Tax Gross-Up Agreement effective December 4, 2007 by and between Mack-Cali Realty Corporation and each of Mitchell E. Hersh, Barry Lefkowitz, Michael Grossman, Mark Yeager and Roger W. Thomas (filed as Exhibit 10.2 to the Company’s Form 8-K dated December 4, 2007 and incorporated herein by reference).
10.75
Amended and Restated Revolving Credit Agreement dated as of September 27, 2002, among Mack-Cali Realty, L.P. and JPMorgan Chase Bank, Fleet National Bank and Other Lenders Which May Become Parties Thereto with JPMorgan Chase Bank, as administrative agent, swing lender and fronting bank, Fleet National Bank and Commerzbank AG, New York and Grand Cayman branches as syndication agents, Bank of America, N.A. and Wells Fargo Bank, National Association, as documentation agents, and J.P. Morgan Securities Inc. and Fleet Securities, Inc, as arrangers (filed as Exhibit 10.1 to the Company’s Form 8-K dated September 27, 2002 and incorporated herein by reference).
10.76
Second Amended and Restated Revolving Credit Agreement among Mack-Cali Realty, L.P., JPMorgan Chase Bank, N.A., Bank of America, N.A., and other lending institutions that are or may become a party to the Second Amended and Restated Revolving Credit Agreement dated as of November 23, 2004 (filed as Exhibit 10.1 to the Company’s Form 8-K dated November 23, 2004 and incorporated herein by reference).
10.77
Extension and Modification Agreement dated as of September 16, 2005 by and among Mack-Cali Realty, L.P., JPMorgan Chase Bank, N.A., as administrative agent, and the several Lenders Party thereto (filed as Exhibit 10.1 to the Company’s Form 8-K dated September 16, 2005 and incorporated herein by reference).
10.78
Second Modification Agreement dated as of July 14, 2006 by and among Mack-Cali Realty, L.P., JPMorgan Chase Bank, N.A., as administrative agent, and the several Lenders party thereto (filed as Exhibit 10.1 to the Company’s Form 8-K dated July 14, 2006 and incorporated herein by reference).
10.79
Extension and Third Modification Agreement dated as of June 22, 2007 by and among Mack-Cali Realty, L.P., JPMorgan Chase Bank, N.A., as administrative agent, and the several Lenders party thereto. (filed as Exhibit 10.1 to the Company’s Form 8-K dated June 22, 2007 and incorporated herein by reference).
131
Exhibit Number Exhibit Title
10.80
Fourth Modification Agreement dated as of September 21, 2007 by and among Mack Cali Realty, L.P., JPMorgan Chase Bank, N.A., as administrative agent and the several Lenders party thereto (filed as Exhibit 10.1 to the Company’s Form 8-K dated September 21, 2007 and incorporated herein by reference).
10.81
Amended and Restated Master Loan Agreement dated as of November 12, 2004 among Mack-Cali Realty, L.P., and Affiliates of Mack-Cali Realty Corporation and Mack-Cali Realty, L.P., as Borrowers, Mack-Cali Realty Corporation and Mack-Cali Realty L.P., as Guarantors and The Prudential Insurance Company of America, as Lender (filed as Exhibit 10.1 to the Company’s Form 8-K dated November 12, 2004 and incorporated herein by reference).
10.82
Contribution and Exchange Agreement among The MK Contributors, The MK Entities, The Patriot Contributors, The Patriot Entities, Patriot American Management and Leasing Corp., Cali Realty, L.P. and Cali Realty Corporation, dated September 18, 1997 (filed as Exhibit 10.98 to the Company’s Form 8-K dated September 19, 1997 and incorporated herein by reference).
10.83
First Amendment to Contribution and Exchange Agreement, dated as of December 11, 1997, by and among the Company and the Mack Group (filed as Exhibit 10.99 to the Company’s Form 8-K dated December 11, 1997 and incorporated herein by reference).
10.84
Employee Stock Option Plan of Mack-Cali Realty Corporation (filed as Exhibit 10.1 to the Company’s Post-Effective Amendment No. 1 to Form S-8, Registration No. 333-44443, and incorporated herein by reference).
10.85
Director Stock Option Plan of Mack-Cali Realty Corporation (filed as Exhibit 10.2 to the Company’s Post-Effective Amendment No. 1 to Form S-8, Registration No. 333-44443, and incorporated herein by reference).
10.86
2000 Employee Stock Option Plan (filed as Exhibit 10.1 to the Company’s Registration Statement on Form S-8, Registration No. 333-52478, and incorporated herein by reference), as amended by the First Amendment to the 2000 Employee Stock Option Plan (filed as Exhibit 10.17 to the Company’s Form 10-Q dated June 30, 2002 and incorporated herein by reference).
10.87
Amended and Restated 2000 Director Stock Option Plan (filed as Exhibit 10.2 to the Company’s Post-Effective Amendment No. 1 to Registration Statement on Form S-8, Registration No. 333-100244, and incorporated herein by reference).
10.88
Mack-Cali Realty Corporation 2004 Incentive Stock Plan (filed as Exhibit 10.1 to the Company’s Registration Statement on Form S-8, Registration No. 333-116437, and incorporated herein by reference).
10.89
Deferred Compensation Plan for Directors (filed as Exhibit 10.1 to the Company’s Registration Statement on Form S-8, Registration No. 333-80081, and incorporated herein by reference).

132
Exhibit Number Exhibit Title
10.90
Form of Indemnification Agreement by and between Mack-Cali Realty Corporation and each of William L. Mack, John J. Cali, Mitchell E. Hersh, John R. Cali, David S. Mack, Martin S. Berger, Alan S. Bernikow, Kenneth M. Duberstein, Martin D. Gruss, Nathan Gantcher, Vincent Tese, Roy J.Zuckerberg, Alan G. Philibosian, Irvin D. Reid, Robert F. Weinberg, Barry Lefkowitz, Roger W. Thomas, Michael A. Grossman, Mark Yeager, Anthony Krug, Dean Cingolani, Anthony DeCaro Jr., Mark Durno, William Fitzpatrick, John Kropke, Nicholas Mitarotonda, Jr., Michael Nevins, Virginia Sobol, Albert Spring, Daniel Wagner, Deborah Franklin, John Marazzo, Christopher DeLorenzo, Jeffrey Warner, Diane Chayes and James Corrigan (filed as Exhibit 10.28 to the Company’s Form 10-Q dated September 30, 2002 and incorporated herein by reference).
10.91
Indemnification Agreement dated October 22, 2002 by and between Mack-Cali Realty Corporation and John Crandall (filed as Exhibit 10.29 to the Company’s Form 10-Q dated September 30, 2002 and incorporated herein by reference).
10.92
Second Amendment to Contribution and Exchange Agreement, dated as of June 27, 2000, between RMC Development Company, LLC f/k/a Robert Martin Company, LLC, Robert Martin Eastview North Company, L.P., the Company and the Operating Partnership (filed as Exhibit 10.44 to the Company’s Form 10-K dated December 31, 2002 and incorporated herein by reference).
10.93
Limited Partnership Agreement of Meadowlands Mills/Mack-Cali Limited Partnership by and between Meadowlands Mills Limited Partnership, Mack-Cali Meadowlands Entertainment L.L.C. and Mack-Cali Meadowlands Special L.L.C. dated November 25, 2003 (filed as Exhibit 10.1 to the Company’s Form 8-K dated December 3, 2003 and incorporated herein by reference).
10.94
Redevelopment Agreement by and between the New Jersey Sports and Exposition Authority and Meadowlands Mills/Mack-Cali Limited Partnership dated December 3, 2003 (filed as Exhibit 10.2 to the Company’s Form 8-K dated December 3, 2003 and incorporated herein by reference).
10.95
First Amendment to Redevelopment Agreement by and between the New Jersey Sports and Exposition Authority and Meadowlands Mills/Mack-Cali Limited Partnership dated October 5, 2004 (filed as Exhibit 10.54 to the Company’s Form 10-Q dated September 30, 2004 and incorporated herein by reference).
10.96
Letter Agreement by and between Mack-Cali Realty Corporation and The Mills Corporation dated October 5, 2004 (filed as Exhibit 10.55 to the Company’s Form 10-Q dated September 30, 2004 and incorporated herein by reference).
10.97
First Amendment to Limited Partnership Agreement of Meadowlands Mills/Mack-Cali Limited Partnership by and between Meadowlands Mills Limited Partnership, Mack-Cali Meadowlands Entertainment L.L.C. and Mack-Cali Meadowlands Special L.L.C. dated as of June 30, 2005 (filed as Exhibit 10.66 to the Company’s Form 10-Q dated June 30, 2005 and incorporated herein by reference).

133
Exhibit Number Exhibit Title
10.98
Mack-Cali Rights, Obligations and Option Agreement by and between Meadowlands Developer Limited Partnership, Meadowlands Limited Partnership, Meadowlands Developer Holding Corp., Meadowlands Mack-Cali GP, L.L.C., Mack-Cali Meadowlands Special, L.L.C., Baseball Meadowlands Mills/Mack-Cali Limited Partnership, A-B Office Meadowlands Mack-Cali Limited Partnership, C-D Office Meadowlands Mack-Cali Limited Partnership, Hotel Meadowlands Mack-Cali Limited Partnership and ERC Meadowlands Mills/Mack-Cali Limited Partnership dated November 22, 2006 (filed as Exhibit 10.92 to the Company’s Form 10-K dated December 31, 2006 and incorporated herein by reference).
10.99
Redemption Agreement by and among Meadowlands Developer Limited Partnership, Meadowlands Developer Holding Corp., Mack-Cali Meadowlands entertainment L.L.C., Mack-Cali Meadowlands Special L.L.C., and Meadowlands Limited Partnership dated November 22, 2006 (filed as Exhibit 10.93 to the Company’s Form 10-K dated December 31, 2006 and incorporated herein by reference).
10.100
Contribution and Exchange Agreement by and between Mack-Cali Realty, L.P. and Tenth Springhill Lake Associates L.L.L.P., Eleventh Springhill Lake Associates L.L.L.P., Twelfth Springhill Lake Associates L.L.L.P., Fourteenth Springhill Lake Associates L.L.L.P., each a Maryland limited liability limited partnership, Greenbelt Associates, a Maryland general partnership, and Sixteenth Springhill Lake Associates L.L.L.P., a Maryland limited liability limited partnership, and certain other natural persons, dated as of November 21, 2005 (filed as Exhibit 10.69 to the Company’s Form 10-K dated December 31, 2005 and incorporated herein by reference).
10.101
Membership Interest Purchase and Contribution Agreement by and among Mr. Stanley C. Gale, SCG Holding Corp., Mack-Cali Realty Acquisition Corp. and Mack-Cali Realty, L.P. dated as of March 7, 2006 (filed as Exhibit 10.1 to the Company’s Form 8-K dated March 7, 2006 and incorporated herein by reference).
10.102
Amendment No. 1 to Membership Interest Purchase and Contribution Agreement dated as of March 31, 2006 (filed as Exhibit 10.1 to the Company’s Form 8-K dated March 28, 2006 and incorporated herein by reference).
10.103
Amendment No. 2 to Membership Interest Purchase and Contribution Agreement dated as of May 9, 2006 (filed as Exhibit 10.1 to the Company’s Form 8-K dated May 9, 2006 and incorporated herein by reference).
10.104
Amendment No. 8 to Membership Interest Purchase and Contribution Agreement by and among Mr. Stanley C. Gale, SCG Holding Corp., Mack-Cali Realty Acquisition Corp. and Mack-Cali Realty, L.P. dated as of May 23, 2007 (filed as Exhibit 10.1 to the Company’s Form 8-K dated May 23, 2007.
10.105
Contribution and Sale Agreement by and among Gale SLG NJ LLC, a Delaware limited liability company, Gale SLG NJ MEZZ LLC, a Delaware limited liability company, and Gale SLG RIDGEFIELD MEZZ LLC, a Delaware limited liability company and Mack-Cali Ventures L.L.C. dated as of March 7, 2006 (filed as Exhibit 10.2 to the Company’s Form 8-K dated March 7, 2006 and incorporated herein by reference).

134
Exhibit Number Exhibit Title
10.106
First Amendment to Contribution and Sale Agreement by and among GALE SLG NJ LLC, a Delaware limited liability company, GALE SLG NJ MEZZ LLC, a Delaware limited liability company, and GALE SLG RIDGEFIELD MEZZ LLC, a Delaware limited liability company, and Mack-Cali Ventures L.L.C., a Delaware limited liability company, dated as of May 9, 2006 (filed as Exhibit 10.4 to the Company’s Form 8-K dated May 9, 2006 and incorporated herein by reference).
10.107
Non-Portfolio Property Interest Contribution Agreement by and among Mr. Stanley C. Gale, Mr. Mark Yeager, GCF II Investor LLC, The Gale Investments Company, LLC, Gale & Wentworth Vreeland, LLC, Gale Urban Solutions LLC, MSGW-ONE Campus Investors, LLC, Mack-Cali Realty Acquisition Corp. and Mack-Cali Realty, L.P. dated as of May 9, 2006 (filed as Exhibit 10.2 to the Company’s Form 8-K dated May 9, 2006 and incorporated herein by reference).
10.108
Loan Agreement by and among the entities set forth on Exhibit A, collectively, as Borrowers, and Gramercy Warehouse Funding I LLC, as Lender, dated May 9, 2006 (filed as Exhibit 10.5 to the Company’s Form 8-K dated May 9, 2006 and incorporated herein by reference).
10.109
Promissory Note of One Grande SPE LLC, 1280 Wall SPE LLC, 10 Sylvan SPE LLC, 5 Independence SPE LLC, 1 Independence SPE LLC, and 3 Becker SPE LLC, as Borrowers, in favor of Gramercy Warehouse Funding I, LLC, as Lender, in the principal amount of $90,286,551 dated May 9, 2006 (filed as Exhibit 10.6 to the Company’s Form 8-K dated May 9, 2006 and incorporated herein by reference).
10.110
Mortgage, Security Agreement and Fixture Filing by and between 4 Becker SPE LLC, as Borrower, and Wachovia Bank, National Association, as Lender, dated May 9, 2006 (filed as Exhibit 10.7 to the Company’s Form 8-K dated May 9, 2006 and incorporated herein by reference).
10.111
Promissory Note of 4 Becker SPE LLC, as Borrower, in favor of Wachovia Bank, National Association, as Lender, in the principal amount of $43,000,000 dated May 9, 2006 (filed as Exhibit 10.8 to the Company’s Form 8-K dated May 9, 2006 and incorporated herein by reference).
10.112
Mortgage, Security Agreement and Fixture Filing by and between 210 Clay SPE LLC, as Borrower, and Wachovia Bank, National Association, as Lender, dated May 9, 2006 (filed as Exhibit 10.9 to the Company’s Form 8-K dated May 9, 2006 and incorporated herein by reference).
10.113
Promissory Note of 210 Clay SPE LLC, as Borrower, in favor of Wachovia Bank, National Association, as Lender, in the principal amount of $16,000,000 dated May 9, 2006 (filed as Exhibit 10.10 to the Company’s Form 8-K dated May 9, 2006 and incorporated herein by reference).
10.114
Mortgage, Security Agreement and Fixture Filing by and between 5 Becker SPE LLC, as Borrower, and Wachovia Bank, National Association, as Lender, dated May 9, 2006 (filed as Exhibit 10.11 to the Company’s Form 8-K dated May 9, 2006 and incorporated herein by reference).
10.115
Promissory Note of 5 Becker SPE LLC, as Borrower, in favor of Wachovia Bank, National Association, as Lender, in the principal amount of $15,500,000 dated May 9, 2006 (filed as Exhibit 10.12 to the Company’s Form 8-K dated May 9, 2006 and incorporated herein by reference).
10.116
Mortgage, Security Agreement and Fixture Filing by and between 51 CHUBB SPE LLC, as Borrower, and Wachovia Bank, National Association, as Lender, dated May 9, 2006 (filed as Exhibit 10.13 to the Company’s Form 8-K dated May 9, 2006 and incorporated herein by reference).
135
Exhibit Number Exhibit Title
10.117
Promissory Note of 51 CHUBB SPE LLC, as Borrower, in favor of Wachovia Bank, National Association, as Lender, in the principal amount of $4,500,000 dated May 9, 2006 (filed as Exhibit 10.14 to the Company’s Form 8-K dated May 9, 2006 and incorporated herein by reference).
10.118
Form of Amended and Restated Limited Liability Company Agreement of Mack-Green-Gale LLC dated , 2006 (filed as Exhibit 10.3 to the Company’s Form 8-K dated March 7, 2006 and incorporated herein by reference).
10.119
Form of Limited Liability Company Operating Agreement (filed as Exhibit 10.3 to the Company’s Form 8-K dated May 9, 2006 and incorporated herein by reference).
10.120
Agreement of Sale and Purchase dated August 9, 2006 by and between Mack-Cali Realty, L.P. and Westcore Properties AC, LLC (filed as Exhibit 10.91 to the Company’s Form 10-Q dated September 30, 2006 and incorporated herein by reference).
10.121
First Amendment to Agreement of Sale and Purchase dated September 6, 2006 by and between Mack-Cali Realty, L.P. and Westcore Properties AC, LLC (filed as Exhibit 10.92 to the Company’s Form 10-Q dated September 30, 2006 and incorporated herein by reference).
10.122
Second Amendment to Agreement of Sale and Purchase dated September 15, 2006 by and between Mack-Cali Realty, L.P. and Westcore Properties AC, LLC (filed as Exhibit 10.93 to the Company’s Form 10-Q dated September 30, 2006 and incorporated herein by reference).
10.123
Agreement of Sale and Purchase dated September 25, 2006 by and between Phelan Realty Associates L.P., 795 Folsom Realty Associates L.P. and Westcore Properties AC, LLC (filed as Exhibit 10.94 to the Company’s Form 10-Q dated September 30, 2006 and incorporated herein by reference).
10.124
Membership Interest Purchase and Contribution Agreement dated as of December 28, 2006, by and among NKFGMS Owners, LLC, The Gale Construction Services Company, L.L.C., NKFFM Limited Liability Company, Scott Panzer, Ian Marlow, Newmark & Company Real Estate, Inc. d/b/a Newmark Knight Frank, and Mack-Cali Realty, L.P (filed as Exhibit 10.117 to the Company’s Form 10-K dated December 31, 2006 and incorporated herein by reference).
10.125
Operating Agreement of NKFGMS Owners, LLC (filed as Exhibit 10.118 to the Company’s Form 10-K dated December 31, 2006 and incorporated herein by reference).
10.126
Loans, Sale and Services Agreement dated December 28, 2006 by and between Newmark & Company Real Estate, Inc. d/b/a Newmark Knight Frank, Mack-Cali Realty, L.P., and Newmark Knight Frank Global Management Services, LLC (filed as Exhibit 10.119 to the Company’s Form 10-K dated December 31, 2006 and incorporated herein by reference).
10.127
Term Loan Agreement among Mack-Cali Realty, L.P. and JPMorgan Chase Bank, N.A. as Administrative Agent, J.P. Morgan Securities Inc. as Arranger, and other lender which may become parties to this Agreement dated November 29, 2006 (filed as Exhibit 10.120 to the Company’s Form 10-K dated December 31, 2006 and incorporated herein by reference).

136
Exhibit Number Exhibit Title
10.128
Agreement of Purchase and Sale among SLG Broad Street A LLC and SLG Broad Street C LLC, as Sellers, and M-C Broad 125 A L.L.C. and M-C Broad 125 C L.L.C., as Purchasers, dated as of March 15, 2007 (filed as Exhibit 10.121 to the Company’s Form 10-Q dated March 31, 2007 and incorporated herein by reference).
10.129
Agreement of Purchase and Sale among 500 West Putnam L.L.C., as Seller, and SLG 500 West Putnam LLC, as Purchaser, dated as of March 15, 2007 (filed as Exhibit 10.122 to the Company’s Form 10-Q dated March 31, 2007 and incorporated herein by reference).
10.130
Letter Agreement by and between Mack-Cali Realty, L.P., Mack-Cali Realty Acquisition Corp., Mack-Cali Belmar Realty, LLC, M-C Belmar, LLC, Mr. Stanley C. Gale, SCG Holding Corp., Mr. Mark Yeager, GCF II Investor LLC, The Gale Investments Company, LLC, Gale & Wentworth Vreeland, LLC, Gale Urban Solutions LLC, MSGW-ONE Campus Investors, LLC and Gale/Yeager Investments LLC dated October 31, 2007 (filed as Exhibit 10.128 to the Company’s Form 10-Q dated September 30, 2007 and incorporated herein by reference).
21.1* Subsidiaries of the Company.
23.1* Consent of PricewaterhouseCoopers LLP, independent registered public accounting firm.
31.1*
Certification of the Company’s President and Chief Executive Officer, Mitchell E. Hersh, pursuant to Section 302 of the Sarbanes-Oxley Act of 2002.
31.2*
Certification of the Company’s Chief Financial Officer, Barry Lefkowitz, pursuant to Section 302 of the Sarbanes-Oxley Act of 2002.
32.1*
Certification of the Company’s President and Chief Executive Officer, Mitchell E. Hersh, and the Company’s Chief Financial Officer, Barry Lefkowitz, pursuant to Section 906 of the Sarbanes-Oxley Act of 2002.
*filed herewith

EXECUTIVE OFFICES
343 Thornall Street
Edison, New Jersey 08837-2206
Phone: (732) 590-1000
Fax: (732) 205-8237
www.mack-cali.com
E-mail: [email protected]
INDEPENDENT REGISTERED PUBLIC ACCOUNTING FIRM
PricewaterhouseCoopers LLP
300 Madison Avenue
New York, New York 10017-6204
(646) 471-3000
TRANSFER AGENT AND REGISTRAR
Computershare Trust Company, N.A.
P.O. Box 43078
Providence, Rhode Island 02940-3078
(800) 317-4445
Outside U.S. and Canada: (781) 575-2724
Hearing impaired TDD: (800) 952-9245
www.computershare.com
DIVIDEND REINVESTMENT AND STOCK PURCHASE PLAN
Computershare Trust Company, N.A.
P.O. Box 43078
Providence, Rhode Island 02940-3078
(800) 317-4445
www.computershare.com
COMMON STOCK LISTING
New York Stock Exchange (CLI)
ANNUAL MEETING OF STOCKHOLDERS
Stockholders are invited to attend the Annual Meeting of Stockholders
to be held at 2 p.m. on Wednesday, May 21, 2008, at the Hyatt Regency
Jersey City on the Hudson, Harborside Financial Center, 2 Exchange
Place, Jersey City, New Jersey 07302-3901.
Visit Mack-Cali on the web at www.mack-cali.com.
Design: Graphic Expression, Inc., New York City, www.tgenyc.com

www.mack-cali.com