Embed Size (px)
Citation preview

2007 CAS Ratemaking Seminar
SPE-3 Actuarial Analysis of Catastrophes & Terrorism for
Commercial Insurance
Rimma Maasbach - ISO

Terrorism Loss Costs
Topics
(1) Overview of TRIA
(2) Loss Costs – International • Original (2002)• Revised (2004)
(3) TRIA• Calculation of Federal Backstop Factors
(4) Domestic Terrorism Pricing
Terrorism Pricing
Terrorism Risk Insurance Act of 2002 (TRIA) Overview

Terrorism Rating Overview
Line of Insurance Product Derivation
• Commercial Property
Loss Cost AIR Model + ISO Adjustment
• General Liability • Commercial Auto
Percentage Loadings To Current Loss Costs
ISO Modeling
• Businessowners Combination of Property and GL
• Other Lines
(e.g. CIM, Farm)
Refer to Company
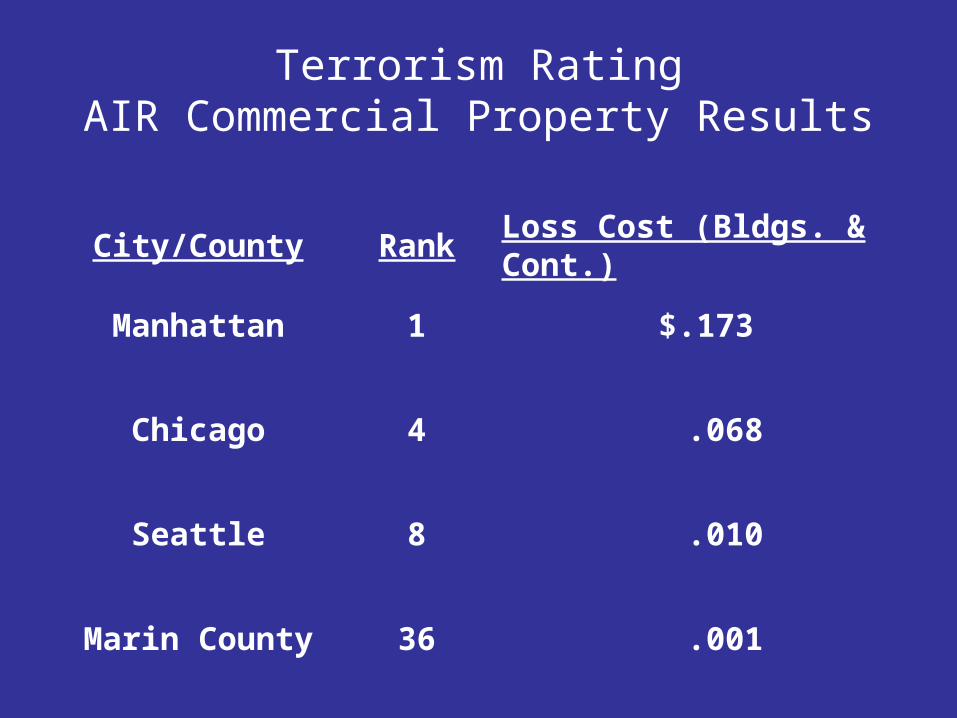
Terrorism RatingAIR Commercial Property Results
City/County Rank Loss Cost (Bldgs. & Cont.)
Manhattan 1 $.173
Chicago 4 .068
Seattle 8 .010
Marin County 36 .001
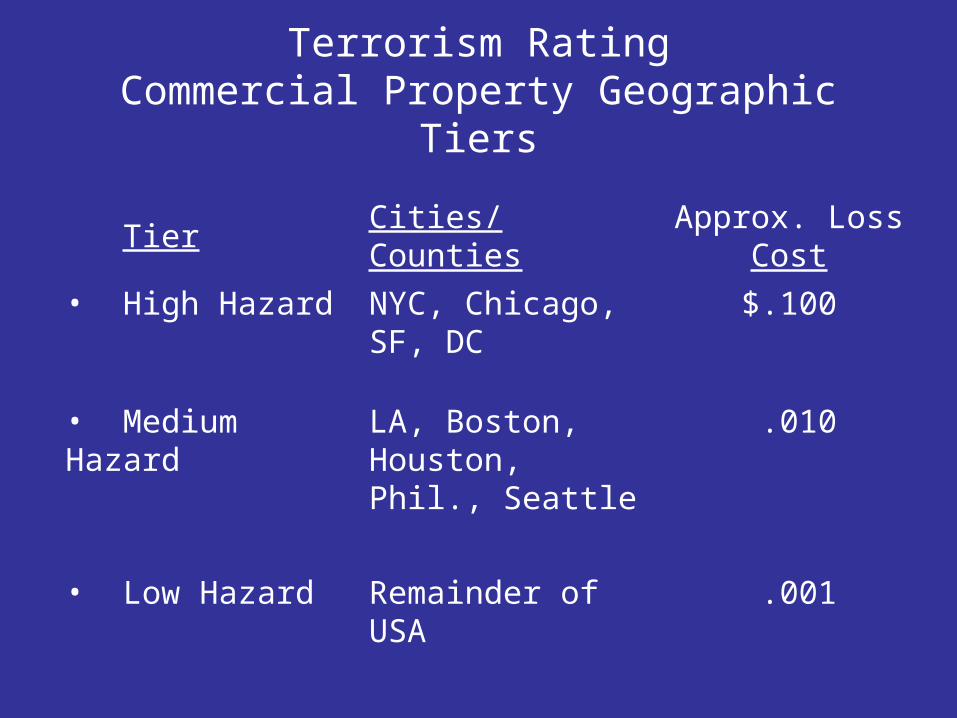
Terrorism RatingCommercial Property Geographic Tiers
Tier Cities/CountiesApprox. Loss
Cost
• High Hazard NYC, Chicago, SF, DC
$.100
• Medium Hazard LA, Boston, Houston, Phil., Seattle
.010
• Low Hazard Remainder of USA .001
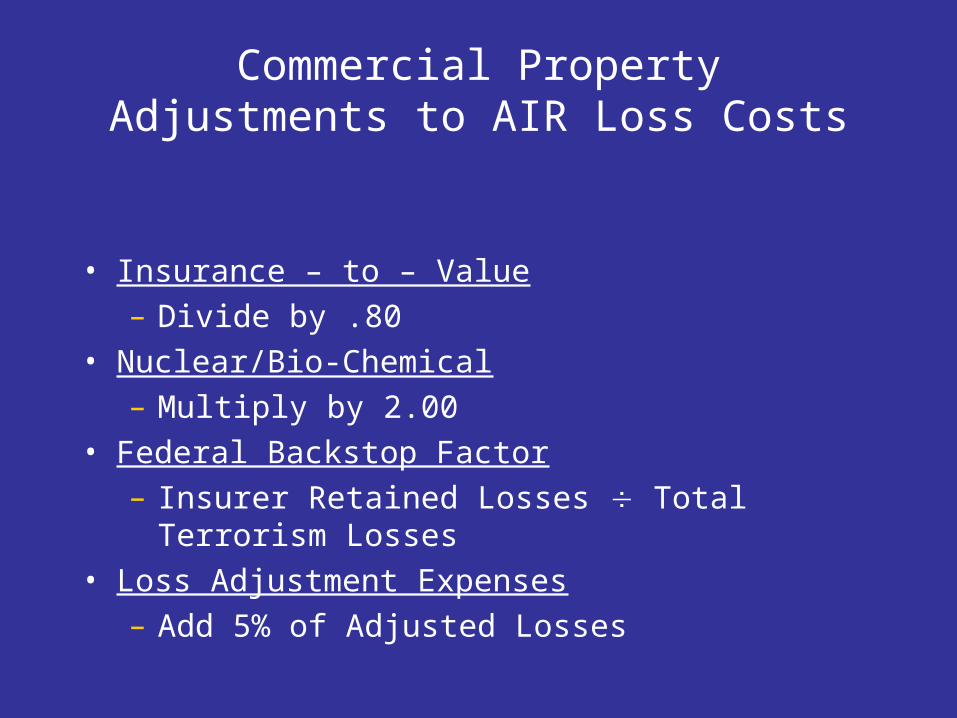
Commercial PropertyAdjustments to AIR Loss Costs
• Insurance – to – Value– Divide by .80
• Nuclear/Bio-Chemical– Multiply by 2.00
• Federal Backstop Factor– Insurer Retained Losses Total Terrorism Losses
• Loss Adjustment Expenses– Add 5% of Adjusted Losses
Terrorism Pricing
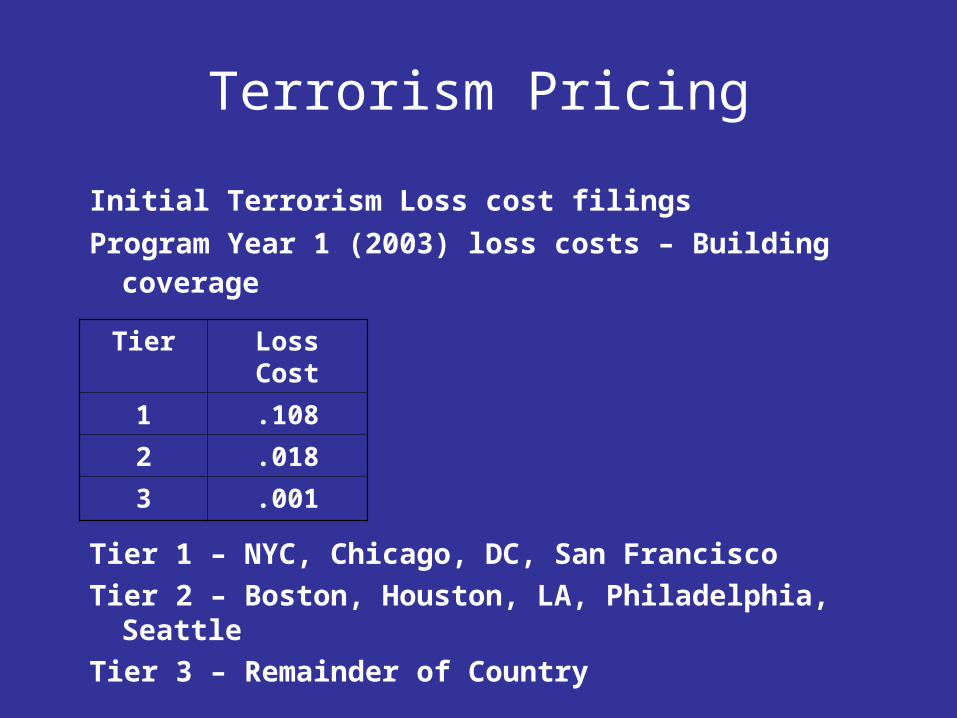
Initial Terrorism Loss cost filings
Program Year 1 (2003) loss costs – Building coverage
Tier 1 – NYC, Chicago, DC, San Francisco
Tier 2 – Boston, Houston, LA, Philadelphia, Seattle
Tier 3 – Remainder of Country
Tier Loss Cost
1 .108
2 .018
3 .001

#
20019
20032
20011
20002
20020
2001620008
20007
20015
20018
20003
20012
20001
20024
20017
20004
20009
20010
2003720005
20006
20036
20064
20057
20059
20004
Washington
District of Columbia
WASHINGTON, D.C.IMPLEMENTED TERRORISM LOSS COSTS
.030
.018
.008
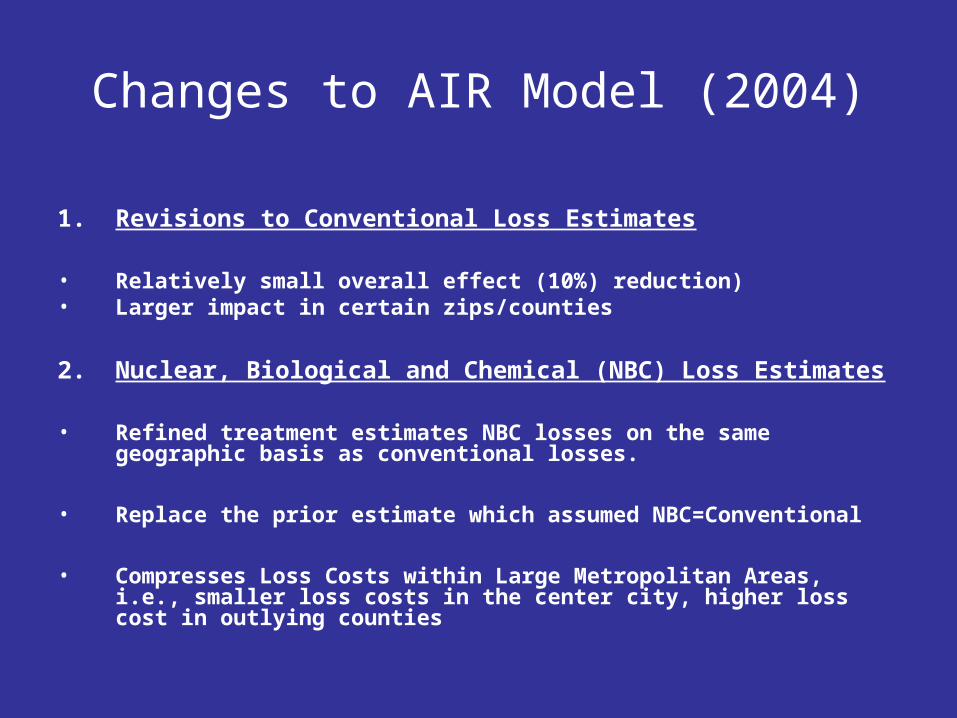
Changes to AIR Model (2004)
1. Revisions to Conventional Loss Estimates
• Relatively small overall effect (10%) reduction)• Larger impact in certain zips/counties
2. Nuclear, Biological and Chemical (NBC) Loss Estimates
• Refined treatment estimates NBC losses on the same geographic basis as conventional losses.
• Replace the prior estimate which assumed NBC=Conventional
• Compresses Loss Costs within Large Metropolitan Areas, i.e., smaller loss costs in the center city, higher loss cost in outlying counties

AIR Terrorism ModelCommercial Property
Comparison of Annual Expected International Terrorism Losses
2002 AIR Version 2004 AIR Version
Conventional $1.45 Billion $1.30 Billion
NBC $1.45 Billion* .95 Billion
Total $2.90 Billion $2.25 Billion
* Preliminary Estimate* Preliminary Estimate

Terrorism Loss CostsSample Impacts of Updated Model Version
Original Loss Costs New Loss Costs
Location Conv. NBC Comb Conv. NBC Comb.
Downtown $.100 $.100 $.200 $.090 $.020 $.110
Outlying Area
.001 .001 .002 .001 .015 .016
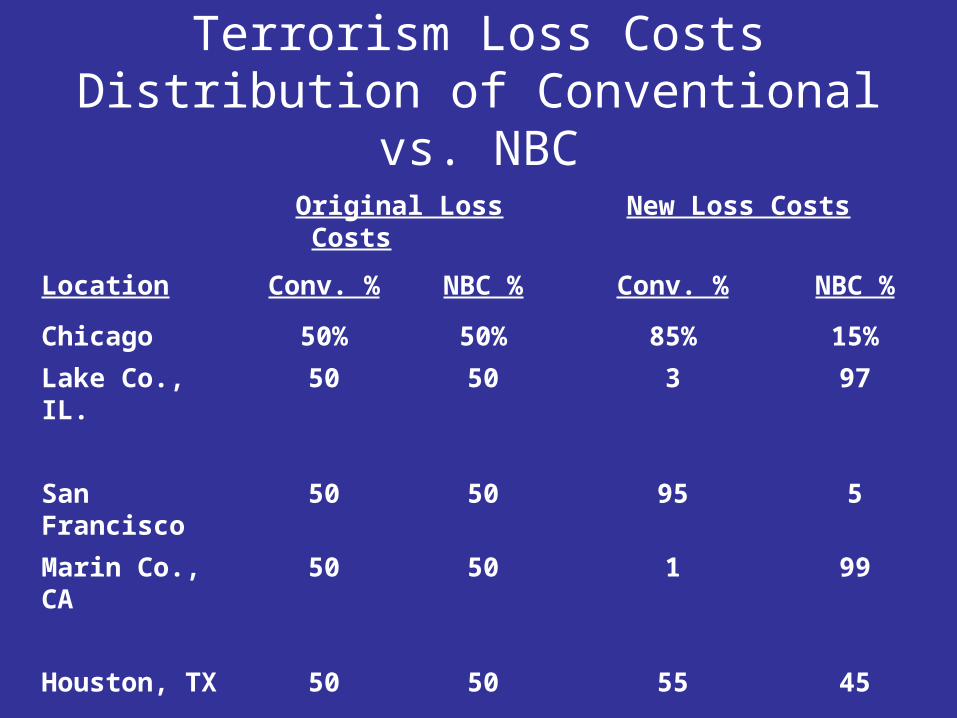
Terrorism Loss CostsDistribution of Conventional vs. NBC
Original Loss Costs New Loss Costs
Location Conv. % NBC % Conv. % NBC %
Chicago 50% 50% 85% 15%
Lake Co., IL. 50 50 3 97
San Francisco 50 50 95 5
Marin Co., CA 50 50 1 99
Houston, TX 50 50 55 45
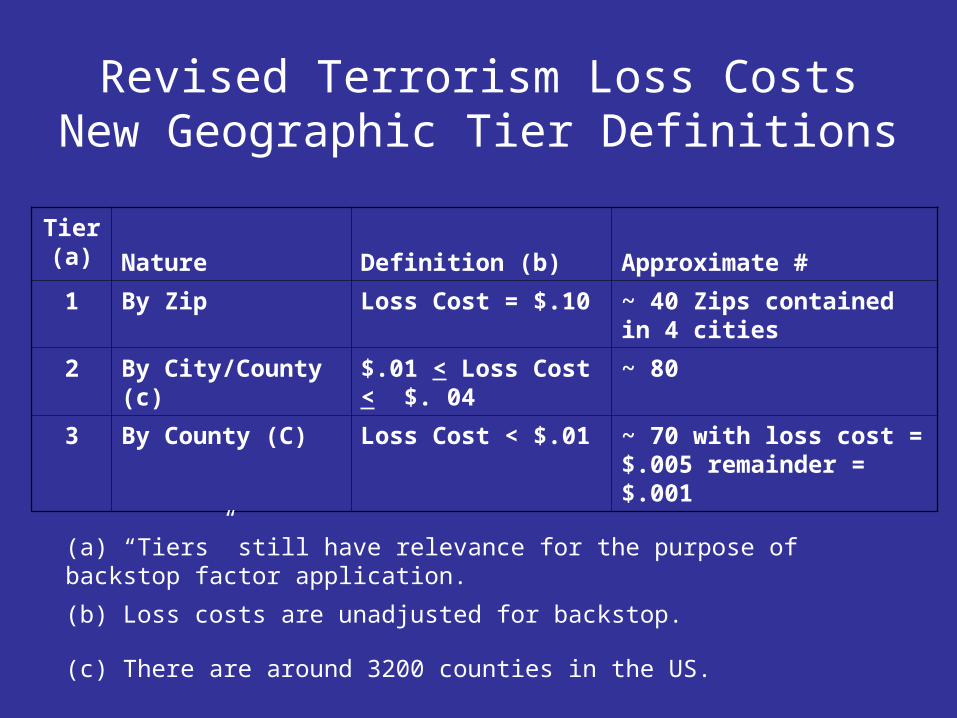
Revised Terrorism Loss CostsNew Geographic Tier Definitions
Tier (a) Nature Definition (b) Approximate #
1 By Zip Loss Cost = $.10 ~ 40 Zips contained in 4 cities
2 By City/County (c) $.01 < Loss Cost < $. 04
~ 80
3 By County (C) Loss Cost < $.01 ~ 70 with loss cost = $.005 remainder = $.001
(a) “Tiers” still have relevance for the purpose of backstop factor application.
(b) Loss costs are unadjusted for backstop.
(c) There are around 3200 counties in the US.
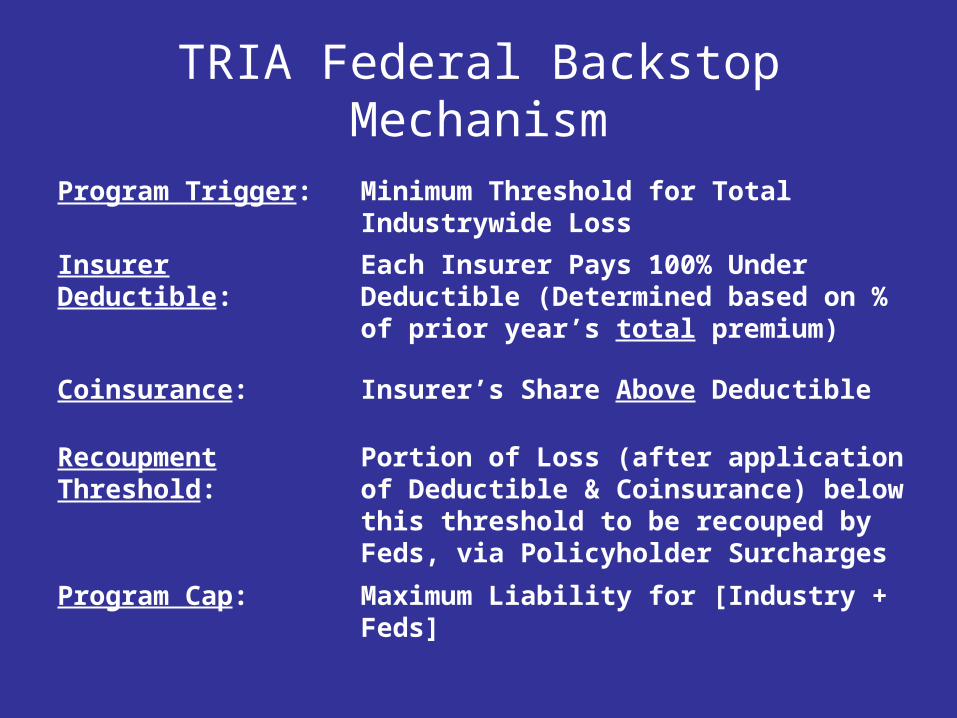
TRIA Federal Backstop Mechanism
Program Trigger: Minimum Threshold for Total Industrywide Loss
Insurer Deductible: Each Insurer Pays 100% Under Deductible (Determined based on % of prior year’s total premium)
Coinsurance: Insurer’s Share Above Deductible
Recoupment Threshold:
Portion of Loss (after application of Deductible & Coinsurance) below this threshold to be recouped by Feds, via Policyholder Surcharges
Program Cap: Maximum Liability for [Industry + Feds]

Terrorism Risk InsuranceExtension Act (TRIEA)
Key Features
– Two Additional years (2006 & 2007)– “Make Available” Requirement– International only (No Domestic)– Applies to Underlying Coverages only (e.g. No
Mandatory CBRN)– Limited Lines of Insurance
• Property/Casualty Only• Commercial Lines Only• Some Commercial Lines Excluded
– Federal Backstop Mechanism Continues Unchanged• But Parameters Have Changed
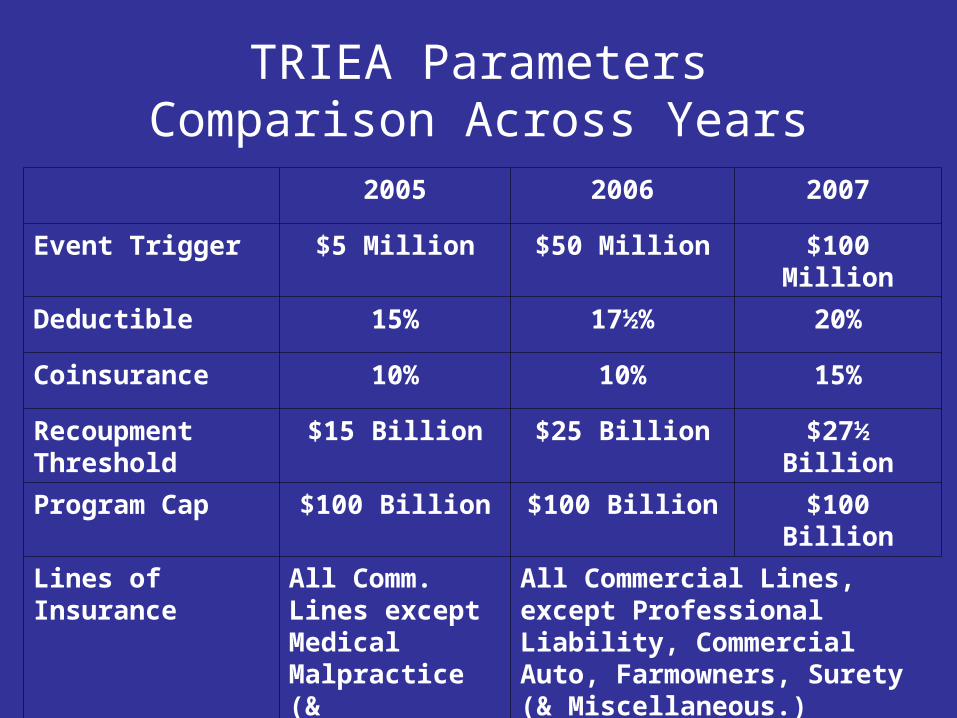
TRIEA ParametersComparison Across Years
2005 2006 2007
Event Trigger $5 Million $50 Million $100 Million
Deductible 15% 17½% 20%
Coinsurance 10% 10% 15%
Recoupment Threshold
$15 Billion $25 Billion $27½ Billion
Program Cap $100 Billion $100 Billion $100 Billion
Lines of Insurance
All Comm. Lines except Medical Malpractice (& Miscellaneous)
All Commercial Lines, except Professional Liability, Commercial Auto, Farmowners, Surety (& Miscellaneous.)

Calculation of TRIA Federal Backstop Factors
• Calculate annual expected insured losses covered by the act – mean and the 99%ile – fit lognormal and gamma distributions.
• Calculate industry deductible based on earned premium for the prior year. % market share impacted increases with the size of loss.
• Relative impacts – losses will not be distributed exactly according to insurer’s market share. Assume each quintile incurs an uneven percentage of losses – e.g., 10%, 15%, 20%, 25%, 30%.
• Calculate retained insured losses as a percentage of total losses, subject to the $100B cap.
• Distribute average retention among tiers – greater impact for Tier 1 with greater loss potential.
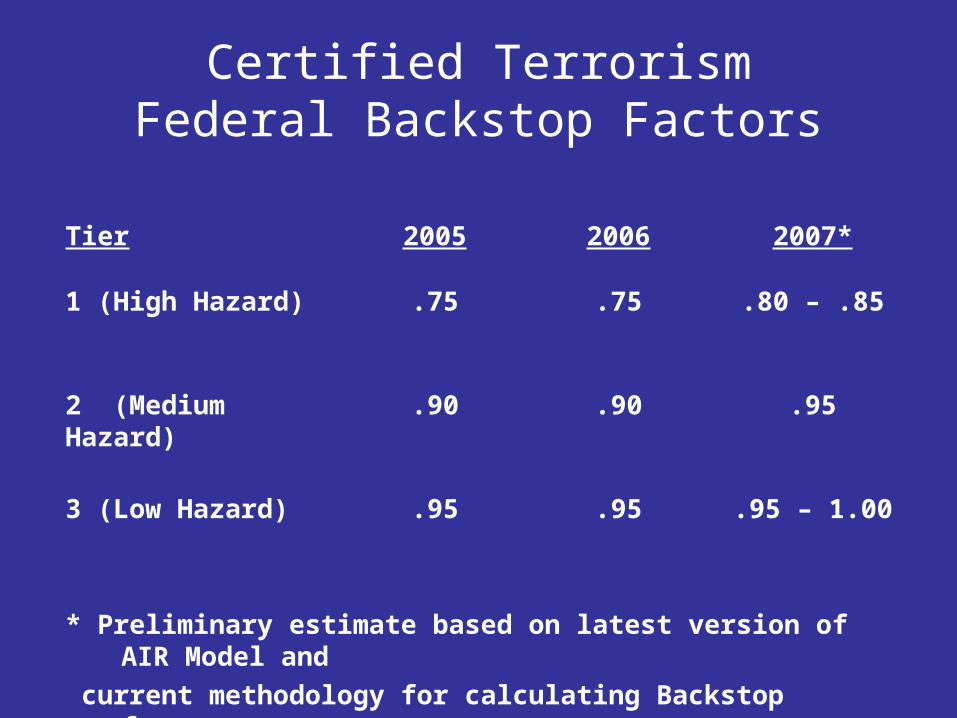
Certified TerrorismFederal Backstop Factors
Tier 2005 2006 2007*
1 (High Hazard) .75 .75 .80 – .85
2 (Medium Hazard) .90 .90 .95
3 (Low Hazard) .95 .95 .95 – 1.00
* Preliminary estimate based on latest version of AIR Model and
current methodology for calculating Backstop factors.
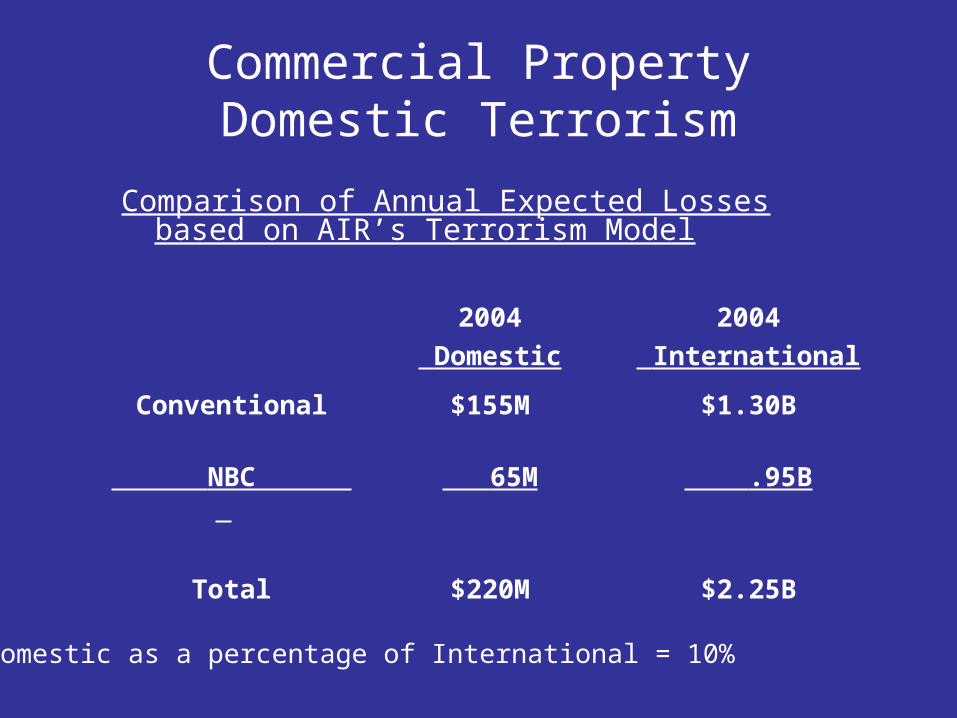
Commercial PropertyDomestic Terrorism
Comparison of Annual Expected Losses based on AIR’s Terrorism Model
2004
Domestic
2004
International
Conventional $155M $1.30B
NBC 65M .95B
Total $220M $2.25B
Domestic as a percentage of International = 10%
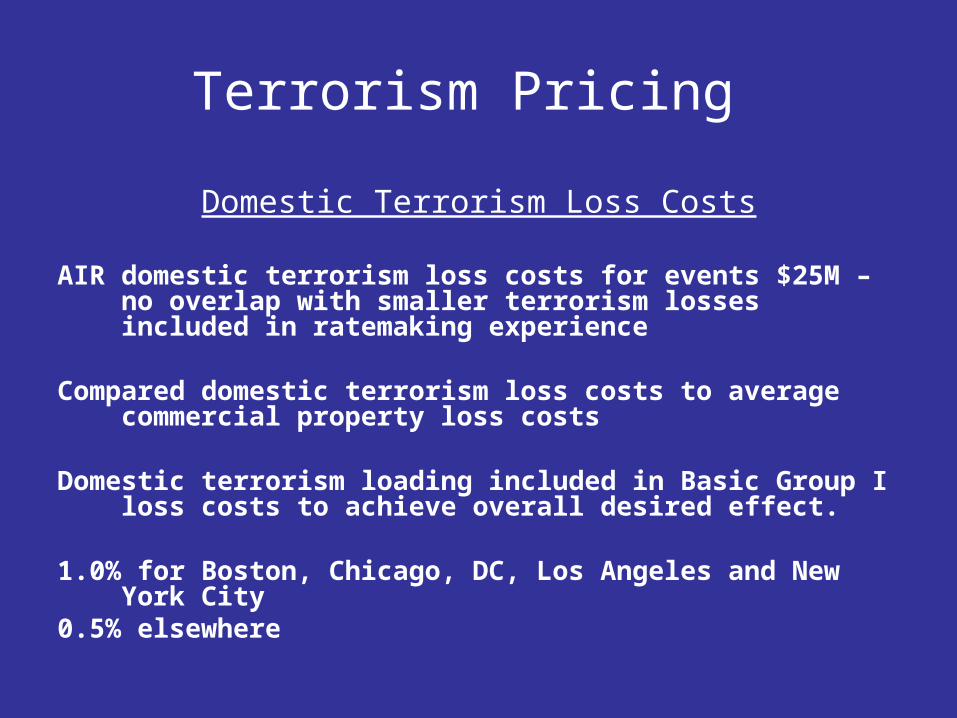
Terrorism Pricing
Domestic Terrorism Loss Costs
AIR domestic terrorism loss costs for events $25M – no overlap with smaller terrorism losses included in ratemaking experience
Compared domestic terrorism loss costs to average commercial property loss costs
Domestic terrorism loading included in Basic Group I loss costs to achieve overall desired effect.
1.0% for Boston, Chicago, DC, Los Angeles and New York City0.5% elsewhere
Commercial PropertyTerrorism Pricing
Rimma Maasbach
201-469-2605