Embed Size (px)
Citation preview

2007 FINANCIAL RESULTSANALYSTS CONFERENCE
Carlos GHOSNPRESIDENT & CEO

22007 FINANCIAL RESULTS FEBRUARY 14th 2008
2007 COMMERCIAL RESULTS
Thousand units (Cars + LCVs)
International
+ 16.3%
- 4.1%
France+ Europe
EuropeEurope
20072006
1,024 967
-- 5.6%5.6%
2006
669
2007
FranceFrance-- 1.8%1.8%
657
Asia AfricaAsia Africa
1752006 2007
192
+ 9.8%+ 9.8%
381
2006
EuroMedEuroMed
2007
424
+ 11.5%+ 11.5%+ 32.2%+ 32.2%
20062452007
185
AmericasAmericas
WorldWorld
20072006
2,434
+ 2.1%+ 2.1%
2,484

32007 FINANCIAL RESULTS FEBRUARY 14th 2008
2007 Change2006(million euros)
(1) On a consistent basis, FY2006 = €39,969m
2007 FINANCIAL RESULTS
Worldwide sales – in K units 2,434 2,484 + 2.1%
Revenues 40,332 40,682 + 1.8%(1)
Operating margin 1,063 1,354 + 27.4%
in % of revenues 2.6% 3.3% + 0.7pt

42007 FINANCIAL RESULTS FEBRUARY 14th 2008
OPERATING PROFIT VARIANCE ANALYSIS
CHANGE 2007 / 2006 : + €291m1,063 1,354
2006 2007
- 154
+ 210
- 241
+ 137
+ 134 + 44
- 20
- 57
Currency
VolumeSalesFinancing
G&A
Warranty
Mix / Price Enrichment
Manufacturing & Logistics
Purchasing
Others
(million euros)
+ 390
- 270 Rawmaterials
- 152
R&D

52007 FINANCIAL RESULTS FEBRUARY 14th 2008
2007 Change2006(million euros)
Other operating income & expenses - 186 - 116 + 37.6%
Associated companies 2,277 1,675 - 26.4%
Net income 2,960 2,734 - 7.6%
Automobile net financial debt 2,414 2,088 - 13.5%
2007 FINANCIAL RESULTS
Worldwide sales – in K units 2,434 2,484 + 2.1%
Revenues 40,332 40,682 + 1.8%(1)
Operating margin 1,063 1,354 + 27.4%
in % of revenues 2.6% 3.3% + 0.7pt
(1) On a consistent basis, FY2006 = €39,969m
62007 FINANCIAL RESULTS FEBRUARY 14th 2008
Cash FlowChangeIn WCR
Net tangible & intangible Investments
Dividends paid
Free Cash Flow
+ 4,552
- 1,287
- 2,278
+ 961
Development expensescapitalized
- 26
+ 37
Fairvalue
Net debt decrease
+ 326
Dec 31st 2007 : €2,088m
+ 241
Others
(million euros)
+ 936Dividends received from associated companies
- 913
- 109 Leasedvehicles
- 2,169 NetInvestments
AUTOMOBILE NET FINANCIAL DEBT EVOLUTION

72007 FINANCIAL RESULTS FEBRUARY 14th 2008
INVESTMENT AND R&D EXPENSES
In % of group revenuesCash impact (excl. IAS 38)
6.8%
11.7%
4.9%
R&D Expenses
Net investments
5.7%
4.6%
10.3% 10.0%
5.2%
4.9%
4.4%
5.5%
9.9%
11.5% 11.4%
6.1%
5.3%
6.0%
5.5%
0%
2%
4%
6%
8%
10%
12%
14%
2002 2003 2004 2005 2006 2007

82007 FINANCIAL RESULTS FEBRUARY 14th 2008
Cash FlowChangeIn WCR
Net tangible & intangible Investments
Dividends paid
Free Cash Flow
+ 4,552
- 1,287
- 2,278
+ 961
Development expensescapitalized
- 26
+ 37
Fairvalue
Net debt decrease
+ 326
Dec 31st 2007 : €2,088m
+ 241
Others
(million euros)
+ 936Dividends received from associated companies
- 913
- 109 Leasedvehicles
- 2,169 NetInvestments
AUTOMOBILE NET FINANCIAL DEBT EVOLUTION

92007 FINANCIAL RESULTS FEBRUARY 14th 2008
DIVIDENDS
in € per share
Dividends paid
1.8
2.4
3.1+ 29%
+ 33%
3.8+ 23%
2005 2006 2007 2008
102007 FINANCIAL RESULTS FEBRUARY 14th 2008
QUALITY
! Number of defects at the end of the assembly line divided by 6! Number of incidents at 3-month cut by half! Some vehicles of our range already Top3 of their segment! New Laguna on track
! 700,000 additional customers « fully satisfied »
PRODUCT
SERVICE

112007 FINANCIAL RESULTS FEBRUARY 14th 2008
! Purchasing performance
! Manufacturing
! Logistics
! G&A
! Distribution costs
! Investment costs
2009 Objectives
COST REDUCTION
- 9.1% - 14%*
- 5.4% - 12%
- 7.3% - 9%
- 5% < 4% revenues(ie 4.8% rev.)
+ 3.1% - 8% per unit in Europe
- 35% - 50%
2007 vs 2005
* 2008 Objective

122007 FINANCIAL RESULTS FEBRUARY 14th 2008
VEHICLE PROJECTS UNDER DEVELOPMENT
0
5
10
15
20
25
30
2004 2005 2006 2007 2008 2009
Previous trend
Upcoming trend
18
22

132007 FINANCIAL RESULTS FEBRUARY 14th 2008
Active Drive4 directional wheel chassis
2008
Diesel3.0 dCi
Diesel 2.0 dCi130/150/175hp
TECHNOLOGY: NEW POWERTRAINS
Diesel 1.5 dCi 110hp
ENGINES
GEARBOXES
Diesel1.5 dCi 65hp
Petrol1.2 TCE 100hp
Petrol2.0 16v 140hp
6-speed AJ0Automatic gearbox
6-speed TL4Manual gearbox
CHASSIS

142007 FINANCIAL RESULTS FEBRUARY 14th 2008
INCREASE IN PRODUCTION CAPACITY+ 600,000 VEHICLES PER YEAR BETWEEN 2005 AND 2007
Existing capacityextended
New capacity
+ 250,000veh/yr
+ 35,000veh/yr
+ 15,000veh/yr
+ 100,000veh/yr
+ 125,000veh/yr
+ 70,000veh/yr

152007 FINANCIAL RESULTS FEBRUARY 14th 2008
POSITIONING RENAULT IN GROWING MARKETS
AVTOVAZPARTNERSHIPPROJECT
INDUSTRIALCAPACITYEXTENSION
162007 FINANCIAL RESULTS FEBRUARY 14th 2008
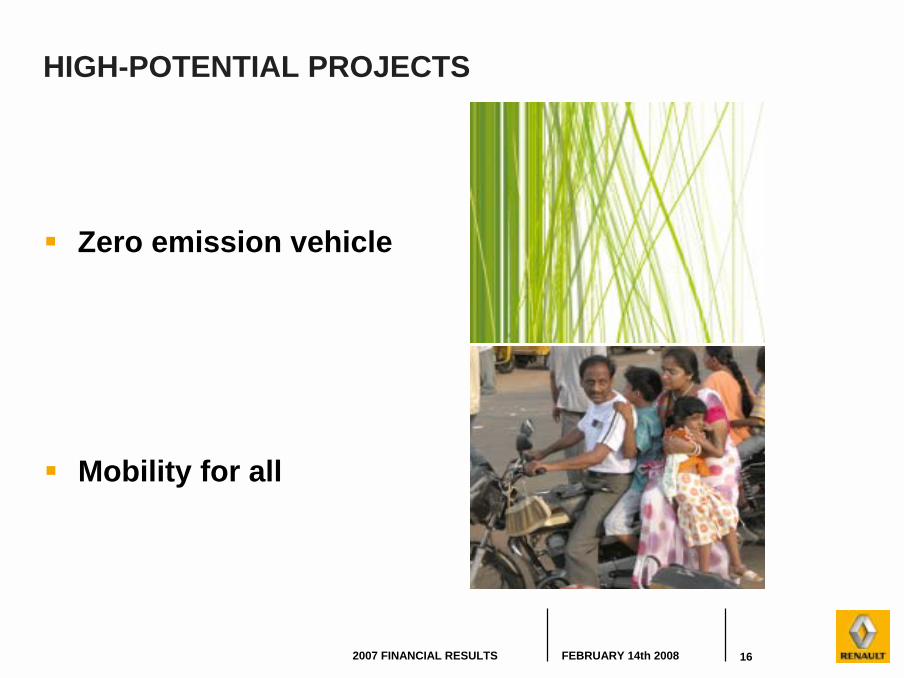
! Mobility for all
! Zero emission vehicle
HIGH-POTENTIAL PROJECTS

172007 FINANCIAL RESULTS FEBRUARY 14th 2008
Replacementmodels
Expansionmodels
20072006
THE PRODUCT OFFENSIVE 2006-2008
Logan MCV
Logan Van
Twingo
Laguna
QM5 (Korea)
Sandero (Amer.)

182007 FINANCIAL RESULTS FEBRUARY 14th 2008
20072006
Logan MCV
Logan Van
Twingo
Laguna
QM5 (Corée)
Sandero (Amér.)
Sedan, successorto Clio Symbol
H1 2008
Clio Grand Tour
Logan Pick-up
Laguna Coupé
Kangoo PC+LCV
Grand Modus
Kangoo Compact
Mégane
H2 2008
Expansionmodels
Replacementmodels
THE PRODUCT OFFENSIVE 2006-2008

192007 FINANCIAL RESULTS FEBRUARY 14th 2008
2008 PRODUCT LAUNCHES BY REGION
Phase 2 + Derivatives
World Premiere vehicles in 2007
FranceFrance
1313
Asia Asia AfricaAfrica
1111
EuromedEuromed
1212EuropeEurope
1414
AmericasAmericas
66

202007 FINANCIAL RESULTS FEBRUARY 14th 2008
MARKET SEGMENT VARIATION
Source: Global Insight
0 12,000
MPV
2003-2007 Worldwide growth(thousand units)(Global Insight coverage)
2,000 4,000 6,000 8,000 10,000 14,000
LCV
SUV
E-F
D
C
B
A

212007 FINANCIAL RESULTS FEBRUARY 14th 2008

222007 FINANCIAL RESULTS FEBRUARY 14th 2008
Change2006 *Million euros 2007
TOTAL 39,969 40,682 + 1.8%
Sales Financing 1,911 2,003 + 4.8%
Automobile 38,058 38,679 + 1.6%
* 2006 data has been restated on a consistent basis
REVENUES BY DIVISION

232007 FINANCIAL RESULTS FEBRUARY 14th 2008
AUTOMOBILE DIVISION REVENUES UP 1.6% IN 2007Contribution to the change in revenues
Exchange rateVolume Mix/Price
ExchangerateVolume
+ 1.2FRANCE + EUROPE OTHERSEUROMED + AMERICAS
+ ASIA-AFRICA
- 2.6 + 3.1
+ 1.0 + 1.2
+ 0.0 + 0.0
+ 2.6
- 0.5
- 2.7
Mix/Price

242007 FINANCIAL RESULTS FEBRUARY 14th 2008
OPERATING MARGIN EVOLUTION
380
592471
722632
0
200
400
600
800
1,000
1,200
H1 2005 H2 2005 H1 2006 H2 2006 H1 2007 H2 20070.0%
1.0%
2.0%
3.0%
4.0%
5.0%
6.0%Automobile (million euros)
Sales Financing (RCI)
Group operating margin (%)
Automobile operating margin (%)
2.4%
1.3%
3.1%
943
4.4%
3.3%
1.9%
0.9%
1.6%
2.7%2.3%
3.5%
2.2%

![2007 AVI Interim Results - Final.ppt [Read-Only] · 2019. 9. 6. · 3 Group financial results Group financial results H1 07 H1 06 Income statement Rm Rm %Δ Continuing operations](https://img.pdfslide.net/doc/110x75/5ffa8d353dd02e786925c88f/2007-avi-interim-results-finalppt-read-only-2019-9-6-3-group-financial.jpg)