Embed Size (px)
Citation preview

2007 Financial Review Annual Report
yesterday today tomorrow
fertile futurePotashCorp: Supplying Fertilizer to the World
Through our growth from the largest Canadian potash company yesterday to the global leader of today with the promise of even more tomorrow, some things have never changed. For almost two decades we have helped farmers produce quality crops. Our help is needed even more today, because millions of people in booming offshore countries can now afford better, healthier diets and the modern consumer goods made with our products. Our high-quality resources – nitrogen, phosphate and particularly potash – are in demand as world requirements for food, fuel, feed and fi ber increase. And PotashCorp delivers, operating with care for the environment, our employees and the communities we serve, because we will be here tomorrow, too, fulfi lling our long-term promise.
$0.9 BILLION
$3.9 BILLION
$9.7 BILLION
1989
1999
2007
A local grower sells fruit and vegetables at a Malaysian market.
POTASHCORP ASSETS (at December 31)
POTASHCORP 2007 FINANCIAL REVIEW
1
TABLE OF CONTENTS
Introduction Letter from the CFO 2
Peer Comparisons 3
Management’s Discussion & AnalysisOur Global Story 4
Company Overview 6
PotashOverview 10
Strategy 13
Delivering 14
Risks 16
NitrogenOverview 17
Strategy 20
Delivering 20
Risks 20
PhosphateOverview 21
Strategy 24
Delivering 24
Risks 24
Key Performance Drivers 25
Rewarding Results 28
Risk Management 29
Factors That Shaped our Business in 2007 31
2007 Financial Overview 34
Business Segment Review 35
2008 Outlook 50
Liquidity and Capital Resources/Management 53
Accounting Estimates and Changes 60
11 Year Report 65
Financials Financial Performance Indicators 66
Independent Registered Chartered Accountants’ Reports 70
Consolidated Financial Statements 72
Appendix 113
learn even more onlineThis Financial Review Annual Report contains the heart of the 2007 PotashCorp story – the foundation built yesterday, our performance today, and the promise of a bright tomorrow. Much more detail is available in our online version, at PotashCorp2007AR.com, with keywords provided throughout this report to help locate specifi c information.
Financial data in this report are stated in US dollars unless otherwise noted. Share and per-share data have been adjusted to refl ect our three-for-one stock split in May 2007.
Learn more in our online report:
Keyword: PotashCorp2007AR.com
LOOK FOR…
POTASHCORP 2007 FINANCIAL REVIEW
L E T T E R F R O M T H E C F O2
“ OUR POTASH POTENTIAL IS TREMENDOUS. WITH HIGHER
DEMAND AND PRICES, AND AVERAGING A MILLION TONNES OF
NEW OPERATIONAL CAPACITY EACH YEAR FOR FIVE YEARS,
POTASH GROSS MARGIN COULD RISE SIGNIFICANTLY.”
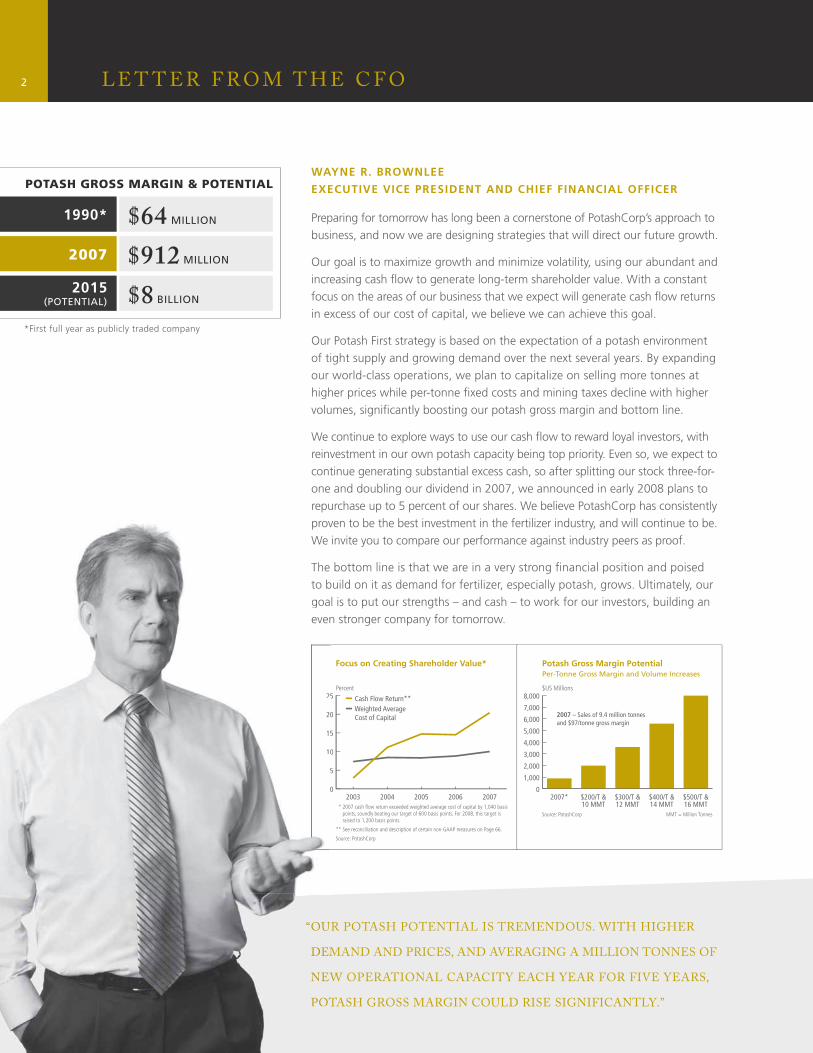
WAYNE R. BROWNLEE
EXECUTIVE VICE PRESIDENT AND CHIEF FINANCIAL OFFICER
Preparing for tomorrow has long been a cornerstone of PotashCorp’s approach to business, and now we are designing strategies that will direct our future growth.
Our goal is to maximize growth and minimize volatility, using our abundant and increasing cash fl ow to generate long-term shareholder value. With a constant focus on the areas of our business that we expect will generate cash fl ow returns in excess of our cost of capital, we believe we can achieve this goal.
Our Potash First strategy is based on the expectation of a potash environment of tight supply and growing demand over the next several years. By expanding our world-class operations, we plan to capitalize on selling more tonnes at higher prices while per-tonne fi xed costs and mining taxes decline with higher volumes, signifi cantly boosting our potash gross margin and bottom line.
We continue to explore ways to use our cash fl ow to reward loyal investors, with reinvestment in our own potash capacity being top priority. Even so, we expect to continue generating substantial excess cash, so after splitting our stock three-for-one and doubling our dividend in 2007, we announced in early 2008 plans to repurchase up to 5 percent of our shares. We believe PotashCorp has consistently proven to be the best investment in the fertilizer industry, and will continue to be. We invite you to compare our performance against industry peers as proof.
The bottom line is that we are in a very strong fi nancial position and poised to build on it as demand for fertilizer, especially potash, grows. Ultimately, our goal is to put our strengths – and cash – to work for our investors, building an even stronger company for tomorrow.
$64 MILLION
$912 MILLION
$8 BILLION
1990*
2007
2015(POTENTIAL)
0
5
10
15
20
25
20072006200520042003
Percent
* 2007 cash flow return exceeded weighted average cost of capital by 1,040 basis points, soundly beating our target of 600 basis points. For 2008, this target is raised to 1,200 basis points.
** See reconciliation and description of certain non-GAAP measures on Page 66.
Source: PotashCorp
Focus on Creating Shareholder Value*
Cash Flow Return**Weighted AverageCost of Capital
0
1,000
2,000
3,000
4,000
5,000
6,000
7,000
8,000
$500/T &16 MMT
$400/T &14 MMT
$300/T &12 MMT
$200/T &10 MMT
2007*
$US Millions
Source: PotashCorp MMT = Million Tonnes
Potash Gross Margin PotentialPer-Tonne Gross Margin and Volume Increases
2007 – Sales of 9.4 million tonnes and $97/tonne gross margin
*First full year as publicly traded company
POTASH GROSS MARGIN & POTENTIAL
“ OU
DEM
NEW
POT
provWe
The to bgoaeven
0
5
10
15
20
25
3
POTASHCORP 2007 FINANCIAL REVIEW
P E E R C O M PA R I S O N S
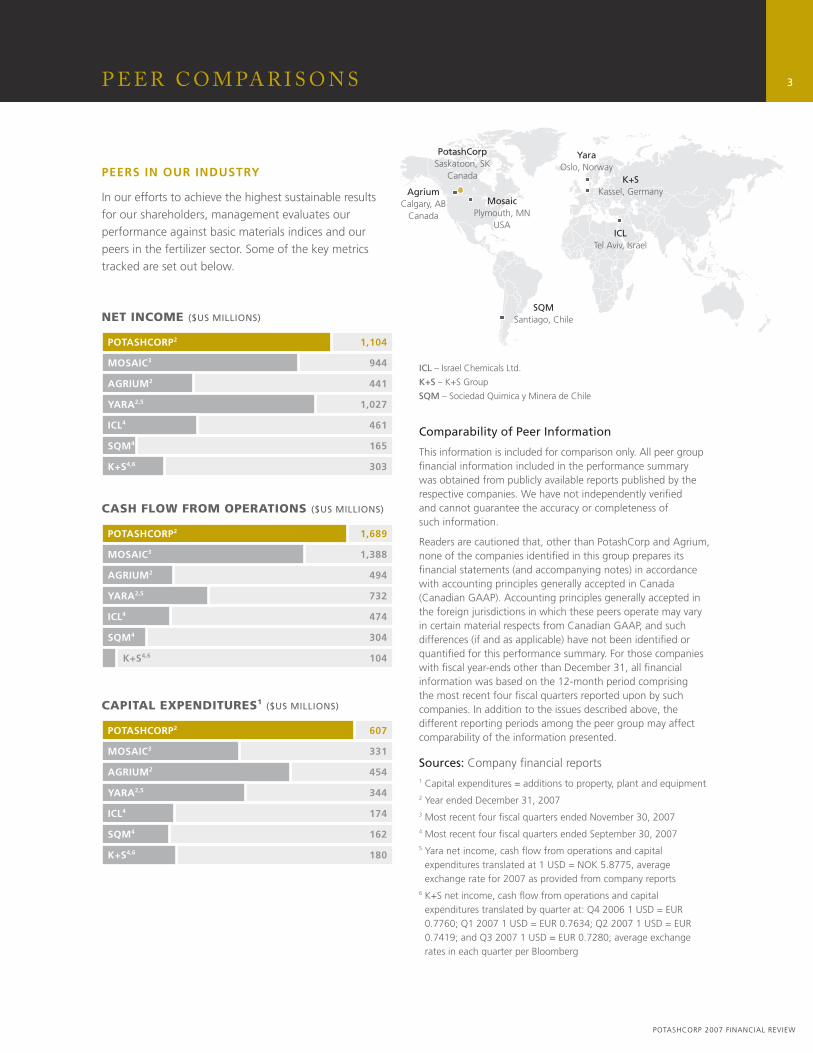
PEERS IN OUR INDUSTRY
In our efforts to achieve the highest sustainable results for our shareholders, management evaluates our performance against basic materials indices and our peers in the fertilizer sector. Some of the key metrics tracked are set out below.
Comparability of Peer Information
This information is included for comparison only. All peer group fi nancial information included in the performance summary was obtained from publicly available reports published by the respective companies. We have not independently verifi ed and cannot guarantee the accuracy or completeness of such information.
Readers are cautioned that, other than PotashCorp and Agrium, none of the companies identifi ed in this group prepares its fi nancial statements (and accompanying notes) in accordance with accounting principles generally accepted in Canada (Canadian GAAP). Accounting principles generally accepted in the foreign jurisdictions in which these peers operate may vary in certain material respects from Canadian GAAP, and such differences (if and as applicable) have not been identifi ed or quantifi ed for this performance summary. For those companies with fi scal year-ends other than December 31, all fi nancial information was based on the 12-month period comprising the most recent four fi scal quarters reported upon by such companies. In addition to the issues described above, the different reporting periods among the peer group may affect comparability of the information presented.
Sources: Company fi nancial reports1 Capital expenditures = additions to property, plant and equipment2 Year ended December 31, 20073 Most recent four fi scal quarters ended November 30, 20074 Most recent four fi scal quarters ended September 30, 20075 Yara net income, cash fl ow from operations and capital
expenditures translated at 1 USD = NOK 5.8775, average exchange rate for 2007 as provided from company reports
6 K+S net income, cash fl ow from operations and capital expenditures translated by quarter at: Q4 2006 1 USD = EUR 0.7760; Q1 2007 1 USD = EUR 0.7634; Q2 2007 1 USD = EUR 0.7419; and Q3 2007 1 USD = EUR 0.7280; average exchange rates in each quarter per Bloomberg
PotashCorpSaskatoon, SK
Canada
MosaicPlymouth, MN
USA
AgriumCalgary, AB
Canada
K+SKassel, Germany
SQMSantiago, Chile
ICLTel Aviv, Israel
YaraOslo, Norway
ICL – Israel Chemicals Ltd.
K+S – K+S Group
SQM – Sociedad Quimica y Minera de Chile
0 1400
NET INCOME ($US MILLIONS)
1,104
944
441
1,027
461
165
303K+S4,6
SQM4
ICL4
YARA2,5
AGRIUM2
MOSAIC3
POTASHCORP2
0 1400
CASH FLOW FROM OPERATIONS ($US MILLIONS)
1,689
1,388
494
732
474
304
104 K+S4,6
SQM4
ICL4
YARA2,5
AGRIUM2
MOSAIC3
POTASHCORP2
0 1400
CAPITAL EXPENDITURES1 ($US MILLIONS)
607
331
454
344
174
162
180K+S4,6
SQM4
ICL4
YARA2,5
AGRIUM2
MOSAIC3
POTASHCORP2
POTASHCORP 2007 FINANCIAL REVIEW
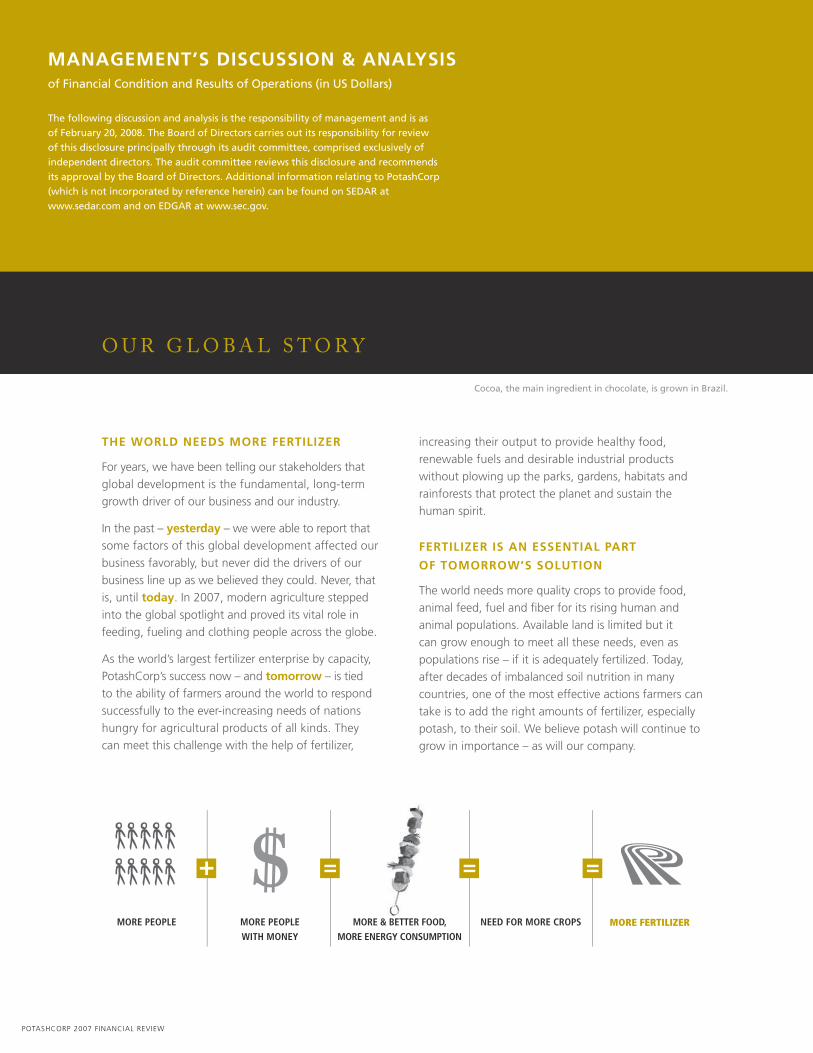
THE WORLD NEEDS MORE FERTILIZER
For years, we have been telling our stakeholders that global development is the fundamental, long-term growth driver of our business and our industry.
In the past – yesterday – we were able to report that some factors of this global development affected our business favorably, but never did the drivers of our business line up as we believed they could. Never, that is, until today. In 2007, modern agriculture stepped into the global spotlight and proved its vital role in feeding, fueling and clothing people across the globe.
As the world’s largest fertilizer enterprise by capacity, PotashCorp’s success now – and tomorrow – is tied to the ability of farmers around the world to respond successfully to the ever-increasing needs of nations hungry for agricultural products of all kinds. They can meet this challenge with the help of fertilizer,
increasing their output to provide healthy food, renewable fuels and desirable industrial products without plowing up the parks, gardens, habitats and rainforests that protect the planet and sustain the human spirit.
FERTILIZER IS AN ESSENTIAL PART
OF TOMORROW’S SOLUTION
The world needs more quality crops to provide food, animal feed, fuel and fi ber for its rising human and animal populations. Available land is limited but it can grow enough to meet all these needs, even as populations rise – if it is adequately fertilized. Today, after decades of imbalanced soil nutrition in many countries, one of the most effective actions farmers can take is to add the right amounts of fertilizer, especially potash, to their soil. We believe potash will continue to grow in importance – as will our company.
O U R G L O B A L S T O R Y
The following discussion and analysis is the responsibility of management and is as of February 20, 2008. The Board of Directors carries out its responsibility for review of this disclosure principally through its audit committee, comprised exclusively of independent directors. The audit committee reviews this disclosure and recommends its approval by the Board of Directors. Additional information relating to PotashCorp (which is not incorporated by reference herein) can be found on SEDAR at www.sedar.com and on EDGAR at www.sec.gov.
MANAGEMENT’S DISCUSSION & ANALYSISof Financial Condition and Results of Operations (in US Dollars)
MORE PEOPLE MORE PEOPLE WITH MONEY
MORE & BETTER FOOD, MORE ENERGY CONSUMPTION
NEED FOR MORE CROPS MORE FERTILIZER
+ = = =
Cocoa, the main ingredient in chocolate, is grown in Brazil.
5
POTASHCORP 2007 FINANCIAL REVIEW
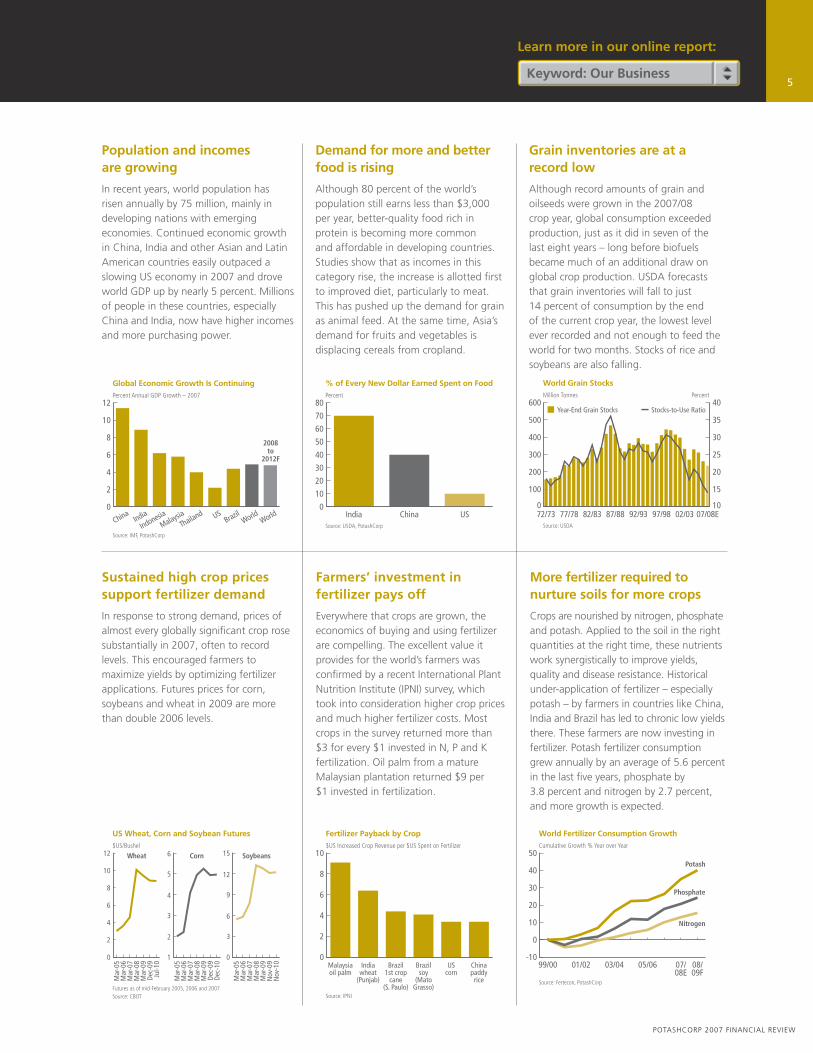
Sustained high crop prices support fertilizer demand
In response to strong demand, prices of almost every globally signifi cant crop rose substantially in 2007, often to record levels. This encouraged farmers to maximize yields by optimizing fertilizer applications. Futures prices for corn, soybeans and wheat in 2009 are more than double 2006 levels.
Farmers’ investment in fertilizer pays off
Everywhere that crops are grown, the economics of buying and using fertilizer are compelling. The excellent value it provides for the world’s farmers was confi rmed by a recent International Plant Nutrition Institute (IPNI) survey, which took into consideration higher crop prices and much higher fertilizer costs. Most crops in the survey returned more than $3 for every $1 invested in N, P and K fertilization. Oil palm from a mature Malaysian plantation returned $9 per $1 invested in fertilization.
More fertilizer required to nurture soils for more crops
Crops are nourished by nitrogen, phosphate and potash. Applied to the soil in the right quantities at the right time, these nutrients work synergistically to improve yields, quality and disease resistance. Historical under-application of fertilizer – especially potash – by farmers in countries like China, India and Brazil has led to chronic low yields there. These farmers are now investing in fertilizer. Potash fertilizer consumption grew annually by an average of 5.6 percent in the last fi ve years, phosphate by 3.8 percent and nitrogen by 2.7 percent, and more growth is expected.
0
100
200
300
400
500
600
07/08E02/0397/9892/9387/8882/8377/7872/73
Million Tonnes Percent
Source: USDA
World Grain Stocks
10
15
20
25
30
35
40Year-End Grain Stocks Stocks-to-Use Ratio
0
2
4
6
8
10
Chinapaddy
rice
UScorn
Brazilsoy
(MatoGrasso)
Brazil1st crop
cane(S. Paulo)
Indiawheat
(Punjab)
Malaysiaoil palm
$US Increased Crop Revenue per $US Spent on Fertilizer
Source: IPNI
Fertilizer Payback by Crop
0
10
20
30
40
50
60
70
80
USChinaIndia
Percent
Source: USDA, PotashCorp
% of Every New Dollar Earned Spent on Food
-10
0
10
20
30
40
50
08/09F
07/08E
05/0603/0401/0299/00
Cumulative Growth % Year over Year
Source: Fertecon, PotashCorp
World Fertilizer Consumption Growth
Potash
Phosphate
Nitrogen
0
2
4
6
8
10
12
WorldWorldBrazilUS
ThailandMalaysia
IndonesiaIndiaChina
Percent Annual GDP Growth – 2007
Source: IMF, PotashCorp
Global Economic Growth Is Continuing
2008to
2012F
$US/Bushel
Futures as of mid-February 2005, 2006 and 2007Source: CBOT
US Wheat, Corn and Soybean Futures
Wheat Corn Soybeans
0
2
4
6
8
10
12
Jul-1
0De
c-09
Mar
-09
Mar
-08
Mar
-07
Mar
-06
Mar
-05
1
2
3
4
5
6
Dec-
10De
c-09
Mar
-09
Mar
-08
Mar
-07
Mar
-06
Mar
-05
0
3
6
9
12
15
Nov
-10
Nov
-09
Mar
-09
Mar
-08
Mar
-07
Mar
-06
Mar
-05
Population and incomesare growing
In recent years, world population has risen annually by 75 million, mainly in developing nations with emerging economies. Continued economic growth in China, India and other Asian and Latin American countries easily outpaced a slowing US economy in 2007 and drove world GDP up by nearly 5 percent. Millions of people in these countries, especially China and India, now have higher incomes and more purchasing power.
Demand for more and better food is rising
Although 80 percent of the world’s population still earns less than $3,000 per year, better-quality food rich in protein is becoming more common and affordable in developing countries. Studies show that as incomes in this category rise, the increase is allotted fi rst to improved diet, particularly to meat. This has pushed up the demand for grain as animal feed. At the same time, Asia’s demand for fruits and vegetables is displacing cereals from cropland.
Grain inventories are at a record low
Although record amounts of grain and oilseeds were grown in the 2007/08 crop year, global consumption exceeded production, just as it did in seven of the last eight years – long before biofuels became much of an additional draw on global crop production. USDA forecasts that grain inventories will fall to just 14 percent of consumption by the end of the current crop year, the lowest level ever recorded and not enough to feed the world for two months. Stocks of rice and soybeans are also falling.
Learn more in our online report:
Keyword: Our Business
6 C O M PA N Y O V E R V I E W
POTASHCORP – AN OVERVIEW
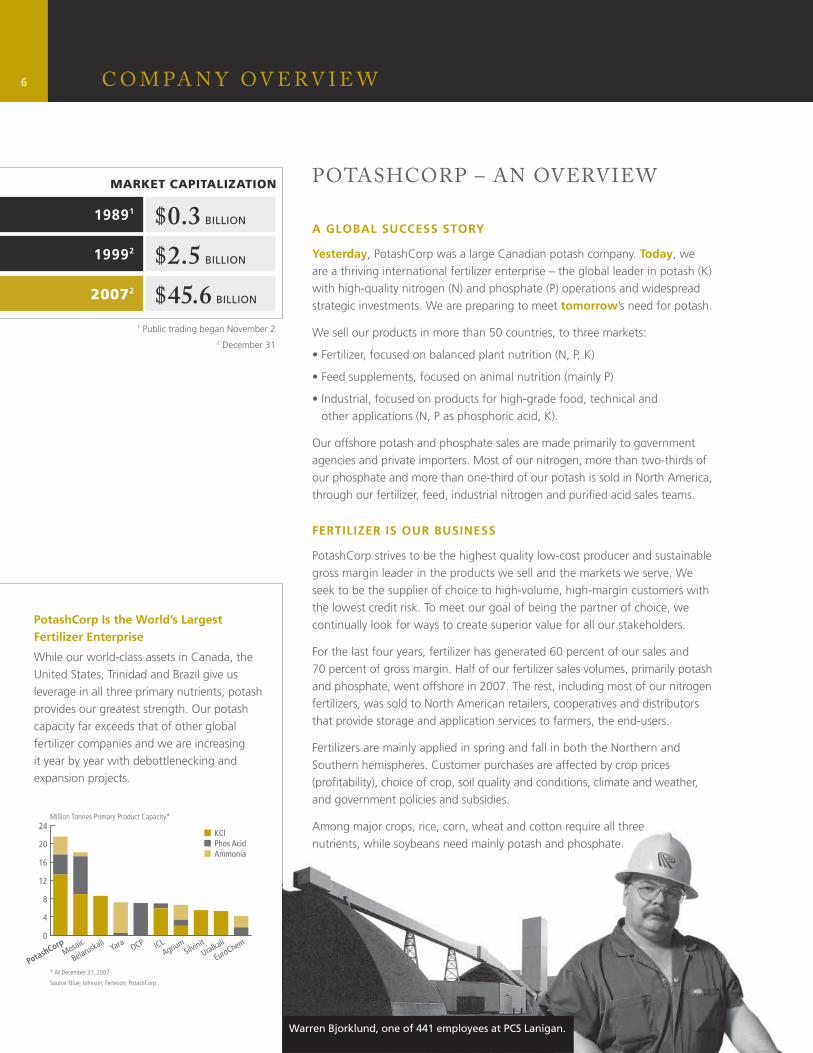
$0.3 BILLION
$2.5 BILLION
$45.6 BILLION
19891
19992
20072
Warren Bjorklund, one of 441 employees at PCS Lanigan.
MARKET CAPITALIZATION
1 Public trading began November 22 December 31
0
4
8
12
16
20
24
EuroChemUralkali
SilvinitAgriumICL
OCPYara
BelaruskaliMosaic
PotashCorp
Million Tonnes Primary Product Capacity*
* At December 31, 2007
Source: Blue, Johnson; Fertecon; PotashCorp
KClPhos AcidAmmonia
PotashCorp Is the World’s Largest Fertilizer Enterprise
While our world-class assets in Canada, the United States, Trinidad and Brazil give us leverage in all three primary nutrients, potash provides our greatest strength. Our potash capacity far exceeds that of other global fertilizer companies and we are increasing it year by year with debottlenecking and expansion projects.
A GLOBAL SUCCESS STORY
Yesterday, PotashCorp was a large Canadian potash company. Today, we are a thriving international fertilizer enterprise – the global leader in potash (K) with high-quality nitrogen (N) and phosphate (P) operations and widespread strategic investments. We are preparing to meet tomorrow’s need for potash.
We sell our products in more than 50 countries, to three markets:
• Fertilizer, focused on balanced plant nutrition (N, P, K)
• Feed supplements, focused on animal nutrition (mainly P)
• Industrial, focused on products for high-grade food, technical and other applications (N, P as phosphoric acid, K).
Our offshore potash and phosphate sales are made primarily to government agencies and private importers. Most of our nitrogen, more than two-thirds of our phosphate and more than one-third of our potash is sold in North America, through our fertilizer, feed, industrial nitrogen and purifi ed acid sales teams.
FERTILIZER IS OUR BUSINESS
PotashCorp strives to be the highest quality low-cost producer and sustainable gross margin leader in the products we sell and the markets we serve. We seek to be the supplier of choice to high-volume, high-margin customers with the lowest credit risk. To meet our goal of being the partner of choice, we continually look for ways to create superior value for all our stakeholders.
For the last four years, fertilizer has generated 60 percent of our sales and 70 percent of gross margin. Half of our fertilizer sales volumes, primarily potash and phosphate, went offshore in 2007. The rest, including most of our nitrogen fertilizers, was sold to North American retailers, cooperatives and distributors that provide storage and application services to farmers, the end-users.
Fertilizers are mainly applied in spring and fall in both the Northern and Southern hemispheres. Customer purchases are affected by crop prices (profi tability), choice of crop, soil quality and conditions, climate and weather, and government policies and subsidies.
Among major crops, rice, corn, wheat and cotton require all three nutrients, while soybeans need mainly potash and phosphate.
POTASHCORP 2007 FINANCIAL REVIEW
C O M PA N Y O V E R V I E W 7
BUILDING EXCELLENCE ON POTASH FIRST
Potash Is the Heart of Our Business
Our biggest earnings contributor, generating almost half of our total gross margin in 2007, potash offers our greatest growth potential. Therefore, it is the focus of our long-term strategic plan – our Potash First strategy.
Potash also provides signifi cant global reach, in end-markets and through our investments in related offshore companies. Almost 60 percent of our production is used in growing international markets for agricultural commodities such as rice, soybeans, corn, palm oil, sugar, rubber, bananas, oranges and coffee. The remainder goes to offshore industrial uses and to the North American market, which has historically been stable due to the maturity of its agriculture system.
Nitrogen and Phosphate Add Depth and Breadth
PotashCorp is also a major global producer of nitrogen and phosphate. In 2007, our nitrogen business generated about 28 percent of our gross margin, while phosphate produced about 23 percent.
Our nitrogen operations are divided between Trinidad, where we have long-term, lower-cost gas contracts with National Gas Company of Trinidad and Tobago Limited, and the US. We produce approximately two-thirds of our ammonia in Trinidad while emphasizing industrial products in the US.
As the most diversifi ed global phosphate producer, we offer a full product range: phosphoric acid, liquid and solid fertilizers, feed supplements for livestock and poultry, and products used by industry, such as purifi ed acid.
Feed and Industrial Are Stable Businesses
Our feed and industrial sales are considerably less seasonal and cyclical – and therefore less volatile – than fertilizer sales, which increases the quality of earnings in these segments.
We sell feed products primarily to US bulk feed producers that blend them into animal feeds. Latin America and Asia are our largest offshore feed markets.
Nitrogen, phosphate and potash are used by industry to make important products for modern living, such as
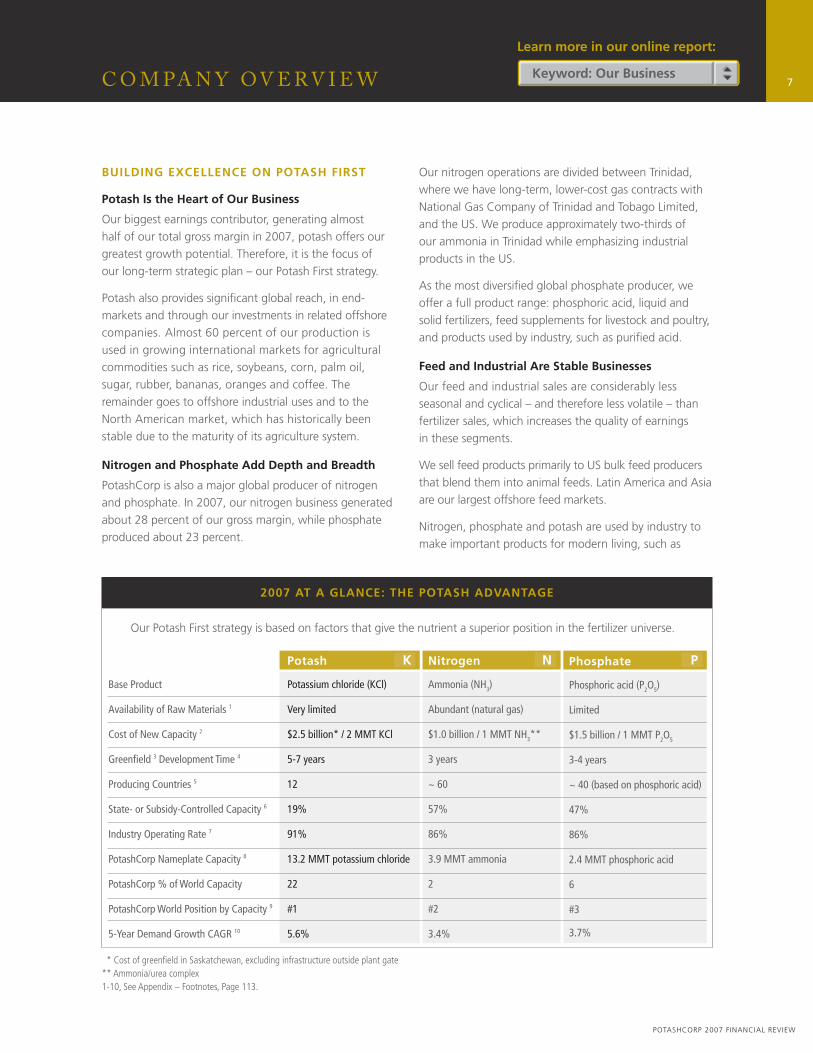
Base Product
Availability of Raw Materials 1
Cost of New Capacity 2
Greenfi eld 3 Development Time 4
Producing Countries 5
State- or Subsidy-Controlled Capacity 6
Industry Operating Rate 7
PotashCorp Nameplate Capacity 8
PotashCorp % of World Capacity
PotashCorp World Position by Capacity 9
5-Year Demand Growth CAGR 10
2007 AT A GLANCE: THE POTASH ADVANTAGE
Potash
Potassium chloride (KCl)
Very limited
$2.5 billion* / 2 MMT KCl
5-7 years
12
19%
91%
13.2 MMT potassium chloride
22
#1
5.6%
Nitrogen
Ammonia (NH3)
Abundant (natural gas)
$1.0 billion / 1 MMT NH3**
3 years
~ 60
57%
86%
3.9 MMT ammonia
2
#2
3.4%
Phosphate
Phosphoric acid (P2O5)
Limited
$1.5 billion / 1 MMT P2O5
3-4 years
~ 40 (based on phosphoric acid)
47%
86%
2.4 MMT phosphoric acid
6
#3
3.7%
K N P
Our Potash First strategy is based on factors that give the nutrient a superior position in the fertilizer universe.
* Cost of greenfi eld in Saskatchewan, excluding infrastructure outside plant gate** Ammonia/urea complex1-10, See Appendix – Footnotes, Page 113.
Learn more in our online report:
Keyword: Our Business
POTASHCORP 2007 FINANCIAL REVIEW
adhesives, resins and foams for the construction and automotive industries, soft drinks, metal cleaners, computer and TV screens, soaps, de-icers and water softeners. Rising incomes in developing countries are driving growth in offshore demand for these products.
Availability of Supply and Quality Matter
In the current robust agricultural markets, availability of supply is customers’ fi rst concern in their buying decisions for our products. PotashCorp ranks well above the industry average in reliability of supply and product quality, according to our annual customer surveys.
OUR VALUE PROPOSITION
Potash for Growth, Trinidad Nitrogen and Phosphate Diversity for Earnings Stability
We strive to generate long-term growth while minimizing fl uctuations in our earnings.
To maximize long-term value, we concentrate on areas of our business that generate the highest margins – potash, Trinidad nitrogen and our diverse phosphate products. Sustained margins in these businesses are supported by our lower-cost production capabilities. Our long-term natural gas contracts in Trinidad and proximity to the US market give us signifi cant cost advantages in nitrogen, just as our high-quality rock enables us to make the entire range of phosphate products.
DELIVERING TODAY WHILE MAPPING OUR FUTURE
In current market conditions, we are generating substantial free cash fl ow – and we expect to continue to do so. We carefully weigh the choices for our cash, evaluating the best return on any investment that matches our Potash First strategy. Our goal is to have cash fl ow return materially exceed cost of capital.
C O M PA N Y O V E R V I E W8
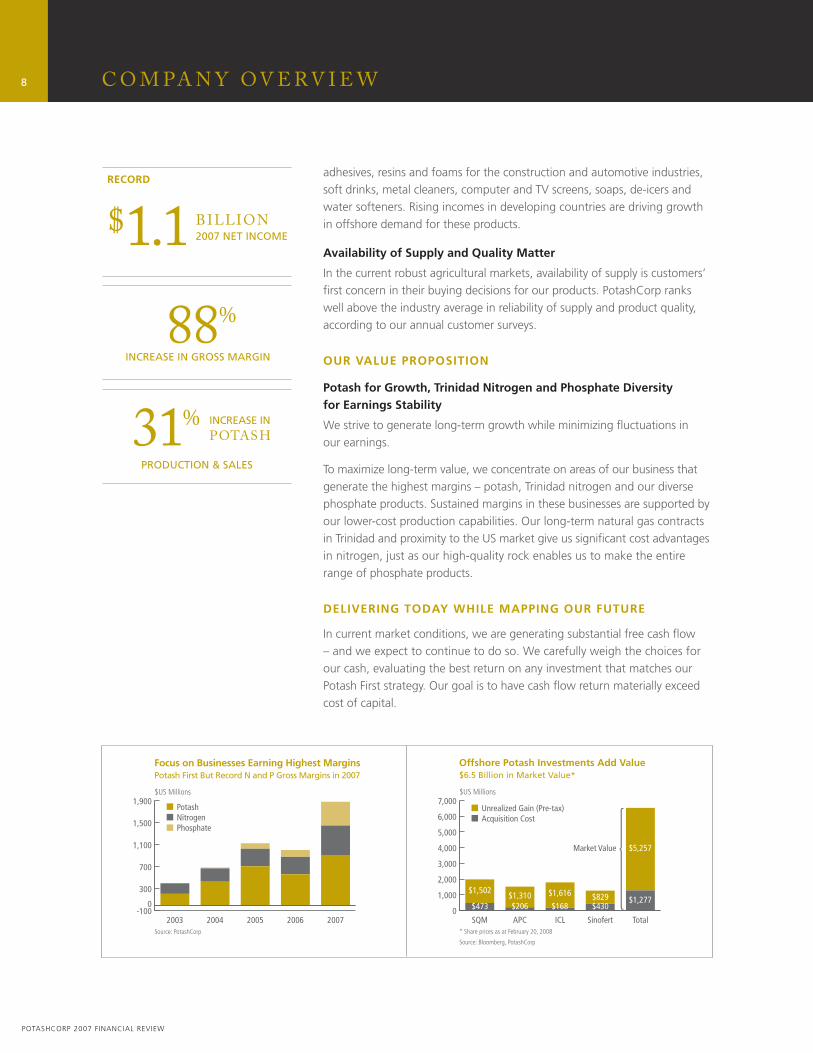
-100
300
700
1,100
1,500
1,900
20072006200520042003
0
$US Millions
Source: PotashCorp
Focus on Businesses Earning Highest MarginsPotash First But Record N and P Gross Margins in 2007
PotashNitrogenPhosphate
0
1,000
2,000
3,000
4,000
5,000
6,000
7,000
TotalSinofertICLAPCSQM
$US Millions
* Share prices as at February 20, 2008
Source: Bloomberg, PotashCorp
Offshore Potash Investments Add Value$6.5 Billion in Market Value*
Unrealized Gain (Pre-tax)Acquisition Cost
Market Value
$1,502
$473
$1,616
$168
$5,257
$1,277$1,310$206
$829$430
88%
INCREASE IN GROSS MARGIN
INCREASE IN
POTASH
$1.1 BILLION
31%
PRODUCTION & SALES
2007 NET INCOME
RECORD
POTASHCORP 2007 FINANCIAL REVIEW
C O M PA N Y O V E R V I E W
We have always exercised great discipline in capital allocation so much of our cash fl ow is, and will be, invested in expanding our own potash capacity. At the same time, we seek to increase our offshore potash investments and explore other merger and acquisition opportunities that fi t the Potash First strategy.
We also consider share repurchase and increased dividends as effective ways to maximize shareholder value over the long term. We used our strong cash fl ow to repurchase 28.5 million shares in 2005, confi dent that our potash assets are the best in the world. At an average cost of almost $30 per share, this added signifi cant shareholder value. We announced another repurchase in January 2008 of up to 15.8 million shares, viewing this as an opportunity to add further value. In conjunction with a three-for-one stock split in May 2007, we doubled our quarterly dividend.
CAPABILITY TO DELIVER
To ensure we can deliver on our value proposition and support our vision and strategy, we rely on several key assets:
• An experienced management team that takes a broad view of our business, develops long-term strategies and commits the company to them
• A solid capital structure that enables us to take advantage of opportunities and withstand normal short-term business fl uctuations
• Substantial cash fl ow, which is both the result and the cause of our success
• A productive workforce, motivated sales teams and coordinated transportation network.
9
Many spices, including cardamom,
are grown in India.
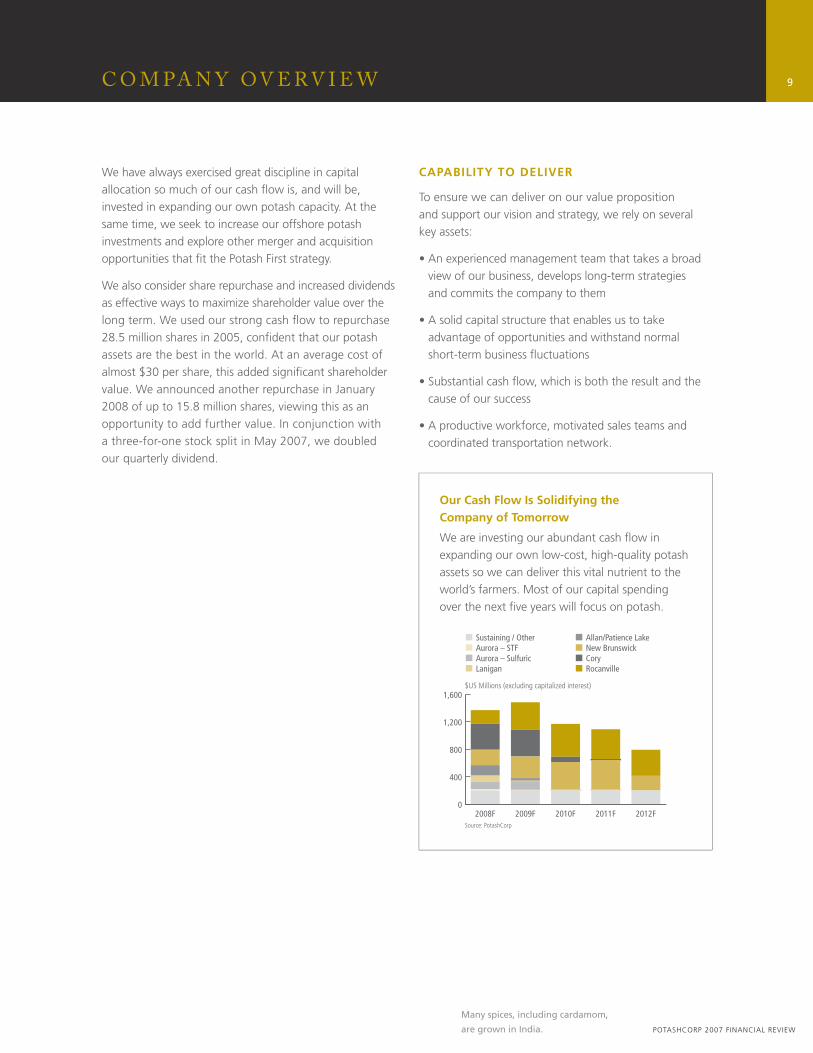
Our Cash Flow Is Solidifying the Company of Tomorrow
We are investing our abundant cash fl ow in expanding our own low-cost, high-quality potash assets so we can deliver this vital nutrient to the world’s farmers. Most of our capital spending over the next fi ve years will focus on potash.
0
400
800
1,200
1,600
2012F2011F2010F2009F2008F
$US Millions (excluding capitalized interest)
Source: PotashCorp
Sustaining / OtherAurora – STFAurora – SulfuricLanigan
Allan/Patience LakeNew BrunswickCoryRocanville
POTASHCORP 2007 FINANCIAL REVIEW
P O TA S H1 0
POTASHCORP – THE GLOBAL POTASH LEADER
OVERVIEW
The World of Potash and Our Place in It
PotashCorp is the world’s largest potash producer, with almost one-quarter of global capacity. We own and operate six mines in Saskatchewan and New Brunswick, with mineral rights at another Saskatchewan mine. We have announced plans to raise production potential by more than 70 percent from 2007 levels by the end of 2012 and, by 2015, up to 90 percent.
Potash: The Best Long-Term Fertilizer Enterprise
Potash has many structural advantages over the other primary nutrient businesses.
Good Deposits Are Rare
Few good potash deposits exist that are economical to mine, so only 12 countries produce signifi cant amounts. Two-thirds of world production and three-quarters of reserves are in Canada, Russia and Belarus.
Ownership Is Primarily Private
Most global potash ownership is in the private sector, where decisions are more likely to be made for economic rather than political reasons. This means that reinvestment and supply fundamentals are more market-oriented and predictable. Only in Belarus is there signifi cant government ownership, and its economy and GDP growth depend heavily on US dollar potash sales.
Signifi cant Barriers to Entry
With limited quality deposits worldwide and high and rapidly increasing costs for a greenfi eld mine, entry into the potash business is a formidable undertaking. Companies considering new mines in Saskatchewan and elsewhere face capital costs estimated at $2.5 billion or more and fi ve to seven years in development time. This excludes infrastructure costs outside the plant for such necessary items as access roads, power and natural gas lines, rail lines and cars, and port facilities and related storage, which could signifi cantly exceed $500 million, depending on location. With no positive cash fl ow over the lengthy construction period, a greenfi eld mine carries considerable risk.
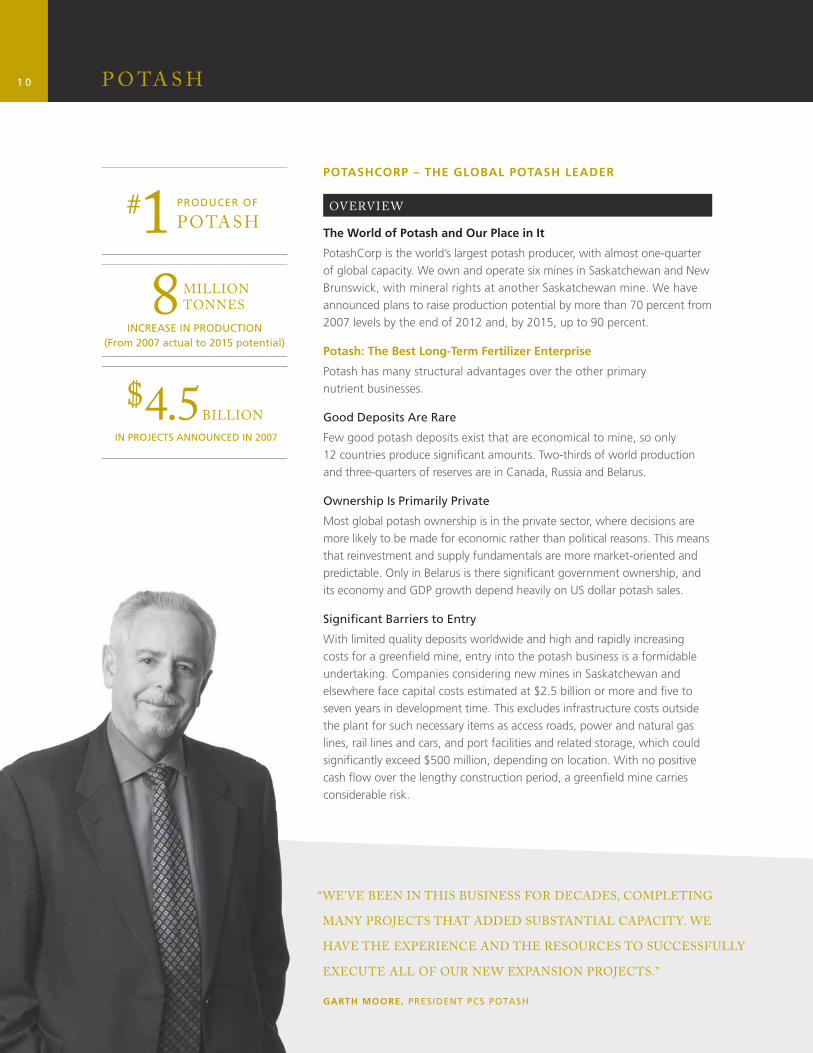
“ WE’VE BEEN IN THIS BUSINESS FOR DECADES, COMPLETING
MANY PROJECTS THAT ADDED SUBSTANTIAL CAPACITY. WE
HAVE THE EXPERIENCE AND THE RESOURCES TO SUCCESSFULLY
EXECUTE ALL OF OUR NEW EXPANSION PROJECTS.”
GARTH MOORE, PRESIDENT PCS POTASH
8
$4.5
#1
INCREASE IN PRODUCTION(From 2007 actual to 2015 potential)
MILLIONTONNES
BILLION
IN PROJECTS ANNOUNCED IN 2007
PRODUCER OF
POTASH
POTASHCORP 2007 FINANCIAL REVIEW
P O TA S H 1 1
STRENGTHS
• Capability to substantially raise capacity in less time than and at a signifi cant discount to comparable greenfi eld capacity
• Low-cost, fl exible production, with a small percentage of fi xed costs
• Declining per-tonne production costs and mining taxes with expanded volumes
• Long reserve lives from existing mine shafts
• Offshore potash-related investments add considerably to overall profi tability
• Substantial barriers to entry, with high capital costs and long lead times
• Few world producers, little government ownership
• No substitutable products for potash
WEAKNESSES
• High rail and ocean freight delivery costs for Saskatchewan potash, potential for bottlenecks
• Water infl ows at New Brunswick and Esterhazy increase production costs there and risk loss of production
• Production costs exposed to Canadian dollar volatility
• High Saskatchewan resource taxes and federal and provincial income taxes, relative to global competitors
OPPORTUNITIES
• Global food story, complemented by biofuels, is accelerating long-term growth expectations for potash consumption
• With competitors at or near maximum operating rates and limited expansion potential, planned capacity additions should enable PotashCorp to increase our percentage participation in a growing market
THREATS
• Potash demand growth could exceed company’s logistical capability to deliver in the short term
• Demand can be temporarily affected by changes in consumption patterns in offshore markets
• Substantial upward pricing trend may attract greenfi eld projects
• PotashCorp would be disproportionately affected by market weakness, particularly in the short term
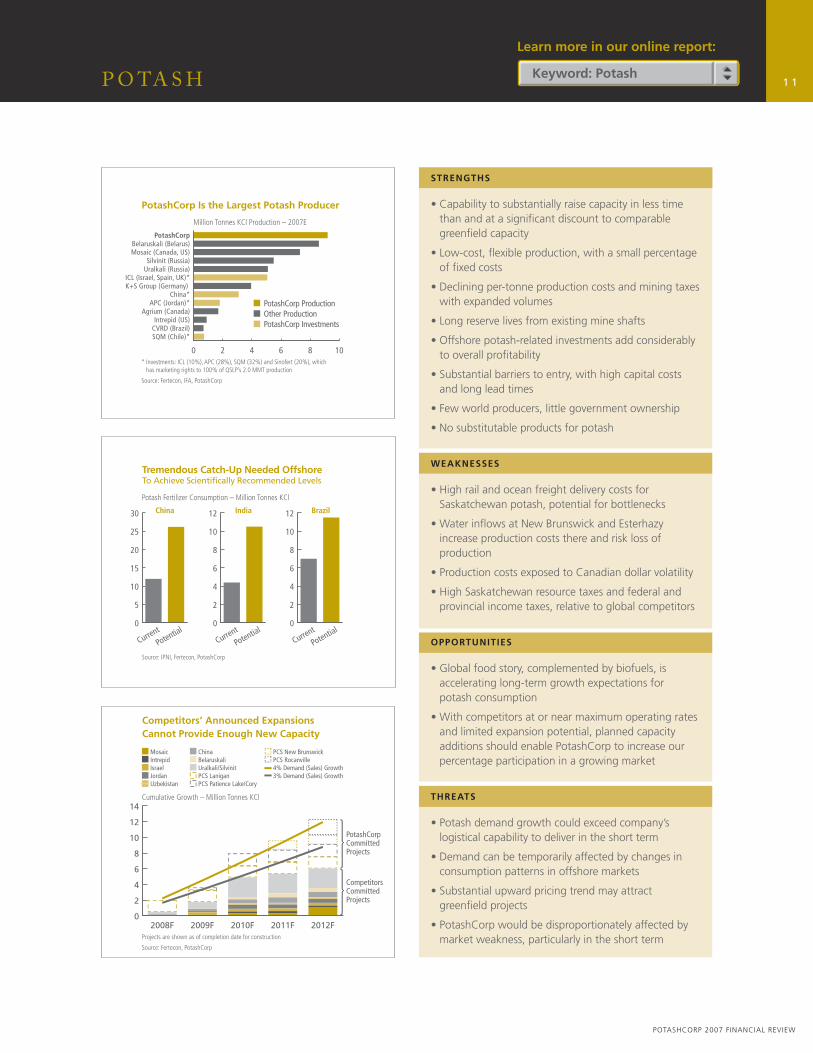
Million Tonnes KCl Production – 2007E
* Investments: ICL (10%), APC (28%), SQM (32%) and Sinofert (20%), which has marketing rights to 100% of QSLP’s 2.0 MMT production
Source: Fertecon, IFA, PotashCorp
PotashCorp Is the Largest Potash Producer
PotashCorp ProductionOther ProductionPotashCorp Investments
0 2 4 6 8 10
SQM (Chile)*CVRD (Brazil)Intrepid (US)
Agrium (Canada)APC (Jordan)*
China*K+S Group (Germany) ICL (Israel, Spain, UK)*
Uralkali (Russia)Silvinit (Russia)
Mosaic (Canada, US)Belaruskali (Belarus)
PotashCorp
Cumulative Growth – Million Tonnes KCl
Projects are shown as of completion date for construction
Source: Fertecon, PotashCorp
Competitors’ Announced Expansions Cannot Provide Enough New Capacity
MosaicIntrepidIsraelJordanUzbekistan
ChinaBelaruskaliUralkali/SilvinitPCS LaniganPCS Patience Lake/Cory
PCS New BrunswickPCS Rocanville4% Demand (Sales) Growth3% Demand (Sales) Growth
PotashCorpCommittedProjects
CompetitorsCommittedProjects
0
2
4
6
8
10
12
14
2012F2011F2010F2009F2008F
Potash Fertilizer Consumption – Million Tonnes KCl
China India Brazil
Source: IPNI, Fertecon, PotashCorp
Tremendous Catch-Up Needed Offshore To Achieve Scientifically Recommended Levels
0
5
10
15
20
25
30
PotentialCurrent
0
2
4
6
8
10
12
PotentialCurrent
0
2
4
6
8
10
12
PotentialCurrent
Learn more in our online report:
Keyword: Potash
12
POTASHCORP 2007 FINANCIAL REVIEW
P O TA S H
PotashCorp: A Long-Term Potash Enterprise
With 22 percent of world potash capacity, signifi cant plans for growth and plentiful high-quality reserves, PotashCorp can provide this vital nutrient to the world’s farmers far into the future. While we are a major supplier to North America, we sell nearly two-thirds of our potash offshore, particularly to developing nations. Their demand is rising sharply, and our sales are increasing with it. Our potash-related investments reinforce this major segment of our enterprise.
Potash Sales and Logistics: Offshore
PotashCorp is the largest contributor (55 percent) to Canpotex Limited (Canpotex), the offshore marketing company for Saskatchewan‘s three producers (others: Mosaic, Agrium). Other global marketing agencies such as Belarusian Potash Company (for Belaruskali and
Uralkali) and International Potash Company (for Silvinit), and producers such as ICL and K+S, compete with Canpotex in the key offshore markets of China, India, Brazil and Southeast Asia. The location of our New Brunswick operation gives PotashCorp an advantage in supplying Brazil and other Latin American countries.
The largest offshore customers purchase in different ways.
• China buys from Canpotex under three-year memoranda of understanding, with pricing negotiated annually. The current memorandum expires at the end of 2009.
• India has traditionally bought from Canpotex as needed under six- to 12-month price and volume contracts.
• Brazil buys from Canpotex and PCS Sales on the spot market, as do Southeast Asian countries from Canpotex.
By marketing jointly through Canpotex we reduce our transportation and distribution costs, which can be considerable when shipping product from Canada’s
interior. Approximately 40 percent of Canpotex customers buy at the port where the product is loaded and pay their own freight costs (FOB). Canpotex pays the freight for customers who buy on a delivered (CFR) basis. Thus, changing ocean freight rates can substantially affect margins.
Potash Sales and Logistics: North America
We sell to the eastern United States from our New Brunswick operation and to the rest of the US from Saskatchewan – particularly our Rocanville plant, which is just 95 miles from the US border. Our North American customers, who buy mainly on a CFR basis, are wholesalers, retailers and cooperatives that purchase on the spot market from PCS Sales. We do not sell directly to farmers. We own or lease more than 200 distribution points in the US, with most leases the variable cost type –
available if needed and paid for only when used. We own or lease almost 8,600 railcars. Product fl ow is managed by our transportation and distribution group.
Global and North American Competitors
China, India, Brazil and Southeast Asia are the principal markets for both FSU producers and Canpotex, and FSU producers also ship into the European Union. Europe and Brazil are the main K+S markets, while ICL ships to India, China, Southeast Asia, Brazil and Europe.
Our main North American competitors are Mosaic and Agrium. Our share of Canadian producers’ sales to the North American market was 42 percent in 2007.
Strategic Investments Enhance Our Enterprise
Investments in global potash-related companies provide strategic opportunities and signifi cant contributions to our bottom line. Our 32 percent ownership of SQM in Chile gives us an infl uential position in the world’s leading producer of specialty potassium, iodine and lithium
We have announced $4.5 billion of debottlenecks and expansions to raise our operational capacity to 15.7 million tonnes by the end of 2012, and potentially to 17.2 million tonnes three years later.
13
POTASHCORP 2007 FINANCIAL REVIEW
P O TA S H
Million Tonnes Operational Capacity*
* Capacity projects completed by the end of each year** 2012 includes a reduction for PotashCorp’s share of Esterhazy reserve depletion
Source: PotashCorp
PotashCorp Is Preparing to DeliverPotential 17.2 Million Tonnes KCl Before Greenfield
0
5
10
15
20
2013-152012**20112009-10200820072006
10.0MMT
Allan &Esterhazy
Cory &P. Lake
NewBrunswick
OtherSask.
Lanigan
Rocan-ville
17.2MMT
products. With 28 percent ownership of Arab Potash Company Ltd. (APC) in Jordan – which has a signifi cant logistical advantage in delivering to India and other Asian markets – we appoint the top four management positions. We own 10 percent of ICL in Israel, and now own 20 percent of fertilizer distributor Sinofert Holdings Limited (Sinofert) in China, the largest potash distributor in the world’s fastest growing market. Sinofert distributes approximately 60 percent of the fertilizer imported into China. It handles all product of Qinghai Salt Lake Potash Company (QSLP), the country’s largest producer, in which it owns an 18 percent interest. The largest offshore purchaser of Canadian potash, Sinofert generates more than half its gross margin through potash sales.
OUR STRATEGY
RAISE CAPACITY TO MEET RISING DEMAND
It is no accident that PotashCorp has the world’s greatest potash capacity when demand for this nutrient is climbing swiftly. We began preparing yesterday for the catch-up demand of today – with strategic purchases that consolidated our Saskatchewan base and added an operation in New Brunswick, Canada’s only East Coast producer. We also invested in offshore companies to extend our global reach. We are preparing for tomorrow by bringing on capacity through debottlenecking and expansion projects at our existing mines for substantially less than the cost of greenfi eld capacity. We continue to look for opportunities to extend our global enterprise through strategic investments or acquisitions.
Timing Capacity Additions to Market Need
Our potash value proposition requires us to time the completion of our expansion projects to the expected growth in offshore demand. This is more of an art than a science, since demand rarely moves in a straight line upward. The substantial increase in 2007, however, demonstrated that it is better to be slightly ahead of the curve in getting additional production capacity ready for the market.
Producing to Meet Market Demand
For almost two decades, we have sought to minimize downside risk by following the strategy of matching our production to market demand. This has caused some fl uctuations in our sales volumes, as temporary events can negatively affect short-term buying patterns even when the long-term trend is upward. This is particularly true when growth depends on offshore markets.
Greenfi eld Unlikely Threat to Our Strategy
With no signifi cant greenfi eld projects announced and long lead times for new developments, we do not expect new competitor mines for at least fi ve to seven years.
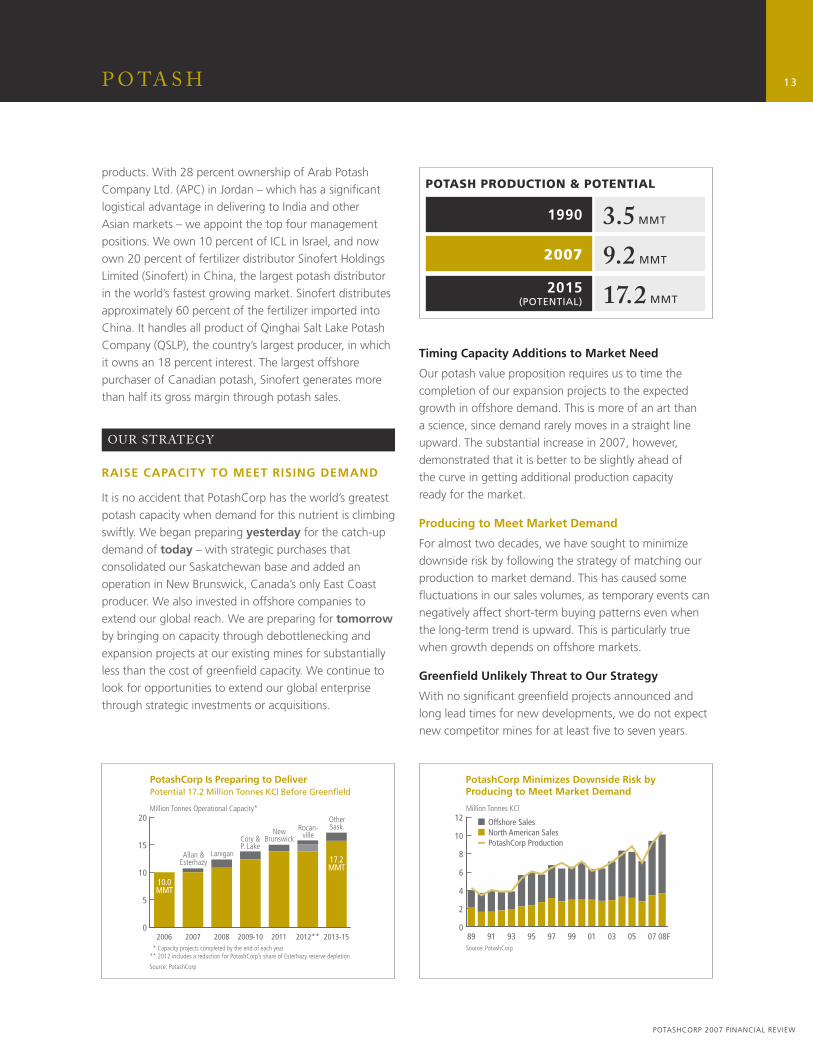
3.5 MMT
9.2 MMT
17.2 MMT
1990
2007
2015(POTENTIAL)
Million Tonnes KCl
Source: PotashCorp
PotashCorp Minimizes Downside Risk byProducing to Meet Market Demand
Offshore SalesNorth American SalesPotashCorp Production
0
2
4
6
8
10
12
08F07050301999795939189
POTASH PRODUCTION & POTENTIAL
14
POTASHCORP 2007 FINANCIAL REVIEW
P O TA S H
While rising potash prices and profi tability increase the possibility that greenfi eld mines could be developed, the cost and time required to establish a world-scale mine, mill and supporting infrastructure remain a major impediment.
DELIVERING ON OUR POTASH PROMISE
Preparing for Tomorrow’s Needs
In 2007, we announced almost $4.5 billion in new projects at our Patience Lake, Cory, Rocanville and New Brunswick operations. Debottlenecking should be complete at Patience Lake by the end of 2008, while Cory’s debottleneck/expansion is expected to be completed by mid-2010. We expect ramp-up at our new mine and expanded mill at New Brunswick to begin by the end of 2011, and a large mine and mill expansion project at Rocanville is expected to be complete one year later.
We expect to develop an additional 1.5 million tonnes of potential capacity in Saskatchewan by 2015, and we are updating long-standing plans for a greenfi eld mine at Bredenbury, Saskatchewan.
Investing in Transportation and Distribution Infrastructure
Raising our operational capacity by approximately 5 million tonnes over fi ve years requires investment in our transportation and distribution infrastructure and close cooperation with our rail transportation partners.
Because most long-term growth in demand is expected to come from offshore markets, Canpotex increased capacity at its Portland, Oregon terminal by 1 million tonnes in 2007. It is also considering expansion alternatives for Vancouver’s Neptune terminal, and a potential new West Coast export terminal.
To meet rising Brazilian demand, two bulk fertilizer warehouses, one at Lavras that we own and another at the Port of Santos – the Perola Bulk Fertilizer Terminal that we lease through a joint venture company in which we are the majority shareholder – became fully operational in 2007. Perola’s capacity is now estimated at 750,000 tonnes. Since construction began in 2005, we have invested more than $10 million in these facilities.
In 2007, Canpotex ordered 1,000 new specialized potash railcars to add to the 3,500 it already leases, and it proposes to add more over the next few years.
By investing $85 million in effi ciency improvements and new automation technology for rail and loadout facilities at Allan and Lanigan, we are increasing throughput capacity to move more product faster.
Our existing contract with Canadian National Railway continues until 2010 while Canpotex has a contract with CP Rail until 2012.
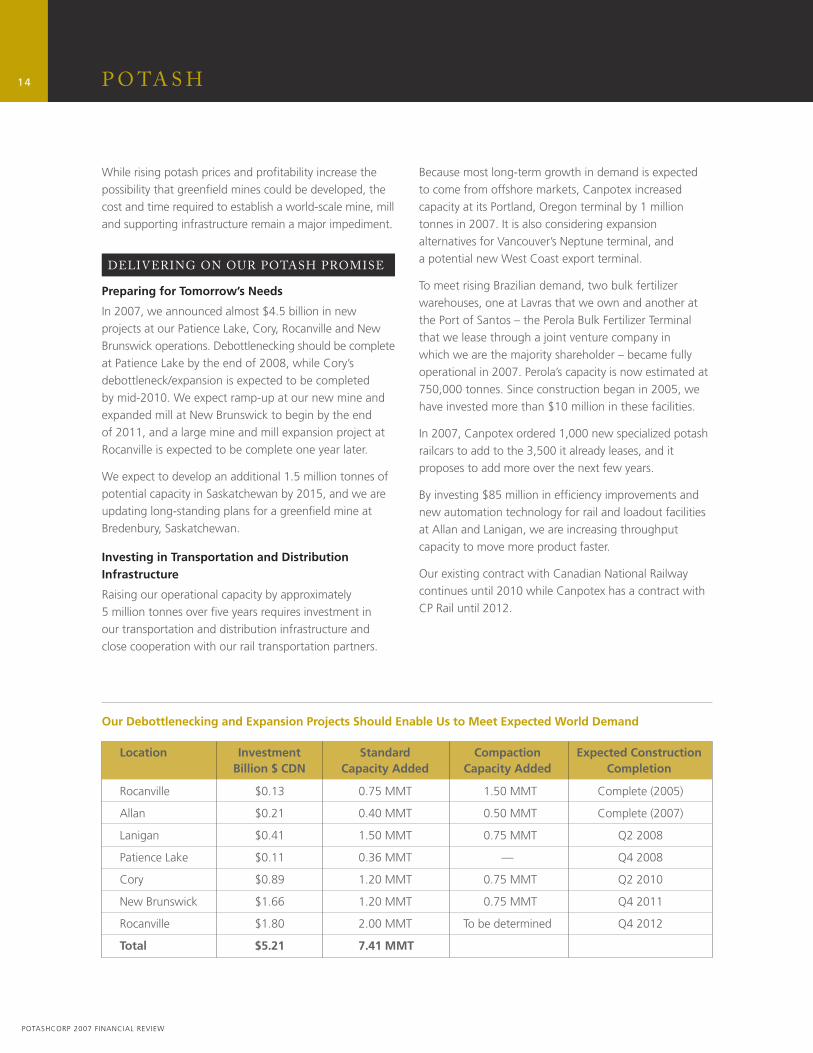
Rocanville $0.13 0.75 MMT 1.50 MMT Complete (2005)
Allan $0.21 0.40 MMT 0.50 MMT Complete (2007)
Lanigan $0.41 1.50 MMT 0.75 MMT Q2 2008
Patience Lake $0.11 0.36 MMT — Q4 2008
Cory $0.89 1.20 MMT 0.75 MMT Q2 2010
New Brunswick $1.66 1.20 MMT 0.75 MMT Q4 2011
Rocanville $1.80 2.00 MMT To be determined Q4 2012
Total $5.21 7.41 MMT
Location Investment Standard Compaction Expected Construction Billion $ CDN Capacity Added Capacity Added Completion
Our Debottlenecking and Expansion Projects Should Enable Us to Meet Expected World Demand
15
POTASHCORP 2007 FINANCIAL REVIEW
P O TA S H
$US/Short Ton KCl Granular FOB Saskatchewan Mine
2004 2005 2006 2007 2008Source: PotashCorp
80
120
160
200
240
280
320
360
400
AJOJAJOJAJO JAJOJAJ
$US/MT KCl – Spot Price
2003 2004 2005 2006 2007 2008Source: Fertecon, FMB, OMS, PotashCorp
CFR Brazil GranularCFR Malaysia Standard
100
200
300
400
500
600
AJOJAJOJAJOJAJOJAJOJAJ
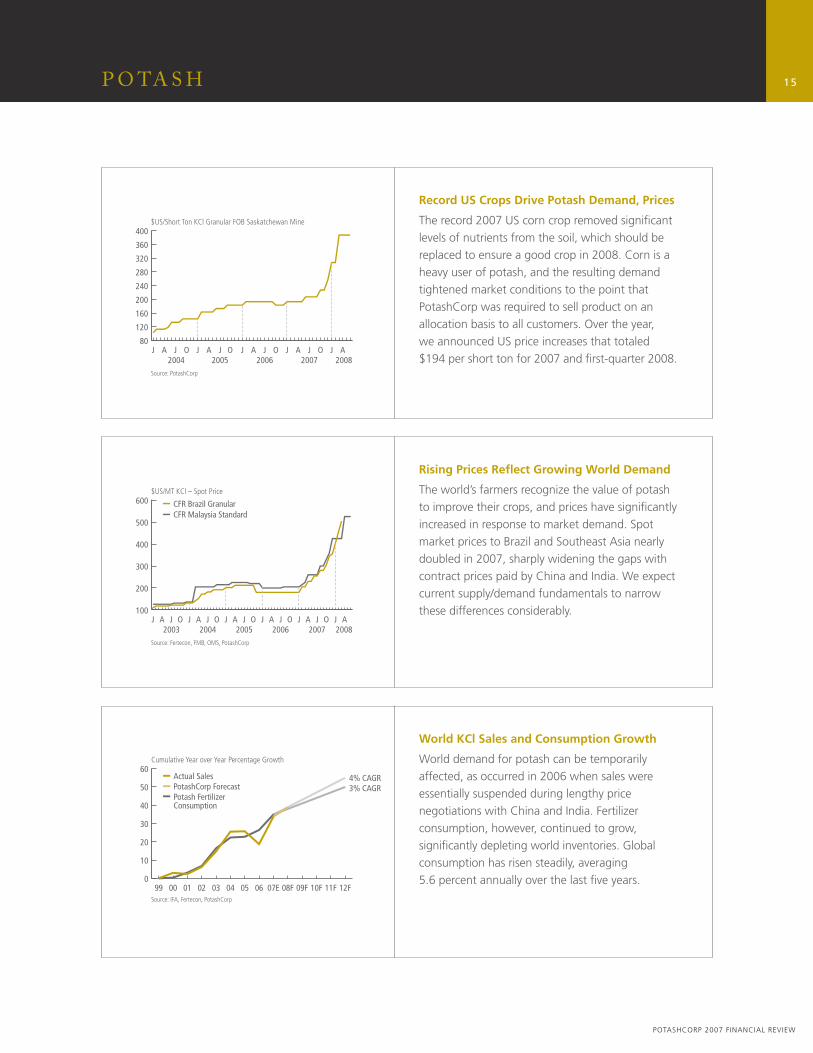
Record US Crops Drive Potash Demand, Prices
The record 2007 US corn crop removed signifi cant levels of nutrients from the soil, which should be replaced to ensure a good crop in 2008. Corn is a heavy user of potash, and the resulting demand tightened market conditions to the point that PotashCorp was required to sell product on an allocation basis to all customers. Over the year, we announced US price increases that totaled $194 per short ton for 2007 and fi rst-quarter 2008.
Rising Prices Refl ect Growing World Demand
The world’s farmers recognize the value of potash to improve their crops, and prices have signifi cantly increased in response to market demand. Spot market prices to Brazil and Southeast Asia nearly doubled in 2007, sharply widening the gaps with contract prices paid by China and India. We expect current supply/demand fundamentals to narrow these differences considerably.
World KCl Sales and Consumption Growth
World demand for potash can be temporarily affected, as occurred in 2006 when sales were essentially suspended during lengthy price negotiations with China and India. Fertilizer consumption, however, continued to grow, signifi cantly depleting world inventories. Global consumption has risen steadily, averaging 5.6 percent annually over the last fi ve years.
Cumulative Year over Year Percentage Growth
Source: IFA, Fertecon, PotashCorp
Actual SalesPotashCorp ForecastPotash Fertilizer Consumption
0
10
20
30
40
50
60
12F11F10F09F08F07E0605040302010099
4% CAGR3% CAGR
16
POTASHCORP 2007 FINANCIAL REVIEW
P O TA S H
RISKS TO OUR POTASH STRATEGY
Since potash is the heart of our company and our largest gross margin contributor, we pay particular attention to risks to its success and act quickly and fi rmly to mitigate them. In 2007, the following risks were viewed as most important:
Suppressed Demand Creating Market Imbalance
If expected growth in demand fails to materialize, negatively affecting sales volumes and price realizations, our potash success could be threatened. While we anticipate long-term growth in consumption, fl uctuations in demand are inherent to the global potash market. We attempt to mitigate this risk by matching our production to market demand, thereby protecting our margins.
Lack of Adequate Transportation and Distribution Infrastructure
Without adequate transportation and distribution infrastructure, we could fi nd it diffi cult to achieve our growth plans. In the short term, railcar shortages, slow turn times and disruptions such as strikes, derailments and/or adverse weather could prevent us from delivering product in a timely manner to North American customers or ports on both coasts. This could result in customer dissatisfaction, loss of sales and higher distribution costs.
Directly and through Canpotex, we mitigate this risk by working with major rail carriers to ensure suffi cient investment is made in transportation infrastructure to help potash move as smoothly as possible.
To further manage this risk, both Canpotex and PotashCorp have purchased railcars or leased them long-term to facilitate the movement of potash. In Brazil, we have invested in two terminals for better throughput.
Risks Particular to Underground Mines
Unexpected underground rock falls can result in life-threatening injuries, a risk that all mining companies face. Several ground falls have occurred in our potash mines in the last three years, and our mitigation actions have included developing a mining machine canopy to protect our employees.
Many underground mines around the world – including our potash mines – must deal with water-bearing strata that carry the risk of water infl ow. We are successfully managing water infl ows at our New Brunswick operation, and infl ows are being managed at Esterhazy, where we currently have a 25 percent interest. Our other conventional mines are currently dry.
Advanced geoseismic monitors record micro-events, provide information to help predict ground falls and help us avoid areas with unusual ground conditions that could carry the danger of water infl ow. Our Earth Sciences group is also developing ground-penetrating radar that could help determine such conditions.
New Supply Creating Market Imbalance
Recent growth in demand for potash has outpaced the historical trend, requiring producers to increase operating rates and pushing up prices. Those higher prices could attract credible new competitor supply in the form of greenfi eld mines, which could outpace the growth in world demand, reducing prices and potash margins.
To mitigate this risk, we continue to follow a strategy of producing to meet market demand to protect our margins.
17
POTASHCORP 2007 FINANCIAL REVIEW
65%
95%
OF AMMONIA PRODUCED IN TRINIDAD
AVERAGE TRINIDAD NATURAL GAS VOLUMES
LOCKED IN 2008 THROUGH 2012(73% 2008 THROUGH 2018)
#2 IN WORLD
AMMONIACAPACITY
N I T R O G E N
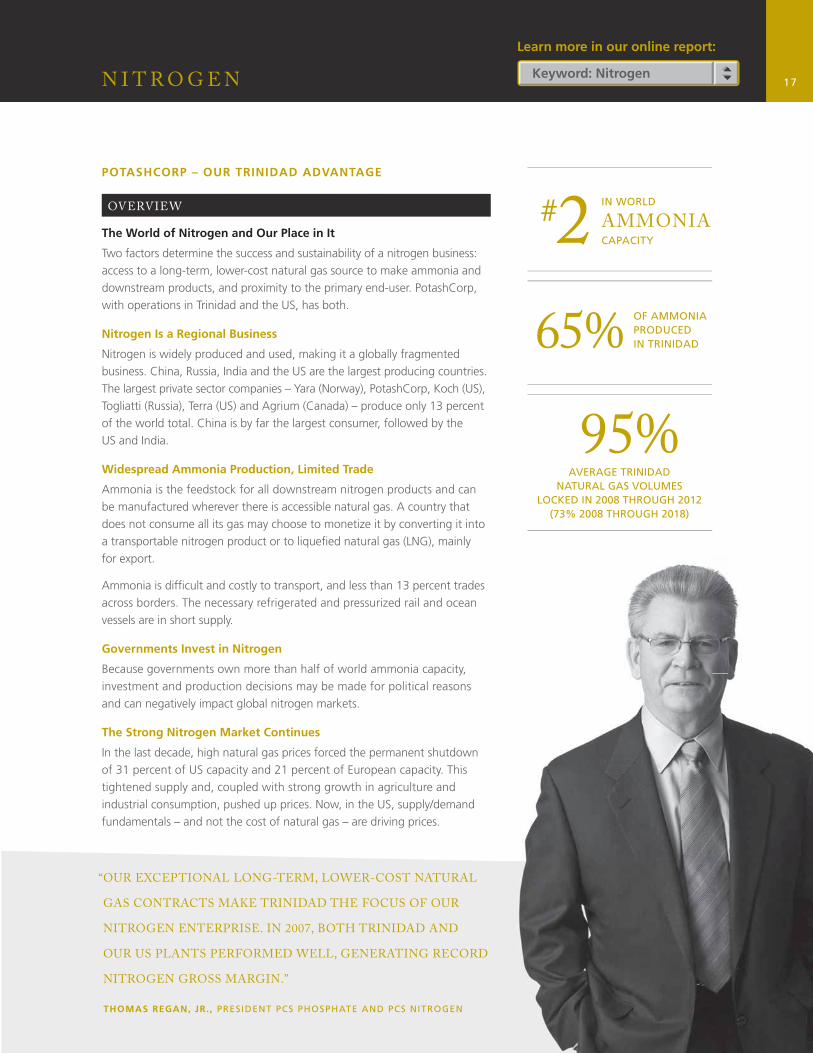
“ OUR EXCEPTIONAL LONG-TERM, LOWER-COST NATURAL
GAS CONTRACTS MAKE TRINIDAD THE FOCUS OF OUR
NITROGEN ENTERPRISE. IN 2007, BOTH TRINIDAD AND
OUR US PLANTS PERFORMED WELL, GENERATING RECORD
NITROGEN GROSS MARGIN.”
THOMAS REGAN, JR. , PRESIDENT PCS PHOSPHATE AND PCS NITROGEN
POTASHCORP – OUR TRINIDAD ADVANTAGE
OVERVIEW
The World of Nitrogen and Our Place in It
Two factors determine the success and sustainability of a nitrogen business: access to a long-term, lower-cost natural gas source to make ammonia and downstream products, and proximity to the primary end-user. PotashCorp, with operations in Trinidad and the US, has both.
Nitrogen Is a Regional Business
Nitrogen is widely produced and used, making it a globally fragmented business. China, Russia, India and the US are the largest producing countries. The largest private sector companies – Yara (Norway), PotashCorp, Koch (US), Togliatti (Russia), Terra (US) and Agrium (Canada) – produce only 13 percent of the world total. China is by far the largest consumer, followed by the US and India.
Widespread Ammonia Production, Limited Trade
Ammonia is the feedstock for all downstream nitrogen products and can be manufactured wherever there is accessible natural gas. A country that does not consume all its gas may choose to monetize it by converting it into a transportable nitrogen product or to liquefi ed natural gas (LNG), mainly for export.
Ammonia is diffi cult and costly to transport, and less than 13 percent trades across borders. The necessary refrigerated and pressurized rail and ocean vessels are in short supply.
Governments Invest in Nitrogen
Because governments own more than half of world ammonia capacity, investment and production decisions may be made for political reasons and can negatively impact global nitrogen markets.
The Strong Nitrogen Market Continues
In the last decade, high natural gas prices forced the permanent shutdown of 31 percent of US capacity and 21 percent of European capacity. This tightened supply and, coupled with strong growth in agriculture and industrial consumption, pushed up prices. Now, in the US, supply/demand fundamentals – and not the cost of natural gas – are driving prices.
Learn more in our online report:
Keyword: Nitrogen
18
POTASHCORP 2007 FINANCIAL REVIEW
N I T R O G E N
STRENGTHS
• Long-term, lower-cost natural gas contracts in Trinidad
• Almost two-thirds of our ammonia production in Trinidad, close to the world’s largest importer, the US
• US-manufactured ammonia operations somewhat geographically insulated, and make more than 80 percent of sales to stable industrial customers
• Hedging program mitigates natural gas price risk related to US production
WEAKNESSES
• One-third of our ammonia production in the US, using higher-cost natural gas
• Contractual commitments to US industrial customers may force us to operate unprofi tably amid rising gas prices
• Many nitrogen plants globally, with signifi cant government ownership and infl uence
OPPORTUNITIES
• Narrowing gap in global gas prices is raising fl oor price for nitrogen
• Europe now the swing supplier with higher gas costs, supporting a higher fl oor for US nitrogen prices
• LNG projects in low-cost gas regions provide alternatives for monetizing gas, reducing new supply pressures in nitrogen
• Higher construction costs discourage greenfi eld plants
• Higher ocean freight costs discourage nitrogen imports into the US from Eastern Europe and the Middle East
THREATS
• Abundant low-cost natural gas in developing countries may lead to its monetization as nitrogen products
• Shorter construction period means new capacity can impact the market more quickly than for other primary nutrients
• Pending changes in transport regulations in North America could substantially increase costs of shipping ammonia and diffi culty in siting terminals
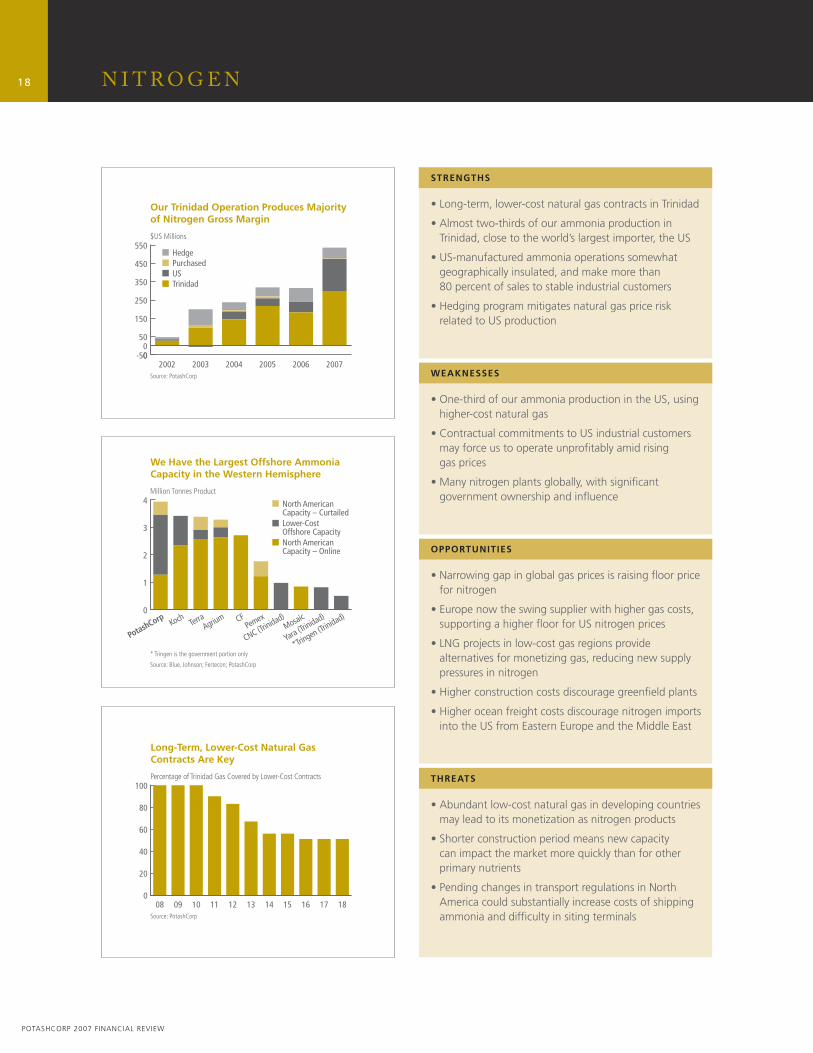
Million Tonnes Product
* Tringen is the government portion only
Source: Blue, Johnson; Fertecon; PotashCorp
We Have the Largest Offshore Ammonia Capacity in the Western Hemisphere
North American Capacity – CurtailedLower-Cost Offshore CapacityNorth American Capacity – Online
0
1
2
3
4
*Tringen (Tri
nidad)
Yara (Trinidad)
Mosaic
CNC (Trinidad)
PemexCFAgriumTerraKoch
PotashCorp
$US Millions
Source: PotashCorp
Our Trinidad Operation Produces Majority of Nitrogen Gross Margin
HedgePurchasedUSTrinidad
00
-50
50
150
250
350
450
550
200720062005200420032002
Percentage of Trinidad Gas Covered by Lower-Cost Contracts
Source: PotashCorp
Long-Term, Lower-Cost Natural Gas Contracts Are Key
0
20
40
60
80
100
1817161514131211100908
19
POTASHCORP 2007 FINANCIAL REVIEW
N I T R O G E N
The N Game
Cost, product availability, ease of transport, ease and safety of application, type of crop and effectiveness of seed/plant uptake infl uence farmers’ choice of nitrogen fertilizer. Granular urea is preferred, as it contains more N than nitrogen solutions, is more plentiful due to ease of manufacture and transport, and is safer and easier to apply in a blend with phosphate and potassium. Nitrogen solutions – easy-to-use liquids that don’t require timely rains to dissolve – are an effective pre-plant and side-dress source of nitrogen on certain crops at certain stages of growth. Ammonia, a hazardous material but the most effi cient source of
nitrogen, has a short window for successful application. Phosphate fertilizers DAP and MAP are another N source for farmers.
In 2007, the need to increase crop production and the preference for urea by large agricultural markets such as the US and India led to strong demand for this product. India purchased nearly 35 times more urea – 6.7 million tonnes – than just fi ve years ago. With more than 15 million more acres of corn planted in the US than in 2006, demand for nitrogen solutions increased substantially.
Higher Costs Delay Greenfi eld Projects
Because of increased construction costs, greenfi eld nitrogen projects are not coming on stream in low-cost gas regions as quickly as they did during previous periods of high profi tability. Several projects planned in the Middle East and Trinidad have been deferred or abandoned, extending the current positive market
conditions in nitrogen.
PotashCorp: Building on Trinidad and Industrial
Because our natural gas contracts in Trinidad – a country with extensive gas reserves and a stable government – are indexed to ammonia prices, our nitrogen produced there is profi table even when US gas costs are high. Our large Trinidad operation is less than a week’s sailing time from the US, the world’s largest ammonia importer and our primary nitrogen market.
Our Trinidad production supplies both fertilizer and industrial markets in the US. Industrial sales are traditionally more stable. Of our US production, almost two-thirds of urea and more than 80 percent of ammonia go to industrial customers.
Nitrogen Sales and Logistics
Our North American customers buy nitrogen products from PCS Sales on the spot market and sales are made on a delivered basis. Logistics and transportation costs regionalize sales, particularly for ammonia. Imports move more easily into the US Gulf than into the interior and therefore most affect competitors close to the Gulf or the Mississippi River. We shuttered ammonia production at Geismar in 2003 mainly because of imports, but Augusta and Lima operate in interior regions and are somewhat insulated.
We lower transportation costs and ensure economical delivery of Trinidad product to the US through long-term leases on ammonia vessels at fi xed prices. Ownership or major supply contracts at six deepwater US ports give us logistical strength and fl exibility for these imports.
We deliver most of our US-produced ammonia via pipeline to stable industrial customers that require product quality and reliable delivery to keep their plants running effi ciently.
Driven by strong world demand and higher Russian and European gas prices, nitrogen prices in the US have decoupled
from gas costs, considerably improving profi tability.
20
POTASHCORP 2007 FINANCIAL REVIEW
N I T R O G E N
OUR STRATEGY
BUILDING ON OUR TRINIDAD ASSET TO
MINIMIZE VOLATILITY
Our nitrogen strategy has two components. First, we seek to enhance our overall strategy of growth with reduced volatility by maximizing our Trinidad production with its advantageous natural gas costs. Our second goal is to maximize our stable US industrial sales.
Margin volatility due to natural gas costs has historically affected how we operate our US plants. When US gas is high-priced, we may reduce operating rates and purchase product to meet customer commitments. However, with today’s strong demand and pricing environment and with more stable US gas prices, each facility produced the combination of products that provided the highest overall nitrogen segment gross margin. For example, we used our nitrogen solutions production capability at Geismar in 2007 to meet market demand and attain favorable margins.
Over the longer term, we would consider strategic partnerships that leverage our marketing and operations expertise in low-cost natural gas regions, doing so on a fee basis and minimizing up-front investment risk.
DELIVERING ON EFFICIENT PRODUCTION
MAXIMIZING PRODUCTION AND
STRENGTHENING OUR TRINIDAD ADVANTAGE
Our investment in debottlenecking our four Trinidad ammonia units in 2005 and 2006 paid off with record production and added effi ciency in 2007. Upgrades at Lima in mid-2006 resulted in much higher and more effi cient production there, as well. These investments allowed us to generate higher overall cash fl ows and margins in this segment.
In the current market and price environment, we continue to evaluate the possibility of additional capacity, perhaps through a fi fth ammonia plant at our Trinidad complex and/or further debottlenecking projects at our US plants.
NITROGEN RISK
Risk of Cyclicality
The involvement by governments in nitrogen creates a risk that supply will be brought on stream without consideration of demand. This can create price cyclicality due to competitive costs, availability of supply and world demand. To mitigate this risk, we maximize our lower-cost Trinidad production while focusing on less cyclical US industrial markets. At our US plants, we employ gas price risk hedging strategies and, during periods of high gas costs, reduce operating rates.
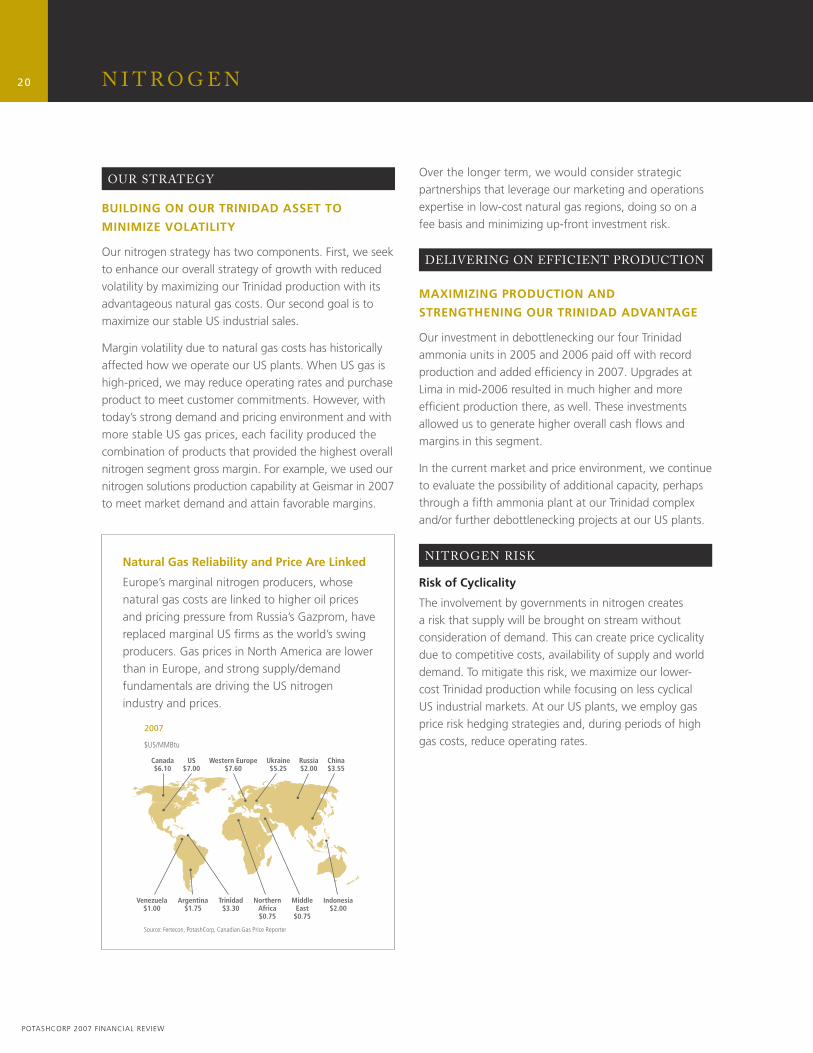
Natural Gas Reliability and Price Are Linked
Europe’s marginal nitrogen producers, whose natural gas costs are linked to higher oil prices and pricing pressure from Russia’s Gazprom, have replaced marginal US fi rms as the world’s swing producers. Gas prices in North America are lower than in Europe, and strong supply/demand fundamentals are driving the US nitrogen industry and prices.
$US/MMBtu
Source: Fertecon, PotashCorp, Canadian Gas Price Reporter
2007
Canada$6.10
Trinidad$3.30
Russia$2.00
China$3.55
Ukraine$5.25
Western Europe$7.60
NorthernAfrica$0.75
MiddleEast
$0.75
Indonesia$2.00
Venezuela$1.00
Argentina$1.75
US$7.00
21
POTASHCORP 2007 FINANCIAL REVIEW
P H O S P H AT E
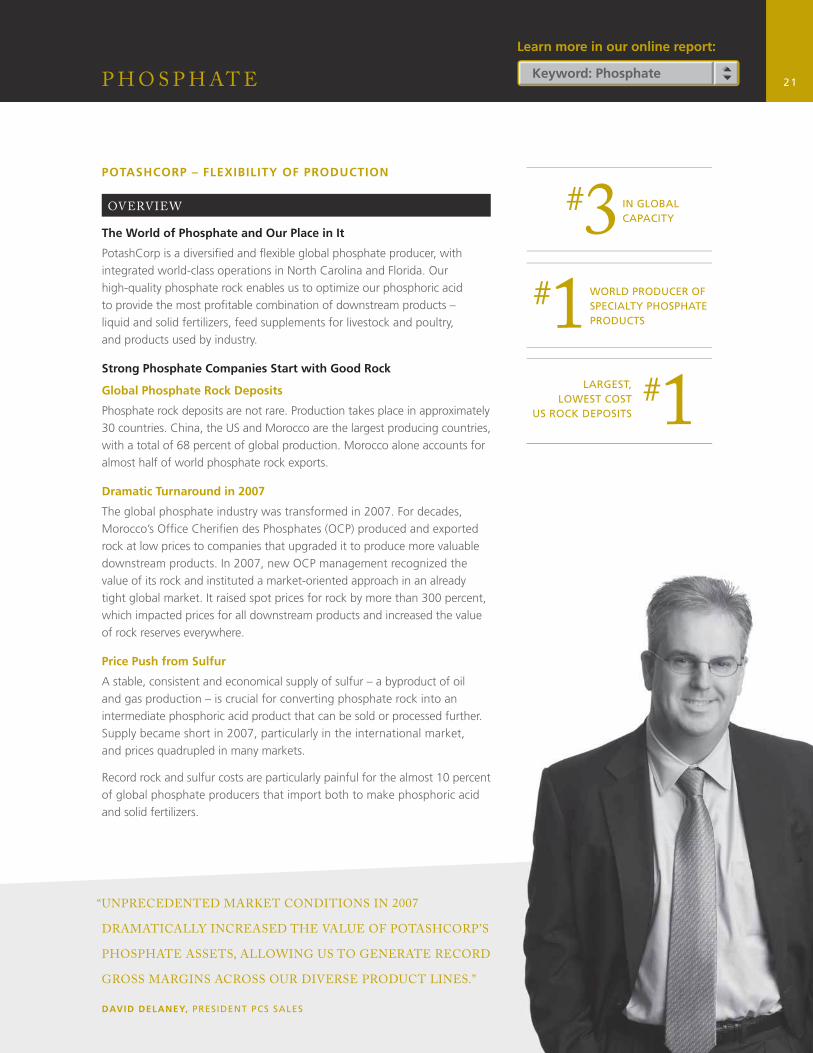
DAVID DELANEY, PRESIDENT PCS SALES
#1
#1
#3
LARGEST, LOWEST COST
US ROCK DEPOSITS
WORLD PRODUCER OF SPECIALTY PHOSPHATE PRODUCTS
IN GLOBALCAPACITY
POTASHCORP – FLEXIBILITY OF PRODUCTION
OVERVIEW
The World of Phosphate and Our Place in It
PotashCorp is a diversifi ed and fl exible global phosphate producer, with integrated world-class operations in North Carolina and Florida. Our high-quality phosphate rock enables us to optimize our phosphoric acid to provide the most profi table combination of downstream products – liquid and solid fertilizers, feed supplements for livestock and poultry, and products used by industry.
Strong Phosphate Companies Start with Good Rock
Global Phosphate Rock Deposits
Phosphate rock deposits are not rare. Production takes place in approximately 30 countries. China, the US and Morocco are the largest producing countries, with a total of 68 percent of global production. Morocco alone accounts for almost half of world phosphate rock exports.
Dramatic Turnaround in 2007
The global phosphate industry was transformed in 2007. For decades, Morocco’s Offi ce Cherifi en des Phosphates (OCP) produced and exported rock at low prices to companies that upgraded it to produce more valuable downstream products. In 2007, new OCP management recognized the value of its rock and instituted a market-oriented approach in an already tight global market. It raised spot prices for rock by more than 300 percent, which impacted prices for all downstream products and increased the value of rock reserves everywhere.
Price Push from Sulfur
A stable, consistent and economical supply of sulfur – a byproduct of oil and gas production – is crucial for converting phosphate rock into an intermediate phosphoric acid product that can be sold or processed further. Supply became short in 2007, particularly in the international market, and prices quadrupled in many markets.
Record rock and sulfur costs are particularly painful for the almost 10 percent of global phosphate producers that import both to make phosphoric acid and solid fertilizers.
“ UNPRECEDENTED MARKET CONDITIONS IN 2007
DRAMATICALLY INCREASED THE VALUE OF POTASHCORP’S
PHOSPHATE ASSETS, ALLOWING US TO GENERATE RECORD
GROSS MARGINS ACROSS OUR DIVERSE PRODUCT LINES.”
Learn more in our online report:
Keyword: Phosphate
22
POTASHCORP 2007 FINANCIAL REVIEW
P H O S P H AT E
Limited New Solid Fertilizer Capacity
Other than China, which is building mainly for domestic consumption, new solid fertilizer capacity is expected to be limited until Saudi Arabia’s 3-million-tonne Ma’aden facility is operational. Morocco plans to bring on phosphoric acid plant expansions in 2008 and 2009 that will enable it to increase DAP production, to capture more of the social and economic benefi ts of upgrading its rock. Until Ma’aden begins producing in 2011 or 2012, global demand is expected to exceed this new Moroccan capacity, keeping markets tight.
PotashCorp: Specializing in Diversity
We Begin with Quality Phosphate Rock
PotashCorp has abundant and accessible phosphate rock with low levels of impurities, which results in low production costs. Because of this high-quality rock, we can allocate about 40 percent of our phosphoric acid to high-margin industrial and feed products outside the more volatile fertilizer commodity cycle. At the same time, we are well balanced with exposure to the strong and rising profi tability of liquid and solid fertilizers.
Industry Demands Purifi ed Phosphoric Acid
Wet process technology and Aurora’s superior rock have made us a signifi cant player in this business. Global demand for industrial phosphate products is rising, and closure of several energy-intensive thermal plants by competitors has restructured US production.
Feed Supplements for Animals and Poultry
We are one of only a few producers of dical and monocal phosphate animal feed supplements, used primarily in beef and pork production. Aurora’s quality rock also gives us a competitive edge in producing DFP for poultry. Although the current fertilizer market is attractive, we continue to be a major player in this high-margin feed business. US feed consumption is stable, and rising global demand for meat, combined with higher prices in a tight global market for phosphoric acid, makes the current feed environment and longer-term outlook favorable.
Phosphate Sales and Logistics
Approximately 70 percent of our phosphate sales are focused on North America, where we typically benefi t from higher realized prices. Sales are made on both a
spot and contract basis, depending on the product, and include freight. PCS Sales handles this North American business. PhosChem, a US marketing association that includes Mosaic, sells our phosphate fertilizers offshore.
Global and North American Competitors
OCP is our major offshore competitor, while we compete in North America with Mosaic, CF Industries, Mississippi Phosphate, Agrifos and Agrium. Moroccan and Israeli imports vie with us for North American industrial sales while producers in China compete for feed sales.
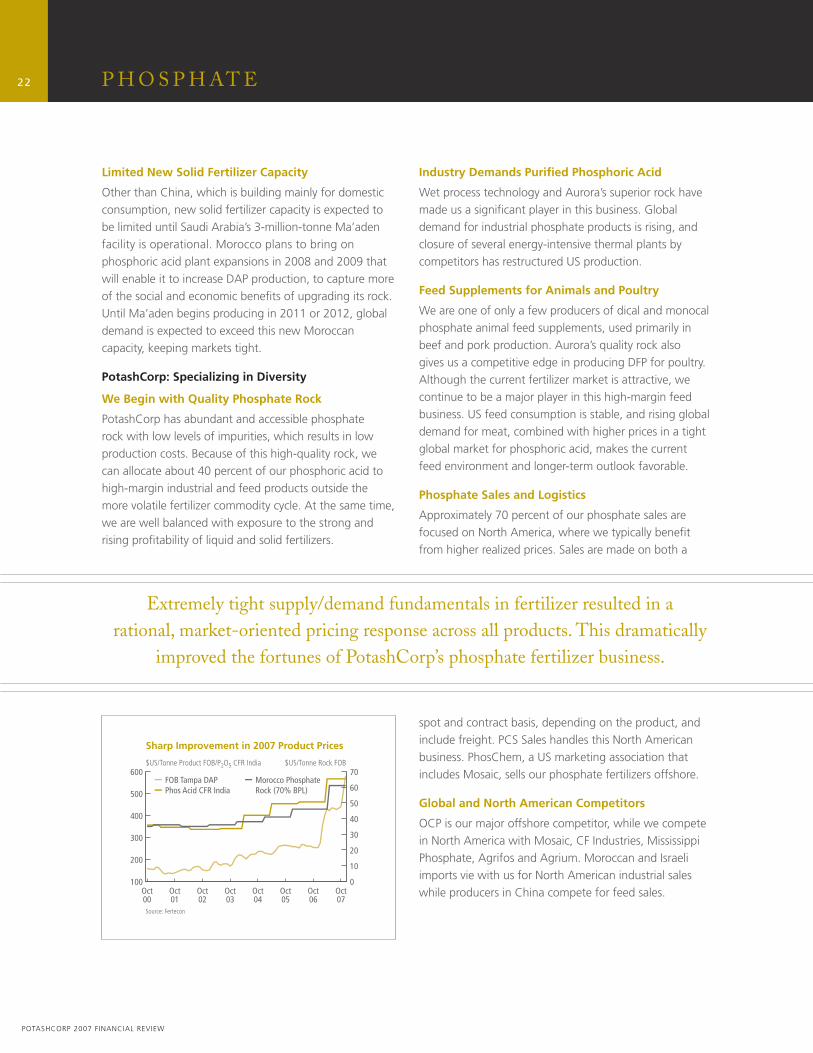
$US/Tonne Product FOB/P2O5 CFR India $US/Tonne Rock FOB
Source: Fertecon
Sharp Improvement in 2007 Product Prices
FOB Tampa DAPPhos Acid CFR India
100
200
300
400
500
600
Oct07
Oct06
Oct05
Oct04
Oct03
Oct02
Oct01
Oct00
Morocco PhosphateRock (70% BPL)
0
10
20
30
40
50
60
70
Extremely tight supply/demand fundamentals in fertilizer resulted in a rational, market-oriented pricing response across all products. This dramatically
improved the fortunes of PotashCorp’s phosphate fertilizer business.
23
POTASHCORP 2007 FINANCIAL REVIEW
P H O S P H AT E
STRENGTHS
• Signifi cant high-quality, low-cost phosphate rock reserves
• Ability to direct rock with low levels of impurities to diversifi ed product line to optimize margins
• Mining near processing facilities provides cost advantage over North American competitors
• Access to lower-cost North American liquid sulfur
• Strong position in North American purifi ed acid and feed phosphate markets
WEAKNESSES
• Transporting ammonia to solid fertilizer plants is becoming more diffi cult and costly
• Higher sulfur and ammonia costs can negatively impact margins
• Plants with high fi xed costs may not perform profi tably at lower operating rates
• Long-term sales contracts for industrial and some liquid fertilizer products can cause a lag in pricing in times of rising input costs, temporarily impacting margins
OPPORTUNITIES
• Tight phosphate rock, phosphoric acid and solid fertilizer supply/demand fundamentals
• Few companies globally with rock of suffi cient quality to economically produce purifi ed acid
• We believe that fewer greenfi eld projects gives at least a three-year window on solid fertilizer supply until Saudi Arabia’s Ma’aden project comes on stream
THREATS
• Signifi cant government control in global phosphate supply and consumption decisions
• High barriers to exit because of signifi cant environmental restoration and remediation costs
• Extensive environmental and permitting requirements
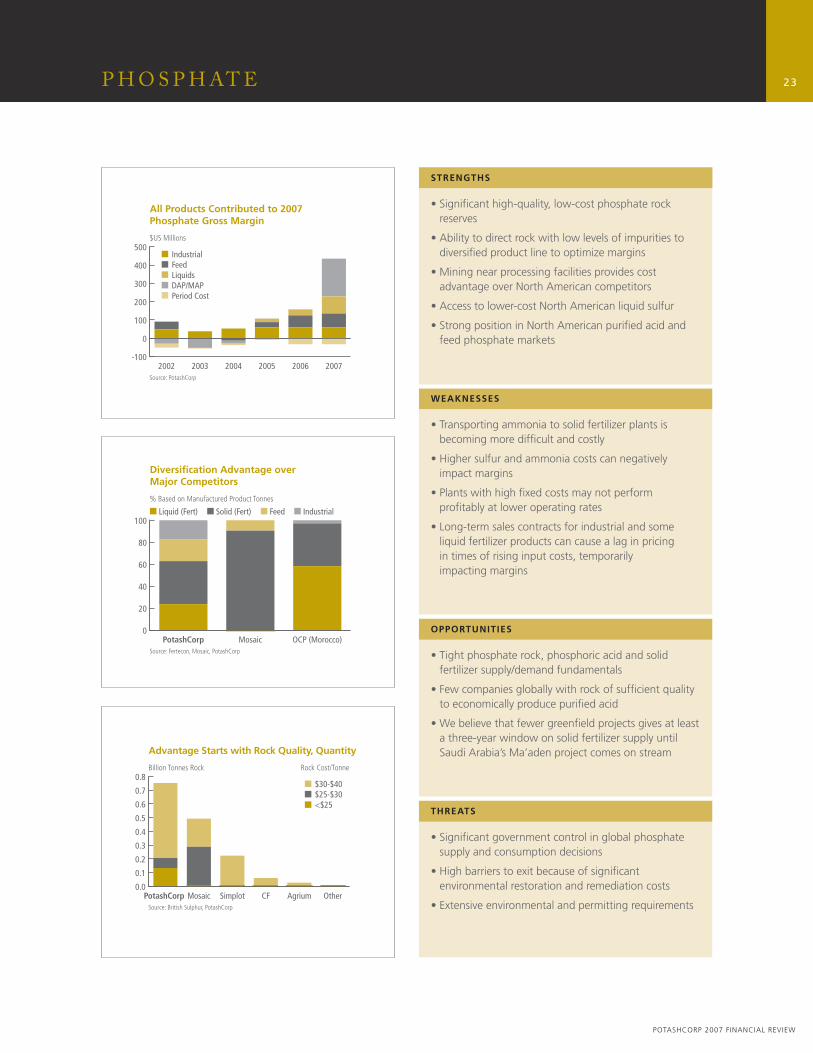
% Based on Manufactured Product Tonnes
Source: Fertecon, Mosaic, PotashCorp
Diversification Advantage over Major Competitors
Liquid (Fert) Solid (Fert) Feed Industrial
0
20
40
60
80
100
OCP (Morocco)MosaicPotashCorp
$US Millions
Source: PotashCorp
All Products Contributed to 2007 Phosphate Gross Margin
IndustrialFeedLiquidsDAP/MAPPeriod Cost
-100
0
100
200
300
400
500
200720062005200420032002
Billion Tonnes Rock Rock Cost/Tonne
Source: British Sulphur, PotashCorp
Advantage Starts with Rock Quality, Quantity
$30-$40$25-$30<$25
0.0
0.1
0.2
0.3
0.4
0.5
0.6
0.7
0.8
OtherAgriumCFSimplotMosaicPotashCorp
24
POTASHCORP 2007 FINANCIAL REVIEW
P H O S P H AT E
OUR STRATEGY
USE OUR PRODUCT FLEXIBILITY TO MAXIMIZE
RETURNS, ENHANCE STABILITY
We seek to use the fl exibility made possible by our high-quality rock to optimize our product sales mix, maximize gross margin on a long-term basis and thereby enhance earnings stability.
In the stable US industrial phosphate business, our strategy is to capture growing demand on an opportunistic basis. Purifi ed acid generates strong margins, and we have expanded to gain market share as competitors closed high-cost, energy-intensive plants. In phosphate feed supplements, we focus on profi tability rather than sales volumes.
Our strategy in phosphate fertilizers is to allot phosphoric acid not suitable for feed and industrial products to the most profi table combination of the liquid and solid fertilizers in high demand in the current robust, agriculture-driven market. Maintaining high operating rates results in lower per-tonne fi xed costs.
DELIVERING ON PRODUCT DIVERSITY
Consistent with our strategy of leveraging our rock quality to further strengthen product and margin diversity, we have begun a $260 million debottlenecking project at Aurora. A new sulfuric acid plant, expected to be completed in 2009, will make possible an additional 180,000 tonnes of annual phosphoric acid production
that can be used in any combination of downstream products that maximizes phosphate gross margin.
PHOSPHATE RISKS
Risk of Cyclicality
Short-term price cyclicality due to competitive costs, availability of supply and government involvement has historically added considerable risk in phosphate. Over the next fi ve years, increasing competitive supply of solid fertilizer, particularly DAP, may outpace growth in world consumption, potentially depressing prices and risking our phosphate margins. In mitigation, we are leveraging our strengths in specialty industrial and feed products while streamlining fertilizer production to minimize production costs.
United States Environmental Protection Agency
The US phosphate industry, including PotashCorp, is subject to an industry-wide initiative of the United States Environmental Protection Agency (USEPA), which has challenged industry’s implementation of a particular exemption for mineral processing wastes under the hazardous waste program. Potential violations at our various phosphate facilities stemming from inspections conducted by the USEPA under this program could lead to fi nancial penalties. We address this risk by working with other phosphate industry members and in company-specifi c meetings with representatives of the Department of Justice, the USEPA and state environmental agencies regarding potential resolution, through litigation or otherwise, of any matters identifi ed in the inspections.
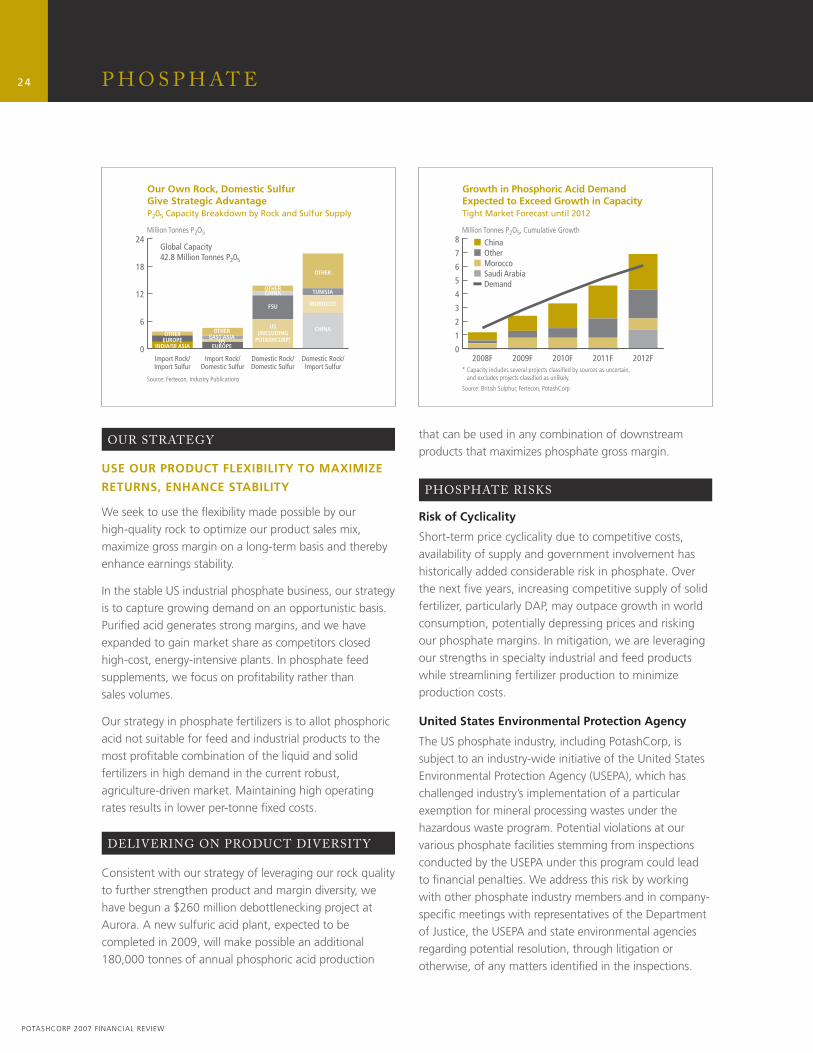
Million Tonnes P2O5
Source: Fertecon, Industry Publications
Our Own Rock, Domestic Sulfur Give Strategic AdvantageP205 Capacity Breakdown by Rock and Sulfur Supply
Global Capacity42.8 Million Tonnes P205
0
6
12
18
24
Domestic Rock/Import Sulfur
Domestic Rock/Domestic Sulfur
Import Rock/Domestic Sulfur
Import Rock/Import Sulfur
OTHERCHINA
FSU
US(INCLUDING
POTASHCORP)OTHER
EUROPEINDIA/SE ASIA
OTHEREAST ASIA
USEUROPE
OTHER
TUNISIA
MOROCCO
CHINA
0
1
2
3
4
5
6
7
8
2012F2011F2010F2009F2008F
Million Tonnes P2O5, Cumulative Growth
* Capacity includes several projects classified by sources as uncertain, and excludes projects classified as unlikely.
Source: British Sulphur, Fertecon, PotashCorp
Growth in Phosphoric Acid Demand Expected to Exceed Growth in CapacityTight Market Forecast until 2012
ChinaOtherMoroccoSaudi ArabiaDemand
25
POTASHCORP 2007 FINANCIAL REVIEW
K E Y P E R F O R M A N C E D R I V E R S
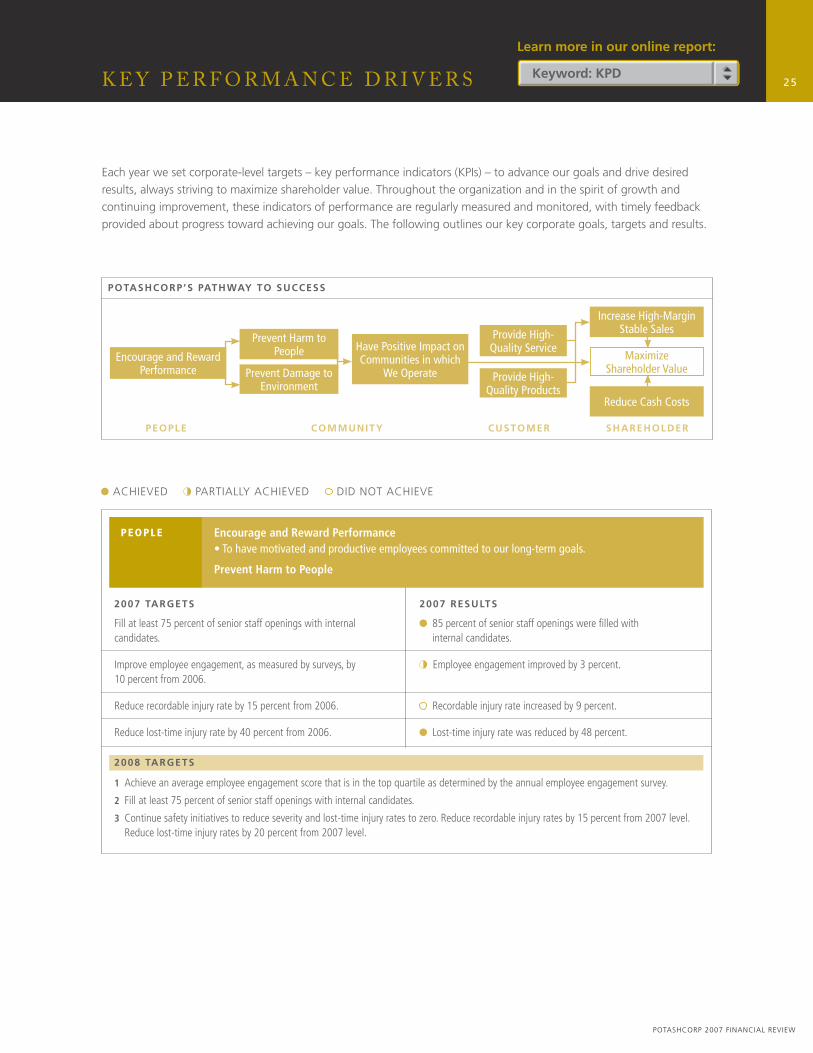
Each year we set corporate-level targets – key performance indicators (KPIs) – to advance our goals and drive desired results, always striving to maximize shareholder value. Throughout the organization and in the spirit of growth and continuing improvement, these indicators of performance are regularly measured and monitored, with timely feedback provided about progress toward achieving our goals. The following outlines our key corporate goals, targets and results.
ACHIEVED PARTIALLY ACHIEVED DID NOT ACHIEVE
POTASHCORP’S PATHWAY TO SUCCESS
PEOPLE COMMUNITY CUSTOMER SHAREHOLDER
Encourage and Reward Performance
Have Positive Impact on Communities in which
We Operate
Prevent Harm to People
Increase High-Margin Stable Sales
Maximize Shareholder Value
Reduce Cash Costs
Provide High-Quality Service
Prevent Damage to Environment
Provide High-Quality Products
Fill at least 75 percent of senior staff openings with internal candidates.
Improve employee engagement, as measured by surveys, by 10 percent from 2006.
Reduce recordable injury rate by 15 percent from 2006.
Reduce lost-time injury rate by 40 percent from 2006.
85 percent of senior staff openings were fi lled with internal candidates.
Employee engagement improved by 3 percent.
Recordable injury rate increased by 9 percent.
Lost-time injury rate was reduced by 48 percent.
2007 TARGETS 2007 RESULTS
PEOPLE Encourage and Reward Performance• To have motivated and productive employees committed to our long-term goals.
Prevent Harm to People
2008 TARGETS
1 Achieve an average employee engagement score that is in the top quartile as determined by the annual employee engagement survey.
2 Fill at least 75 percent of senior staff openings with internal candidates.
3 Continue safety initiatives to reduce severity and lost-time injury rates to zero. Reduce recordable injury rates by 15 percent from 2007 level. Reduce lost-time injury rates by 20 percent from 2007 level.
Learn more in our online report:
Keyword: KPD
26
POTASHCORP 2007 FINANCIAL REVIEW
K E Y P E R F O R M A N C E D R I V E R S
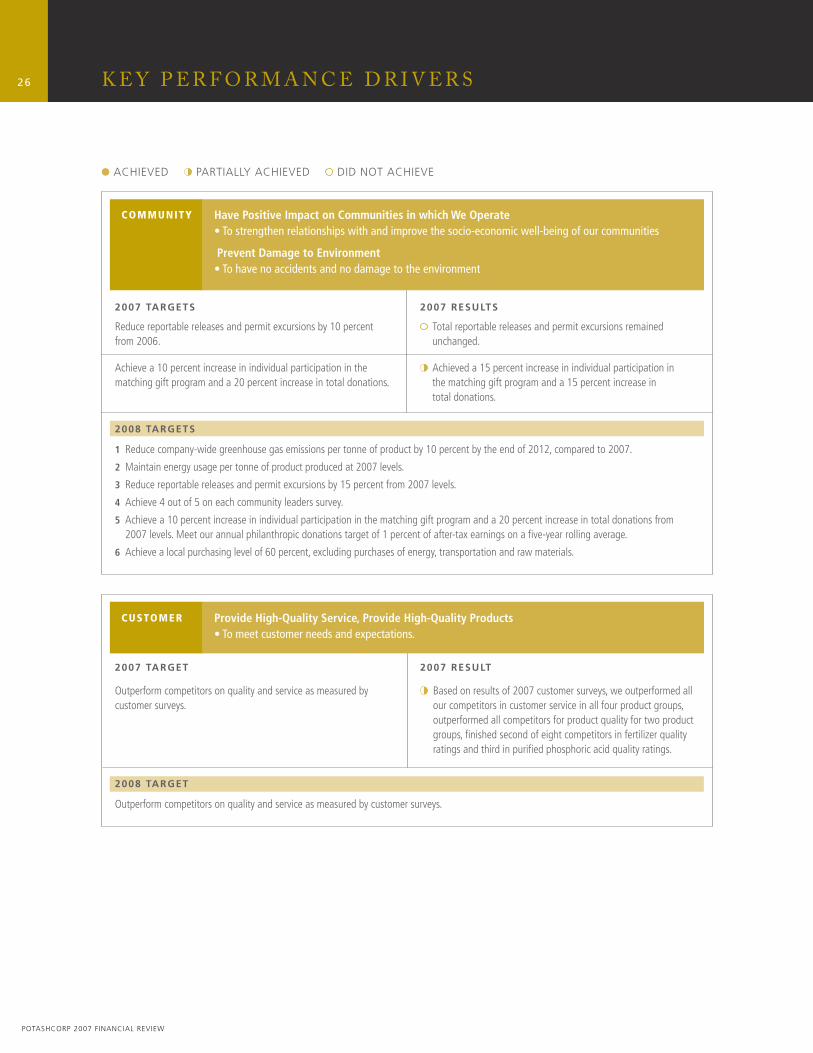
ACHIEVED PARTIALLY ACHIEVED DID NOT ACHIEVE
Reduce reportable releases and permit excursions by 10 percent from 2006.
Achieve a 10 percent increase in individual participation in the matching gift program and a 20 percent increase in total donations.
Total reportable releases and permit excursions remained unchanged.
Achieved a 15 percent increase in individual participation in the matching gift program and a 15 percent increase in total donations.
2007 TARGETS 2007 RESULTS
COMMUNITY Have Positive Impact on Communities in which We Operate• To strengthen relationships with and improve the socio-economic well-being of our communities
Prevent Damage to Environment • To have no accidents and no damage to the environment
2008 TARGETS
1 Reduce company-wide greenhouse gas emissions per tonne of product by 10 percent by the end of 2012, compared to 2007.
2 Maintain energy usage per tonne of product produced at 2007 levels.
3 Reduce reportable releases and permit excursions by 15 percent from 2007 levels.
4 Achieve 4 out of 5 on each community leaders survey.
5 Achieve a 10 percent increase in individual participation in the matching gift program and a 20 percent increase in total donations from 2007 levels. Meet our annual philanthropic donations target of 1 percent of after-tax earnings on a fi ve-year rolling average.
6 Achieve a local purchasing level of 60 percent, excluding purchases of energy, transportation and raw materials.
Outperform competitors on quality and service as measured by customer surveys.
Based on results of 2007 customer surveys, we outperformed all our competitors in customer service in all four product groups, outperformed all competitors for product quality for two product groups, fi nished second of eight competitors in fertilizer quality ratings and third in purifi ed phosphoric acid quality ratings.
2007 TARGET 2007 RESULT
CUSTOMER Provide High-Quality Service, Provide High-Quality Products• To meet customer needs and expectations.
2008 TARGET
Outperform competitors on quality and service as measured by customer surveys.
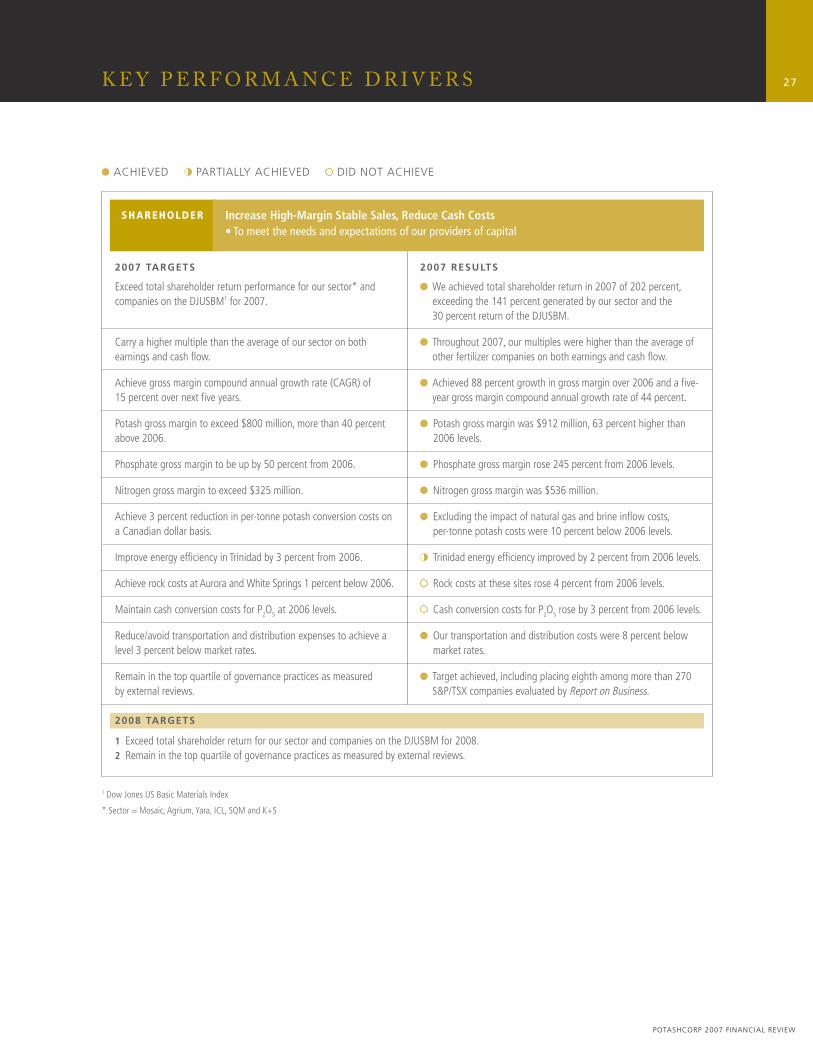
27
POTASHCORP 2007 FINANCIAL REVIEW
K E Y P E R F O R M A N C E D R I V E R S
Exceed total shareholder return performance for our sector* and companies on the DJUSBM1 for 2007.
Carry a higher multiple than the average of our sector on both earnings and cash fl ow.
Achieve gross margin compound annual growth rate (CAGR) of 15 percent over next fi ve years.
Potash gross margin to exceed $800 million, more than 40 percent above 2006.
Phosphate gross margin to be up by 50 percent from 2006.
Nitrogen gross margin to exceed $325 million.
Achieve 3 percent reduction in per-tonne potash conversion costs on a Canadian dollar basis.
Improve energy effi ciency in Trinidad by 3 percent from 2006.
Achieve rock costs at Aurora and White Springs 1 percent below 2006.
Maintain cash conversion costs for P2O5 at 2006 levels.
Reduce/avoid transportation and distribution expenses to achieve a level 3 percent below market rates.
Remain in the top quartile of governance practices as measured by external reviews.
We achieved total shareholder return in 2007 of 202 percent, exceeding the 141 percent generated by our sector and the 30 percent return of the DJUSBM.
Throughout 2007, our multiples were higher than the average of other fertilizer companies on both earnings and cash fl ow.
Achieved 88 percent growth in gross margin over 2006 and a fi ve-year gross margin compound annual growth rate of 44 percent.
Potash gross margin was $912 million, 63 percent higher than 2006 levels.
Phosphate gross margin rose 245 percent from 2006 levels.
Nitrogen gross margin was $536 million.
Excluding the impact of natural gas and brine infl ow costs, per-tonne potash costs were 10 percent below 2006 levels.
Trinidad energy effi ciency improved by 2 percent from 2006 levels.
Rock costs at these sites rose 4 percent from 2006 levels.
Cash conversion costs for P2O5 rose by 3 percent from 2006 levels.
Our transportation and distribution costs were 8 percent below market rates.
Target achieved, including placing eighth among more than 270 S&P/TSX companies evaluated by Report on Business.
2007 TARGETS 2007 RESULTS
SHAREHOLDER Increase High-Margin Stable Sales, Reduce Cash Costs• To meet the needs and expectations of our providers of capital
ACHIEVED PARTIALLY ACHIEVED DID NOT ACHIEVE
1 Dow Jones US Basic Materials Index
* Sector = Mosaic, Agrium, Yara, ICL, SQM and K+S
2008 TARGETS
1 Exceed total shareholder return for our sector and companies on the DJUSBM for 2008.2 Remain in the top quartile of governance practices as measured by external reviews.
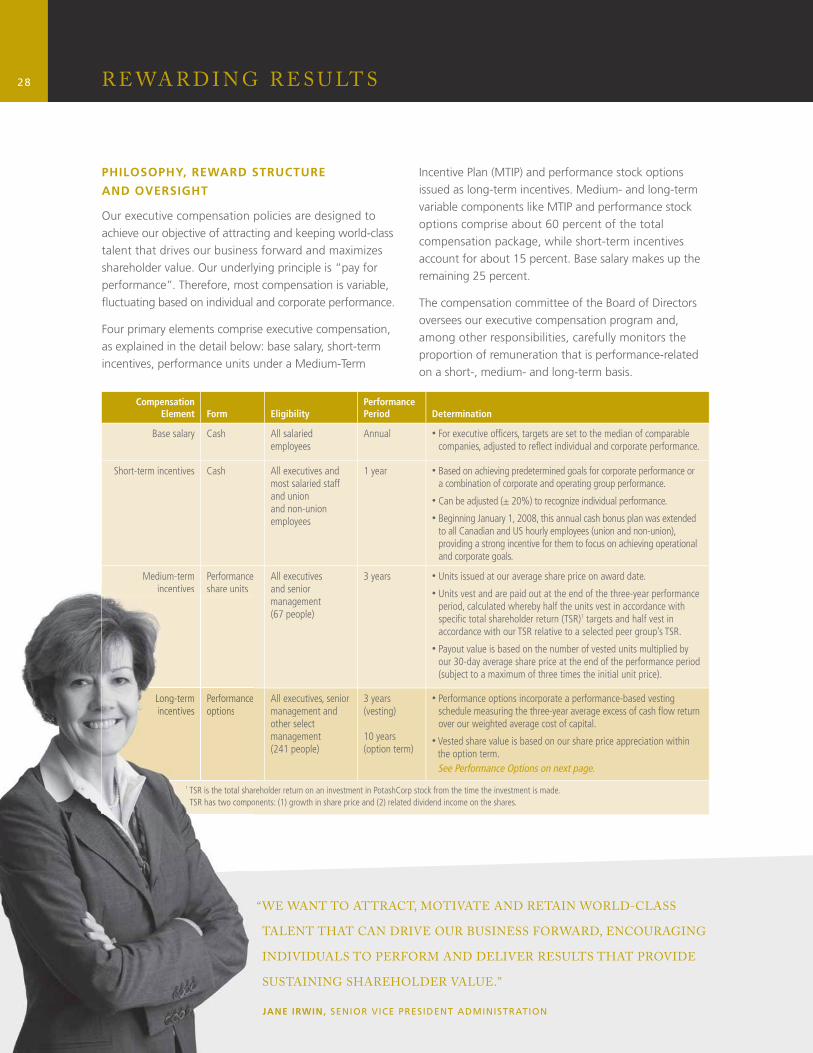
28
POTASHCORP 2007 FINANCIAL REVIEW
CompensationElement Form Eligibility
PerformancePeriod Determination
Base salary Cash All salaried employees
Annual • For executive offi cers, targets are set to the median of comparable companies, adjusted to refl ect individual and corporate performance.
Short-term incentives Cash All executives and most salaried staff and union and non-union employees
1 year • Based on achieving predetermined goals for corporate performance or a combination of corporate and operating group performance.
• Can be adjusted (± 20%) to recognize individual performance.
• Beginning January 1, 2008, this annual cash bonus plan was extended to all Canadian and US hourly employees (union and non-union), providing a strong incentive for them to focus on achieving operational and corporate goals.
Medium-term incentives
Performance share units
All executives and senior management (67 people)
3 years • Units issued at our average share price on award date.
• Units vest and are paid out at the end of the three-year performance period, calculated whereby half the units vest in accordance with specifi c total shareholder return (TSR)1 targets and half vest in accordance with our TSR relative to a selected peer group’s TSR.
• Payout value is based on the number of vested units multiplied by our 30-day average share price at the end of the performance period (subject to a maximum of three times the initial unit price).
Long-term incentives
Performance options
All executives, senior management and other select management (241 people)
3 years (vesting)
10 years (option term)
• Performance options incorporate a performance-based vesting schedule measuring the three-year average excess of cash fl ow return over our weighted average cost of capital.
• Vested share value is based on our share price appreciation within the option term.See Performance Options on next page.
1 TSR is the total shareholder return on an investment in PotashCorp stock from the time the investment is made. TSR has two components: (1) growth in share price and (2) related dividend income on the shares.
PHILOSOPHY, REWARD STRUCTURE
AND OVERSIGHT
Our executive compensation policies are designed to achieve our objective of attracting and keeping world-class talent that drives our business forward and maximizes shareholder value. Our underlying principle is “pay for performance”. Therefore, most compensation is variable, fl uctuating based on individual and corporate performance.
Four primary elements comprise executive compensation, as explained in the detail below: base salary, short-term incentives, performance units under a Medium-Term
Incentive Plan (MTIP) and performance stock options issued as long-term incentives. Medium- and long-term variable components like MTIP and performance stock options comprise about 60 percent of the total compensation package, while short-term incentives account for about 15 percent. Base salary makes up the remaining 25 percent.
The compensation committee of the Board of Directors oversees our executive compensation program and, among other responsibilities, carefully monitors the proportion of remuneration that is performance-related on a short-, medium- and long-term basis.
R E WA R D I N G R E S U LT S
“ WE WANT TO ATTRACT, MOTIVATE AND RETAIN WORLD-CLASS
TALENT THAT CAN DRIVE OUR BUSINESS FORWARD, ENCOURAGING
INDIVIDUALS TO PERFORM AND DELIVER RESULTS THAT PROVIDE
SUSTAINING SHAREHOLDER VALUE.”
JANE IRWIN, SENIOR VICE PRESIDENT ADMINISTRATION
incentives share units
Long-term incentives
Performance options
1 TSR is the total shar TSR has two compo
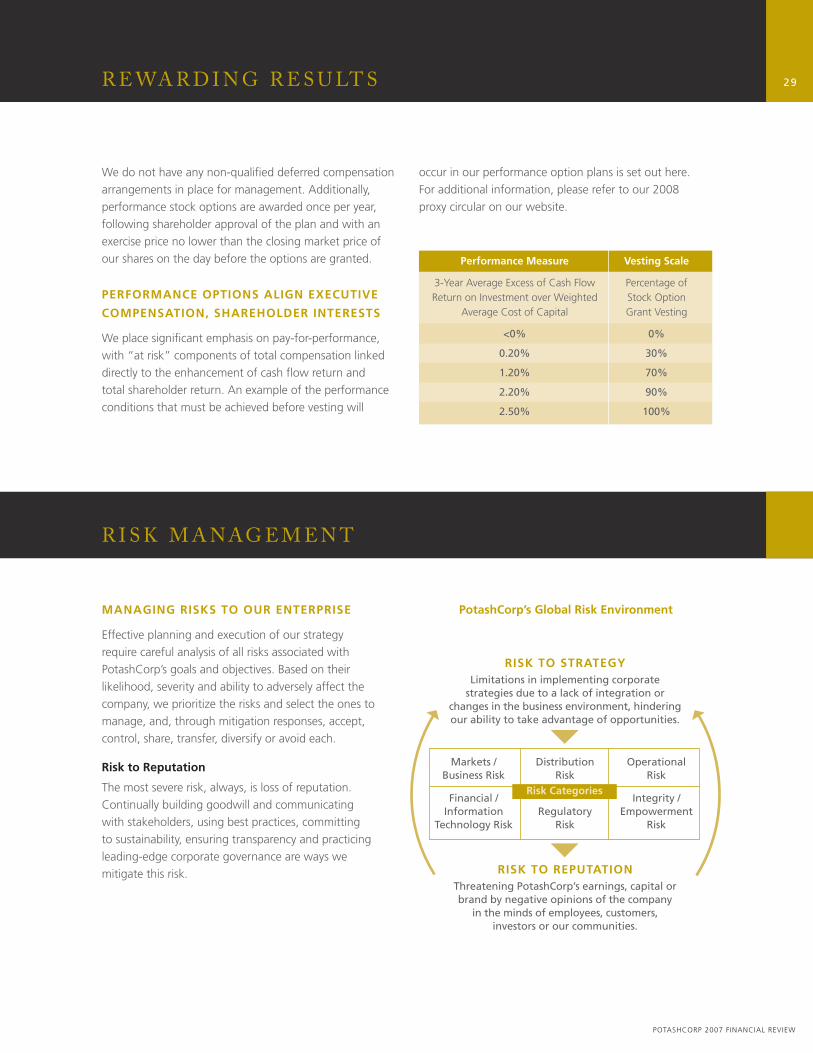
29
POTASHCORP 2007 FINANCIAL REVIEW
R E WA R D I N G R E S U LT S
MANAGING RISKS TO OUR ENTERPRISE
Effective planning and execution of our strategy require careful analysis of all risks associated with PotashCorp’s goals and objectives. Based on their likelihood, severity and ability to adversely affect the company, we prioritize the risks and select the ones to manage, and, through mitigation responses, accept, control, share, transfer, diversify or avoid each.
Risk to Reputation
The most severe risk, always, is loss of reputation. Continually building goodwill and communicating with stakeholders, using best practices, committing to sustainability, ensuring transparency and practicing leading-edge corporate governance are ways we mitigate this risk.
R I S K M A N AG E M E N T
RISK TO STRATEGYLimitations in implementing corporate
strategies due to a lack of integration or changes in the business environment, hindering our ability to take advantage of opportunities.
RISK TO REPUTATIONThreatening PotashCorp’s earnings, capital or brand by negative opinions of the company
in the minds of employees, customers, investors or our communities.
Markets / Business Risk
Financial / Information
Technology Risk
Distribution Risk
Regulatory Risk
OperationalRisk
Integrity / Empowerment
Risk
Risk Categories
PotashCorp’s Global Risk Environment
Performance Measure
3-Year Average Excess of Cash Flow Return on Investment over Weighted
Average Cost of Capital
<0%
0.20%
1.20%
2.20%
2.50%
Vesting Scale
Percentage ofStock OptionGrant Vesting
0%
30%
70%
90%
100%
We do not have any non-qualifi ed deferred compensation arrangements in place for management. Additionally, performance stock options are awarded once per year, following shareholder approval of the plan and with an exercise price no lower than the closing market price of our shares on the day before the options are granted.
PERFORMANCE OPTIONS ALIGN EXECUTIVE
COMPENSATION, SHAREHOLDER INTERESTS
We place signifi cant emphasis on pay-for-performance, with “at risk” components of total compensation linked directly to the enhancement of cash fl ow return and total shareholder return. An example of the performance conditions that must be achieved before vesting will
occur in our performance option plans is set out here. For additional information, please refer to our 2008 proxy circular on our website.
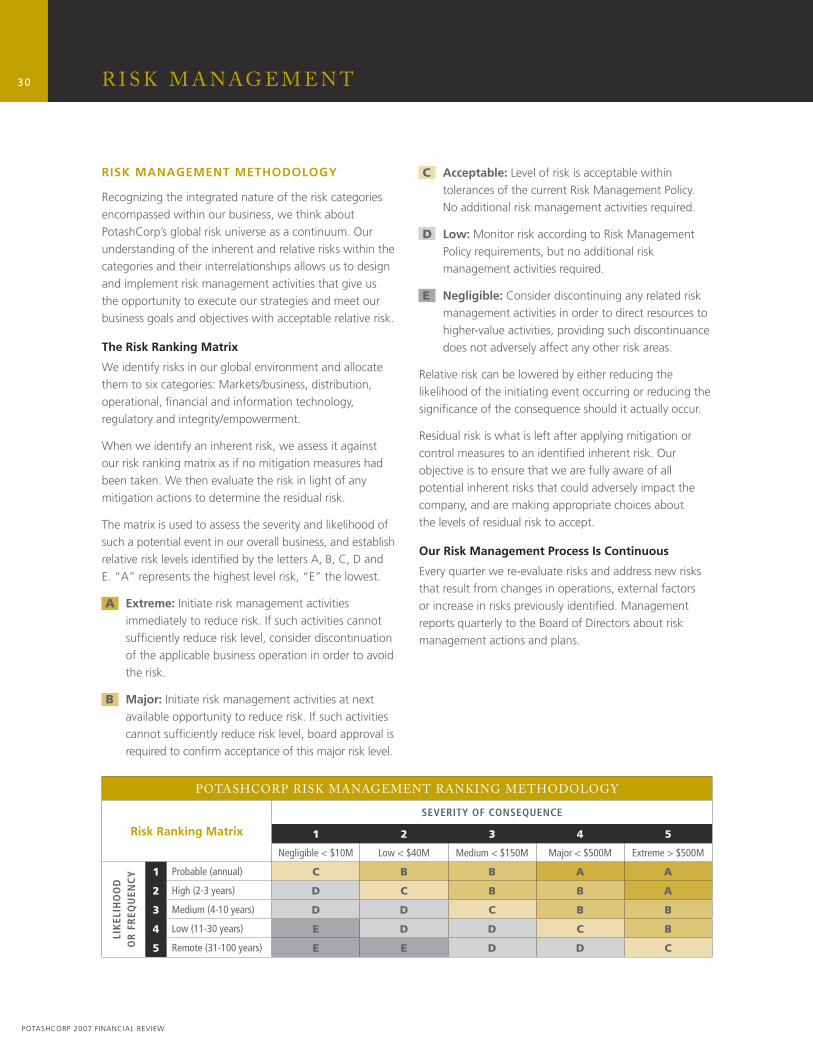
30
POTASHCORP 2007 FINANCIAL REVIEW
R I S K M A N AG E M E N T
RISK MANAGEMENT METHODOLOGY
Recognizing the integrated nature of the risk categories encompassed within our business, we think about PotashCorp’s global risk universe as a continuum. Our understanding of the inherent and relative risks within the categories and their interrelationships allows us to design and implement risk management activities that give us the opportunity to execute our strategies and meet our business goals and objectives with acceptable relative risk.
The Risk Ranking Matrix
We identify risks in our global environment and allocate them to six categories: Markets/business, distribution, operational, fi nancial and information technology, regulatory and integrity/empowerment.
When we identify an inherent risk, we assess it against our risk ranking matrix as if no mitigation measures had been taken. We then evaluate the risk in light of any mitigation actions to determine the residual risk.
The matrix is used to assess the severity and likelihood of such a potential event in our overall business, and establish relative risk levels identifi ed by the letters A, B, C, D and E. “A” represents the highest level risk, “E” the lowest.
A Extreme: Initiate risk management activities immediately to reduce risk. If such activities cannot suffi ciently reduce risk level, consider discontinuation of the applicable business operation in order to avoid the risk.
B Major: Initiate risk management activities at next available opportunity to reduce risk. If such activities cannot suffi ciently reduce risk level, board approval is required to confi rm acceptance of this major risk level.
C Acceptable: Level of risk is acceptable within tolerances of the current Risk Management Policy. No additional risk management activities required.
D Low: Monitor risk according to Risk Management Policy requirements, but no additional risk management activities required.
E Negligible: Consider discontinuing any related risk management activities in order to direct resources to higher-value activities, providing such discontinuance does not adversely affect any other risk areas.
Relative risk can be lowered by either reducing the likelihood of the initiating event occurring or reducing the signifi cance of the consequence should it actually occur.
Residual risk is what is left after applying mitigation or control measures to an identifi ed inherent risk. Our objective is to ensure that we are fully aware of all potential inherent risks that could adversely impact the company, and are making appropriate choices about the levels of residual risk to accept.
Our Risk Management Process Is Continuous
Every quarter we re-evaluate risks and address new risks that result from changes in operations, external factors or increase in risks previously identifi ed. Management reports quarterly to the Board of Directors about risk management actions and plans.
POTASHCORP RISK MANAGEMENT RANKING METHODOLOGY
Risk Ranking Matrix
SEVERITY OF CONSEQUENCE
1 2 3 4 5
Negligible < $10M Low < $40M Medium < $150M Major < $500M Extreme > $500M
LIK
ELIH
OO
D
OR
FR
EQU
ENC
Y 1 Probable (annual) C B B A A
2 High (2-3 years) D C B B A
3 Medium (4-10 years) D D C B B
4 Low (11-30 years) E D D C B
5 Remote (31-100 years) E E D D C
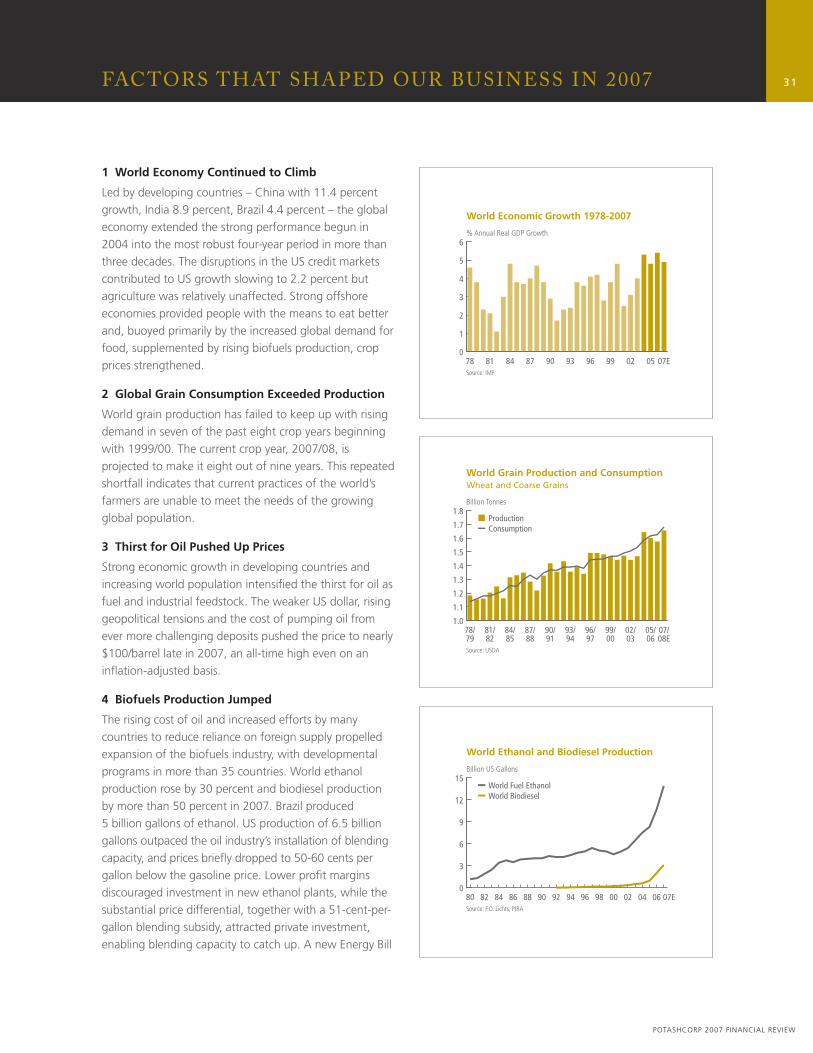
31
POTASHCORP 2007 FINANCIAL REVIEW
FACTORS THAT SHAPED OUR BUSINESS IN 2007
1 World Economy Continued to Climb
Led by developing countries – China with 11.4 percent growth, India 8.9 percent, Brazil 4.4 percent – the global economy extended the strong performance begun in 2004 into the most robust four-year period in more than three decades. The disruptions in the US credit markets contributed to US growth slowing to 2.2 percent but agriculture was relatively unaffected. Strong offshore economies provided people with the means to eat better and, buoyed primarily by the increased global demand for food, supplemented by rising biofuels production, crop prices strengthened.
2 Global Grain Consumption Exceeded Production
World grain production has failed to keep up with rising demand in seven of the past eight crop years beginning with 1999/00. The current crop year, 2007/08, is projected to make it eight out of nine years. This repeated shortfall indicates that current practices of the world’s farmers are unable to meet the needs of the growing global population.
3 Thirst for Oil Pushed Up Prices
Strong economic growth in developing countries and increasing world population intensifi ed the thirst for oil as fuel and industrial feedstock. The weaker US dollar, rising geopolitical tensions and the cost of pumping oil from ever more challenging deposits pushed the price to nearly $100/barrel late in 2007, an all-time high even on an infl ation-adjusted basis.
4 Biofuels Production Jumped
The rising cost of oil and increased efforts by many countries to reduce reliance on foreign supply propelled expansion of the biofuels industry, with developmental programs in more than 35 countries. World ethanol production rose by 30 percent and biodiesel production by more than 50 percent in 2007. Brazil produced 5 billion gallons of ethanol. US production of 6.5 billion gallons outpaced the oil industry’s installation of blending capacity, and prices briefl y dropped to 50-60 cents per gallon below the gasoline price. Lower profi t margins discouraged investment in new ethanol plants, while the substantial price differential, together with a 51-cent-per-gallon blending subsidy, attracted private investment, enabling blending capacity to catch up. A new Energy Bill
1.0
1.1
1.2
1.3
1.4
1.5
1.6
1.7
1.8
07/08E
05/06
02/03
99/00
96/97
93/94
90/91
87/88
84/85
81/82
78/79
Billion Tonnes
Source: USDA
World Grain Production and ConsumptionWheat and Coarse Grains
ProductionConsumption
0
1
2
3
4
5
6
07E05029996939087848178
% Annual Real GDP Growth
Source: IMF
World Economic Growth 1978-2007
0
3
6
9
12
15
07E0604020098969492908886848280
Billion US Gallons
Source: F.O. Lichts, PIRA
World Ethanol and Biodiesel Production
World Fuel EthanolWorld Biodiesel
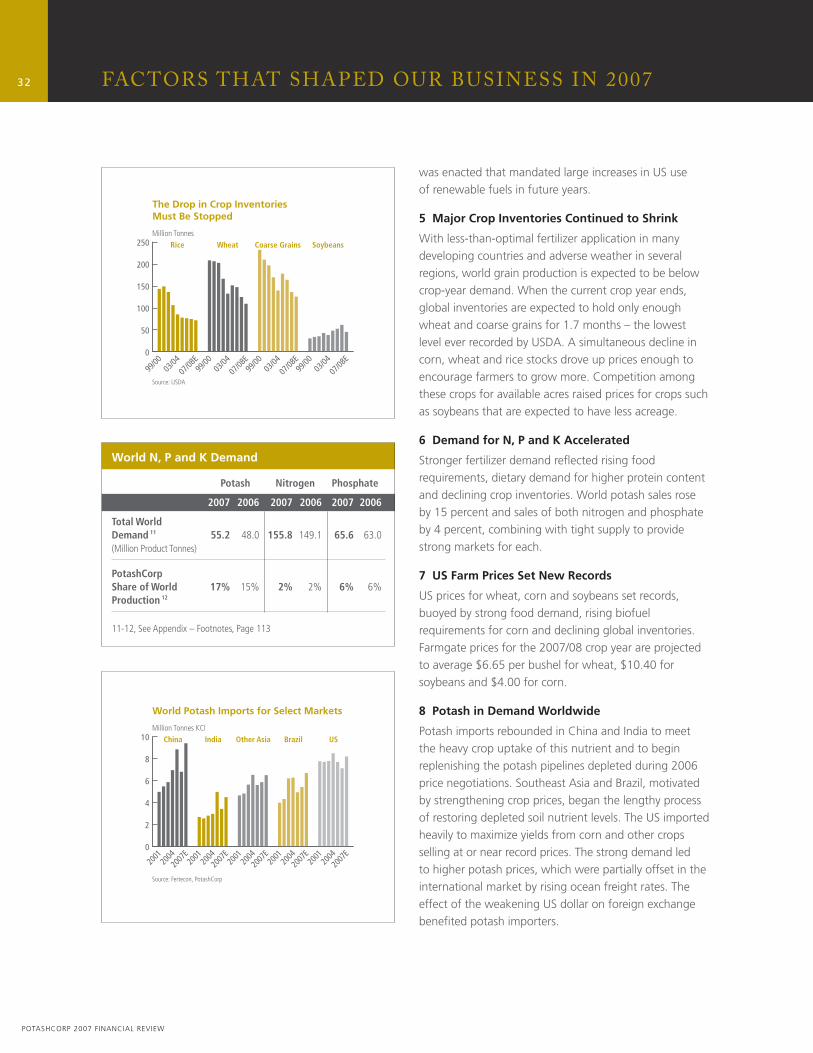
32
POTASHCORP 2007 FINANCIAL REVIEW
was enacted that mandated large increases in US use of renewable fuels in future years.
5 Major Crop Inventories Continued to Shrink
With less-than-optimal fertilizer application in many developing countries and adverse weather in several regions, world grain production is expected to be below crop-year demand. When the current crop year ends, global inventories are expected to hold only enough wheat and coarse grains for 1.7 months – the lowest level ever recorded by USDA. A simultaneous decline in corn, wheat and rice stocks drove up prices enough to encourage farmers to grow more. Competition among these crops for available acres raised prices for crops such as soybeans that are expected to have less acreage.
6 Demand for N, P and K Accelerated
Stronger fertilizer demand refl ected rising food requirements, dietary demand for higher protein content and declining crop inventories. World potash sales rose by 15 percent and sales of both nitrogen and phosphate by 4 percent, combining with tight supply to provide strong markets for each.
7 US Farm Prices Set New Records
US prices for wheat, corn and soybeans set records, buoyed by strong food demand, rising biofuel requirements for corn and declining global inventories. Farmgate prices for the 2007/08 crop year are projected to average $6.65 per bushel for wheat, $10.40 for soybeans and $4.00 for corn.
8 Potash in Demand Worldwide
Potash imports rebounded in China and India to meet the heavy crop uptake of this nutrient and to begin replenishing the potash pipelines depleted during 2006 price negotiations. Southeast Asia and Brazil, motivated by strengthening crop prices, began the lengthy process of restoring depleted soil nutrient levels. The US imported heavily to maximize yields from corn and other crops selling at or near record prices. The strong demand led to higher potash prices, which were partially offset in the international market by rising ocean freight rates. The effect of the weakening US dollar on foreign exchange benefi ted potash importers.
FACTORS THAT SHAPED OUR BUSINESS IN 2007
0
50
100
150
200
250
07/08
E03
/0499
/00
07/08
E03
/0499
/00
07/08
E03
/0499
/00
07/08
E03
/0499
/00
Million Tonnes
Source: USDA
The Drop in Crop Inventories Must Be Stopped
Rice Wheat Coarse Grains Soybeans
0
2
4
6
8
10
2007
E20
0420
0120
07E
2004
2001
2007
E20
0420
0120
07E
2004
2001
2007
E20
0420
01
Million Tonnes KCl
Source: Fertecon, PotashCorp
World Potash Imports for Select Markets
China India Other Asia Brazil US
World N, P and K Demand
Potash Nitrogen Phosphate
2007 2006 2007 2006 2007 2006
Total World Demand 11 55.2 48.0 155.8 149.1 65.6 63.0(Million Product Tonnes)
PotashCorp Share of World 17% 15% 2% 2% 6% 6%Production 12
11-12, See Appendix – Footnotes, Page 113
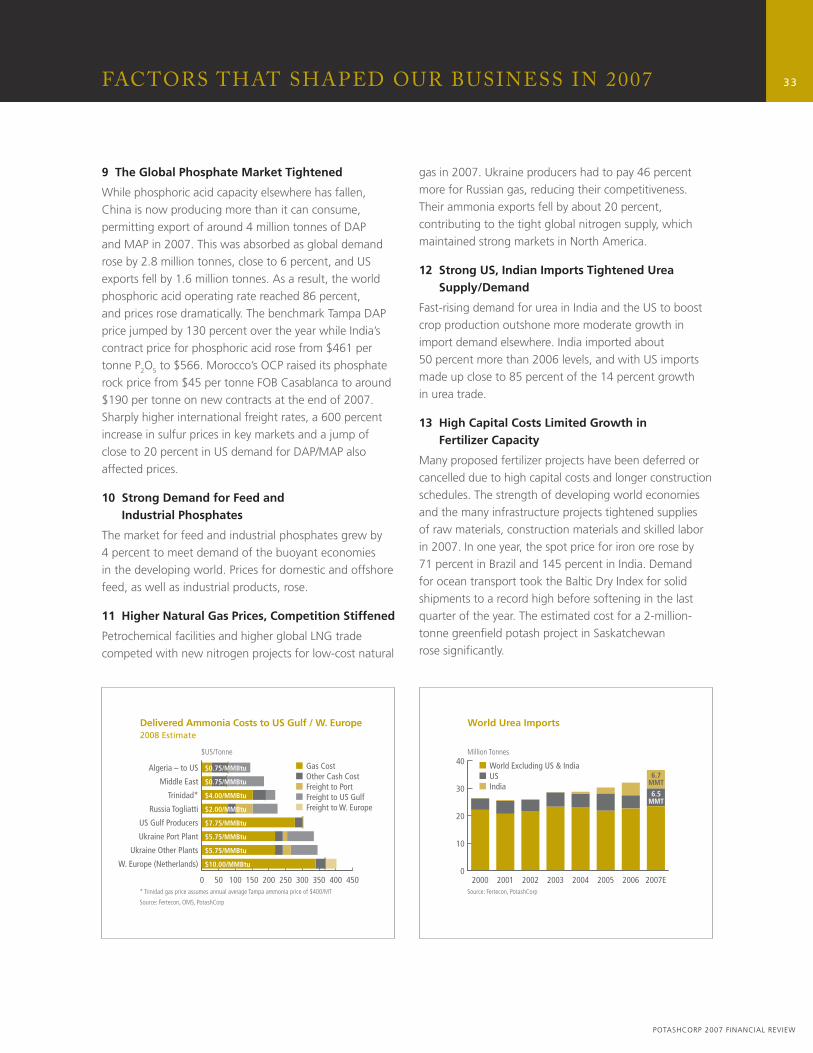
33
POTASHCORP 2007 FINANCIAL REVIEW
FACTORS THAT SHAPED OUR BUSINESS IN 2007
9 The Global Phosphate Market Tightened
While phosphoric acid capacity elsewhere has fallen, China is now producing more than it can consume, permitting export of around 4 million tonnes of DAP and MAP in 2007. This was absorbed as global demand rose by 2.8 million tonnes, close to 6 percent, and US exports fell by 1.6 million tonnes. As a result, the world phosphoric acid operating rate reached 86 percent, and prices rose dramatically. The benchmark Tampa DAP price jumped by 130 percent over the year while India’s contract price for phosphoric acid rose from $461 per tonne P2O5 to $566. Morocco’s OCP raised its phosphate rock price from $45 per tonne FOB Casablanca to around $190 per tonne on new contracts at the end of 2007. Sharply higher international freight rates, a 600 percent increase in sulfur prices in key markets and a jump of close to 20 percent in US demand for DAP/MAP also affected prices.
10 Strong Demand for Feed and Industrial Phosphates
The market for feed and industrial phosphates grew by 4 percent to meet demand of the buoyant economies in the developing world. Prices for domestic and offshore feed, as well as industrial products, rose.
11 Higher Natural Gas Prices, Competition Stiffened
Petrochemical facilities and higher global LNG trade competed with new nitrogen projects for low-cost natural
gas in 2007. Ukraine producers had to pay 46 percent more for Russian gas, reducing their competitiveness. Their ammonia exports fell by about 20 percent, contributing to the tight global nitrogen supply, which maintained strong markets in North America.
12 Strong US, Indian Imports Tightened Urea Supply/Demand
Fast-rising demand for urea in India and the US to boost crop production outshone more moderate growth in import demand elsewhere. India imported about 50 percent more than 2006 levels, and with US imports made up close to 85 percent of the 14 percent growth in urea trade.
13 High Capital Costs Limited Growth in Fertilizer Capacity
Many proposed fertilizer projects have been deferred or cancelled due to high capital costs and longer construction schedules. The strength of developing world economies and the many infrastructure projects tightened supplies of raw materials, construction materials and skilled labor in 2007. In one year, the spot price for iron ore rose by 71 percent in Brazil and 145 percent in India. Demand for ocean transport took the Baltic Dry Index for solid shipments to a record high before softening in the last quarter of the year. The estimated cost for a 2-million-tonne greenfi eld potash project in Saskatchewan rose signifi cantly.
0 50 100 150 200 250 300 350 400 450
W. Europe (Netherlands)
Ukraine Other Plants
Ukraine Port Plant
US Gulf Producers
Russia Togliatti
Trinidad*
Middle East
Algeria – to US
$US/Tonne
* Trinidad gas price assumes annual average Tampa ammonia price of $400/MT
Source: Fertecon, OMS, PotashCorp
Delivered Ammonia Costs to US Gulf / W. Europe2008 Estimate
Gas CostOther Cash CostFreight to PortFreight to US GulfFreight to W. Europe
$0.75/MMBtu
$0.75/MMBtu
$4.00/MMBtu
$2.00/MMBtu
$7.75/MMBtu
$5.75/MMBtu
$5.75/MMBtu
$10.00/MMBtu0
10
20
30
40
2007E2006200520042003200220012000
Million Tonnes
Source: Fertecon, PotashCorp
World Urea Imports
World Excluding US & IndiaUSIndia
6.7MMT
6.5MMT
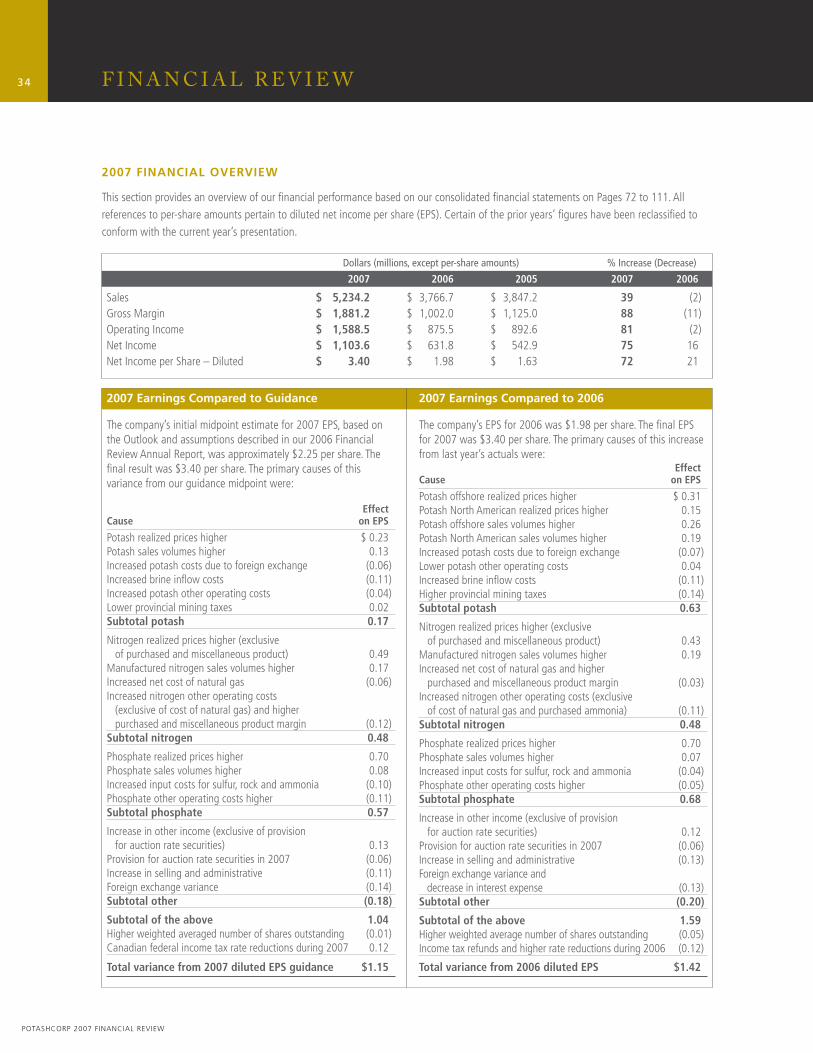
34
POTASHCORP 2007 FINANCIAL REVIEW
2007 FINANCIAL OVERVIEW
This section provides an overview of our fi nancial performance based on our consolidated fi nancial statements on Pages 72 to 111. All references to per-share amounts pertain to diluted net income per share (EPS). Certain of the prior years’ fi gures have been reclassifi ed to conform with the current year’s presentation.
F I N A N C I A L R E V I E W
Dollars (millions, except per-share amounts) % Increase (Decrease)
2007 2006 2005 2007 2006
Sales $ 5,234.2 $ 3,766.7 $ 3,847.2 39 (2) Gross Margin $ 1,881.2 $ 1,002.0 $ 1,125.0 88 (11) Operating Income $ 1,588.5 $ 875.5 $ 892.6 81 (2)Net Income $ 1,103.6 $ 631.8 $ 542.9 75 16Net Income per Share – Diluted $ 3.40 $ 1.98 $ 1.63 72 21
2007 Earnings Compared to Guidance
The company’s initial midpoint estimate for 2007 EPS, based on the Outlook and assumptions described in our 2006 Financial Review Annual Report, was approximately $2.25 per share. The fi nal result was $3.40 per share. The primary causes of this variance from our guidance midpoint were:
Effect Cause on EPS
Potash realized prices higher $ 0.23Potash sales volumes higher 0.13Increased potash costs due to foreign exchange (0.06)Increased brine infl ow costs (0.11)Increased potash other operating costs (0.04)Lower provincial mining taxes 0.02Subtotal potash 0.17
Nitrogen realized prices higher (exclusive of purchased and miscellaneous product) 0.49Manufactured nitrogen sales volumes higher 0.17Increased net cost of natural gas (0.06)Increased nitrogen other operating costs (exclusive of cost of natural gas) and higher purchased and miscellaneous product margin (0.12)Subtotal nitrogen 0.48
Phosphate realized prices higher 0.70Phosphate sales volumes higher 0.08Increased input costs for sulfur, rock and ammonia (0.10)Phosphate other operating costs higher (0.11)Subtotal phosphate 0.57
Increase in other income (exclusive of provision for auction rate securities) 0.13Provision for auction rate securities in 2007 (0.06)Increase in selling and administrative (0.11)Foreign exchange variance (0.14)Subtotal other (0.18)
Subtotal of the above 1.04Higher weighted averaged number of shares outstanding (0.01)Canadian federal income tax rate reductions during 2007 0.12
Total variance from 2007 diluted EPS guidance $1.15
2007 Earnings Compared to 2006
The company’s EPS for 2006 was $1.98 per share. The fi nal EPS for 2007 was $3.40 per share. The primary causes of this increase from last year’s actuals were: Effect Cause on EPS
Potash offshore realized prices higher $ 0.31Potash North American realized prices higher 0.15Potash offshore sales volumes higher 0.26Potash North American sales volumes higher 0.19Increased potash costs due to foreign exchange (0.07)Lower potash other operating costs 0.04Increased brine infl ow costs (0.11)Higher provincial mining taxes (0.14)Subtotal potash 0.63
Nitrogen realized prices higher (exclusive of purchased and miscellaneous product) 0.43Manufactured nitrogen sales volumes higher 0.19Increased net cost of natural gas and higher purchased and miscellaneous product margin (0.03)Increased nitrogen other operating costs (exclusive of cost of natural gas and purchased ammonia) (0.11)Subtotal nitrogen 0.48
Phosphate realized prices higher 0.70Phosphate sales volumes higher 0.07Increased input costs for sulfur, rock and ammonia (0.04)Phosphate other operating costs higher (0.05)Subtotal phosphate 0.68
Increase in other income (exclusive of provision for auction rate securities) 0.12Provision for auction rate securities in 2007 (0.06)Increase in selling and administrative (0.13)Foreign exchange variance and decrease in interest expense (0.13)Subtotal other (0.20)
Subtotal of the above 1.59Higher weighted average number of shares outstanding (0.05)Income tax refunds and higher rate reductions during 2006 (0.12)
Total variance from 2006 diluted EPS $1.42
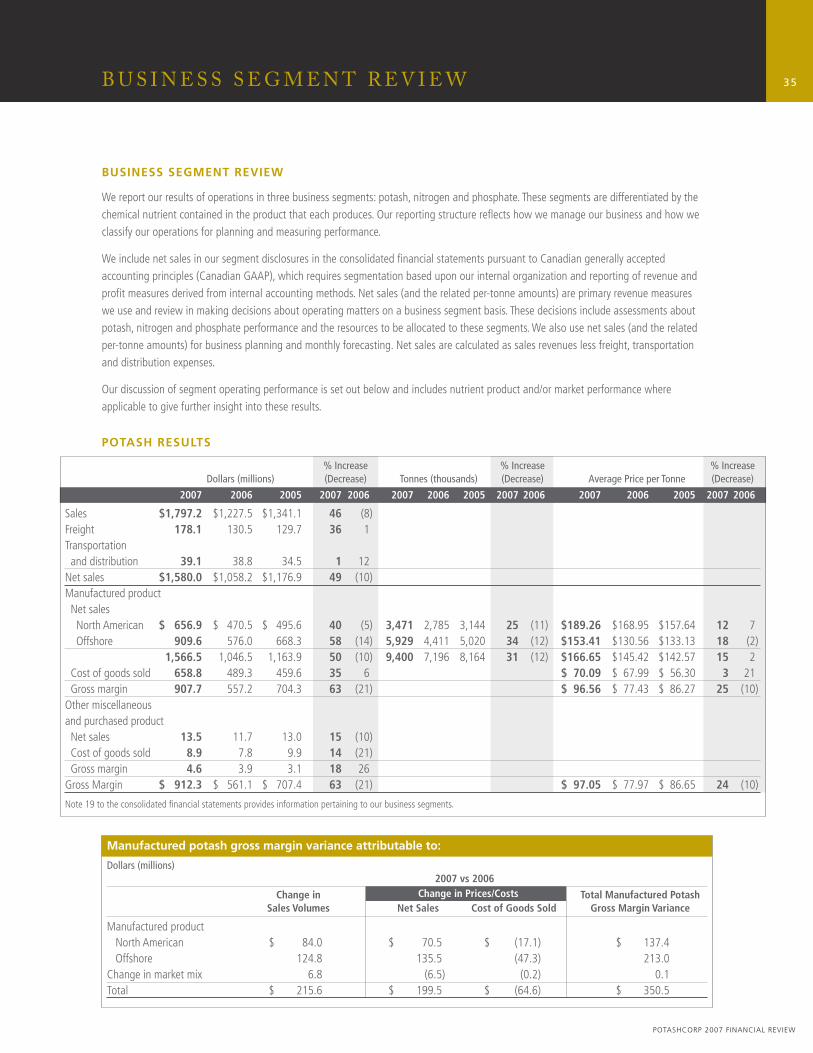
35
POTASHCORP 2007 FINANCIAL REVIEW
B U S I N E S S S E G M E N T R E V I E W
% Increase % Increase % Increase Dollars (millions) (Decrease) Tonnes (thousands) (Decrease) Average Price per Tonne (Decrease)
2007 2006 2005 2007 2006 2007 2006 2005 2007 2006 2007 2006 2005 2007 2006
Sales $1,797.2 $1,227.5 $1,341.1 46 (8)Freight 178.1 130.5 129.7 36 1Transportation and distribution 39.1 38.8 34.5 1 12Net sales $1,580.0 $1,058.2 $1,176.9 49 (10)Manufactured product Net sales North American $ 656.9 $ 470.5 $ 495.6 40 (5) 3,471 2,785 3,144 25 (11) $189.26 $168.95 $157.64 12 7 Offshore 909.6 576.0 668.3 58 (14) 5,929 4,411 5,020 34 (12) $153.41 $130.56 $133.13 18 (2) 1,566.5 1,046.5 1,163.9 50 (10) 9,400 7,196 8,164 31 (12) $166.65 $145.42 $142.57 15 2 Cost of goods sold 658.8 489.3 459.6 35 6 $ 70.09 $ 67.99 $ 56.30 3 21 Gross margin 907.7 557.2 704.3 63 (21) $ 96.56 $ 77.43 $ 86.27 25 (10)Other miscellaneousand purchased product Net sales 13.5 11.7 13.0 15 (10) Cost of goods sold 8.9 7.8 9.9 14 (21) Gross margin 4.6 3.9 3.1 18 26 Gross Margin $ 912.3 $ 561.1 $ 707.4 63 (21) $ 97.05 $ 77.97 $ 86.65 24 (10)
Note 19 to the consolidated fi nancial statements provides information pertaining to our business segments.
BUSINESS SEGMENT REVIEW
We report our results of operations in three business segments: potash, nitrogen and phosphate. These segments are differentiated by the chemical nutrient contained in the product that each produces. Our reporting structure refl ects how we manage our business and how we classify our operations for planning and measuring performance.
We include net sales in our segment disclosures in the consolidated fi nancial statements pursuant to Canadian generally accepted accounting principles (Canadian GAAP), which requires segmentation based upon our internal organization and reporting of revenue and profi t measures derived from internal accounting methods. Net sales (and the related per-tonne amounts) are primary revenue measures we use and review in making decisions about operating matters on a business segment basis. These decisions include assessments about potash, nitrogen and phosphate performance and the resources to be allocated to these segments. We also use net sales (and the related per-tonne amounts) for business planning and monthly forecasting. Net sales are calculated as sales revenues less freight, transportation and distribution expenses.
Our discussion of segment operating performance is set out below and includes nutrient product and/or market performance where applicable to give further insight into these results.
POTASH RESULTS
Manufactured potash gross margin variance attributable to:
Dollars (millions) 2007 vs 2006
Change in Change in Prices/Costs Total Manufactured Potash Sales Volumes Net Sales Cost of Goods Sold Gross Margin Variance
Manufactured product North American $ 84.0 $ 70.5 $ (17.1) $ 137.4 Offshore 124.8 135.5 (47.3) 213.0 Change in market mix 6.8 (6.5) (0.2) 0.1Total $ 215.6 $ 199.5 $ (64.6) $ 350.5
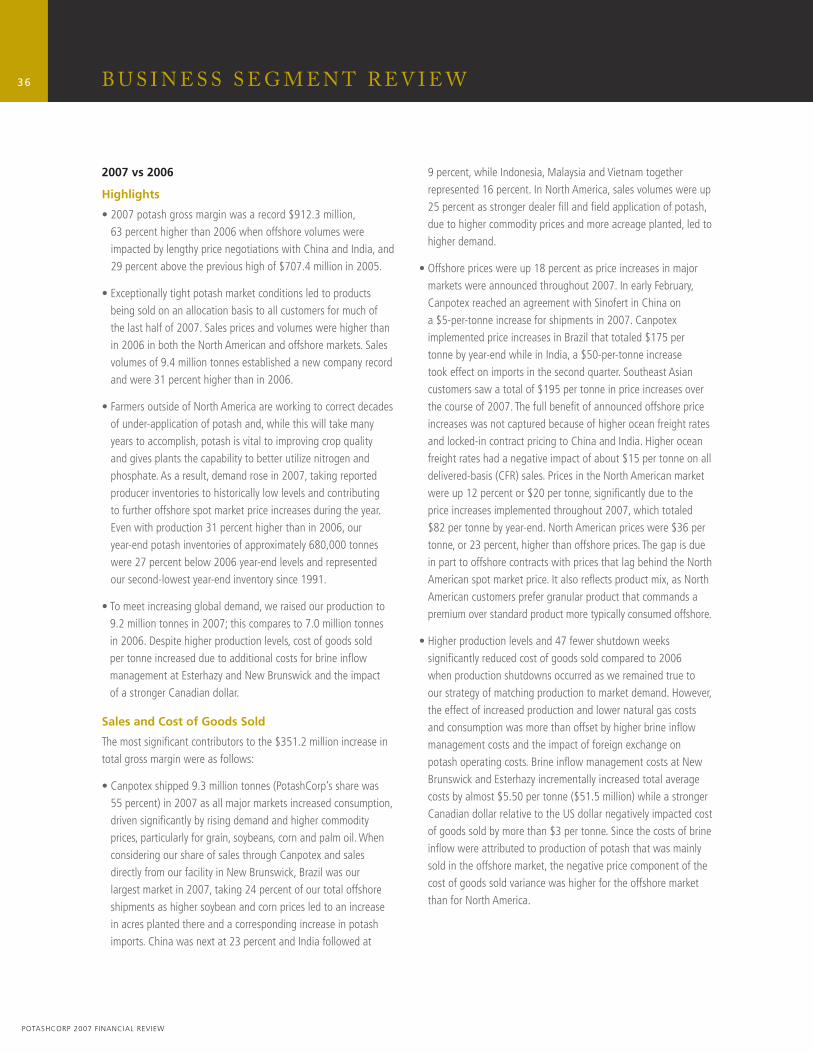
36
POTASHCORP 2007 FINANCIAL REVIEW
2007 vs 2006
Highlights
• 2007 potash gross margin was a record $912.3 million, 63 percent higher than 2006 when offshore volumes were impacted by lengthy price negotiations with China and India, and 29 percent above the previous high of $707.4 million in 2005.
• Exceptionally tight potash market conditions led to products being sold on an allocation basis to all customers for much of the last half of 2007. Sales prices and volumes were higher than in 2006 in both the North American and offshore markets. Sales volumes of 9.4 million tonnes established a new company record and were 31 percent higher than in 2006.
• Farmers outside of North America are working to correct decades of under-application of potash and, while this will take many years to accomplish, potash is vital to improving crop quality and gives plants the capability to better utilize nitrogen and phosphate. As a result, demand rose in 2007, taking reported producer inventories to historically low levels and contributing to further offshore spot market price increases during the year. Even with production 31 percent higher than in 2006, our year-end potash inventories of approximately 680,000 tonnes were 27 percent below 2006 year-end levels and represented our second-lowest year-end inventory since 1991.
• To meet increasing global demand, we raised our production to 9.2 million tonnes in 2007; this compares to 7.0 million tonnes in 2006. Despite higher production levels, cost of goods sold per tonne increased due to additional costs for brine infl ow management at Esterhazy and New Brunswick and the impact of a stronger Canadian dollar.
Sales and Cost of Goods Sold
The most signifi cant contributors to the $351.2 million increase in total gross margin were as follows:
• Canpotex shipped 9.3 million tonnes (PotashCorp’s share was 55 percent) in 2007 as all major markets increased consumption, driven signifi cantly by rising demand and higher commodity prices, particularly for grain, soybeans, corn and palm oil. When considering our share of sales through Canpotex and sales directly from our facility in New Brunswick, Brazil was our largest market in 2007, taking 24 percent of our total offshore shipments as higher soybean and corn prices led to an increase in acres planted there and a corresponding increase in potash imports. China was next at 23 percent and India followed at
9 percent, while Indonesia, Malaysia and Vietnam together represented 16 percent. In North America, sales volumes were up 25 percent as stronger dealer fi ll and fi eld application of potash, due to higher commodity prices and more acreage planted, led to higher demand.
• Offshore prices were up 18 percent as price increases in major markets were announced throughout 2007. In early February, Canpotex reached an agreement with Sinofert in China on a $5-per-tonne increase for shipments in 2007. Canpotex implemented price increases in Brazil that totaled $175 per tonne by year-end while in India, a $50-per-tonne increase took effect on imports in the second quarter. Southeast Asian customers saw a total of $195 per tonne in price increases over the course of 2007. The full benefi t of announced offshore price increases was not captured because of higher ocean freight rates and locked-in contract pricing to China and India. Higher ocean freight rates had a negative impact of about $15 per tonne on all delivered-basis (CFR) sales. Prices in the North American market were up 12 percent or $20 per tonne, signifi cantly due to the price increases implemented throughout 2007, which totaled $82 per tonne by year-end. North American prices were $36 per tonne, or 23 percent, higher than offshore prices. The gap is due in part to offshore contracts with prices that lag behind the North American spot market price. It also refl ects product mix, as North American customers prefer granular product that commands a premium over standard product more typically consumed offshore.
• Higher production levels and 47 fewer shutdown weeks signifi cantly reduced cost of goods sold compared to 2006 when production shutdowns occurred as we remained true to our strategy of matching production to market demand. However, the effect of increased production and lower natural gas costs and consumption was more than offset by higher brine infl ow management costs and the impact of foreign exchange on potash operating costs. Brine infl ow management costs at New Brunswick and Esterhazy incrementally increased total average costs by almost $5.50 per tonne ($51.5 million) while a stronger Canadian dollar relative to the US dollar negatively impacted cost of goods sold by more than $3 per tonne. Since the costs of brine infl ow were attributed to production of potash that was mainly sold in the offshore market, the negative price component of the cost of goods sold variance was higher for the offshore market than for North America.
B U S I N E S S S E G M E N T R E V I E W
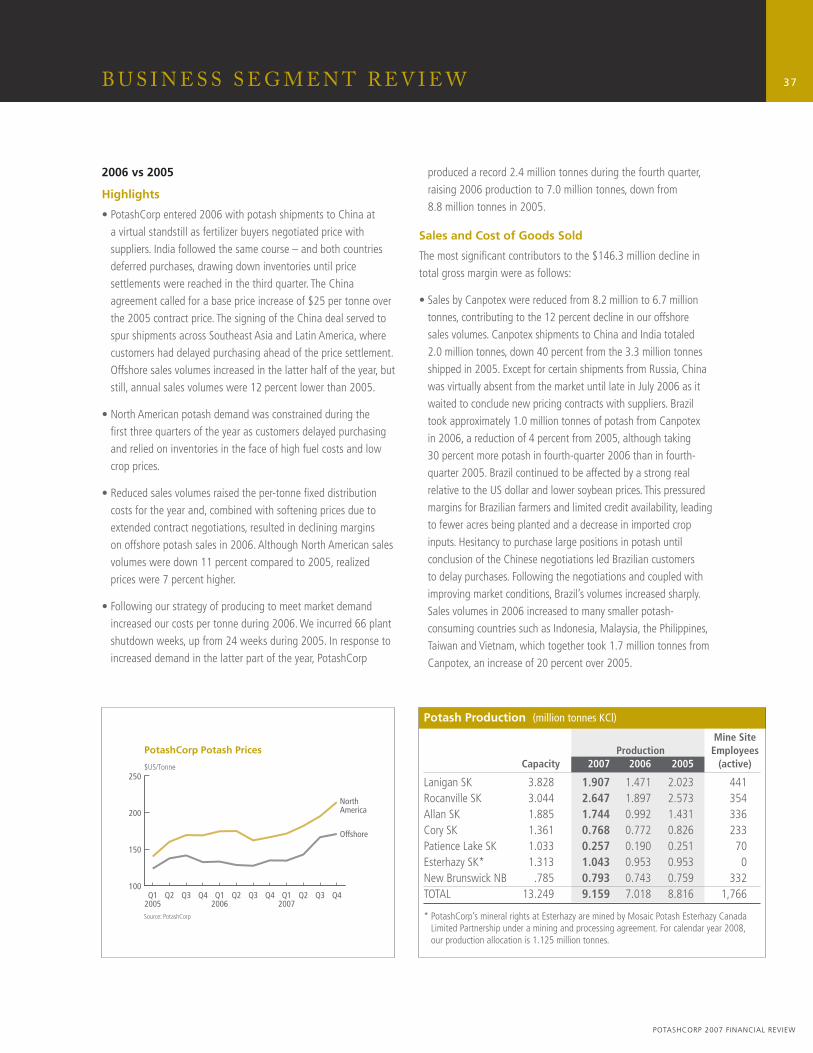
37
POTASHCORP 2007 FINANCIAL REVIEW
B U S I N E S S S E G M E N T R E V I E W
2006 vs 2005
Highlights
• PotashCorp entered 2006 with potash shipments to China at a virtual standstill as fertilizer buyers negotiated price with suppliers. India followed the same course – and both countries deferred purchases, drawing down inventories until price settlements were reached in the third quarter. The China agreement called for a base price increase of $25 per tonne over the 2005 contract price. The signing of the China deal served to spur shipments across Southeast Asia and Latin America, where customers had delayed purchasing ahead of the price settlement. Offshore sales volumes increased in the latter half of the year, but still, annual sales volumes were 12 percent lower than 2005.
• North American potash demand was constrained during the fi rst three quarters of the year as customers delayed purchasing and relied on inventories in the face of high fuel costs and low crop prices.
• Reduced sales volumes raised the per-tonne fi xed distribution costs for the year and, combined with softening prices due to extended contract negotiations, resulted in declining margins on offshore potash sales in 2006. Although North American sales volumes were down 11 percent compared to 2005, realized prices were 7 percent higher.
• Following our strategy of producing to meet market demand increased our costs per tonne during 2006. We incurred 66 plant shutdown weeks, up from 24 weeks during 2005. In response to increased demand in the latter part of the year, PotashCorp
produced a record 2.4 million tonnes during the fourth quarter, raising 2006 production to 7.0 million tonnes, down from 8.8 million tonnes in 2005.
Sales and Cost of Goods Sold
The most signifi cant contributors to the $146.3 million decline in total gross margin were as follows:
• Sales by Canpotex were reduced from 8.2 million to 6.7 million tonnes, contributing to the 12 percent decline in our offshore sales volumes. Canpotex shipments to China and India totaled 2.0 million tonnes, down 40 percent from the 3.3 million tonnes shipped in 2005. Except for certain shipments from Russia, China was virtually absent from the market until late in July 2006 as it waited to conclude new pricing contracts with suppliers. Brazil took approximately 1.0 million tonnes of potash from Canpotex in 2006, a reduction of 4 percent from 2005, although taking 30 percent more potash in fourth-quarter 2006 than in fourth-quarter 2005. Brazil continued to be affected by a strong real relative to the US dollar and lower soybean prices. This pressured margins for Brazilian farmers and limited credit availability, leading to fewer acres being planted and a decrease in imported crop inputs. Hesitancy to purchase large positions in potash until conclusion of the Chinese negotiations led Brazilian customers to delay purchases. Following the negotiations and coupled with improving market conditions, Brazil’s volumes increased sharply. Sales volumes in 2006 increased to many smaller potash-consuming countries such as Indonesia, Malaysia, the Philippines, Taiwan and Vietnam, which together took 1.7 million tonnes from Canpotex, an increase of 20 percent over 2005.
100
150
200
250
Q4Q3Q2Q12007
Q4Q3Q2Q12006
Q4Q3Q2Q12005
$US/Tonne
Source: PotashCorp
PotashCorp Potash Prices
North America
Offshore
Potash Production (million tonnes KCl)
Mine Site Production Employees Capacity 2007 2006 2005 (active)
Lanigan SK 3.828 1.907 1.471 2.023 441Rocanville SK 3.044 2.647 1.897 2.573 354Allan SK 1.885 1.744 0.992 1.431 336Cory SK 1.361 0.768 0.772 0.826 233Patience Lake SK 1.033 0.257 0.190 0.251 70Esterhazy SK* 1.313 1.043 0.953 0.953 0New Brunswick NB .785 0.793 0.743 0.759 332TOTAL 13.249 9.159 7.018 8.816 1,766
* PotashCorp’s mineral rights at Esterhazy are mined by Mosaic Potash Esterhazy Canada Limited Partnership under a mining and processing agreement. For calendar year 2008, our production allocation is 1.125 million tonnes.
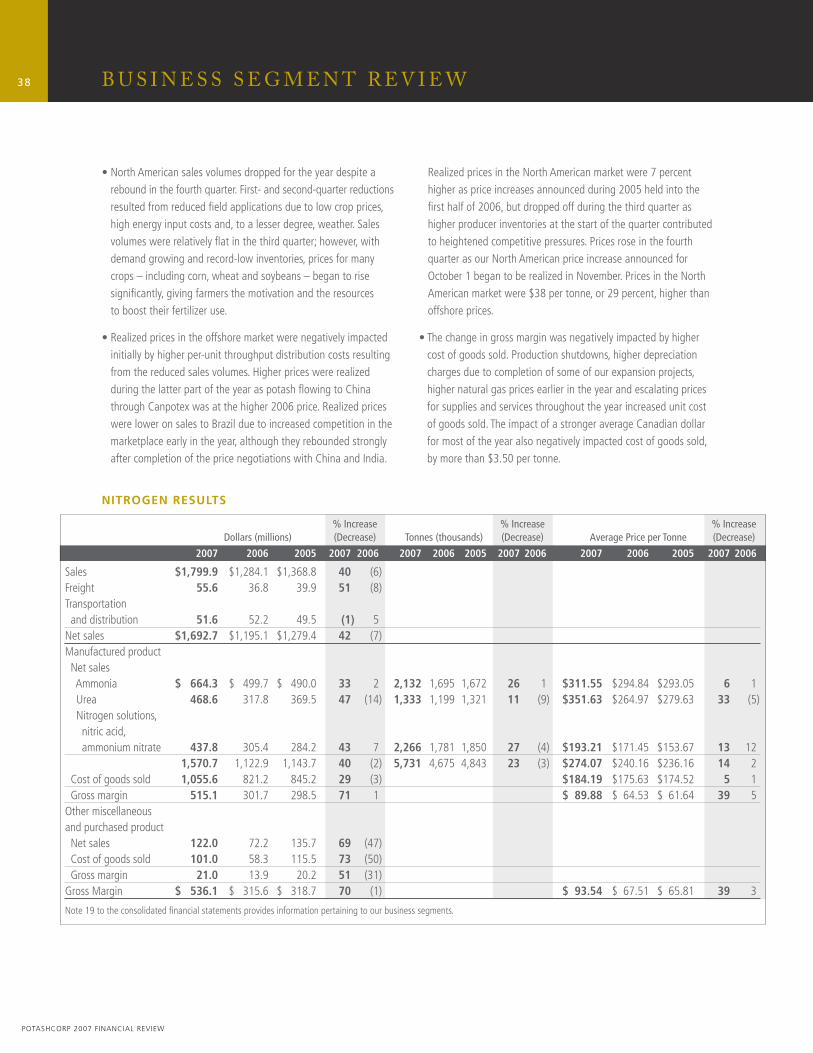
38
POTASHCORP 2007 FINANCIAL REVIEW
NITROGEN RESULTS
• North American sales volumes dropped for the year despite a rebound in the fourth quarter. First- and second-quarter reductions resulted from reduced fi eld applications due to low crop prices, high energy input costs and, to a lesser degree, weather. Sales volumes were relatively fl at in the third quarter; however, with demand growing and record-low inventories, prices for many crops – including corn, wheat and soybeans – began to rise signifi cantly, giving farmers the motivation and the resources to boost their fertilizer use.
• Realized prices in the offshore market were negatively impacted initially by higher per-unit throughput distribution costs resulting from the reduced sales volumes. Higher prices were realized during the latter part of the year as potash fl owing to China through Canpotex was at the higher 2006 price. Realized prices were lower on sales to Brazil due to increased competition in the marketplace early in the year, although they rebounded strongly after completion of the price negotiations with China and India.
Realized prices in the North American market were 7 percent higher as price increases announced during 2005 held into the fi rst half of 2006, but dropped off during the third quarter as higher producer inventories at the start of the quarter contributed to heightened competitive pressures. Prices rose in the fourth quarter as our North American price increase announced for October 1 began to be realized in November. Prices in the North American market were $38 per tonne, or 29 percent, higher than offshore prices.
• The change in gross margin was negatively impacted by higher cost of goods sold. Production shutdowns, higher depreciation charges due to completion of some of our expansion projects, higher natural gas prices earlier in the year and escalating prices for supplies and services throughout the year increased unit cost of goods sold. The impact of a stronger average Canadian dollar for most of the year also negatively impacted cost of goods sold, by more than $3.50 per tonne.
B U S I N E S S S E G M E N T R E V I E W
% Increase % Increase % Increase Dollars (millions) (Decrease) Tonnes (thousands) (Decrease) Average Price per Tonne (Decrease)
2007 2006 2005 2007 2006 2007 2006 2005 2007 2006 2007 2006 2005 2007 2006
Sales $1,799.9 $1,284.1 $1,368.8 40 (6)Freight 55.6 36.8 39.9 51 (8)Transportation and distribution 51.6 52.2 49.5 (1) 5Net sales $1,692.7 $1,195.1 $1,279.4 42 (7)Manufactured product Net sales Ammonia $ 664.3 $ 499.7 $ 490.0 33 2 2,132 1,695 1,672 26 1 $311.55 $294.84 $293.05 6 1 Urea 468.6 317.8 369.5 47 (14) 1,333 1,199 1,321 11 (9) $351.63 $264.97 $279.63 33 (5) Nitrogen solutions, nitric acid, ammonium nitrate 437.8 305.4 284.2 43 7 2,266 1,781 1,850 27 (4) $193.21 $171.45 $153.67 13 12 1,570.7 1,122.9 1,143.7 40 (2) 5,731 4,675 4,843 23 (3) $274.07 $240.16 $236.16 14 2 Cost of goods sold 1,055.6 821.2 845.2 29 (3) $184.19 $175.63 $174.52 5 1 Gross margin 515.1 301.7 298.5 71 1 $ 89.88 $ 64.53 $ 61.64 39 5Other miscellaneousand purchased product Net sales 122.0 72.2 135.7 69 (47) Cost of goods sold 101.0 58.3 115.5 73 (50) Gross margin 21.0 13.9 20.2 51 (31) Gross Margin $ 536.1 $ 315.6 $ 318.7 70 (1) $ 93.54 $ 67.51 $ 65.81 39 3
Note 19 to the consolidated fi nancial statements provides information pertaining to our business segments.
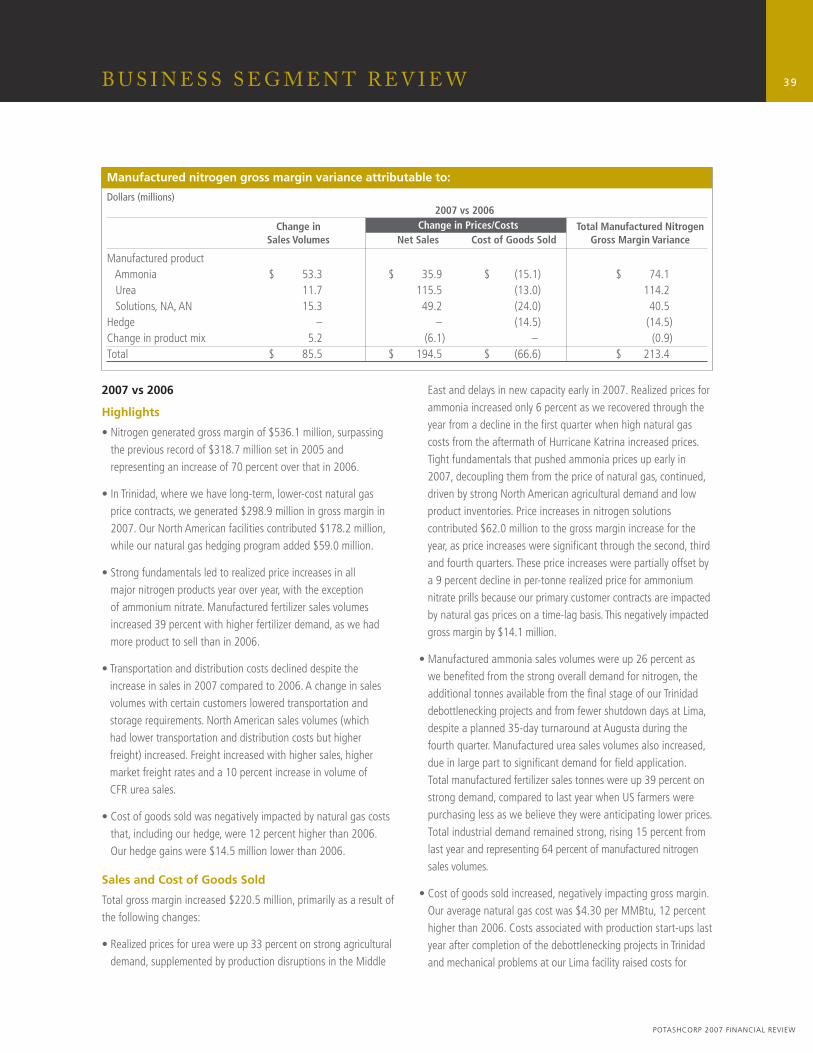
39
POTASHCORP 2007 FINANCIAL REVIEW
B U S I N E S S S E G M E N T R E V I E W
Manufactured nitrogen gross margin variance attributable to:
Dollars (millions) 2007 vs 2006
Change in Change in Prices/Costs Total Manufactured Nitrogen Sales Volumes Net Sales Cost of Goods Sold Gross Margin Variance
Manufactured product Ammonia $ 53.3 $ 35.9 $ (15.1) $ 74.1 Urea 11.7 115.5 (13.0) 114.2 Solutions, NA, AN 15.3 49.2 (24.0) 40.5Hedge – – (14.5) (14.5)Change in product mix 5.2 (6.1) – (0.9)Total $ 85.5 $ 194.5 $ (66.6) $ 213.4
2007 vs 2006
Highlights
• Nitrogen generated gross margin of $536.1 million, surpassing the previous record of $318.7 million set in 2005 and representing an increase of 70 percent over that in 2006.
• In Trinidad, where we have long-term, lower-cost natural gas price contracts, we generated $298.9 million in gross margin in 2007. Our North American facilities contributed $178.2 million, while our natural gas hedging program added $59.0 million.
• Strong fundamentals led to realized price increases in all major nitrogen products year over year, with the exception of ammonium nitrate. Manufactured fertilizer sales volumes increased 39 percent with higher fertilizer demand, as we had more product to sell than in 2006.
• Transportation and distribution costs declined despite the increase in sales in 2007 compared to 2006. A change in sales volumes with certain customers lowered transportation and storage requirements. North American sales volumes (which had lower transportation and distribution costs but higher freight) increased. Freight increased with higher sales, higher market freight rates and a 10 percent increase in volume of CFR urea sales.
• Cost of goods sold was negatively impacted by natural gas costs that, including our hedge, were 12 percent higher than 2006. Our hedge gains were $14.5 million lower than 2006.
Sales and Cost of Goods Sold
Total gross margin increased $220.5 million, primarily as a result of the following changes:
• Realized prices for urea were up 33 percent on strong agricultural demand, supplemented by production disruptions in the Middle
East and delays in new capacity early in 2007. Realized prices for ammonia increased only 6 percent as we recovered through the year from a decline in the fi rst quarter when high natural gas costs from the aftermath of Hurricane Katrina increased prices. Tight fundamentals that pushed ammonia prices up early in 2007, decoupling them from the price of natural gas, continued, driven by strong North American agricultural demand and low product inventories. Price increases in nitrogen solutions contributed $62.0 million to the gross margin increase for the year, as price increases were signifi cant through the second, third and fourth quarters. These price increases were partially offset by a 9 percent decline in per-tonne realized price for ammonium nitrate prills because our primary customer contracts are impacted by natural gas prices on a time-lag basis. This negatively impacted gross margin by $14.1 million.
• Manufactured ammonia sales volumes were up 26 percent as we benefi ted from the strong overall demand for nitrogen, the additional tonnes available from the fi nal stage of our Trinidad debottlenecking projects and from fewer shutdown days at Lima, despite a planned 35-day turnaround at Augusta during the fourth quarter. Manufactured urea sales volumes also increased, due in large part to signifi cant demand for fi eld application. Total manufactured fertilizer sales tonnes were up 39 percent on strong demand, compared to last year when US farmers were purchasing less as we believe they were anticipating lower prices. Total industrial demand remained strong, rising 15 percent from last year and representing 64 percent of manufactured nitrogen sales volumes.
• Cost of goods sold increased, negatively impacting gross margin. Our average natural gas cost was $4.30 per MMBtu, 12 percent higher than 2006. Costs associated with production start-ups last year after completion of the debottlenecking projects in Trinidad and mechanical problems at our Lima facility raised costs for
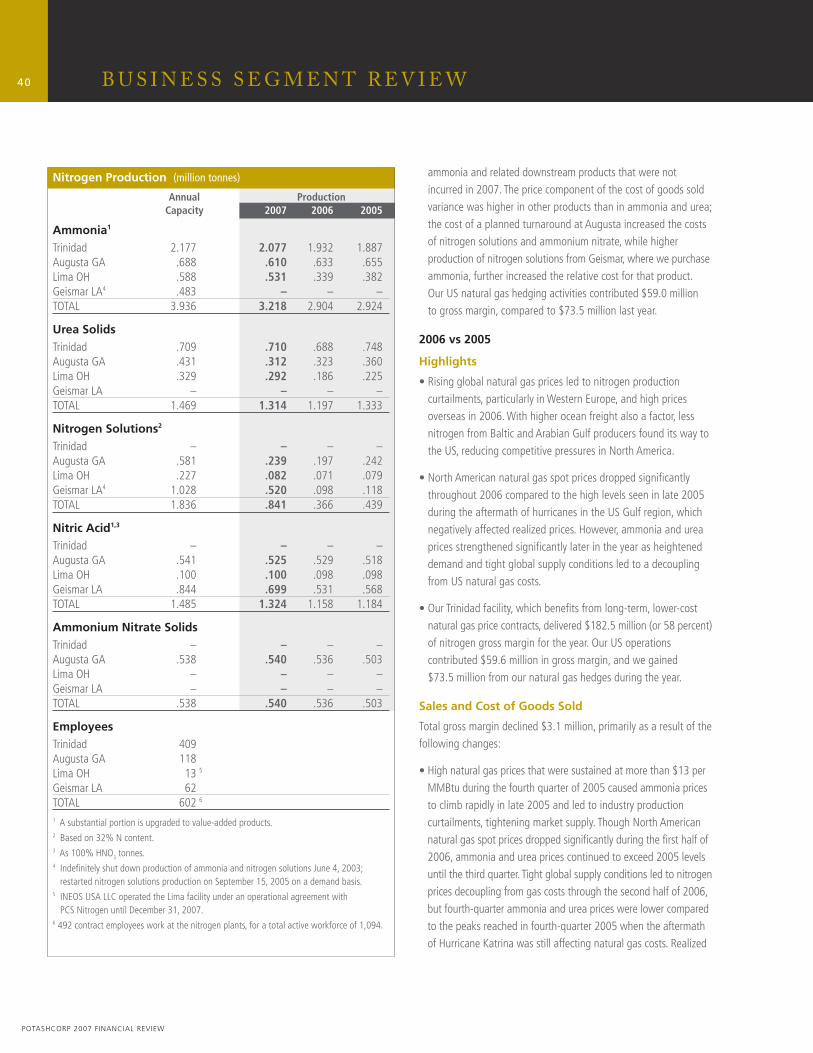
40
POTASHCORP 2007 FINANCIAL REVIEW
ammonia and related downstream products that were not incurred in 2007. The price component of the cost of goods sold variance was higher in other products than in ammonia and urea; the cost of a planned turnaround at Augusta increased the costs of nitrogen solutions and ammonium nitrate, while higher production of nitrogen solutions from Geismar, where we purchase ammonia, further increased the relative cost for that product. Our US natural gas hedging activities contributed $59.0 million to gross margin, compared to $73.5 million last year.
2006 vs 2005
Highlights
• Rising global natural gas prices led to nitrogen production curtailments, particularly in Western Europe, and high prices overseas in 2006. With higher ocean freight also a factor, less nitrogen from Baltic and Arabian Gulf producers found its way to the US, reducing competitive pressures in North America.
• North American natural gas spot prices dropped signifi cantly throughout 2006 compared to the high levels seen in late 2005 during the aftermath of hurricanes in the US Gulf region, which negatively affected realized prices. However, ammonia and urea prices strengthened signifi cantly later in the year as heightened demand and tight global supply conditions led to a decoupling from US natural gas costs.
• Our Trinidad facility, which benefi ts from long-term, lower-cost natural gas price contracts, delivered $182.5 million (or 58 percent) of nitrogen gross margin for the year. Our US operations contributed $59.6 million in gross margin, and we gained $73.5 million from our natural gas hedges during the year.
Sales and Cost of Goods Sold
Total gross margin declined $3.1 million, primarily as a result of the following changes:
• High natural gas prices that were sustained at more than $13 per MMBtu during the fourth quarter of 2005 caused ammonia prices to climb rapidly in late 2005 and led to industry production curtailments, tightening market supply. Though North American natural gas spot prices dropped signifi cantly during the fi rst half of 2006, ammonia and urea prices continued to exceed 2005 levels until the third quarter. Tight global supply conditions led to nitrogen prices decoupling from gas costs through the second half of 2006, but fourth-quarter ammonia and urea prices were lower compared to the peaks reached in fourth-quarter 2005 when the aftermath of Hurricane Katrina was still affecting natural gas costs. Realized
B U S I N E S S S E G M E N T R E V I E W
Nitrogen Production (million tonnes)
Annual Production Capacity 2007 2006 2005
Ammonia1
Trinidad 2.177 2.077 1.932 1.887Augusta GA .688 .610 .633 .655Lima OH .588 .531 .339 .382Geismar LA4 .483 – – –TOTAL 3.936 3.218 2.904 2.924
Urea SolidsTrinidad .709 .710 .688 .748Augusta GA .431 .312 .323 .360Lima OH .329 .292 .186 .225Geismar LA – – – –TOTAL 1.469 1.314 1.197 1.333
Nitrogen Solutions2
Trinidad – – – –Augusta GA .581 .239 .197 .242Lima OH .227 .082 .071 .079Geismar LA4 1.028 .520 .098 .118TOTAL 1.836 .841 .366 .439
Nitric Acid1,3 Trinidad – – – –Augusta GA .541 .525 .529 .518Lima OH .100 .100 .098 .098Geismar LA .844 .699 .531 .568TOTAL 1.485 1.324 1.158 1.184
Ammonium Nitrate SolidsTrinidad – – – –Augusta GA .538 .540 .536 .503Lima OH – – – –Geismar LA – – – –TOTAL .538 .540 .536 .503
EmployeesTrinidad 409 Augusta GA 118 Lima OH 13 5
Geismar LA 62 TOTAL 602 6
1 A substantial portion is upgraded to value-added products.2 Based on 32% N content.3 As 100% HNO3 tonnes.4 Indefi nitely shut down production of ammonia and nitrogen solutions June 4, 2003;
restarted nitrogen solutions production on September 15, 2005 on a demand basis.5 INEOS USA LLC operated the Lima facility under an operational agreement with
PCS Nitrogen until December 31, 2007.6 492 contract employees work at the nitrogen plants, for a total active workforce of 1,094.
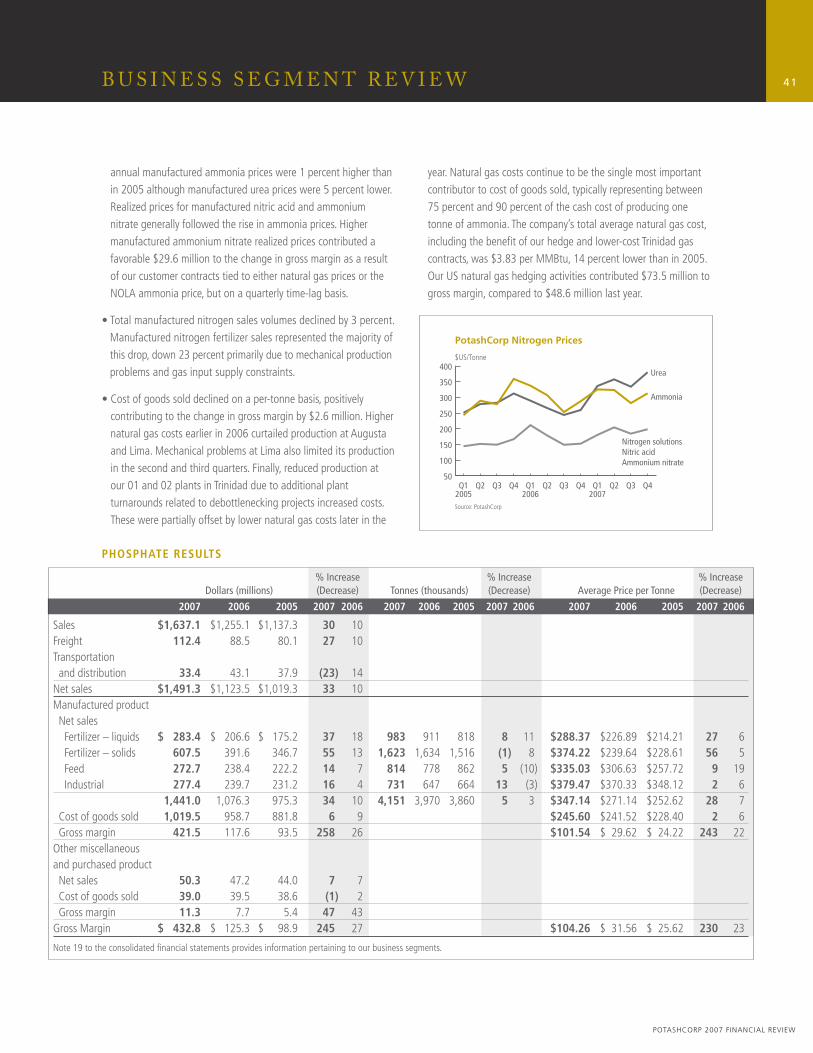
41
POTASHCORP 2007 FINANCIAL REVIEW
B U S I N E S S S E G M E N T R E V I E W
annual manufactured ammonia prices were 1 percent higher than in 2005 although manufactured urea prices were 5 percent lower. Realized prices for manufactured nitric acid and ammonium nitrate generally followed the rise in ammonia prices. Higher manufactured ammonium nitrate realized prices contributed a favorable $29.6 million to the change in gross margin as a result of our customer contracts tied to either natural gas prices or the NOLA ammonia price, but on a quarterly time-lag basis.
• Total manufactured nitrogen sales volumes declined by 3 percent. Manufactured nitrogen fertilizer sales represented the majority of this drop, down 23 percent primarily due to mechanical production problems and gas input supply constraints.
• Cost of goods sold declined on a per-tonne basis, positively contributing to the change in gross margin by $2.6 million. Higher natural gas costs earlier in 2006 curtailed production at Augusta and Lima. Mechanical problems at Lima also limited its production in the second and third quarters. Finally, reduced production at our 01 and 02 plants in Trinidad due to additional plant turnarounds related to debottlenecking projects increased costs. These were partially offset by lower natural gas costs later in the
year. Natural gas costs continue to be the single most important contributor to cost of goods sold, typically representing between 75 percent and 90 percent of the cash cost of producing one tonne of ammonia. The company’s total average natural gas cost, including the benefi t of our hedge and lower-cost Trinidad gas contracts, was $3.83 per MMBtu, 14 percent lower than in 2005. Our US natural gas hedging activities contributed $73.5 million to gross margin, compared to $48.6 million last year.
50
100
150
200
250
300
350
400
Q4Q3Q2Q12007
Q4Q3Q2Q12006
Q4Q3Q2Q12005
$US/Tonne
Source: PotashCorp
PotashCorp Nitrogen Prices
Ammonia
Urea
Nitrogen solutionsNitric acidAmmonium nitrate
PHOSPHATE RESULTS
% Increase % Increase % Increase Dollars (millions) (Decrease) Tonnes (thousands) (Decrease) Average Price per Tonne (Decrease)
2007 2006 2005 2007 2006 2007 2006 2005 2007 2006 2007 2006 2005 2007 2006
Sales $1,637.1 $1,255.1 $1,137.3 30 10Freight 112.4 88.5 80.1 27 10Transportation and distribution 33.4 43.1 37.9 (23) 14Net sales $1,491.3 $1,123.5 $1,019.3 33 10Manufactured product Net sales Fertilizer – liquids $ 283.4 $ 206.6 $ 175.2 37 18 983 911 818 8 11 $288.37 $226.89 $214.21 27 6 Fertilizer – solids 607.5 391.6 346.7 55 13 1,623 1,634 1,516 (1) 8 $374.22 $239.64 $228.61 56 5 Feed 272.7 238.4 222.2 14 7 814 778 862 5 (10) $335.03 $306.63 $257.72 9 19 Industrial 277.4 239.7 231.2 16 4 731 647 664 13 (3) $379.47 $370.33 $348.12 2 6 1,441.0 1,076.3 975.3 34 10 4,151 3,970 3,860 5 3 $347.14 $271.14 $252.62 28 7 Cost of goods sold 1,019.5 958.7 881.8 6 9 $245.60 $241.52 $228.40 2 6 Gross margin 421.5 117.6 93.5 258 26 $101.54 $ 29.62 $ 24.22 243 22Other miscellaneousand purchased product Net sales 50.3 47.2 44.0 7 7 Cost of goods sold 39.0 39.5 38.6 (1) 2 Gross margin 11.3 7.7 5.4 47 43 Gross Margin $ 432.8 $ 125.3 $ 98.9 245 27 $104.26 $ 31.56 $ 25.62 230 23
Note 19 to the consolidated fi nancial statements provides information pertaining to our business segments.
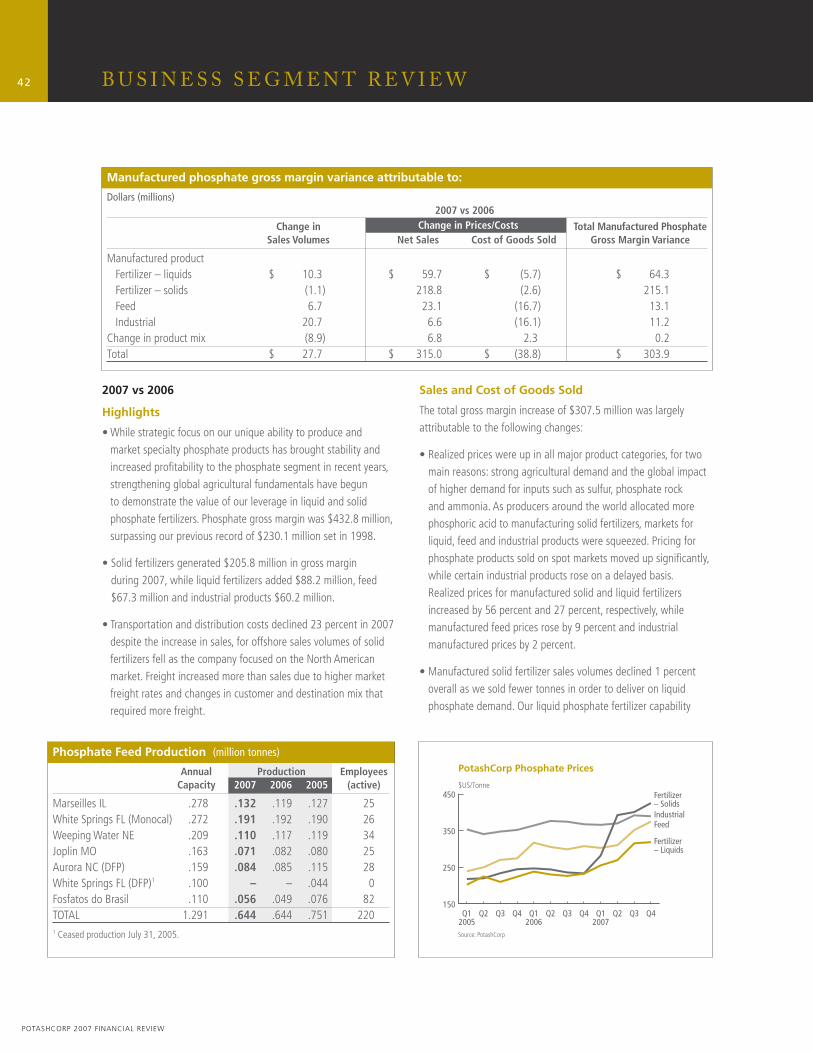
42
POTASHCORP 2007 FINANCIAL REVIEW
2007 vs 2006
Highlights
• While strategic focus on our unique ability to produce and market specialty phosphate products has brought stability and increased profi tability to the phosphate segment in recent years, strengthening global agricultural fundamentals have begun to demonstrate the value of our leverage in liquid and solid phosphate fertilizers. Phosphate gross margin was $432.8 million, surpassing our previous record of $230.1 million set in 1998.
• Solid fertilizers generated $205.8 million in gross margin during 2007, while liquid fertilizers added $88.2 million, feed $67.3 million and industrial products $60.2 million.
• Transportation and distribution costs declined 23 percent in 2007 despite the increase in sales, for offshore sales volumes of solid fertilizers fell as the company focused on the North American market. Freight increased more than sales due to higher market freight rates and changes in customer and destination mix that required more freight.
Sales and Cost of Goods Sold
The total gross margin increase of $307.5 million was largely attributable to the following changes:
• Realized prices were up in all major product categories, for two main reasons: strong agricultural demand and the global impact of higher demand for inputs such as sulfur, phosphate rock and ammonia. As producers around the world allocated more phosphoric acid to manufacturing solid fertilizers, markets for liquid, feed and industrial products were squeezed. Pricing for phosphate products sold on spot markets moved up signifi cantly, while certain industrial products rose on a delayed basis. Realized prices for manufactured solid and liquid fertilizers increased by 56 percent and 27 percent, respectively, while manufactured feed prices rose by 9 percent and industrial manufactured prices by 2 percent.
• Manufactured solid fertilizer sales volumes declined 1 percent overall as we sold fewer tonnes in order to deliver on liquid phosphate demand. Our liquid phosphate fertilizer capability
B U S I N E S S S E G M E N T R E V I E W
Manufactured phosphate gross margin variance attributable to:
Dollars (millions) 2007 vs 2006
Change in Change in Prices/Costs Total Manufactured Phosphate Sales Volumes Net Sales Cost of Goods Sold Gross Margin Variance
Manufactured product Fertilizer – liquids $ 10.3 $ 59.7 $ (5.7) $ 64.3 Fertilizer – solids (1.1) 218.8 (2.6) 215.1 Feed 6.7 23.1 (16.7) 13.1 Industrial 20.7 6.6 (16.1) 11.2Change in product mix (8.9) 6.8 2.3 0.2Total $ 27.7 $ 315.0 $ (38.8) $ 303.9
150
250
350
450
Q4Q3Q2Q12007
Q4Q3Q2Q12006
Q4Q3Q2Q12005
$US/Tonne
Source: PotashCorp
PotashCorp Phosphate Prices
IndustrialFeed
Fertilizer– Solids
Fertilizer– Liquids
Phosphate Feed Production (million tonnes)
Annual Production Employees Capacity 2007 2006 2005 (active)
Marseilles IL .278 .132 .119 .127 25White Springs FL (Monocal) .272 .191 .192 .190 26Weeping Water NE .209 .110 .117 .119 34Joplin MO .163 .071 .082 .080 25Aurora NC (DFP) .159 .084 .085 .115 28White Springs FL (DFP)1 .100 – – .044 0Fosfatos do Brasil .110 .056 .049 .076 82TOTAL 1.291 .644 .644 .751 2201 Ceased production July 31, 2005.
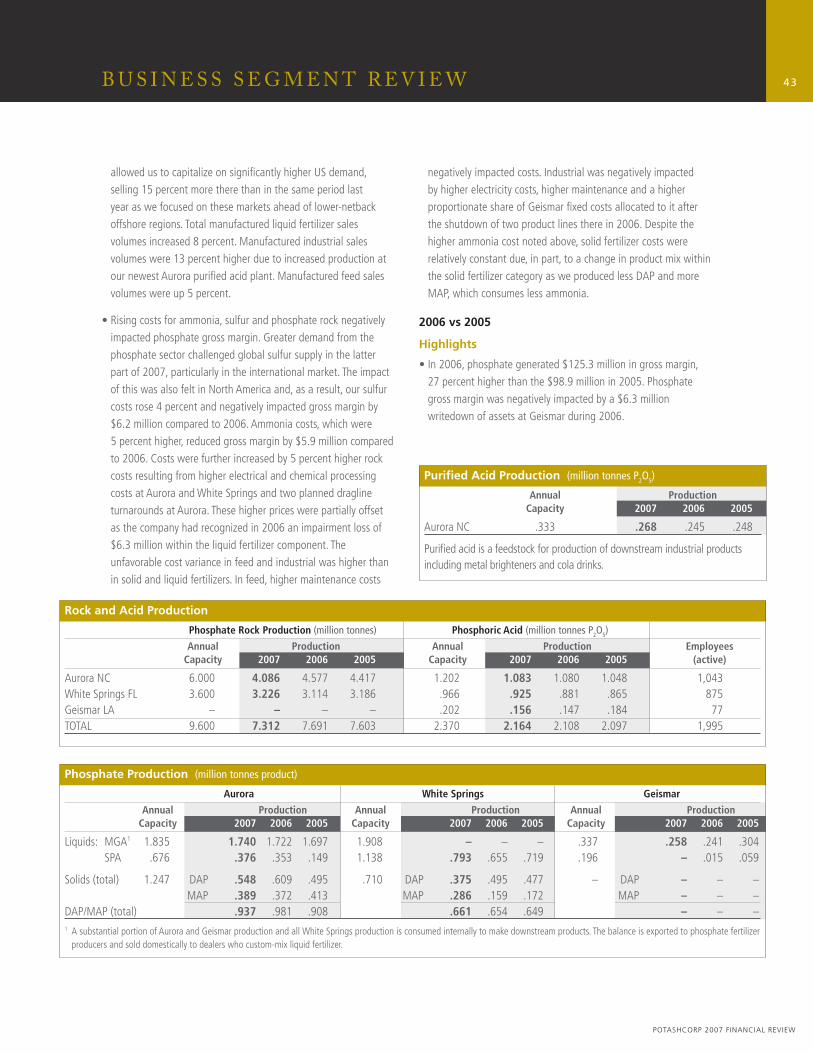
43
POTASHCORP 2007 FINANCIAL REVIEW
B U S I N E S S S E G M E N T R E V I E W
allowed us to capitalize on signifi cantly higher US demand, selling 15 percent more there than in the same period last year as we focused on these markets ahead of lower-netback offshore regions. Total manufactured liquid fertilizer sales volumes increased 8 percent. Manufactured industrial sales volumes were 13 percent higher due to increased production at our newest Aurora purifi ed acid plant. Manufactured feed sales volumes were up 5 percent.
• Rising costs for ammonia, sulfur and phosphate rock negatively impacted phosphate gross margin. Greater demand from the phosphate sector challenged global sulfur supply in the latter part of 2007, particularly in the international market. The impact of this was also felt in North America and, as a result, our sulfur costs rose 4 percent and negatively impacted gross margin by $6.2 million compared to 2006. Ammonia costs, which were 5 percent higher, reduced gross margin by $5.9 million compared to 2006. Costs were further increased by 5 percent higher rock costs resulting from higher electrical and chemical processing costs at Aurora and White Springs and two planned dragline turnarounds at Aurora. These higher prices were partially offset as the company had recognized in 2006 an impairment loss of $6.3 million within the liquid fertilizer component. The unfavorable cost variance in feed and industrial was higher than in solid and liquid fertilizers. In feed, higher maintenance costs
negatively impacted costs. Industrial was negatively impacted by higher electricity costs, higher maintenance and a higher proportionate share of Geismar fi xed costs allocated to it after the shutdown of two product lines there in 2006. Despite the higher ammonia cost noted above, solid fertilizer costs were relatively constant due, in part, to a change in product mix within the solid fertilizer category as we produced less DAP and more MAP, which consumes less ammonia.
2006 vs 2005
Highlights
• In 2006, phosphate generated $125.3 million in gross margin, 27 percent higher than the $98.9 million in 2005. Phosphate gross margin was negatively impacted by a $6.3 million writedown of assets at Geismar during 2006.
Rock and Acid Production
Phosphate Rock Production (million tonnes) Phosphoric Acid (million tonnes P2O5)
Annual Production Annual Production Employees Capacity 2007 2006 2005 Capacity 2007 2006 2005 (active)
Aurora NC 6.000 4.086 4.577 4.417 1.202 1.083 1.080 1.048 1,043White Springs FL 3.600 3.226 3.114 3.186 .966 .925 .881 .865 875Geismar LA – – – – .202 .156 .147 .184 77TOTAL 9.600 7.312 7.691 7.603 2.370 2.164 2.108 2.097 1,995
Phosphate Production (million tonnes product)
Aurora White Springs Geismar
Annual Production Annual Production Annual Production Capacity 2007 2006 2005 Capacity 2007 2006 2005 Capacity 2007 2006 2005
Liquids: MGA1 1.835 1.740 1.722 1.697 1.908 – – – .337 .258 .241 .304 SPA .676 .376 .353 .149 1.138 .793 .655 .719 .196 – .015 .059
Solids (total) 1.247 DAP .548 .609 .495 .710 DAP .375 .495 .477 – DAP – – – MAP .389 .372 .413 MAP .286 .159 .172 MAP – – –DAP/MAP (total) .937 .981 .908 .661 .654 .649 – – –1 A substantial portion of Aurora and Geismar production and all White Springs production is consumed internally to make downstream products. The balance is exported to phosphate fertilizer
producers and sold domestically to dealers who custom-mix liquid fertilizer.
Purifi ed Acid Production (million tonnes P2O5)
Annual Production Capacity 2007 2006 2005
Aurora NC .333 .268 .245 .248
Purifi ed acid is a feedstock for production of downstream industrial products including metal brighteners and cola drinks.
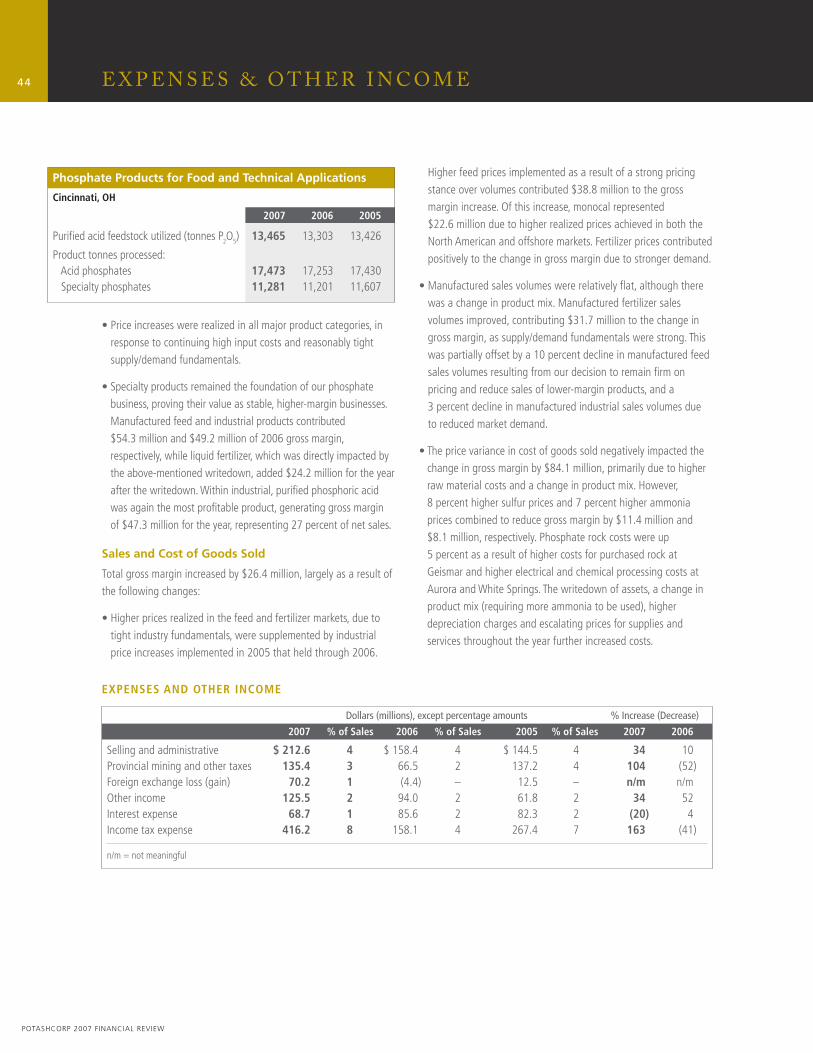
44
POTASHCORP 2007 FINANCIAL REVIEW
• Price increases were realized in all major product categories, in response to continuing high input costs and reasonably tight supply/demand fundamentals.
• Specialty products remained the foundation of our phosphate business, proving their value as stable, higher-margin businesses. Manufactured feed and industrial products contributed $54.3 million and $49.2 million of 2006 gross margin, respectively, while liquid fertilizer, which was directly impacted by the above-mentioned writedown, added $24.2 million for the year after the writedown. Within industrial, purifi ed phosphoric acid was again the most profi table product, generating gross margin of $47.3 million for the year, representing 27 percent of net sales.
Sales and Cost of Goods Sold
Total gross margin increased by $26.4 million, largely as a result of the following changes:
• Higher prices realized in the feed and fertilizer markets, due to tight industry fundamentals, were supplemented by industrial price increases implemented in 2005 that held through 2006.
Higher feed prices implemented as a result of a strong pricing stance over volumes contributed $38.8 million to the gross margin increase. Of this increase, monocal represented $22.6 million due to higher realized prices achieved in both the North American and offshore markets. Fertilizer prices contributed positively to the change in gross margin due to stronger demand.
• Manufactured sales volumes were relatively fl at, although there was a change in product mix. Manufactured fertilizer sales volumes improved, contributing $31.7 million to the change in gross margin, as supply/demand fundamentals were strong. This was partially offset by a 10 percent decline in manufactured feed sales volumes resulting from our decision to remain fi rm on pricing and reduce sales of lower-margin products, and a 3 percent decline in manufactured industrial sales volumes due to reduced market demand.
• The price variance in cost of goods sold negatively impacted the change in gross margin by $84.1 million, primarily due to higher raw material costs and a change in product mix. However, 8 percent higher sulfur prices and 7 percent higher ammonia prices combined to reduce gross margin by $11.4 million and $8.1 million, respectively. Phosphate rock costs were up 5 percent as a result of higher costs for purchased rock at Geismar and higher electrical and chemical processing costs at Aurora and White Springs. The writedown of assets, a change in product mix (requiring more ammonia to be used), higher depreciation charges and escalating prices for supplies and services throughout the year further increased costs.
E X P E N S E S & O T H E R I N C O M E
EXPENSES AND OTHER INCOME
Dollars (millions), except percentage amounts % Increase (Decrease)
2007 % of Sales 2006 % of Sales 2005 % of Sales 2007 2006
Selling and administrative $ 212.6 4 $ 158.4 4 $ 144.5 4 34 10Provincial mining and other taxes 135.4 3 66.5 2 137.2 4 104 (52)Foreign exchange loss (gain) 70.2 1 (4.4) – 12.5 – n/m n/mOther income 125.5 2 94.0 2 61.8 2 34 52Interest expense 68.7 1 85.6 2 82.3 2 (20) 4Income tax expense 416.2 8 158.1 4 267.4 7 163 (41)
n/m = not meaningful
Phosphate Products for Food and Technical Applications
Cincinnati, OH
2007 2006 2005
Purifi ed acid feedstock utilized (tonnes P2O5) 13,465 13,303 13,426
Product tonnes processed: Acid phosphates 17,473 17,253 17,430 Specialty phosphates 11,281 11,201 11,607
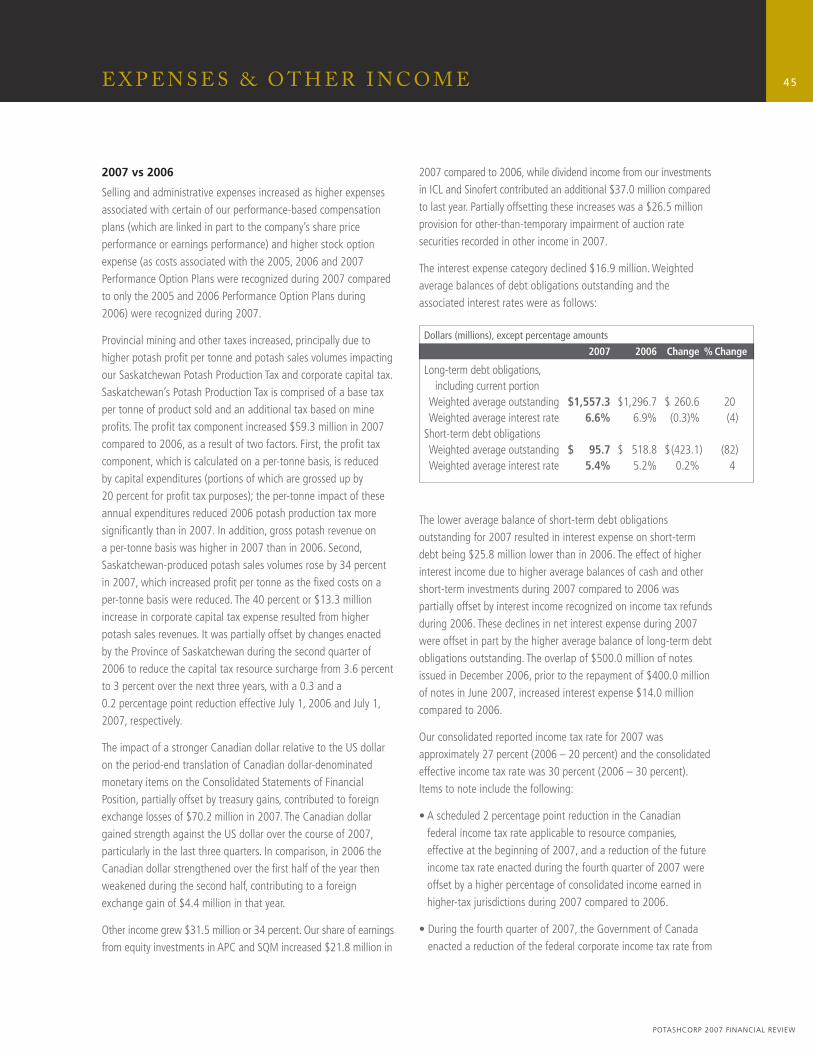
45
POTASHCORP 2007 FINANCIAL REVIEW
E X P E N S E S & O T H E R I N C O M E
2007 vs 2006
Selling and administrative expenses increased as higher expenses associated with certain of our performance-based compensation plans (which are linked in part to the company’s share price performance or earnings performance) and higher stock option expense (as costs associated with the 2005, 2006 and 2007 Performance Option Plans were recognized during 2007 compared to only the 2005 and 2006 Performance Option Plans during 2006) were recognized during 2007.
Provincial mining and other taxes increased, principally due to higher potash profi t per tonne and potash sales volumes impacting our Saskatchewan Potash Production Tax and corporate capital tax. Saskatchewan’s Potash Production Tax is comprised of a base tax per tonne of product sold and an additional tax based on mine profi ts. The profi t tax component increased $59.3 million in 2007 compared to 2006, as a result of two factors. First, the profi t tax component, which is calculated on a per-tonne basis, is reduced by capital expenditures (portions of which are grossed up by 20 percent for profi t tax purposes); the per-tonne impact of these annual expenditures reduced 2006 potash production tax more signifi cantly than in 2007. In addition, gross potash revenue on a per-tonne basis was higher in 2007 than in 2006. Second, Saskatchewan-produced potash sales volumes rose by 34 percent in 2007, which increased profi t per tonne as the fi xed costs on a per-tonne basis were reduced. The 40 percent or $13.3 million increase in corporate capital tax expense resulted from higher potash sales revenues. It was partially offset by changes enacted by the Province of Saskatchewan during the second quarter of 2006 to reduce the capital tax resource surcharge from 3.6 percent to 3 percent over the next three years, with a 0.3 and a 0.2 percentage point reduction effective July 1, 2006 and July 1, 2007, respectively.
The impact of a stronger Canadian dollar relative to the US dollar on the period-end translation of Canadian dollar-denominated monetary items on the Consolidated Statements of Financial Position, partially offset by treasury gains, contributed to foreign exchange losses of $70.2 million in 2007. The Canadian dollar gained strength against the US dollar over the course of 2007, particularly in the last three quarters. In comparison, in 2006 the Canadian dollar strengthened over the fi rst half of the year then weakened during the second half, contributing to a foreign exchange gain of $4.4 million in that year.
Other income grew $31.5 million or 34 percent. Our share of earnings from equity investments in APC and SQM increased $21.8 million in
2007 compared to 2006, while dividend income from our investments in ICL and Sinofert contributed an additional $37.0 million compared to last year. Partially offsetting these increases was a $26.5 million provision for other-than-temporary impairment of auction rate securities recorded in other income in 2007.
The interest expense category declined $16.9 million. Weighted average balances of debt obligations outstanding and the associated interest rates were as follows:
The lower average balance of short-term debt obligations outstanding for 2007 resulted in interest expense on short-term debt being $25.8 million lower than in 2006. The effect of higher interest income due to higher average balances of cash and other short-term investments during 2007 compared to 2006 was partially offset by interest income recognized on income tax refunds during 2006. These declines in net interest expense during 2007 were offset in part by the higher average balance of long-term debt obligations outstanding. The overlap of $500.0 million of notes issued in December 2006, prior to the repayment of $400.0 million of notes in June 2007, increased interest expense $14.0 million compared to 2006.
Our consolidated reported income tax rate for 2007 was approximately 27 percent (2006 – 20 percent) and the consolidated effective income tax rate was 30 percent (2006 – 30 percent). Items to note include the following:
• A scheduled 2 percentage point reduction in the Canadian federal income tax rate applicable to resource companies, effective at the beginning of 2007, and a reduction of the future income tax rate enacted during the fourth quarter of 2007 were offset by a higher percentage of consolidated income earned in higher-tax jurisdictions during 2007 compared to 2006.
• During the fourth quarter of 2007, the Government of Canada enacted a reduction of the federal corporate income tax rate from
Dollars (millions), except percentage amounts
2007 2006 Change % Change
Long-term debt obligations, including current portion Weighted average outstanding $1,557.3 $1,296.7 $ 260.6 20 Weighted average interest rate 6.6% 6.9% (0.3)% (4)Short-term debt obligations Weighted average outstanding $ 95.7 $ 518.8 $ (423.1) (82) Weighted average interest rate 5.4% 5.2% 0.2% 4
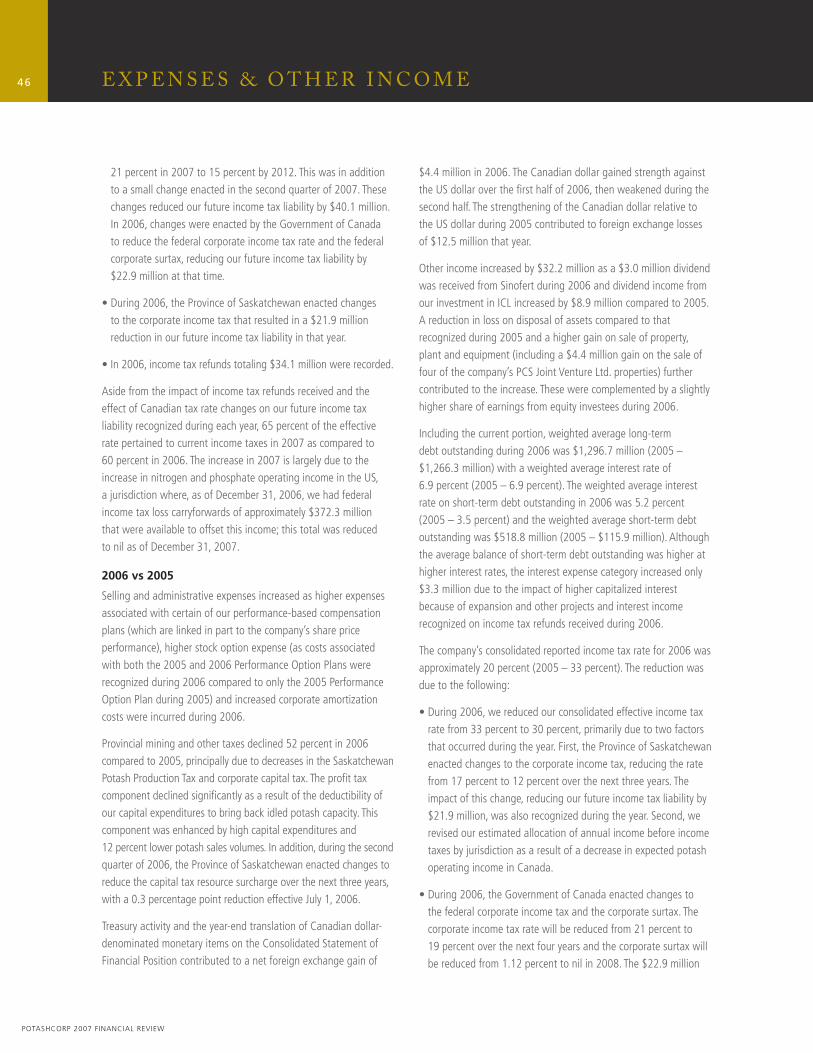
46
POTASHCORP 2007 FINANCIAL REVIEW
E X P E N S E S & O T H E R I N C O M E
21 percent in 2007 to 15 percent by 2012. This was in addition to a small change enacted in the second quarter of 2007. These changes reduced our future income tax liability by $40.1 million. In 2006, changes were enacted by the Government of Canada to reduce the federal corporate income tax rate and the federal corporate surtax, reducing our future income tax liability by $22.9 million at that time.
• During 2006, the Province of Saskatchewan enacted changes to the corporate income tax that resulted in a $21.9 million reduction in our future income tax liability in that year.
• In 2006, income tax refunds totaling $34.1 million were recorded.
Aside from the impact of income tax refunds received and the effect of Canadian tax rate changes on our future income tax liability recognized during each year, 65 percent of the effective rate pertained to current income taxes in 2007 as compared to 60 percent in 2006. The increase in 2007 is largely due to the increase in nitrogen and phosphate operating income in the US, a jurisdiction where, as of December 31, 2006, we had federal income tax loss carryforwards of approximately $372.3 million that were available to offset this income; this total was reduced to nil as of December 31, 2007.
2006 vs 2005
Selling and administrative expenses increased as higher expenses associated with certain of our performance-based compensation plans (which are linked in part to the company’s share price performance), higher stock option expense (as costs associated with both the 2005 and 2006 Performance Option Plans were recognized during 2006 compared to only the 2005 Performance Option Plan during 2005) and increased corporate amortization costs were incurred during 2006.
Provincial mining and other taxes declined 52 percent in 2006 compared to 2005, principally due to decreases in the Saskatchewan Potash Production Tax and corporate capital tax. The profi t tax component declined signifi cantly as a result of the deductibility of our capital expenditures to bring back idled potash capacity. This component was enhanced by high capital expenditures and 12 percent lower potash sales volumes. In addition, during the second quarter of 2006, the Province of Saskatchewan enacted changes to reduce the capital tax resource surcharge over the next three years, with a 0.3 percentage point reduction effective July 1, 2006.
Treasury activity and the year-end translation of Canadian dollar-denominated monetary items on the Consolidated Statement of Financial Position contributed to a net foreign exchange gain of
$4.4 million in 2006. The Canadian dollar gained strength against the US dollar over the fi rst half of 2006, then weakened during the second half. The strengthening of the Canadian dollar relative to the US dollar during 2005 contributed to foreign exchange losses of $12.5 million that year.
Other income increased by $32.2 million as a $3.0 million dividend was received from Sinofert during 2006 and dividend income from our investment in ICL increased by $8.9 million compared to 2005. A reduction in loss on disposal of assets compared to that recognized during 2005 and a higher gain on sale of property, plant and equipment (including a $4.4 million gain on the sale of four of the company’s PCS Joint Venture Ltd. properties) further contributed to the increase. These were complemented by a slightly higher share of earnings from equity investees during 2006.
Including the current portion, weighted average long-term debt outstanding during 2006 was $1,296.7 million (2005 – $1,266.3 million) with a weighted average interest rate of 6.9 percent (2005 – 6.9 percent). The weighted average interest rate on short-term debt outstanding in 2006 was 5.2 percent (2005 – 3.5 percent) and the weighted average short-term debt outstanding was $518.8 million (2005 – $115.9 million). Although the average balance of short-term debt outstanding was higher at higher interest rates, the interest expense category increased only $3.3 million due to the impact of higher capitalized interest because of expansion and other projects and interest income recognized on income tax refunds received during 2006.
The company’s consolidated reported income tax rate for 2006 was approximately 20 percent (2005 – 33 percent). The reduction was due to the following:
• During 2006, we reduced our consolidated effective income tax rate from 33 percent to 30 percent, primarily due to two factors that occurred during the year. First, the Province of Saskatchewan enacted changes to the corporate income tax, reducing the rate from 17 percent to 12 percent over the next three years. The impact of this change, reducing our future income tax liability by $21.9 million, was also recognized during the year. Second, we revised our estimated allocation of annual income before income taxes by jurisdiction as a result of a decrease in expected potash operating income in Canada.
• During 2006, the Government of Canada enacted changes to the federal corporate income tax and the corporate surtax. The corporate income tax rate will be reduced from 21 percent to 19 percent over the next four years and the corporate surtax will be reduced from 1.12 percent to nil in 2008. The $22.9 million
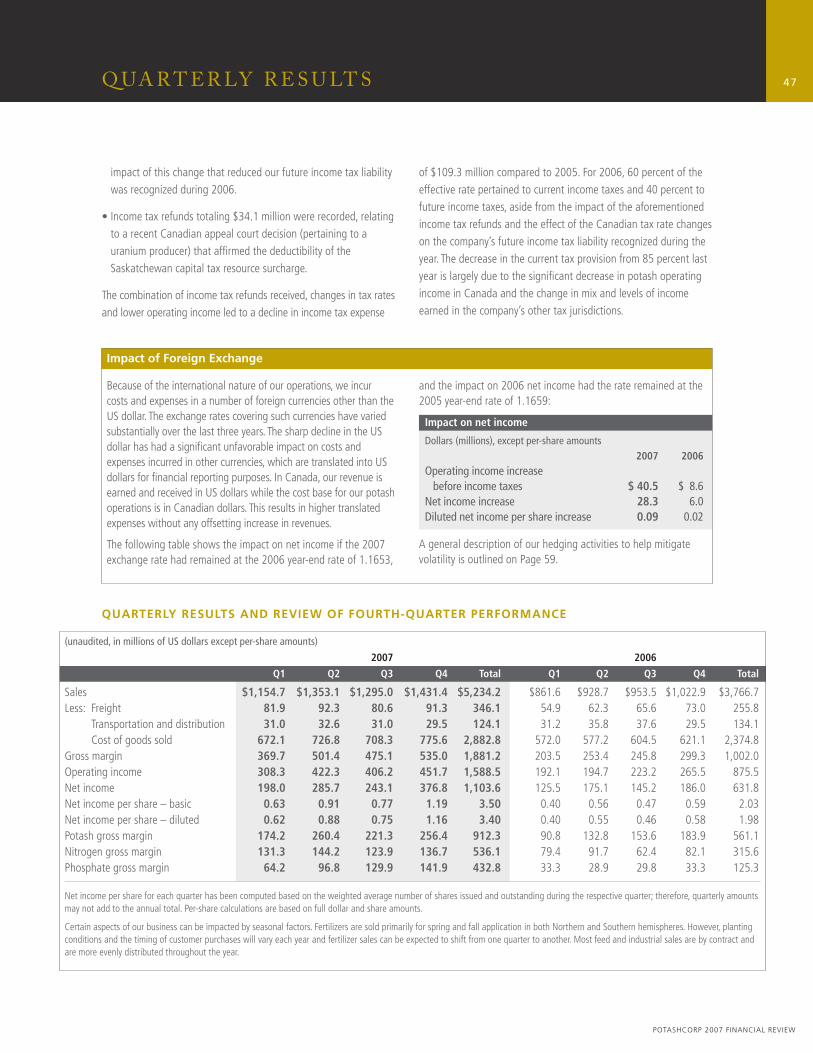
47
POTASHCORP 2007 FINANCIAL REVIEW
Q UA R T E R LY R E S U LT S
Impact of Foreign Exchange
Because of the international nature of our operations, we incur costs and expenses in a number of foreign currencies other than the US dollar. The exchange rates covering such currencies have varied substantially over the last three years. The sharp decline in the US dollar has had a signifi cant unfavorable impact on costs and expenses incurred in other currencies, which are translated into US dollars for fi nancial reporting purposes. In Canada, our revenue is earned and received in US dollars while the cost base for our potash operations is in Canadian dollars. This results in higher translated expenses without any offsetting increase in revenues.
The following table shows the impact on net income if the 2007 exchange rate had remained at the 2006 year-end rate of 1.1653,
and the impact on 2006 net income had the rate remained at the 2005 year-end rate of 1.1659:
Impact on net income
Dollars (millions), except per-share amounts 2007 2006Operating income increase before income taxes $ 40.5 $ 8.6Net income increase 28.3 6.0Diluted net income per share increase 0.09 0.02
A general description of our hedging activities to help mitigate volatility is outlined on Page 59.
(unaudited, in millions of US dollars except per-share amounts)
2007 2006
Q1 Q2 Q3 Q4 Total Q1 Q2 Q3 Q4 Total
Sales $1,154.7 $1,353.1 $1,295.0 $1,431.4 $5,234.2 $861.6 $928.7 $953.5 $1,022.9 $3,766.7Less: Freight 81.9 92.3 80.6 91.3 346.1 54.9 62.3 65.6 73.0 255.8 Transportation and distribution 31.0 32.6 31.0 29.5 124.1 31.2 35.8 37.6 29.5 134.1 Cost of goods sold 672.1 726.8 708.3 775.6 2,882.8 572.0 577.2 604.5 621.1 2,374.8Gross margin 369.7 501.4 475.1 535.0 1,881.2 203.5 253.4 245.8 299.3 1,002.0Operating income 308.3 422.3 406.2 451.7 1,588.5 192.1 194.7 223.2 265.5 875.5Net income 198.0 285.7 243.1 376.8 1,103.6 125.5 175.1 145.2 186.0 631.8Net income per share – basic 0.63 0.91 0.77 1.19 3.50 0.40 0.56 0.47 0.59 2.03Net income per share – diluted 0.62 0.88 0.75 1.16 3.40 0.40 0.55 0.46 0.58 1.98Potash gross margin 174.2 260.4 221.3 256.4 912.3 90.8 132.8 153.6 183.9 561.1Nitrogen gross margin 131.3 144.2 123.9 136.7 536.1 79.4 91.7 62.4 82.1 315.6Phosphate gross margin 64.2 96.8 129.9 141.9 432.8 33.3 28.9 29.8 33.3 125.3
Net income per share for each quarter has been computed based on the weighted average number of shares issued and outstanding during the respective quarter; therefore, quarterly amounts may not add to the annual total. Per-share calculations are based on full dollar and share amounts.
Certain aspects of our business can be impacted by seasonal factors. Fertilizers are sold primarily for spring and fall application in both Northern and Southern hemispheres. However, planting conditions and the timing of customer purchases will vary each year and fertilizer sales can be expected to shift from one quarter to another. Most feed and industrial sales are by contract and are more evenly distributed throughout the year.
QUARTERLY RESULTS AND REVIEW OF FOURTH-QUARTER PERFORMANCE
impact of this change that reduced our future income tax liability was recognized during 2006.
• Income tax refunds totaling $34.1 million were recorded, relating to a recent Canadian appeal court decision (pertaining to a uranium producer) that affi rmed the deductibility of the Saskatchewan capital tax resource surcharge.
The combination of income tax refunds received, changes in tax rates and lower operating income led to a decline in income tax expense
of $109.3 million compared to 2005. For 2006, 60 percent of the effective rate pertained to current income taxes and 40 percent to future income taxes, aside from the impact of the aforementioned income tax refunds and the effect of the Canadian tax rate changes on the company’s future income tax liability recognized during the year. The decrease in the current tax provision from 85 percent last year is largely due to the signifi cant decrease in potash operating income in Canada and the change in mix and levels of income earned in the company’s other tax jurisdictions.
48
POTASHCORP 2007 FINANCIAL REVIEW
Q UA R T E R LY R E S U LT S
With strong market conditions and rising prices for all three nutrients, gross margin for the quarter climbed to a record $535.0 million, up $235.7 million from last year’s fourth quarter. Cash fl ow from operations of $531.6 million was the second highest quarterly total in our history, while the $1,688.9 million achieved for the year exceeded the 2005 record by 95 percent.
Highlights of our 2007 fourth quarter include:
• Potash gross margin of $256.4 million approached the record $260.4 million of this year’s second quarter and was 39 percent higher than the $183.9 million of last year’s fourth quarter. As a percentage of net sales, potash gross margin increased to 60 percent from 57 percent in last year’s fourth quarter, and from 58 percent in the third quarter of 2007. Realized prices to offshore markets were up $36 per tonne over 2006, but the full benefi t of announced offshore price increases was not captured because of higher ocean freight rates and locked-in contract pricing to China and India. In the North American spot market, our realized prices were $48 per tonne higher than in 2006 and $19 per tonne above last quarter. Total potash sales volumes of 2.3 million tonnes were 5 percent above last year, when offshore markets were actively restocking after purchasing delays earlier in 2006. Offshore, sales volumes of 1.5 million tonnes were 10 percent higher than in the previous year. Our North American sales volumes were just slightly lower than the previous year’s very strong fourth-quarter sales. Our potash production reached a quarterly record of 2.5 million tonnes, 6 percent higher than in 2006 as we saw the benefi t of additional tonnes after the completion of our Allan project in 2007. The stronger Canadian dollar raised potash cost of goods sold by about $8 per tonne compared to last year, while continuing higher brine infl ow costs at New Brunswick and Esterhazy had a further negative impact of $6 per tonne.
• On the foundation of continuing strong agricultural demand and higher natural gas prices, nitrogen gross margin of $136.7 million was the second highest quarterly total in company history, 67 percent above the same quarter in 2006 and trailing only the second quarter of 2007. Our Trinidad operation generated $73.9 million in gross margin, while our US operations added $45.1 million and natural gas hedging gains contributed $17.7 million. With the continuation of tight supply/demand fundamentals, realized prices for manufactured ammonia and urea were up 9 percent (+$25 per tonne) and 46 percent (+$120 per tonne), respectively, from 2006. The signifi cant price improvements for these products were achieved since the third quarter of 2007, with ammonia 11 percent higher (+$31 per
tonne) and urea up 14 percent (+$46 per tonne). Prices for nitrogen solutions were up 52 percent quarter over quarter. Total manufactured nitrogen sales volumes of 1.4 million tonnes were up 19 percent from 2006 levels, built on strong US agricultural demand. This was achieved even though production was fl at, as our Augusta facility took a planned 35-day turnaround during the quarter. We again opportunistically produced nitrogen solutions at our Geismar facility from imported ammonia and purchased carbon dioxide, enabling us to increase total manufactured sales volumes for this product by 160 percent quarter over quarter and add an extra $13.6 million to the gross margin increase.
• Driven by continued strong sales volumes and higher pricing in all major product categories, phosphate generated record quarterly gross margin of $141.9 million in the fourth quarter of 2007, exceeding the total in the same quarter of 2006 by $108.6 million. Solid phosphate fertilizers continued their strong turnaround, generating $70.3 million in gross margin, while liquid fertilizer at $31.5 million, feed at $22.3 million and industrial products at $14.9 million were consistent contributors. Our realized prices were up from a year earlier in all major product categories, in part because of strong agricultural demand and in part due to the global impact of higher costs for inputs such as sulfur, phosphate rock and ammonia. Pricing for phosphate products sold on spot markets moved dramatically upward, while certain industrial products rose on a delayed basis. Our manufactured solid fertilizer realized prices were up 82 percent (+$192 per tonne) compared to the same quarter in 2006, while liquid fertilizer rose 37 percent (+$86 per tonne), feed 22 percent (+$67 per tonne) and industrial products 6 percent (+$22 per tonne). North American manufactured sales volumes for liquid fertilizer were up 9 percent and solid fertilizers were 22 percent higher than the previous year’s fourth quarter, as we focused on these markets ahead of lower-netback offshore regions. Total liquid and solid fertilizer manufactured sales volumes were 2 percent higher and 3 percent lower than in 2006, respectively. Manufactured feed sales volumes rose 12 percent quarter over quarter, driven by a 32 percent increase in sales to offshore markets, primarily in Latin America. Manufactured industrial sales volumes were 17 percent higher than the fourth quarter of 2006 as a result of stronger demand for phosphoric acid and retail technical grade purifi ed acid. Our sulfur costs rose 49 percent from the fourth quarter of 2006 and 30 percent from the trailing quarter.
• Selling and administrative expenses were substantially higher in 2007, due largely to valuation of deferred share units that were directly impacted by the signifi cant upward movement in our share price.
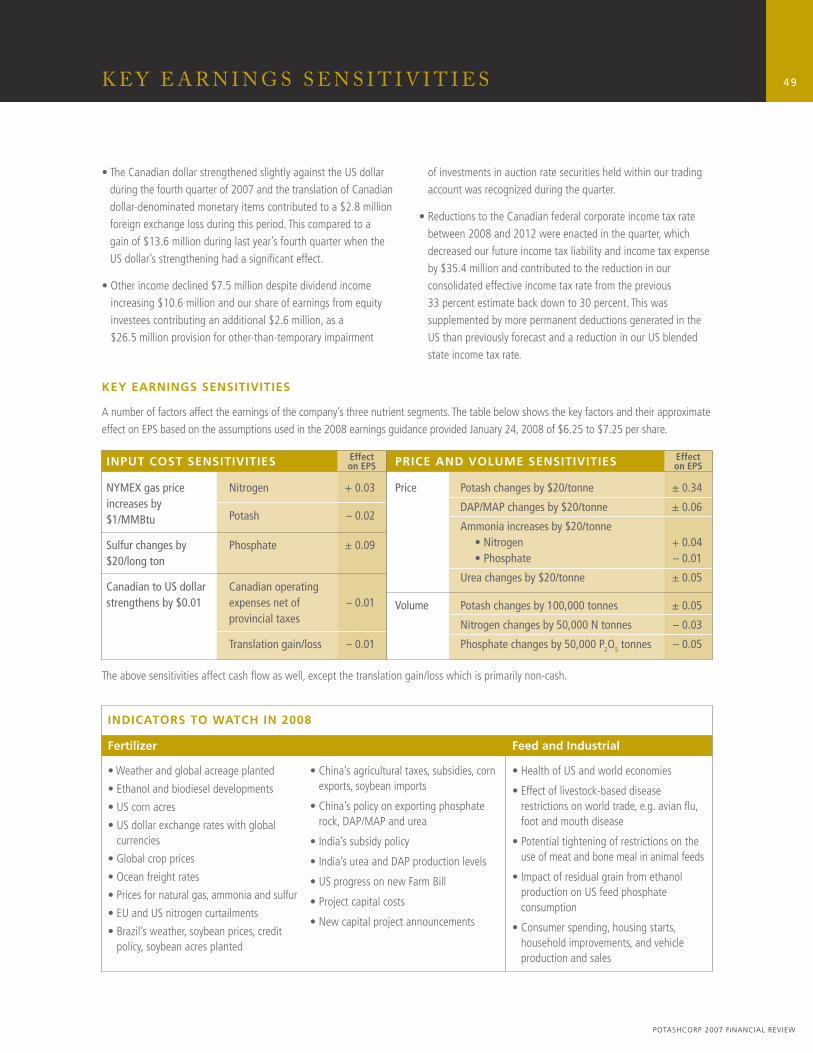
49
POTASHCORP 2007 FINANCIAL REVIEW
K E Y E A R N I N G S S E N S I T I V I T I E S
• The Canadian dollar strengthened slightly against the US dollar during the fourth quarter of 2007 and the translation of Canadian dollar-denominated monetary items contributed to a $2.8 million foreign exchange loss during this period. This compared to a gain of $13.6 million during last year’s fourth quarter when the US dollar’s strengthening had a signifi cant effect.
• Other income declined $7.5 million despite dividend income increasing $10.6 million and our share of earnings from equity investees contributing an additional $2.6 million, as a $26.5 million provision for other-than-temporary impairment
of investments in auction rate securities held within our trading account was recognized during the quarter.
• Reductions to the Canadian federal corporate income tax rate between 2008 and 2012 were enacted in the quarter, which decreased our future income tax liability and income tax expense by $35.4 million and contributed to the reduction in our consolidated effective income tax rate from the previous 33 percent estimate back down to 30 percent. This was supplemented by more permanent deductions generated in the US than previously forecast and a reduction in our US blended state income tax rate.
KEY EARNINGS SENSITIVITIES
A number of factors affect the earnings of the company’s three nutrient segments. The table below shows the key factors and their approximate effect on EPS based on the assumptions used in the 2008 earnings guidance provided January 24, 2008 of $6.25 to $7.25 per share.
The above sensitivities affect cash fl ow as well, except the translation gain/loss which is primarily non-cash.
INPUT COST SENSITIVITIES PRICE AND VOLUME SENSITIVITIES
NYMEX gas price increases by $1/MMBtu
Sulfur changes by $20/long ton
Canadian to US dollar strengthens by $0.01
Price
Volume
Nitrogen + 0.03
Potash – 0.02
Phosphate ± 0.09
Canadian operating expenses net of – 0.01provincial taxes
Translation gain/loss – 0.01
Potash changes by $20/tonne ± 0.34
DAP/MAP changes by $20/tonne ± 0.06
Ammonia increases by $20/tonne • Nitrogen + 0.04 • Phosphate – 0.01
Urea changes by $20/tonne ± 0.05
Potash changes by 100,000 tonnes ± 0.05
Nitrogen changes by 50,000 N tonnes – 0.03
Phosphate changes by 50,000 P2O5 tonnes – 0.05
Effect on EPS
Effect on EPS
Fertilizer
• Weather and global acreage planted
• Ethanol and biodiesel developments
• US corn acres
• US dollar exchange rates with global currencies
• Global crop prices
• Ocean freight rates
• Prices for natural gas, ammonia and sulfur
• EU and US nitrogen curtailments
• Brazil’s weather, soybean prices, credit policy, soybean acres planted
• China’s agricultural taxes, subsidies, corn exports, soybean imports
• China’s policy on exporting phosphate rock, DAP/MAP and urea
• India’s subsidy policy
• India’s urea and DAP production levels
• US progress on new Farm Bill
• Project capital costs
• New capital project announcements
Feed and Industrial
• Health of US and world economies
• Effect of livestock-based disease restrictions on world trade, e.g. avian fl u, foot and mouth disease
• Potential tightening of restrictions on the use of meat and bone meal in animal feeds
• Impact of residual grain from ethanol production on US feed phosphate consumption
• Consumer spending, housing starts, household improvements, and vehicle production and sales
INDICATORS TO WATCH IN 2008
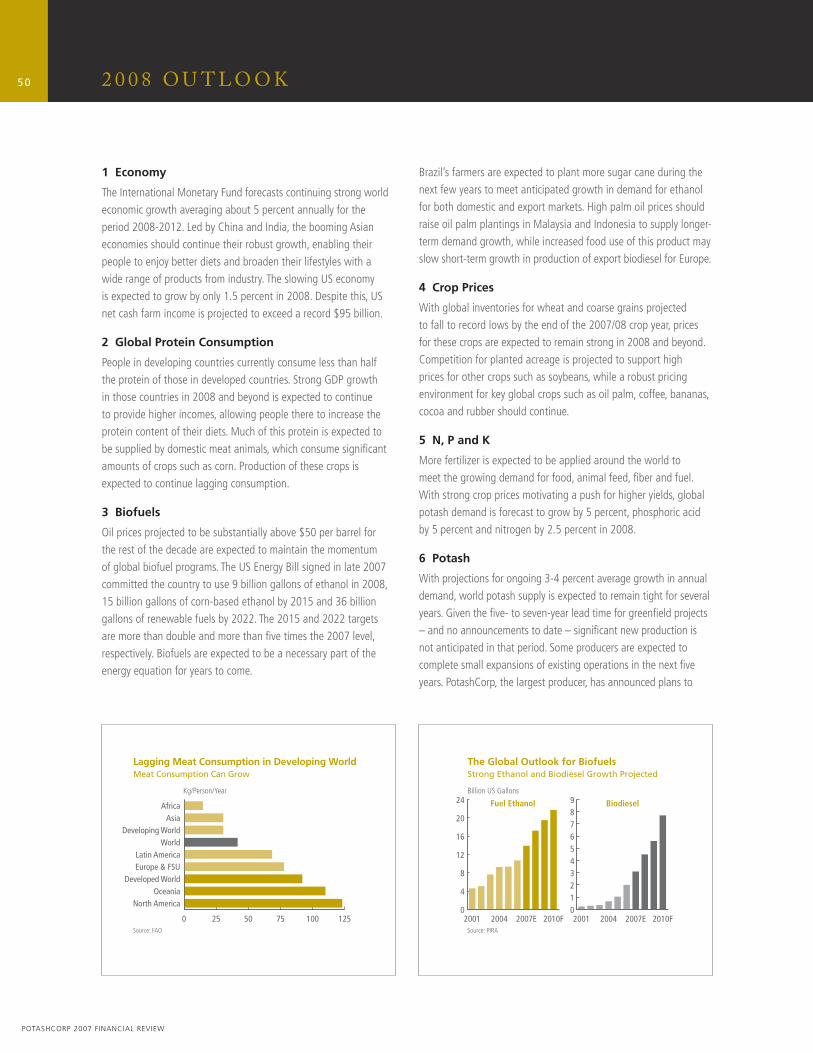
50
POTASHCORP 2007 FINANCIAL REVIEW
2 0 0 8 O U T L O O K
1 Economy
The International Monetary Fund forecasts continuing strong world economic growth averaging about 5 percent annually for the period 2008-2012. Led by China and India, the booming Asian economies should continue their robust growth, enabling their people to enjoy better diets and broaden their lifestyles with a wide range of products from industry. The slowing US economy is expected to grow by only 1.5 percent in 2008. Despite this, US net cash farm income is projected to exceed a record $95 billion.
2 Global Protein Consumption
People in developing countries currently consume less than half the protein of those in developed countries. Strong GDP growth in those countries in 2008 and beyond is expected to continue to provide higher incomes, allowing people there to increase the protein content of their diets. Much of this protein is expected to be supplied by domestic meat animals, which consume signifi cant amounts of crops such as corn. Production of these crops is expected to continue lagging consumption.
3 Biofuels
Oil prices projected to be substantially above $50 per barrel for the rest of the decade are expected to maintain the momentum of global biofuel programs. The US Energy Bill signed in late 2007 committed the country to use 9 billion gallons of ethanol in 2008, 15 billion gallons of corn-based ethanol by 2015 and 36 billion gallons of renewable fuels by 2022. The 2015 and 2022 targets are more than double and more than fi ve times the 2007 level, respectively. Biofuels are expected to be a necessary part of the energy equation for years to come.
Brazil’s farmers are expected to plant more sugar cane during the next few years to meet anticipated growth in demand for ethanol for both domestic and export markets. High palm oil prices should raise oil palm plantings in Malaysia and Indonesia to supply longer-term demand growth, while increased food use of this product may slow short-term growth in production of export biodiesel for Europe.
4 Crop Prices
With global inventories for wheat and coarse grains projected to fall to record lows by the end of the 2007/08 crop year, prices for these crops are expected to remain strong in 2008 and beyond. Competition for planted acreage is projected to support high prices for other crops such as soybeans, while a robust pricing environment for key global crops such as oil palm, coffee, bananas, cocoa and rubber should continue.
5 N, P and K
More fertilizer is expected to be applied around the world to meet the growing demand for food, animal feed, fi ber and fuel. With strong crop prices motivating a push for higher yields, global potash demand is forecast to grow by 5 percent, phosphoric acid by 5 percent and nitrogen by 2.5 percent in 2008.
6 Potash
With projections for ongoing 3-4 percent average growth in annual demand, world potash supply is expected to remain tight for several years. Given the fi ve- to seven-year lead time for greenfi eld projects – and no announcements to date – signifi cant new production is not anticipated in that period. Some producers are expected to complete small expansions of existing operations in the next fi ve years. PotashCorp, the largest producer, has announced plans to
0 25 50 75 100 125
North AmericaOceania
Developed WorldEurope & FSULatin America
WorldDeveloping World
AsiaAfrica
Kg/Person/Year
Source: FAO
Lagging Meat Consumption in Developing WorldMeat Consumption Can Grow
0
4
8
12
16
20
24
2010F2007E200420010123456789
2010F2007E20042001
Billion US Gallons
Source: PIRA
The Global Outlook for BiofuelsStrong Ethanol and Biodiesel Growth Projected
Fuel Ethanol Biodiesel
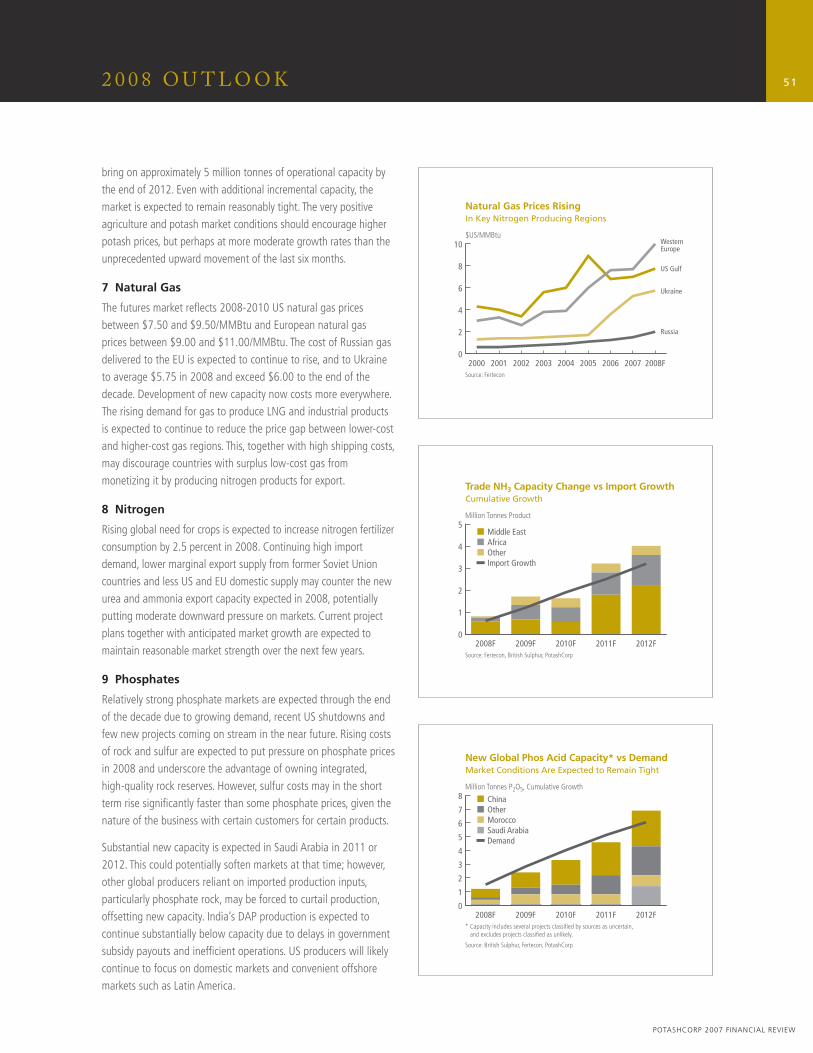
51
POTASHCORP 2007 FINANCIAL REVIEW
2 0 0 8 O U T L O O K
bring on approximately 5 million tonnes of operational capacity by the end of 2012. Even with additional incremental capacity, the market is expected to remain reasonably tight. The very positive agriculture and potash market conditions should encourage higher potash prices, but perhaps at more moderate growth rates than the unprecedented upward movement of the last six months.
7 Natural Gas
The futures market refl ects 2008-2010 US natural gas prices between $7.50 and $9.50/MMBtu and European natural gas prices between $9.00 and $11.00/MMBtu. The cost of Russian gas delivered to the EU is expected to continue to rise, and to Ukraine to average $5.75 in 2008 and exceed $6.00 to the end of the decade. Development of new capacity now costs more everywhere. The rising demand for gas to produce LNG and industrial products is expected to continue to reduce the price gap between lower-cost and higher-cost gas regions. This, together with high shipping costs, may discourage countries with surplus low-cost gas from monetizing it by producing nitrogen products for export.
8 Nitrogen
Rising global need for crops is expected to increase nitrogen fertilizer consumption by 2.5 percent in 2008. Continuing high import demand, lower marginal export supply from former Soviet Union countries and less US and EU domestic supply may counter the new urea and ammonia export capacity expected in 2008, potentially putting moderate downward pressure on markets. Current project plans together with anticipated market growth are expected to maintain reasonable market strength over the next few years.
9 Phosphates
Relatively strong phosphate markets are expected through the end of the decade due to growing demand, recent US shutdowns and few new projects coming on stream in the near future. Rising costs of rock and sulfur are expected to put pressure on phosphate prices in 2008 and underscore the advantage of owning integrated, high-quality rock reserves. However, sulfur costs may in the short term rise signifi cantly faster than some phosphate prices, given the nature of the business with certain customers for certain products.
Substantial new capacity is expected in Saudi Arabia in 2011 or 2012. This could potentially soften markets at that time; however, other global producers reliant on imported production inputs, particularly phosphate rock, may be forced to curtail production, offsetting new capacity. India’s DAP production is expected to continue substantially below capacity due to delays in government subsidy payouts and ineffi cient operations. US producers will likely continue to focus on domestic markets and convenient offshore markets such as Latin America.
0
1
2
3
4
5
6
7
8
2012F2011F2010F2009F2008F
Million Tonnes P2O5, Cumulative Growth
* Capacity includes several projects classified by sources as uncertain, and excludes projects classified as unlikely.
Source: British Sulphur, Fertecon, PotashCorp
New Global Phos Acid Capacity* vs DemandMarket Conditions Are Expected to Remain Tight
ChinaOtherMoroccoSaudi ArabiaDemand
0
2
4
6
8
10
2008F20072006200520042003200220012000
$US/MMBtu
Source: Fertecon
Natural Gas Prices RisingIn Key Nitrogen Producing Regions
WesternEurope
US Gulf
Ukraine
Russia
0
1
2
3
4
5
2012F2011F2010F2009F2008F
Million Tonnes Product
Source: Fertecon, British Sulphur, PotashCorp
Trade NH3 Capacity Change vs Import Growth Cumulative Growth
Middle EastAfricaOtherImport Growth
52
POTASHCORP 2007 FINANCIAL REVIEW
F I N A N C I A L C O N D I T I O N R E V I E W
FINANCIAL CONDITION REVIEW
Effective January 1, 2007, we adopted new accounting standards for fi nancial instruments and hedging activities on a prospective basis; accordingly, comparative amounts for prior periods have not been restated. The new standards had the following impact on our Consolidated Statements of Financial Position as of December 31, 2007:
• The fair values of available-for-sale investments are recorded as assets on the Consolidated Statements of Financial Position. The company classifi ed its investments in ICL and Sinofert as available-for-sale and therefore has recorded these investments at their fair value, resulting in a balance of unrealized holding gains in investments of $2,334.1 million, accumulated other comprehensive income of $2,133.7 million and future income tax liability of $200.4 million as of December 31, 2007. The total balance recorded in investments related to ICL and Sinofert as of December 31, 2007 was $2,725.5 million. In previous periods these investments had been recorded at cost which, as of December 31, 2006 and December 31, 2007, was $167.7 million for ICL and $223.7 million for Sinofert.
• Derivative instruments are generally recorded on the Consolidated Statements of Financial Position at fair value. At December 31, 2007, the fair value of our derivative instrument assets represented a current asset of $30.8 million and a long-term asset of $104.2 million. Of the total, $127.7 million related to natural gas swap, option and physical gas purchase contracts, with $127.6 million of the swap contracts designated as accounting hedges, and $7.3 million related to foreign currency and other forward purchase contracts. As of December 31, 2006, no such derivative instrument assets were recorded on the balance sheet. As of December 31, 2007, the current portion of derivative instrument liabilities of $0.2 million related to natural gas contracts was included in accounts payable and accrued charges. Net gains of $73.5 million on the contracts designated as accounting hedges have been recognized in accumulated other comprehensive income, net of income taxes, as of December 31, 2007, to the extent those hedges are effective; ineffectiveness of $9.6 million arising from January 1 to December 31, 2007 has been recognized as an increase through net income. The future income tax liability associated with these instruments was $50.3 million. Net realized and unrealized gains recognized in net income on physical gas purchase contracts and options not qualifying for hedge accounting arising from January 1 to December 31, 2007 were insignifi cant; no amounts were
recorded in net income during 2006. Hedge ineffectiveness existing on derivative instruments as of January 1, 2007 was recorded as a cumulative effect adjustment to opening retained earnings, net of income tax, resulting in an increase in retained earnings of $0.2 million and a decrease in accumulated other comprehensive income of $0.2 million.
• Bond issue costs were reclassifi ed from other assets to long-term debt and deferred swap gains were reclassifi ed from other non-current liabilities to long-term debt, resulting in a reduction in other assets of $23.9 million, a reduction in other non-current liabilities of $6.6 million and a reduction in long-term debt of $17.3 million at January 1, 2007. These costs are amortized using the effective interest rate method, and will continue to be amortized over the term of the related liability. As of December 31, 2007, unamortized bond issue costs reduced long-term debt by $24.6 million while unamortized deferred swap gains increased it by $5.3 million.
During 2007, we recorded investments in auction rate securities in investments, which we classifi ed as available-for-sale. As of December 31, 2007, the balance recorded in investments was $56.0 million (face value $132.5 million), resulting in a balance of unrealized holding losses of $76.5 million. The unrealized losses represent our estimate of diminution in value as of December 31, 2007, resulting from the lack of current liquidity for these investments at year-end and uncertainty as to the ultimate recoverability. Of the total unrealized loss, $26.5 million has been considered other-than-temporary and therefore reduced net income before income taxes, while $50.0 million has been considered temporary and reduced other comprehensive income before income taxes. In prior years, auction rate securities were included with cash and cash equivalents. The company has not reclassifi ed prior years as the adjustments are not considered material.
Total assets were $9,716.6 million at December 31, 2007, an increase of $3,499.6 million or 56 percent over December 31, 2006. During the same period, total liabilities increased by $261.2 million to $3,697.9 million, and total shareholders’ equity increased by $3,238.4 million to $6,018.7 million.
The largest contributors to the increase in assets during 2007 were investments in available-for-sale securities and derivative instruments as described above, cash and cash equivalents, property, plant and equipment and accounts receivable. Cash and cash equivalents increased $393.8 million, largely due to cash fl ow from operations which was $1,688.9 million during 2007. Accounts
53
POTASHCORP 2007 FINANCIAL REVIEW
L I Q U I D I T Y & C A P I TA L R E S O U R C E S
receivable increased $153.9 million or 35 percent compared to December 31, 2006, which is consistent with the 43 percent increase in sales in the last month of the year. These increases were partially offset by a $73.2 million decline in inventories as they were drawn down due to strong demand that exceeded the company’s production, which was interrupted due to regularly scheduled maintenance at certain locations.
Liabilities increased despite cash fl ow from operations being used to repay $67.9 million of short-term debt obligations and $400.4 million of long-term debt obligations during 2007, including $400.0 million of 7.125 percent 10-year bonds at maturity. This reduction was more than offset by higher future income tax liability and accounts payable and accrued charges. Future income tax liability increased $356.0 million, of which $250.7 million was attributable to the adoption of new accounting standards for fi nancial instruments and hedging activities as described above, with the remainder primarily driven by the impact of the strengthening Canadian dollar and higher income earned during 2007. Accounts payable and accrued charges were $366.5 million higher than at December 31, 2006 as income taxes payable were up $118.4 million with higher income earned in 2007 combined with a lower Canadian installment base; trade payables were up $99.1 million due to work on the company’s potash expansion projects; accrued payroll was up $42.9 million due to higher incentive plan accruals related to share price appreciation and stronger results year over year; deferred revenue increased $17.3 million as a result of customers prepaying for product to lock in pricing ahead of announced price increases; and dividends payable were up $15.9 million as we doubled our quarterly cash dividend in May 2007.
Share capital, retained earnings and contributed surplus all increased at December 31, 2007 compared to December 31, 2006.
Share capital was $29.7 million higher due to the issuance of common shares upon stock option exercises and under our dividend reinvestment plan. Recognition of compensation cost associated with our stock-based compensation plans increased contributed surplus by $38.6 million while the issuance of common shares arising from stock option exercises reduced the balance, for a net increase of $36.6 million. Net earnings of $1,103.6 million for 2007 increased retained earnings while dividends declared of $110.6 million and a cumulative effect adjustment related to the adoption of new accounting standards (as described above) reduced the balance, for a net increase in retained earnings of $993.2 million at December 31, 2007 compared to December 31, 2006. We also added a new line in the equity section of the Consolidated Statements of Financial Position for accumulated other comprehensive income as a result of new accounting standards effective January 1, 2007, as described above. Balances comprising accumulated other comprehensive income included (net of related income taxes) $2,098.7 million in net unrealized holding gains on our available-for-sale securities, $73.5 million in net unrealized gains on our natural gas derivatives that qualify for hedge accounting and $6.7 million in unrealized foreign exchange gains on translation of our self-sustaining foreign operations.
LIQUIDITY AND CAPITAL RESOURCES
The following section explains how we manage our cash and capital resources to carry out our strategy and deliver results.
Liquidity risk arises from our general funding needs and in the management of our assets, liabilities and optimal capital structure. We manage liquidity risk to maintain suffi cient liquid fi nancial resources to fund our balance sheet and meet our commitments and obligations in the most cost-effective manner possible.
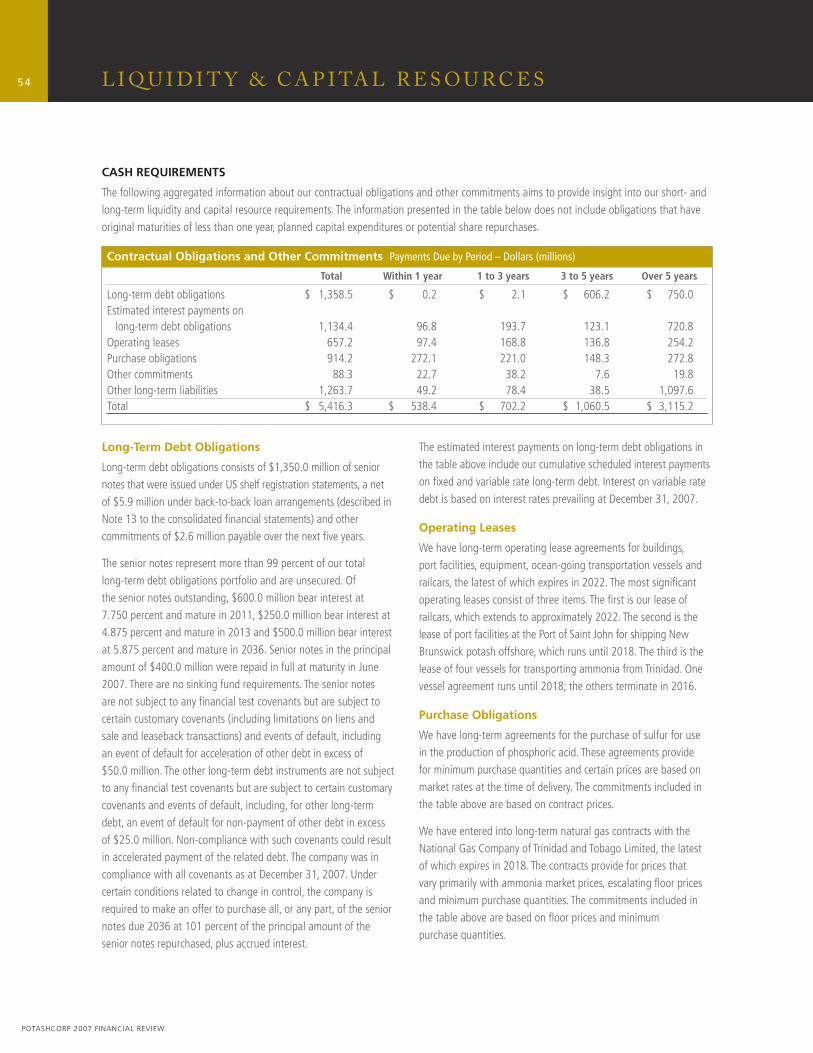
54
POTASHCORP 2007 FINANCIAL REVIEW
L I Q U I D I T Y & C A P I TA L R E S O U R C E S
CASH REQUIREMENTS
The following aggregated information about our contractual obligations and other commitments aims to provide insight into our short- and long-term liquidity and capital resource requirements. The information presented in the table below does not include obligations that have original maturities of less than one year, planned capital expenditures or potential share repurchases.
Long-Term Debt Obligations
Long-term debt obligations consists of $1,350.0 million of senior notes that were issued under US shelf registration statements, a net of $5.9 million under back-to-back loan arrangements (described in Note 13 to the consolidated fi nancial statements) and other commitments of $2.6 million payable over the next fi ve years.
The senior notes represent more than 99 percent of our total long-term debt obligations portfolio and are unsecured. Of the senior notes outstanding, $600.0 million bear interest at 7.750 percent and mature in 2011, $250.0 million bear interest at 4.875 percent and mature in 2013 and $500.0 million bear interest at 5.875 percent and mature in 2036. Senior notes in the principal amount of $400.0 million were repaid in full at maturity in June 2007. There are no sinking fund requirements. The senior notes are not subject to any fi nancial test covenants but are subject to certain customary covenants (including limitations on liens and sale and leaseback transactions) and events of default, including an event of default for acceleration of other debt in excess of $50.0 million. The other long-term debt instruments are not subject to any fi nancial test covenants but are subject to certain customary covenants and events of default, including, for other long-term debt, an event of default for non-payment of other debt in excess of $25.0 million. Non-compliance with such covenants could result in accelerated payment of the related debt. The company was in compliance with all covenants as at December 31, 2007. Under certain conditions related to change in control, the company is required to make an offer to purchase all, or any part, of the senior notes due 2036 at 101 percent of the principal amount of the senior notes repurchased, plus accrued interest.
The estimated interest payments on long-term debt obligations in the table above include our cumulative scheduled interest payments on fi xed and variable rate long-term debt. Interest on variable rate debt is based on interest rates prevailing at December 31, 2007.
Operating Leases
We have long-term operating lease agreements for buildings, port facilities, equipment, ocean-going transportation vessels and railcars, the latest of which expires in 2022. The most signifi cant operating leases consist of three items. The fi rst is our lease of railcars, which extends to approximately 2022. The second is the lease of port facilities at the Port of Saint John for shipping New Brunswick potash offshore, which runs until 2018. The third is the lease of four vessels for transporting ammonia from Trinidad. One vessel agreement runs until 2018; the others terminate in 2016.
Purchase Obligations
We have long-term agreements for the purchase of sulfur for use in the production of phosphoric acid. These agreements provide for minimum purchase quantities and certain prices are based on market rates at the time of delivery. The commitments included in the table above are based on contract prices.
We have entered into long-term natural gas contracts with the National Gas Company of Trinidad and Tobago Limited, the latest of which expires in 2018. The contracts provide for prices that vary primarily with ammonia market prices, escalating fl oor prices and minimum purchase quantities. The commitments included in the table above are based on fl oor prices and minimum purchase quantities.
Contractual Obligations and Other Commitments Payments Due by Period – Dollars (millions)
Total Within 1 year 1 to 3 years 3 to 5 years Over 5 years
Long-term debt obligations $ 1,358.5 $ 0.2 $ 2.1 $ 606.2 $ 750.0Estimated interest payments on long-term debt obligations 1,134.4 96.8 193.7 123.1 720.8Operating leases 657.2 97.4 168.8 136.8 254.2Purchase obligations 914.2 272.1 221.0 148.3 272.8Other commitments 88.3 22.7 38.2 7.6 19.8Other long-term liabilities 1,263.7 49.2 78.4 38.5 1,097.6Total $ 5,416.3 $ 538.4 $ 702.2 $ 1,060.5 $ 3,115.2
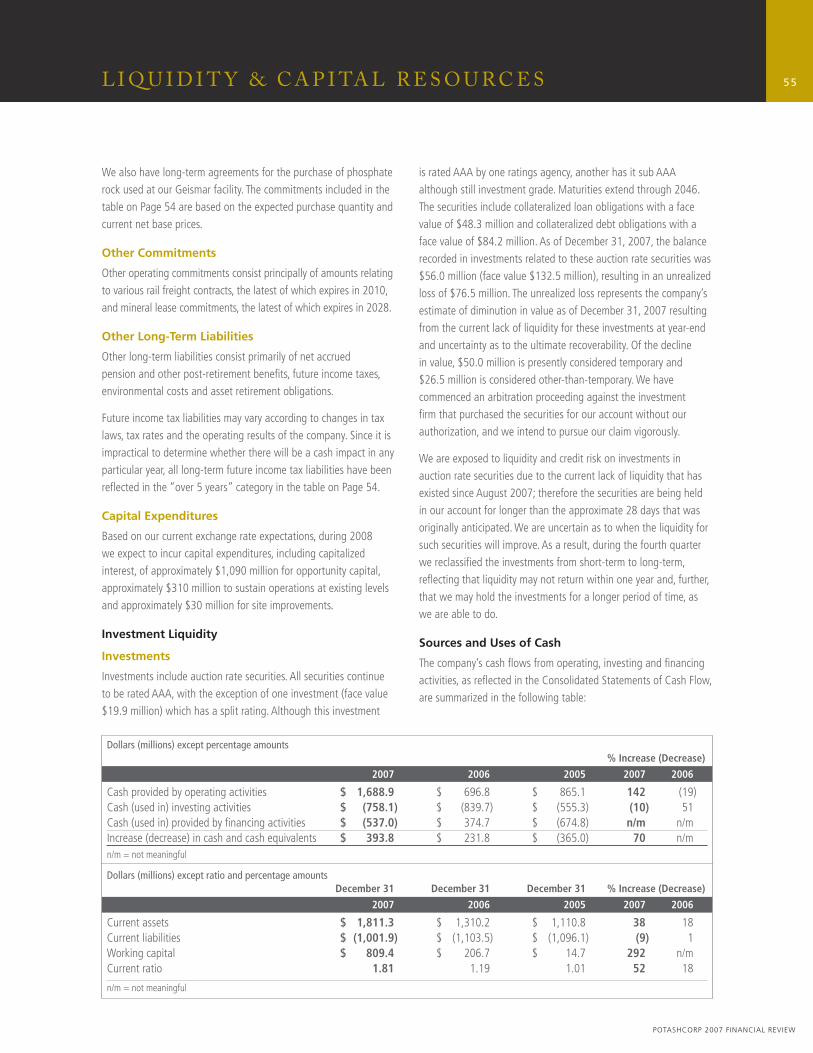
55
POTASHCORP 2007 FINANCIAL REVIEW
L I Q U I D I T Y & C A P I TA L R E S O U R C E S
We also have long-term agreements for the purchase of phosphate rock used at our Geismar facility. The commitments included in the table on Page 54 are based on the expected purchase quantity and current net base prices.
Other Commitments
Other operating commitments consist principally of amounts relating to various rail freight contracts, the latest of which expires in 2010, and mineral lease commitments, the latest of which expires in 2028.
Other Long-Term Liabilities
Other long-term liabilities consist primarily of net accrued pension and other post-retirement benefi ts, future income taxes, environmental costs and asset retirement obligations.
Future income tax liabilities may vary according to changes in tax laws, tax rates and the operating results of the company. Since it is impractical to determine whether there will be a cash impact in any particular year, all long-term future income tax liabilities have been refl ected in the “over 5 years” category in the table on Page 54.
Capital Expenditures
Based on our current exchange rate expectations, during 2008 we expect to incur capital expenditures, including capitalized interest, of approximately $1,090 million for opportunity capital, approximately $310 million to sustain operations at existing levels and approximately $30 million for site improvements.
Investment Liquidity
Investments
Investments include auction rate securities. All securities continue to be rated AAA, with the exception of one investment (face value $19.9 million) which has a split rating. Although this investment
is rated AAA by one ratings agency, another has it sub AAA although still investment grade. Maturities extend through 2046. The securities include collateralized loan obligations with a face value of $48.3 million and collateralized debt obligations with a face value of $84.2 million. As of December 31, 2007, the balance recorded in investments related to these auction rate securities was $56.0 million (face value $132.5 million), resulting in an unrealized loss of $76.5 million. The unrealized loss represents the company’s estimate of diminution in value as of December 31, 2007 resulting from the current lack of liquidity for these investments at year-end and uncertainty as to the ultimate recoverability. Of the decline in value, $50.0 million is presently considered temporary and $26.5 million is considered other-than-temporary. We have commenced an arbitration proceeding against the investment fi rm that purchased the securities for our account without our authorization, and we intend to pursue our claim vigorously.
We are exposed to liquidity and credit risk on investments in auction rate securities due to the current lack of liquidity that has existed since August 2007; therefore the securities are being held in our account for longer than the approximate 28 days that was originally anticipated. We are uncertain as to when the liquidity for such securities will improve. As a result, during the fourth quarter we reclassifi ed the investments from short-term to long-term, refl ecting that liquidity may not return within one year and, further, that we may hold the investments for a longer period of time, as we are able to do.
Sources and Uses of Cash
The company’s cash fl ows from operating, investing and fi nancing activities, as refl ected in the Consolidated Statements of Cash Flow, are summarized in the following table:
Dollars (millions) except percentage amounts % Increase (Decrease)
2007 2006 2005 2007 2006
Cash provided by operating activities $ 1,688.9 $ 696.8 $ 865.1 142 (19)Cash (used in) investing activities $ (758.1) $ (839.7) $ (555.3) (10) 51Cash (used in) provided by fi nancing activities $ (537.0) $ 374.7 $ (674.8) n/m n/mIncrease (decrease) in cash and cash equivalents $ 393.8 $ 231.8 $ (365.0) 70 n/mn/m = not meaningful
Dollars (millions) except ratio and percentage amounts December 31 December 31 December 31 % Increase (Decrease)
2007 2006 2005 2007 2006
Current assets $ 1,811.3 $ 1,310.2 $ 1,110.8 38 18Current liabilities $ (1,001.9) $ (1,103.5) $ (1,096.1) (9) 1Working capital $ 809.4 $ 206.7 $ 14.7 292 n/mCurrent ratio 1.81 1.19 1.01 52 18
n/m = not meaningful
56
POTASHCORP 2007 FINANCIAL REVIEW
L I Q U I D I T Y & C A P I TA L R E S O U R C E S
Our liquidity needs can be met through a variety of sources, including: cash generated from operations, short-term borrowings against our line of credit and commercial paper program, long-term debt issued under our US shelf registration statements, and long-term debt drawn down under our syndicated credit facility. Our primary uses of funds are operational expenses, sustaining and opportunity capital spending, intercorporate investments, dividends, and interest and principal payments on our debt securities.
Cash provided by operating activities grew to $1,688.9 million in 2007, an increase of 142 percent compared to 2006, largely attributable to net income of $1,103.6 million which was $471.8 million higher than in 2006. The strengthening of the Canadian dollar against the US dollar in 2007 increased the reconciliation of net income to cash provided by operating activities by $51.9 million compared to 2006, when the impact was negligible. The increase in provision for future income taxes positively impacted the change in reconciliation of net income to cash provided by operating activities by $69.6 million, and higher depreciation and amortization expense in 2007 due to recent expansion projects now being depreciated improved it by an additional $48.9 million compared to 2006. The change in accounts payable and accrued charges of $250.9 million contributed a further $520.0 million in additional cash fl ows for 2007 compared to 2006. Accounts payable and accrued charges increased during 2007 with higher incentive plan accruals, trade accounts payable, income taxes payable, deferred revenues and dividends payable. This compares to 2006 when the change in accounts payable represented a cash outfl ow of $269.1 million due to (1) reductions in income tax payable because of paying 2005 Canadian income taxes due in fi rst-half 2006 and making Canadian income tax installments for 2006 based on expectations higher than actual results; (2) lower hedging margin deposits as a result of falling natural gas prices and reduced volume of derivative instruments outstanding; and (3) payments of incentive compensation accruals related to performance units granted under the company’s medium-term incentive plan (which is evaluated on a three-year cycle and paid every three years). These were partially offset by the change in other long-term liabilities which negatively impacted the reconciliation of net income to cash provided by operating activities by $57.9 million in 2007 compared to a positive impact of $13.4 million in 2006, a change of $71.3 million that was signifi cantly attributable to increased pension funding during 2007. Further, the change in accounts receivable negatively impacted 2007 operating cash fl ows by $154.6 million compared to a positive impact of $11.0 million in 2006, as accounts
receivable increased more at the end of 2007 than 2006 with signifi cantly higher product pricing.
Cash used in investing activities declined $81.6 million year over year. The most signifi cant cash outlays included:
• During the fi rst quarter of 2007, $9.7 million was paid to settle outstanding amounts related to the December 2006 purchase of additional shares in SQM. During the third quarter of 2007, we purchased an additional 1,011,062 shares of SQM for cash consideration of $16.8 million, which was fi nanced by cash on hand. Our ownership interest in SQM remains at approximately 32 percent. During 2006, we acquired additional interests in Sinofert, APC and SQM for cash consideration of $352.5 million. The Sinofert purchase price was fi nanced by short-term debt; the purchase prices of APC and SQM were fi nanced by cash on hand.
• Our spending on property, plant and equipment was $607.2 million in 2007, an increase of $98.6 million over 2006. Approximately 56 percent (2006 – 58 percent) of our consolidated capital expenditures related to the potash segment.
• We invested $132.5 million in investments in the form of auction rate securities during 2007.
Cash used in fi nancing activities increased $911.7 million during 2007 compared to the cash infl ow from fi nancing activities in 2006. During 2007, we repaid $400.0 million of 10-year bonds that matured in June 2007 while we received $483.9 million proceeds from issuance of long-term debt (net of discount and issue costs) in 2006. Dividend payments increased as we doubled our quarterly dividend in May 2007 (from $0.05 per share to $0.10 per share), using an additional $32.7 million, while $26.4 million lower repayments of short-term debt (as the balance was reduced through 2006) partially offset this.
We believe that internally generated cash fl ow, supplemented by borrowing from existing fi nancing sources if necessary, will be suffi cient to meet our anticipated capital expenditures and other cash requirements in 2008, exclusive of any possible acquisitions, as was the case in 2007. At this time, we do not reasonably expect any presently known trend or uncertainty to affect our ability to access our historical sources of cash.
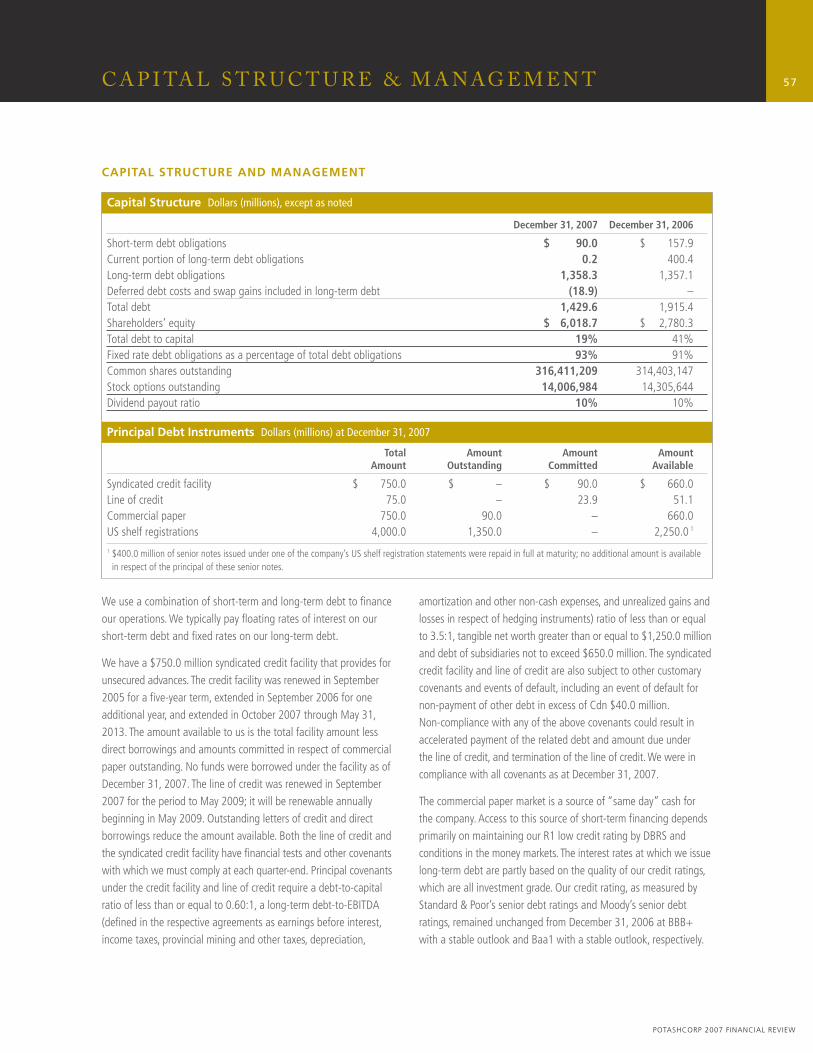
57
POTASHCORP 2007 FINANCIAL REVIEW
C A P I TA L S T R U C T U R E & M A N AG E M E N T
CAPITAL STRUCTURE AND MANAGEMENT
Capital Structure Dollars (millions), except as noted
December 31, 2007 December 31, 2006
Short-term debt obligations $ 90.0 $ 157.9Current portion of long-term debt obligations 0.2 400.4Long-term debt obligations 1,358.3 1,357.1Deferred debt costs and swap gains included in long-term debt (18.9) –Total debt 1,429.6 1,915.4Shareholders’ equity $ 6,018.7 $ 2,780.3Total debt to capital 19% 41%Fixed rate debt obligations as a percentage of total debt obligations 93% 91%Common shares outstanding 316,411,209 314,403,147Stock options outstanding 14,006,984 14,305,644Dividend payout ratio 10% 10%
Principal Debt Instruments Dollars (millions) at December 31, 2007
Total Amount Amount Amount Amount Outstanding Committed Available
Syndicated credit facility $ 750.0 $ – $ 90.0 $ 660.0Line of credit 75.0 – 23.9 51.1Commercial paper 750.0 90.0 – 660.0US shelf registrations 4,000.0 1,350.0 – 2,250.0 1
1 $400.0 million of senior notes issued under one of the company’s US shelf registration statements were repaid in full at maturity; no additional amount is available in respect of the principal of these senior notes.
We use a combination of short-term and long-term debt to fi nance our operations. We typically pay fl oating rates of interest on our short-term debt and fi xed rates on our long-term debt.
We have a $750.0 million syndicated credit facility that provides for unsecured advances. The credit facility was renewed in September 2005 for a fi ve-year term, extended in September 2006 for one additional year, and extended in October 2007 through May 31, 2013. The amount available to us is the total facility amount less direct borrowings and amounts committed in respect of commercial paper outstanding. No funds were borrowed under the facility as of December 31, 2007. The line of credit was renewed in September 2007 for the period to May 2009; it will be renewable annually beginning in May 2009. Outstanding letters of credit and direct borrowings reduce the amount available. Both the line of credit and the syndicated credit facility have fi nancial tests and other covenants with which we must comply at each quarter-end. Principal covenants under the credit facility and line of credit require a debt-to-capital ratio of less than or equal to 0.60:1, a long-term debt-to-EBITDA (defi ned in the respective agreements as earnings before interest, income taxes, provincial mining and other taxes, depreciation,
amortization and other non-cash expenses, and unrealized gains and losses in respect of hedging instruments) ratio of less than or equal to 3.5:1, tangible net worth greater than or equal to $1,250.0 million and debt of subsidiaries not to exceed $650.0 million. The syndicated credit facility and line of credit are also subject to other customary covenants and events of default, including an event of default for non-payment of other debt in excess of Cdn $40.0 million. Non-compliance with any of the above covenants could result in accelerated payment of the related debt and amount due under the line of credit, and termination of the line of credit. We were in compliance with all covenants as at December 31, 2007.
The commercial paper market is a source of “same day” cash for the company. Access to this source of short-term fi nancing depends primarily on maintaining our R1 low credit rating by DBRS and conditions in the money markets. The interest rates at which we issue long-term debt are partly based on the quality of our credit ratings, which are all investment grade. Our credit rating, as measured by Standard & Poor’s senior debt ratings and Moody’s senior debt ratings, remained unchanged from December 31, 2006 at BBB+ with a stable outlook and Baa1 with a stable outlook, respectively.
58
POTASHCORP 2007 FINANCIAL REVIEW
M A R K E T R I S K S A S S O C I AT ED W I T H F I NA N C I A L I N S T R U M EN T S
We also have US shelf registration statements, one of which was registered in 2007 for $2,000.0 million, under which we may issue up to an additional $2,250.0 million in unsecured debt securities.
For 2007, our weighted average cost of capital was 10.0 percent (2006 – 8.8 percent), of which 96 percent represented equity (2006 – 86 percent).
Outstanding Share Data
We had 316,411,209 common shares issued and outstanding at December 31, 2007, compared to 314,403,147 common shares issued and outstanding at December 31, 2006. The company issued 2,008,062 common shares pursuant to the exercise of stock options and under our dividend reinvestment plan.
During the second quarter, the 2007 Performance Option Plan was approved by our shareholders. It permits the grant to eligible employees of options to purchase common shares of the company at an exercise price that shall not be less than the quoted market closing price of the shares on the day prior to the grant. In general, options will vest, if at all, according to a schedule based on the three-year average excess of the company’s consolidated cash fl ow return on investment over the weighted average cost of capital.
At December 31, 2007, there were 14,006,984 options to purchase common shares outstanding under the company’s fi ve stock option plans, as compared to 14,305,644 at December 31, 2006.
Off-Balance Sheet Arrangements
In the normal course of operations, PotashCorp engages in a variety of transactions that, under Canadian GAAP, are either not recorded on our Consolidated Statements of Financial Position or are recorded on our Consolidated Statements of Financial Position in amounts that differ from the full contract amounts. Principal off-balance sheet activities we undertake include issuance of guarantee contracts, certain derivative instruments and long-term fi xed price contracts. We do not reasonably expect any presently known trend or uncertainty to affect our ability to continue using these arrangements. These types of arrangements are discussed below.
Guarantee Contracts
Refer to Note 30 to the consolidated fi nancial statements for information pertaining to our guarantees.
Derivative Instruments
We use derivative fi nancial instruments to manage exposure to commodity price, interest rate and foreign exchange rate fl uctuations. As a result of new accounting changes effective January 1, 2007,
as described in Note 3 to the consolidated fi nancial statements, regardless of whether the derivatives are designated as hedges for Canadian GAAP purposes, they are recorded on the Consolidated Statements of Financial Position at fair value and marked-to-market each reporting period, except for certain non-fi nancial derivatives that have qualifi ed for and for which we have documented a normal purchase or normal sale exception in accordance with the accounting standards.
Long-Term Fixed Price Contracts
Certain of our long-term raw materials agreements contain fi xed price components. Our signifi cant agreements, and the related obligations under such agreements, are discussed in Cash Requirements on Page 54.
MARKET RISKS ASSOCIATED WITH
FINANCIAL INSTRUMENTS
Market risk is the potential for loss from adverse changes in the market value of fi nancial instruments. The level of market risk to which we are exposed varies depending on the composition of our derivative instrument portfolio, as well as current and expected market conditions. The following discussion provides additional detail regarding our exposure to the risks of changing commodity prices, interest rates and foreign exchange rates. A discussion of enterprise-wide risk management can be found on Pages 29 to 30. A discussion of certain liquidity and credit risk related to our investments can be found under “Liquidity and Capital Resources – Investment Liquidity” on Page 55.
Commodity Risk
Our natural gas purchase strategy is based on diversifi cation for our total gas requirements (which represent the forecast consumption of natural gas volumes by our manufacturing and mining facilities). The objective is to acquire a reliable supply of natural gas feedstock and fuel on a location-adjusted, cost-competitive basis in a manner that minimizes volatility without undue risk.
Our US nitrogen results are signifi cantly affected by the price of natural gas. As discussed above, we employ derivative commodity instruments related to a portion of our natural gas requirements (primarily futures, swaps and options) for the purpose of managing our exposure to commodity price risk in the purchase of natural gas, not for speculative or trading purposes. Changes in the market value of these derivative instruments have a high correlation to changes in the spot price of natural gas.
59
POTASHCORP 2007 FINANCIAL REVIEW
R E L AT E D PA R T Y T R A N S AC T I O N S
A sensitivity analysis has been prepared to estimate our market risk exposure arising from derivative commodity instruments. The fair value of such instruments is calculated by valuing each position using quoted market prices where available or prices provided by other external sources. Market risk is estimated as the potential loss in fair value resulting from a hypothetical 10 percent adverse change in such prices. The results of this analysis indicate that as of December 31, 2007, our estimated derivative commodity instruments’ market risk exposure was $48.9 million (2006 – $30.5 million), based on our gas hedging contracts fair-valued at $127.5 million (2006 – $120.3 million). Actual results may differ from this estimate. Changes in the fair value of such derivative instruments, with maturities in 2008 through 2017, will generally relate to changes in the spot price of natural gas purchases.
Interest Rate Risk
We address interest rate risk by using a diversifi ed portfolio of fi xed and fl oating rate instruments. This exposure is also managed by aligning current and long-term assets with demand and fi xed-term debt and by monitoring the effects of market changes in interest rates.
As at December 31, 2007, our short-term debt (comprised of commercial paper) was $90.0 million, our current portion of long-term debt obligation maturities was $0.2 million and our long-term portion of debt obligation maturities was $1,358.3 million. Long-term debt obligation maturities, including the current portion, are comprised primarily of $1,350.0 million of senior notes that were issued under our US shelf registration statements. Since most of our outstanding borrowings have fi xed interest rates, the primary market risk exposure is to changes in fair value. It is estimated that, all else constant, a hypothetical 10 percent change in interest rates would not materially impact our results of operations or fi nancial position. If interest rates changed signifi cantly, management would take appropriate actions to manage our exposure to the change. However, due to the uncertainty of the specifi c actions that would be taken and their possible effects, the sensitivity analysis assumes no changes in our fi nancial structure.
We are also exposed to changes in interest rates related to our investments in marketable securities and auction rate securities. At December 31, 2007, our marketable securities in cash and cash equivalents had a face value and fair value of $719.5 million, and auction rate securities had a face value of $132.5 million and fair value of $56.0 million. Interest rates on marketable securities are fl oating and therefore vary directly with the Canadian and US
market interest rates. Interest rates on auction rate securities are typically reset every 28 days through the sale of the securities in a dutch auction process; however, in the event of market illiquidity the interest rate is reset based on a spread to LIBOR. As a result of current negative conditions in the global credit markets, auctions for the investments in these securities that are held in the company’s trading account have recently failed to settle on their respective settlement dates and instead have paid interest based on the prescribed spread to LIBOR. As of December 31, 2007, our estimated interest rate risk exposure on our marketable securities was minimal due to the short-term nature of the investments, as was the impact on auction rate securities since the provisions of those agreements, in the current market situation, guarantee a fi xed spread regardless of where the market interest rates move. It is estimated that, all else constant, a hypothetical 10 percent change in interest rates would not materially impact our results of operations or fi nancial position.
Foreign Exchange Risk
We also enter into foreign currency forward contracts for the primary purpose of limiting exposure to exchange rate fl uctuations relating to Canadian dollar operating and capital expenditures and capital expenditures denominated in currencies other than the US or Canadian dollar. These contracts are not designated as hedging instruments for accounting purposes. Gains or losses resulting from foreign exchange contracts are recognized in earnings in the period in which changes in fair value occur.
As at December 31, 2007, we had entered into foreign currency forward contracts to sell US dollars and receive Canadian dollars in the notional amount of $60.0 million (2006 – $100.0 million) at an average exchange rate of 1.0176 (2006 – 1.1478) per US dollar and to sell US dollars and receive Hong Kong dollars in the notional amount of $174.5 million (2006 –$NIL) at an average exchange rate of 7.7937 (2006 – NIL) per US dollar. The company had also entered into other small forward contracts. Maturity dates for all forward contracts are within 2008 and 2009.
RELATED PARTY TRANSACTIONS
The company sells potash from our Saskatchewan mines for use outside of North America exclusively to Canpotex. Sales for the year ended December 31, 2007 were $782.7 million (2006 – $467.1 million; 2005 – $577.1 million). Sales to Canpotex are at prevailing market prices and are settled on normal trade terms.
60
POTASHCORP 2007 FINANCIAL REVIEW
C R I T I C A L AC C O U N T I N G E S T I M AT E S
CRITICAL ACCOUNTING ESTIMATES
Our discussion and analysis of our fi nancial condition and results of operations are based upon our consolidated fi nancial statements, which have been prepared in accordance with Canadian GAAP. These principles differ in certain signifi cant respects from US GAAP, and these differences are described and quantifi ed in Note 33 to the consolidated fi nancial statements.
Our signifi cant accounting policies are contained in Note 2 to the consolidated fi nancial statements. Certain of these policies involve critical accounting estimates because they require us to make particularly subjective or complex judgments about matters that are inherently uncertain and because of the likelihood that materially different amounts could be reported under different conditions or using different assumptions. We have discussed the development, selection and application of our key accounting policies, and the critical accounting estimates and assumptions they involve, with the audit committee of the Board of Directors, and it has reviewed the disclosures described in this section.
The following section discusses the critical accounting estimates and assumptions that management has made and how they affect the amounts reported in the consolidated fi nancial statements. We consider these estimates to be an important part of understanding our fi nancial statements.
Variable Interest Entities
In the normal course of business, we may enter into arrangements that need to be examined to determine whether they fall under the variable interest entity (VIE) accounting guidance. Management needs to exercise signifi cant judgment to determine if entities are VIEs and, if so, whether such VIE relationships are required to be consolidated. This process involves fi rst understanding the arrangements to determine whether the entity is considered a VIE under the accounting rules. We use a variety of complex estimation processes that may consider both qualitative and quantitative factors, and may involve the use of assumptions about the business environment in which an entity operates and analysis and calculation of its expected losses and its expected residual returns, where necessary. These quantitative processes involve estimating the future cash fl ows and performance of the entity, analyzing the variability in those cash fl ows and allocating the losses and returns among the identifi ed parties holding variable interests. Where an entity is determined to be a VIE, our interests are compared to those of the unrelated outside parties to identify the party that is the primary benefi ciary, and thus should consolidate the entity. In
addition to the areas of judgment mentioned above, there is a signifi cant amount of judgment exercised in interpreting the provisions of the accounting guidance and applying them to our specifi c transactions.
Pension and Other Post-Retirement Costs
We sponsor plans that provide pensions and other post-retirement benefi ts for most of our employees. We believe the accounting estimates related to our employee benefi t plan costs are critical accounting estimates because: (1) the amounts are based on complex actuarial calculations using several assumptions; and (2) given the magnitude of our estimated costs, differences in actual results or changes in assumptions could materially affect our consolidated fi nancial statements.
Due to the long-term nature of these plans, the calculation of expenses and obligations depends on various assumptions such as discount rates, expected rates of return on assets, health-care cost trend rates, projected salary increases, retirement age, mortality and termination rates. These assumptions are determined by management and are reviewed annually by our actuaries. The discount rate refl ects the weighted average interest rate at which the pension and other post-retirement liabilities could be effectively settled using high-quality bonds at the measurement date. The rate varies by country. We determine the discount rate using a yield curve approach. Based on the respective plans’ demographics, expected future pension benefi t and medical claims payments are measured and discounted to determine the present value of the expected future cash fl ows. The cash fl ows are discounted using yields on high-quality AA-rated non-callable bonds with cash fl ows of similar timing. The expected rate of return on plan assets assumption is based on expected returns for the various asset classes. Other assumptions are based on actual experience and our best estimates. Actual results that differ from the assumptions are accumulated and amortized over future periods and, therefore, generally affect recognized expense and the recorded obligation in future periods. We have included a table in Note 15 to the consolidated fi nancial statements that quantifi es the impact of these differences in each of the last three years. These differences relate primarily to: (1) actual versus expected return on plan assets; (2) actual actuarial gains/losses incurred on the benefi t obligation versus those expected and recognized in the consolidated fi nancial statements; and (3) actual past service costs incurred as a result of plan amendments versus those expected and recognized in the consolidated fi nancial statements.
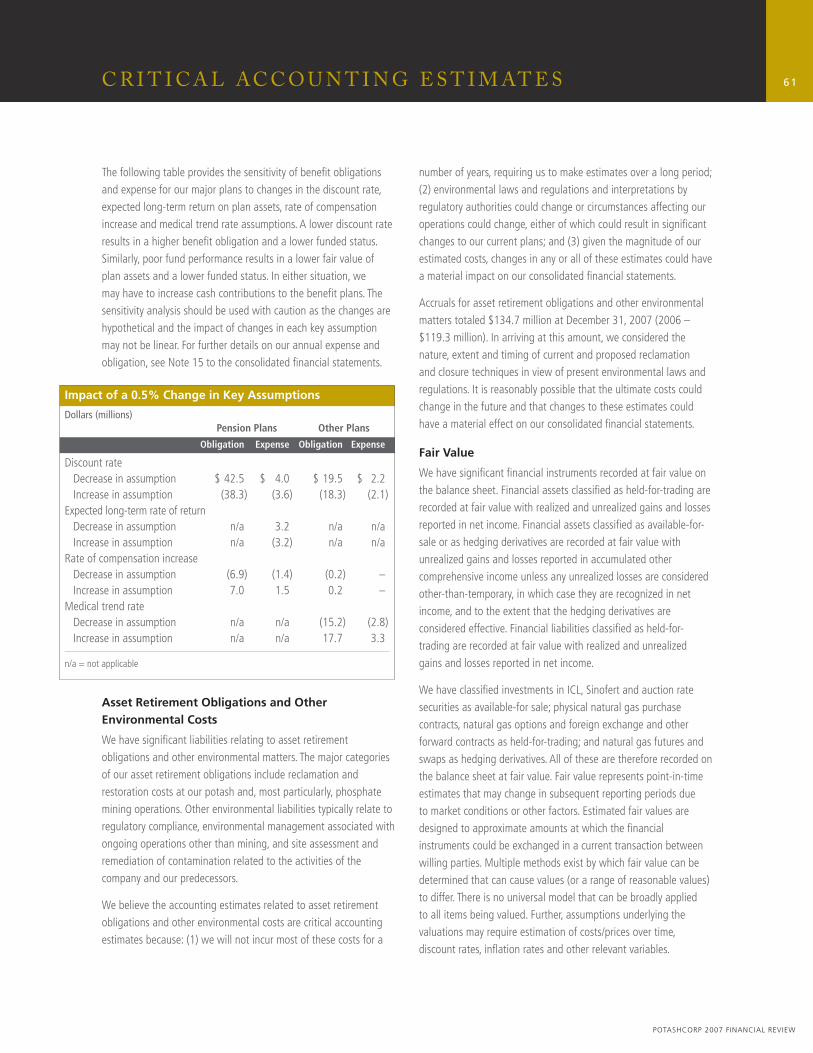
61
POTASHCORP 2007 FINANCIAL REVIEW
C R I T I C A L AC C O U N T I N G E S T I M AT E S
The following table provides the sensitivity of benefi t obligations and expense for our major plans to changes in the discount rate, expected long-term return on plan assets, rate of compensation increase and medical trend rate assumptions. A lower discount rate results in a higher benefi t obligation and a lower funded status. Similarly, poor fund performance results in a lower fair value of plan assets and a lower funded status. In either situation, we may have to increase cash contributions to the benefi t plans. The sensitivity analysis should be used with caution as the changes are hypothetical and the impact of changes in each key assumption may not be linear. For further details on our annual expense and obligation, see Note 15 to the consolidated fi nancial statements.
Asset Retirement Obligations and Other Environmental Costs
We have signifi cant liabilities relating to asset retirement obligations and other environmental matters. The major categories of our asset retirement obligations include reclamation and restoration costs at our potash and, most particularly, phosphate mining operations. Other environmental liabilities typically relate to regulatory compliance, environmental management associated with ongoing operations other than mining, and site assessment and remediation of contamination related to the activities of the company and our predecessors.
We believe the accounting estimates related to asset retirement obligations and other environmental costs are critical accounting estimates because: (1) we will not incur most of these costs for a
number of years, requiring us to make estimates over a long period; (2) environmental laws and regulations and interpretations by regulatory authorities could change or circumstances affecting our operations could change, either of which could result in signifi cant changes to our current plans; and (3) given the magnitude of our estimated costs, changes in any or all of these estimates could have a material impact on our consolidated fi nancial statements.
Accruals for asset retirement obligations and other environmental matters totaled $134.7 million at December 31, 2007 (2006 – $119.3 million). In arriving at this amount, we considered the nature, extent and timing of current and proposed reclamation and closure techniques in view of present environmental laws and regulations. It is reasonably possible that the ultimate costs could change in the future and that changes to these estimates could have a material effect on our consolidated fi nancial statements.
Fair Value
We have signifi cant fi nancial instruments recorded at fair value on the balance sheet. Financial assets classifi ed as held-for-trading are recorded at fair value with realized and unrealized gains and losses reported in net income. Financial assets classifi ed as available-for-sale or as hedging derivatives are recorded at fair value with unrealized gains and losses reported in accumulated other comprehensive income unless any unrealized losses are considered other-than-temporary, in which case they are recognized in net income, and to the extent that the hedging derivatives are considered effective. Financial liabilities classifi ed as held-for-trading are recorded at fair value with realized and unrealized gains and losses reported in net income.
We have classifi ed investments in ICL, Sinofert and auction rate securities as available-for sale; physical natural gas purchase contracts, natural gas options and foreign exchange and other forward contracts as held-for-trading; and natural gas futures and swaps as hedging derivatives. All of these are therefore recorded on the balance sheet at fair value. Fair value represents point-in-time estimates that may change in subsequent reporting periods due to market conditions or other factors. Estimated fair values are designed to approximate amounts at which the fi nancial instruments could be exchanged in a current transaction between willing parties. Multiple methods exist by which fair value can be determined that can cause values (or a range of reasonable values) to differ. There is no universal model that can be broadly applied to all items being valued. Further, assumptions underlying the valuations may require estimation of costs/prices over time, discount rates, infl ation rates and other relevant variables.
Impact of a 0.5% Change in Key Assumptions
Dollars (millions) Pension Plans Other Plans
Obligation Expense Obligation Expense
Discount rate Decrease in assumption $ 42.5 $ 4.0 $ 19.5 $ 2.2 Increase in assumption (38.3) (3.6) (18.3) (2.1)Expected long-term rate of return Decrease in assumption n/a 3.2 n/a n/a Increase in assumption n/a (3.2) n/a n/aRate of compensation increase Decrease in assumption (6.9) (1.4) (0.2) – Increase in assumption 7.0 1.5 0.2 –Medical trend rate Decrease in assumption n/a n/a (15.2) (2.8) Increase in assumption n/a n/a 17.7 3.3
n/a = not applicable
62
POTASHCORP 2007 FINANCIAL REVIEW
C R I T I C A L AC C O U N T I N G E S T I M AT E S
There is currently no active market for the auction rate securities in our trading account and therefore fair value is based on valuation techniques that refl ect our own expectations about the assumptions that market participants would use in pricing the asset in a current transaction (including information obtained on transactions in the marketplace for other investments that may be considered similar, information on expected cash fl ows based on our position of priority within the tranches, information on expected cash fl ows based on information available regarding the underlying securities, and assumptions about risk) as of the balance sheet date. Fair value for our investments in Sinofert and ICL is based on the closing bid price as of the balance sheet date. Futures contracts are exchange-traded and fair value is determined based on exchange prices. Other forward contracts are based on underlyings that are exchange-traded and therefore fair value is determined based on these prices. Swaps and option agreements are traded in the over-the-counter market and fair value is calculated based on models and other valuation techniques that include prices sourced from observable data.
Fair values are also used in the assessment of asset impairment, as discussed further below.
Income Taxes
We operate in a specialized industry and in several tax jurisdictions. As a result, our income is subject to various rates of taxation. The breadth of the company’s operations and the global complexity of tax regulations require assessments of uncertainties and judgments in estimating the taxes we will ultimately pay. The fi nal taxes paid are dependent upon many factors, including negotiations with taxing authorities in various jurisdictions, outcomes of tax litigation and resolution of disputes arising from federal, provincial, state and local tax audits. The resolution of these uncertainties and the associated fi nal taxes may result in adjustments to our tax assets and tax liabilities.
We estimate future income taxes based upon temporary differences between the assets and liabilities that we report in our consolidated fi nancial statements and the tax basis of our assets and liabilities as determined under applicable tax laws. We record a valuation allowance against our future income tax assets when we believe, based on all available evidence, that it is not “more likely than not” that all of our future income tax assets recognized will be realized prior to their expiration. The amount of the future income tax asset recognized and considered realizable could, however, be reduced if projected income is not achieved.
Asset Impairment
We review long-lived assets and intangible assets with fi nite lives whenever events or changes in circumstances indicate that the carrying amount of such assets may not be fully recoverable. Determination of recoverability is based on an estimate of undiscounted future cash fl ows, and measurement of an impairment loss is based on the fair value of the assets. We believe that the accounting estimate related to asset impairment is a critical accounting estimate because: (1) it is highly susceptible to change from period to period as it requires management to make assumptions about future sales, margins and market conditions over the long-term life of the assets; and (2) the impact that recognizing an impairment would have on our fi nancial position and results of operations may be material. As at December 31, 2007, we determined that there were no triggering events requiring impairment analysis.
Goodwill is not amortized, but is assessed for impairment at the reporting unit level annually, or sooner if events or changes in circumstances indicate that the carrying amount could exceed fair value. Goodwill is assessed for impairment using a two-step approach, with the fi rst step being to assess whether the fair value of the reporting unit to which the goodwill is associated is less than its carrying value. If this is the case, a second impairment test is performed that requires a comparison of the fair value of goodwill to its carrying amount. If fair value is less than carrying value, goodwill is considered impaired and an impairment charge must be recognized immediately. The fair value of our reporting units is determined from internally developed valuation models that consider various factors such as normalized and projected earnings, present value of future cash fl ows and discount rates. In each of the last two years, we tested goodwill for impairment, and in each year we determined that, based on our assumptions, the fair value of our reporting units exceeded their carrying amounts and therefore we did not recognize impairment.
Investments that are classifi ed as available-for-sale, carried at cost or accounted for using the equity method are also reviewed to determine whether fair value is below carrying value. Factors and judgments we consider in determining whether a loss is temporary as compared to other-than-temporary include the length of time and extent to which fair value has been below cost; fi nancial condition and near-term prospects of the investee; and our ability and intent to hold the investment for a period of time suffi cient to allow for any anticipated recovery. We determined the fair value of the auction rate securities held in our trading account to be $56.0 million as of
63
POTASHCORP 2007 FINANCIAL REVIEW
RE C EN T ACCO U N T I N G C H A N G ES & EF F E C T I V E DAT ES
December 31, 2007, representing an impairment of $76.5 million as compared to the par value of the securities. Of the total impairment, $50.0 million has been classifi ed as temporary and $26.5 million has been classifi ed as other-than-temporary. The securities were reviewed on an individual basis to determine whether the impairment was temporary or other-than-temporary. Two were identifi ed as being other-than-temporarily impaired based on the vintage of the underlying securities and complexity of the structures. The entire impairment on these two securities was therefore classifi ed as other-than-temporary. For those investments for which the impairment in fair value is considered temporary, the company has the ability to hold the securities until the temporary impairment in fair value is recovered, which may not be until a recovery of the auction process or until maturity. However, the estimated fair value of the investments in auction rate securities could decline in future periods based on market conditions, which could result in additional impairment charges. None of our other investments were considered impaired, either temporarily or other-than-temporarily, as of December 31, 2007.
We cannot predict if an event that triggers impairment will occur, when it will occur or how it will affect the asset amounts we have reported. Although we believe our estimates are reasonable and consistent with current conditions, internal planning and expected future operations, such estimates are subject to signifi cant uncertainties and judgments. As a result, it is reasonably possible that the amounts reported for asset impairments could be different if we were to use different assumptions or if market and other conditions were to change. The changes could result in non-cash charges that could materially affect our consolidated fi nancial statements.
Stock-Based Compensation
We account for stock-based compensation in accordance with the fair value recognition provisions of Canadian GAAP. As such, stock-based compensation expense for equity-settled plans is measured at the grant date based on the fair value of the award and is recognized as an expense over the vesting period. Determining the fair value of such stock-based awards at the grant date requires judgment, including estimating the expected term of stock options, the expected volatility of our stock and expected dividends. In addition, judgment is required to estimate the number of stock-based awards that are expected to be forfeited.
For those awards with performance conditions that determine the number of options or units to which our employees will be entitled, measurement of compensation cost is based on our best estimate of the outcome of the performance conditions. If actual results differ signifi cantly from these estimates, stock-based compensation expense and our results of operations could be materially impacted.
Depreciation and Amortization
We depreciate certain mining and milling assets and pre-stripping costs using the units of production method based on the shorter of estimates of reserve or service lives. We have other assets that we depreciate on a straight-line basis over their estimated useful lives.
We perform assessments of our existing assets and depreciable lives in connection with the review of mine operating plans. When we determine that assigned asset lives do not refl ect the expected remaining period of benefi t, we make prospective changes to their depreciable lives. There are a number of uncertainties inherent in estimating reserve quantities, particularly as they relate to assumptions regarding future prices, the geology of our mines, the mining methods we use and the related costs we incur to develop and mine our reserves. Changes in these assumptions could result in material adjustments to our reserve estimates, which could result in changes to units of production depreciation expense in future periods. Although some degree of variability is expected, we believe the extent of our technical data and operating experience mitigates the potential for signifi cant changes in reserve estimates.
As discussed on Page 62, we review and evaluate our long-lived assets for impairment when events or changes in circumstances indicate that the related carrying amounts may not be recoverable. We believe it is unlikely that revisions to our estimates of reserves would give rise to an impairment of our assets because of their signifi cant size in relation to our asset-carrying values.
RECENT ACCOUNTING CHANGES AND
EFFECTIVE DATES
Refer to Note 3 to the consolidated fi nancial statements for information pertaining to accounting changes effective in 2007, and Notes 2 and 33 to the consolidated fi nancial statements for information on issued accounting pronouncements that will be effective in future years.
64
POTASHCORP 2007 FINANCIAL REVIEW
F O R WA R D - L O O K I N G S TAT E M E N T S
FORWARD-LOOKING STATEMENTS
This 2007 Financial Review, including the “Key Earnings Sensitivities” and “Outlook” sections of Management’s Discussion & Analysis of Financial Condition and Results of Operations, contains forward-looking statements. These statements can be identifi ed by expressions of belief, expectation or intention, as well as those statements that are not historical fact. These statements are based on certain factors and assumptions as set forth in this 2007 Financial Review, including foreign exchange rates, expected growth, results of operations, performance, business prospects and opportunities and effective income tax rates. While the company considers these factors and assumptions to be reasonable based on information currently available, they may prove to be incorrect. A number of factors could cause actual results to differ materially from those in the forward-looking statements, including, but not limited to: fl uctuations in supply and demand in fertilizer, sulfur, transportation and petrochemical markets; changes in competitive pressures, including pricing pressures; the results of negotiations with China and India; timing and amount of capital expenditures;
risks associated with natural gas and other hedging activities; changes in capital markets and corresponding effects on the company’s investments; changes in currency and exchange rates; unexpected geological or environmental conditions, including water infl ow; strikes or other forms of work stoppage or slowdowns; changes in, and the effects of, government policy and regulations; and earnings, exchange rates and the decisions of taxing authorities, all of which could affect our effective tax rates. Additional risks and uncertainties can be found in our Form 10-K for the fi scal year ended December 31, 2007 under the captions “Forward-Looking Statements” and “Item 1A – Risk Factors” and in our fi lings with the US Securities and Exchange Commission and the Canadian provincial securities commissions. Forward-looking statements are given only as at the date of this report and the company disclaims any obligation to update or revise the forward-looking statements, whether as a result of new information, future events or otherwise, except as required by law.
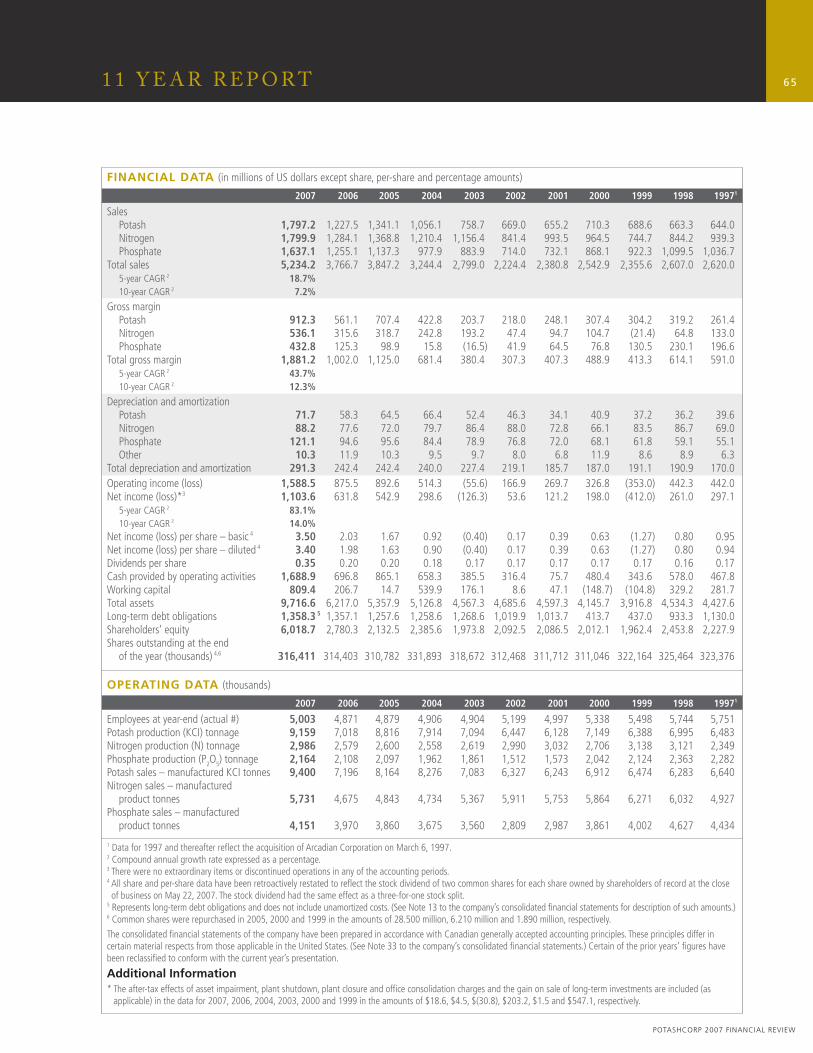
65
POTASHCORP 2007 FINANCIAL REVIEW
1 1 Y E A R R E P O R T
FINANCIAL DATA (in millions of US dollars except share, per-share and percentage amounts)
2007 2006 2005 2004 2003 2002 2001 2000 1999 1998 19971
Sales Potash 1,797.2 1,227.5 1,341.1 1,056.1 758.7 669.0 655.2 710.3 688.6 663.3 644.0 Nitrogen 1,799.9 1,284.1 1,368.8 1,210.4 1,156.4 841.4 993.5 964.5 744.7 844.2 939.3 Phosphate 1,637.1 1,255.1 1,137.3 977.9 883.9 714.0 732.1 868.1 922.3 1,099.5 1,036.7Total sales 5,234.2 3,766.7 3,847.2 3,244.4 2,799.0 2,224.4 2,380.8 2,542.9 2,355.6 2,607.0 2,620.0 5-year CAGR 2 18.7% 10-year CAGR 2 7.2%
Gross margin Potash 912.3 561.1 707.4 422.8 203.7 218.0 248.1 307.4 304.2 319.2 261.4 Nitrogen 536.1 315.6 318.7 242.8 193.2 47.4 94.7 104.7 (21.4) 64.8 133.0 Phosphate 432.8 125.3 98.9 15.8 (16.5) 41.9 64.5 76.8 130.5 230.1 196.6Total gross margin 1,881.2 1,002.0 1,125.0 681.4 380.4 307.3 407.3 488.9 413.3 614.1 591.0 5-year CAGR 2 43.7% 10-year CAGR 2 12.3%
Depreciation and amortization Potash 71.7 58.3 64.5 66.4 52.4 46.3 34.1 40.9 37.2 36.2 39.6 Nitrogen 88.2 77.6 72.0 79.7 86.4 88.0 72.8 66.1 83.5 86.7 69.0 Phosphate 121.1 94.6 95.6 84.4 78.9 76.8 72.0 68.1 61.8 59.1 55.1 Other 10.3 11.9 10.3 9.5 9.7 8.0 6.8 11.9 8.6 8.9 6.3Total depreciation and amortization 291.3 242.4 242.4 240.0 227.4 219.1 185.7 187.0 191.1 190.9 170.0Operating income (loss) 1,588.5 875.5 892.6 514.3 (55.6) 166.9 269.7 326.8 (353.0) 442.3 442.0Net income (loss)*3 1,103.6 631.8 542.9 298.6 (126.3) 53.6 121.2 198.0 (412.0) 261.0 297.1 5-year CAGR 2 83.1% 10-year CAGR 2 14.0%Net income (loss) per share – basic 4 3.50 2.03 1.67 0.92 (0.40) 0.17 0.39 0.63 (1.27) 0.80 0.95Net income (loss) per share – diluted 4 3.40 1.98 1.63 0.90 (0.40) 0.17 0.39 0.63 (1.27) 0.80 0.94Dividends per share 0.35 0.20 0.20 0.18 0.17 0.17 0.17 0.17 0.17 0.16 0.17Cash provided by operating activities 1,688.9 696.8 865.1 658.3 385.5 316.4 75.7 480.4 343.6 578.0 467.8Working capital 809.4 206.7 14.7 539.9 176.1 8.6 47.1 (148.7) (104.8) 329.2 281.7Total assets 9,716.6 6,217.0 5,357.9 5,126.8 4,567.3 4,685.6 4,597.3 4,145.7 3,916.8 4,534.3 4,427.6Long-term debt obligations 1,358.3 5 1,357.1 1,257.6 1,258.6 1,268.6 1,019.9 1,013.7 413.7 437.0 933.3 1,130.0Shareholders’ equity 6,018.7 2,780.3 2,132.5 2,385.6 1,973.8 2,092.5 2,086.5 2,012.1 1,962.4 2,453.8 2,227.9Shares outstanding at the end of the year (thousands) 4,6 316,411 314,403 310,782 331,893 318,672 312,468 311,712 311,046 322,164 325,464 323,376
OPERATING DATA (thousands)
2007 2006 2005 2004 2003 2002 2001 2000 1999 1998 19971
Employees at year-end (actual #) 5,003 4,871 4,879 4,906 4,904 5,199 4,997 5,338 5,498 5,744 5,751Potash production (KCI) tonnage 9,159 7,018 8,816 7,914 7,094 6,447 6,128 7,149 6,388 6,995 6,483Nitrogen production (N) tonnage 2,986 2,579 2,600 2,558 2,619 2,990 3,032 2,706 3,138 3,121 2,349Phosphate production (P2O5) tonnage 2,164 2,108 2,097 1,962 1,861 1,512 1,573 2,042 2,124 2,363 2,282Potash sales – manufactured KCI tonnes 9,400 7,196 8,164 8,276 7,083 6,327 6,243 6,912 6,474 6,283 6,640Nitrogen sales – manufactured product tonnes 5,731 4,675 4,843 4,734 5,367 5,911 5,753 5,864 6,271 6,032 4,927Phosphate sales – manufactured product tonnes 4,151 3,970 3,860 3,675 3,560 2,809 2,987 3,861 4,002 4,627 4,434
1 Data for 1997 and thereafter refl ect the acquisition of Arcadian Corporation on March 6, 1997.2 Compound annual growth rate expressed as a percentage.3 There were no extraordinary items or discontinued operations in any of the accounting periods.4 All share and per-share data have been retroactively restated to refl ect the stock dividend of two common shares for each share owned by shareholders of record at the close of business on May 22, 2007. The stock dividend had the same effect as a three-for-one stock split.
5 Represents long-term debt obligations and does not include unamortized costs. (See Note 13 to the company’s consolidated fi nancial statements for description of such amounts.)6 Common shares were repurchased in 2005, 2000 and 1999 in the amounts of 28.500 million, 6.210 million and 1.890 million, respectively.
The consolidated fi nancial statements of the company have been prepared in accordance with Canadian generally accepted accounting principles. These principles differ in certain material respects from those applicable in the United States. (See Note 33 to the company’s consolidated fi nancial statements.) Certain of the prior years’ fi gures have been reclassifi ed to conform with the current year’s presentation.
Additional Information * The after-tax effects of asset impairment, plant shutdown, plant closure and offi ce consolidation charges and the gain on sale of long-term investments are included (as
applicable) in the data for 2007, 2006, 2004, 2003, 2000 and 1999 in the amounts of $18.6, $4.5, $(30.8), $203.2, $1.5 and $547.1, respectively.
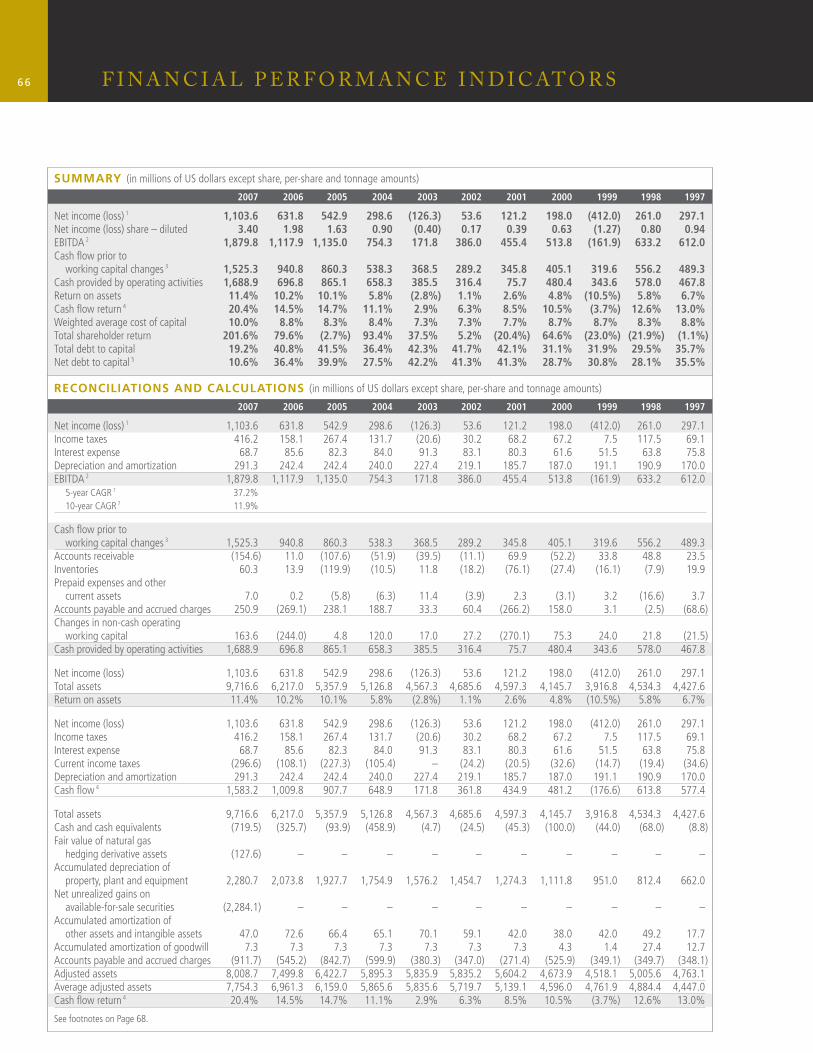
66
SUMMARY (in millions of US dollars except share, per-share and tonnage amounts)
2007 2006 2005 2004 2003 2002 2001 2000 1999 1998 1997
Net income (loss) 1 1,103.6 631.8 542.9 298.6 (126.3) 53.6 121.2 198.0 (412.0) 261.0 297.1Net income (loss) share – diluted 3.40 1.98 1.63 0.90 (0.40) 0.17 0.39 0.63 (1.27) 0.80 0.94EBITDA 2 1,879.8 1,117.9 1,135.0 754.3 171.8 386.0 455.4 513.8 (161.9) 633.2 612.0Cash fl ow prior to working capital changes 3 1,525.3 940.8 860.3 538.3 368.5 289.2 345.8 405.1 319.6 556.2 489.3Cash provided by operating activities 1,688.9 696.8 865.1 658.3 385.5 316.4 75.7 480.4 343.6 578.0 467.8Return on assets 11.4% 10.2% 10.1% 5.8% (2.8%) 1.1% 2.6% 4.8% (10.5%) 5.8% 6.7%Cash fl ow return 4 20.4% 14.5% 14.7% 11.1% 2.9% 6.3% 8.5% 10.5% (3.7%) 12.6% 13.0%Weighted average cost of capital 10.0% 8.8% 8.3% 8.4% 7.3% 7.3% 7.7% 8.7% 8.7% 8.3% 8.8%Total shareholder return 201.6% 79.6% (2.7%) 93.4% 37.5% 5.2% (20.4%) 64.6% (23.0%) (21.9%) (1.1%)Total debt to capital 19.2% 40.8% 41.5% 36.4% 42.3% 41.7% 42.1% 31.1% 31.9% 29.5% 35.7%Net debt to capital 5 10.6% 36.4% 39.9% 27.5% 42.2% 41.3% 41.3% 28.7% 30.8% 28.1% 35.5%
RECONCILIATIONS AND CALCULATIONS (in millions of US dollars except share, per-share and tonnage amounts)
2007 2006 2005 2004 2003 2002 2001 2000 1999 1998 1997
Net income (loss) 1 1,103.6 631.8 542.9 298.6 (126.3) 53.6 121.2 198.0 (412.0) 261.0 297.1Income taxes 416.2 158.1 267.4 131.7 (20.6) 30.2 68.2 67.2 7.5 117.5 69.1Interest expense 68.7 85.6 82.3 84.0 91.3 83.1 80.3 61.6 51.5 63.8 75.8Depreciation and amortization 291.3 242.4 242.4 240.0 227.4 219.1 185.7 187.0 191.1 190.9 170.0EBITDA 2 1,879.8 1,117.9 1,135.0 754.3 171.8 386.0 455.4 513.8 (161.9) 633.2 612.0 5-year CAGR 7 37.2% 10-year CAGR 7 11.9%
Cash fl ow prior to working capital changes 3 1,525.3 940.8 860.3 538.3 368.5 289.2 345.8 405.1 319.6 556.2 489.3Accounts receivable (154.6) 11.0 (107.6) (51.9) (39.5) (11.1) 69.9 (52.2) 33.8 48.8 23.5Inventories 60.3 13.9 (119.9) (10.5) 11.8 (18.2) (76.1) (27.4) (16.1) (7.9) 19.9Prepaid expenses and other current assets 7.0 0.2 (5.8) (6.3) 11.4 (3.9) 2.3 (3.1) 3.2 (16.6) 3.7Accounts payable and accrued charges 250.9 (269.1) 238.1 188.7 33.3 60.4 (266.2) 158.0 3.1 (2.5) (68.6)Changes in non-cash operating working capital 163.6 (244.0) 4.8 120.0 17.0 27.2 (270.1) 75.3 24.0 21.8 (21.5)Cash provided by operating activities 1,688.9 696.8 865.1 658.3 385.5 316.4 75.7 480.4 343.6 578.0 467.8
Net income (loss) 1,103.6 631.8 542.9 298.6 (126.3) 53.6 121.2 198.0 (412.0) 261.0 297.1Total assets 9,716.6 6,217.0 5,357.9 5,126.8 4,567.3 4,685.6 4,597.3 4,145.7 3,916.8 4,534.3 4,427.6Return on assets 11.4% 10.2% 10.1% 5.8% (2.8%) 1.1% 2.6% 4.8% (10.5%) 5.8% 6.7%
Net income (loss) 1,103.6 631.8 542.9 298.6 (126.3) 53.6 121.2 198.0 (412.0) 261.0 297.1Income taxes 416.2 158.1 267.4 131.7 (20.6) 30.2 68.2 67.2 7.5 117.5 69.1Interest expense 68.7 85.6 82.3 84.0 91.3 83.1 80.3 61.6 51.5 63.8 75.8Current income taxes (296.6) (108.1) (227.3) (105.4) – (24.2) (20.5) (32.6) (14.7) (19.4) (34.6)Depreciation and amortization 291.3 242.4 242.4 240.0 227.4 219.1 185.7 187.0 191.1 190.9 170.0Cash fl ow 4 1,583.2 1,009.8 907.7 648.9 171.8 361.8 434.9 481.2 (176.6) 613.8 577.4
Total assets 9,716.6 6,217.0 5,357.9 5,126.8 4,567.3 4,685.6 4,597.3 4,145.7 3,916.8 4,534.3 4,427.6Cash and cash equivalents (719.5) (325.7) (93.9) (458.9) (4.7) (24.5) (45.3) (100.0) (44.0) (68.0) (8.8)Fair value of natural gas hedging derivative assets (127.6) – – – – – – – – – –Accumulated depreciation of property, plant and equipment 2,280.7 2,073.8 1,927.7 1,754.9 1,576.2 1,454.7 1,274.3 1,111.8 951.0 812.4 662.0Net unrealized gains on available-for-sale securities (2,284.1) – – – – – – – – – –Accumulated amortization of other assets and intangible assets 47.0 72.6 66.4 65.1 70.1 59.1 42.0 38.0 42.0 49.2 17.7Accumulated amortization of goodwill 7.3 7.3 7.3 7.3 7.3 7.3 7.3 4.3 1.4 27.4 12.7Accounts payable and accrued charges (911.7) (545.2) (842.7) (599.9) (380.3) (347.0) (271.4) (525.9) (349.1) (349.7) (348.1)Adjusted assets 8,008.7 7,499.8 6,422.7 5,895.3 5,835.9 5,835.2 5,604.2 4,673.9 4,518.1 5,005.6 4,763.1Average adjusted assets 7,754.3 6,961.3 6,159.0 5,865.6 5,835.6 5,719.7 5,139.1 4,596.0 4,761.9 4,884.4 4,447.0Cash fl ow return 4 20.4% 14.5% 14.7% 11.1% 2.9% 6.3% 8.5% 10.5% (3.7%) 12.6% 13.0%
See footnotes on Page 68.
F I N A N C I A L P E R F O R M A N C E I N D I C AT O R S
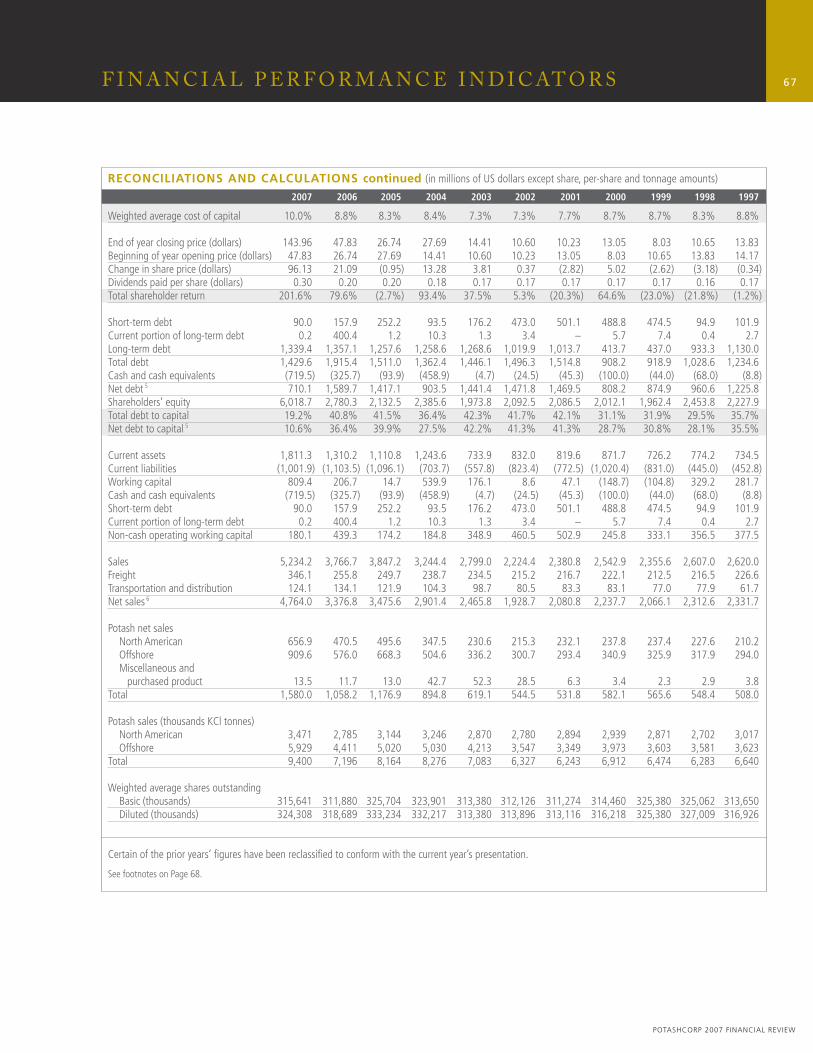
67
POTASHCORP 2007 FINANCIAL REVIEW
F I N A N C I A L P E R F O R M A N C E I N D I C AT O R S
RECONCILIATIONS AND CALCULATIONS continued (in millions of US dollars except share, per-share and tonnage amounts)
2007 2006 2005 2004 2003 2002 2001 2000 1999 1998 1997
Weighted average cost of capital 10.0% 8.8% 8.3% 8.4% 7.3% 7.3% 7.7% 8.7% 8.7% 8.3% 8.8%
End of year closing price (dollars) 143.96 47.83 26.74 27.69 14.41 10.60 10.23 13.05 8.03 10.65 13.83Beginning of year opening price (dollars) 47.83 26.74 27.69 14.41 10.60 10.23 13.05 8.03 10.65 13.83 14.17Change in share price (dollars) 96.13 21.09 (0.95) 13.28 3.81 0.37 (2.82) 5.02 (2.62) (3.18) (0.34)Dividends paid per share (dollars) 0.30 0.20 0.20 0.18 0.17 0.17 0.17 0.17 0.17 0.16 0.17Total shareholder return 201.6% 79.6% (2.7%) 93.4% 37.5% 5.3% (20.3%) 64.6% (23.0%) (21.8%) (1.2%)
Short-term debt 90.0 157.9 252.2 93.5 176.2 473.0 501.1 488.8 474.5 94.9 101.9Current portion of long-term debt 0.2 400.4 1.2 10.3 1.3 3.4 – 5.7 7.4 0.4 2.7Long-term debt 1,339.4 1,357.1 1,257.6 1,258.6 1,268.6 1,019.9 1,013.7 413.7 437.0 933.3 1,130.0Total debt 1,429.6 1,915.4 1,511.0 1,362.4 1,446.1 1,496.3 1,514.8 908.2 918.9 1,028.6 1,234.6Cash and cash equivalents (719.5) (325.7) (93.9) (458.9) (4.7) (24.5) (45.3) (100.0) (44.0) (68.0) (8.8)Net debt 5 710.1 1,589.7 1,417.1 903.5 1,441.4 1,471.8 1,469.5 808.2 874.9 960.6 1,225.8Shareholders’ equity 6,018.7 2,780.3 2,132.5 2,385.6 1,973.8 2,092.5 2,086.5 2,012.1 1,962.4 2,453.8 2,227.9Total debt to capital 19.2% 40.8% 41.5% 36.4% 42.3% 41.7% 42.1% 31.1% 31.9% 29.5% 35.7%Net debt to capital 5 10.6% 36.4% 39.9% 27.5% 42.2% 41.3% 41.3% 28.7% 30.8% 28.1% 35.5%
Current assets 1,811.3 1,310.2 1,110.8 1,243.6 733.9 832.0 819.6 871.7 726.2 774.2 734.5Current liabilities (1,001.9) (1,103.5) (1,096.1) (703.7) (557.8) (823.4) (772.5) (1,020.4) (831.0) (445.0) (452.8)Working capital 809.4 206.7 14.7 539.9 176.1 8.6 47.1 (148.7) (104.8) 329.2 281.7Cash and cash equivalents (719.5) (325.7) (93.9) (458.9) (4.7) (24.5) (45.3) (100.0) (44.0) (68.0) (8.8)Short-term debt 90.0 157.9 252.2 93.5 176.2 473.0 501.1 488.8 474.5 94.9 101.9Current portion of long-term debt 0.2 400.4 1.2 10.3 1.3 3.4 – 5.7 7.4 0.4 2.7Non-cash operating working capital 180.1 439.3 174.2 184.8 348.9 460.5 502.9 245.8 333.1 356.5 377.5
Sales 5,234.2 3,766.7 3,847.2 3,244.4 2,799.0 2,224.4 2,380.8 2,542.9 2,355.6 2,607.0 2,620.0Freight 346.1 255.8 249.7 238.7 234.5 215.2 216.7 222.1 212.5 216.5 226.6Transportation and distribution 124.1 134.1 121.9 104.3 98.7 80.5 83.3 83.1 77.0 77.9 61.7Net sales 6 4,764.0 3,376.8 3,475.6 2,901.4 2,465.8 1,928.7 2,080.8 2,237.7 2,066.1 2,312.6 2,331.7
Potash net sales North American 656.9 470.5 495.6 347.5 230.6 215.3 232.1 237.8 237.4 227.6 210.2 Offshore 909.6 576.0 668.3 504.6 336.2 300.7 293.4 340.9 325.9 317.9 294.0 Miscellaneous and purchased product 13.5 11.7 13.0 42.7 52.3 28.5 6.3 3.4 2.3 2.9 3.8Total 1,580.0 1,058.2 1,176.9 894.8 619.1 544.5 531.8 582.1 565.6 548.4 508.0
Potash sales (thousands KCl tonnes) North American 3,471 2,785 3,144 3,246 2,870 2,780 2,894 2,939 2,871 2,702 3,017 Offshore 5,929 4,411 5,020 5,030 4,213 3,547 3,349 3,973 3,603 3,581 3,623Total 9,400 7,196 8,164 8,276 7,083 6,327 6,243 6,912 6,474 6,283 6,640
Weighted average shares outstanding Basic (thousands) 315,641 311,880 325,704 323,901 313,380 312,126 311,274 314,460 325,380 325,062 313,650 Diluted (thousands) 324,308 318,689 333,234 332,217 313,380 313,896 313,116 316,218 325,380 327,009 316,926
Certain of the prior years’ fi gures have been reclassifi ed to conform with the current year’s presentation.
See footnotes on Page 68.
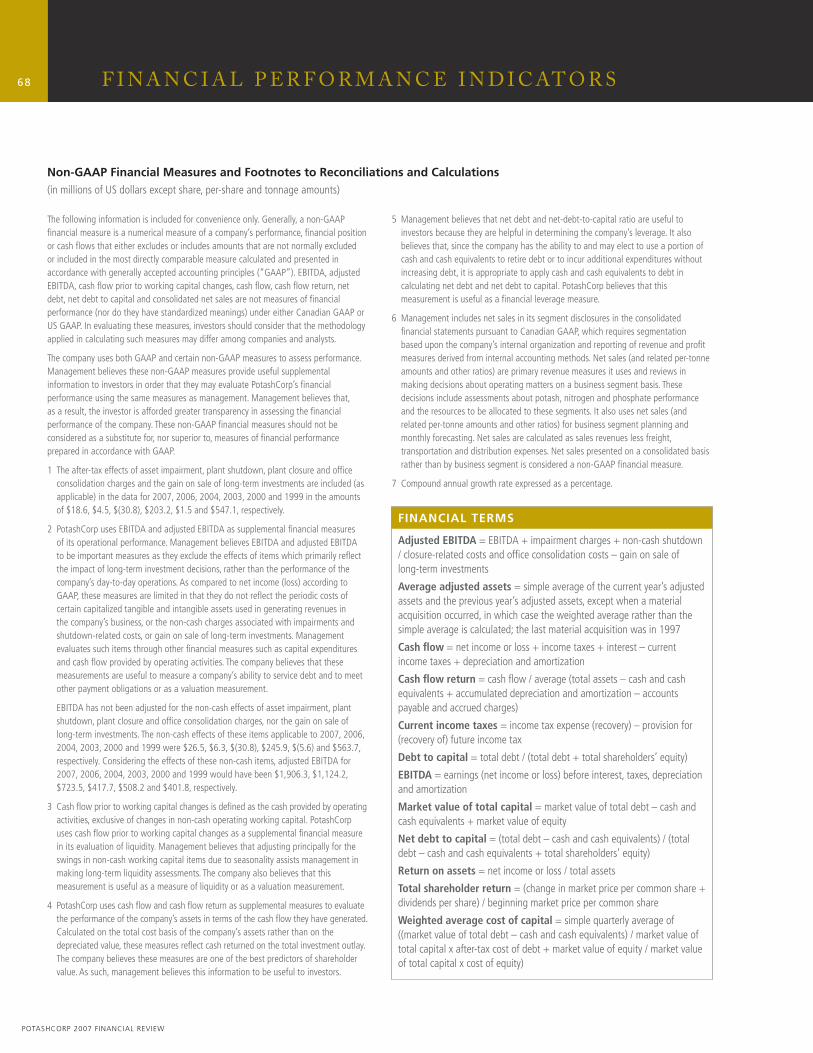
68
POTASHCORP 2007 FINANCIAL REVIEW
The following information is included for convenience only. Generally, a non-GAAP fi nancial measure is a numerical measure of a company’s performance, fi nancial position or cash fl ows that either excludes or includes amounts that are not normally excluded or included in the most directly comparable measure calculated and presented in accordance with generally accepted accounting principles (“GAAP”). EBITDA, adjusted EBITDA, cash fl ow prior to working capital changes, cash fl ow, cash fl ow return, net debt, net debt to capital and consolidated net sales are not measures of fi nancial performance (nor do they have standardized meanings) under either Canadian GAAP or US GAAP. In evaluating these measures, investors should consider that the methodology applied in calculating such measures may differ among companies and analysts.
The company uses both GAAP and certain non-GAAP measures to assess performance. Management believes these non-GAAP measures provide useful supplemental information to investors in order that they may evaluate PotashCorp’s fi nancial performance using the same measures as management. Management believes that, as a result, the investor is afforded greater transparency in assessing the fi nancial performance of the company. These non-GAAP fi nancial measures should not be considered as a substitute for, nor superior to, measures of fi nancial performance prepared in accordance with GAAP.
1 The after-tax effects of asset impairment, plant shutdown, plant closure and offi ce consolidation charges and the gain on sale of long-term investments are included (as applicable) in the data for 2007, 2006, 2004, 2003, 2000 and 1999 in the amounts of $18.6, $4.5, $(30.8), $203.2, $1.5 and $547.1, respectively.
2 PotashCorp uses EBITDA and adjusted EBITDA as supplemental fi nancial measures of its operational performance. Management believes EBITDA and adjusted EBITDA to be important measures as they exclude the effects of items which primarily refl ect the impact of long-term investment decisions, rather than the performance of the company’s day-to-day operations. As compared to net income (loss) according to GAAP, these measures are limited in that they do not refl ect the periodic costs of certain capitalized tangible and intangible assets used in generating revenues in the company’s business, or the non-cash charges associated with impairments and shutdown-related costs, or gain on sale of long-term investments. Management evaluates such items through other fi nancial measures such as capital expenditures and cash fl ow provided by operating activities. The company believes that these measurements are useful to measure a company’s ability to service debt and to meet other payment obligations or as a valuation measurement.
EBITDA has not been adjusted for the non-cash effects of asset impairment, plant shutdown, plant closure and offi ce consolidation charges, nor the gain on sale of long-term investments. The non-cash effects of these items applicable to 2007, 2006, 2004, 2003, 2000 and 1999 were $26.5, $6.3, $(30.8), $245.9, $(5.6) and $563.7, respectively. Considering the effects of these non-cash items, adjusted EBITDA for 2007, 2006, 2004, 2003, 2000 and 1999 would have been $1,906.3, $1,124.2, $723.5, $417.7, $508.2 and $401.8, respectively.
3 Cash fl ow prior to working capital changes is defi ned as the cash provided by operating activities, exclusive of changes in non-cash operating working capital. PotashCorp uses cash fl ow prior to working capital changes as a supplemental fi nancial measure in its evaluation of liquidity. Management believes that adjusting principally for the swings in non-cash working capital items due to seasonality assists management in making long-term liquidity assessments. The company also believes that this measurement is useful as a measure of liquidity or as a valuation measurement.
4 PotashCorp uses cash fl ow and cash fl ow return as supplemental measures to evaluate the performance of the company’s assets in terms of the cash fl ow they have generated. Calculated on the total cost basis of the company’s assets rather than on the depreciated value, these measures refl ect cash returned on the total investment outlay. The company believes these measures are one of the best predictors of shareholder value. As such, management believes this information to be useful to investors.
5 Management believes that net debt and net-debt-to-capital ratio are useful to investors because they are helpful in determining the company’s leverage. It also believes that, since the company has the ability to and may elect to use a portion of cash and cash equivalents to retire debt or to incur additional expenditures without increasing debt, it is appropriate to apply cash and cash equivalents to debt in calculating net debt and net debt to capital. PotashCorp believes that this measurement is useful as a fi nancial leverage measure.
6 Management includes net sales in its segment disclosures in the consolidated fi nancial statements pursuant to Canadian GAAP, which requires segmentation based upon the company’s internal organization and reporting of revenue and profi t measures derived from internal accounting methods. Net sales (and related per-tonne amounts and other ratios) are primary revenue measures it uses and reviews in making decisions about operating matters on a business segment basis. These decisions include assessments about potash, nitrogen and phosphate performance and the resources to be allocated to these segments. It also uses net sales (and related per-tonne amounts and other ratios) for business segment planning and monthly forecasting. Net sales are calculated as sales revenues less freight, transportation and distribution expenses. Net sales presented on a consolidated basis rather than by business segment is considered a non-GAAP fi nancial measure.
7 Compound annual growth rate expressed as a percentage.
F I N A N C I A L P E R F O R M A N C E I N D I C AT O R S
Non-GAAP Financial Measures and Footnotes to Reconciliations and Calculations(in millions of US dollars except share, per-share and tonnage amounts)
FINANCIAL TERMS
Adjusted EBITDA = EBITDA + impairment charges + non-cash shutdown / closure-related costs and offi ce consolidation costs – gain on sale of long-term investments
Average adjusted assets = simple average of the current year’s adjusted assets and the previous year’s adjusted assets, except when a material acquisition occurred, in which case the weighted average rather than the simple average is calculated; the last material acquisition was in 1997
Cash fl ow = net income or loss + income taxes + interest – current income taxes + depreciation and amortization
Cash fl ow return = cash fl ow / average (total assets – cash and cash equivalents + accumulated depreciation and amortization – accounts payable and accrued charges)
Current income taxes = income tax expense (recovery) – provision for (recovery of) future income tax
Debt to capital = total debt / (total debt + total shareholders’ equity)
EBITDA = earnings (net income or loss) before interest, taxes, depreciation and amortization
Market value of total capital = market value of total debt – cash and cash equivalents + market value of equity
Net debt to capital = (total debt – cash and cash equivalents) / (total debt – cash and cash equivalents + total shareholders’ equity)
Return on assets = net income or loss / total assets
Total shareholder return = (change in market price per common share + dividends per share) / beginning market price per common share
Weighted average cost of capital = simple quarterly average of ((market value of total debt – cash and cash equivalents) / market value of total capital x after-tax cost of debt + market value of equity / market value of total capital x cost of equity)
69
MANAGEMENT’S RESPONSIBILITY FOR FINANCIAL REPORTING
Management’s Report on Financial Statements
The accompanying consolidated fi nancial statements and related fi nancial information are the responsibility of PotashCorp management and have been prepared in accordance with accounting principles generally accepted in Canada and include amounts based on estimates and judgments. Financial information included elsewhere in this report is consistent with the consolidated fi nancial statements.
Our independent registered chartered accountants, Deloitte & Touche LLP, provide an audit of the consolidated fi nancial statements, as refl ected in their report for 2007 included on Page 71.
The consolidated fi nancial statements are approved by the Board of Directors on the recommendation of the audit committee.
The audit committee of the Board of Directors is composed of directors who are not offi cers or employees of PotashCorp. PotashCorp’s interim condensed consolidated fi nancial statements and MD&A are discussed and analyzed by the audit committee with management and the independent registered chartered accountants before such information is approved by the committee and submitted to securities commissions or other regulatory authorities. The annual consolidated fi nancial statements and MD&A are also analyzed by the audit committee together with management and the independent registered chartered accountants and are approved by the board.
In addition, the audit committee has the duty to review critical accounting policies and signifi cant estimates and judgments underlying the consolidated fi nancial statements as presented by management, and to approve the fees of the independent registered chartered accountants.
Deloitte & Touche LLP, the independent registered chartered accountants, have full and independent access to the audit committee to discuss their audit and related matters.
Management’s Report on Internal Control over Financial Reporting
Management is responsible for establishing and maintaining an adequate system of internal control over fi nancial reporting. During the past year, we have directed efforts to improve and document our internal control over fi nancial reporting. Internal control over fi nancial reporting is a process designed to provide reasonable assurance regarding the reliability of fi nancial reporting and the preparation of consolidated fi nancial statements for external reporting purposes in accordance with generally accepted accounting principles. Because of its inherent limitations, internal control over fi nancial reporting may not prevent or detect misstatements. Management has assessed the effectiveness of the company’s internal control over fi nancial reporting based on the framework in Internal Control – Integrated Framework issued by the Committee of Sponsoring Organizations of the Treadway Commission (COSO) and concluded that the company’s internal control over fi nancial reporting was effective as of December 31, 2007. The effectiveness of the company’s internal control over fi nancial reporting as of December 31, 2007 has been audited by Deloitte & Touche LLP, as refl ected in their report for 2007 included on Page 70.
W. Doyle W. BrownleePresident and Executive Vice President andChief Executive Offi cer Chief Financial Offi cer
February 15, 2008
MANAGEMENT ’S RESPONSIBILITY
POTASHCORP 2007 FINANCIAL REVIEW
Learn more in our online report:
Keyword: Financials
70
REPORT OF INDEPENDENT REGISTERED CHARTERED ACCOUNTANTS
To the Board of Directors and Shareholders of Potash Corporation of Saskatchewan Inc.
We have audited the internal control over fi nancial reporting of Potash Corporation of Saskatchewan Inc. and subsidiaries (the “Company”) as of December 31, 2007, based on the criteria established in Internal Control – Integrated Framework issued by the Committee of Sponsoring Organizations of the Treadway Commission. The Company’s management is responsible for maintaining effective internal control over fi nancial reporting and for its assessment of the effectiveness of internal control over fi nancial reporting, included in the accompanying Management’s Report on Internal Control Over Financial Reporting. Our responsibility is to express an opinion on the Company’s internal control over fi nancial reporting based on our audit.
We conducted our audit in accordance with the standards of the Public Company Accounting Oversight Board (United States). Those standards require that we plan and perform the audit to obtain reasonable assurance about whether effective internal control over fi nancial reporting was maintained in all material respects. Our audit included obtaining an understanding of internal control over fi nancial reporting, assessing the risk that a material weakness exists, testing and evaluating the design and operating effectiveness of internal control based on assessed risk, and performing such other procedures as we considered necessary in the circumstances. We believe that our audit provides a reasonable basis for our opinion.
A company’s internal control over fi nancial reporting is a process designed by, or under the supervision of, the company’s principal executive and principal fi nancial offi cers, or persons performing similar functions, and effected by the company’s board of directors, management and other personnel to provide reasonable assurance regarding the reliability of fi nancial reporting and the preparation of fi nancial statements for external purposes in accordance with generally accepted accounting principles. A company’s internal control over fi nancial reporting includes those policies and procedures that (1) pertain to the maintenance of records that, in reasonable detail, accurately and fairly refl ect the transactions and dispositions of the assets of the company; (2) provide reasonable assurance that transactions are recorded as necessary to permit preparation of fi nancial statements in accordance with generally accepted accounting principles, and that receipts and expenditures of the company are being made only in accordance with authorizations of management and directors of the company; and (3) provide reasonable assurance regarding prevention or timely detection of unauthorized acquisition, use or disposition of the company’s assets that could have a material effect on the fi nancial statements.
Because of the inherent limitations of internal control over fi nancial reporting, including the possibility of collusion or improper management override of controls, material misstatements due to error or fraud may not be prevented or detected on a timely basis. Also, projections of any evaluation of the effectiveness of the internal control over fi nancial reporting to future periods are subject to the risk that the controls may become inadequate because of changes in conditions, or that the degree of compliance with the policies or procedures may deteriorate.
In our opinion, the Company maintained, in all material respects, effective internal control over fi nancial reporting as of December 31, 2007, based on the criteria established in Internal Control – Integrated Framework issued by the Committee of Sponsoring Organizations of the Treadway Commission.
We have also audited, in accordance with the standards of the Public Company Accounting Oversight Board (United States), the consolidated fi nancial statements of the Company as of and for the year ended December 31, 2007 and our report dated February 15, 2008 expresses an unqualifi ed opinion on these consolidated fi nancial statements and includes an explanatory paragraph referring to changes in the Company’s accounting for fi nancial instruments and for mine stripping costs.
Independent Registered Chartered AccountantsSaskatoon, Canada
February 15, 2008
A C C O U N TA N T S ’ R E P O R T S
POTASHCORP 2007 FINANCIAL REVIEW
71
REPORT OF INDEPENDENT REGISTERED CHARTERED ACCOUNTANTS
To the Board of Directors and Shareholders of Potash Corporation of Saskatchewan Inc.
We have audited the accompanying consolidated statements of fi nancial position of Potash Corporation of Saskatchewan Inc. and subsidiaries (the “Company”) as of December 31, 2007 and 2006, the related consolidated statements of operations and retained earnings and cash fl ow for each of the three years in the period ended December 31, 2007, and the related consolidated statements of comprehensive income and accumulated other comprehensive income for the year ended December 31, 2007. These fi nancial statements are the responsibility of the Company’s management. Our responsibility is to express an opinion on these fi nancial statements based on our audits.
We conducted our audits in accordance with the standards of the Public Company Accounting Oversight Board (United States). Those standards require that we plan and perform the audit to obtain reasonable assurance about whether the fi nancial statements are free of material misstatement. An audit includes examining, on a test basis, evidence supporting the amounts and disclosures in the fi nancial statements. An audit also includes assessing the accounting principles used and signifi cant estimates made by management, as well as evaluating the overall fi nancial statement presentation. We believe that our audits provide a reasonable basis for our opinion.
In our opinion, such consolidated fi nancial statements present fairly, in all material respects, the fi nancial position of Potash Corporation of Saskatchewan Inc. and subsidiaries as of December 31, 2007 and 2006, and the results of their operations and their cash fl ows for each of the three years in the period ended December 31, 2007 in conformity with Canadian generally accepted accounting principles.
As discussed in Note 3 to the consolidated fi nancial statements, in 2007 the Company: (1) changed its method of accounting for fi nancial instruments to conform to Canadian Institute of Chartered Accountants (“CICA”) Handbook Sections 1530 Comprehensive Income, 3251 Equity, 3855 Financial Instruments – Recognition and Measurement, and 3865 Hedges, and (2) changed its method of accounting for mine stripping costs to conform to CICA Emerging Issues Committee Abstract No. 160 Stripping Costs Incurred in the Production Phase of a Mining Operation.
We have also audited, in accordance with the standards of the Public Company Accounting Oversight Board (United States), the Company’s internal control over fi nancial reporting as of December 31, 2007, based on the criteria established in Internal Control – Integrated Framework issued by the Committee of Sponsoring Organizations of the Treadway Commission and our report dated February 15, 2008 expresses an unqualifi ed opinion on the Company’s internal control over fi nancial reporting.
Independent Registered Chartered AccountantsSaskatoon, Canada
February 15, 2008
A C C O U N TA N T S ’ R E P O R T S
POTASHCORP 2007 FINANCIAL REVIEW
72
CONSOLIDATED STATEMENTS OF FINANCIAL POSITION
as at December 31 in millions of US dollars except share amounts
2007 2006
AssetsCurrent assets Cash and cash equivalents $ 719.5 $ 325.7 Accounts receivable (Note 4) 596.2 442.3 Inventories (Note 5) 428.1 501.3 Prepaid expenses and other current assets 36.7 40.9 Current portion of derivative instrument assets (Note 6) 30.8 – 1,811.3 1,310.2Derivative instrument assets (Note 6) 104.2 –Property, plant and equipment (Note 7) 3,887.4 3,525.8Investments (Note 8) 3,581.5 1,148.9Other assets (Note 9) 210.7 105.8Intangible assets (Note 10) 24.5 29.3Goodwill (Note 10) 97.0 97.0 $ 9,716.6 $ 6,217.0
LiabilitiesCurrent liabilities Short-term debt (Note 11) $ 90.0 $ 157.9 Accounts payable and accrued charges (Note 12) 911.7 545.2 Current portion of long-term debt (Note 13) 0.2 400.4 1,001.9 1,103.5Long-term debt (Note 13) 1,339.4 1,357.1Future income tax liability (Note 25) 988.1 632.1Accrued pension and other post-retirement benefi ts (Note 15) 244.8 219.6Accrued environmental costs and asset retirement obligations (Note 16) 121.0 110.3Other non-current liabilities and deferred credits 2.7 14.1 3,697.9 3,436.7
Commitments, Contingencies and Guarantees (Notes 14, 29 and 30, respectively)
Shareholders’ EquityShare capital (Note 17) 1,461.3 1,431.6 Unlimited authorization of common shares without par value; issued and outstanding 316,411,209 and 314,403,147 shares at December 31, 2007 and 2006, respectively Unlimited authorization of fi rst preferred shares; none outstandingContributed surplus (Note 18) 98.9 62.3Accumulated other comprehensive income 2,178.9 –Retained earnings 2,279.6 1,286.4 6,018.7 2,780.3 $ 9,716.6 $ 6,217.0
(See Notes to the Consolidated Financial Statements)
Approved by the Board of Directors,
Director Director
C O N S O L I DAT E D F I N A N C I A L S TAT E M E N T S
POTASHCORP 2007 FINANCIAL REVIEW
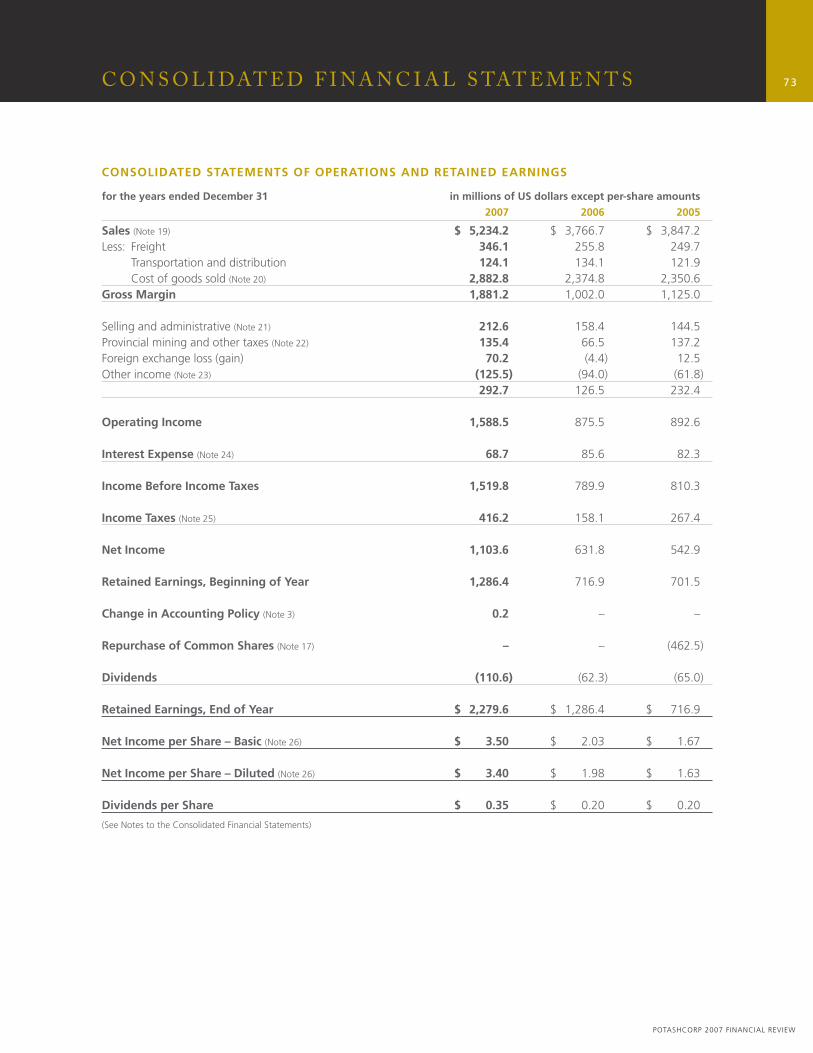
73
CONSOLIDATED STATEMENTS OF OPERATIONS AND RETAINED EARNINGS
for the years ended December 31 in millions of US dollars except per-share amounts
2007 2006 2005
Sales (Note 19) $ 5,234.2 $ 3,766.7 $ 3,847.2 Less: Freight 346.1 255.8 249.7 Transportation and distribution 124.1 134.1 121.9 Cost of goods sold (Note 20) 2,882.8 2,374.8 2,350.6Gross Margin 1,881.2 1,002.0 1,125.0
Selling and administrative (Note 21) 212.6 158.4 144.5Provincial mining and other taxes (Note 22) 135.4 66.5 137.2Foreign exchange loss (gain) 70.2 (4.4) 12.5Other income (Note 23) (125.5) (94.0) (61.8) 292.7 126.5 232.4
Operating Income 1,588.5 875.5 892.6
Interest Expense (Note 24) 68.7 85.6 82.3
Income Before Income Taxes 1,519.8 789.9 810.3
Income Taxes (Note 25) 416.2 158.1 267.4
Net Income 1,103.6 631.8 542.9
Retained Earnings, Beginning of Year 1,286.4 716.9 701.5
Change in Accounting Policy (Note 3) 0.2 – –
Repurchase of Common Shares (Note 17) – – (462.5)
Dividends (110.6) (62.3) (65.0)
Retained Earnings, End of Year $ 2,279.6 $ 1,286.4 $ 716.9
Net Income per Share – Basic (Note 26) $ 3.50 $ 2.03 $ 1.67
Net Income per Share – Diluted (Note 26) $ 3.40 $ 1.98 $ 1.63
Dividends per Share $ 0.35 $ 0.20 $ 0.20
(See Notes to the Consolidated Financial Statements)
C O N S O L I DAT E D F I N A N C I A L S TAT E M E N T S
POTASHCORP 2007 FINANCIAL REVIEW
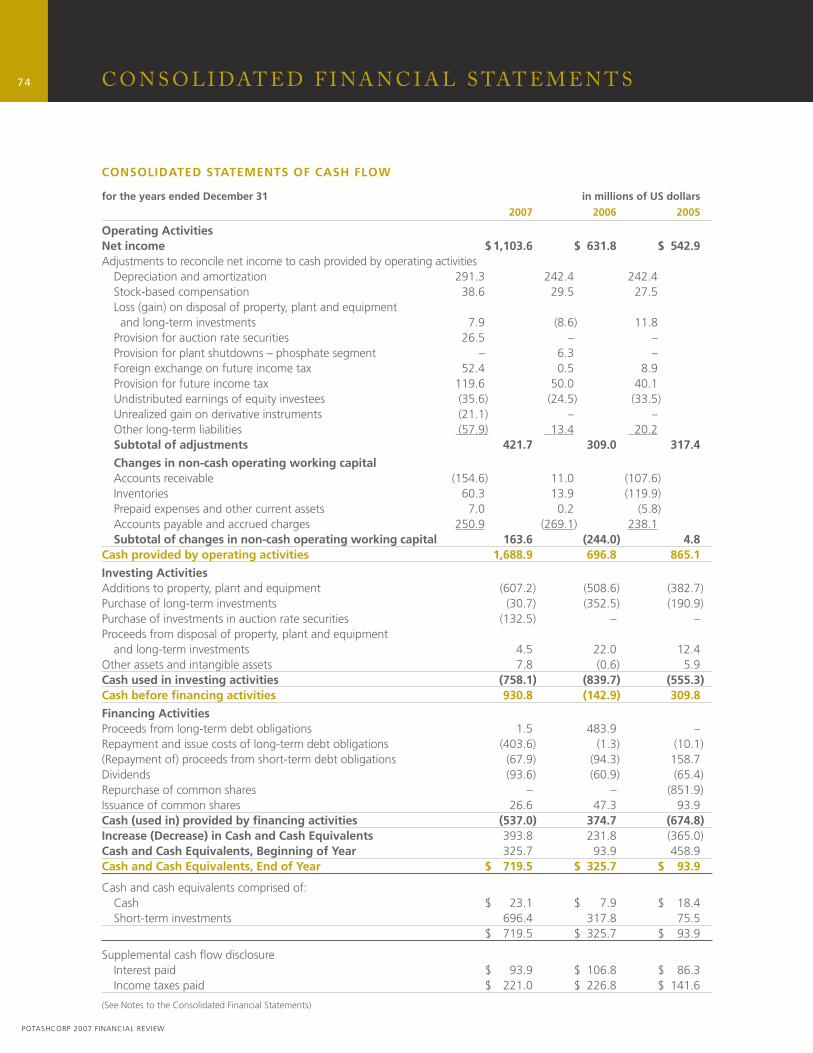
74
CONSOLIDATED STATEMENTS OF CASH FLOW
for the years ended December 31 in millions of US dollars
2007 2006 2005
Operating ActivitiesNet income $ 1,103.6 $ 631.8 $ 542.9Adjustments to reconcile net income to cash provided by operating activities Depreciation and amortization 291.3 242.4 242.4 Stock-based compensation 38.6 29.5 27.5 Loss (gain) on disposal of property, plant and equipment and long-term investments 7.9 (8.6) 11.8 Provision for auction rate securities 26.5 – – Provision for plant shutdowns – phosphate segment – 6.3 – Foreign exchange on future income tax 52.4 0.5 8.9 Provision for future income tax 119.6 50.0 40.1 Undistributed earnings of equity investees (35.6) (24.5) (33.5) Unrealized gain on derivative instruments (21.1) – – Other long-term liabilities (57.9) 13.4 20.2 Subtotal of adjustments 421.7 309.0 317.4
Changes in non-cash operating working capital Accounts receivable (154.6) 11.0 (107.6) Inventories 60.3 13.9 (119.9) Prepaid expenses and other current assets 7.0 0.2 (5.8) Accounts payable and accrued charges 250.9 (269.1) 238.1 Subtotal of changes in non-cash operating working capital 163.6 (244.0) 4.8Cash provided by operating activities 1,688.9 696.8 865.1
Investing ActivitiesAdditions to property, plant and equipment (607.2) (508.6) (382.7)Purchase of long-term investments (30.7) (352.5) (190.9)Purchase of investments in auction rate securities (132.5) – –Proceeds from disposal of property, plant and equipment and long-term investments 4.5 22.0 12.4Other assets and intangible assets 7.8 (0.6) 5.9Cash used in investing activities (758.1) (839.7) (555.3)Cash before fi nancing activities 930.8 (142.9) 309.8
Financing ActivitiesProceeds from long-term debt obligations 1.5 483.9 –Repayment and issue costs of long-term debt obligations (403.6) (1.3) (10.1)(Repayment of) proceeds from short-term debt obligations (67.9) (94.3) 158.7Dividends (93.6) (60.9) (65.4)Repurchase of common shares – – (851.9)Issuance of common shares 26.6 47.3 93.9Cash (used in) provided by fi nancing activities (537.0) 374.7 (674.8)Increase (Decrease) in Cash and Cash Equivalents 393.8 231.8 (365.0)Cash and Cash Equivalents, Beginning of Year 325.7 93.9 458.9Cash and Cash Equivalents, End of Year $ 719.5 $ 325.7 $ 93.9
Cash and cash equivalents comprised of: Cash $ 23.1 $ 7.9 $ 18.4 Short-term investments 696.4 317.8 75.5 $ 719.5 $ 325.7 $ 93.9
Supplemental cash fl ow disclosure Interest paid $ 93.9 $ 106.8 $ 86.3 Income taxes paid $ 221.0 $ 226.8 $ 141.6
(See Notes to the Consolidated Financial Statements)
C O N S O L I DAT E D F I N A N C I A L S TAT E M E N T S
POTASHCORP 2007 FINANCIAL REVIEW
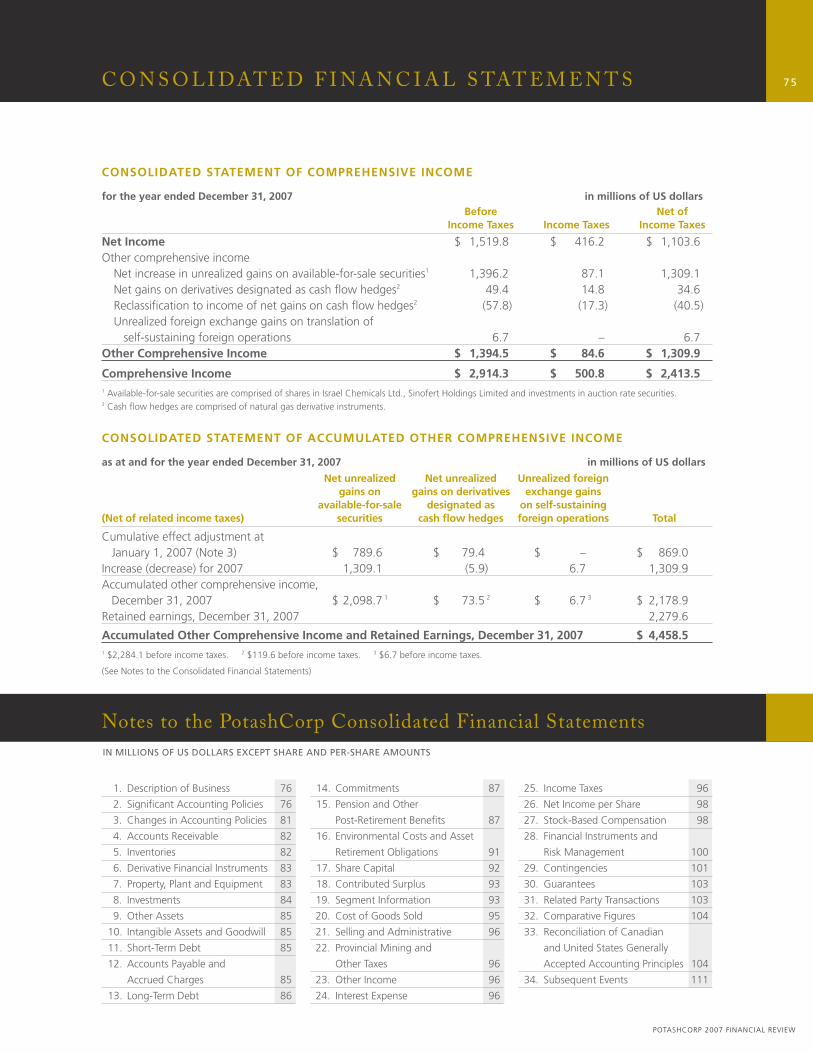
75
CONSOLIDATED STATEMENT OF COMPREHENSIVE INCOME
for the year ended December 31, 2007 in millions of US dollars Before Net of Income Taxes Income Taxes Income Taxes
Net Income $ 1,519.8 $ 416.2 $ 1,103.6 Other comprehensive income Net increase in unrealized gains on available-for-sale securities1 1,396.2 87.1 1,309.1 Net gains on derivatives designated as cash fl ow hedges2 49.4 14.8 34.6 Reclassifi cation to income of net gains on cash fl ow hedges2 (57.8) (17.3) (40.5) Unrealized foreign exchange gains on translation of self-sustaining foreign operations 6.7 – 6.7Other Comprehensive Income $ 1,394.5 $ 84.6 $ 1,309.9
Comprehensive Income $ 2,914.3 $ 500.8 $ 2,413.51 Available-for-sale securities are comprised of shares in Israel Chemicals Ltd., Sinofert Holdings Limited and investments in auction rate securities.2 Cash fl ow hedges are comprised of natural gas derivative instruments.
Notes to the PotashCorp Consolidated Financial StatementsIN MILLIONS OF US DOLLARS EXCEPT SHARE AND PER-SHARE AMOUNTS
CONSOLIDATED STATEMENT OF ACCUMULATED OTHER COMPREHENSIVE INCOME
as at and for the year ended December 31, 2007 in millions of US dollars
Net unrealized Net unrealized Unrealized foreign gains on gains on derivatives exchange gains available-for-sale designated as on self-sustaining (Net of related income taxes) securities cash fl ow hedges foreign operations Total
Cumulative effect adjustment at January 1, 2007 (Note 3) $ 789.6 $ 79.4 $ – $ 869.0Increase (decrease) for 2007 1,309.1 (5.9) 6.7 1,309.9Accumulated other comprehensive income, December 31, 2007 $ 2,098.7 1 $ 73.5 2 $ 6.7 3 $ 2,178.9Retained earnings, December 31, 2007 2,279.6
Accumulated Other Comprehensive Income and Retained Earnings, December 31, 2007 $ 4,458.51 $2,284.1 before income taxes. 2 $119.6 before income taxes. 3 $6.7 before income taxes.
(See Notes to the Consolidated Financial Statements)
1. Description of Business 76
2. Signifi cant Accounting Policies 76
3. Changes in Accounting Policies 81
4. Accounts Receivable 82
5. Inventories 82
6. Derivative Financial Instruments 83
7. Property, Plant and Equipment 83
8. Investments 84
9. Other Assets 85
10. Intangible Assets and Goodwill 85
11. Short-Term Debt 85
12. Accounts Payable and
Accrued Charges 85
13. Long-Term Debt 86
14. Commitments 87
15. Pension and Other
Post-Retirement Benefi ts 87
16. Environmental Costs and Asset
Retirement Obligations 91
17. Share Capital 92
18. Contributed Surplus 93
19. Segment Information 93
20. Cost of Goods Sold 95
21. Selling and Administrative 96
22. Provincial Mining and
Other Taxes 96
23. Other Income 96
24. Interest Expense 96
25. Income Taxes 96
26. Net Income per Share 98
27. Stock-Based Compensation 98
28. Financial Instruments and
Risk Management 100
29. Contingencies 101
30. Guarantees 103
31. Related Party Transactions 103
32. Comparative Figures 104
33. Reconciliation of Canadian
and United States Generally
Accepted Accounting Principles 104
34. Subsequent Events 111
C O N S O L I DAT E D F I N A N C I A L S TAT E M E N T S
POTASHCORP 2007 FINANCIAL REVIEW
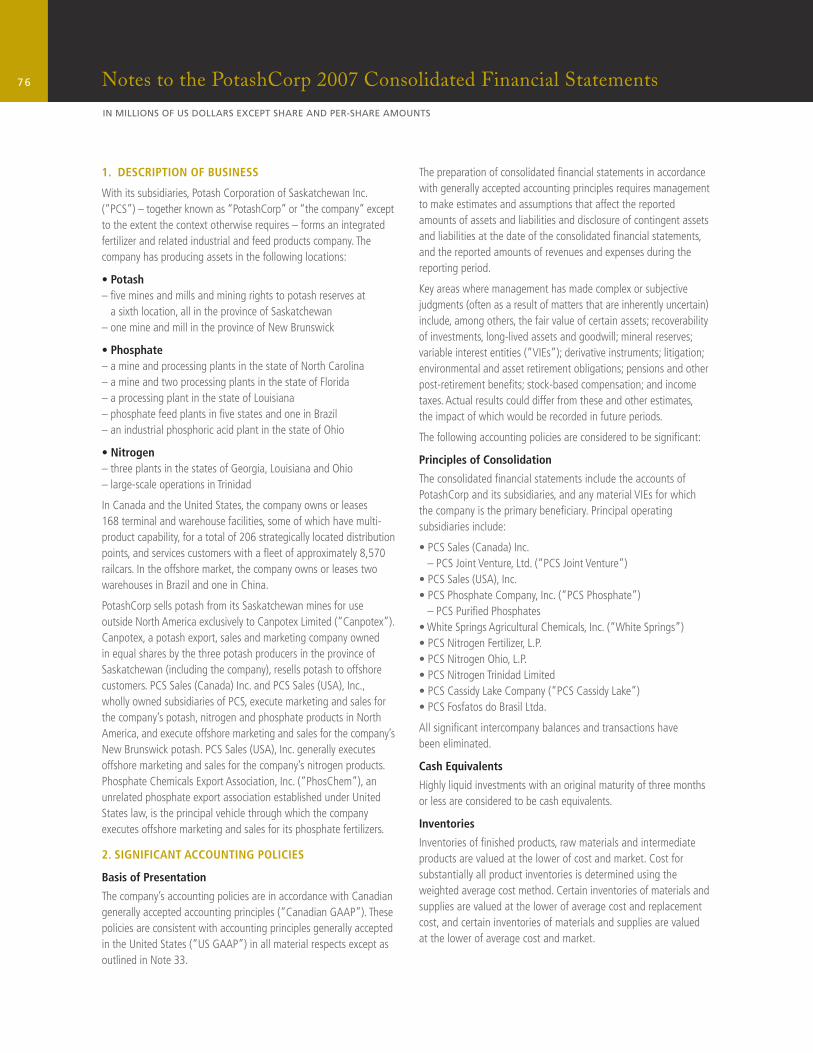
76 Notes to the PotashCorp 2007 Consolidated Financial Statements
IN MILLIONS OF US DOLLARS EXCEPT SHARE AND PER-SHARE AMOUNTS
1. DESCRIPTION OF BUSINESS
With its subsidiaries, Potash Corporation of Saskatchewan Inc. (“PCS”) – together known as “PotashCorp” or “the company” except to the extent the context otherwise requires – forms an integrated fertilizer and related industrial and feed products company. The company has producing assets in the following locations:
• Potash– fi ve mines and mills and mining rights to potash reserves at
a sixth location, all in the province of Saskatchewan– one mine and mill in the province of New Brunswick
• Phosphate– a mine and processing plants in the state of North Carolina– a mine and two processing plants in the state of Florida– a processing plant in the state of Louisiana– phosphate feed plants in fi ve states and one in Brazil– an industrial phosphoric acid plant in the state of Ohio
• Nitrogen– three plants in the states of Georgia, Louisiana and Ohio– large-scale operations in Trinidad
In Canada and the United States, the company owns or leases 168 terminal and warehouse facilities, some of which have multi-product capability, for a total of 206 strategically located distribution points, and services customers with a fl eet of approximately 8,570 railcars. In the offshore market, the company owns or leases two warehouses in Brazil and one in China.
PotashCorp sells potash from its Saskatchewan mines for use outside North America exclusively to Canpotex Limited (“Canpotex”). Canpotex, a potash export, sales and marketing company owned in equal shares by the three potash producers in the province of Saskatchewan (including the company), resells potash to offshore customers. PCS Sales (Canada) Inc. and PCS Sales (USA), Inc., wholly owned subsidiaries of PCS, execute marketing and sales for the company’s potash, nitrogen and phosphate products in North America, and execute offshore marketing and sales for the company’s New Brunswick potash. PCS Sales (USA), Inc. generally executes offshore marketing and sales for the company’s nitrogen products. Phosphate Chemicals Export Association, Inc. (“PhosChem”), an unrelated phosphate export association established under United States law, is the principal vehicle through which the company executes offshore marketing and sales for its phosphate fertilizers.
2. SIGNIFICANT ACCOUNTING POLICIES
Basis of Presentation
The company’s accounting policies are in accordance with Canadian generally accepted accounting principles (“Canadian GAAP”). These policies are consistent with accounting principles generally accepted in the United States (“US GAAP”) in all material respects except as outlined in Note 33.
The preparation of consolidated fi nancial statements in accordance with generally accepted accounting principles requires management to make estimates and assumptions that affect the reported amounts of assets and liabilities and disclosure of contingent assets and liabilities at the date of the consolidated fi nancial statements, and the reported amounts of revenues and expenses during the reporting period.
Key areas where management has made complex or subjective judgments (often as a result of matters that are inherently uncertain) include, among others, the fair value of certain assets; recoverability of investments, long-lived assets and goodwill; mineral reserves; variable interest entities (“VIEs”); derivative instruments; litigation; environmental and asset retirement obligations; pensions and other post-retirement benefi ts; stock-based compensation; and income taxes. Actual results could differ from these and other estimates, the impact of which would be recorded in future periods.
The following accounting policies are considered to be signifi cant:
Principles of Consolidation
The consolidated fi nancial statements include the accounts of PotashCorp and its subsidiaries, and any material VIEs for which the company is the primary benefi ciary. Principal operating subsidiaries include:
• PCS Sales (Canada) Inc. – PCS Joint Venture, Ltd. (“PCS Joint Venture”)• PCS Sales (USA), Inc.• PCS Phosphate Company, Inc. (“PCS Phosphate”) – PCS Purifi ed Phosphates• White Springs Agricultural Chemicals, Inc. (“White Springs”)• PCS Nitrogen Fertilizer, L.P.• PCS Nitrogen Ohio, L.P.• PCS Nitrogen Trinidad Limited• PCS Cassidy Lake Company (“PCS Cassidy Lake”)• PCS Fosfatos do Brasil Ltda.
All signifi cant intercompany balances and transactions have been eliminated.
Cash Equivalents
Highly liquid investments with an original maturity of three months or less are considered to be cash equivalents.
Inventories
Inventories of fi nished products, raw materials and intermediate products are valued at the lower of cost and market. Cost for substantially all product inventories is determined using the weighted average cost method. Certain inventories of materials and supplies are valued at the lower of average cost and replacement cost, and certain inventories of materials and supplies are valued at the lower of average cost and market.
77Notes to the PotashCorp 2007 Consolidated Financial Statements
IN MILLIONS OF US DOLLARS EXCEPT SHARE AND PER-SHARE AMOUNTS
Prepaid Expenses
Prepaid expenses include prepaid freight and throughput costs relating to product inventory stored at warehouse and terminal facilities.
Derivative Financial Instruments
See Note 3 for changes in accounting policies in 2007. The following refl ects policies in place for 2007.
Derivative fi nancial instruments are used by the company to manage its exposure to exchange rate, interest rate and commodity price fl uctuations. The company recognizes its derivative instruments at fair value on the Consolidated Statements of Financial Position where appropriate. Contracts to buy or sell a non-fi nancial item that can be settled net in cash or another fi nancial instrument, or by exchanging fi nancial instruments, as if the contracts were fi nancial instruments (except contracts that were entered into and continue to be held for the purpose of the receipt or delivery of a non-fi nancial item in accordance with expected purchase, sale or usage requirements), are accounted for as fi nancial instruments.
The accounting for changes in the fair value (i.e. gains or losses) of a derivative instrument depends on whether it has been designated and qualifi es as part of a hedging relationship. For strategies designated as fair value hedges, the effective portion of the change in the fair value of the derivative is offset in income against the change in fair value, attributed to the risk being hedged, of the underlying hedged asset, liability or fi rm commitment. For cash fl ow hedges, the effective portion of the change in the fair value of the derivative is accumulated in other comprehensive income (“OCI”) until the variability in cash fl ows being hedged is recognized in earnings in future accounting periods. Ineffective portions of hedges are recorded in earnings in the current period. The change in fair value of derivative instruments not designated as hedges is recorded in income in the current period. For transitional purposes, the company has elected to record embedded derivatives only for contracts entered into or substantively modifi ed on or after January 1, 2003.
The company’s policy is not to use derivative fi nancial instruments for trading or speculative purposes, although it may choose not to designate a relationship as an accounting hedge. The company formally documents all relationships between hedging instruments and hedged items, as well as its risk management objective and strategy for undertaking the hedge transaction. This process includes linking derivatives to specifi c assets and liabilities or to specifi c fi rm commitments or forecast transactions. The company also assesses, both at the hedge’s inception and on an ongoing basis, whether the derivatives used in hedging transactions are highly effective in offsetting changes in fair values of hedged items. A hedging relationship is terminated if the hedge ceases to be effective; if the underlying asset or liability being hedged is derecognized or if it is no longer probable that the anticipated transaction will occur; or if
the derivative instrument is no longer designated as a hedging instrument. If a hedging relationship is terminated, the difference between the fair value and the accrued value of the hedging derivatives upon termination is deferred and recognized into earnings on the same basis as gains, losses, revenue and expenses of the previously hedged item are recognized.
Signifi cant recent derivatives include the following:
• Natural gas futures, swaps and option agreements to manage the cost of natural gas, generally designated as cash fl ow hedges of anticipated transactions. The portion of gain or loss on derivative instruments designated as cash fl ow hedges that are deferred in accumulated other comprehensive income (“AOCI”) is reclassifi ed into cost of goods sold when the product containing the hedged item impacts earnings. Any hedge ineffectiveness is recorded in cost of goods sold in the current period.
• Interest rate swaps designated as fair value hedges to manage the interest rate mix of the company’s total debt portfolio and related overall cost of borrowing. Hedge accounting treatment results in interest expense on the related debt being refl ected at hedged rates rather than original contractual interest rates.
• Foreign currency forward contracts for the primary purpose of limiting exposure to exchange rate fl uctuations relating to expenditures denominated in currencies other than the US dollar. These contracts are not designated as hedging instruments for accounting purposes. Accordingly, they are marked-to-market with changes in fair value recognized through foreign exchange gain or loss in earnings.
• Agreement for the forward purchase of shares of Sinofert at a fi xed Hong Kong dollar amount per share. This contract was not designated as a hedging instrument for accounting purposes. Accordingly, changes in fair value are recognized through other income in earnings.
Property, Plant and Equipment
Property, plant and equipment (which includes certain mine development costs and pre-stripping costs) are carried at cost. Costs of additions, betterments, renewals and interest during construction are capitalized.
Maintenance and repair expenditures that do not improve or extend productive life are expensed in the year incurred.
Certain mining and milling assets are depreciated using the units of production method based on the shorter of estimates of reserves or service lives. Pre-stripping costs are amortized on a unit-of-production basis over the ore mined from the mineable acreage stripped. Other asset classes are depreciated or amortized on a straight-line basis as follows: land improvements 5 to 40 years, buildings and improvements 6 to 40 years and machinery and equipment (comprised primarily of plant equipment) 20 to 40 years.
2. Signifi cant Accounting Policies continued
78 Notes to the PotashCorp 2007 Consolidated Financial Statements
IN MILLIONS OF US DOLLARS EXCEPT SHARE AND PER-SHARE AMOUNTS
Investments
Investments in which the company exercises signifi cant infl uence (but does not control) are accounted for using the equity method. The proportionate share of any net income or losses from investments accounted for using the equity method, and any gain or loss on disposal, are recorded in other income. The fair value for investments designated as available-for-sale is recorded in the Consolidated Statements of Financial Position, with unrealized gains and losses, net of related income taxes, recorded in AOCI. The cost of securities sold is based on the specifi c identifi cation method. Realized gains and losses, including any other-than-temporary decline in value, on these debt and equity securities are removed from AOCI and recorded in net income.
An investment is considered impaired if its fair value falls below its cost and the decline is considered other-than-temporary. Factors the company considers in determining whether a decline is temporary include the length of time and extent to which fair value has been below cost, the fi nancial condition and near-term prospects of the investee, and the company’s ability and intent to hold the investment for a period of time suffi cient to allow for any anticipated recovery. When there has been a decline in value that is other-than-temporary, the carrying value of the investment is appropriately reduced.
Other Assets
Preproduction costs are capitalized to deferred charges and represent costs incurred prior to obtaining commercial production at new facilities, net of revenue earned, and are amortized on either a straight-line or units of production basis over a maximum of 10 years.
The costs of constructing bases for gypsum stacks and settling ponds are capitalized to deferred charges and are amortized on a straight-line basis over their estimated useful lives of 3 to 5 years.
Costs of readying sites for future mining activities are capitalized to other assets and are amortized on a units of production basis over a maximum of 40 years. In addition, certain up-front lease costs are capitalized to other assets and amortized over the life of the leases, the latest of which is expected to extend through 2038 when fi nalized.
Intangible Assets
Finite-lived intangible assets are amortized on a straight-line basis over their estimated useful lives as follows: production and technology rights 25 to 30 years and computer software up to 5 years.
Goodwill
All business combinations are accounted for using the purchase method. Identifi able intangible assets are recognized separately from goodwill. Goodwill is carried at cost, is not amortized and represents the excess of the purchase price and related costs over the fair value assigned to the net identifi able assets of a business acquired.
Asset Impairment
The company reviews both long-lived assets to be held and used and identifi able intangible assets with fi nite lives whenever events or changes in circumstances indicate that the carrying amount of such assets may not be fully recoverable. Determination of recoverability is based on an estimate of undiscounted future cash fl ows resulting from the use of the asset and its eventual disposition. Measurement of an impairment loss for long-lived assets and certain identifi able intangible assets that management expects to hold and use is based on the fair value of the assets, whereas such assets to be disposed of are reported at the lower of carrying amount or fair value less costs to sell.
Goodwill impairment is assessed at the reporting unit level at least annually (in April), or more frequently if events or circumstances indicate there may be an impairment. Reporting units comprise business operations with similar economic characteristics and strategies and may represent either a business segment or a business unit within a business segment. Potential impairment is identifi ed when the carrying value of a reporting unit, including the allocated goodwill, exceeds its fair value. Goodwill impairment is measured as the excess of the carrying amount of the reporting unit’s allocated goodwill over the implied fair value of the goodwill, based on the fair value of the assets and liabilities of the reporting unit.
Leases
Leases entered into are classifi ed as either capital or operating leases. Leases that transfer substantially all of the benefi ts and risks of ownership of property to the company are accounted for as capital leases. Equipment acquired under capital leases is depreciated over the period of expected use on the same basis as other similar property, plant and equipment. Gains or losses resulting from sale/leaseback transactions are deferred and amortized in proportion to the amortization of the leased asset. Rental payments under operating leases are expensed as incurred.
Long-Term Debt
See Note 3 for changes in accounting policies in 2007. The following refl ects policies in place for 2007.
Issue costs of long-term obligations and gains and losses on interest rate swaps are capitalized to long-term obligations and are amortized to expense over the term of the related liability using the effective interest rate method.
Pension and Other Post-Retirement Benefi ts
The company offers a number of benefi t plans that provide pension and other benefi ts to qualifi ed employees. These plans include defi ned benefi t pension plans, supplemental pension plans, defi ned contribution plans and health, disability, dental and life insurance plans.
2. Signifi cant Accounting Policies continued
79Notes to the PotashCorp 2007 Consolidated Financial Statements
IN MILLIONS OF US DOLLARS EXCEPT SHARE AND PER-SHARE AMOUNTS
The company accrues its obligations under employee benefi t plans and the related costs, net of plan assets. The cost of pensions and other retirement benefi ts earned by employees is generally actuarially determined using the projected benefi t method prorated on service and management’s best estimate of expected plan investment performance, salary escalation, retirement ages of employees and expected health-care costs. For the purpose of calculating the expected return on plan assets, those assets are valued at fair value. Prior service costs from plan amendments are deferred and amortized on a straight-line basis over the average remaining service period of employees active at the date of amendment. Actuarial gains (losses) arise from the difference between actual long-term rate of return on plan assets for a period and the expected long-term rate of return on plan assets for that period, or from changes in actuarial assumptions used to determine the accrued benefi t obligation. The excess of the net accumulated actuarial gain (loss) over 10 percent of the greater of the benefi t obligation and the fair value of plan assets is amortized over the average remaining service period of active employees. When the restructuring of a benefi t plan gives rise to both a curtailment and a settlement of obligations, the curtailment is accounted for prior to the settlement. Actuaries perform valuations on a regular basis to determine the actuarial present value of the accrued pension and other post-retirement benefi ts.
Pension and other post-retirement benefi t expense includes, as applicable, the net of management’s best estimate of the cost of benefi ts provided, interest cost of projected benefi ts, return on plan assets, amortization of experience gains or losses and plan amendments, and changes in the valuation allowance.
Defi ned contribution plan costs are recognized in earnings for services rendered by employees during the period.
Environmental Costs and Asset Retirement Obligations
Environmental costs that relate to current operations are expensed or capitalized as appropriate. Environmental costs are capitalized if the costs extend the life of the property, increase its capacity, mitigate or prevent contamination from future operations, or relate to legal asset retirement obligations. Costs that relate to existing conditions caused by past operations and that do not contribute to current or future revenue generation are expensed. Provisions for estimated costs are recorded when environmental remedial efforts are likely and the costs can be reasonably estimated. In determining the provisions, the company uses the most current information available, including similar past experiences, available technology, regulations in effect, the timing of remediation and cost-sharing arrangements.
The company recognizes its obligations to retire certain tangible long-lived assets. The fair value of a liability for an asset retirement obligation is recognized in the period in which it is incurred if a reasonable estimate of fair value can be made. The associated asset retirement costs are capitalized as part of the carrying amount of the
long-lived asset and then amortized over its estimated useful life. In subsequent periods, the asset retirement obligation is adjusted for the passage of time and any changes in the amount or timing of the underlying future cash fl ows through charges to earnings. A gain or loss may be incurred upon settlement of the liability.
Income Taxes
Taxation on earnings comprises current and future income tax. Taxation is recognized in the income statement except to the extent that it relates to items recognized directly in OCI, in which case the tax is recognized in OCI.
Current income tax is the expected income tax payable on the taxable income for the year using rates enacted or substantively enacted at the year-end, and includes any adjustment to income tax payable in respect of previous years. Future income tax is provided using the asset and liability method whereby future income tax assets and liabilities are recognized for temporary differences between fi nancial statement carrying amounts of assets and liabilities and their respective income tax bases. The tax effect of certain temporary differences is not recognized, principally with respect to temporary differences relating to investments in subsidiaries, jointly controlled entities and associates to the extent that the company is able to control the reversal of the temporary difference and the temporary difference is not expected to reverse in the foreseeable future. The amount of future income tax recognized is based on the expected manner and timing of realization or settlement of the carrying amount of assets and liabilities. Future income tax assets are recorded in the fi nancial statements if realization is considered more likely than not. A valuation allowance is established, if necessary, to reduce any future income tax asset to an amount that is more likely than not to be realized. Future income tax assets and liabilities are offset to the extent that they relate to income taxes levied on the same taxable entity by the same taxation authority.
Stock-Based Compensation Plans
Grants under the company’s stock-based compensation plans are accounted for in accordance with the fair value-based method of accounting. For stock option plans that will settle through the issuance of equity, the fair value of stock options is determined on their grant date using a valuation model and recorded as compensation expense over the period that the stock options vest, with a corresponding increase to contributed surplus. Forfeitures are estimated throughout the vesting period based on past experience and future expectations, and trued up upon actual option vesting. When stock options are exercised, the proceeds, together with the amount recorded in contributed surplus, are recorded in share capital.
Stock-based plans that are likely to settle in cash or other assets are accounted for as liabilities based on the intrinsic value of the awards. The compensation expense is accrued over the vesting
2. Signifi cant Accounting Policies continued
80 Notes to the PotashCorp 2007 Consolidated Financial Statements
IN MILLIONS OF US DOLLARS EXCEPT SHARE AND PER-SHARE AMOUNTS
period of the award, based on the difference between the market value of the underlying stock and the exercise price of the award, if any. Fluctuations in the market value of the underlying stock determined based on the closing price of the stock on the last day of each reporting period will result in a change to the accrued compensation expense, which is recognized in the period in which the fl uctuation occurs.
Foreign Exchange Transactions
The company’s functional currency is the US dollar.
The majority of the company’s operations are considered integrated and are translated into US dollars using the temporal method. Under this method, Canadian, Trinidadian and Chilean dollar operating transactions are translated to US dollars at the average exchange rate for the previous month. Monetary assets and liabilities are translated at period-end exchange rates. Non-monetary assets owned at December 31, 1994 have been translated under the translation of convenience method at the December 31, 1994 year-end exchange rate of US $1.00 = Cdn $1.4028. Additions subsequent to December 31, 1994 are translated at the exchange rate prevailing at the time of the transaction. Translation exchange gains and losses of integrated foreign operations are refl ected in earnings.
The company’s Brazilian operations are considered self-sustaining and are translated into US dollars using the current rate method whereby assets and liabilities are translated at period-end exchange rates and transactions are translated at the rates in effect at the time. The gain or loss on translation is refl ected in other comprehensive income.
Fair Value
Fair value represents point-in-time estimates that may change in subsequent reporting periods due to market conditions or other factors.
The fair values for non-fi nancial instruments are estimated using accepted valuation methodologies such as discounted future net cash fl ows, earnings multiples or prices for similar assets, whichever is most appropriate under the circumstances.
Estimated fair values for fi nancial instruments are designed to approximate amounts at which the instruments could be exchanged in a current transaction between willing parties. Futures contracts are exchange-traded and fair value is determined based on exchange prices. Fair value for other forward contracts with underlyings that are exchange-traded is determined based on these prices. Swaps and option agreements are traded in the over-the-counter market and fair value is calculated based on models and other valuation techniques that include prices sourced from observable data. Fair value for investments in equity securities and other investments designated as available-for-sale is based on the closing bid price as of the balance sheet date. Fair value for
investments in auction rate securities in the company’s trading account, which represent debt securities designated as available-for-sale that are currently considered to be illiquid, is based on valuation techniques that refl ect the company’s own expectations about the assumptions that market participants would use in pricing the asset in a current transaction (including information obtained on transactions in the marketplace for other investments that may be considered similar, information on the expected cash fl ows based on position of priority within the tranches, information on the expected cash fl ows based on information available regarding the underlying securities, and assumptions about risk) as of the balance sheet date.
Revenue Recognition
Sales revenue is recognized when the product is shipped, the sales price is determinable and collectability is reasonably assured. Revenue is recorded based on the FOB mine, plant, warehouse or terminal price, except for certain vessel sales or specifi c product sales that are shipped on a delivered basis. Transportation costs are recovered from the customer through sales pricing.
Recent Accounting Pronouncements
Determining the Variability to be Considered in Applying the Variable Interest Entity Standards
In September 2006, the Emerging Issues Committee issued Abstract No. 163, “Determining the Variability to be Considered in Applying AcG-15” (“EIC-163”). This guidance provides additional clarifi cation on how to analyze and consolidate a variable interest entity (“VIE”). EIC-163 concludes that the “by-design” approach should be the method used to assess variability (that is created by risks the entity is designed to create and pass along to its interest holders) when applying the VIE standards. The “by-design” approach focuses on the substance of the risks created over the form of the relationship. The guidance may be applied to all entities (including newly created entities) with which an enterprise fi rst becomes involved, and to all entities previously required to be analyzed under the VIE standards when a reconsideration event has occurred, effective January 1, 2007. The implementation of this guidance did not have a material impact on the company’s consolidated fi nancial statements.
Capital Disclosures
In December 2006, the Canadian Institute of Chartered Accountants (“CICA”) issued Section 1535, “Capital Disclosures”. This Section establishes standards for disclosing information about an entity’s capital and how it is managed. This Section applies to interim and annual fi nancial statements relating to fi scal years beginning on or after October 1, 2007, and is not expected to have a material impact on the company’s consolidated fi nancial statements.
Financial Instruments
Effective January 1, 2007, the company adopted CICA Section 3861, “Financial Instruments – Disclosure and Presentation”, which
2. Signifi cant Accounting Policies continued
81Notes to the PotashCorp 2007 Consolidated Financial Statements
IN MILLIONS OF US DOLLARS EXCEPT SHARE AND PER-SHARE AMOUNTS
requires entities to provide disclosures in their fi nancial statements that enable users to evaluate: (1) the signifi cance of fi nancial instruments for the entity’s fi nancial position and performance; and (2) the nature and extent of risks arising from fi nancial instruments to which the entity is exposed during the period and at the balance sheet date, and how the entity manages those risks.
In December 2006, the CICA issued Section 3863, “Financial Instruments – Presentation”, to enhance fi nancial statement users’ understanding of the signifi cance of fi nancial instruments to an entity’s fi nancial position, performance and cash fl ows. This Section establishes standards for presentation of fi nancial instruments and non-fi nancial derivatives. It deals with the classifi cation of fi nancial instruments, from the perspective of the issuer, between liabilities and equity, the classifi cation of related interest, dividends, losses and gains, and the circumstances in which fi nancial assets and fi nancial liabilities are offset. This standard harmonizes disclosures with International Financial Reporting Standards. This Section applies to interim and annual fi nancial statements relating to fi scal years beginning on or after October 1, 2007, and is not expected to have a material impact on the company’s consolidated fi nancial statements.
In March 2007, the CICA issued Section 3862, “Financial Instruments – Disclosures”, which replaces Section 3861 and provides expanded disclosure requirements that provide additional detail by fi nancial asset and liability categories. This standard harmonizes disclosures with International Financial Reporting Standards. This Section applies to interim and annual fi nancial statements relating to fi scal years beginning on or after October 1, 2007, and is not expected to have a material impact on the company’s consolidated fi nancial statements.
Inventories
In June 2007, the CICA issued Section 3031, “Inventories”, which replaces Section 3030 and harmonizes the Canadian standard related to inventories with International Financial Reporting Standards. This Section provides more extensive guidance on the determination of cost, including allocation of overhead; narrows the permitted cost formulas; requires impairment testing; and expands the disclosure requirements to increase transparency. This Section applies to interim and annual fi nancial statements relating to fi scal years beginning on or after January 1, 2008, and is not expected to have a material impact on the company’s consolidated fi nancial statements.
International Financial Reporting Standards
In May 2007, the CICA published an updated version of its “Implementation Plan for Incorporating International Financial Reporting Standards (“IFRS”) into Canadian GAAP”. This plan includes an outline of the key decisions that the CICA will need to make as it implements the Strategic Plan for publicly accountable enterprises that will converge Canadian generally accepted
accounting principles with IFRS. The changeover date from Canadian GAAP to IFRS is for annual and interim fi nancial statements relating to fi scal years beginning on or after January 1, 2011.
Goodwill and Intangible Assets
In February 2008, the CICA issued Section 3064, “Goodwill and Intangible Assets”, which replaces Section 3062, “Goodwill and Other Intangible Assets”, and Section 3450, “Research and Development Costs”. The purpose of this Section is to provide more specifi c guidance on the recognition of internally developed intangible assets and requires that research and development expenditures be evaluated against the same criteria as expenditures for intangible assets. The Section harmonizes Canadian standards with International Financial Reporting Standards and applies to annual and interim fi nancial statements relating to fi scal years beginning on or after October 1, 2008. It is not expected to have a material impact on the company’s consolidated fi nancial statements.
3. CHANGES IN ACCOUNTING POLICIES
Comprehensive Income, Equity, Financial Instruments and Hedges
Effective January 1, 2007, the company adopted CICA Section 1530, “Comprehensive Income”, Section 3251, “Equity”, Section 3855, “Financial Instruments – Recognition and Measurement” and Section 3865, “Hedges”. These pronouncements increase harmonization with US GAAP. Under the standards:
• Financial assets are classifi ed as loans and receivables, held-to-maturity, held-for-trading or available-for-sale. Loans and receivables include all loans and receivables except debt securities and are accounted for at amortized cost. Held-to-maturity classifi cation is restricted to fi xed maturity instruments that the company intends and is able to hold to maturity and are accounted for at amortized cost. Held-for-trading instruments include all derivative fi nancial instruments not included in a hedging relationship and any designated instruments and are recorded at fair value with realized and unrealized gains and losses reported in net income. The remaining fi nancial assets are classifi ed as available-for-sale. These are recorded at fair value with unrealized gains and losses reported in a new category of the Consolidated Statements of Financial Position under shareholders’ equity called AOCI;
• Financial liabilities are classifi ed as either held-for-trading or other. Held-for-trading instruments are recorded at fair value with realized and unrealized gains and losses reported in net income. Other instruments are accounted for at amortized cost with gains and losses reported in net income in the period that the liability is derecognized; and
• Derivative instruments (“derivatives”) are classifi ed as held-for-trading unless designated as hedging instruments. All derivatives are recorded at fair value on the Consolidated Statements of Financial
2. Signifi cant Accounting Policies continued
82 Notes to the PotashCorp 2007 Consolidated Financial Statements
IN MILLIONS OF US DOLLARS EXCEPT SHARE AND PER-SHARE AMOUNTS
Position. For derivatives that hedge the changes in fair value of an asset or liability, changes in the derivatives’ fair value are reported in net income and are substantially offset by changes in the fair value of the hedged asset or liability attributable to the risk being hedged. For derivatives that hedge variability in cash fl ows, the effective portion of the changes in the derivatives’ fair value is initially recognized in OCI and the ineffective portion is recorded in net income. Amounts temporarily recorded in AOCI will subsequently be reclassifi ed to net income in the periods when net income is affected by the variability in the cash fl ows of the hedged item.
These standards have been applied prospectively; accordingly, comparative amounts for prior periods have not been restated. The adoption of these standards resulted in the following adjustments as of January 1, 2007 in accordance with the transition provisions:
(1) Available-for-sale securities
• The company’s investments in Israel Chemicals Ltd. (“ICL”) and Sinofert Holdings Limited (“Sinofert”) have been classifi ed as available-for-sale and recorded at fair value in the Consolidated Statements of Financial Position, resulting in an increase in investments of $887.8, an increase to AOCI of $789.6 and an increase in future income tax liability of $98.2;
(2) Deferred debt costs
• Bond issue costs were reclassifi ed from other assets to long-term debt and deferred swap gains were reclassifi ed from other non-current liabilities to long-term debt, resulting in a reduction in other assets of $23.9, a reduction in other non-current liabilities of $6.6 and a reduction in long-term debt of $17.3;
(3) Natural gas derivatives
• The company employs futures, swaps and option agreements to establish the cost of a portion of its natural gas requirements. These derivative instruments generally qualify for hedge accounting. Derivative instruments were recorded on the Consolidated Statements of Financial Position at fair value, resulting in an increase in current portion of derivative instrument assets of $50.9, an increase in derivative instrument assets (non-current) of $69.4, an increase in future income tax liability of $45.6 and an increase in AOCI of $74.7;
• Hedge ineffectiveness on these derivative instruments was recorded as a cumulative effect adjustment to opening retained earnings, net of tax, resulting in an increase in retained earnings of $0.2 and a decrease in AOCI of $0.2. The effect on basic and diluted earnings per share was not signifi cant; and
• Deferred realized hedging gains were reclassifi ed from inventory to AOCI, resulting in an increase in inventory of $8.0, an increase in future income tax liability of $3.1 and an increase in AOCI of $4.9.
Accounting Changes
In July 2006, the CICA revised Section 1506, “Accounting Changes”, which requires that: (1) voluntary changes in accounting policy are made only if they result in the fi nancial statements providing reliable and more relevant information; (2) changes in accounting policy are generally applied retrospectively; and (3) prior period errors are corrected retrospectively. Section 1506 is effective for fi scal years beginning on or after January 1, 2007. The implementation of this guidance did not have a material impact on the company’s consolidated fi nancial statements.
Stripping Costs Incurred in the Production Phase of a Mining Operation
In March 2006, the Emerging Issues Committee issued Abstract No. 160, “Stripping Costs Incurred in the Production Phase of a Mining Operation” (“EIC-160”). EIC-160 discusses the treatment of costs associated with the activity of removing overburden and other mine waste minerals in the production phase of a mining operation. It concludes that such stripping costs should be accounted for according to the benefi t received by the entity and recorded as either a component of inventory or a betterment to the mineral property, depending on the benefi t received. The implementation of EIC-160, effective January 1, 2007, resulted in a decrease in inventory of $21.1, a decrease in other assets of $7.4 and an increase in property, plant and equipment of $28.5.
4. ACCOUNTS RECEIVABLE
2007 2006
Trade accounts – Canpotex $ 110.2 $ 84.1 – Other 439.0 329.3Non-trade accounts 52.9 33.6 602.1 447.0Less allowance for doubtful accounts (5.9) (4.7) $ 596.2 $ 442.3
5. INVENTORIES
2007 1 2006
Finished products $ 186.6 $ 237.1Intermediate products 70.7 98.5Raw materials 68.0 62.4Materials and supplies 102.8 103.3 $ 428.1 $ 501.31 See changes in accounting policies (Note 3).
3. Changes in Accounting Policies continued
83Notes to the PotashCorp 2007 Consolidated Financial Statements
IN MILLIONS OF US DOLLARS EXCEPT SHARE AND PER-SHARE AMOUNTS
6. DERIVATIVE FINANCIAL INSTRUMENTS
2007 1
Assets Liabilities Net
Natural gas hedging $ 127.6 $ 0.1 $ 127.5Natural gas non-hedging 0.1 0.1 –Foreign currency and other forward purchase contracts 7.3 – 7.3Total 135.0 0.2 134.8 Less current portion (30.8) (0.2) (30.6)Long-term portion $ 104.2 $ – $ 104.21 See changes in accounting policies (Note 3).
At times the company employs futures, swaps and option agreements to establish the cost of a portion of its natural gas requirements. These instruments are intended to hedge the future cost of the anticipated natural gas purchases for its US nitrogen and phosphate plants. Under these arrangements, the company receives or makes payments based on the differential between a specifi ed price and the actual spot price of natural gas. The company has certain available lines of credit that are used to reduce cash margin requirements to maintain the derivatives. At December 31, 2007, it had collected cash margin requirements of $33.9 (2006 – $22.8), which were included in accounts payable and accrued charges (see Note 12).
As at December 31, 2007, the company had derivatives qualifying for hedge accounting in the form of swaps which represented a notional amount of 69.4 million MMBtu with maturities in 2008 through 2017. For the year ended December 31, 2007, gains of $48.1 were recognized in cost of goods sold excluding ineffectiveness, which resulted in an additional gain of $9.6 for the year. Of the gains and losses at December 31, 2007, approximately $23.9 of net gains will be reclassifi ed to cost of goods sold within the next 12 months. As at December 31, 2007, gains from settled hedging transactions deferred in inventory were $NIL (2006 – $8.0). The fair value of the company’s natural gas hedging contracts at December 31, 2007 approximated $127.5 (including liabilities of $0.1 recorded in accounts payable and accrued charges) (2006 – $120.3), using discount rates between 3.82 percent and 4.70 percent (2006 – between 5.06 percent and 5.37 percent) depending on the settlement date.
As at December 31, 2007, the company had entered into foreign currency forward contracts to sell US dollars and receive Canadian dollars in the notional amount of $60.0 (2006 – $100.0) at an average exchange rate of 1.0176 (2006 – 1.1478) per US dollar and to sell US dollars and receive Hong Kong dollars in the notional amount of $174.5 (2006 – $NIL) at an average exchange rate of 7.7937 (2006 – NIL) per US dollar. The company had also entered into other small forward contracts. Maturity dates for all forward contracts are within 2008 and 2009. The company recognized a gain of $13.0 for the year ended December 31, 2007 in foreign exchange (gain) loss related to foreign currency forward contracts classifi ed as
held-for-trading. As at December 31, 2007, the company had entered into an agreement for the forward purchase of shares of Sinofert that settled in January 2008. The fair value of these contracts at December 31, 2007 was a gain of $7.3.
The current portion of derivative instrument assets and liabilities represents unrealized gains and losses with settlement dates in the next 12 months.
7. PROPERTY, PLANT AND EQUIPMENT
2007 1
Accumulated Depreciation and Net Book Cost Amortization Value
Land and improvements $ 248.9 $ 53.9 $ 195.0Buildings and improvements 647.9 220.5 427.4Machinery and equipment 5,074.5 1,937.3 3,137.2Mine development costs 196.8 69.0 127.8 $ 6,168.1 $ 2,280.7 $ 3,887.41 See changes in accounting policies (Note 3).
2006
Accumulated Depreciation and Net Book Cost Amortization Value
Land and improvements $ 233.3 $ 51.9 $ 181.4Buildings and improvements 547.9 206.4 341.5Machinery and equipment 4,618.0 1,750.4 2,867.6Mine development costs 200.4 65.1 135.3 $ 5,599.6 $ 2,073.8 $ 3,525.8
Depreciation and amortization of property, plant and equipment included in cost of goods sold and in selling and administrative expenses was $279.8 (2006 – $226.3; 2005 – $227.4). The net carrying amount of property, plant and equipment not being amortized at December 31, 2007 because it was under construction or development was $608.8 (2006 – $381.6).
During the year, the company recorded an impairment charge of $NIL (2006 – $6.3; 2005 – $NIL) relating to certain assets. As at December 31, 2007, the company determined that there were no triggering events requiring impairment analysis. Interest capitalized to property, plant and equipment during the year was $21.8 (2006 – $19.1; 2005 – $5.7).
The opening balance of pre-stripping costs at January 1, 2007 was $28.5, additions during 2007 were $24.8 and amortization was $19.9, for a balance at December 31, 2007 of $33.4.
Acquiring or constructing property, plant and equipment by incurring a liability does not result in a cash outfl ow for the company until the liability is paid. In the period the related liability is incurred, the change in operating accounts payable on the Consolidated Statements of Cash Flow is typically reduced by such
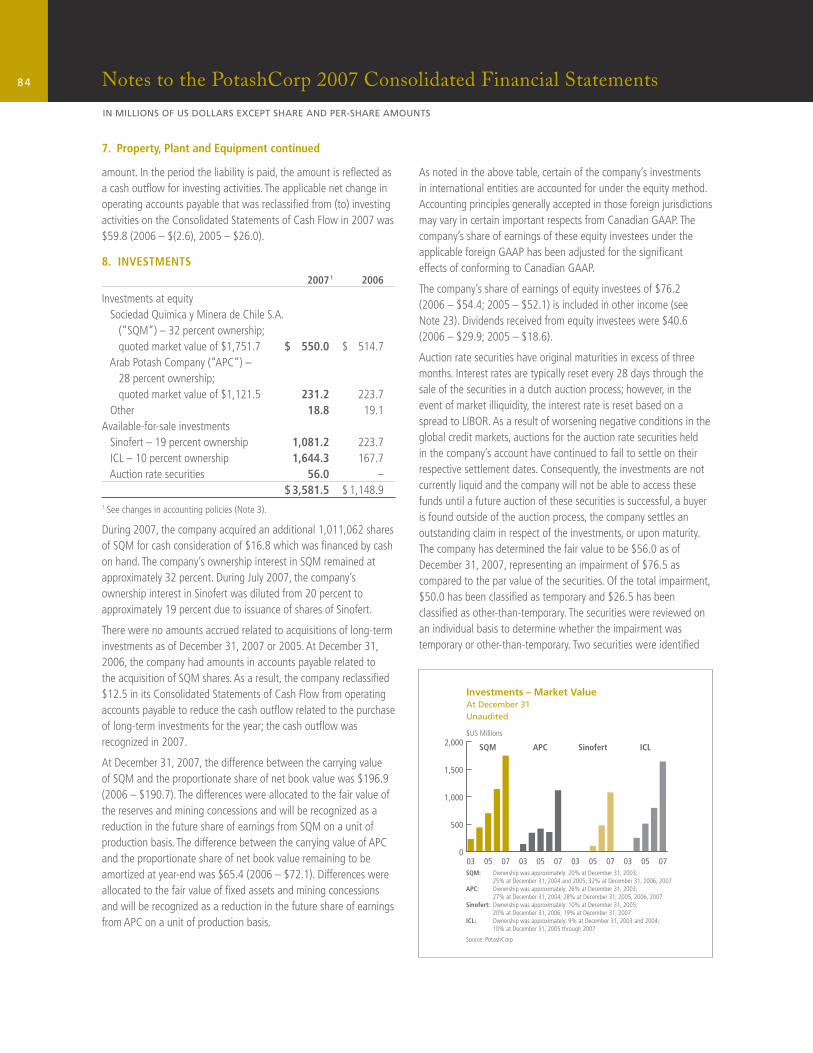
84 Notes to the PotashCorp 2007 Consolidated Financial Statements
IN MILLIONS OF US DOLLARS EXCEPT SHARE AND PER-SHARE AMOUNTS
7. Property, Plant and Equipment continued
amount. In the period the liability is paid, the amount is refl ected as a cash outfl ow for investing activities. The applicable net change in operating accounts payable that was reclassifi ed from (to) investing activities on the Consolidated Statements of Cash Flow in 2007 was $59.8 (2006 – $(2.6), 2005 – $26.0).
8. INVESTMENTS
2007 1 2006
Investments at equity Sociedad Quimica y Minera de Chile S.A. (“SQM”) – 32 percent ownership; quoted market value of $1,751.7 $ 550.0 $ 514.7 Arab Potash Company (“APC”) – 28 percent ownership; quoted market value of $1,121.5 231.2 223.7 Other 18.8 19.1Available-for-sale investments Sinofert – 19 percent ownership 1,081.2 223.7 ICL – 10 percent ownership 1,644.3 167.7 Auction rate securities 56.0 – $ 3,581.5 $ 1,148.91 See changes in accounting policies (Note 3).
During 2007, the company acquired an additional 1,011,062 shares of SQM for cash consideration of $16.8 which was fi nanced by cash on hand. The company’s ownership interest in SQM remained at approximately 32 percent. During July 2007, the company’s ownership interest in Sinofert was diluted from 20 percent to approximately 19 percent due to issuance of shares of Sinofert.
There were no amounts accrued related to acquisitions of long-term investments as of December 31, 2007 or 2005. At December 31, 2006, the company had amounts in accounts payable related to the acquisition of SQM shares. As a result, the company reclassifi ed $12.5 in its Consolidated Statements of Cash Flow from operating accounts payable to reduce the cash outfl ow related to the purchase of long-term investments for the year; the cash outfl ow was recognized in 2007.
At December 31, 2007, the difference between the carrying value of SQM and the proportionate share of net book value was $196.9 (2006 – $190.7). The differences were allocated to the fair value of the reserves and mining concessions and will be recognized as a reduction in the future share of earnings from SQM on a unit of production basis. The difference between the carrying value of APC and the proportionate share of net book value remaining to be amortized at year-end was $65.4 (2006 – $72.1). Differences were allocated to the fair value of fi xed assets and mining concessions and will be recognized as a reduction in the future share of earnings from APC on a unit of production basis.
As noted in the above table, certain of the company’s investments in international entities are accounted for under the equity method. Accounting principles generally accepted in those foreign jurisdictions may vary in certain important respects from Canadian GAAP. The company’s share of earnings of these equity investees under the applicable foreign GAAP has been adjusted for the signifi cant effects of conforming to Canadian GAAP.
The company’s share of earnings of equity investees of $76.2 (2006 – $54.4; 2005 – $52.1) is included in other income (see Note 23). Dividends received from equity investees were $40.6 (2006 – $29.9; 2005 – $18.6).
Auction rate securities have original maturities in excess of three months. Interest rates are typically reset every 28 days through the sale of the securities in a dutch auction process; however, in the event of market illiquidity, the interest rate is reset based on a spread to LIBOR. As a result of worsening negative conditions in the global credit markets, auctions for the auction rate securities held in the company’s account have continued to fail to settle on their respective settlement dates. Consequently, the investments are not currently liquid and the company will not be able to access these funds until a future auction of these securities is successful, a buyer is found outside of the auction process, the company settles an outstanding claim in respect of the investments, or upon maturity. The company has determined the fair value to be $56.0 as of December 31, 2007, representing an impairment of $76.5 as compared to the par value of the securities. Of the total impairment, $50.0 has been classifi ed as temporary and $26.5 has been classifi ed as other-than-temporary. The securities were reviewed on an individual basis to determine whether the impairment was temporary or other-than-temporary. Two securities were identifi ed
0
500
1,000
1,500
2,000
070503070503070503070503
$US Millions
SQM: Ownership was approximately: 20% at December 31, 2003; 25% at December 31, 2004 and 2005; 32% at December 31, 2006, 2007APC: Ownership was approximately: 26% at December 31, 2003; 27% at December 31, 2004; 28% at December 31, 2005, 2006, 2007Sinofert: Ownership was approximately: 10% at December 31, 2005; 20% at December 31, 2006; 19% at December 31, 2007ICL: Ownership was approximately: 9% at December 31, 2003 and 2004; 10% at December 31, 2005 through 2007
Source: PotashCorp
Investments – Market ValueAt December 31 Unaudited
SQM APC Sinofert ICL
85Notes to the PotashCorp 2007 Consolidated Financial Statements
IN MILLIONS OF US DOLLARS EXCEPT SHARE AND PER-SHARE AMOUNTS
8. Investments continued
as being other-than-temporarily impaired based on the vintage of the underlying securities and complexity of the structures. The entire impairment on these two securities was therefore classifi ed as other-than-temporary. For those investments for which the impairment in fair value is considered temporary, the company has the ability to hold the securities until the temporary impairment in fair value is recovered, which may not be until a recovery of the auction process or until maturity. Maturity dates for these investments range from 2017 to 2046 with principal distributions occurring on several securities prior to maturity. The investments are classifi ed as long-term since they are not expected to be realizable within one year from the date of the Consolidated Statements of Financial Position.
In prior years, auction rate securities were included with cash and cash equivalents. The company has not reclassifi ed prior years as the adjustments are not considered material.
9. OTHER ASSETS
2007 1 2006
Deferred charges – net of accumulated amortization of $16.9 (2006 – $50.0) $ 24.0 $ 44.5Accrued pension benefi t asset 111.7 26.8Up-front lease costs – net of accumulated amortization of $2.2 (2006 – $NIL) 24.7 –Other 50.3 34.5 $ 210.7 $ 105.81 See changes in accounting policies (Note 3).
Amortization of deferred charges included in cost of goods sold and in selling and administrative expenses was $5.4 (2006 – $9.2; 2005 – $10.9).
10. INTANGIBLE ASSETS AND GOODWILL
2007 2006
Intangible assets – net of accumulated amortization of $27.9 (2006 – $22.6) $ 24.5 $ 29.3Goodwill – net of accumulated amortization of $7.3 (2006 – $7.3) $ 97.0 $ 97.0
Intangible assets relate primarily to production and technology rights and computer software. Other than goodwill, the company has not recognized any intangible assets with indefi nite useful lives. Total amortization expense relating to fi nite-lived intangible assets for 2007 was $6.1 (2006 – $6.9; 2005 – $4.1). Amortization expense in each of the next fi ve years calculated upon such assets held as at December 31, 2007 is estimated to be $3.9 for 2008, $3.8 for 2009, $3.3 for 2010, $1.0 for 2011 and $1.0 for 2012.
Substantially all of the company’s recorded goodwill relates to the nitrogen segment.
11. SHORT-TERM DEBT
Short-term debt was $90.0 at December 31, 2007 (2006 – $157.9). The weighted average interest rate on this debt was 5.17 percent (2006 – 5.51 percent). The company had an unsecured line of credit available for short-term fi nancing (net of letters of credit of $23.9 and direct borrowings of $NIL) in the amount of $51.1 at December 31, 2007 (2006 – $57.7). In addition, the company is authorized to borrow a further $660.0 under its commercial paper program.
The line of credit was renewed in September 2007 for the period to May 2009; it will be renewable annually each May beginning in 2009. Outstanding letters of credit and direct borrowings reduce the amount available. The line of credit is subject to fi nancial tests and other covenants. The principal covenants require a debt-to-capital ratio of less than or equal to 0.60:1, a long-term debt-to-EBITDA (as defi ned in the agreement to be earnings before interest, income taxes, provincial mining and other taxes, depreciation, amortization and other non-cash expenses, and unrealized gains and losses in respect of hedging instruments) ratio of less than or equal to 3.5:1, tangible net worth in an amount greater than or equal to $1,250.0 and debt of subsidiaries not to exceed $650.0. The line of credit is subject to other customary covenants and events of default, including an event of default for non-payment of other debt in excess of Cdn $40.0. Non-compliance with such covenants could result in accelerated payment of amounts due under the line of credit, and its termination. The company was in compliance with the above-mentioned covenants at December 31, 2007.
12. ACCOUNTS PAYABLE AND ACCRUED CHARGES
2007 2006
Trade accounts $ 371.0 $ 242.9Income taxes 188.4 70.0Accrued compensation 94.0 49.5Deferred revenue 42.1 25.2Margin deposits 33.9 22.8Other taxes 32.2 12.9Dividends 32.0 16.1Accrued deferred share units 29.7 10.2Accrued interest 29.2 24.6Current portion accrued environmental costs and asset retirement obligations 13.7 9.0Current portion pension and other post-retirement benefi ts 7.9 8.9Other payables 37.6 53.1 $ 911.7 $ 545.2
86 Notes to the PotashCorp 2007 Consolidated Financial Statements
IN MILLIONS OF US DOLLARS EXCEPT SHARE AND PER-SHARE AMOUNTS
13. LONG-TERM DEBT
2007 1 2006
Effective Interest Rate 2
Notes Payable 7.125% notes payable June 15, 2007 $ – – $ 400.0 7.750% notes payable May 31, 2011 600.0 7.65% 600.0 4.875% notes payable March 1, 2013 250.0 5.08% 250.0 5.875% notes payable December 1, 2036 500.0 6.11% 500.0 The above series of notes were issued under US shelf registration statements covering up to
$4,000.0 of debt securities. The notes are unsecured and there are no sinking fund requirements
prior to maturity. The 2011, 2013 and 2036 notes are redeemable, in whole or in part, at the
company’s option at any time prior to maturity for a price at least equal to the principal amount
of the notes to be redeemed, plus accrued interest. Under certain conditions related to change
in control, the company is required to make an offer to purchase all, or any part, of the 2036
notes at 101 percent of the principal amount of the notes repurchased, plus accrued interest.
Other 8.5 7.60% 7.5 1,358.5 1,757.5Less net unamortized debt costs (24.6) –Add unamortized interest rate swap gains 5.3 – 1,339.2 1,757.5Less current maturities (0.2) (400.4)Add current portion of amortization 0.4 – $ 1,339.4 $ 1,357.11 See changes in accounting policies (Note 3).2 The effective interest rate by instrument includes the impact of swap gains and debt costs.
The company has entered into back-to-back loan arrangements involving certain fi nancial assets and fi nancial liabilities. The company has presented fi nancial assets of $505.1 and fi nancial liabilities of $511.0 on a net basis related to these arrangements because a legal right to set-off exists, and it intends to settle with the same party on a net basis. Other long-term debt in the above table includes a net fi nancial liability of $5.9 (2006 – $5.9) pursuant to these arrangements. The company incurred $3.2 of debt issue costs as a result of one such arrangement entered into during 2007, which were included as a reduction to long-term debt and are being amortized using the effective interest rate method over the term of the related liability.
The company has a syndicated revolving credit facility which provides for unsecured advances of up to $750.0 (less the amount of direct borrowings and commercial paper outstanding). The facility was renewed in September 2005 for a fi ve-year term, extended in September 2006 for one additional year, and extended in October 2007 through May 31, 2013. As at December 31, 2007, no amounts were outstanding and $660.0 was available under the facility. Principal covenants and events of default under the credit facility requirements are the same as those under the line of credit described in Note 11. The notes payable are not subject to any
fi nancial test covenants but are subject to certain customary covenants (including limitations on liens and sale and leaseback transactions) and events of default, including an event of default for acceleration of other debt in excess of $50.0. The other long-term debt instruments are not subject to any fi nancial test covenants but are subject to certain customary covenants and events of default, including, for other long-term debt, an event of default for non-payment of other debt in excess of $25.0. Non-compliance with such covenants could result in accelerated payment of the related debt. The company was in compliance with the above-mentioned covenants at December 31, 2007.
Long-term debt at December 31, 2007 will mature as follows:
2008 $ 0.22009 0.32010 1.82011 600.32012 5.9Subsequent years 750.0 $ 1,358.5
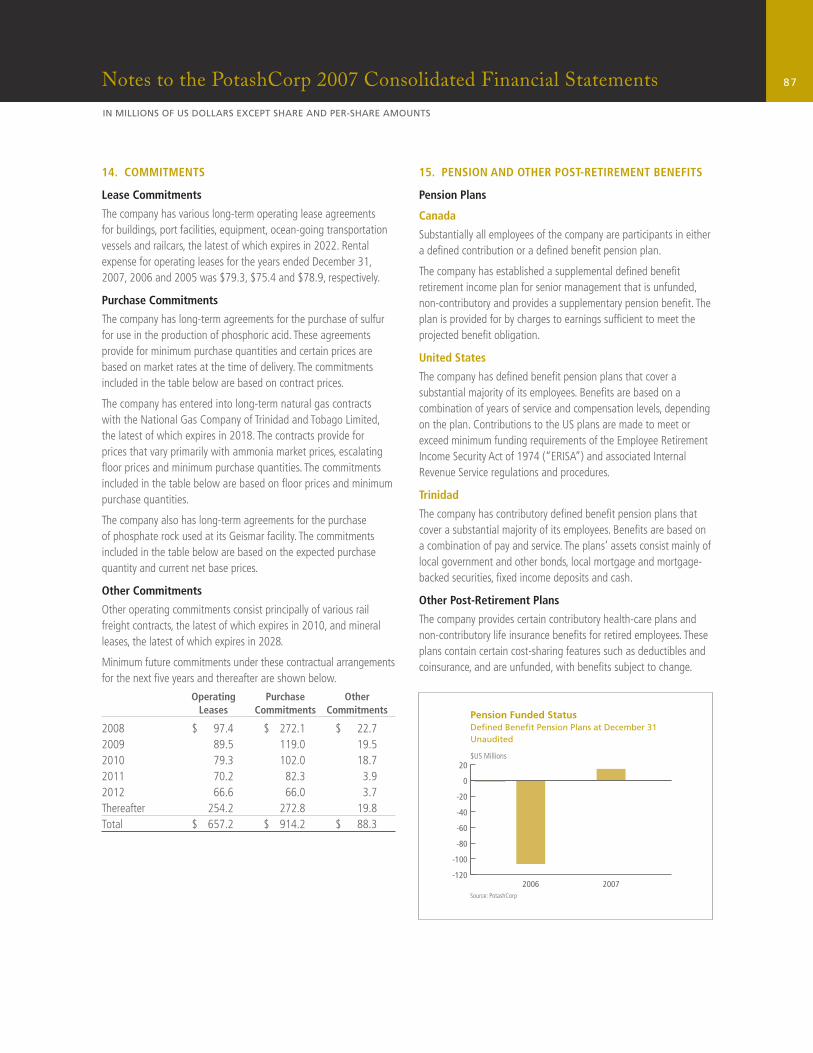
87Notes to the PotashCorp 2007 Consolidated Financial Statements
IN MILLIONS OF US DOLLARS EXCEPT SHARE AND PER-SHARE AMOUNTS
14. COMMITMENTS
Lease Commitments
The company has various long-term operating lease agreements for buildings, port facilities, equipment, ocean-going transportation vessels and railcars, the latest of which expires in 2022. Rental expense for operating leases for the years ended December 31, 2007, 2006 and 2005 was $79.3, $75.4 and $78.9, respectively.
Purchase Commitments
The company has long-term agreements for the purchase of sulfur for use in the production of phosphoric acid. These agreements provide for minimum purchase quantities and certain prices are based on market rates at the time of delivery. The commitments included in the table below are based on contract prices.
The company has entered into long-term natural gas contracts with the National Gas Company of Trinidad and Tobago Limited, the latest of which expires in 2018. The contracts provide for prices that vary primarily with ammonia market prices, escalating fl oor prices and minimum purchase quantities. The commitments included in the table below are based on fl oor prices and minimum purchase quantities.
The company also has long-term agreements for the purchase of phosphate rock used at its Geismar facility. The commitments included in the table below are based on the expected purchase quantity and current net base prices.
Other Commitments
Other operating commitments consist principally of various rail freight contracts, the latest of which expires in 2010, and mineral leases, the latest of which expires in 2028.
Minimum future commitments under these contractual arrangements for the next fi ve years and thereafter are shown below.
Operating Purchase Other Leases Commitments Commitments
2008 $ 97.4 $ 272.1 $ 22.72009 89.5 119.0 19.52010 79.3 102.0 18.72011 70.2 82.3 3.92012 66.6 66.0 3.7Thereafter 254.2 272.8 19.8Total $ 657.2 $ 914.2 $ 88.3
15. PENSION AND OTHER POST-RETIREMENT BENEFITS
Pension Plans
Canada
Substantially all employees of the company are participants in either a defi ned contribution or a defi ned benefi t pension plan.
The company has established a supplemental defi ned benefi t retirement income plan for senior management that is unfunded, non-contributory and provides a supplementary pension benefi t. The plan is provided for by charges to earnings suffi cient to meet the projected benefi t obligation.
United States
The company has defi ned benefi t pension plans that cover a substantial majority of its employees. Benefi ts are based on a combination of years of service and compensation levels, depending on the plan. Contributions to the US plans are made to meet or exceed minimum funding requirements of the Employee Retirement Income Security Act of 1974 (“ERISA”) and associated Internal Revenue Service regulations and procedures.
Trinidad
The company has contributory defi ned benefi t pension plans that cover a substantial majority of its employees. Benefi ts are based on a combination of pay and service. The plans’ assets consist mainly of local government and other bonds, local mortgage and mortgage-backed securities, fi xed income deposits and cash.
Other Post-Retirement Plans
The company provides certain contributory health-care plans and non-contributory life insurance benefi ts for retired employees. These plans contain certain cost-sharing features such as deductibles and coinsurance, and are unfunded, with benefi ts subject to change.
-120
-100
-80
-60
-40
-20
0
20
2007 2006
$US Millions
Source: PotashCorp
Pension Funded StatusDefined Benefit Pension Plans at December 31Unaudited
88 Notes to the PotashCorp 2007 Consolidated Financial Statements
IN MILLIONS OF US DOLLARS EXCEPT SHARE AND PER-SHARE AMOUNTS
15. Pension and Other Post-Retirement Benefi ts continued
Defi ned Benefi t Plans
The components of net expense for the company’s pension and other post-retirement benefi t plans, computed actuarially, were as follows:
Pension Other
2007 2006 2005 2007 2006 2005
Costs arising in the period Service cost for benefi ts earned during the year $ 15.3 $ 14.2 $ 13.8 $ 6.1 $ 4.7 $ 5.7 Interest cost on projected benefi t obligations 36.5 33.5 31.1 14.9 12.4 13.3 Actual return on plan assets (44.3) (42.1) (34.3) – – – Actuarial (gain) loss (33.5) 8.9 27.9 (12.0) 18.4 (12.7) Plan amendments 0.3 1.4 3.5 – (1.7) 11.5 Plan curtailments – – 0.4 – – – Change in valuation allowance – 2.0 2.4 – – – Costs arising in the period (25.7) 17.9 44.8 9.0 33.8 17.8Difference between costs arising in the period and costs recognized in the period in respect of: Return on plan assets 1.5 3.9 (2.7) – – – Actuarial loss (gain) 40.8 (1.7) (23.6) 16.4 (16.4) 15.4 Plan amendments 1.5 1.0 (2.3) (2.9) (1.1) (13.0) Transitional obligation 0.9 1.6 1.4 0.2 0.4 0.3Net expense $ 19.0 $ 22.7 $ 17.6 $ 22.7 $ 16.7 $ 20.5
The assumptions used to determine the benefi t obligation and expense for the company’s signifi cant plans were as follows (weighted average as of December 31):
Pension Other
2007 2006 2005 2007 2006 2005
Discount rate – obligation 6.50% 5.85% 5.70% 6.50% 5.85% 5.70%Discount rate – expense 5.85% 5.70% 5.75% 5.85% 5.70% 5.75%Long-term rate of return on assets 8.00% 8.00% 8.50% n/a n/a n/aRate of increase in compensation levels 4.00% 4.00% 4.00% n/a n/a n/a
The average remaining service period of the active employees covered by the company’s pension plans is 12.0 years (2006 – 11.5 years). The average remaining service period of the active employees covered by the company’s other benefi ts plans is 12.1 years (2006 – 11.8 years).
The assumed health-care cost trend rates are as follows:
2007 2006 2005
Health-care cost trend rates assumed for next year 6.00% 6.00% 6.00%Ultimate health-care cost trend rate assumed 6.00% 6.00% 6.00%Year that the rate reaches the ultimate trend rate 2007 2006 2005
Effective January 1, 2004, the company’s largest retiree medical plan limits the company’s share of annual medical cost increases to 75 percent of the fi rst 6 percent of total medical infl ation for recent and future non-union retirees. Any cost increases in excess of this amount are funded by increased retiree contributions.
The company’s discount rate assumption refl ects the weighted average interest rate at which the pension and other post-retirement liabilities could be effectively settled using high-quality bonds at the measurement date. The rate varies by country. The company determines the discount rate using a yield curve approach. Based on the plan’s demographics, expected future pension benefi t and medical claims, payments are measured and discounted to determine the present value of the expected future cash fl ows. The cash fl ows are discounted using yields on high-quality AA-rated non-callable bonds with cash fl ows of similar timing. The equivalent level discount rate is then used as input by the company to determine the fi nal discount rate. The rate selected for the December 31, 2007 measurement date will be used to determine expense for fi scal 2008.
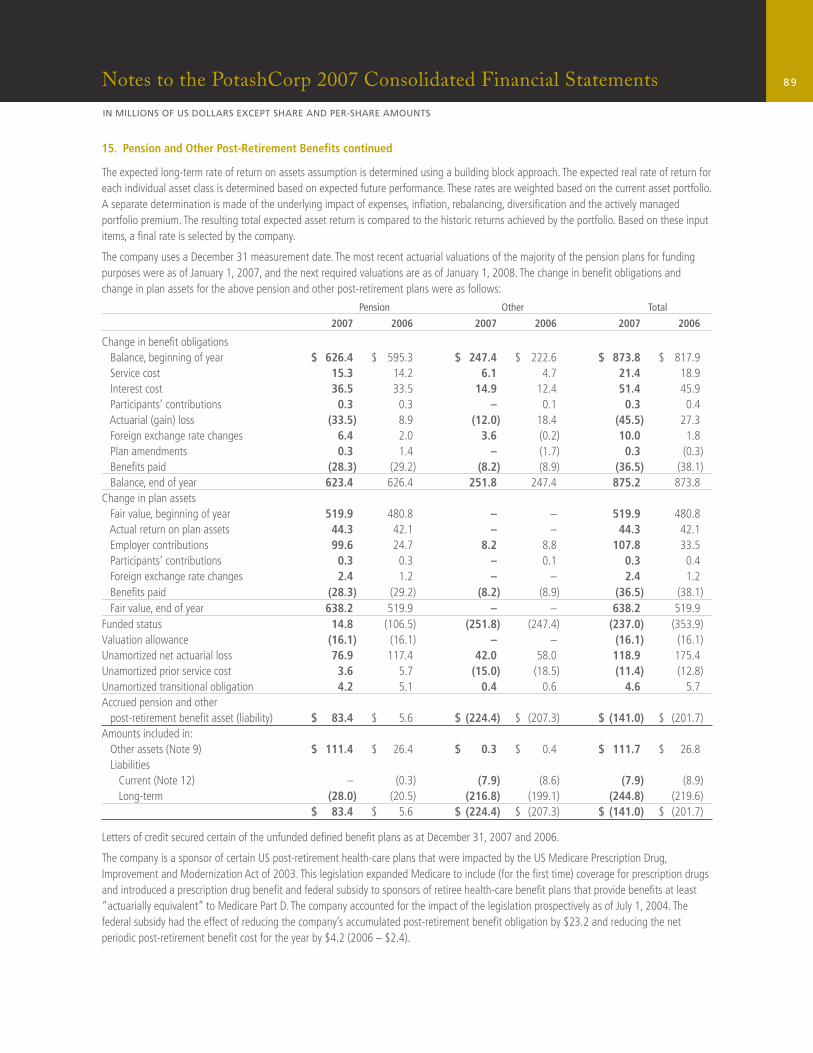
89Notes to the PotashCorp 2007 Consolidated Financial Statements
IN MILLIONS OF US DOLLARS EXCEPT SHARE AND PER-SHARE AMOUNTS
15. Pension and Other Post-Retirement Benefi ts continued
The expected long-term rate of return on assets assumption is determined using a building block approach. The expected real rate of return for each individual asset class is determined based on expected future performance. These rates are weighted based on the current asset portfolio. A separate determination is made of the underlying impact of expenses, infl ation, rebalancing, diversifi cation and the actively managed portfolio premium. The resulting total expected asset return is compared to the historic returns achieved by the portfolio. Based on these input items, a fi nal rate is selected by the company.
The company uses a December 31 measurement date. The most recent actuarial valuations of the majority of the pension plans for funding purposes were as of January 1, 2007, and the next required valuations are as of January 1, 2008. The change in benefi t obligations and change in plan assets for the above pension and other post-retirement plans were as follows:
Pension Other Total
2007 2006 2007 2006 2007 2006
Change in benefi t obligations Balance, beginning of year $ 626.4 $ 595.3 $ 247.4 $ 222.6 $ 873.8 $ 817.9 Service cost 15.3 14.2 6.1 4.7 21.4 18.9 Interest cost 36.5 33.5 14.9 12.4 51.4 45.9 Participants’ contributions 0.3 0.3 – 0.1 0.3 0.4 Actuarial (gain) loss (33.5) 8.9 (12.0) 18.4 (45.5) 27.3 Foreign exchange rate changes 6.4 2.0 3.6 (0.2) 10.0 1.8 Plan amendments 0.3 1.4 – (1.7) 0.3 (0.3) Benefi ts paid (28.3) (29.2) (8.2) (8.9) (36.5) (38.1) Balance, end of year 623.4 626.4 251.8 247.4 875.2 873.8Change in plan assets Fair value, beginning of year 519.9 480.8 – – 519.9 480.8 Actual return on plan assets 44.3 42.1 – – 44.3 42.1 Employer contributions 99.6 24.7 8.2 8.8 107.8 33.5 Participants’ contributions 0.3 0.3 – 0.1 0.3 0.4 Foreign exchange rate changes 2.4 1.2 – – 2.4 1.2 Benefi ts paid (28.3) (29.2) (8.2) (8.9) (36.5) (38.1) Fair value, end of year 638.2 519.9 – – 638.2 519.9Funded status 14.8 (106.5) (251.8) (247.4) (237.0) (353.9)Valuation allowance (16.1) (16.1) – – (16.1) (16.1)Unamortized net actuarial loss 76.9 117.4 42.0 58.0 118.9 175.4Unamortized prior service cost 3.6 5.7 (15.0) (18.5) (11.4) (12.8)Unamortized transitional obligation 4.2 5.1 0.4 0.6 4.6 5.7Accrued pension and other post-retirement benefi t asset (liability) $ 83.4 $ 5.6 $ (224.4) $ (207.3) $ (141.0) $ (201.7)Amounts included in: Other assets (Note 9) $ 111.4 $ 26.4 $ 0.3 $ 0.4 $ 111.7 $ 26.8 Liabilities Current (Note 12) – (0.3) (7.9) (8.6) (7.9) (8.9) Long-term (28.0) (20.5) (216.8) (199.1) (244.8) (219.6) $ 83.4 $ 5.6 $ (224.4) $ (207.3) $ (141.0) $ (201.7)
Letters of credit secured certain of the unfunded defi ned benefi t plans as at December 31, 2007 and 2006.
The company is a sponsor of certain US post-retirement health-care plans that were impacted by the US Medicare Prescription Drug, Improvement and Modernization Act of 2003. This legislation expanded Medicare to include (for the fi rst time) coverage for prescription drugs and introduced a prescription drug benefi t and federal subsidy to sponsors of retiree health-care benefi t plans that provide benefi ts at least “actuarially equivalent” to Medicare Part D. The company accounted for the impact of the legislation prospectively as of July 1, 2004. The federal subsidy had the effect of reducing the company’s accumulated post-retirement benefi t obligation by $23.2 and reducing the net periodic post-retirement benefi t cost for the year by $4.2 (2006 – $2.4).
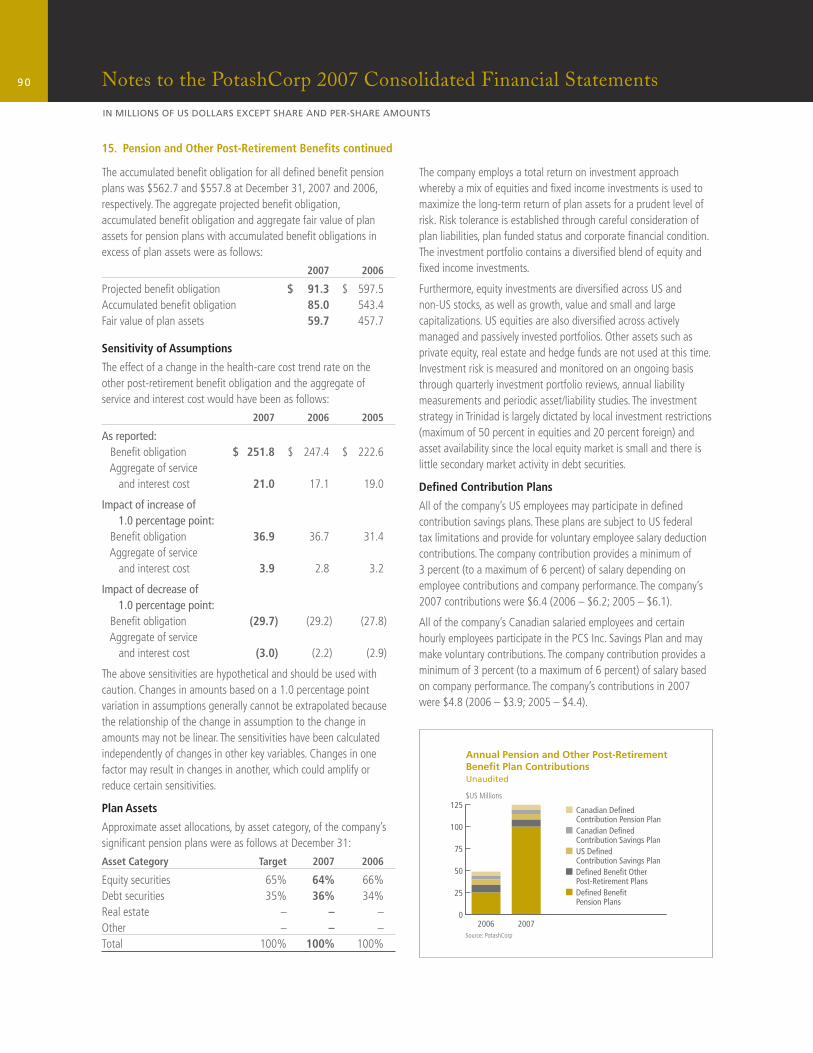
90 Notes to the PotashCorp 2007 Consolidated Financial Statements
IN MILLIONS OF US DOLLARS EXCEPT SHARE AND PER-SHARE AMOUNTS
15. Pension and Other Post-Retirement Benefi ts continued
The accumulated benefi t obligation for all defi ned benefi t pension plans was $562.7 and $557.8 at December 31, 2007 and 2006, respectively. The aggregate projected benefi t obligation, accumulated benefi t obligation and aggregate fair value of plan assets for pension plans with accumulated benefi t obligations in excess of plan assets were as follows:
2007 2006
Projected benefi t obligation $ 91.3 $ 597.5Accumulated benefi t obligation 85.0 543.4Fair value of plan assets 59.7 457.7
Sensitivity of Assumptions
The effect of a change in the health-care cost trend rate on the other post-retirement benefi t obligation and the aggregate of service and interest cost would have been as follows:
2007 2006 2005
As reported: Benefi t obligation $ 251.8 $ 247.4 $ 222.6 Aggregate of service and interest cost 21.0 17.1 19.0
Impact of increase of 1.0 percentage point: Benefi t obligation 36.9 36.7 31.4 Aggregate of service and interest cost 3.9 2.8 3.2
Impact of decrease of 1.0 percentage point: Benefi t obligation (29.7) (29.2) (27.8) Aggregate of service and interest cost (3.0) (2.2) (2.9)
The above sensitivities are hypothetical and should be used with caution. Changes in amounts based on a 1.0 percentage point variation in assumptions generally cannot be extrapolated because the relationship of the change in assumption to the change in amounts may not be linear. The sensitivities have been calculated independently of changes in other key variables. Changes in one factor may result in changes in another, which could amplify or reduce certain sensitivities.
Plan Assets
Approximate asset allocations, by asset category, of the company’s signifi cant pension plans were as follows at December 31:
Asset Category Target 2007 2006
Equity securities 65% 64% 66%Debt securities 35% 36% 34%Real estate – – –Other – – –Total 100% 100% 100%
The company employs a total return on investment approach whereby a mix of equities and fi xed income investments is used to maximize the long-term return of plan assets for a prudent level of risk. Risk tolerance is established through careful consideration of plan liabilities, plan funded status and corporate fi nancial condition. The investment portfolio contains a diversifi ed blend of equity and fi xed income investments.
Furthermore, equity investments are diversifi ed across US and non-US stocks, as well as growth, value and small and large capitalizations. US equities are also diversifi ed across actively managed and passively invested portfolios. Other assets such as private equity, real estate and hedge funds are not used at this time. Investment risk is measured and monitored on an ongoing basis through quarterly investment portfolio reviews, annual liability measurements and periodic asset/liability studies. The investment strategy in Trinidad is largely dictated by local investment restrictions (maximum of 50 percent in equities and 20 percent foreign) and asset availability since the local equity market is small and there is little secondary market activity in debt securities.
Defi ned Contribution Plans
All of the company’s US employees may participate in defi ned contribution savings plans. These plans are subject to US federal tax limitations and provide for voluntary employee salary deduction contributions. The company contribution provides a minimum of 3 percent (to a maximum of 6 percent) of salary depending on employee contributions and company performance. The company’s 2007 contributions were $6.4 (2006 – $6.2; 2005 – $6.1).
All of the company’s Canadian salaried employees and certain hourly employees participate in the PCS Inc. Savings Plan and may make voluntary contributions. The company contribution provides a minimum of 3 percent (to a maximum of 6 percent) of salary based on company performance. The company’s contributions in 2007 were $4.8 (2006 – $3.9; 2005 – $4.4).
0
25
50
75
100
125
20072006
$US Millions
Source: PotashCorp
Annual Pension and Other Post-Retirement Benefit Plan ContributionsUnaudited
Canadian Defined Contribution Pension PlanCanadian DefinedContribution Savings PlanUS DefinedContribution Savings PlanDefined Benefit OtherPost-Retirement PlansDefined Benefit Pension Plans
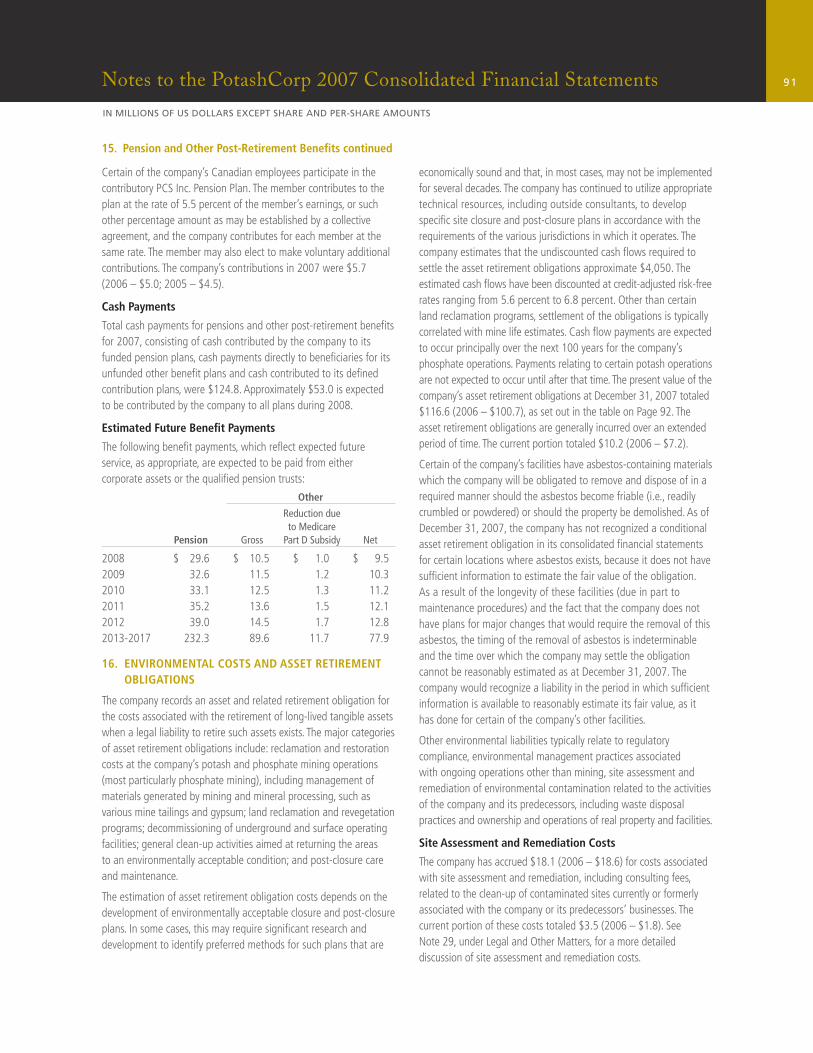
91Notes to the PotashCorp 2007 Consolidated Financial Statements
IN MILLIONS OF US DOLLARS EXCEPT SHARE AND PER-SHARE AMOUNTS
15. Pension and Other Post-Retirement Benefi ts continued
Certain of the company’s Canadian employees participate in the contributory PCS Inc. Pension Plan. The member contributes to the plan at the rate of 5.5 percent of the member’s earnings, or such other percentage amount as may be established by a collective agreement, and the company contributes for each member at the same rate. The member may also elect to make voluntary additional contributions. The company’s contributions in 2007 were $5.7 (2006 – $5.0; 2005 – $4.5).
Cash Payments
Total cash payments for pensions and other post-retirement benefi ts for 2007, consisting of cash contributed by the company to its funded pension plans, cash payments directly to benefi ciaries for its unfunded other benefi t plans and cash contributed to its defi ned contribution plans, were $124.8. Approximately $53.0 is expected to be contributed by the company to all plans during 2008.
Estimated Future Benefi t Payments
The following benefi t payments, which refl ect expected future service, as appropriate, are expected to be paid from either corporate assets or the qualifi ed pension trusts:
Other
Reduction due to Medicare Pension Gross Part D Subsidy Net
2008 $ 29.6 $ 10.5 $ 1.0 $ 9.52009 32.6 11.5 1.2 10.32010 33.1 12.5 1.3 11.22011 35.2 13.6 1.5 12.12012 39.0 14.5 1.7 12.82013-2017 232.3 89.6 11.7 77.9
16. ENVIRONMENTAL COSTS AND ASSET RETIREMENT OBLIGATIONS
The company records an asset and related retirement obligation for the costs associated with the retirement of long-lived tangible assets when a legal liability to retire such assets exists. The major categories of asset retirement obligations include: reclamation and restoration costs at the company’s potash and phosphate mining operations (most particularly phosphate mining), including management of materials generated by mining and mineral processing, such as various mine tailings and gypsum; land reclamation and revegetation programs; decommissioning of underground and surface operating facilities; general clean-up activities aimed at returning the areas to an environmentally acceptable condition; and post-closure care and maintenance.
The estimation of asset retirement obligation costs depends on the development of environmentally acceptable closure and post-closure plans. In some cases, this may require signifi cant research and development to identify preferred methods for such plans that are
economically sound and that, in most cases, may not be implemented for several decades. The company has continued to utilize appropriate technical resources, including outside consultants, to develop specifi c site closure and post-closure plans in accordance with the requirements of the various jurisdictions in which it operates. The company estimates that the undiscounted cash fl ows required to settle the asset retirement obligations approximate $4,050. The estimated cash fl ows have been discounted at credit-adjusted risk-free rates ranging from 5.6 percent to 6.8 percent. Other than certain land reclamation programs, settlement of the obligations is typically correlated with mine life estimates. Cash fl ow payments are expected to occur principally over the next 100 years for the company’s phosphate operations. Payments relating to certain potash operations are not expected to occur until after that time. The present value of the company’s asset retirement obligations at December 31, 2007 totaled $116.6 (2006 – $100.7), as set out in the table on Page 92. The asset retirement obligations are generally incurred over an extended period of time. The current portion totaled $10.2 (2006 – $7.2).
Certain of the company’s facilities have asbestos-containing materials which the company will be obligated to remove and dispose of in a required manner should the asbestos become friable (i.e., readily crumbled or powdered) or should the property be demolished. As of December 31, 2007, the company has not recognized a conditional asset retirement obligation in its consolidated fi nancial statements for certain locations where asbestos exists, because it does not have suffi cient information to estimate the fair value of the obligation. As a result of the longevity of these facilities (due in part to maintenance procedures) and the fact that the company does not have plans for major changes that would require the removal of this asbestos, the timing of the removal of asbestos is indeterminable and the time over which the company may settle the obligation cannot be reasonably estimated as at December 31, 2007. The company would recognize a liability in the period in which suffi cient information is available to reasonably estimate its fair value, as it has done for certain of the company’s other facilities.
Other environmental liabilities typically relate to regulatory compliance, environmental management practices associated with ongoing operations other than mining, site assessment and remediation of environmental contamination related to the activities of the company and its predecessors, including waste disposal practices and ownership and operations of real property and facilities.
Site Assessment and Remediation Costs
The company has accrued $18.1 (2006 – $18.6) for costs associated with site assessment and remediation, including consulting fees, related to the clean-up of contaminated sites currently or formerly associated with the company or its predecessors’ businesses. The current portion of these costs totaled $3.5 (2006 – $1.8). See Note 29, under Legal and Other Matters, for a more detailed discussion of site assessment and remediation costs.
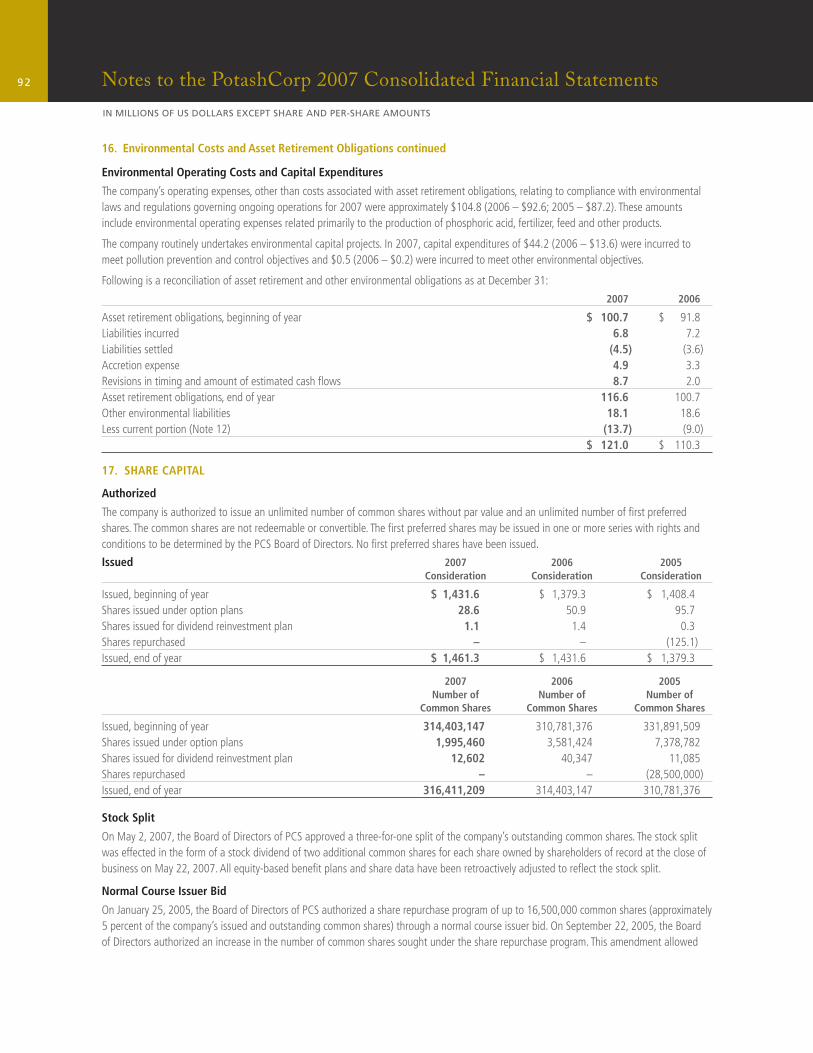
92 Notes to the PotashCorp 2007 Consolidated Financial Statements
IN MILLIONS OF US DOLLARS EXCEPT SHARE AND PER-SHARE AMOUNTS
16. Environmental Costs and Asset Retirement Obligations continued
Environmental Operating Costs and Capital Expenditures
The company’s operating expenses, other than costs associated with asset retirement obligations, relating to compliance with environmental laws and regulations governing ongoing operations for 2007 were approximately $104.8 (2006 – $92.6; 2005 – $87.2). These amounts include environmental operating expenses related primarily to the production of phosphoric acid, fertilizer, feed and other products.
The company routinely undertakes environmental capital projects. In 2007, capital expenditures of $44.2 (2006 – $13.6) were incurred to meet pollution prevention and control objectives and $0.5 (2006 – $0.2) were incurred to meet other environmental objectives.
Following is a reconciliation of asset retirement and other environmental obligations as at December 31:
2007 2006
Asset retirement obligations, beginning of year $ 100.7 $ 91.8Liabilities incurred 6.8 7.2Liabilities settled (4.5) (3.6)Accretion expense 4.9 3.3Revisions in timing and amount of estimated cash fl ows 8.7 2.0Asset retirement obligations, end of year 116.6 100.7Other environmental liabilities 18.1 18.6Less current portion (Note 12) (13.7) (9.0) $ 121.0 $ 110.3
17. SHARE CAPITAL
Authorized
The company is authorized to issue an unlimited number of common shares without par value and an unlimited number of fi rst preferred shares. The common shares are not redeemable or convertible. The fi rst preferred shares may be issued in one or more series with rights and conditions to be determined by the PCS Board of Directors. No fi rst preferred shares have been issued.
Issued 2007 2006 2005 Consideration Consideration Consideration
Issued, beginning of year $ 1,431.6 $ 1,379.3 $ 1,408.4Shares issued under option plans 28.6 50.9 95.7Shares issued for dividend reinvestment plan 1.1 1.4 0.3Shares repurchased – – (125.1)Issued, end of year $ 1,461.3 $ 1,431.6 $ 1,379.3
2007 2006 2005 Number of Number of Number of Common Shares Common Shares Common Shares
Issued, beginning of year 314,403,147 310,781,376 331,891,509Shares issued under option plans 1,995,460 3,581,424 7,378,782Shares issued for dividend reinvestment plan 12,602 40,347 11,085Shares repurchased – – (28,500,000)Issued, end of year 316,411,209 314,403,147 310,781,376
Stock Split
On May 2, 2007, the Board of Directors of PCS approved a three-for-one split of the company’s outstanding common shares. The stock split was effected in the form of a stock dividend of two additional common shares for each share owned by shareholders of record at the close of business on May 22, 2007. All equity-based benefi t plans and share data have been retroactively adjusted to refl ect the stock split.
Normal Course Issuer Bid
On January 25, 2005, the Board of Directors of PCS authorized a share repurchase program of up to 16,500,000 common shares (approximately 5 percent of the company’s issued and outstanding common shares) through a normal course issuer bid. On September 22, 2005, the Board of Directors authorized an increase in the number of common shares sought under the share repurchase program. This amendment allowed
93Notes to the PotashCorp 2007 Consolidated Financial Statements
IN MILLIONS OF US DOLLARS EXCEPT SHARE AND PER-SHARE AMOUNTS
17. Share Capital continued
the company to repurchase up to 12,000,000 additional common shares. Shares could be repurchased from time to time on the open market through February 14, 2006 at prevailing market prices. The timing and amount of purchases, if any, under the program were dependent upon the availability and alternative uses of capital, market conditions and other factors. The company completed the repurchase program by December 31, 2005. No further program was authorized in 2006 or 2007. On January 23, 2008, the Board of Directors of PCS authorized a share repurchase program of up to 15,820,000 common shares (see Note 34).
During 2005, the company repurchased for cancellation 28,500,000 common shares under the program, at a net cost of $851.9 and an average price per share of $29.89. The repurchase resulted in a reduction of share capital of $125.1, and the excess net cost over the average book value of the shares was recorded as a reduction of contributed surplus of $264.3 and a reduction of retained earnings of $462.5.
18. CONTRIBUTED SURPLUS
2007 2006 2005
Balance, beginning of year $ 62.3 $ 36.3 $ 275.7Stock-based compensation 36.6 26.0 24.9Share repurchases (Note 17) – – (264.3)Balance, end of year $ 98.9 $ 62.3 $ 36.3
19. SEGMENT INFORMATION
The company has three reportable business segments: potash, nitrogen and phosphate. These business segments are differentiated by the chemical nutrient contained in the product that each produces. Inter-segment sales are made under terms that approximate market value. The accounting policies of the segments are the same as those described in Note 2.
2007 Potash Nitrogen Phosphate All others Consolidated
Sales $ 1,797.2 $ 1,799.9 $ 1,637.1 $ – $ 5,234.2Freight 178.1 55.6 112.4 – 346.1Transportation and distribution 39.1 51.6 33.4 – 124.1Net sales – third party 1,580.0 1,692.7 1,491.3 – Cost of goods sold 667.7 1,156.6 1,058.5 – 2,882.8Gross margin 912.3 536.1 432.8 – 1,881.2Inter-segment sales – 112.3 1.9 – –Depreciation and amortization 71.7 88.2 121.1 10.3 291.3Goodwill – 96.6 – 0.4 97.0Assets 1,809.6 1,646.4 1,955.4 4,305.2 9,716.6Additions to property, plant and equipment 338.2 89.7 176.2 3.1 607.2
2006 Potash Nitrogen Phosphate All others Consolidated
Sales $ 1,227.5 $ 1,284.1 $ 1,255.1 $ – $ 3,766.7Freight 130.5 36.8 88.5 – 255.8Transportation and distribution 38.8 52.2 43.1 – 134.1Net sales – third party 1,058.2 1,195.1 1,123.5 – Cost of goods sold 497.1 879.5 998.2 – 2,374.8Gross margin 561.1 315.6 125.3 – 1,002.0Inter-segment sales 5.7 112.4 7.2 – –Depreciation and amortization 58.3 77.6 94.6 11.9 242.4Goodwill – 96.6 – 0.4 97.0Assets 1,478.0 1,480.7 1,753.9 1,504.4 6,217.0Additions to property, plant and equipment 293.2 75.5 119.7 20.2 508.6
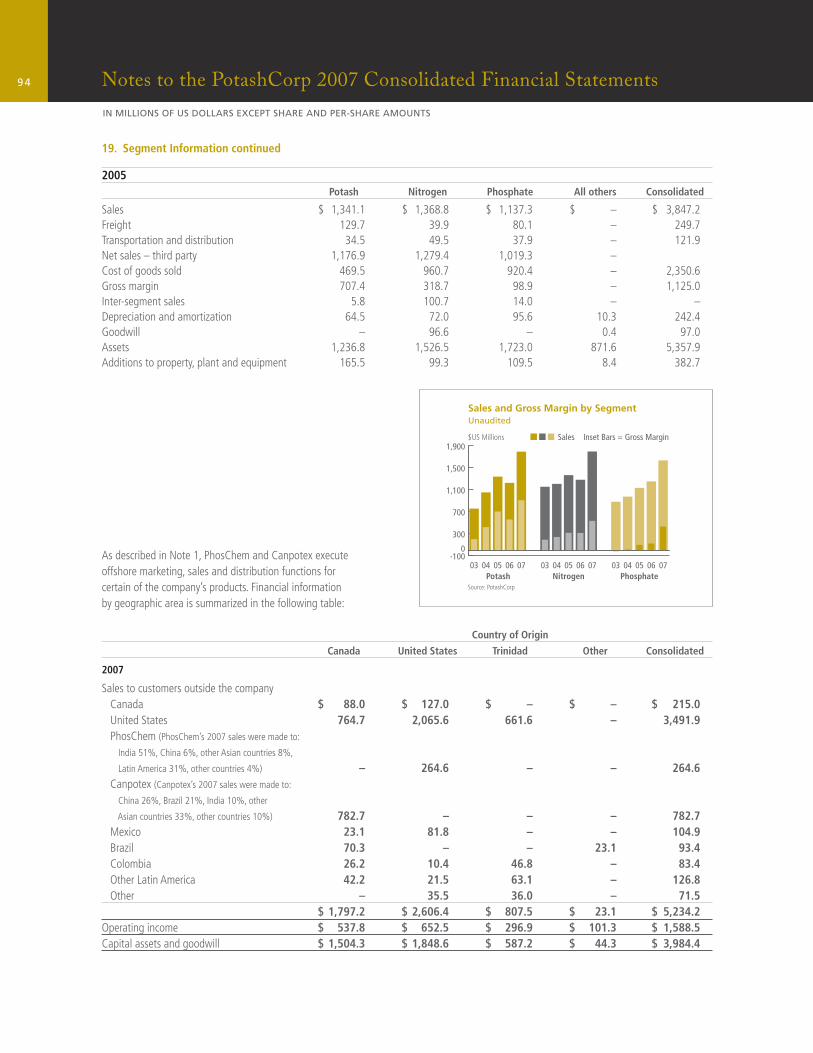
94 Notes to the PotashCorp 2007 Consolidated Financial Statements
IN MILLIONS OF US DOLLARS EXCEPT SHARE AND PER-SHARE AMOUNTS
19. Segment Information continued
2005 Potash Nitrogen Phosphate All others Consolidated
Sales $ 1,341.1 $ 1,368.8 $ 1,137.3 $ – $ 3,847.2Freight 129.7 39.9 80.1 – 249.7Transportation and distribution 34.5 49.5 37.9 – 121.9Net sales – third party 1,176.9 1,279.4 1,019.3 – Cost of goods sold 469.5 960.7 920.4 – 2,350.6Gross margin 707.4 318.7 98.9 – 1,125.0Inter-segment sales 5.8 100.7 14.0 – –Depreciation and amortization 64.5 72.0 95.6 10.3 242.4Goodwill – 96.6 – 0.4 97.0Assets 1,236.8 1,526.5 1,723.0 871.6 5,357.9Additions to property, plant and equipment 165.5 99.3 109.5 8.4 382.7
Country of Origin
Canada United States Trinidad Other Consolidated
2007
Sales to customers outside the company Canada $ 88.0 $ 127.0 $ – $ – $ 215.0 United States 764.7 2,065.6 661.6 – 3,491.9 PhosChem (PhosChem’s 2007 sales were made to:
India 51%, China 6%, other Asian countries 8%,
Latin America 31%, other countries 4%) – 264.6 – – 264.6 Canpotex (Canpotex’s 2007 sales were made to:
China 26%, Brazil 21%, India 10%, other
Asian countries 33%, other countries 10%) 782.7 – – – 782.7 Mexico 23.1 81.8 – – 104.9 Brazil 70.3 – – 23.1 93.4 Colombia 26.2 10.4 46.8 – 83.4 Other Latin America 42.2 21.5 63.1 – 126.8 Other – 35.5 36.0 – 71.5 $ 1,797.2 $ 2,606.4 $ 807.5 $ 23.1 $ 5,234.2Operating income $ 537.8 $ 652.5 $ 296.9 $ 101.3 $ 1,588.5Capital assets and goodwill $ 1,504.3 $ 1,848.6 $ 587.2 $ 44.3 $ 3,984.4
-100
300
700
1,100
1,500
1,900
070605040307060504030706050403
$US Millions
Source: PotashCorp
Sales and Gross Margin by SegmentUnaudited
Sales
0
Potash Nitrogen Phosphate
Inset Bars = Gross Margin
As described in Note 1, PhosChem and Canpotex execute offshore marketing, sales and distribution functions for certain of the company’s products. Financial information by geographic area is summarized in the following table:
95Notes to the PotashCorp 2007 Consolidated Financial Statements
IN MILLIONS OF US DOLLARS EXCEPT SHARE AND PER-SHARE AMOUNTS
19. Segment Information continued
Country of Origin
Canada United States Trinidad Other Consolidated
2006
Sales to customers outside the company Canada $ 65.7 $ 92.0 $ – $ – $ 157.7 United States 557.5 1,454.9 530.2 – 2,542.6 PhosChem (PhosChem’s 2006 sales were made to:
India 40%, China 19%, other Asian countries 14%,
Latin America 22%, other countries 5%) – 232.2 – – 232.2 Canpotex (Canpotex’s 2006 sales were made to:
China 19%, India 10%, other Asian countries 41%,
Brazil 15%, other countries 15%) 467.1 – – – 467.1 Mexico 7.3 72.1 5.1 – 84.5 Brazil 68.7 – – 16.2 84.9 Colombia 20.2 7.5 32.3 – 60.0 Other Latin America 41.0 19.2 38.3 – 98.5 Other – 37.9 1.3 – 39.2 $ 1,227.5 $ 1,915.8 $ 607.2 $ 16.2 $ 3,766.7Operating income $ 426.9 $ 216.4 $ 171.8 $ 60.4 $ 875.5Capital assets and goodwill $ 1,207.7 $ 1,761.3 $ 610.4 $ 43.4 $ 3,622.8
Country of Origin
Canada United States Trinidad Other Consolidated
2005
Sales to customers outside the company Canada $ 69.3 $ 105.9 $ – $ – $ 175.2 United States 576.6 1,470.9 545.5 – 2,593.0 PhosChem (PhosChem’s 2005 sales were made to:
India 29%, China 29%, other Asian countries 22%,
Latin America 14%, other countries 6%) – 166.7 – – 166.7 Canpotex (Canpotex’s 2005 sales were made to:
China 29%, India 11%, other Asian countries 33%,
Brazil 13%, other countries 14%) 577.1 – – – 577.1 Mexico 10.5 64.5 – – 75.0 Brazil 60.3 3.7 – 23.7 87.7 Colombia 19.3 9.3 28.7 – 57.3 Other Latin America 28.0 5.7 31.6 – 65.3 Other – 23.6 26.3 – 49.9 $ 1,341.1 $ 1,850.3 $ 632.1 $ 23.7 $ 3,847.2Operating income $ 464.1 $ 170.2 $ 199.3 $ 59.0 $ 892.6Capital assets and goodwill $ 954.6 $ 1,751.1 $ 612.4 $ 41.7 $ 3,359.8
20. COST OF GOODS SOLD
The primary components of cost of goods sold are labor, employee benefi ts, services, raw materials (including inbound freight and purchasing and receiving costs), operating supplies, energy costs, property and miscellaneous taxes, depreciation and amortization, and provision for plant shutdowns.
Provision for Plant Shutdowns – Phosphate Segment – 2006
In July 2006, the company indefi nitely suspended production of superphosphoric acid and ammonium polyphosphate products at its Geismar, Louisiana location due to higher input costs and lower product margins for those products at that location, compared to the company’s other
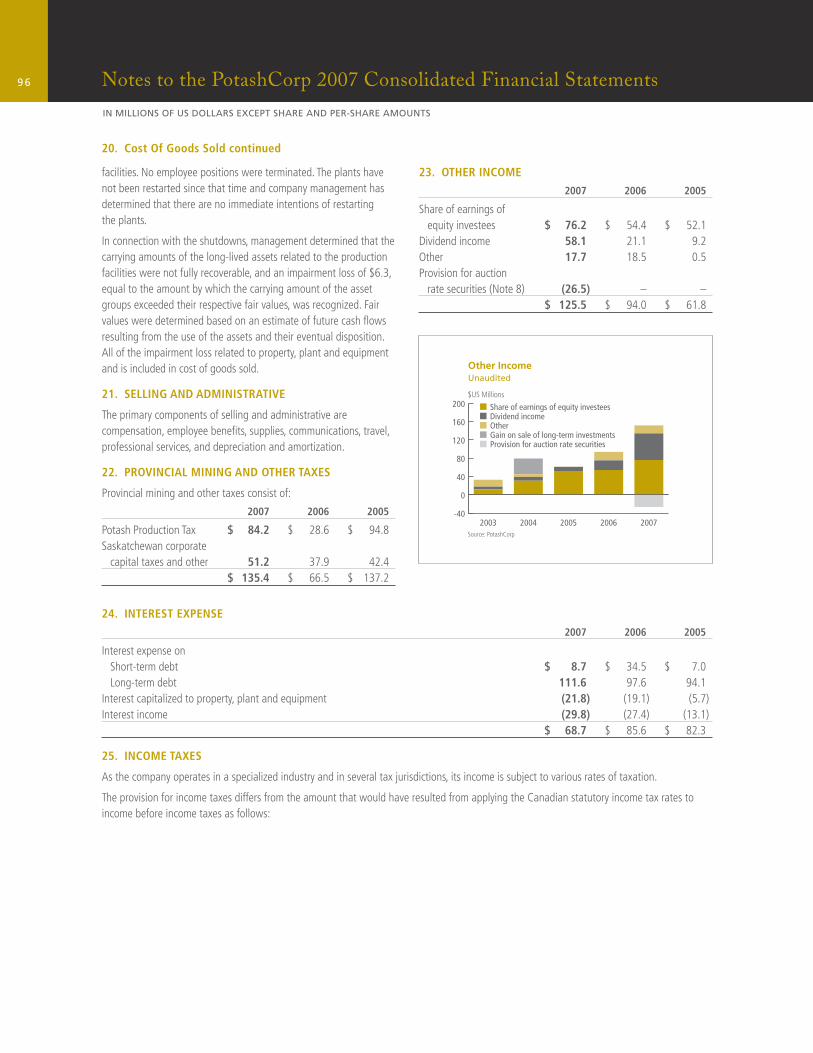
96 Notes to the PotashCorp 2007 Consolidated Financial Statements
IN MILLIONS OF US DOLLARS EXCEPT SHARE AND PER-SHARE AMOUNTS
20. Cost Of Goods Sold continued
facilities. No employee positions were terminated. The plants have not been restarted since that time and company management has determined that there are no immediate intentions of restarting the plants.
In connection with the shutdowns, management determined that the carrying amounts of the long-lived assets related to the production facilities were not fully recoverable, and an impairment loss of $6.3, equal to the amount by which the carrying amount of the asset groups exceeded their respective fair values, was recognized. Fair values were determined based on an estimate of future cash fl ows resulting from the use of the assets and their eventual disposition. All of the impairment loss related to property, plant and equipment and is included in cost of goods sold.
21. SELLING AND ADMINISTRATIVE
The primary components of selling and administrative are compensation, employee benefi ts, supplies, communications, travel, professional services, and depreciation and amortization.
22. PROVINCIAL MINING AND OTHER TAXES
Provincial mining and other taxes consist of:
2007 2006 2005
Potash Production Tax $ 84.2 $ 28.6 $ 94.8Saskatchewan corporate capital taxes and other 51.2 37.9 42.4 $ 135.4 $ 66.5 $ 137.2
23. OTHER INCOME
2007 2006 2005
Share of earnings of equity investees $ 76.2 $ 54.4 $ 52.1Dividend income 58.1 21.1 9.2Other 17.7 18.5 0.5Provision for auction rate securities (Note 8) (26.5) – – $ 125.5 $ 94.0 $ 61.8
24. INTEREST EXPENSE
2007 2006 2005
Interest expense on Short-term debt $ 8.7 $ 34.5 $ 7.0 Long-term debt 111.6 97.6 94.1Interest capitalized to property, plant and equipment (21.8) (19.1) (5.7)Interest income (29.8) (27.4) (13.1) $ 68.7 $ 85.6 $ 82.3
25. INCOME TAXES
As the company operates in a specialized industry and in several tax jurisdictions, its income is subject to various rates of taxation.
The provision for income taxes differs from the amount that would have resulted from applying the Canadian statutory income tax rates to income before income taxes as follows:
-40
0
40
80
120
160
200
20072006200520042003
$US Millions
Source: PotashCorp
Other IncomeUnaudited
Share of earnings of equity investeesDividend incomeOtherGain on sale of long-term investmentsProvision for auction rate securities
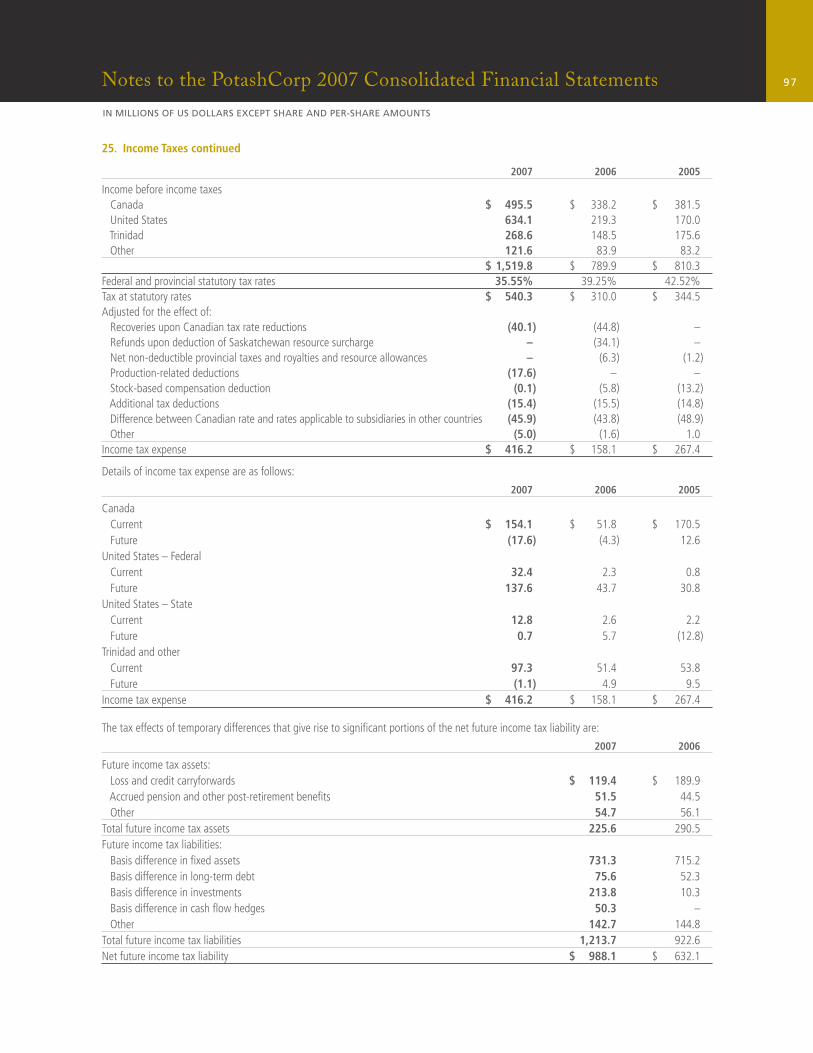
97Notes to the PotashCorp 2007 Consolidated Financial Statements
IN MILLIONS OF US DOLLARS EXCEPT SHARE AND PER-SHARE AMOUNTS
25. Income Taxes continued
2007 2006 2005
Income before income taxes Canada $ 495.5 $ 338.2 $ 381.5 United States 634.1 219.3 170.0 Trinidad 268.6 148.5 175.6 Other 121.6 83.9 83.2 $ 1,519.8 $ 789.9 $ 810.3Federal and provincial statutory tax rates 35.55% 39.25% 42.52%Tax at statutory rates $ 540.3 $ 310.0 $ 344.5Adjusted for the effect of: Recoveries upon Canadian tax rate reductions (40.1) (44.8) – Refunds upon deduction of Saskatchewan resource surcharge – (34.1) – Net non-deductible provincial taxes and royalties and resource allowances – (6.3) (1.2) Production-related deductions (17.6) – – Stock-based compensation deduction (0.1) (5.8) (13.2) Additional tax deductions (15.4) (15.5) (14.8) Difference between Canadian rate and rates applicable to subsidiaries in other countries (45.9) (43.8) (48.9) Other (5.0) (1.6) 1.0Income tax expense $ 416.2 $ 158.1 $ 267.4
Details of income tax expense are as follows:
2007 2006 2005
Canada Current $ 154.1 $ 51.8 $ 170.5 Future (17.6) (4.3) 12.6United States – Federal Current 32.4 2.3 0.8 Future 137.6 43.7 30.8United States – State Current 12.8 2.6 2.2 Future 0.7 5.7 (12.8)Trinidad and other Current 97.3 51.4 53.8 Future (1.1) 4.9 9.5Income tax expense $ 416.2 $ 158.1 $ 267.4
The tax effects of temporary differences that give rise to signifi cant portions of the net future income tax liability are:
2007 2006
Future income tax assets: Loss and credit carryforwards $ 119.4 $ 189.9 Accrued pension and other post-retirement benefi ts 51.5 44.5 Other 54.7 56.1Total future income tax assets 225.6 290.5Future income tax liabilities: Basis difference in fi xed assets 731.3 715.2 Basis difference in long-term debt 75.6 52.3 Basis difference in investments 213.8 10.3 Basis difference in cash fl ow hedges 50.3 – Other 142.7 144.8Total future income tax liabilities 1,213.7 922.6Net future income tax liability $ 988.1 $ 632.1
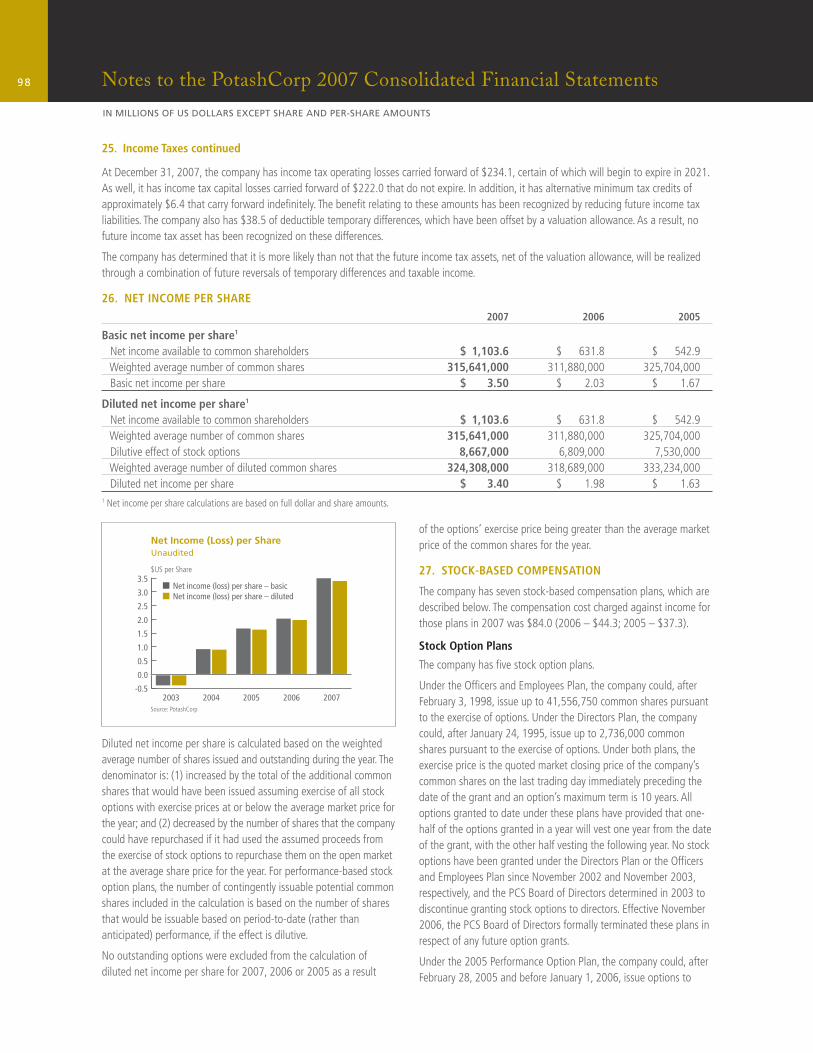
98 Notes to the PotashCorp 2007 Consolidated Financial Statements
IN MILLIONS OF US DOLLARS EXCEPT SHARE AND PER-SHARE AMOUNTS
25. Income Taxes continued
At December 31, 2007, the company has income tax operating losses carried forward of $234.1, certain of which will begin to expire in 2021. As well, it has income tax capital losses carried forward of $222.0 that do not expire. In addition, it has alternative minimum tax credits of approximately $6.4 that carry forward indefi nitely. The benefi t relating to these amounts has been recognized by reducing future income tax liabilities. The company also has $38.5 of deductible temporary differences, which have been offset by a valuation allowance. As a result, no future income tax asset has been recognized on these differences.
The company has determined that it is more likely than not that the future income tax assets, net of the valuation allowance, will be realized through a combination of future reversals of temporary differences and taxable income.
26. NET INCOME PER SHARE
2007 2006 2005
Basic net income per share1
Net income available to common shareholders $ 1,103.6 $ 631.8 $ 542.9 Weighted average number of common shares 315,641,000 311,880,000 325,704,000 Basic net income per share $ 3.50 $ 2.03 $ 1.67
Diluted net income per share1
Net income available to common shareholders $ 1,103.6 $ 631.8 $ 542.9 Weighted average number of common shares 315,641,000 311,880,000 325,704,000 Dilutive effect of stock options 8,667,000 6,809,000 7,530,000 Weighted average number of diluted common shares 324,308,000 318,689,000 333,234,000 Diluted net income per share $ 3.40 $ 1.98 $ 1.631 Net income per share calculations are based on full dollar and share amounts.
Diluted net income per share is calculated based on the weighted average number of shares issued and outstanding during the year. The denominator is: (1) increased by the total of the additional common shares that would have been issued assuming exercise of all stock options with exercise prices at or below the average market price for the year; and (2) decreased by the number of shares that the company could have repurchased if it had used the assumed proceeds from the exercise of stock options to repurchase them on the open market at the average share price for the year. For performance-based stock option plans, the number of contingently issuable potential common shares included in the calculation is based on the number of shares that would be issuable based on period-to-date (rather than anticipated) performance, if the effect is dilutive.
No outstanding options were excluded from the calculation of diluted net income per share for 2007, 2006 or 2005 as a result
of the options’ exercise price being greater than the average market price of the common shares for the year.
27. STOCK-BASED COMPENSATION
The company has seven stock-based compensation plans, which are described below. The compensation cost charged against income for those plans in 2007 was $84.0 (2006 – $44.3; 2005 – $37.3).
Stock Option Plans
The company has fi ve stock option plans.
Under the Offi cers and Employees Plan, the company could, after February 3, 1998, issue up to 41,556,750 common shares pursuant to the exercise of options. Under the Directors Plan, the company could, after January 24, 1995, issue up to 2,736,000 common shares pursuant to the exercise of options. Under both plans, the exercise price is the quoted market closing price of the company’s common shares on the last trading day immediately preceding the date of the grant and an option’s maximum term is 10 years. All options granted to date under these plans have provided that one-half of the options granted in a year will vest one year from the date of the grant, with the other half vesting the following year. No stock options have been granted under the Directors Plan or the Offi cers and Employees Plan since November 2002 and November 2003, respectively, and the PCS Board of Directors determined in 2003 to discontinue granting stock options to directors. Effective November 2006, the PCS Board of Directors formally terminated these plans in respect of any future option grants.
Under the 2005 Performance Option Plan, the company could, after February 28, 2005 and before January 1, 2006, issue options to
-0.5
0.0
0.5
1.0
1.5
2.0
2.5
3.0
3.5
20072006200520042003
$US per Share
Source: PotashCorp
Net Income (Loss) per ShareUnaudited
Net income (loss) per share – basicNet income (loss) per share – diluted
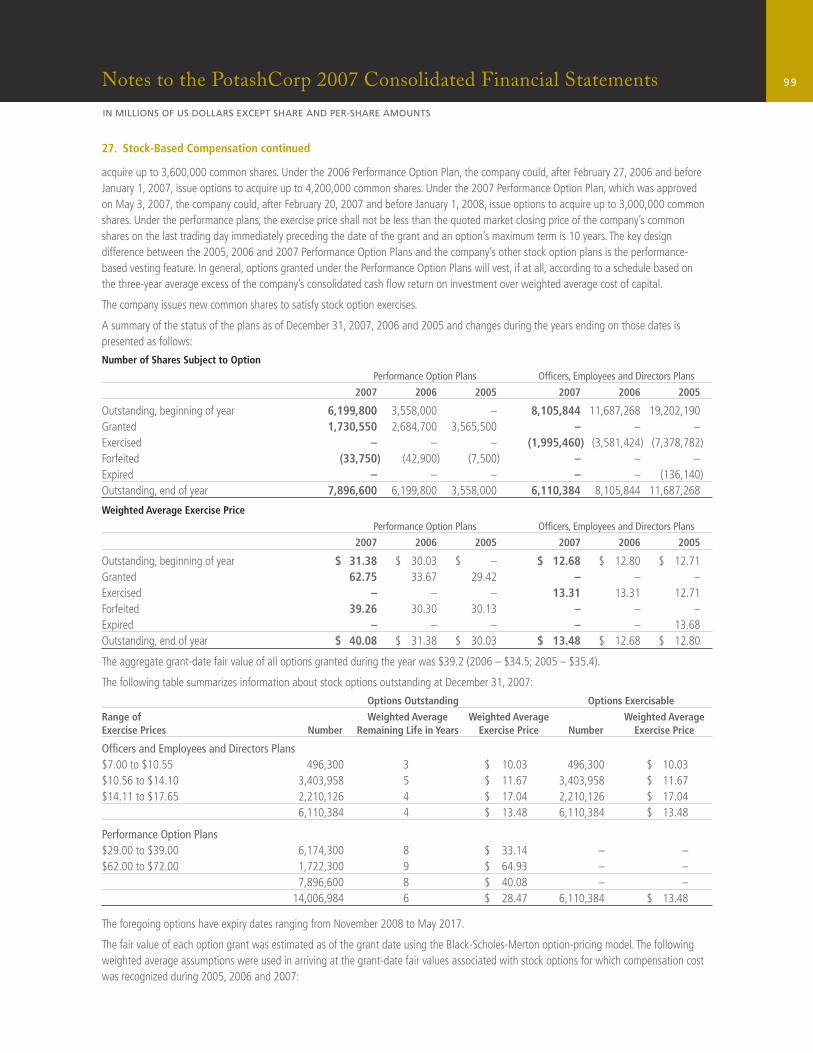
99Notes to the PotashCorp 2007 Consolidated Financial Statements
IN MILLIONS OF US DOLLARS EXCEPT SHARE AND PER-SHARE AMOUNTS
27. Stock-Based Compensation continued
acquire up to 3,600,000 common shares. Under the 2006 Performance Option Plan, the company could, after February 27, 2006 and before January 1, 2007, issue options to acquire up to 4,200,000 common shares. Under the 2007 Performance Option Plan, which was approved on May 3, 2007, the company could, after February 20, 2007 and before January 1, 2008, issue options to acquire up to 3,000,000 common shares. Under the performance plans, the exercise price shall not be less than the quoted market closing price of the company’s common shares on the last trading day immediately preceding the date of the grant and an option’s maximum term is 10 years. The key design difference between the 2005, 2006 and 2007 Performance Option Plans and the company’s other stock option plans is the performance-based vesting feature. In general, options granted under the Performance Option Plans will vest, if at all, according to a schedule based on the three-year average excess of the company’s consolidated cash fl ow return on investment over weighted average cost of capital.
The company issues new common shares to satisfy stock option exercises.
A summary of the status of the plans as of December 31, 2007, 2006 and 2005 and changes during the years ending on those dates is presented as follows:
Number of Shares Subject to Option
Performance Option Plans Offi cers, Employees and Directors Plans
2007 2006 2005 2007 2006 2005
Outstanding, beginning of year 6,199,800 3,558,000 – 8,105,844 11,687,268 19,202,190Granted 1,730,550 2,684,700 3,565,500 – – –Exercised – – – (1,995,460) (3,581,424) (7,378,782)Forfeited (33,750) (42,900) (7,500) – – –Expired – – – – – (136,140)Outstanding, end of year 7,896,600 6,199,800 3,558,000 6,110,384 8,105,844 11,687,268
Weighted Average Exercise Price
Performance Option Plans Offi cers, Employees and Directors Plans
2007 2006 2005 2007 2006 2005
Outstanding, beginning of year $ 31.38 $ 30.03 $ – $ 12.68 $ 12.80 $ 12.71Granted 62.75 33.67 29.42 – – –Exercised – – – 13.31 13.31 12.71Forfeited 39.26 30.30 30.13 – – –Expired – – – – – 13.68Outstanding, end of year $ 40.08 $ 31.38 $ 30.03 $ 13.48 $ 12.68 $ 12.80
The aggregate grant-date fair value of all options granted during the year was $39.2 (2006 – $34.5; 2005 – $35.4).
The following table summarizes information about stock options outstanding at December 31, 2007:
Options Outstanding Options Exercisable
Range of Weighted Average Weighted Average Weighted AverageExercise Prices Number Remaining Life in Years Exercise Price Number Exercise Price
Offi cers and Employees and Directors Plans$7.00 to $10.55 496,300 3 $ 10.03 496,300 $ 10.03$10.56 to $14.10 3,403,958 5 $ 11.67 3,403,958 $ 11.67$14.11 to $17.65 2,210,126 4 $ 17.04 2,210,126 $ 17.04 6,110,384 4 $ 13.48 6,110,384 $ 13.48
Performance Option Plans$29.00 to $39.00 6,174,300 8 $ 33.14 – –$62.00 to $72.00 1,722,300 9 $ 64.93 – – 7,896,600 8 $ 40.08 – – 14,006,984 6 $ 28.47 6,110,384 $ 13.48
The foregoing options have expiry dates ranging from November 2008 to May 2017.
The fair value of each option grant was estimated as of the grant date using the Black-Scholes-Merton option-pricing model. The following weighted average assumptions were used in arriving at the grant-date fair values associated with stock options for which compensation cost was recognized during 2005, 2006 and 2007:
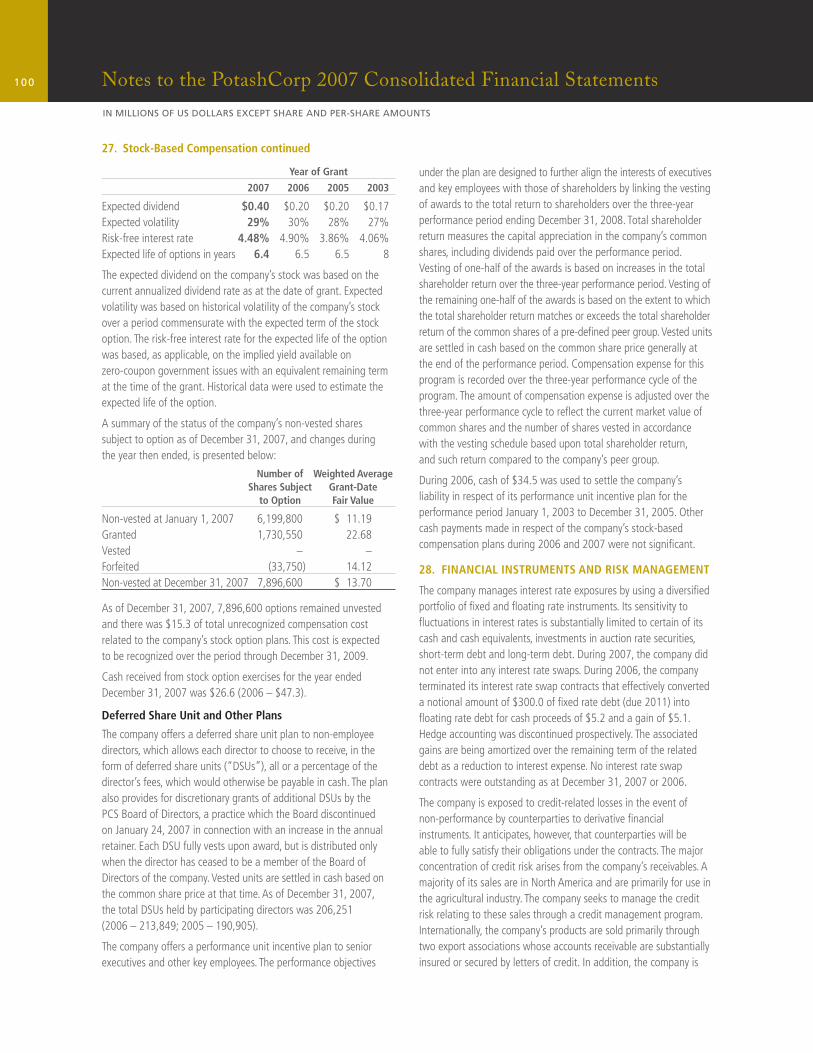
100 Notes to the PotashCorp 2007 Consolidated Financial Statements
IN MILLIONS OF US DOLLARS EXCEPT SHARE AND PER-SHARE AMOUNTS
27. Stock-Based Compensation continued
Year of Grant
2007 2006 2005 2003
Expected dividend $0.40 $0.20 $0.20 $0.17Expected volatility 29% 30% 28% 27%Risk-free interest rate 4.48% 4.90% 3.86% 4.06%Expected life of options in years 6.4 6.5 6.5 8
The expected dividend on the company’s stock was based on the current annualized dividend rate as at the date of grant. Expected volatility was based on historical volatility of the company’s stock over a period commensurate with the expected term of the stock option. The risk-free interest rate for the expected life of the option was based, as applicable, on the implied yield available on zero-coupon government issues with an equivalent remaining term at the time of the grant. Historical data were used to estimate the expected life of the option.
A summary of the status of the company’s non-vested shares subject to option as of December 31, 2007, and changes during the year then ended, is presented below:
Number of Weighted Average Shares Subject Grant-Date to Option Fair Value
Non-vested at January 1, 2007 6,199,800 $ 11.19Granted 1,730,550 22.68Vested – –Forfeited (33,750) 14.12Non-vested at December 31, 2007 7,896,600 $ 13.70
As of December 31, 2007, 7,896,600 options remained unvested and there was $15.3 of total unrecognized compensation cost related to the company’s stock option plans. This cost is expected to be recognized over the period through December 31, 2009.
Cash received from stock option exercises for the year ended December 31, 2007 was $26.6 (2006 – $47.3).
Deferred Share Unit and Other Plans
The company offers a deferred share unit plan to non-employee directors, which allows each director to choose to receive, in the form of deferred share units (“DSUs”), all or a percentage of the director’s fees, which would otherwise be payable in cash. The plan also provides for discretionary grants of additional DSUs by the PCS Board of Directors, a practice which the Board discontinued on January 24, 2007 in connection with an increase in the annual retainer. Each DSU fully vests upon award, but is distributed only when the director has ceased to be a member of the Board of Directors of the company. Vested units are settled in cash based on the common share price at that time. As of December 31, 2007, the total DSUs held by participating directors was 206,251 (2006 – 213,849; 2005 – 190,905).
The company offers a performance unit incentive plan to senior executives and other key employees. The performance objectives
under the plan are designed to further align the interests of executives and key employees with those of shareholders by linking the vesting of awards to the total return to shareholders over the three-year performance period ending December 31, 2008. Total shareholder return measures the capital appreciation in the company’s common shares, including dividends paid over the performance period. Vesting of one-half of the awards is based on increases in the total shareholder return over the three-year performance period. Vesting of the remaining one-half of the awards is based on the extent to which the total shareholder return matches or exceeds the total shareholder return of the common shares of a pre-defi ned peer group. Vested units are settled in cash based on the common share price generally at the end of the performance period. Compensation expense for this program is recorded over the three-year performance cycle of the program. The amount of compensation expense is adjusted over the three-year performance cycle to refl ect the current market value of common shares and the number of shares vested in accordance with the vesting schedule based upon total shareholder return, and such return compared to the company’s peer group.
During 2006, cash of $34.5 was used to settle the company’s liability in respect of its performance unit incentive plan for the performance period January 1, 2003 to December 31, 2005. Other cash payments made in respect of the company’s stock-based compensation plans during 2006 and 2007 were not signifi cant.
28. FINANCIAL INSTRUMENTS AND RISK MANAGEMENT
The company manages interest rate exposures by using a diversifi ed portfolio of fi xed and fl oating rate instruments. Its sensitivity to fl uctuations in interest rates is substantially limited to certain of its cash and cash equivalents, investments in auction rate securities, short-term debt and long-term debt. During 2007, the company did not enter into any interest rate swaps. During 2006, the company terminated its interest rate swap contracts that effectively converted a notional amount of $300.0 of fi xed rate debt (due 2011) into fl oating rate debt for cash proceeds of $5.2 and a gain of $5.1. Hedge accounting was discontinued prospectively. The associated gains are being amortized over the remaining term of the related debt as a reduction to interest expense. No interest rate swap contracts were outstanding as at December 31, 2007 or 2006.
The company is exposed to credit-related losses in the event of non-performance by counterparties to derivative fi nancial instruments. It anticipates, however, that counterparties will be able to fully satisfy their obligations under the contracts. The major concentration of credit risk arises from the company’s receivables. A majority of its sales are in North America and are primarily for use in the agricultural industry. The company seeks to manage the credit risk relating to these sales through a credit management program. Internationally, the company’s products are sold primarily through two export associations whose accounts receivable are substantially insured or secured by letters of credit. In addition, the company is
101Notes to the PotashCorp 2007 Consolidated Financial Statements
IN MILLIONS OF US DOLLARS EXCEPT SHARE AND PER-SHARE AMOUNTS
28. Financial Instruments and Risk Management continued
exposed to liquidity and credit risk on investments in auction rate securities due to the current lack of liquidity for the investments in auction rate securities held in the company’s trading account that has existed since August 2007. Due to the lack of liquidity, the securities have been held longer than the approximately 28 days that was originally anticipated. The auction rate securities consist of collateralized loan obligations consisting primarily of corporate bonds with a face value of $48.3 and collateralized debt obligations consisting primarily of publicly traded debt with a face value of $84.2. Of the total $76.5 unrealized decrease in the fair value of investments in auction rate securities, $50.0 is included in OCI and $26.5 is included in net income (see Note 8). The company is uncertain as to when the liquidity for such securities will improve.
Fair Value
Due to their short-term nature, the fair value of cash and cash equivalents, accounts receivable, short-term debt, and accounts payable and accrued charges is assumed to approximate carrying value. The effective interest rate on the investments in auction rate securities held within the company’s trading account at December 31, 2007 was 13.40 percent (2006 – 5.33 percent). The effective interest rate on the company’s short-term debt at December 31, 2007 was 5.17 percent (2006 – 5.51 percent). The fair value of the company’s notes payable at December 31, 2007 approximated $1,364.8 (2006 – $1,776.8) and refl ects a current yield valuation based on observed market prices. The current yield on the notes payable ranges from 4.64 percent to 6.45 percent (2006 – 5.47 percent to 6.16 percent). The fair value of the company’s other long-term debt instruments approximated carrying value.
29. CONTINGENCIES
Canpotex
PCS is a shareholder in Canpotex, which markets potash offshore. Should any operating losses or other liabilities be incurred by Canpotex, the shareholders have contractually agreed to reimburse it for such losses or liabilities in proportion to their productive capacity. There were no such operating losses or other liabilities in 2007, 2006 or 2005.
Mining Risk
In common with other companies in the industry, the company is unable to acquire insurance for underground assets.
Investment in APC
The company is party to a shareholders agreement with Jordan Investment Company (“JIC”) with respect to its investment in APC. The terms of the shareholders agreement provide that, from October 17, 2006 to October 16, 2009, JIC may seek to exercise a put option (the “Put”) to require the company to purchase JIC’s remaining common shares in APC. If the Put were exercised, the company’s purchase price would be calculated in accordance with a specifi ed formula based, in part, on earnings of APC. The amount
which the company may have to pay for JIC’s remaining common shares if there was to be a valid exercise of the Put would be determinable at the time JIC provides appropriate notice to the company pursuant to the terms of the agreement.
Legal and Other Matters
Signifi cant matters of note include the following:
• In 1994, PCS Joint Venture responded to information requests from the US Environmental Protection Agency (“USEPA”) and the Georgia Department of Natural Resources, Environmental Protection Division (“GEPD”) regarding conditions at its Moultrie, Georgia location. PCS Joint Venture believes that the lead-contaminated soil and groundwater found at the site are attributable to former operations at the site prior to PCS Joint Venture’s ownership. In 2005, the GEPD approved a Corrective Action Plan to address environmental conditions at this location. As anticipated, the approved remedy requires some excavation and off-site disposal of impacted soil and installation of a groundwater recovery and treatment system. PCS Joint Venture began the remediation in November 2005 and completed soil excavation in March 2006, and it is proceeding consistent with the projected schedule and budget.
• In 1998, the company, along with other parties, was notifi ed by the USEPA of potential liability under the US federal Comprehensive Environmental Response, Compensation and Liability Act of 1980 (“CERCLA”) with respect to certain soil and groundwater conditions at a PCS Joint Venture blending facility in Lakeland, Florida and certain adjoining property. In 1999, PCS Joint Venture signed an Administrative Order on Consent with the USEPA pursuant to which PCS Joint Venture agreed to conduct a Remedial Investigation and Feasibility Study (“RI/FS”) of these conditions. PCS Joint Venture and another party shared the cost of the RI/FS, which is now complete. A Record of Decision (“ROD”) based upon the RI/FS was issued on September 27, 2007. The ROD provides for a remedy that requires excavation of impacted soils and interim treatment of groundwater. The total remedy cost is estimated in the ROD to be $8.5. Soil excavation activities are expected to begin by the end of 2008. The USEPA has issued letters to PCS Joint Venture and fi ve other alleged potentially responsible parties and negotiations are underway regarding the appropriate share of the cost of the remedy that should be borne by each party. Although PCS Joint Venture sold the Lakeland property in July 2006, it has retained the above-described remediation responsibilities and has indemnifi ed the third-party purchaser for the costs of remediation and certain related claims.
• The USEPA has identifi ed PCS Nitrogen, Inc. (“PCS Nitrogen”) as a potentially responsible party with respect to a former fertilizer blending operation in Charleston, South Carolina, known as the Planters Property or Columbia Nitrogen site, formerly owned by a company from which PCS Nitrogen acquired certain other assets.
102 Notes to the PotashCorp 2007 Consolidated Financial Statements
IN MILLIONS OF US DOLLARS EXCEPT SHARE AND PER-SHARE AMOUNTS
29. Contingencies continued
The USEPA has requested reimbursement of $3.0 of previously incurred response costs and the performance or fi nancing of future site investigation and response activities from PCS Nitrogen and other named potentially responsible parties. In September 2005, Ashley II of Charleston, L.L.C., the current owner of the Planters Property, fi led a complaint in the United States District Court for the District of South Carolina (the “Court”) seeking a declaratory judgment that PCS Nitrogen is liable to pay environmental response costs that Ashley II of Charleston, L.L.C. alleges it has incurred and will incur in connection with response activities at the site. In the third quarter of 2007, the Court issued its decision for the fi rst phase of the case, in which it determined that PCS Nitrogen is the successor to a former owner of the site and may be liable to Ashley II of Charleston, L.L.C. for its environmental response costs at the site. PCS Nitrogen has fi led a motion with the Court for certifi cation of an interlocutory appeal of the Court’s order and to stay further proceedings pending a decision on the appeal from the Fourth Circuit Appellate Court. PCS Nitrogen expects that the Court will rule on the motion for certifi cation in the fi rst quarter of 2008. PCS Nitrogen has also fi led third-party complaints in the case against owners and operators that it believes should be responsible parties with respect to the site. In the event PCS Nitrogen is unsuccessful in its appeal of the Court’s order, PCS Nitrogen will pursue the third-party complaints in the second phase of the case during which the Court will enter a fi nal decision regarding the allocation and amount of any such liability. PCS Nitrogen denies that it is a potentially responsible party and is vigorously defending its interests in these actions.
• PCS Phosphate, along with several other entities, has received notice from parties to an Administrative Settlement Agreement (“Settling Parties”) with USEPA of alleged contribution liability under CERCLA for costs incurred and to be incurred addressing PCB soil contamination at the Ward Superfund Site in Raleigh, North Carolina (“Site”). PCS Phosphate has agreed to participate, on a non-joint and several basis, with the Settling Parties in the performance of the removal action and the payment of other costs associated with the Site, including reimbursement of USEPA’s past costs. The cost of performing the removal at the Site is estimated at $30.0. The removal activities commenced at the Site in August 2007. The company anticipates recovering some portion of its expenditures in this matter from other liable parties. USEPA is evaluating response actions for PCB-impacted sediments downstream of the Site but has not issued a fi nal remedy for those sediments.
• The USEPA announced an initiative to evaluate implementation within the phosphate industry of a particular exemption for mineral processing wastes under the hazardous waste program. In connection with this industry-wide initiative, the USEPA conducted hazardous waste compliance evaluation inspections at numerous phosphate operations, including the company’s plants in Aurora,
North Carolina, Geismar, Louisiana and White Springs, Florida. The USEPA has notifi ed the company of various alleged violations of the Resource Conservation and Recovery Act at the company’s Aurora and White Springs plants. The company and other industry members have met with representatives of the US Department of Justice, USEPA and various state environmental agencies regarding potential resolution of these matters. During these meetings, the company was informed that the USEPA also believes the Geismar plant is in violation of these requirements. The company is uncertain if any resolution will be possible without litigation, or, if litigation occurs, what the outcome would be. At this time, the company is unable to evaluate the extent of any exposure that it may have in these matters.
• Pursuant to the 1996 Corrective Action Consent Order (the “Order”) executed between PCS Nitrogen Fertilizer, LP, formerly known as Arcadian Fertilizer, LP (“PCS Nitrogen Fertilizer”) and GEPD in conjunction with PCS Nitrogen Fertilizer’s purchase of certain real property from the entity from which PCS Nitrogen Fertilizer previously leased such property, PCS Nitrogen Fertilizer agreed to perform certain activities including a facility investigation and, if necessary, a corrective action. In accordance with the Order, PCS Nitrogen Fertilizer has performed an investigation of environmental site conditions and has documented its fi ndings in several successive facility investigation reports submitted to GEPD. Based on these fi ndings and on the requirements of the Order, PCS Nitrogen Fertilizer is implementing a pilot study to evaluate the viability of in-situ bioremediation of groundwater at the site. In the event the technology proves successful and full-scale implementation is warranted, upon GEPD approval, a full-scale bioremediation remedy will be implemented. If the pilot study proves unsuccessful or if GEPD does not approve this remedial strategy, other, more costly remediation alternatives may need to be evaluated and implemented.
The company is also engaged in ongoing site assessment and/or remediation activities at a number of other facilities and sites. Based on current information, it does not believe that its future obligations with respect to these facilities and sites are reasonably likely to have a material adverse effect on its consolidated fi nancial position or results of operations.
Various other claims and lawsuits are pending against the company in the ordinary course of business. While it is not possible to determine the ultimate outcome of such actions at this time, and there exist inherent uncertainties in predicting such outcomes, it is management’s belief that the ultimate resolution of such actions is not reasonably likely to have a material adverse effect on the company’s consolidated fi nancial position or results of operations.
The breadth of the company’s operations and the global complexity of tax regulations require assessments of uncertainties and judgments in estimating the taxes it will ultimately pay. The fi nal
103Notes to the PotashCorp 2007 Consolidated Financial Statements
IN MILLIONS OF US DOLLARS EXCEPT SHARE AND PER-SHARE AMOUNTS
29. Contingencies continued
taxes paid are dependent upon many factors, including negotiations with taxing authorities in various jurisdictions, outcomes of tax litigation and resolution of disputes arising from federal, provincial, state and local tax audits. The resolution of these uncertainties and the associated fi nal taxes may result in adjustments to the company’s tax assets and tax liabilities.
The company owns facilities that have been either permanently or indefi nitely shut down. It expects to incur nominal annual expenditures for site security and other maintenance costs at certain of these facilities. Should the facilities be dismantled, certain other shutdown-related costs may be incurred. Such costs would not be expected to have a material adverse effect on the company’s consolidated fi nancial position or results of operations and would be recognized and recorded in the period in which they were incurred.
30. GUARANTEES
In the normal course of operations, the company provides indemnifi cations that are often standard contractual terms to counterparties in transactions such as purchase and sale contracts, service agreements, director/offi cer contracts and leasing transactions. These indemnifi cation agreements may require the company to compensate the counterparties for costs incurred as a result of various events, including environmental liabilities and changes in (or in the interpretation of) laws and regulations, or as a result of litigation claims or statutory sanctions that may be suffered by the counterparty as a consequence of the transaction. The terms of these indemnifi cation agreements will vary based upon the contract, the nature of which prevents the company from making a reasonable estimate of the maximum potential amount that it could be required to pay to counterparties. Historically, the company has not made any signifi cant payments under such indemnifi cations and no amounts have been accrued in the accompanying consolidated fi nancial statements with respect to these indemnifi cation guarantees (apart from any appropriate accruals relating to the underlying potential liabilities).
The company enters into agreements in the normal course of business that may contain features that meet the defi nition of a guarantee. Various debt obligations (such as overdrafts, lines of credit with counterparties for derivatives, and back-to-back loan arrangements) and other commitments (such as railcar leases) related to certain subsidiaries and investees have been directly guaranteed by the company under such agreements with third parties. The company would be required to perform on these guarantees in the event of default by the guaranteed parties. No material loss is anticipated by reason of such agreements and guarantees. At December 31, 2007, the maximum potential amount of future (undiscounted) payments under signifi cant guarantees provided to third parties approximated $454.7. As many of these guarantees will not be drawn upon and the maximum potential amount of future payments does not consider the possibility of recovery under recourse or collateral provisions, this
amount is not indicative of future cash requirements or the company’s expected losses from these arrangements. At December 31, 2007, no subsidiary balances subject to guarantees were outstanding in connection with the company’s cash management facilities, and it had no liabilities recorded for other obligations other than subsidiary bank borrowings of approximately $5.9, which are refl ected in other long-term debt in Note 13, and the cash margin requirements to maintain derivatives as disclosed in Note 12.
The company has guaranteed the gypsum stack capping, closure and post-closure obligations of White Springs and PCS Nitrogen in Florida and Louisiana, respectively, pursuant to the fi nancial assurance regulatory requirements in those states. In February 2005, the Florida Environmental Regulation Commission approved certain modifi cations to the fi nancial assurance requirements designed to ensure that responsible parties have suffi cient resources to cover all closure and post-closure costs and liabilities associated with gypsum stacks in the state. The new requirements became effective in July 2005 and include fi nancial strength tests that are more stringent than under previous law and a requirement that gypsum stack closure cost estimates include the cost of treating process water.
The environmental regulations of the Province of Saskatchewan require each potash mine to have decommissioning and reclamation plans. Financial assurances for these plans must be established within one year following approval of these plans by the responsible provincial minister. The Minister of Environment for Saskatchewan provisionally approved the plans in July 2000. In July 2001, a Cdn $2.0 irrevocable letter of credit was posted. The company submitted a revised plan when it was due in 2006 and is awaiting a response from the Province. The company is unable to predict, at this time, the outcome of the ongoing review of the plans or the timing of implementation and structure of any fi nancial assurance requirements.
The company has met its fi nancial assurance responsibilities as of December 31, 2007. Costs associated with the retirement of long-lived tangible assets have been accrued in the accompanying consolidated fi nancial statements to the extent that a legal liability to retire such assets exists (see Note 16).
During the year, the company entered into various other commercial letters of credit in the normal course of operations. As at December 31, 2007, $23.9 of letters of credit were outstanding (2006 – $17.3).
The company expects that it will be able to satisfy all applicable credit support requirements without disrupting normal business operations.
31. RELATED PARTY TRANSACTIONS
Sales to Canpotex are at prevailing market prices. Sales for the year ended December 31, 2007 were $782.7 (2006 – $467.1; 2005 – $577.1). Account balances resulting from the Canpotex transactions are included in the Consolidated Statements of Financial Position and settled on normal trade terms (see Note 4).
104 Notes to the PotashCorp 2007 Consolidated Financial Statements
IN MILLIONS OF US DOLLARS EXCEPT SHARE AND PER-SHARE AMOUNTS
32. COMPARATIVE FIGURES
Certain of the prior years’ fi gures have been reclassifi ed to conform with the current year’s presentation.
33. RECONCILIATION OF CANADIAN AND UNITED STATES GENERALLY ACCEPTED ACCOUNTING PRINCIPLES
Canadian GAAP varies in certain signifi cant respects from US GAAP. As required by the United States Securities and Exchange Commission, the effect of these principal differences on the company’s consolidated fi nancial statements is described and quantifi ed below:
(a) Long-term investments: Prior to January 1, 2007, the company’s investments in ICL and Sinofert were stated at cost under Canadian GAAP. US GAAP requires that these investments be classifi ed as available-for-sale and be stated at market value with the difference between market value and cost reported as a component of OCI. As described in Note 3, Canadian GAAP related to this matter was amended to be consistent with US GAAP on a prospective basis effective January 1, 2007.
Certain of the company’s investments in international entities are accounted for under the equity method. Accounting principles generally accepted in those foreign jurisdictions may vary in certain important respects from Canadian GAAP and in certain other respects from US GAAP. The company’s share of earnings of these equity investees under Canadian GAAP has been adjusted for the signifi cant effects of conforming to US GAAP.
(b) Property, plant and equipment and goodwill: The net book value of property, plant and equipment and goodwill under Canadian GAAP is higher than under US GAAP, as past provisions for asset impairment under Canadian GAAP were measured based on the undiscounted cash fl ow from use together with the residual value of the assets. Under US GAAP, they were measured based on fair value, which was lower than the undiscounted cash fl ow from use together with the residual value of the assets. Fair value for this purpose was determined based on discounted expected future net cash fl ows.
(c) Depreciation and amortization: Depreciation and amortization under Canadian GAAP is higher than under US GAAP, as a result of differences in the carrying amounts of property, plant and equipment under Canadian and US GAAP.
(d) Exploration costs: Under Canadian GAAP, capitalized exploration costs are classifi ed under property, plant and equipment. For US GAAP, these costs are generally expensed until such time as a fi nal feasibility study has confi rmed the existence of a commercially mineable deposit.
(e) Pre-operating costs: Operating costs incurred during the start-up phase of new projects are deferred under Canadian GAAP until commercial production levels are reached, at which time they
are amortized over the estimated life of the project. US GAAP requires that these costs be expensed as incurred. As at December 31, 2007 and 2006, the start-up costs deferred for Canadian GAAP were not material.
(f) Pension and other post-retirement benefi ts: Under Canadian GAAP, when a defi ned benefi t plan gives rise to an accrued benefi t asset, a company must recognize a valuation allowance for the excess of the adjusted benefi t asset over the expected future benefi t to be realized from the plan asset. Changes in the pension valuation allowance are recognized in income. US GAAP does not specifi cally address pension valuation allowances, and the US regulators have interpreted this to be a difference between Canadian GAAP and US GAAP. In light of this, a difference between Canadian GAAP and US GAAP has been recorded for the effects of recognizing a pension valuation allowance and the changes therein under Canadian GAAP.
In addition, US GAAP requires the company to recognize the difference between the benefi t obligation and the fair value of plan assets in the Consolidated Statements of Financial Position with the offset to OCI. No similar requirement currently exists under Canadian GAAP.
(g) Foreign currency translation adjustment: The company adopted the US dollar as its functional and reporting currency on January 1, 1995. At that time, the consolidated fi nancial statements were translated into US dollars at the December 31, 1994 year-end exchange rate using the translation of convenience method under Canadian GAAP. This translation method was not permitted under US GAAP. US GAAP required the comparative Consolidated Statements of Operations and Consolidated Statements of Cash Flow to be translated at applicable weighted average exchange rates, whereas the Consolidated Statements of Financial Position were permitted to be translated at the December 31, 1994 year-end exchange rate. The use of disparate exchange rates under US GAAP gave rise to a foreign currency translation adjustment. Under US GAAP, this adjustment is reported as a component of accumulated OCI.
(h) Derivative instruments and hedging activities: Prior to January 1, 2007 under Canadian GAAP, the company’s derivatives used for non-trading purposes that did not qualify for hedge accounting were carried at fair value on the Consolidated Statements of Financial Position, with changes in fair value refl ected in earnings. Derivatives embedded within instruments were generally not separately accounted for except for those related to equity-linked deposit contracts, which are not applicable to the company. Gains and losses on derivative instruments held within an effective hedge relationship were recognized in earnings on the same basis and in the same period as the underlying hedged items. There was no difference in accounting between Canadian GAAP and US GAAP in respect of derivatives held by the company that do not qualify for
105Notes to the PotashCorp 2007 Consolidated Financial Statements
IN MILLIONS OF US DOLLARS EXCEPT SHARE AND PER-SHARE AMOUNTS
33. Reconciliation of Canadian and United States Generally Accepted Accounting Principles continued
hedge accounting. Unlike Canadian GAAP, however, the company recognized all of its derivative instruments (whether designated in hedging relationships or not, or embedded within hybrid instruments) at fair value on the Consolidated Statements of Financial Position for US GAAP purposes. Under US GAAP, the accounting for changes in the fair value (i.e. gains or losses) of a derivative instrument depends on whether it has been designated and qualifi es as part of a hedging relationship. For strategies designated as fair value hedges, the effective portion of the change in the fair value of the derivative is offset in income against the change in fair value, attributed to the risk being hedged, of the underlying hedged asset, liability or fi rm commitment. For cash fl ow hedges, the effective portion of the changes in the fair value of the derivative is accumulated in OCI until the variability in cash fl ows being hedged is recognized in earnings in future accounting periods. For both fair value and cash fl ow hedges, if a derivative instrument is designated as a hedge and meets the criteria for hedge effectiveness, earnings offset is available, but only to the extent that the hedge is effective. Ineffective portions of fair value or cash fl ow hedges are recorded in earnings in the current period.
As described in Note 3, Canadian GAAP related to this matter was amended to be consistent with US GAAP on a prospective basis effective January 1, 2007.
(i) Comprehensive income: Comprehensive income is recognized and measured under US GAAP pursuant to SFAS No. 130, “Reporting Comprehensive Income”. This standard defi nes comprehensive income as all changes in equity other than those resulting from investments by owners and distributions to owners. Comprehensive income is comprised of net income and OCI. OCI refers to amounts that are recorded as an element of shareholders’ equity but are excluded from net income because these transactions or events were attributed to changes from non-owner sources. As described in Note 3, Canadian standards relating to comprehensive income are effective January 1, 2007 on a prospective basis.
(j) Stock-based compensation: Under Canadian GAAP, the company’s stock-based compensation plan awards classifi ed as liabilities are measured at intrinsic value at each reporting period. Effective January 1, 2006, US GAAP requires that these liability awards be measured at fair value at each reporting period. As at December 31, 2007, the difference between Canadian GAAP and US GAAP was not signifi cant. The company uses a Monte Carlo simulation model to estimate the fair value of its performance unit incentive plan liability for US GAAP purposes.
Under Canadian GAAP, stock options are recognized over the service period, which for the company is established by the option performance period. Effective January 1, 2006, under US GAAP stock options are recognized over the requisite service period which does not commence until the option plan is approved by
the company’s shareholders and options are granted thereunder. For options granted under the PotashCorp 2006 Performance Option Plan, the service period commenced January 1, 2006 under Canadian GAAP and May 4, 2006 under US GAAP. For options granted under the PotashCorp 2007 Performance Option Plan, the service period commenced January 1, 2007 under Canadian GAAP and May 3, 2007 under US GAAP. This difference impacts the stock-based compensation cost recorded and may impact diluted earnings per share.
(k) Stripping costs: Under Canadian GAAP, the company capitalizes and amortizes costs associated with the activity of removing overburden and other mine waste minerals in the production phase. Effective January 1, 2006, US GAAP requires such stripping costs to be attributed to ore produced in that period as a component of inventory and recognized in cost of sales in the same period as related revenue. In accordance with US GAAP, the company has recorded the effect of initially applying this consensus as a cumulative-effect adjustment recognized in the opening balance of retained earnings as of January 1, 2006.
(l) Income taxes related to the above adjustments: The income tax adjustment refl ects the impact on income taxes of the US GAAP adjustments described above. Accounting for income taxes under Canadian GAAP and US GAAP is similar, except that income tax rates of enacted or substantively enacted tax law must be used to calculate future income tax assets and liabilities under Canadian GAAP, whereas only income tax rates of enacted tax law can be used under US GAAP.
(m) Income tax consequences of stock-based employee compensation: Under Canadian GAAP, the income tax benefi t attributable to stock-based compensation that is deductible in computing taxable income but is not recorded in the consolidated fi nancial statements as an expense of any period (the “excess benefi t”) is considered to be a permanent difference. Accordingly, such amount is treated as an item that reconciles the statutory income tax rate to the company’s effective income tax rate. Under US GAAP, the excess benefi t is recognized as additional paid-in capital.
(n) Income taxes related to uncertain income tax positions: US GAAP prescribes a comprehensive model for how a company should recognize, measure, present and disclose in its consolidated fi nancial statements uncertain income tax positions that it has taken or expects to take on a tax return (including a decision whether to fi le or not to fi le a return in a particular jurisdiction). Canadian GAAP has no similar requirements related to uncertain income tax positions.
(o) Cash fl ow statements: US GAAP requires the disclosure of income taxes paid. Canadian GAAP requires the disclosure of income tax cash fl ows, which would include any income taxes recovered during the year.
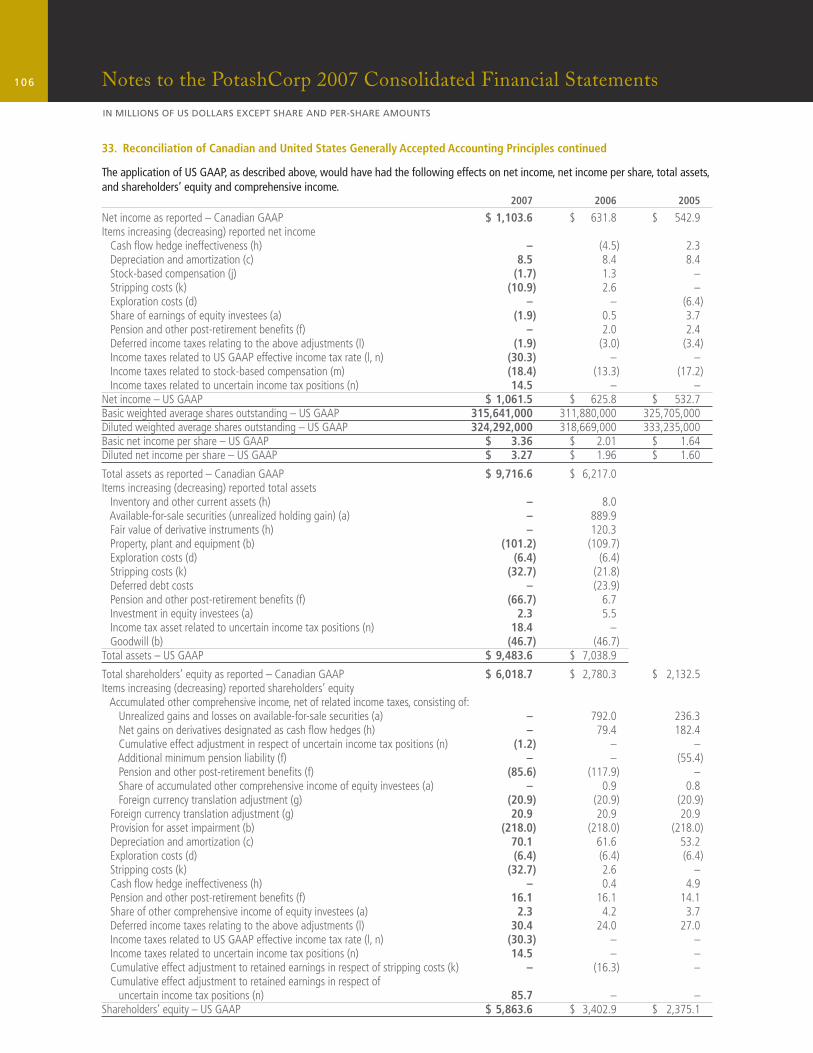
106 Notes to the PotashCorp 2007 Consolidated Financial Statements
IN MILLIONS OF US DOLLARS EXCEPT SHARE AND PER-SHARE AMOUNTS
33. Reconciliation of Canadian and United States Generally Accepted Accounting Principles continued
The application of US GAAP, as described above, would have had the following effects on net income, net income per share, total assets, and shareholders’ equity and comprehensive income. 2007 2006 2005
Net income as reported – Canadian GAAP $ 1,103.6 $ 631.8 $ 542.9Items increasing (decreasing) reported net income Cash fl ow hedge ineffectiveness (h) – (4.5) 2.3 Depreciation and amortization (c) 8.5 8.4 8.4 Stock-based compensation (j) (1.7) 1.3 – Stripping costs (k) (10.9) 2.6 – Exploration costs (d) – – (6.4) Share of earnings of equity investees (a) (1.9) 0.5 3.7 Pension and other post-retirement benefi ts (f) – 2.0 2.4 Deferred income taxes relating to the above adjustments (l) (1.9) (3.0) (3.4) Income taxes related to US GAAP effective income tax rate (l, n) (30.3) – – Income taxes related to stock-based compensation (m) (18.4) (13.3) (17.2) Income taxes related to uncertain income tax positions (n) 14.5 – –Net income – US GAAP $ 1,061.5 $ 625.8 $ 532.7Basic weighted average shares outstanding – US GAAP 315,641,000 311,880,000 325,705,000Diluted weighted average shares outstanding – US GAAP 324,292,000 318,669,000 333,235,000Basic net income per share – US GAAP $ 3.36 $ 2.01 $ 1.64Diluted net income per share – US GAAP $ 3.27 $ 1.96 $ 1.60
Total assets as reported – Canadian GAAP $ 9,716.6 $ 6,217.0 Items increasing (decreasing) reported total assets Inventory and other current assets (h) – 8.0 Available-for-sale securities (unrealized holding gain) (a) – 889.9 Fair value of derivative instruments (h) – 120.3 Property, plant and equipment (b) (101.2) (109.7) Exploration costs (d) (6.4) (6.4) Stripping costs (k) (32.7) (21.8) Deferred debt costs – (23.9) Pension and other post-retirement benefi ts (f) (66.7) 6.7 Investment in equity investees (a) 2.3 5.5 Income tax asset related to uncertain income tax positions (n) 18.4 – Goodwill (b) (46.7) (46.7)Total assets – US GAAP $ 9,483.6 $ 7,038.9
Total shareholders’ equity as reported – Canadian GAAP $ 6,018.7 $ 2,780.3 $ 2,132.5Items increasing (decreasing) reported shareholders’ equity Accumulated other comprehensive income, net of related income taxes, consisting of: Unrealized gains and losses on available-for-sale securities (a) – 792.0 236.3 Net gains on derivatives designated as cash fl ow hedges (h) – 79.4 182.4 Cumulative effect adjustment in respect of uncertain income tax positions (n) (1.2) – – Additional minimum pension liability (f) – – (55.4) Pension and other post-retirement benefi ts (f) (85.6) (117.9) – Share of accumulated other comprehensive income of equity investees (a) – 0.9 0.8 Foreign currency translation adjustment (g) (20.9) (20.9) (20.9) Foreign currency translation adjustment (g) 20.9 20.9 20.9 Provision for asset impairment (b) (218.0) (218.0) (218.0) Depreciation and amortization (c) 70.1 61.6 53.2 Exploration costs (d) (6.4) (6.4) (6.4) Stripping costs (k) (32.7) 2.6 – Cash fl ow hedge ineffectiveness (h) – 0.4 4.9 Pension and other post-retirement benefi ts (f) 16.1 16.1 14.1 Share of other comprehensive income of equity investees (a) 2.3 4.2 3.7 Deferred income taxes relating to the above adjustments (l) 30.4 24.0 27.0 Income taxes related to US GAAP effective income tax rate (l, n) (30.3) – – Income taxes related to uncertain income tax positions (n) 14.5 – – Cumulative effect adjustment to retained earnings in respect of stripping costs (k) – (16.3) – Cumulative effect adjustment to retained earnings in respect of uncertain income tax positions (n) 85.7 – –Shareholders’ equity – US GAAP $ 5,863.6 $ 3,402.9 $ 2,375.1
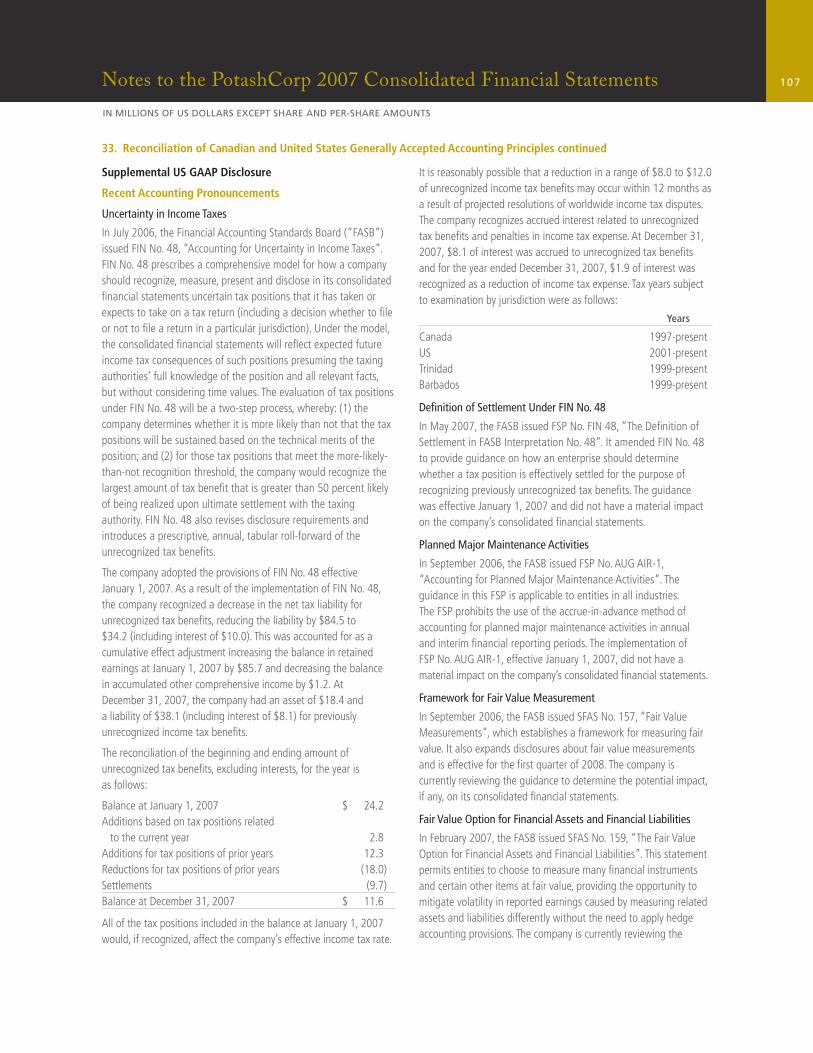
107Notes to the PotashCorp 2007 Consolidated Financial Statements
IN MILLIONS OF US DOLLARS EXCEPT SHARE AND PER-SHARE AMOUNTS
33. Reconciliation of Canadian and United States Generally Accepted Accounting Principles continued
Supplemental US GAAP Disclosure
Recent Accounting Pronouncements
Uncertainty in Income Taxes
In July 2006, the Financial Accounting Standards Board (“FASB”) issued FIN No. 48, “Accounting for Uncertainty in Income Taxes”. FIN No. 48 prescribes a comprehensive model for how a company should recognize, measure, present and disclose in its consolidated fi nancial statements uncertain tax positions that it has taken or expects to take on a tax return (including a decision whether to fi le or not to fi le a return in a particular jurisdiction). Under the model, the consolidated fi nancial statements will refl ect expected future income tax consequences of such positions presuming the taxing authorities’ full knowledge of the position and all relevant facts, but without considering time values. The evaluation of tax positions under FIN No. 48 will be a two-step process, whereby: (1) the company determines whether it is more likely than not that the tax positions will be sustained based on the technical merits of the position; and (2) for those tax positions that meet the more-likely-than-not recognition threshold, the company would recognize the largest amount of tax benefi t that is greater than 50 percent likely of being realized upon ultimate settlement with the taxing authority. FIN No. 48 also revises disclosure requirements and introduces a prescriptive, annual, tabular roll-forward of the unrecognized tax benefi ts.
The company adopted the provisions of FIN No. 48 effective January 1, 2007. As a result of the implementation of FIN No. 48, the company recognized a decrease in the net tax liability for unrecognized tax benefi ts, reducing the liability by $84.5 to $34.2 (including interest of $10.0). This was accounted for as a cumulative effect adjustment increasing the balance in retained earnings at January 1, 2007 by $85.7 and decreasing the balance in accumulated other comprehensive income by $1.2. At December 31, 2007, the company had an asset of $18.4 and a liability of $38.1 (including interest of $8.1) for previously unrecognized income tax benefi ts.
The reconciliation of the beginning and ending amount of unrecognized tax benefi ts, excluding interests, for the year is as follows:
Balance at January 1, 2007 $ 24.2Additions based on tax positions related to the current year 2.8Additions for tax positions of prior years 12.3Reductions for tax positions of prior years (18.0)Settlements (9.7)Balance at December 31, 2007 $ 11.6
All of the tax positions included in the balance at January 1, 2007 would, if recognized, affect the company’s effective income tax rate.
It is reasonably possible that a reduction in a range of $8.0 to $12.0 of unrecognized income tax benefi ts may occur within 12 months as a result of projected resolutions of worldwide income tax disputes. The company recognizes accrued interest related to unrecognized tax benefi ts and penalties in income tax expense. At December 31, 2007, $8.1 of interest was accrued to unrecognized tax benefi ts and for the year ended December 31, 2007, $1.9 of interest was recognized as a reduction of income tax expense. Tax years subject to examination by jurisdiction were as follows:
Years
Canada 1997-presentUS 2001-presentTrinidad 1999-presentBarbados 1999-present
Defi nition of Settlement Under FIN No. 48
In May 2007, the FASB issued FSP No. FIN 48, “The Defi nition of Settlement in FASB Interpretation No. 48”. It amended FIN No. 48 to provide guidance on how an enterprise should determine whether a tax position is effectively settled for the purpose of recognizing previously unrecognized tax benefi ts. The guidance was effective January 1, 2007 and did not have a material impact on the company’s consolidated fi nancial statements.
Planned Major Maintenance Activities
In September 2006, the FASB issued FSP No. AUG AIR-1, “Accounting for Planned Major Maintenance Activities”. The guidance in this FSP is applicable to entities in all industries. The FSP prohibits the use of the accrue-in-advance method of accounting for planned major maintenance activities in annual and interim fi nancial reporting periods. The implementation of FSP No. AUG AIR-1, effective January 1, 2007, did not have a material impact on the company’s consolidated fi nancial statements.
Framework for Fair Value Measurement
In September 2006, the FASB issued SFAS No. 157, “Fair Value Measurements”, which establishes a framework for measuring fair value. It also expands disclosures about fair value measurements and is effective for the fi rst quarter of 2008. The company is currently reviewing the guidance to determine the potential impact, if any, on its consolidated fi nancial statements.
Fair Value Option for Financial Assets and Financial Liabilities
In February 2007, the FASB issued SFAS No. 159, “The Fair Value Option for Financial Assets and Financial Liabilities”. This statement permits entities to choose to measure many fi nancial instruments and certain other items at fair value, providing the opportunity to mitigate volatility in reported earnings caused by measuring related assets and liabilities differently without the need to apply hedge accounting provisions. The company is currently reviewing the
108 Notes to the PotashCorp 2007 Consolidated Financial Statements
IN MILLIONS OF US DOLLARS EXCEPT SHARE AND PER-SHARE AMOUNTS
33. Reconciliation of Canadian and United States Generally Accepted Accounting Principles continued
guidance, which is effective for the fi rst quarter of 2008, to determine the potential impact, if any, on its consolidated fi nancial statements.
Business Combinations
In December 2007, the FASB issued SFAS No. 141(R), “Business Combinations”. The standard requires the acquiring entity in a business combination to recognize all (and only) the assets acquired and liabilities assumed in the transaction; establishes the acquisition date fair value as the measurement objective for all assets acquired and liabilities assumed; and requires the acquirer to disclose to investors and other users all of the information they need to evaluate and understand the nature and fi nancial effect of the business combination. The company is currently reviewing the guidance, which is effective for fi scal years beginning after December 15, 2008, to determine the potential impact, if any, on its consolidated fi nancial statements.
Noncontrolling Interests in Consolidated Financial Statements
In December 2007, the FASB issued SFAS No. 160, “Noncontrolling Interests in Consolidated Financial Statements”. The standard requires all entities to report noncontrolling (minority) interests as equity in consolidated fi nancial statements. SFAS No. 160 eliminates the diversity that currently exists in accounting for transactions between an entity and noncontrolling interests by requiring they be treated as equity transactions. The company is currently reviewing the guidance, which is effective for fi scal years beginning after December 15, 2008, to determine the potential impact, if any, on its consolidated fi nancial statements.
Deferred Income Taxes
The total valuation allowance recognized for deferred income tax assets in 2007 was $10.4 (2006 – $53.1). The company has determined that it is more likely than not that the deferred income tax assets net of the valuation allowance will be realized through a combination of future reversals of temporary differences and taxable income.
Stock-Based Compensation
The total compensation cost charged to income in respect of the company’s seven stock-based compensation plans under US GAAP was $85.7 for the year ended December 31, 2007 (2006 – $43.0; 2005 – $37.3).
The aggregate intrinsic value of options outstanding at December 31, 2007 under the Performance Option Plans was $815.1, and the aggregate intrinsic value of options exercisable was $NIL. The
aggregate intrinsic value of options outstanding at December 31, 2007 under the Offi cers and Employees and Directors Plans was $792.3, and the aggregate intrinsic value of options exercisable was $792.3. The total intrinsic value of stock options exercised during the year ended December 31, 2007 was $137.4 (2006 – $72.9). No stock options vested during 2007.
As of December 31, 2007, there was $15.1 of total unrecognized compensation cost related to the company’s stock option plans. This cost is expected to be recognized over the period through December 31, 2009.
The company issued 18,726 performance units during 2007 (2006 – 471,495) under the performance unit incentive plan at a weighted average grant-date fair value of $98.52 per unit (2006 – $26.16). As at December 31, 2007, 434,266 units remained unvested and outstanding. Total unrecognized compensation cost approximated $59.3, which is expected to be recognized over the period through December 31, 2008. However, such amount will be subject to change, as these liability awards are re-measured at fair value at each reporting period.
Derivative Instruments and Hedging Activities
The company has designated its natural gas derivative instruments as cash fl ow hedges.
During the year, gains of $57.7 (including ineffectiveness) were recognized in cost of goods sold (2006 – $73.5; 2005 – $48.6).
Pension and Other Post-Retirement Benefi ts
The unamortized actuarial loss, unamortized prior service cost and unamortized transitional obligation included in accumulated other comprehensive income and expected to be recognized in net periodic pension cost during 2008 is $6.0, $(0.8) and $2.2, respectively.
Related Party Transactions
During the year, sales to a company associated with the immediate family of a member of the PCS Board of Directors totaled $29.7 (2006 – $16.0; 2005 – $12.6). These transactions were conducted in the normal course of business at the prevailing market prices and on normal trade terms.
Supplemental Schedules
The following supplemental schedules present the consolidated Financial Position, Operations and Retained Earnings, Comprehensive Income, Accumulated Other Comprehensive Income, and Cash Flow in accordance with US GAAP as adjusted for the GAAP differences described in this note.
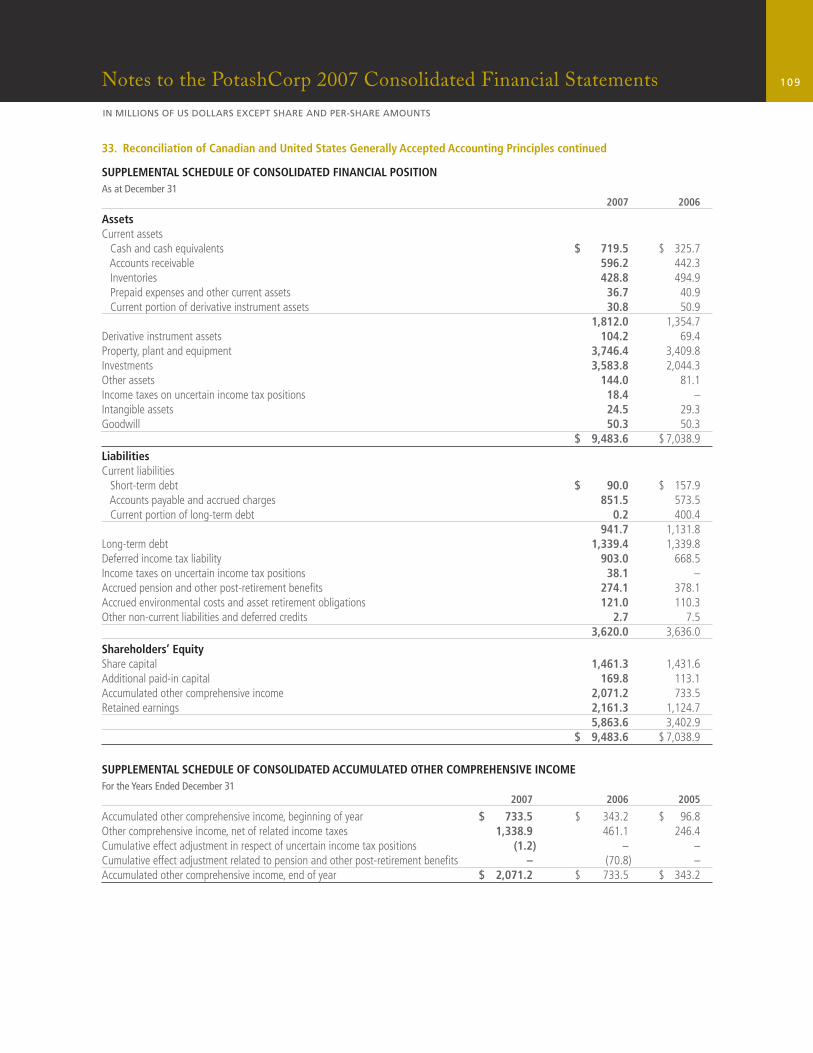
109Notes to the PotashCorp 2007 Consolidated Financial Statements
IN MILLIONS OF US DOLLARS EXCEPT SHARE AND PER-SHARE AMOUNTS
SUPPLEMENTAL SCHEDULE OF CONSOLIDATED FINANCIAL POSITIONAs at December 31 2007 2006
AssetsCurrent assets Cash and cash equivalents $ 719.5 $ 325.7 Accounts receivable 596.2 442.3 Inventories 428.8 494.9 Prepaid expenses and other current assets 36.7 40.9 Current portion of derivative instrument assets 30.8 50.9 1,812.0 1,354.7Derivative instrument assets 104.2 69.4Property, plant and equipment 3,746.4 3,409.8Investments 3,583.8 2,044.3Other assets 144.0 81.1Income taxes on uncertain income tax positions 18.4 –Intangible assets 24.5 29.3Goodwill 50.3 50.3 $ 9,483.6 $ 7,038.9
LiabilitiesCurrent liabilities Short-term debt $ 90.0 $ 157.9 Accounts payable and accrued charges 851.5 573.5 Current portion of long-term debt 0.2 400.4 941.7 1,131.8Long-term debt 1,339.4 1,339.8Deferred income tax liability 903.0 668.5Income taxes on uncertain income tax positions 38.1 –Accrued pension and other post-retirement benefi ts 274.1 378.1Accrued environmental costs and asset retirement obligations 121.0 110.3Other non-current liabilities and deferred credits 2.7 7.5 3,620.0 3,636.0
Shareholders’ EquityShare capital 1,461.3 1,431.6Additional paid-in capital 169.8 113.1Accumulated other comprehensive income 2,071.2 733.5Retained earnings 2,161.3 1,124.7 5,863.6 3,402.9 $ 9,483.6 $ 7,038.9
SUPPLEMENTAL SCHEDULE OF CONSOLIDATED ACCUMULATED OTHER COMPREHENSIVE INCOMEFor the Years Ended December 31 2007 2006 2005
Accumulated other comprehensive income, beginning of year $ 733.5 $ 343.2 $ 96.8Other comprehensive income, net of related income taxes 1,338.9 461.1 246.4Cumulative effect adjustment in respect of uncertain income tax positions (1.2) – –Cumulative effect adjustment related to pension and other post-retirement benefi ts – (70.8) –Accumulated other comprehensive income, end of year $ 2,071.2 $ 733.5 $ 343.2
33. Reconciliation of Canadian and United States Generally Accepted Accounting Principles continued
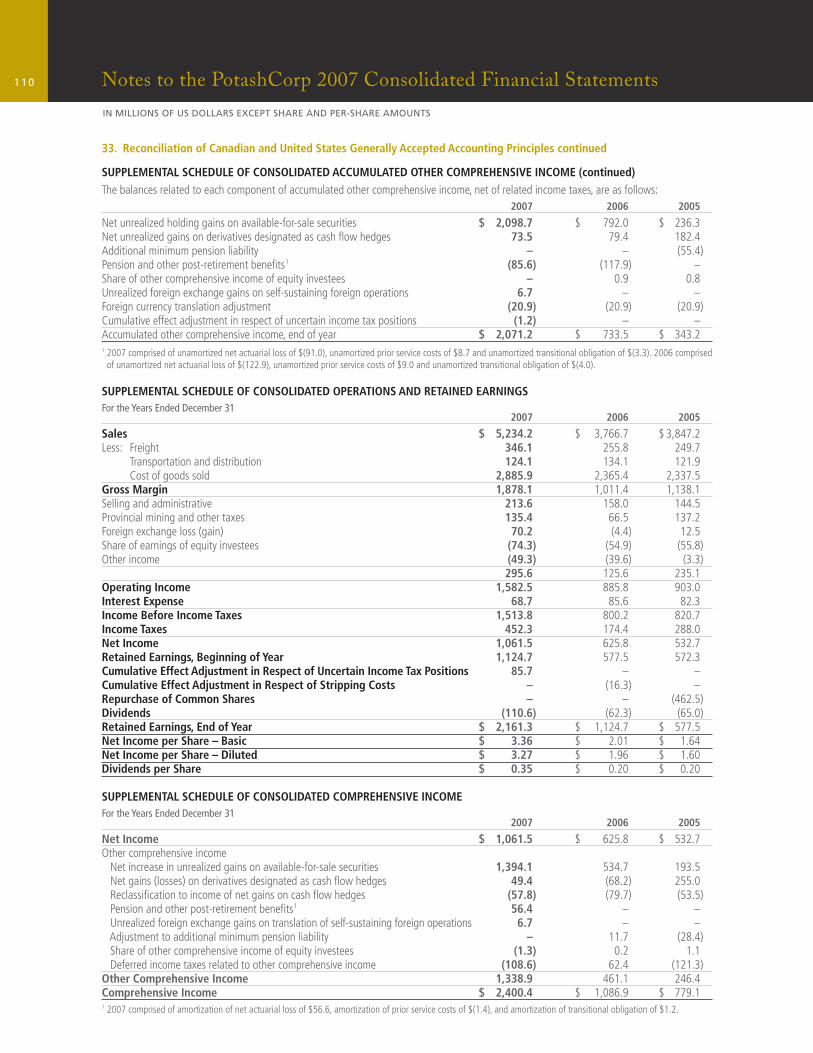
110 Notes to the PotashCorp 2007 Consolidated Financial Statements
IN MILLIONS OF US DOLLARS EXCEPT SHARE AND PER-SHARE AMOUNTS
33. Reconciliation of Canadian and United States Generally Accepted Accounting Principles continued
SUPPLEMENTAL SCHEDULE OF CONSOLIDATED ACCUMULATED OTHER COMPREHENSIVE INCOME (continued)The balances related to each component of accumulated other comprehensive income, net of related income taxes, are as follows: 2007 2006 2005
Net unrealized holding gains on available-for-sale securities $ 2,098.7 $ 792.0 $ 236.3Net unrealized gains on derivatives designated as cash fl ow hedges 73.5 79.4 182.4Additional minimum pension liability – – (55.4)Pension and other post-retirement benefi ts1 (85.6) (117.9) –Share of other comprehensive income of equity investees – 0.9 0.8Unrealized foreign exchange gains on self-sustaining foreign operations 6.7 – –Foreign currency translation adjustment (20.9) (20.9) (20.9)Cumulative effect adjustment in respect of uncertain income tax positions (1.2) – –Accumulated other comprehensive income, end of year $ 2,071.2 $ 733.5 $ 343.21 2007 comprised of unamortized net actuarial loss of $(91.0), unamortized prior service costs of $8.7 and unamortized transitional obligation of $(3.3). 2006 comprised
of unamortized net actuarial loss of $(122.9), unamortized prior service costs of $9.0 and unamortized transitional obligation of $(4.0).
SUPPLEMENTAL SCHEDULE OF CONSOLIDATED OPERATIONS AND RETAINED EARNINGSFor the Years Ended December 31 2007 2006 2005
Sales $ 5,234.2 $ 3,766.7 $ 3,847.2Less: Freight 346.1 255.8 249.7 Transportation and distribution 124.1 134.1 121.9 Cost of goods sold 2,885.9 2,365.4 2,337.5Gross Margin 1,878.1 1,011.4 1,138.1Selling and administrative 213.6 158.0 144.5Provincial mining and other taxes 135.4 66.5 137.2Foreign exchange loss (gain) 70.2 (4.4) 12.5Share of earnings of equity investees (74.3) (54.9) (55.8)Other income (49.3) (39.6) (3.3) 295.6 125.6 235.1Operating Income 1,582.5 885.8 903.0Interest Expense 68.7 85.6 82.3Income Before Income Taxes 1,513.8 800.2 820.7Income Taxes 452.3 174.4 288.0Net Income 1,061.5 625.8 532.7Retained Earnings, Beginning of Year 1,124.7 577.5 572.3Cumulative Effect Adjustment in Respect of Uncertain Income Tax Positions 85.7 – –Cumulative Effect Adjustment in Respect of Stripping Costs – (16.3) –Repurchase of Common Shares – – (462.5)Dividends (110.6) (62.3) (65.0)Retained Earnings, End of Year $ 2,161.3 $ 1,124.7 $ 577.5Net Income per Share – Basic $ 3.36 $ 2.01 $ 1.64Net Income per Share – Diluted $ 3.27 $ 1.96 $ 1.60Dividends per Share $ 0.35 $ 0.20 $ 0.20
SUPPLEMENTAL SCHEDULE OF CONSOLIDATED COMPREHENSIVE INCOME For the Years Ended December 31 2007 2006 2005
Net Income $ 1,061.5 $ 625.8 $ 532.7Other comprehensive income Net increase in unrealized gains on available-for-sale securities 1,394.1 534.7 193.5 Net gains (losses) on derivatives designated as cash fl ow hedges 49.4 (68.2) 255.0 Reclassifi cation to income of net gains on cash fl ow hedges (57.8) (79.7) (53.5) Pension and other post-retirement benefi ts1 56.4 – – Unrealized foreign exchange gains on translation of self-sustaining foreign operations 6.7 – – Adjustment to additional minimum pension liability – 11.7 (28.4) Share of other comprehensive income of equity investees (1.3) 0.2 1.1 Deferred income taxes related to other comprehensive income (108.6) 62.4 (121.3)Other Comprehensive Income 1,338.9 461.1 246.4Comprehensive Income $ 2,400.4 $ 1,086.9 $ 779.11 2007 comprised of amortization of net actuarial loss of $56.6, amortization of prior service costs of $(1.4), and amortization of transitional obligation of $1.2.
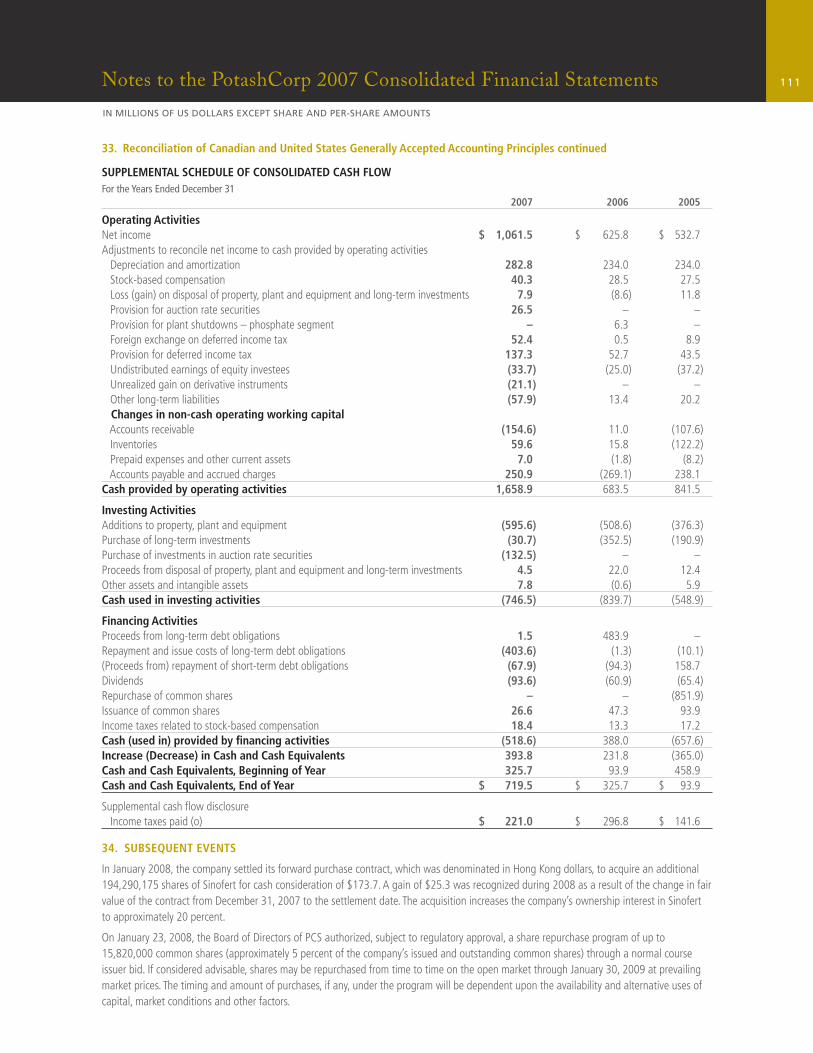
111Notes to the PotashCorp 2007 Consolidated Financial Statements
IN MILLIONS OF US DOLLARS EXCEPT SHARE AND PER-SHARE AMOUNTS
33. Reconciliation of Canadian and United States Generally Accepted Accounting Principles continued
SUPPLEMENTAL SCHEDULE OF CONSOLIDATED CASH FLOWFor the Years Ended December 31 2007 2006 2005
Operating ActivitiesNet income $ 1,061.5 $ 625.8 $ 532.7Adjustments to reconcile net income to cash provided by operating activities Depreciation and amortization 282.8 234.0 234.0 Stock-based compensation 40.3 28.5 27.5 Loss (gain) on disposal of property, plant and equipment and long-term investments 7.9 (8.6) 11.8 Provision for auction rate securities 26.5 – – Provision for plant shutdowns – phosphate segment – 6.3 – Foreign exchange on deferred income tax 52.4 0.5 8.9 Provision for deferred income tax 137.3 52.7 43.5 Undistributed earnings of equity investees (33.7) (25.0) (37.2) Unrealized gain on derivative instruments (21.1) – – Other long-term liabilities (57.9) 13.4 20.2 Changes in non-cash operating working capital Accounts receivable (154.6) 11.0 (107.6) Inventories 59.6 15.8 (122.2) Prepaid expenses and other current assets 7.0 (1.8) (8.2) Accounts payable and accrued charges 250.9 (269.1) 238.1Cash provided by operating activities 1,658.9 683.5 841.5
Investing ActivitiesAdditions to property, plant and equipment (595.6) (508.6) (376.3)Purchase of long-term investments (30.7) (352.5) (190.9)Purchase of investments in auction rate securities (132.5) – –Proceeds from disposal of property, plant and equipment and long-term investments 4.5 22.0 12.4Other assets and intangible assets 7.8 (0.6) 5.9Cash used in investing activities (746.5) (839.7) (548.9)
Financing ActivitiesProceeds from long-term debt obligations 1.5 483.9 –Repayment and issue costs of long-term debt obligations (403.6) (1.3) (10.1)(Proceeds from) repayment of short-term debt obligations (67.9) (94.3) 158.7Dividends (93.6) (60.9) (65.4)Repurchase of common shares – – (851.9)Issuance of common shares 26.6 47.3 93.9Income taxes related to stock-based compensation 18.4 13.3 17.2Cash (used in) provided by fi nancing activities (518.6) 388.0 (657.6)Increase (Decrease) in Cash and Cash Equivalents 393.8 231.8 (365.0)Cash and Cash Equivalents, Beginning of Year 325.7 93.9 458.9Cash and Cash Equivalents, End of Year $ 719.5 $ 325.7 $ 93.9
Supplemental cash fl ow disclosure Income taxes paid (o) $ 221.0 $ 296.8 $ 141.6
34. SUBSEQUENT EVENTS
In January 2008, the company settled its forward purchase contract, which was denominated in Hong Kong dollars, to acquire an additional 194,290,175 shares of Sinofert for cash consideration of $173.7. A gain of $25.3 was recognized during 2008 as a result of the change in fair value of the contract from December 31, 2007 to the settlement date. The acquisition increases the company’s ownership interest in Sinofert to approximately 20 percent.
On January 23, 2008, the Board of Directors of PCS authorized, subject to regulatory approval, a share repurchase program of up to 15,820,000 common shares (approximately 5 percent of the company’s issued and outstanding common shares) through a normal course issuer bid. If considered advisable, shares may be repurchased from time to time on the open market through January 30, 2009 at prevailing market prices. The timing and amount of purchases, if any, under the program will be dependent upon the availability and alternative uses of capital, market conditions and other factors.
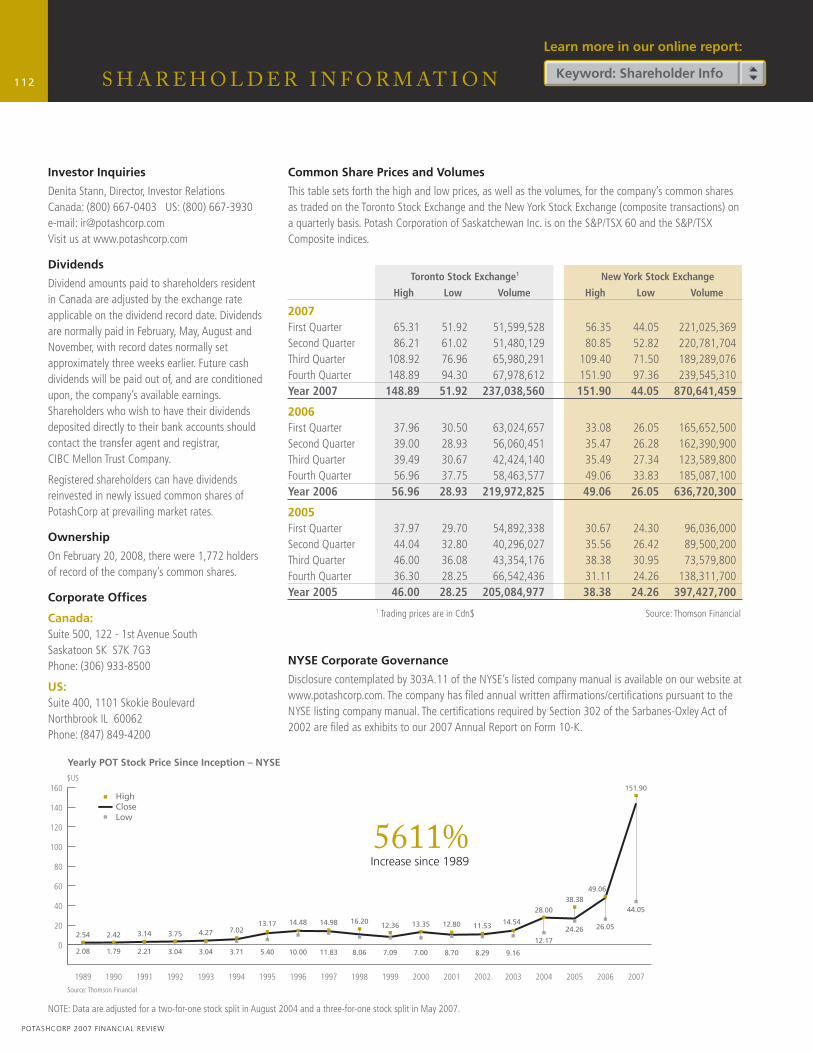
112
Investor Inquiries
Denita Stann, Director, Investor RelationsCanada: (800) 667-0403 US: (800) 667-3930e-mail: [email protected] us at www.potashcorp.com
Dividends
Dividend amounts paid to shareholders resident in Canada are adjusted by the exchange rate applicable on the dividend record date. Dividends are normally paid in February, May, August and November, with record dates normally set approximately three weeks earlier. Future cash dividends will be paid out of, and are conditioned upon, the company’s available earnings. Shareholders who wish to have their dividends deposited directly to their bank accounts should contact the transfer agent and registrar, CIBC Mellon Trust Company.
Registered shareholders can have dividends reinvested in newly issued common shares of PotashCorp at prevailing market rates.
Ownership
On February 20, 2008, there were 1,772 holders of record of the company’s common shares.
Corporate Offi ces
Canada:Suite 500, 122 - 1st Avenue South Saskatoon SK S7K 7G3Phone: (306) 933-8500
US:Suite 400, 1101 Skokie BoulevardNorthbrook IL 60062 Phone: (847) 849-4200
S H A R E H O L D E R I N F O R M AT I O N
Common Share Prices and Volumes
This table sets forth the high and low prices, as well as the volumes, for the company’s common shares as traded on the Toronto Stock Exchange and the New York Stock Exchange (composite transactions) on a quarterly basis. Potash Corporation of Saskatchewan Inc. is on the S&P/TSX 60 and the S&P/TSX Composite indices.
Toronto Stock Exchange1 New York Stock Exchange
High Low Volume High Low Volume
2007 First Quarter 65.31 51.92 51,599,528 56.35 44.05 221,025,369Second Quarter 86.21 61.02 51,480,129 80.85 52.82 220,781,704Third Quarter 108.92 76.96 65,980,291 109.40 71.50 189,289,076Fourth Quarter 148.89 94.30 67,978,612 151.90 97.36 239,545,310 Year 2007 148.89 51.92 237,038,560 151.90 44.05 870,641,459
2006 First Quarter 37.96 30.50 63,024,657 33.08 26.05 165,652,500Second Quarter 39.00 28.93 56,060,451 35.47 26.28 162,390,900Third Quarter 39.49 30.67 42,424,140 35.49 27.34 123,589,800Fourth Quarter 56.96 37.75 58,463,577 49.06 33.83 185,087,100 Year 2006 56.96 28.93 219,972,825 49.06 26.05 636,720,300
2005 First Quarter 37.97 29.70 54,892,338 30.67 24.30 96,036,000Second Quarter 44.04 32.80 40,296,027 35.56 26.42 89,500,200Third Quarter 46.00 36.08 43,354,176 38.38 30.95 73,579,800Fourth Quarter 36.30 28.25 66,542,436 31.11 24.26 138,311,700 Year 2005 46.00 28.25 205,084,977 38.38 24.26 397,427,700
1 Trading prices are in Cdn$ Source: Thomson Financial
NYSE Corporate Governance
Disclosure contemplated by 303A.11 of the NYSE’s listed company manual is available on our website at www.potashcorp.com. The company has fi led annual written affi rmations/certifi cations pursuant to the NYSE listing company manual. The certifi cations required by Section 302 of the Sarbanes-Oxley Act of 2002 are fi led as exhibits to our 2007 Annual Report on Form 10-K.
$US
Source: Thomson Financial
HighCloseLow
0
20
40
60
80
100
120
140
160
2007200620052004200320022001200019991998199719961995199419931992199119901989
Yearly POT Stock Price Since Inception – NYSE
2.54
2.08
2.42
1.79
3.14
2.21
3.75
3.04
4.27
3.04
7.02
3.71
13.17
5.40
14.48
10.00
14.98
11.83
16.20
8.06
12.36
7.09
13.35
7.00
12.80
8.70
11.53
8.29
14.54
9.16
28.00
12.17
38.38
24.26
49.06
26.05
151.90
44.05
NOTE: Data are adjusted for a two-for-one stock split in August 2004 and a three-for-one stock split in May 2007.
5611%Increase since 1989
Learn more in our online report:
Keyword: Shareholder Info
POTASHCORP 2007 FINANCIAL REVIEW
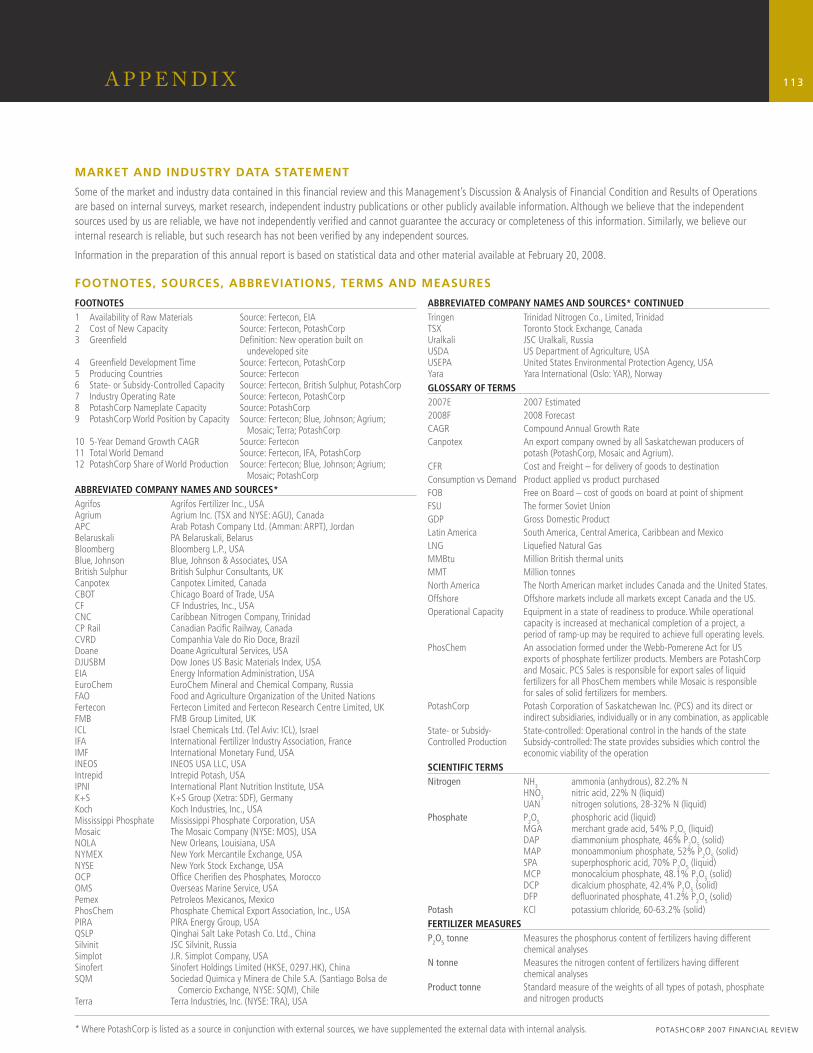
113
FOOTNOTES1 Availability of Raw Materials Source: Fertecon, EIA2 Cost of New Capacity Source: Fertecon, PotashCorp3 Greenfi eld Defi nition: New operation built on
undeveloped site4 Greenfi eld Development Time Source: Fertecon, PotashCorp5 Producing Countries Source: Fertecon6 State- or Subsidy-Controlled Capacity Source: Fertecon, British Sulphur, PotashCorp7 Industry Operating Rate Source: Fertecon, PotashCorp8 PotashCorp Nameplate Capacity Source: PotashCorp9 PotashCorp World Position by Capacity Source: Fertecon; Blue, Johnson; Agrium;
Mosaic; Terra; PotashCorp10 5-Year Demand Growth CAGR Source: Fertecon11 Total World Demand Source: Fertecon, IFA, PotashCorp12 PotashCorp Share of World Production Source: Fertecon; Blue, Johnson; Agrium;
Mosaic; PotashCorpABBREVIATED COMPANY NAMES AND SOURCES*Agrifos Agrifos Fertilizer Inc., USAAgrium Agrium Inc. (TSX and NYSE: AGU), CanadaAPC Arab Potash Company Ltd. (Amman: ARPT), JordanBelaruskali PA Belaruskali, BelarusBloomberg Bloomberg L.P., USABlue, Johnson Blue, Johnson & Associates, USABritish Sulphur British Sulphur Consultants, UKCanpotex Canpotex Limited, CanadaCBOT Chicago Board of Trade, USACF CF Industries, Inc., USACNC Caribbean Nitrogen Company, TrinidadCP Rail Canadian Pacifi c Railway, CanadaCVRD Companhia Vale do Rio Doce, BrazilDoane Doane Agricultural Services, USADJUSBM Dow Jones US Basic Materials Index, USAEIA Energy Information Administration, USAEuroChem EuroChem Mineral and Chemical Company, RussiaFAO Food and Agriculture Organization of the United Nations Fertecon Fertecon Limited and Fertecon Research Centre Limited, UKFMB FMB Group Limited, UKICL Israel Chemicals Ltd. (Tel Aviv: ICL), IsraelIFA International Fertilizer Industry Association, FranceIMF International Monetary Fund, USAINEOS INEOS USA LLC, USAIntrepid Intrepid Potash, USAIPNI International Plant Nutrition Institute, USAK+S K+S Group (Xetra: SDF), GermanyKoch Koch Industries, Inc., USAMississippi Phosphate Mississippi Phosphate Corporation, USAMosaic The Mosaic Company (NYSE: MOS), USANOLA New Orleans, Louisiana, USANYMEX New York Mercantile Exchange, USANYSE New York Stock Exchange, USAOCP Offi ce Cherifi en des Phosphates, MoroccoOMS Overseas Marine Service, USAPemex Petroleos Mexicanos, MexicoPhosChem Phosphate Chemical Export Association, Inc., USAPIRA PIRA Energy Group, USAQSLP Qinghai Salt Lake Potash Co. Ltd., ChinaSilvinit JSC Silvinit, RussiaSimplot J.R. Simplot Company, USASinofert Sinofert Holdings Limited (HKSE, 0297.HK), ChinaSQM Sociedad Quimica y Minera de Chile S.A. (Santiago Bolsa de Comercio Exchange, NYSE: SQM), ChileTerra Terra Industries, Inc. (NYSE: TRA), USA
ABBREVIATED COMPANY NAMES AND SOURCES* CONTINUEDTringen Trinidad Nitrogen Co., Limited, TrinidadTSX Toronto Stock Exchange, CanadaUralkali JSC Uralkali, RussiaUSDA US Department of Agriculture, USAUSEPA United States Environmental Protection Agency, USAYara Yara International (Oslo: YAR), NorwayGLOSSARY OF TERMS2007E 2007 Estimated2008F 2008 Forecast CAGR Compound Annual Growth RateCanpotex An export company owned by all Saskatchewan producers of
potash (PotashCorp, Mosaic and Agrium).CFR Cost and Freight – for delivery of goods to destinationConsumption vs Demand Product applied vs product purchasedFOB Free on Board – cost of goods on board at point of shipmentFSU The former Soviet UnionGDP Gross Domestic ProductLatin America South America, Central America, Caribbean and MexicoLNG Liquefi ed Natural GasMMBtu Million British thermal unitsMMT Million tonnesNorth America The North American market includes Canada and the United States.Offshore Offshore markets include all markets except Canada and the US.Operational Capacity Equipment in a state of readiness to produce. While operational
capacity is increased at mechanical completion of a project, a period of ramp-up may be required to achieve full operating levels.
PhosChem An association formed under the Webb-Pomerene Act for US exports of phosphate fertilizer products. Members are PotashCorp and Mosaic. PCS Sales is responsible for export sales of liquid fertilizers for all PhosChem members while Mosaic is responsible for sales of solid fertilizers for members.
PotashCorp Potash Corporation of Saskatchewan Inc. (PCS) and its direct or indirect subsidiaries, individually or in any combination, as applicable
State- or Subsidy- State-controlled: Operational control in the hands of the stateControlled Production Subsidy-controlled: The state provides subsidies which control the
economic viability of the operationSCIENTIFIC TERMSNitrogen NH3 ammonia (anhydrous), 82.2% N HNO3 nitric acid, 22% N (liquid) UAN nitrogen solutions, 28-32% N (liquid) Phosphate P2O5 phosphoric acid (liquid) MGA merchant grade acid, 54% P2O5 (liquid) DAP diammonium phosphate, 46% P2O5 (solid) MAP monoammonium phosphate, 52% P2O5 (solid) SPA superphosphoric acid, 70% P2O5 (liquid) MCP monocalcium phosphate, 48.1% P2O5 (solid) DCP dicalcium phosphate, 42.4% P2O5 (solid) DFP defl uorinated phosphate, 41.2% P2O5 (solid)Potash KCl potassium chloride, 60-63.2% (solid)FERTILIZER MEASURESP2O5 tonne Measures the phosphorus content of fertilizers having different
chemical analysesN tonne Measures the nitrogen content of fertilizers having different
chemical analysesProduct tonne Standard measure of the weights of all types of potash, phosphate
and nitrogen products
A P P E N D I X
MARKET AND INDUSTRY DATA STATEMENT
Some of the market and industry data contained in this fi nancial review and this Management’s Discussion & Analysis of Financial Condition and Results of Operations are based on internal surveys, market research, independent industry publications or other publicly available information. Although we believe that the independent sources used by us are reliable, we have not independently verifi ed and cannot guarantee the accuracy or completeness of this information. Similarly, we believe our internal research is reliable, but such research has not been verifi ed by any independent sources.
Information in the preparation of this annual report is based on statistical data and other material available at February 20, 2008.
FOOTNOTES, SOURCES, ABBREVIATIONS, TERMS AND MEASURES
* Where PotashCorp is listed as a source in conjunction with external sources, we have supplemented the external data with internal analysis. POTASHCORP 2007 FINANCIAL REVIEW

can’t wait for tomorrow?
…or join us for our complete Annual Report
PotashCorp2007AR.com
visit potashcorp.com/mobile/
Research In Motion, the RIM logo, BlackBerry, the BlackBerry logo and SureType are registered with the U.S. Patent and Trademark Offi ce and may be pending or registered in other countries – these and other marks of Research In Motion Limited are used under license.