Embed Size (px)
Citation preview

May 14, 2013
Global Metals, Mining & Steel Conference

Forward Looking Information
Both these slides and the accompanying oral presentation contain certain forward-looking statements within the meaning of the United States Private Securities Litigation Reform Act of 1995 and forward-looking information within the meaning of the Securities Act (Ontario) and comparable legislation in other provinces.
Forward-looking statements can be identified by the use of words such as “plans”, “expects” or “does not expect”, “is expected”, “budget”, “scheduled”, “estimates”, “forecasts”, “intends”, “anticipates” or “does not anticipate”, or “believes”, or variation of such words and phrases or state that certain actions, events or results “may”, “could”, “should”, “would”, “might” or “will” be taken, occur or be achieved. Forward-looking statements involve known and unknown risks, uncertainties and other factors which may cause the actual results, performance or achievements of Teck to be materially different from any future results, performance or achievements expressed or implied by the forward-looking statements. These forward-looking statements include statements relating to management’s expectations with respect to market and production trends, our future production targets, our strategy, costs of our selenium management program, the timing, cost and production projections regarding the Quintette coal mine, information presented regarding the Quebrada Blanca Phase II project, our production growth profile, mine lives and mineral and oil and gas reserves and resources, progress in development of mineral and oil sands properties, steel production rates, zinc mine closures, demand and market outlook for commodities.
These forward-looking statements involve numerous assumptions, risks and uncertainties and actual results may vary materially. These statements are based on a number of assumptions, including, but not limited to, assumptions regarding general business and economic conditions, interest rates, the supply and demand for, inventories of, and the level and volatility of prices of coal, zinc, copper and gold and other primary metals and minerals produced by Teck as well as steel, oil, natural gas and petroleum, the outcome of engineering studies currently underway in connection with Teck’s development projects, the timing of receipt of regulatory and governmental approvals for Teck’s development projects and other operations, Teck’s costs of production and production and productivity levels, as well as those of its competitors, power prices, market competition, the accuracy of Teck’s reserve and resource estimates (including with respect to size, grade and recoverability) and the geological, operational and price assumptions on which these are based, the resolution of environmental and other proceedings, our ongoing relations with our employees and partners and joint venturers, the availability of financing for development projects and the future operational and financial performance of the company generally. Our selenium management costs assume the application of biological treatment technology and that the relevant regulators will agree to site-specific downstream selenium concentrations in certain areas in excess of those in provincial water quality guidelines. The foregoing list of assumptions is not exhaustive.
2

Forward Looking Information
Events or circumstances could cause actual results to differ materially. Factors that may cause actual results to vary include, but are not limited to: unanticipated developments in business and economic conditions in the principal markets for Teck’s products or in the supply, demand, and prices for metals and other commodities to be produced, changes in power prices, changes in interest or currency exchange rates, inaccurate geological or metallurgical assumptions (including with respect to the size, grade and recoverability of mineral or oil and gas reserves and resources), changes in taxation laws or tax authority assessing practices, legal disputes or unanticipated outcomes of legal proceedings, unanticipated operational difficulties (including failure of plant, equipment or processes to operate in accordance with specifications or expectations, cost escalation, unavailability of materials and equipment, government action or delays in the receipt of permits or government approvals, industrial disturbances or other job action, and unanticipated events related to health, safety and environmental matters), decisions made by our partners or co-venturers, political events, social unrest, lack of available financing for Teck or its partners or co-venturers, and changes in general economic conditions or conditions in the financial markets. With respect to our selenium management costs, factors that may cause actual results to vary include, but are not limited to, biological treatment technology being less effective than expected and regulators imposing stricter water quality guidelines than our proposed draft valley-wide selenium management plan contemplates.
Certain of these risks are described in more detail in Teck’s annual information form available at www.sedar.com and in public filings with the SEC at www.sec.gov. Teck does not assume the obligation to revise or update these forward-looking statements after the date of this document or to revise them to reflect the occurrence of future unanticipated events, except as may be required under applicable securities laws.
3

Teck Overview and Markets
T E C K R E S O U R C E S
Agenda
Steelmaking Coal
Copper
Zinc
Energy
4

Note 1: Wood Mackenzie, 2012
Increased copper production
# 1 Producer of steelmaking coal in N. America
# 2 Exporter of metallurgical coal in world
# 3 Zinc miner in world(1)
T E C K R E S O U R C E S
Canada’s Largest Diversified Mining Company
5

T E C K R E S O U R C E S – S T R O N G O R G A N I C G R O W T H
‘Stay the Course’ Strategy
Low-cost Incremental
Growth
Building Resources
Copper Coal Energy
Industry Closures Looming
Zinc
Converting Resources to Cash Flow
Brownfield Expansion
6

10%
20%
30%
40%
50%
60%
Urbanization RateServices as % of GDP
Source: Economic Intelligence Unit, Teck Resources
Urbanization Growth & Service Sector Contribution
3%
6%
9%
12%
15%
FY targetActual growth
Real GDP Growth Target vs. Actual
2012 GDP by
Province
T E C K R E S O U R C E S – A C L O S E R L O O K
China’s Growth Continuing, But Changing
• Urbanization continuing, services contribution to GDP growth increasing
• Lower rate / higher base = strong absolute growth
• Coastal provinces maturing, high GDP growth moving west
~15M people per year
urbanizing
7

0
10
20
30
40
50
60
70
1
2
3
4
5
6
7
8
9
10
Traditional Steel Markets:
• Most markets below trend growth
• Japan rebuild taking more time than anticipated
Outside of Asia
• Production and utilization rates in Europe continue to be under pressure
• US production showing signs of improvement
T E C K R E S O U R C E S – C O A L M A R K E T S
Steel Production in Most Markets Below Trend Growth
Japan
USA
S. Korea
Taiwan
Monthly Steel Production (million tonnes)
Source : WSA
EU (RHS)
China (RHS)
8

T E C K R E S O U R C E S – C O A L M A R K E T S
Seaborne Steelmaking Coal Margin Curve is What Matters
• Margin curve highlights the importance of coal quality
• High cost, low quality coals should be eliminated first
• Realized cost savings and ongoing cost reduction initiatives are shifting margin curve
• US$170/tonne benchmark price could impact 40-45mt of seaborne metallurgical coal
• Total announced production cuts ~30Mt annualized
9
Seaborne Metallurgical Margin Curve (US$170/t benchmark price, FOB)
-100
-50
0
50
100
0 30 60 90 120 150 180 210 240 270Million tonnes
Source: Woodmac, Platts, TEX Report, AME, company reports and Teck estimates
~16% of Global Production
Uneconomic
Supply Reduction:
Already idled or warranted
Cost Savings: Cost reductions initiatives
2%
-11%
34% 21%
7% 49% 6%
35% 20% 26%
0.00
0.25
0.50
0.75
1.00
1.25
1.50
1.75
2.00
2.25
Actual* 3rd Party Research
Source: Company reports & presentations, 3rd party research provider, Teck
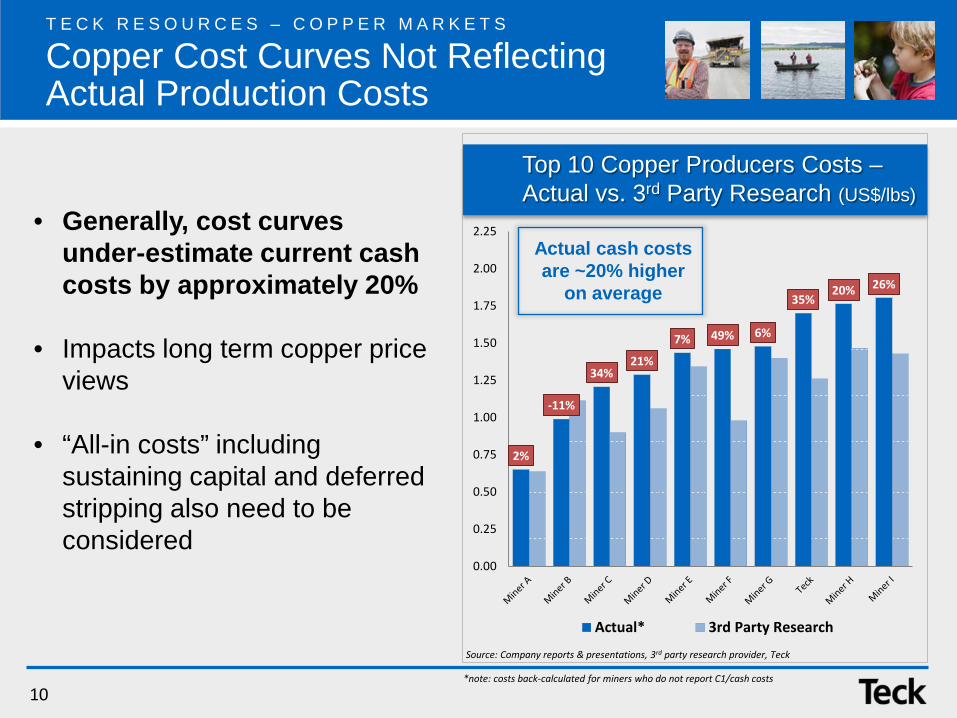
Top 10 Copper Producers Costs – Actual vs. 3rd Party Research (US$/lbs)
T E C K R E S O U R C E S – C O P P E R M A R K E T S
Copper Cost Curves Not Reflecting Actual Production Costs
Actual cash costs are ~20% higher
on average
• Generally, cost curves under-estimate current cash costs by approximately 20%
• Impacts long term copper price views
• “All-in costs” including sustaining capital and deferred stripping also need to be considered
*note: costs back-calculated for miners who do not report C1/cash costs
10

Teck Overview and Markets
Steelmaking Coal
Copper
Zinc
T E C K R E S O U R C E S
Agenda
Energy
11

19
25
10
15
20
25
2009 2012
Pro
duct
ion,
Milli
on to
nnes
Annual Coal Production (million tonnes)
T E C K C O A L – A C L O S E R L O O K
Expanded Coal Production, Efficient Use of Capital
• Expansion cost of approximately $100/t of installed capacity
• Current Annual Production Capacity of 27 Mt
• Increased fleet size, Modernized plant
• Stabilizing strip ratio
• Production ~10% < Capacity due to market constraints
Production increased over 30%
12

T E C K C O A L – A C L O S E R L O O K
Improved Relative Cost Position
• Truck fleet: larger, newer and more units
• Plant modernization: improved efficiency
• Improved productivity
• Rail: 10-year contract to 2021; no price participation
• Port: contracts tied to volume, increased flexibility and Neptune expansion
Cos
t per
tonn
e
Source: Wood Mackenzie Coal Supply Service, Feb 2013, AME & Teck Resouces
Cumulative Tonnes
Teck 2006
Teck 2008
Teck 2011
Teck 2003
Global Seaborne Cash Cost Curve (million tonnes, US$/tonne FOB)
Teck 2013
13

Teck Overview and Markets
Steelmaking Coal
Copper
T E C K R E S O U R C E S
Agenda
Zinc
Energy
14

308
373
225
275
325
375
2009 2012
Pro
duct
ion,
thou
sand
tonn
es
T E C K C O P P E R – A C L O S E R L O O K
Increased Copper Production, Efficient Use of Capital
• Highland Valley: ‒ Production up 42% YoY from
higher grades and recoveries
‒ Mill Optimization Project to increase mill throughput ~10%
• Carmen de Andacollo: ‒ Production increased ~7% YoY ‒ YoY operating costs ~6% lower
• Antamina: ‒ Expansion increased mill
throughput ~30%
Production increased over 21%
Annual Copper Production (thousand tonnes)
15

-1.00
0.00
1.00
2.00
3.00
4.00
0 8,000 16,000 24,000 32,000
US
$ / l
bs
Cumulative Million Pounds
Source: Wood Mackenzie Q1 2013 dataset
T E C K C O P P E R – A C L O S E R L O O K
Competitive Copper Cost Position
2012 Copper Cost Curve (C1 cash costs after by-products)
Teck Located ~mid-point on
cost curve
• Stable cost curve position over past several years
• Mid-point on industry cost curve
• 2012 weighted average cash cost of ~$1.69/lbs
• 2013 costs decreasing
16

T E C K R E S O U R C E S
Agenda
Teck Overview and Markets
Steelmaking Coal
Copper
Zinc
Energy
17

-0.10
0.00
0.10
0.20
0.30
0.40
0 2,000 4,000 6,000 8,000 10,000 12,000
US$
/ lb
s
Total Slab Zinc (kt) Source: Wood Mackenzie Q2 2013 dataset
-0.75
-0.25
0.25
0.75
1.25
0 5,000 10,000 15,000 20,000
US$
/ lb
s
Paid Metal (Mlbs) Source: Wood Mackenzie Q2 2013 dataset
Red Dog Mine • Ranked 3rd largest global zinc
producer • Currently mining Aqqaluk pit • High grade, large volume
production • Low quartile cost position
Trail Metallurgical Operations • Integrated smelting and
refining complex • Major products are refined zinc
and lead
2012 Zinc Cost Curve (C1 cash costs after by-products)
2012 Zinc Smelter Cash Margin (cash margin $/lbs)
Low cost zinc producer
High margin smelter
T E C K Z I N C – M A R K E T S
World Class Business, Disciplined Production
18

T E C K R E S O U R C E S
Agenda
Teck Overview and Markets
Steelmaking Coal
Copper
Zinc
Energy
19

0%
10%
20%
30%
40%
50%
Coal Copper Energy Zinc
T E C K E N E R G Y – A C L O S E R L O O K
Potential Cash Flow Contribution 2018
billion bbls Fort Hills Phase I
• 20% interest
• Mining project, no in-situ (truck and shovel)
• Project sanction decision expected H2 2013
Teck Energy, 5 Years from Today Strong Cash Flow Potential
Fort Hills Phase I
20

T E C K R E S O U R C E S
Teck Controls each Development Decision
Copper • Excellent brown/green field growth
potential in Chile
• QB Hypogene: in permitting; ~250ktpy copper in concentrate at 1st quartile cash cost
• Relincho: FS nearing completion; ~200ktpy copper concentrate
Coal • 100+ year resource base in BC • Quintette restart in permitting • Further expansion possible
Quintette – Capital Efficiency (US$/tonne of installed capacity)
Quintette
Teck Coal Expansion to 28mtpa
0 10 20 30 40Pebble
Reko DikResolution
Quebrada Blanca Ph IIFrieda River-Nena
La Granja SxEwTampakan
Cerro ColoradoEl Pachon
QuellavecoRadomiro Tomic Ph II
GolpuCobre Panama
NamosiAgua Rica
Kerr SulphuretsAktogay
Rio BlancoKOV Restart
El Arco
Mt
Source: Brook Hunt 2010 ye data, QB Teck April 2012
QB2 – Contained Copper Resources of Undeveloped Projects
Market conditions and expected
returns will dictate timing
21
$0
$1,000
$2,000
$3,000
US$
M
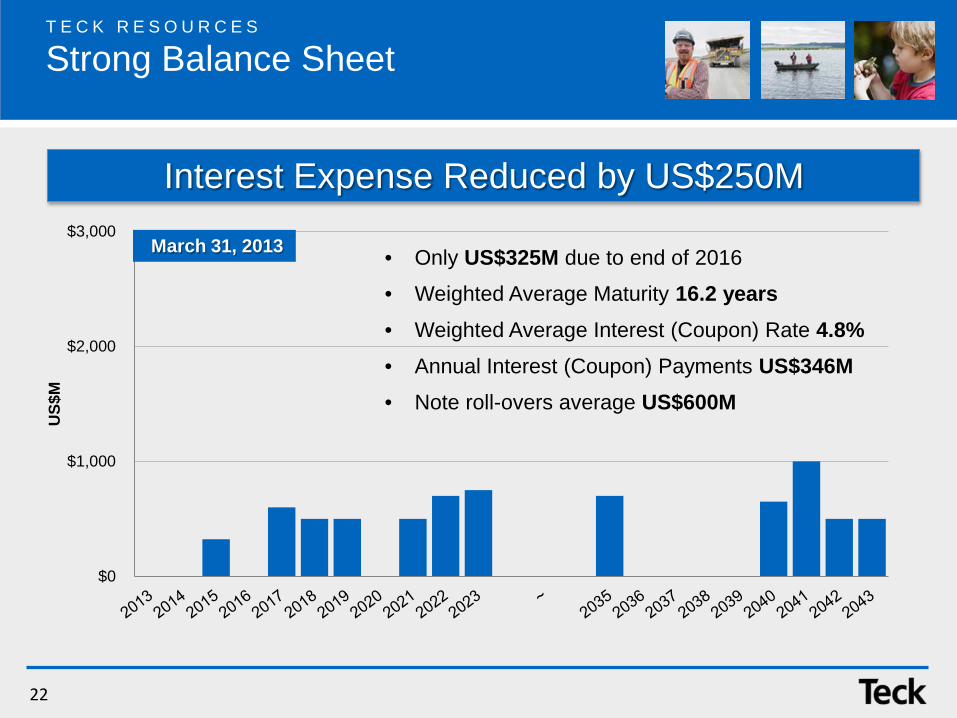
• Only US$325M due to end of 2016
• Weighted Average Maturity 16.2 years • Weighted Average Interest (Coupon) Rate 4.8% • Annual Interest (Coupon) Payments US$346M
• Note roll-overs average US$600M
March 31, 2013
Interest Expense Reduced by US$250M
T E C K R E S O U R C E S
Strong Balance Sheet
22

$0.00
$0.15
$0.30
$0.45
$0.60
$0.75
$0.90
Annualized Dividend Payout
T E C K R E S O U R C E S
Returns to Shareholders
• Progressive dividend policy while maintaining adequate liquidity
• Repurchased 6 million shares as of April 2013
• Vision of steady & sustainable growth
• Current dividend: semi-annual payment $0.45
$0.00
$0.15
23
T E C K R E S O U R C E S
Canada’s Largest Diversified Mining Company
I. Expanded steelmaking coal production
II. Increased copper production
III. Disciplined capital allocation
IV. Prudent cost control and capital spend
24

May 14, 2013
Global Metals, Mining & Steel Conference