Embed Size (px)
Citation preview
2007 UgandaTelecommunications
Sector Performance Reviewaa ssuuppppllyy ssiiddee aannaallyyssiiss ooff ppoolliiccyy oouuttccoommeess
F F TUSUBIRA
IRENE KAGGWA-SEWANKAMBO
APOLO KYEYUNE
ALI NDIWALANA
ANNRITA SSEMBOGA
This Policy Research Paper Series is madepossible through the support of the followingorganisations:
! International Development ResearchCentre (IDRC)
! Uganda Communications Commission
For further information see http://link.wits.ac.za
Tel:+27 11 7173913
Fax:+27 11 7173910
LINK Centre
Graduate School of Public Development Management
Witwatersrand University
Johannesburg
Box 601, Wits, 2050
http://link.wits.ac.za
uganda country profile alt 1.qxp 2007/12/06 10:49 AM Page 1

First RH page (blank)
UUggaannddaa
2 2007 Telecommunications Sector Performance Review
2007 Uganda
Telecommunications Sector Performance Review a supply side analysis of policy outcomes
By1
F F Tusubira, Irene Kaggwa-Sewankambo,
Apolo Kyeyune, Ali Ndiwalana,
Annrita Ssemboga
Makerere UniversityDIRECTORATE FOR ICT SUPPORT
The Knowledge Centre
Disclaimer: The views expressed in this document are those of the authors, not the organisations they are attached to or work for.
ACKNOWLEDGEMENTS
The Authors acknowledge with thanks support of the International Development Research Corporation of Canada, IDRC, that
funded this research through the Research ICT Africa! Network. The cooperation of the various organisations that supplied data,
as cited in this report, is gratefully acknowledged.
1 F F Tusubira, A Kyeyune and A Ndiwalana are with the Directorate for ICT Support, Makerere University. I Kaggwa-Sewankambo and A Ssemboga are with the UgandaCommunications Commission.
UUggaannddaa
32007 Telecommunications Sector Performance Review
Research ICT Africa! (RIA!) fills a strategic gap in the development of a
sustainable information society and network knowledge economy by building the ICT policy and regula-
tory research capacity needed to inform effective ICT governance in Africa. The network was launched
with seed funding from the IDRC and seeks to extend its activities through national, regional and conti-
nental partnerships.
The establishment of the RIA! network emanates from the growing demand for data and analysis necessary
for appropriate but visionary policy required to catapult the continent into the information age. Through net-
work development RIA! seeks to build an African knowledge base in support of ICT policy and regulatory
design processes and monitor and review policy and regulatory developments on the continent.
The research, arising from a public interest agenda, is made available in the public domain and individuals
and entities from the public and private sector and civil society are encouraged to use it for teaching, further
research or to enable them to participate more effectively in national, regional and global ICT policy formu-
lation and governance.
The network is hosted at the Witwatersrand University, LINK Centre, under the directorship of Professor Ali-
son Gillwald. Each member country has a nodal member responsible for coordinating RIA! activities in his/her
respective country. There are further regional coordinators for East Africa, Dr Lishan Adam, and for West
Africa, Dr Olivier Nana Nzèpa.
For further information contact the RIA! coordinator Beki Nkala on [email protected] or go to
www.researchICTafrica.net
Benin – CEFRED, Université d'Abomey Calavi
Botswana – University of Botswana
Burkina Faso – CEDRES, University of Ouagadougou
Cameroon – University of Yaounde II
Côte d'Ivoire – CIRES, l'Université Nationale de Côte d'Ivoire
Ethiopia – University of Addis Ababa
Ghana – STEPRI of CSIR
Kenya – University of Nairobi
Mozambique – Universidade Eduardo Mondlane
Namibia – Namibia Economic and Policy Research Unit
Nigeria – University of Lagos
Rwanda – KIST (Kigali Institute of Science, Technology and Management
Senegal – CRES
South Africa – LINK Centre, University of Witwatersrand
Tanzania – Tanzania Communications Regulatory Authority
Uganda – University of Makerere
Zambia – University of Zambia
East Africa Regional Manager: Dr Lishan Adam
West Africa Regional Manager: Dr Olivier Nana Nzépa
This research is made possible by the support of the Independent Development Research Centre, (IDRC), Ottawa, Canada.
Senior Programme Manager:
Heloise Emdon, [email protected]
South Africa
COUNTRY PROFILE SERIES

UUggaannddaa
4 2007 Telecommunications Sector Performance Review
UUggaannddaa
52007 Telecommunications Sector Performance Review
SERIES EDITOR:
Alison Gillwald
Other country studies in this series are available on
www.researchICTafrica.com.
Proof reading: Beki Nkala
� Benin: Augustin Chabossou
� Botswana: Sebusang Sebusang, MP Makepe andTD Botlhole
� Burkina Faso: Pam Zahonogo
� Cameroon: Olivier Nana Nzèpa and Robertine Tankeu
� Côte d'Ivoire: Arsene Kouadio
� Ethiopia: Lishan Adam
� Ghana: Godfred Frempong
� Kenya: Tim Waema
� Mozambique: Americo Muchanga and Francisco Mabila
� Namibia: Christoph Stork and Mariama Deen-Swarray
� Nigeria: Ike Mowete
� Rwanda: Albert Nsengiyumva and Annet B Baingana
� South Africa: Steve Esselaar and Alison Gillwald
� Tanzania: Ray Mfungayma and Haji Semboja
� Zambia: Sikaaba Malavu
UUggaannddaa
6 2007 Telecommunications Sector Performance Review
List of Abbreviations
CDMA Code Division Multiple Access
COMESA Common Market for Eastern and Southern Africa
DSL Digital Subscriber Lines
EASSy Eastern Africa Submarine Cable System
EGI E-Government Infrastructure
GDP Gross Domestic Product
GII Global Information Infrastructure
GPRS General Packet Radio System
GSM Global System for Mobile Communications
ICT Information and Communication Technology
IDRC International Development Research Corporation (Canada)
IFMS Integrated Financial Management System
ISP Internet Service Provider
ITU International Telecommunication Union
IXP Internet Exchange Point
MTN MTN Uganda Ltd
NBI National Backbone Infrastructure
NGO Non-governmental Organisation
NTO National Telecommunications Operator
OECD Organisation for Economic Co-operation and Development
PABX Private Automatic Branch eXchange
PEAP Poverty Eradication Action Programme
PoP Point of Presence
PPP Public Private Sector Partnerships
QoS Quality of Service
RCDB Rural Communications Development Board
RCDF Rural Communications Development Fund
RCDP Rural Communications Development Policy
STD Subscriber Trunk Dialling
UCC Uganda Communications Commission
UGX Ugandan Shillings (Official Currency)
UICT Uganda Institute of Information and Communication Technology
UIXP Uganda Internet Exchange Point
UPTC Uganda Posts and Telecommunications Company Ltd
UTL Uganda Telecomm Ltd
VSAT Very Small Aperture Terminal
UUggaannddaa
72007 Telecommunications Sector Performance Review
TABLE OF CONTENTS
List of Abbreviations 6
Executive Summary 9
Introduction and Summary 11
Socio-economic and Political Background of Ghana 13
Policy, Institutional and Regulatory Frameworks 15
Telecom Regulatory Environment Survey 22
International and Regional Organisations 24
ICT Market Outlook 26
Cost of ICT Services and Usage 41
Conclusion and Recommendations 51
References 55

UUggaannddaa
8 2007 Telecommunications Sector Performance Review
UUggaannddaa
92007 Telecommunications Sector Performance Review
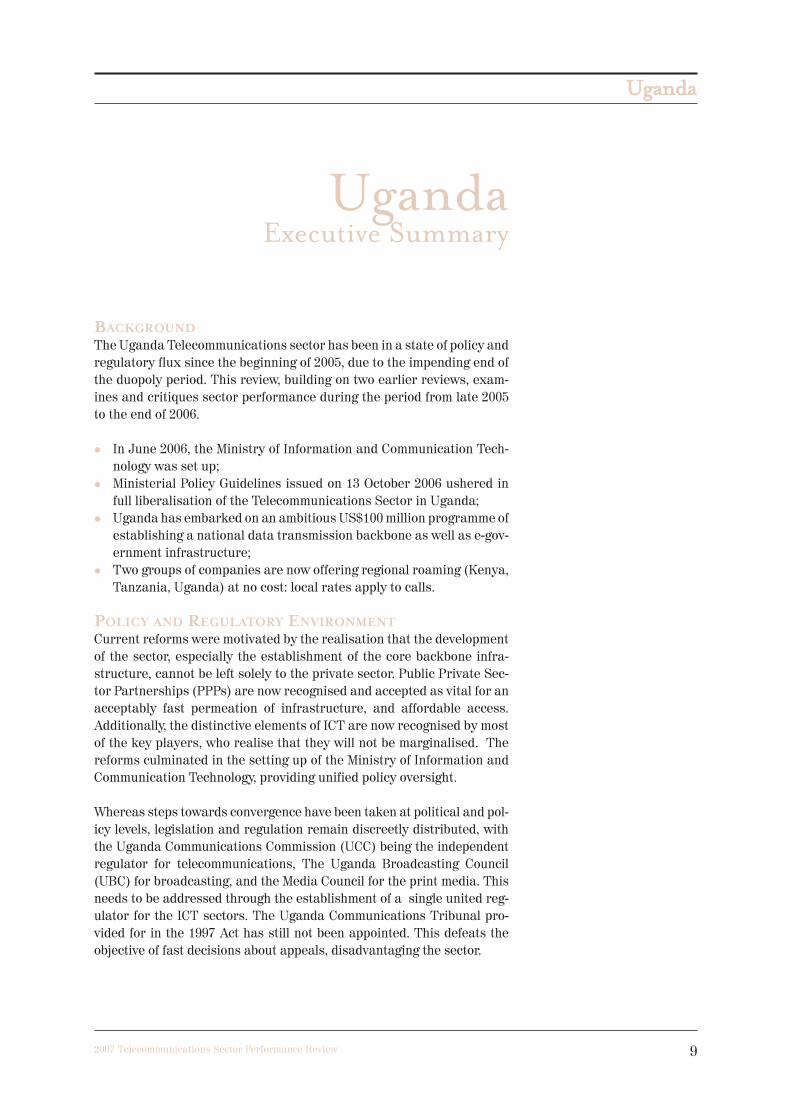
BACKGROUND
The Uganda Telecommunications sector has been in a state of policy and
regulatory flux since the beginning of 2005, due to the impending end of
the duopoly period. This review, building on two earlier reviews, exam-
ines and critiques sector performance during the period from late 2005
to the end of 2006.
� In June 2006, the Ministry of Information and Communication Tech-
nology was set up;
� Ministerial Policy Guidelines issued on 13 October 2006 ushered in
full liberalisation of the Telecommunications Sector in Uganda;
� Uganda has embarked on an ambitious US$100 million programme of
establishing a national data transmission backbone as well as e-gov-
ernment infrastructure;
� Two groups of companies are now offering regional roaming (Kenya,
Tanzania, Uganda) at no cost: local rates apply to calls.
POLICY AND REGULATORY ENVIRONMENT
Current reforms were motivated by the realisation that the development
of the sector, especially the establishment of the core backbone infra-
structure, cannot be left solely to the private sector. Public Private Sec-
tor Partnerships (PPPs) are now recognised and accepted as vital for an
acceptably fast permeation of infrastructure, and affordable access.
Additionally, the distinctive elements of ICT are now recognised by most
of the key players, who realise that they will not be marginalised. The
reforms culminated in the setting up of the Ministry of Information and
Communication Technology, providing unified policy oversight.
Whereas steps towards convergence have been taken at political and pol-
icy levels, legislation and regulation remain discreetly distributed, with
the Uganda Communications Commission (UCC) being the independent
regulator for telecommunications, The Uganda Broadcasting Council
(UBC) for broadcasting, and the Media Council for the print media. This
needs to be addressed through the establishment of a single united reg-
ulator for the ICT sectors. The Uganda Communications Tribunal pro-
vided for in the 1997 Act has still not been appointed. This defeats the
objective of fast decisions about appeals, disadvantaging the sector.
UgandaExecutive Summary
UUggaannddaa
10 2007 Telecommunications Sector Performance Review
On 11 May 2006, the Minister responsible for telecommunications issued
guidelines to UCC as an interim response to the end of the duopoly. This
was followed on 13 October 2006 by further guidelines to UCC by the new
Minister of ICT, giving policy direction for the full liberalisation of the
telecommunications sector by 1 November 2006, opening up competition
in all aspects of telecommunications.
The new policy goals focus on the ubiquity of telecommunications infra-
structure and services to enable planned human development, the equi-
table delivery of information and service needs to all sectors of society,
addressing availability, accessibility and affordability, and growth of the
production sector that, hitherto, have not been key considerations.
Specific targets focus on delivering broadband access to all units of local
government as well as all educational institutions at all levels, and to all
government health units. These targets will be achieved by implement-
ing a national data backbone through a PPP, thus enabling private sec-
tor operators to achieve nationwide coverage with minimum investment.
Parallel with this is the targeting of the more affluent sections of society
through the private sector to achieve a universal service level of 20%
(currently 4.2%) and data connectivity of at least 64KBps to 10% of
households (currently less than 1%).
Following the 13 October 2006 Ministerial Guidelines, UCC established a
new licensing regime becoming effective on 2 January 2007. The new
licence categories are:
INFRASTRUCTURE LICENCES
The Infrastructure licences permit holders to establish and operate
telecommunication infrastructure, with a requirement to permit service
providers access on a non-discriminatory commercial basis.
SERVICE LICENCES
Service Licences permit holders to provide services, using infrastructure
provided by infrastructure licensees. They can also establish their own
infrastructure if licensed to do so.
PERFORMANCE OF THE TELECOMUNICATIONS SECTOR
During 2005, the level of investment declined as operators waited to hear
Government’s decision on the structure of the market after the duopoly.
The 2004 sector reviewnoted that this was expected. Another upsurge in
investment levels is expected with the latest opening-up of the sector to
further competition under the new regime.
Growth has continued to be dominated by the mobile sector, but with a
reducing rate of growth. The reducing rate of growth can be attributed
to price-based saturation effects under the current marketing regime,
UUggaannddaa
112007 Telecommunications Sector Performance Review
compounded by the increasing taxation on mobile services. Initiatives
and innovations, including near free handsets, public investment in the
roll-out of basic connectivity, increased competition that forces
increased market efficiency, and delivery of voice services through data,
will be major factors in pushing access and utilisation to a new and
higher price-based saturation level.
The Rural Communications Development Fund (RCDF), raised through
a levy of 1% on operators’ gross annual revenues, has continued to con-
tribute significantly to the increased penetration of pay phones around
the country. RCDF has partnered with bodies such as the World Bank
and the International Telecommunications Union (ITU). By the end of
2006 the Fund had supported the establishment of or supported Internet
cafes, ICT Training Centres, Internet points of presence, and a modest
number of payphones in 56 districts. A major part of the RCD programme
was implemented during 2006, and it is difficult to evaluate impact at this
point in time.
By the end of 2005 there was coverage in all the 56 districts of Uganda,
even if in many cases, this was confined to a small area of the entire dis-
trict. There are now 80 districts and, some of these may not be covered,
especially since re-districting has occurred exclusively in the rural
areas. With the recognition by Government and the public of the value of
ICT, and the desire to deploy e-government and e-governance, a formal
decision to implement the National Backbone Infrastructure (NBI) and
the E-government Infrastructure (EGI) as public funded projects was
taken in the second half of 2006, with one of the objectives being the
establishment of high capacity links to all districts. The estimated cost
of the NBI and EGI is about US$100 million. A related policy decision
aimed at international connectivity is remaining open to and supporting
all initiatives that will provide access to the global information infra-
structure (GII). This includes the EASSy cable.
The increasing number of subscribers, increasing efficiency of opera-
tions resulting from the introduction of competition in the sector, and
the increasing numbers of operators have led to a continued growth in
sector turnover and increasing contribution to GDP. Direct or full-time
staff and total staff now stand at just under 6 000, while those working
in related industry/businesses generated by the sector stand at about
300 000. This number is expected to increase with the full liberalisation
of the sector.
With regard to tariffs, the general trend has been a decrease, with the
exception being calls from or to fixed lines in East Africa whose costs
have shown an upward trend. It should be noted that, specifically for the
pre-paid market, the imposition of excise duty has had a negative impact
on tariffs and usage. Celtel, operating in each of the countries, intro-
UUggaannddaa
12 2007 Telecommunications Sector Performance Review
duced a new competition frontier by eliminating charges for receiving
calls when roaming, and allowing the customers to make calls at local
rates of countries visited within East Africa. A consortium of MTN in
Uganda, Safaricom in Kenya, and Vodacom in Tanzania rapidly followed
suit. This is an international first.
Internet usage remains very low. The number of subscriber accounts
stood at 11 000 in June 2006. Total incoming and outgoing international
Internet bandwidth is less than 200MBps - extremely low for the size of
the population and the economy. Most users of the Internet in Uganda are
in the capital, Kampala. It is expected that the full liberalisation of the
sector and the national backbone will increase the penetration of Inter-
net around the country.
GOVERNMENT ICT USAGE
From a survey of 18 ministries and 4 statutory bodies, it was established
that there are generally inadequate ICT infrastructure and access, lim-
ited competent technical staff and insufficient budgetary allocations to
sustain ICT services. Government ICT-usage, based on statistics, looks
good, but the reality is that facilities are used largely for email and doc-
ument processing. The real value that comes from an effective intranet,
offering services to citizens on line and running information systems has
not been realised. It was also noted that there are several uncoordinated
initiatives at various levels, mainly focused around e-government and
improvement of service delivery.
A service delivery approach that is in line with the decentralisation
policy, with a holistic strategy that takes into consideration other non-
technology issues like business process re-engineering, a focus on
staff re-training to optimally utilise these new technologies, changing
people’s mindsets and putting in place enabling policies, are strongly
recommended.
REGULATORY PERCEPTION
Lack of easily accessible, complete and understandable information
appears to be a major contributing factor to regulatory perception. While
the regulator has invested considerable resources in availing informa-
tion about various regulatory processes on its website, the majority of
people lack Internet access or literacy.
Most respondents perceive the licensing process to be satisfactory, but
the monitoring of anti-competitive behaviour as poor or unsatisfactory.
This was especially so in the aspect of interconnection where, in addi-
tion to perceived anti-competitive behaviour, consumers believe that
operators have been given too much leeway.
UUggaannddaa
132007 Telecommunications Sector Performance Review
The dominant perception regarding regulatory independence is neutral.
The regulator is perceived to be doing a very good job in the allocation
of scarce resources, and an excellent job of providing information and
application guidelines online. Conversely, the majority of respondents
felt that the regulator’s performance was unsatisfactory or poor with
respect to tariff regulation. Indeed most respondents assume that tariffs
charged in Uganda are some of the highest in the region.
About 40% of the respondents thought that progress towards universal
access is poor or unsatisfactory, 40% gave a neutral response, and 20%
thought it is satisfactory or excellent. The limiting factor here is in real-
ity affordability rather than the coverage aspect of universal access.
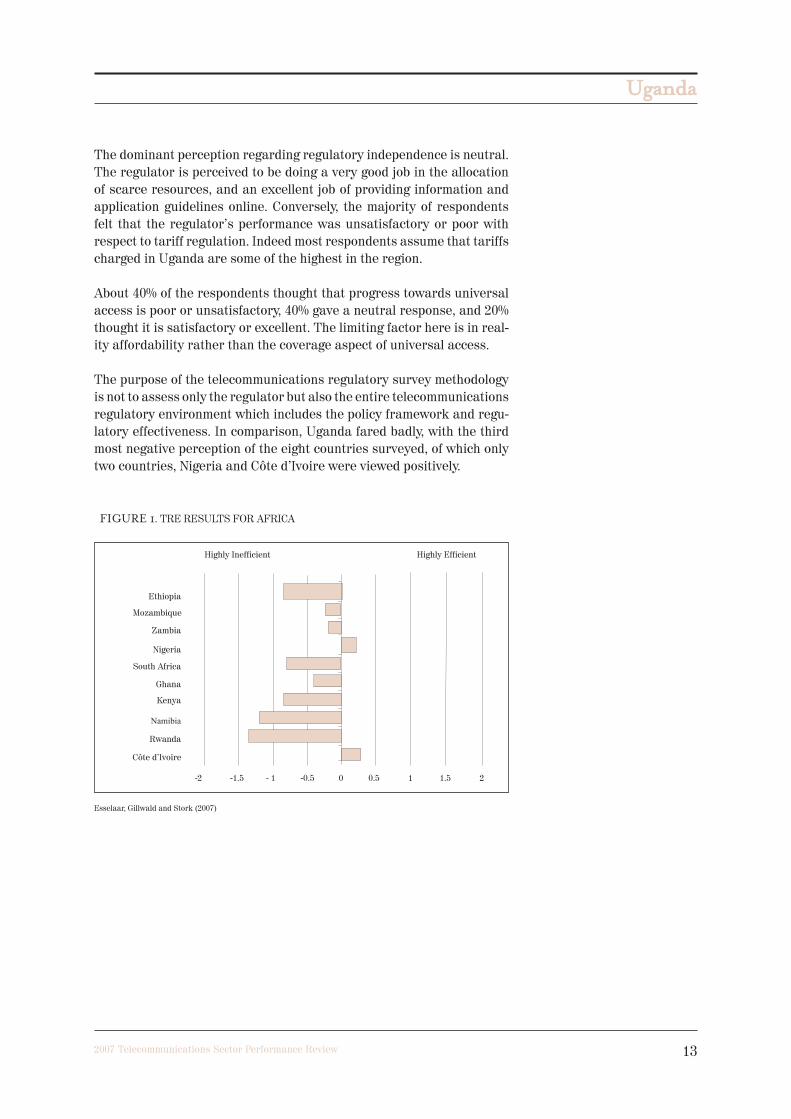
The purpose of the telecommunications regulatory survey methodology
is not to assess only the regulator but also the entire telecommunications
regulatory environment which includes the policy framework and regu-
latory effectiveness. In comparison, Uganda fared badly, with the third
most negative perception of the eight countries surveyed, of which only
two countries, Nigeria and Côte d’Ivoire were viewed positively.
FIGURE 1. TRE RESULTS FOR AFRICA
Esselaar, Gillwald and Stork (2007)

UUggaannddaa
14 2007 Telecommunications Sector Performance Review
CHALLENGES AND RECOMMENDATIONS
This review has brought out the continuing dynamism of the ICT sector
in Uganda, responding at policy and regulatory levels to observed policy
and implementation failures. Government has responded to most policy
challenges identified in the earlier reviews (up to 2005). While not
directly related to this review, government has also moved to increase
the profile and content related to ICT in major national documents,
including Vision 2035 (the planned successor to Vision 2025) and the
Poverty Eradication Action Programme (PEAP). Challenges to the suc-
cess of the new policy initiatives that need to be recognised and
addressed include:
� Regulation. Uganda Communications Commission has been required
to rapidly transform from a market structure dominated by the duop-
oly to a fully liberalised market. New approaches and appropriate
capacity-building are required to ensure that regulatory failure does
not negate the policy objectives of government. Secondly, Uganda
needs to look into establishing a single unified regulator responsible
for all the ICT sectors;
� Laws. As noted in the detailed discussion, many laws (eg competition
law) that are required to enable a fully liberalised data-centric sector
are not yet in place;
� Public infrastructure. Investments like the National Data Backbone
will need proper governance and operation to ensure that they do not
destructively distort the market;’
� Government re-engineering. The service delivery approach that is
core to the e-government initiative will only be achieved if it goes
hand in hand with a holistic strategy that takes into consideration
non-technology issues like business process re-engineering, govern-
ment restructuring to match new processes, and a focus on staff re-
training to optimally work in an ICT-enabled environment.
It remains to be seen, over the next two years or so, how the new policy
directions will impact on access, affordability and, at the higher level,
development.
3 It should be stated that the current official minimum wage is above US$1 per day.

UUggaannddaa
152007 Telecommunications Sector Performance Review
Background
The Uganda Telecommunications sector has been in a state of policy and
regulatory flux since the beginning of 2005. This was caused by the
impending end of the duopoly period, the defining pillar of the market
structure since reform started, and the consequent assessment and
review of the policy.
This review examines and critiques sector performance during the
period 2005 to 2006. It builds on two previous reviews: The Uganda
Telecommunications Sector Performance Review of 2003, and the
demand side based ICT Access and Usage Survey of 2005.
� Ministerial Policy Guidelines issued on 11 May 2006 opened up the
service market of the Telecommunications Sector in Uganda to full
competition;
� In June 2006, Uganda recognised the importance of ICT to national
development by setting up a Ministry of Information and Communica-
tion Technology;
� Ministerial Policy Guidelines issued on 13 October 2006 ushered in
full liberalisation of the Telecommunications Sector in Uganda by
opening up all aspects to unlimited competition;
� Uganda has embarked on an ambitious US$100 million programme of
establishing a national data transmission backbone as well as e-gov-
ernment infrastructure;
� Two groups of companies are now offering regional roaming (Kenya,
Tanzania, Uganda) at no cost: local rates apply to all calls.

UUggaannddaa
16 2007 Telecommunications Sector Performance Review
Policy and RegulatoryEnvironment2
HISTORICAL MOTIVATION FOR REFORM AND THE
REFORM PROCESS
As discussed in the earlier reviews cited, the primary motivation for
the initial reform was not improved sector performance, but elimina-
tion of the high recurrent subsidy for the government-owned monopoly,
Uganda Posts and Telecommunications Ltd (UP&TC). The apprecia-
tion that poor telecommunication services are an impediment to invest-
ment and the socio-economic benefits of ensuring universal access
were secondary issues at the time this reform started. Although this
resulted in the establishment of one of the most liberal regulatory envi-
ronments on the African continent at the time, and the creation of a reg-
ulatory agency that is markedly independent, the emergent sector pol-
icy was not conceived holistically as a means of responding to the
greater challenge of sustainable human development.
Subsequently, the sector was opened up to competition initially through
the licensing of CelTel in September 1993 to provide nationwide mobile
services and other “value added” services. MTN (U) Ltd was licensed in
1998 as a second national telecom operator, Uganda Telecom Limited -
UTL, to compete with the successor to UP&TC. UTL was privatised in
June 2000 and its licence became effective 25 July 2000, which began the
five year exclusivity granted to the two National Telecom Operators
(NTOs). This period of limited competition in basic telephony service,
cellular telecommunications services and satellite services was over
time blamed for stifling innovation and development of the telecom sec-
tor, as well as hindering uptake of ICT in other sectors.
Before the end of the exclusivity period, the Minister responsible for
communications asked the Uganda Communications Commission (UCC)
to spearhead the review of the Telecommunications Policy3. The weak-
nesses in the first policy having been noted, a holistic approach, seeking
to create a telecommunications environment that is responsive to the
development needs of the country, was taken. Extensive consultations
with the various stakeholders (private and public sector included) were
undertaken during this review process, giving it national ownership
among the various stakeholders.
MOTIVATION AND CONTEXT FOR CURRENT REFORMS
Various factors have shaped the motivation and thinking around the cur-
rent process of sector reform.
2 The Uganda Telecommunications Sector Review, FF Tusubira, Irene Kaggwa and Fred Muk-holi, 2004
3 This was an explicit recognition of the capacity limitation within the Ministry, which is responsiblefor policy, to carry out a review.

UUggaannddaa
172007 Telecommunications Sector Performance Review
The realisation that the development of the sector, especially the estab-
lishment of the core backbone infrastructure, cannot be left solely to the
private sector, was the first concern. This was based on a key finding of
the 2005 ICT Access and Usage Survey that contained results of an E-
Usage survey funded mainly by the Uganda Communications Commis-
sion. Public Private Sector Partnerships (PPPs) are now recognised and
accepted as vital for an acceptably fast penetration of telecommunica-
tion infrastructure as well as affordable access.
The second has been a territorial factor; the proponents of Telecommu-
nications, Information Technology, and Broadcasting in Uganda were
over a long period driven by divergent agendas. There has more recently
been a gradual resolution of differences and acceptance of the mutual
interdependence of the sectors and the players. This meant that even
when the sectors were under different political guidance, the players
established informal, semi-formal, and sometimes formal methods of col-
laboration. The distinctive elements of ICT are now recognised by most
of the key players who do not feel that they will be marginalised. This has
led to a coalescing of various stakeholder interests, ranging from the pri-
vate sector to government, arguing against the marginalisation of ICT at
the political level. Two key fora were:
� the stakeholder forum, chaired by the National Planning Authority,
that proposed the consistent integration of ICT into the Poverty Erad-
ication Action Plan (PEAP) III, and into Vision 2035 (successor to
Vision 2025);
� the Presidential Investment Roundtable (PIRT), ICT sub-sector, a
largely private sector forum that made recommendations to the Pres-
ident on key ICT initiatives.
The political profile of ICT has consequently been raised, culminating in
the formal adoption by Government of ICT as a key priority, and the set-
ting up of a Ministry of Information and Communication Technology,
bringing, for the first time, political-level convergence in the sector. A last
frontier here is the continuing exclusion from the new Ministry of the
technical aspects of broadcasting: These are still under the authority of
the Ministry of Information, the main propaganda arm of Government.
Finally, there is the national experience of Ugandans, always strongly
voiced, of the benefits of full liberalisation in terms of greater choice and
fairer prices in all sectors.
On 11 May 2006, prior to the formal adoption of the new sector policy and
eleven months after the end of the duopoly (which was therefore de facto
extended), the Minister responsible for telecommunications, driven by a
public outcry, issued guidelines to UCC as an interim response to the end

UUggaannddaa
18 2007 Telecommunications Sector Performance Review
of the duopoly. These guidelines were a formalisation of some recommen-
dations in the proposed revised sector policy. This was followed on 13
October 2006 summary, , by further guidelines in summary from the new
Minister of ICT, giving policy direction to UCC for the full liberalisation
of the telecommunications sector by 1 November 2006, opening up unlim-
ited competition in all aspects of telecommunications.
It must be noted that the key features of the current reform have all come
into effect at the time of review, and will not impact on performance as
presented in this discussion.
SECTOR POLICY AND POLICY OBJECTIVES4
In the formal proposition of the new policy, it was noted by Government
that while the first policy more than achieved its objectives, and despite
the good regulatory environment in Uganda, many shortcomings still
remain. The most telling weakness in the earlier policy was the purely
infrastructural focus that was not in any way related to the national
development goals and plans. Consequently, while what was planned
was achieved, the level of penetration of telecommunication services
still remains too low to provide the necessary efficiency in service
delivery as well as social and economic transactions to support devel-
opment plans. Levels of availability, accessibility and affordability of
telecom services still remain low, with hardly any integration of ICT in
the daily activities or the service delivery in areas such as education,
health, agriculture, governance, and business. This is compounded by
inadequate consumer awareness and empowerment, resulting in a lack
of understanding of benefits, rights and opportunities presented by
telecommunication services.
With this background, government has adopted a policy framework that
takes as its central pillar the crucial roles that easy access to relevant
information, and efficient communications, play in supporting human
development and underscoring the necessity of ensuring equitable
access to telecommunication services for all the citizens of Uganda
through an enabled and competitive private sector. In the policy frame-
work, government recognises through the experience of the previous ten
years that a purely commercial approach would marginalise the major-
ity of citizens, and has therefore made universal access supported by
appropriate Public Private Partnerships (PPPs) a key policy objective.
The policy goals focus on the ubiquity of telecommunication infrastruc-
ture and services that will enable sustainable human development
through ease and affordability of access to relevant, accurate and timely
information. Such infrastructure is planned to provide the platform for
the delivery of the high-level information and service needs to all sectors
of society. E-government and e-governance are therefore necessarily key
objectives of the policy.
4 This position is encapsulated from the original policy proposals as well as from the Ministry of ICTsynthesis of the issues.
UUggaannddaa
192007 Telecommunications Sector Performance Review
For the first time, and recognising that it is not sustainable for a country
like Uganda to rely on imports for all hard and soft ICT resources, the
policy also aims at promoting the growth of the production and service
export sectors. This will include stimulating and supporting research
and development, fabrication and manufacturing, training, consultancy,
outsourcing services, etc.
There are two categories of specific objectives, all to be achieved by 2010:
� Category 1 provides for Institutional Data Access Points of speeds not
less than 256KBps for all government-aided educational institutions
at all levels, all government health units, population centres in units
of 1 000 people, agricultural extension units and other public institu-
tions, and all sub-counties. Public voice will be even more extensive,
as far down as village level. To enable all these, a National Data
Transmission Backbone is planned to connect to all the administra-
tive districts of Uganda, providing a data-centric route for data, voice
and multi-media communication.
This category has the purpose of achieving universal access objec-
tives aimed at enabling the human development plans and support-
ing various government service delivery sectors. These will be
realised through fulfilment of licence obligations, the Rural Commu-
nications Development Fund; and major PPPs such as the implemen-
tation of the National Data Backbone.
� Category 2 is intended to address sectors of the population that can
afford commercial services. The specific objectives here of achieving
a universal service target of 20% of the projected population, up from
the current 4.2%; and Internet connection at greater than 64KBps to
at least 10% of households in the country, up from the current figure
that is less than 1%, are planned to be achieved largely through mar-
ket liberalisation, fair competition and tariff regulation.
MARKET STRUCTURE
Until mid-2006 the market consisted of two types of providers: the major
operators (UTL, MTN and Celtel) providing the voice services and
related functions, and the minor licensees consisting of ISPs as well as
block wiring and equipment vending companies. The numbers of compa-
nies licensed respectively by September 2006 are shown in Table 1.
UUggaannddaa
20 2007 Telecommunications Sector Performance Review
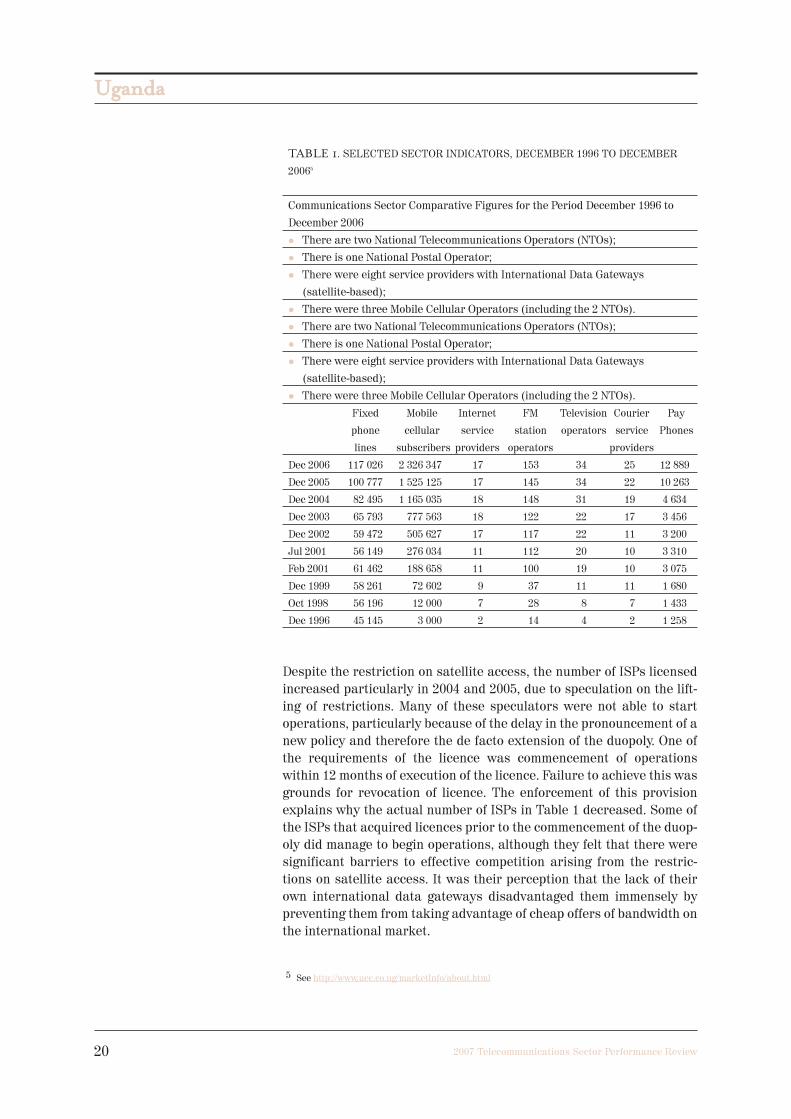
TABLE 1. SELECTED SECTOR INDICATORS, DECEMBER 1996 TO DECEMBER
20065
Communications Sector Comparative Figures for the Period December 1996 to
December 2006
� There are two National Telecommunications Operators (NTOs);
� There is one National Postal Operator;
� There were eight service providers with International Data Gateways
(satellite-based);
� There were three Mobile Cellular Operators (including the 2 NTOs).
� There are two National Telecommunications Operators (NTOs);
� There is one National Postal Operator;
� There were eight service providers with International Data Gateways
(satellite-based);
� There were three Mobile Cellular Operators (including the 2 NTOs).
Fixed Mobile Internet FM Television Courier Pay
phone cellular service station operators service Phones
lines subscribers providers operators providers
Dec 2006 117 026 2 326 347 17 153 34 25 12 889
Dec 2005 100 777 1 525 125 17 145 34 22 10 263
Dec 2004 82 495 1 165 035 18 148 31 19 4 634
Dec 2003 65 793 777 563 18 122 22 17 3 456
Dec 2002 59 472 505 627 17 117 22 11 3 200
Jul 2001 56 149 276 034 11 112 20 10 3 310
Feb 2001 61 462 188 658 11 100 19 10 3 075
Dec 1999 58 261 72 602 9 37 11 11 1 680
Oct 1998 56 196 12 000 7 28 8 7 1 433
Dec 1996 45 145 3 000 2 14 4 2 1 258
Despite the restriction on satellite access, the number of ISPs licensed
increased particularly in 2004 and 2005, due to speculation on the lift-
ing of restrictions. Many of these speculators were not able to start
operations, particularly because of the delay in the pronouncement of a
new policy and therefore the de facto extension of the duopoly. One of
the requirements of the licence was commencement of operations
within 12 months of execution of the licence. Failure to achieve this was
grounds for revocation of licence. The enforcement of this provision
explains why the actual number of ISPs in Table 1 decreased. Some of
the ISPs that acquired licences prior to the commencement of the duop-
oly did manage to begin operations, although they felt that there were
significant barriers to effective competition arising from the restric-
tions on satellite access. It was their perception that the lack of their
own international data gateways disadvantaged them immensely by
preventing them from taking advantage of cheap offers of bandwidth on
the international market.
5 See http://www.ucc.co.ug/marketInfo/about.html

UUggaannddaa
212007 Telecommunications Sector Performance Review
The May 2006 Ministerial Guidelines permitted UCC to open up the pro-
vision of communications services (voice and data) to full competition
while still maintaining restrictions on provision or ownership of infra-
structure. After stakeholder consultations, UCC designed a new licens-
ing regime that came into effect on 14 August 2006. This new regime is
technology neutral in that licences are not issued based on the technol-
ogy or mobility of the service but on the recognition that voice and data
can now be provided over the same transport platform. All already exist-
ing ISPs have been permitted to move to this regime, enabling the full
utilisation of their networks and providing them with the flexibility to
embrace the benefits of development through the capabilities of tech-
nologies associated with the Internet.
The market has also been opened up to providers of calling card serv-
ices, accepting provision of services by providers outside Uganda. This
is a service in which there has been a lot of interest shown but that was
restricted by the provisions of the duopoly arrangement. The launch of
the Ulaya International Calling shop was certainly welcomed, especially
by the Asian community, for international calling. The effect of these
services on the international tariffs in the sector remains to be seen.
Following 13 October 2006 Ministerial Guidelines, UCC defined a new
licensing regime to become effective on 2 January 2007. Under the new
licensing regime the market is shaped through the following licence cat-
egories and provisions:
INFRASTRUCTURE LICENCES
The Infrastructure licences permit holders to establish and operate
telecommunication infrastructure. Public infrastructure licensees are
required to permit service providers access to their infrastructure on a
non-discriminatory commercial basis. Within this category, PPPs will be
used to establish nationwide infrastructure, eliminating the need for
direct roll-out obligations.
SERVICE LICENCES
Service licences permit holders to provide services, using infrastruc-
ture provided by infrastructure licensees. Service providers can also
establish their own infrastructure upon acquiring an infrastructure
licence. As part of the licensing regime, operators who achieve domi-
nant market share in infrastructure or services will be subject to price
regulation. In addition, operators who, for historical or other reasons
offer both infrastructure and services, will be required to have sepa-
ration in accounting between the infrastructure and services sides of
their operations, with a clear distinction between wholesale and retail
operations.
UUggaannddaa
22 2007 Telecommunications Sector Performance Review
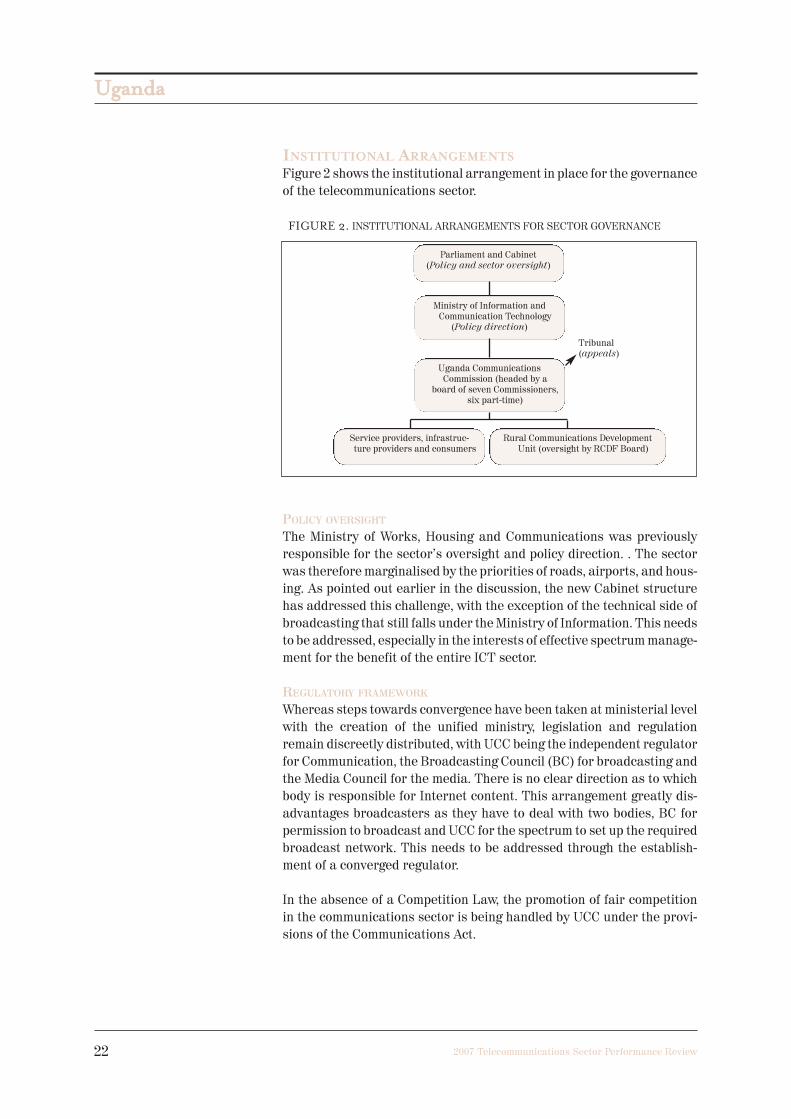
INSTITUTIONAL ARRANGEMENTS
Figure 2 shows the institutional arrangement in place for the governance
of the telecommunications sector.
FIGURE 2. INSTITUTIONAL ARRANGEMENTS FOR SECTOR GOVERNANCE
POLICY OVERSIGHT
The Ministry of Works, Housing and Communications was previously
responsible for the sector’s oversight and policy direction. . The sector
was therefore marginalised by the priorities of roads, airports, and hous-
ing. As pointed out earlier in the discussion, the new Cabinet structure
has addressed this challenge, with the exception of the technical side of
broadcasting that still falls under the Ministry of Information. This needs
to be addressed, especially in the interests of effective spectrum manage-
ment for the benefit of the entire ICT sector.
REGULATORY FRAMEWORK
Whereas steps towards convergence have been taken at ministerial level
with the creation of the unified ministry, legislation and regulation
remain discreetly distributed, with UCC being the independent regulator
for Communication, the Broadcasting Council (BC) for broadcasting and
the Media Council for the media. There is no clear direction as to which
body is responsible for Internet content. This arrangement greatly dis-
advantages broadcasters as they have to deal with two bodies, BC for
permission to broadcast and UCC for the spectrum to set up the required
broadcast network. This needs to be addressed through the establish-
ment of a converged regulator.
In the absence of a Competition Law, the promotion of fair competition
in the communications sector is being handled by UCC under the provi-
sions of the Communications Act.
Parliament and Cabinet (Policy and sector oversight)
Service providers, infrastruc-ture providers and consumers
Rural Communications DevelopmentUnit (oversight by RCDF Board)
Ministry of Information andCommunication Technology
(Policy direction)
Uganda Communications Commission (headed by a
board of seven Commissioners,six part-time)
Tribunal(appeals)
UUggaannddaa
232007 Telecommunications Sector Performance Review
APPEAL PROCESS
The Uganda Communications Tribunal provided for in the Act has still
not been appointed. Complaints and disputes against or not satisfacto-
rily handled by UCC are often taken to the ordinary courts of Law. This
defeats the objective of fast decisions about appeals, a disadvantage for
the sector.
UUggaannddaa
24 2007 Telecommunications Sector Performance Review
PERFORMACE OF THETELECOMMUNICATIONSSECTOR
In this section, the performance of the telecommunications sector is dis-
cussed within the macro context of the national economy.
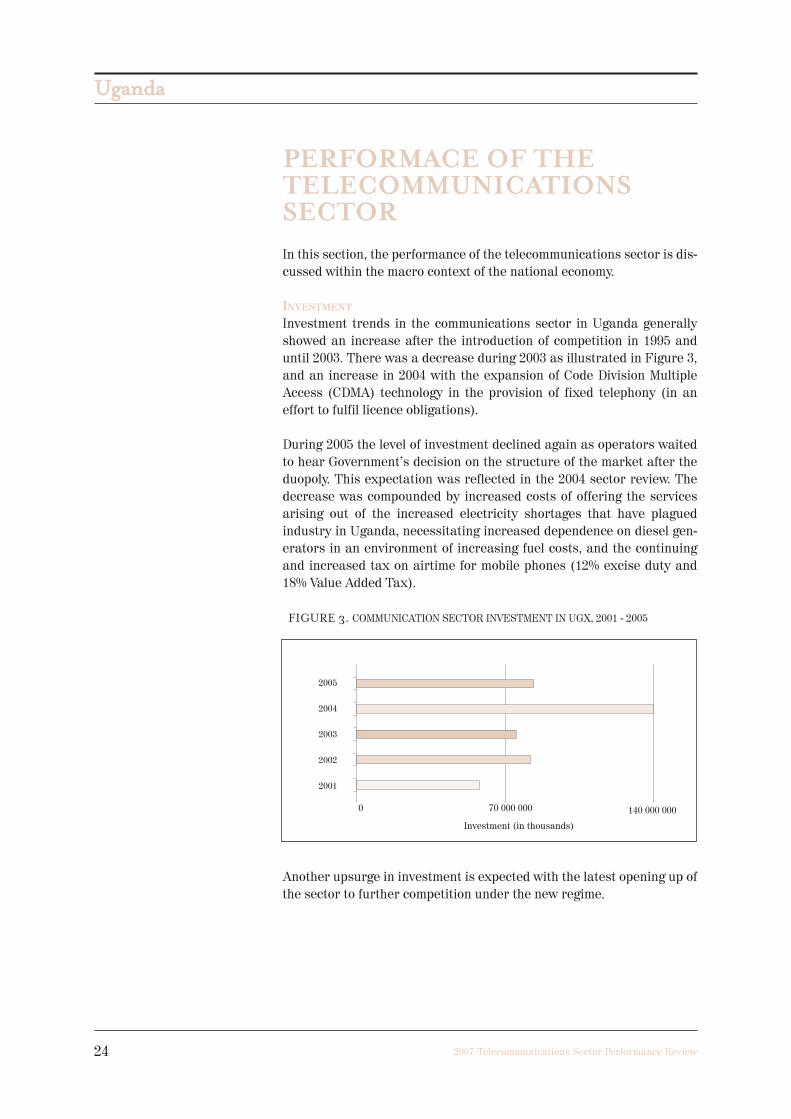
INVESTMENT
Investment trends in the communications sector in Uganda generally
showed an increase after the introduction of competition in 1995 and
until 2003. There was a decrease during 2003 as illustrated in Figure 3,
and an increase in 2004 with the expansion of Code Division Multiple
Access (CDMA) technology in the provision of fixed telephony (in an
effort to fulfil licence obligations).
During 2005 the level of investment declined again as operators waited
to hear Government’s decision on the structure of the market after the
duopoly. This expectation was reflected in the 2004 sector review. The
decrease was compounded by increased costs of offering the services
arising out of the increased electricity shortages that have plagued
industry in Uganda, necessitating increased dependence on diesel gen-
erators in an environment of increasing fuel costs, and the continuing
and increased tax on airtime for mobile phones (12% excise duty and
18% Value Added Tax).
FIGURE 3. COMMUNICATION SECTOR INVESTMENT IN UGX, 2001 - 2005
Another upsurge in investment is expected with the latest opening up of
the sector to further competition under the new regime.

UUggaannddaa
252007 Telecommunications Sector Performance Review
NUMBER OF SUBSCRIBERS
The benefits of introducing competition in the communication sector in
Uganda, and the resulting greater coverage and lower prices, are seen
through the increased number of subscribers. The number of phones
(fixed plus mobile)6 per 100 inhabitants continued to grow, reaching a
penetration of 5.98 in 2004, with most growth occurring in the number of
mobile subscribers as shown in Figure 4.
Although the number of mobile subscribers grew, the rate of growth has
declined since 2003. This can be attributed to price-based saturation
effects under the current marketing regime: firstly, the cost of mobiles
(about US$30 for the lowest priced units) is a barrier, and secondly, the
actual cost of services remains well above the disposable income of the
major percentage of the population, especially those in the rural areas.
This is compounded by the increasing taxation on pre-paid mobile serv-
ices - the basic access platform for the majority of the poorer section of
society. New approaches and initiatives, for example nearly free hand-
sets, public investment in the roll-out of basic connectivity, increased
competition that forces increased market efficiency, and delivery of voice
services through data, will be major factors in pushing access and utili-
sation to a new and higher price-based saturation level. Communal
forms of service access such as pay-phone facilities remain of signifi-
cance in achieving universal access.
It is observed that the fixed-line market that for a long time had been
almost stagnant, started growing again after 2003. This was boosted by
the introduction of wireless fixed-line services using CDMA, which
helped overcome the traditional barrier of time to obtain a line, for long
a deterrent to many and therefore a strong incentive for mobile use.
Although the connection fees associated with CDMA are slightly higher
than those associated with traditional copper line, the call tariffs are
the same.
FIGURE 4. GROWTH TRENDS IN TELEPHONE LINES (FIXED WIRE LINE AND
CELLULAR) IN UGANDA
Source: Uganda Communications Commission
6 The authors must observe that while they combine the numbers of fixed and mobiles as is nowcommon, it is intrinsically incorrect to do so, since each has advantages and disadvantagesdistinct from the other.

UUggaannddaa
26 2007 Telecommunications Sector Performance Review
With similar payphone obligations placed on the three voice operators,
innovation to achieve these while making a profit was stimulated. Learn-
ing from the success of the private phone kiosks, which had an added
attraction of a human interface to assist the user, the conventional wired
coin-operated payphone has been largely replaced by fixed wireless
phones mounted in offices or kiosk boxes with a human attendant or
mediator. Even the old wired payphones now have attendants at hand
with phone cards that allow persons to utilise the phone for as long as
they need, without having to buy a phone card. Power is still an issue for
fixed wireless phones, and the option of using solar panels is not attrac-
tive to the operators due to cost.
Competition in payphone installation has also resulted in innovative
pricing. The common language in phone use within Uganda refers to call
time in terms of units. Previously, a unit would be understood to be one
minute. However, UTL decided to market its call time on pay phones in
units of 15 seconds at UGX100 per unit. While it is inherently more
expensive to buy 15 seconds, it easier for many people to raise the
UGX100 than the UGX200 charged by competitor MTN for a full minute,
especially since the 15 seconds are sufficient to pass a message. From
a social perspective, it is also interesting to see the transformative
nature of the use of shorter units on communication; the traditional
extended greeting is being increasingly forgotten.
RURAL COMMUNICATIONS DEVELOPMENT
The Rural Communications Development Fund (RCDF), raised through
a levy (currently 1% and limited by law to 2.5%) on gross annual rev-
enues of operators (major and minor) , has continued to contribute sig-
nificantly to the increased penetration of payphones around the country.
The RCDF has been used to establish basic communications (at least one
voice access point for units of 2 500 people) nationwide, provide an Inter-
net point of presence in the capital of each administrative district, sup-
port an ICT training institution in each such district, and generally pro-
mote the provision of communications services in rural areas as a
profitable business. RCDF-supported projects have been implemented
through a PPP approach, with additional funding and support from bod-
ies such as the World Bank and the International Telecommunications
Union (ITU). By the end of 2006, the Fund had supported the establish-
ment of 55 Internet cafes, 55 ICT training centres, 13 multi-purpose tele-
centres, 820 payphones, district web portals for 54 districts, and 52 dis-
trict Internet PoPs. Twenty-four new administrative districts have been
recently created, and these must also now be addressed.
A major part of the RCD programme was implemented during 2006, and
it is difficult to evaluate impact at this point in time. It must also be
appreciated that with multiple development initiatives, the passage of

UUggaannddaa
272007 Telecommunications Sector Performance Review
time will increase the challenge of attribution. However, the following
qualitative remarks can be made about the project:
� The payphones established have contributed to improving access to
the population in terms of average distance to facilities. However, in
many cases, the installation of these facilities has followed the pres-
ence of network signal, implying that a significant portion of Ugan-
dans in rural areas still do not have access to telephony services
within reasonable distance;
� The size of a district in Uganda ranges from 1 827 km2 to about
10 000 km2. Therefore one café or ICT training centre, in most cases
located in the district capital, is a drop in the ocean.
� The use of facilities for Internet access and email is still very low due
to a multiplicity of reasons that will be discussed later in this study;
� The limited distribution network, coupled with the current acute
shortages that have plagued the nation despite having a wide reach-
ing national power grid, severely impact on the performance of the
RCDF, due to dependence of systems on mains power. The use of
alternatives such as solar power and generators needs to be inte-
grated into the programme; they pose a significant capital cost and,
in the case of generators, recurrent cost challenges that need to be
taken into account as part of project design.
� The creation of district web portals has been one of the successes of
the RCDF. The web portals contain information on various sectors
(education, agriculture, etc) as they relate to each district, and have
even been translated into three dominant local languages/dialects.
There is, however, no indication of the extent of usage and utilisation
of the online information. Secondly, the responsibility for content
update and management falls on districts that in most cases ignore
this responsibility, making the portals more cosmetic than a useful
aide to development.
� One of the initial challenges to the growth of Internet in Uganda was
highlighted as being the significant disadvantage of users outside of
Kampala who had to pay a lot more for access. The establishment of
Internet PoPs in districts was expected to alleviate this situation, but
access policies and limited availability of the PoPs to other providers
has reduced the expected benefit. Available bandwidths have also
been generally low. This was realised from the mid-term review, and
subsequent subsidy agreements have been refined to prescribe min-
imum bandwidths at PoPs.

UUggaannddaa
28 2007 Telecommunications Sector Performance Review
� One of the major challenges to provision of services in rural areas has
always been sustainability. In light of some of the challenges mentioned
above as well as low demand for the services, the likelihood of survival
or sustainability of some of the activities supported is reduced.
� RCDF has also met with market challenges in terms of ensuring that
competition is not distorted by subsidies offered under the program.
COVERAGE
By the end of 2005, there was coverage in all the 56 districts of Uganda,
even if in many cases, this was confined to a small area of the entire dis-
trict. At the time of writing this paper, the number of districts had been
increased to 80, and inevitably some of these are not covered, especially
since re-districting has occurred exclusively in the rural areas.
Coverage relies on a mix of backhaul and distribution technologies, all
being the choice of the service providers: GSM, CDMA, VSAT, copper
wire, and optical fibre cables.
The map in Figure 5 shows the existing cellular base stations as well as
the existing optical fibre backbone.
FIGURE 5. OPTICAL FIBRE LAYOUT AND DISTRIBUTION OF CELLULAR SITES

UUggaannddaa
292007 Telecommunications Sector Performance Review
During the review of the Telecommunications Policy, it was noted that the
current infrastructure was not sufficient to drive development to the
desired levels and meet the targets for penetration. Not much investment
was expected in the area of infrastructure even if the market were to be
opened up to competition. With the recognition by government and the pub-
lic of the value of ICT and the desire to deploy e-government and e-gover-
nance, the need for intervention to ensure sufficient infrastructure nation-
ally was accepted: Reform was originally focused on reducing government
intervention, but the obvious market failure in achieving national coverage
fast enough necessitated this change in approach. A strong statement was
needed that government would not get involved in operations.
The formal decision to implement the National Backbone Infrastructure
(NBI) and the E-government Infrastructure (EGI) as public funded proj-
ects (estimated cost US$100 million) was taken in the second half of
2006, with one of the objectives being the establishment of high capacity
links to all districts.
This decision necessitated the formulation of specific policy to provide
a framework for implementation. The task team that was set up to define
scope, context, feasibility and strategy came up with policy and gover-
nance proposals that will be released for public consultation and input
before formal consideration by government.
The key pillars of the policy include the implementation of e-government,
making government itself more efficient and more integrated, the imple-
mentation of e-governance and the requirement for one-stop service cen-
tres for citizens in all districts and municipalities to be established, and
the facilitation of access by all citizens to communications services
through the implementation of the NBI that will provide carrier services
extending to all districts by the year 2010 (with a provision for non-dis-
criminatory and open access for all commercial operators so that they
are enabled in supporting and achieving the universal access and uni-
versal service objectives of government).
A completely new initiative for Uganda, following the example of other
countries, is the proposal for special tariffs to enable affordable access
to the Internet in schools, educational institutions and health centres. If
this is formally adopted by government, it will have a major impact on
Internet access and use, and will ensure that the young population is
Internet aware and uses this facility.
International access to the global information infrastructure (GII)
remains a key challenge for a landlocked country like Uganda, and the
recommended policy would promote a competitive and non-exclusive
basis for such access, in recognition of the fact that competition in con-
necting to GII will lead to lower prices7.
7 A current priority project to which the Government of Uganda is committed is the EASSy project.

UUggaannddaa
30 2007 Telecommunications Sector Performance Review
There has been a mixed reaction to the government initiative, with the
majority welcoming it, but with some reservations from the private sec-
tor based on protecting their investment and fear of market distortion
and operational modalities. There are, however, provisions integrated
into the overall proposal that should, if formally adopted, address such
concerns. While the proposed governance structure places EGI under
the National Information Technology Authority-Uganda, and recognises
that NBI is a national strategic resource that must always be owned by
government, it places emphasis on keeping government out of opera-
tions. It is proposed that the excess capacity of the NBI (ie capacity not
required for e-government) will be operated commercially through a
Board, and will be subject to regulation by UCC. This Board will be fully
responsible for defining all structures under its authority, as well as for
modalities for outsourcing services and operations to the private sector.
It is recommended that the Board, consisting of at most seven members,
will include representation from:
� Government;
� The Private Sector;
� Consumers;
� Civil Society Organisations;
� Selected Professional Associations.
GROSS REVENUE
Despite the constraints arising out of the power shortages and increased
taxes, Increased efficiency in operations resulting from the introduction of
competition in the sector as well as the increased numbers of operators
has led to a continued growth in sector turnover as shown in Figure 6 .
FIGURE 6. TOTAL GROSS REVENUE OF THE TELECOMS INDUSTRY IN UGX
Innovations around sms (short messaging service) content and adop-
tion of new technologies like CDMA have boosted the uptake of services
and increased revenue in the sector,assisted by an increased apprecia-
tion and use of services in the sector. Micro finance schemes specific to
provision of community payphone services such as the MTN Village
Phone (modelled on the Bangladesh Grameen Project) and the Uno

UUggaannddaa
312007 Telecommunications Sector Performance Review
Phone Project have served to increase access to services, especially in
the rural areas.
IMPACT ON GDPThe communications sector has demonstrated the highest growth rate
since the introduction of competition, especially in the mobile industry
as shown in Table 2. The contribution of the sector to overall GDP has
exhibited continued growth over the years. The rate of growth is similar
to that of sector turnover, as shown in Figure 7, and can therefore be
attributed to the increased competition in the sector.
TABLE 2. GDP GROWTH RATES AT FACTOR COST (CONSTANT 1997/98 PRICES)8
2001 2002 2003 2004 2005
GDP growth rate 6.5 4.7 6.5 5.6 6.5
(%)
GDP at 1997/98 9 399 801 9 840 586 10 480 183 11 062 483 11 780 848
market prices
(million UGX)
Percentage sector contribution to GDP
Communications 1.1 1.5 2.1 2.9 3.6
Agriculture 20.8 20.6 20.3 19.1 18.4
Manufacturing 8.7 8.6 8.3 8.7 8.6
Mining and Quarrying 0.6 0.7 0.6 0.7 0.7
Electricity and water 1.3 1.3 1.2 1.3 1.3
FIGURE 7. COMPARISON OF SECTOR TURNOVER AND PERCENTAGE
SECTOR VALUE ADDED TO GDP AT CONSTANT PRICES OF 1997/988
8Source: Uganda Bureau of Statistics
UUggaannddaa
32 2007 Telecommunications Sector Performance Review
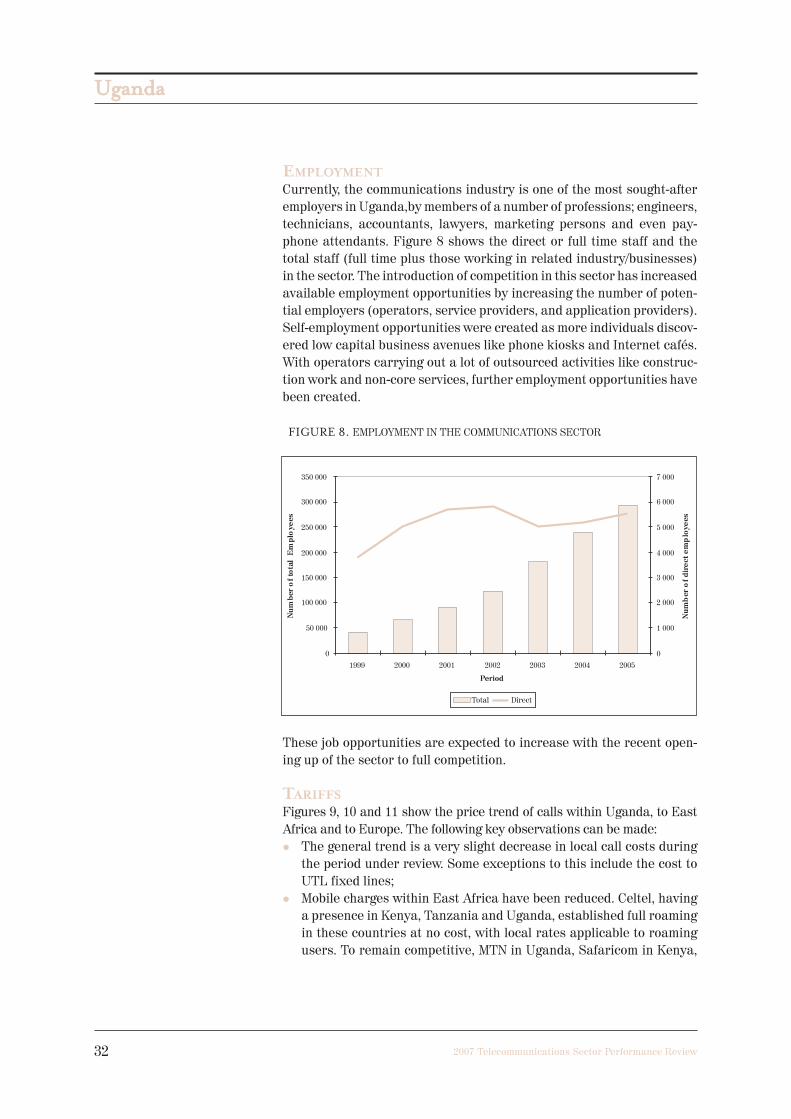
EMPLOYMENT
Currently, the communications industry is one of the most sought-after
employers in Uganda,by members of a number of professions; engineers,
technicians, accountants, lawyers, marketing persons and even pay-
phone attendants. Figure 8 shows the direct or full time staff and the
total staff (full time plus those working in related industry/businesses)
in the sector. The introduction of competition in this sector has increased
available employment opportunities by increasing the number of poten-
tial employers (operators, service providers, and application providers).
Self-employment opportunities were created as more individuals discov-
ered low capital business avenues like phone kiosks and Internet cafés.
With operators carrying out a lot of outsourced activities like construc-
tion work and non-core services, further employment opportunities have
been created.
FIGURE 8. EMPLOYMENT IN THE COMMUNICATIONS SECTOR
These job opportunities are expected to increase with the recent open-
ing up of the sector to full competition.
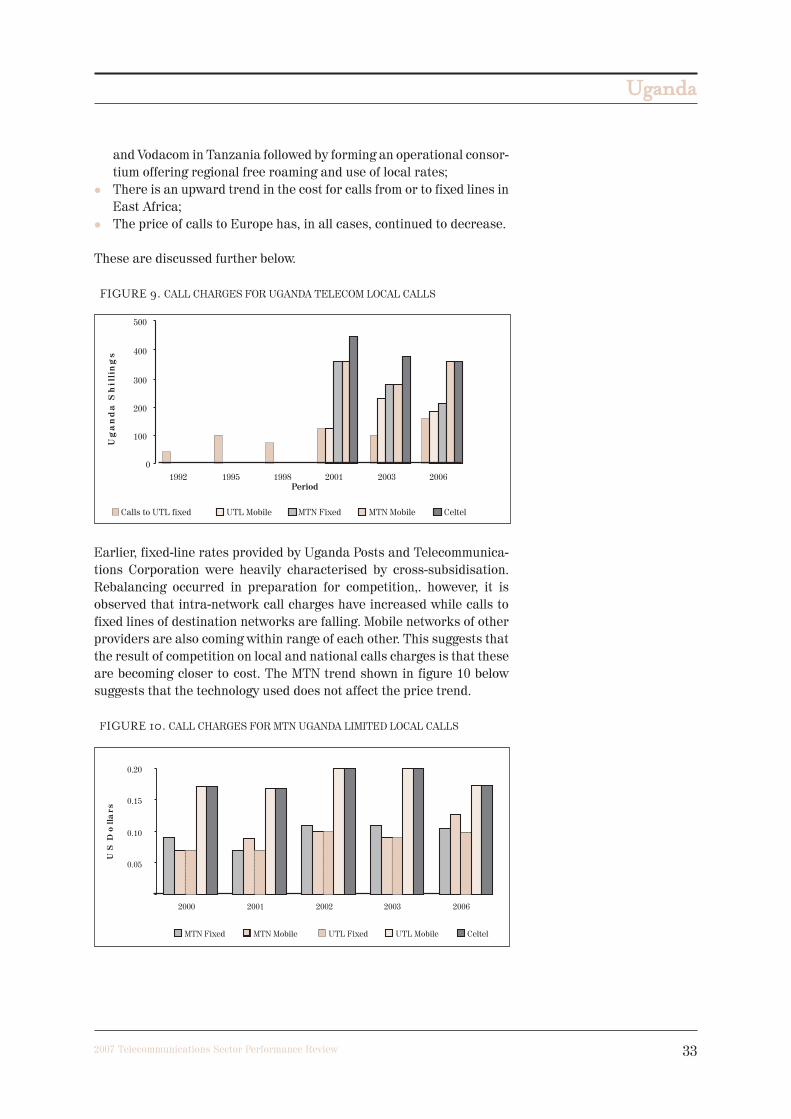
TARIFFS
Figures 9, 10 and 11 show the price trend of calls within Uganda, to East
Africa and to Europe. The following key observations can be made:
� The general trend is a very slight decrease in local call costs during
the period under review. Some exceptions to this include the cost to
UTL fixed lines;
� Mobile charges within East Africa have been reduced. Celtel, having
a presence in Kenya, Tanzania and Uganda, established full roaming
in these countries at no cost, with local rates applicable to roaming
users. To remain competitive, MTN in Uganda, Safaricom in Kenya,
UUggaannddaa
332007 Telecommunications Sector Performance Review
and Vodacom in Tanzania followed by forming an operational consor-
tium offering regional free roaming and use of local rates;
� There is an upward trend in the cost for calls from or to fixed lines in
East Africa;
� The price of calls to Europe has, in all cases, continued to decrease.
These are discussed further below.
FIGURE 9. CALL CHARGES FOR UGANDA TELECOM LOCAL CALLS
Earlier, fixed-line rates provided by Uganda Posts and Telecommunica-
tions Corporation were heavily characterised by cross-subsidisation.
Rebalancing occurred in preparation for competition,. however, it is
observed that intra-network call charges have increased while calls to
fixed lines of destination networks are falling. Mobile networks of other
providers are also coming within range of each other. This suggests that
the result of competition on local and national calls charges is that these
are becoming closer to cost. The MTN trend shown in figure 10 below
suggests that the technology used does not affect the price trend.
FIGURE 10. CALL CHARGES FOR MTN UGANDA LIMITED LOCAL CALLS
UUggaannddaa
34 2007 Telecommunications Sector Performance Review
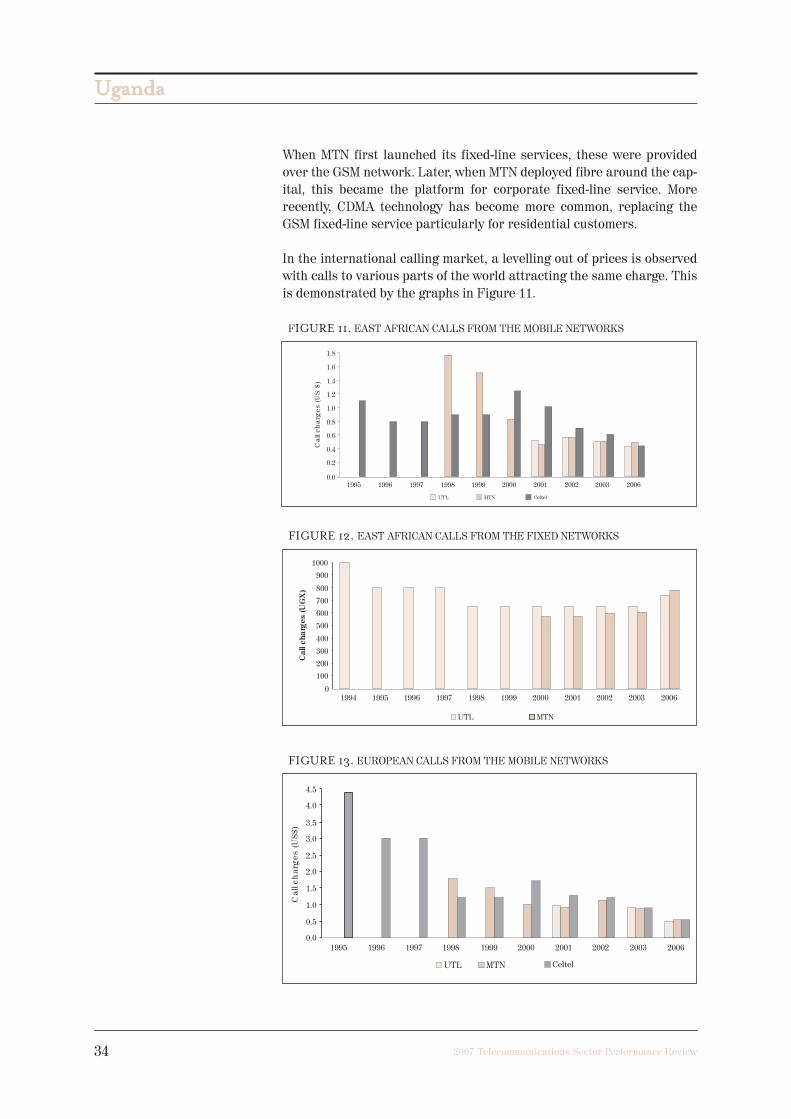
When MTN first launched its fixed-line services, these were provided
over the GSM network. Later, when MTN deployed fibre around the cap-
ital, this became the platform for corporate fixed-line service. More
recently, CDMA technology has become more common, replacing the
GSM fixed-line service particularly for residential customers.
In the international calling market, a levelling out of prices is observed
with calls to various parts of the world attracting the same charge. This
is demonstrated by the graphs in Figure 11.
FIGURE 11. EAST AFRICAN CALLS FROM THE MOBILE NETWORKS
FIGURE 12. EAST AFRICAN CALLS FROM THE FIXED NETWORKS
FIGURE 13. EUROPEAN CALLS FROM THE MOBILE NETWORKS
UUggaannddaa
352007 Telecommunications Sector Performance Review
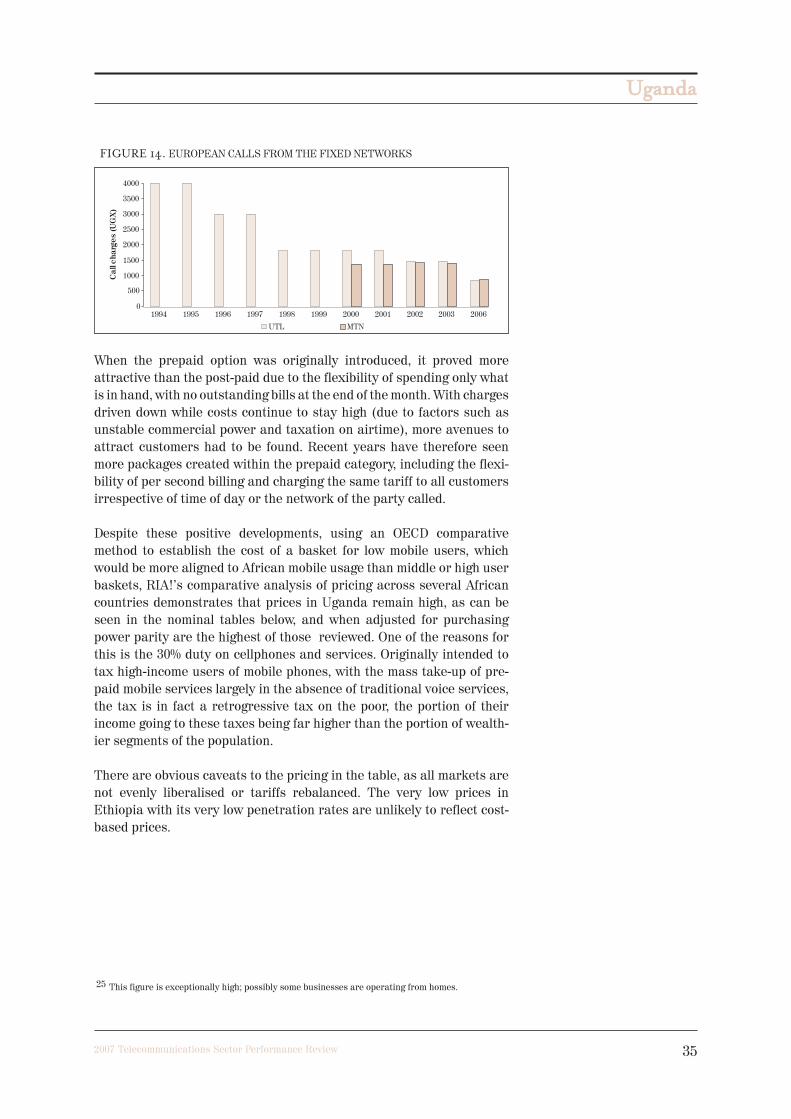
FIGURE 14. EUROPEAN CALLS FROM THE FIXED NETWORKS
When the prepaid option was originally introduced, it proved more
attractive than the post-paid due to the flexibility of spending only what
is in hand, with no outstanding bills at the end of the month. With charges
driven down while costs continue to stay high (due to factors such as
unstable commercial power and taxation on airtime), more avenues to
attract customers had to be found. Recent years have therefore seen
more packages created within the prepaid category, including the flexi-
bility of per second billing and charging the same tariff to all customers
irrespective of time of day or the network of the party called.
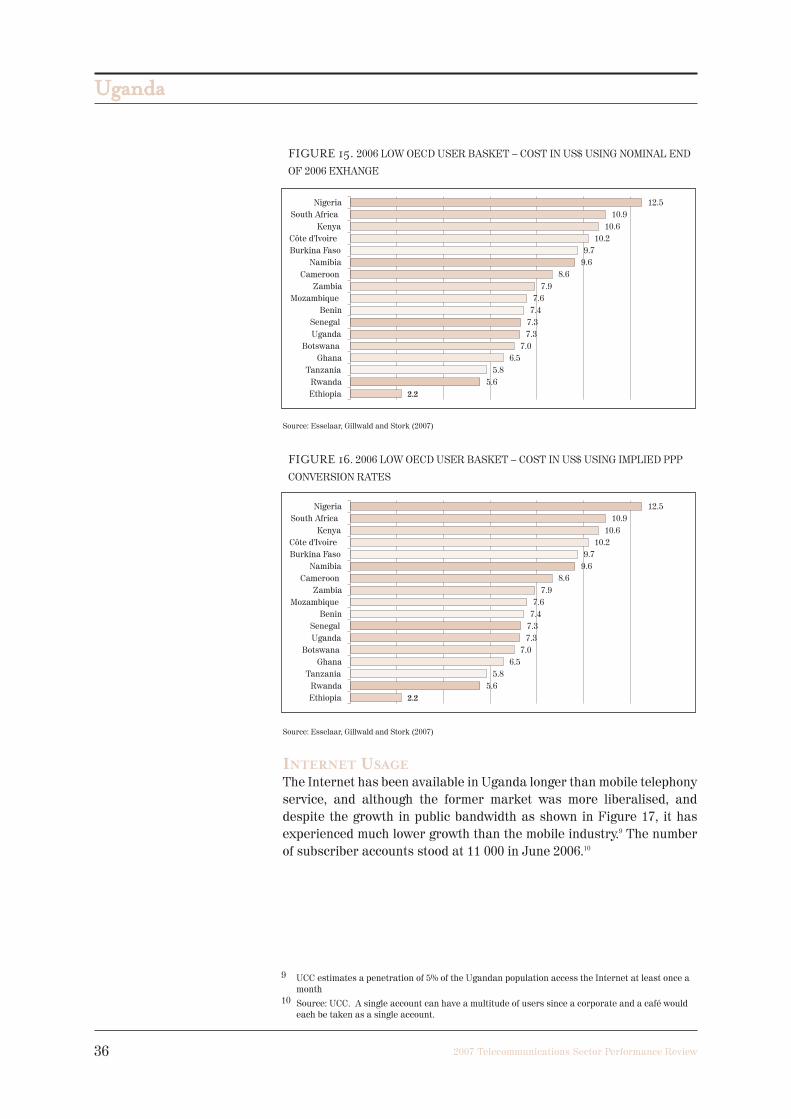
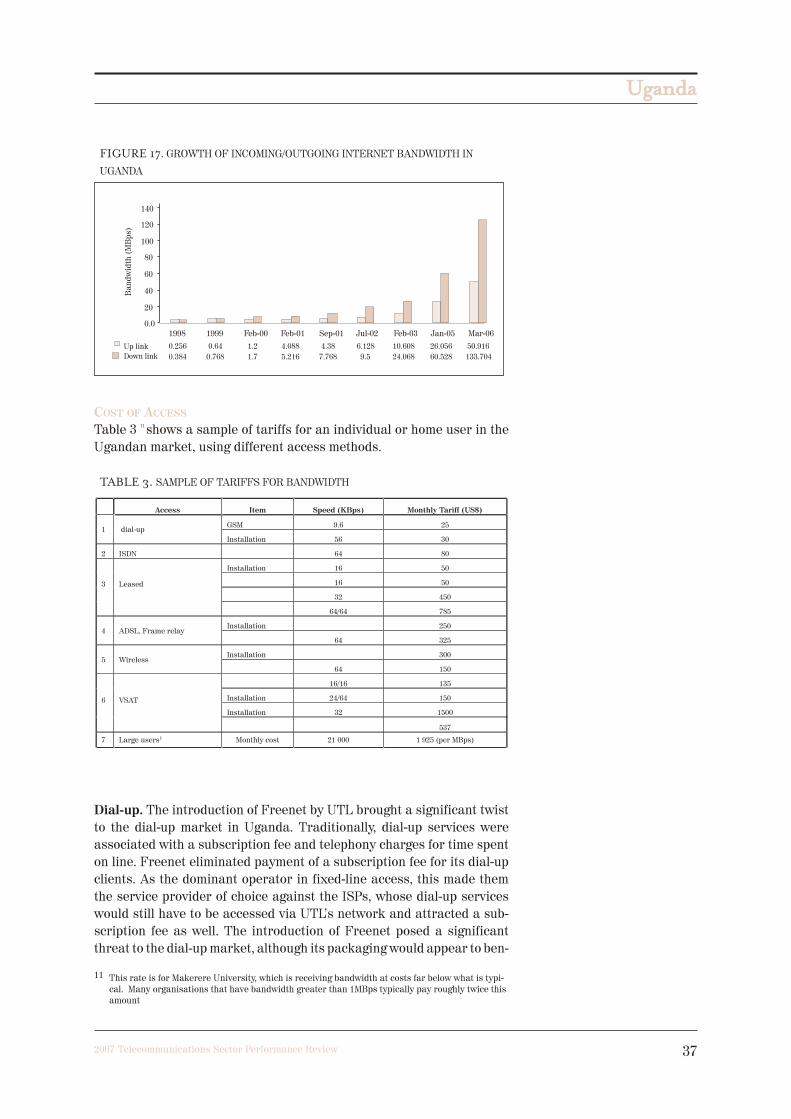
Despite these positive developments, using an OECD comparative
method to establish the cost of a basket for low mobile users, which
would be more aligned to African mobile usage than middle or high user
baskets, RIA!’s comparative analysis of pricing across several African
countries demonstrates that prices in Uganda remain high, as can be
seen in the nominal tables below, and when adjusted for purchasing
power parity are the highest of those reviewed. One of the reasons for
this is the 30% duty on cellphones and services. Originally intended to
tax high-income users of mobile phones, with the mass take-up of pre-
paid mobile services largely in the absence of traditional voice services,
the tax is in fact a retrogressive tax on the poor, the portion of their
income going to these taxes being far higher than the portion of wealth-
ier segments of the population.
There are obvious caveats to the pricing in the table, as all markets are
not evenly liberalised or tariffs rebalanced. The very low prices in
Ethiopia with its very low penetration rates are unlikely to reflect cost-
based prices.
25 This figure is exceptionally high; possibly some businesses are operating from homes.
UUggaannddaa
36 2007 Telecommunications Sector Performance Review
FIGURE 15. 2006 LOW OECD USER BASKET – COST IN US$ USING NOMINAL END
OF 2006 EXHANGE
Source: Esselaar, Gillwald and Stork (2007)
FIGURE 16. 2006 LOW OECD USER BASKET – COST IN US$ USING IMPLIED PPP
CONVERSION RATES
Source: Esselaar, Gillwald and Stork (2007)
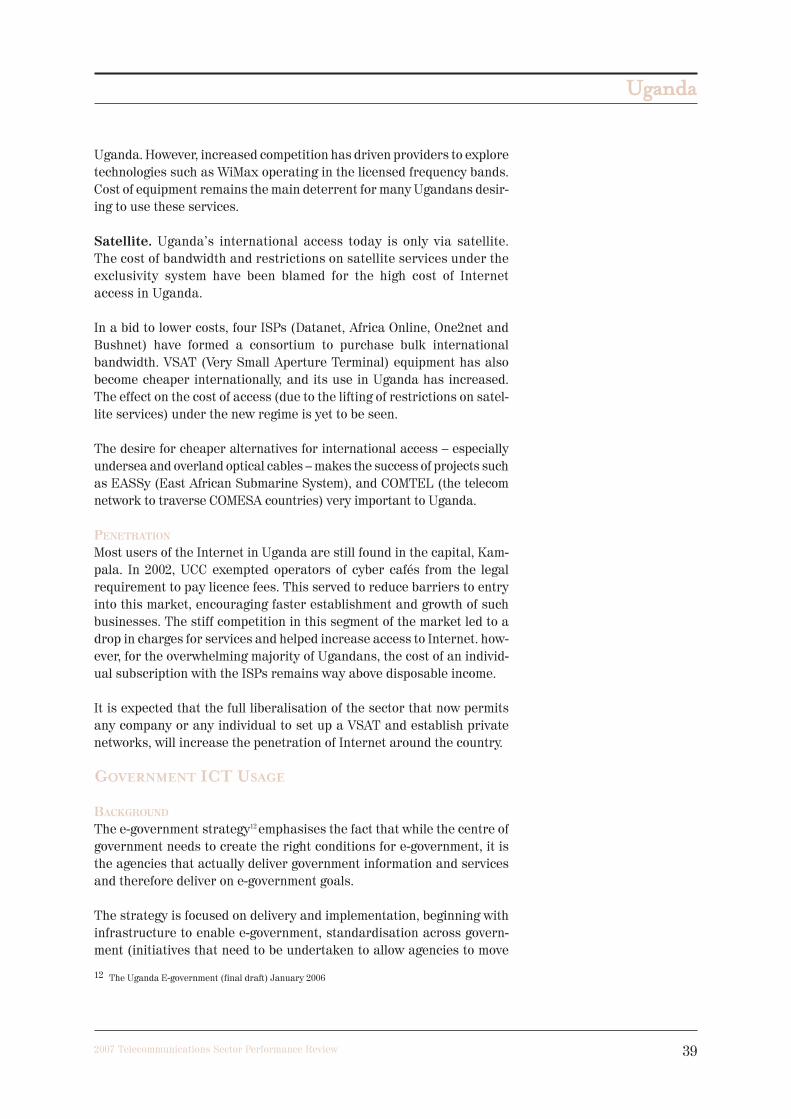
INTERNET USAGE
The Internet has been available in Uganda longer than mobile telephony
service, and although the former market was more liberalised, and
despite the growth in public bandwidth as shown in Figure 17, it has
experienced much lower growth than the mobile industry.9 The number
of subscriber accounts stood at 11 000 in June 2006.10
9 UCC estimates a penetration of 5% of the Ugandan population access the Internet at least once amonth
10 Source: UCC. A single account can have a multitude of users since a corporate and a café wouldeach be taken as a single account.
UUggaannddaa
372007 Telecommunications Sector Performance Review
FIGURE 17. GROWTH OF INCOMING/OUTGOING INTERNET BANDWIDTH IN
UGANDA
COST OF ACCESS
Table 3 11
shows a sample of tariffs for an individual or home user in the
Ugandan market, using different access methods.
TABLE 3. SAMPLE OF TARIFFS FOR BANDWIDTH
Dial-up. The introduction of Freenet by UTL brought a significant twist
to the dial-up market in Uganda. Traditionally, dial-up services were
associated with a subscription fee and telephony charges for time spent
on line. Freenet eliminated payment of a subscription fee for its dial-up
clients. As the dominant operator in fixed-line access, this made them
the service provider of choice against the ISPs, whose dial-up services
would still have to be accessed via UTL’s network and attracted a sub-
scription fee as well. The introduction of Freenet posed a significant
threat to the dial-up market, although its packaging would appear to ben-
11 This rate is for Makerere University, which is receiving bandwidth at costs far below what is typi-cal. Many organisations that have bandwidth greater than 1MBps typically pay roughly twice thisamount

UUggaannddaa
38 2007 Telecommunications Sector Performance Review
efit customers. While UCC directed UTL to offer ISPs the same terms as
it those offered between its Internet and telephony service units, enforce-
ment of this was not followed through. However, limitations in bandwidth
on Freenet have impeded take-up of the service.
Competition in dial-up has also been challenged by the use of CDMA for
fixed telephony service. The mode of deployment by UTL made access to
dial-up services of other ISPs very difficult, meaning that customers of
UTL fixed telephony services using CDMA really have no choice of ISPs.
This should be viewed as an anti-competitive practice. In the case of
MTN, although charges for access to Internet using fixed phones were
reasonable for a number of subscribers, the quality of service (in terms
of available speeds) became degraded or reduced with growth in popu-
larity and increase in number of users.
Dial-up services are also accessed using GSM due to the commonality of
mobile services in Uganda. However, due to the cost of mobile services,
this method of access to the Internet is considerably more expensive
than fixed dial-up access.
Digital Subscriber Line (DSL) services have now been introduced by
UTL for customers with copper fixed telephony services.
Leased line. The result of the exclusivity is that only UTL and MTN pos-
sess nearly nationwide networks. ISPs consequently have to rely on UTL
and MTN to extend services in and outside the capital, Kampala. This
dependency impacts on the quality of service (QoS) provided by the ISPs,
especially as far as disruption of services due to problems on the trans-
mission networks and connection time are concerned. Additionally,
whereas the ISPs have to charge a customer the cost of the leased line in
addition to cost of Internet bandwidth, UTL and MTN bundle these and
only charge for the leased line, giving them an unfair competitive advan-
tage, especially in tenders for services. Operators also reportedly use
information received from ISPs in requesting leased line installations to
woo customers by offering bundled packages that are obviously cheaper
than the offers from the ISPs.
Cellular telephony. Competition in the cellular/mobile telephony market
has driven innovation, resulting in the introduction of GPRS- (General
Packet Radio System) based access to Internet. However, the cost of this
is high, particularly due to the current method of billing based on access
time rather than data throughput.
Wireless. Wireless access using Wifi systems has been popular since
around 1999, arising out of the absence of sufficient fixed telephony last
mile access and ISPs’ own infrastructure. UCC deregulated the 2.4GHz
and 5.8GHz bands in a bid to promote development of the Internet in
UUggaannddaa
392007 Telecommunications Sector Performance Review
Uganda. However, increased competition has driven providers to explore
technologies such as WiMax operating in the licensed frequency bands.
Cost of equipment remains the main deterrent for many Ugandans desir-
ing to use these services.
Satellite. Uganda’s international access today is only via satellite.
The cost of bandwidth and restrictions on satellite services under the
exclusivity system have been blamed for the high cost of Internet
access in Uganda.
In a bid to lower costs, four ISPs (Datanet, Africa Online, One2net and
Bushnet) have formed a consortium to purchase bulk international
bandwidth. VSAT (Very Small Aperture Terminal) equipment has also
become cheaper internationally, and its use in Uganda has increased.
The effect on the cost of access (due to the lifting of restrictions on satel-
lite services) under the new regime is yet to be seen.
The desire for cheaper alternatives for international access – especially
undersea and overland optical cables – makes the success of projects such
as EASSy (East African Submarine System), and COMTEL (the telecom
network to traverse COMESA countries) very important to Uganda.
PENETRATION
Most users of the Internet in Uganda are still found in the capital, Kam-
pala. In 2002, UCC exempted operators of cyber cafés from the legal
requirement to pay licence fees. This served to reduce barriers to entry
into this market, encouraging faster establishment and growth of such
businesses. The stiff competition in this segment of the market led to a
drop in charges for services and helped increase access to Internet. how-
ever, for the overwhelming majority of Ugandans, the cost of an individ-
ual subscription with the ISPs remains way above disposable income.
It is expected that the full liberalisation of the sector that now permits
any company or any individual to set up a VSAT and establish private
networks, will increase the penetration of Internet around the country.
GOVERNMENT ICT USAGE
BACKGROUND
The e-government strategy12 emphasises the fact that while the centre of
government needs to create the right conditions for e-government, it is
the agencies that actually deliver government information and services
and therefore deliver on e-government goals.
The strategy is focused on delivery and implementation, beginning with
infrastructure to enable e-government, standardisation across govern-
ment (initiatives that need to be undertaken to allow agencies to move
12 The Uganda E-government (final draft) January 2006

UUggaannddaa
40 2007 Telecommunications Sector Performance Review
forward and deliver e-government), and coordination between large
numbers of autonomous institutions. A framework called “services deliv-
ery architecture” is central to the strategy.
Resource constraints have created a number of challenges in harness-
ing the potential of ICT. These include inadequate ICT infrastructure and
access, limited well trained support staff (especially for information
resource management), and insufficient budgetary allocations to sustain
ICT services. Non-resource challenges include the negative mindset
towards new ways of working (which is especially true among civil ser-
vants) and lack of enabling policies.
This background on e-government in Uganda (defining the supply-side)
is the context within which government ICT usage was surveyed. It uses
macro-level data on various government agencies (particularly min-
istries) to elicit the ICT usage status within these institutions, and to
establish if and how they relate to service delivery approaches of govern-
ment. Repeated surveys over time will give a trend analysis, and help the
low level evaluation of how government is moving to achieve its e-govern-
ment objectives.
METHODOLOGY
A structured questionnaire was designed based on the indicator guide-
lines as per the RIA! government E-Usage template. The number of
questions was limited for the sake of brevity, while ensuring that all per-
tinent information is captured. Extra information not included in the
proposal template was also included (eg staffing levels, categories of
recurrent costs, funding periods for capital costs) to provide other
related information, providing a more complete picture of the ICT set-
up at each ministry.
The following pertinent issues regarding the data collected are pre-
sented to inform interpretation of results of the questionnaire.
� In terms of scope/coverage, the study mainly focused on the line min-
istries. It excluded the Judiciary and legislature. A total of 18 min-
istries and four statutory bodies were surveyed. The total workforce
in these, excluding classified numbers, is about 7 500. The data col-
lected represented 95% (technical information) and 64% (financial
information) of the required information from the 22 ministries/statu-
tory bodies;
� 18% of ministries did not have full information regarding ICT annual
usage costs, especially maintenance costs and phone bills. This was
especially true for expenditures where there is no service contract
(eg phone bills, one-off repairs). Additionally, no respondents had
actual figures regarding investment costs over the past three years.
The figures submitted were the respondent estimates. While the

UUggaannddaa
412007 Telecommunications Sector Performance Review
questionnaire did not require identification of the funding source,
most indicated donor-funded projects as the major source of IT capi-
tal investments;
� Some ministries did not indicate use of the Integrated Financial Manage-
ment System (IFMS) which is still running as an independent project
under the Ministry of Finance, Planning and Economic Development;
� The number of PCs indicated by the Ministry of Finance, Planning
and Economic Development are inclusive of what are considered the
IFMS project PCs stationed at the various ministries;
� The number of staff is all-inclusive and may potentially skew the ratios
between PCs and bandwidth, as it is inclusive of a large number of sup-
port staff whose direct work does not require use of computers.
FINDINGS
Table 4 gives a summary of usage indicators, which are used to infer the
e-usage patterns.
TABLE 4. GOVERNMENT E-USAGE INDICATORS FOR THE MINISTRIES/ORGANI-
SATIONS SURVEYED
Indicator Average
1 PCs /person 0.52
2 Fixed lines/person 0.1
3 Networked PCs/person 0.45
4 Bandwidth/PC 1.82 KBps
5 ICT usage cost/person US$250
6 ICT investment/person US$850
7 Number of Government portals None
PCs/person. This ranged from 0.08 (Ministry of Works, Housing and
Communication) to 1.4713 (Uganda Bureau of Statistics). The average
figure of 0.52 gives one computer per two employees. Taking into con-
sideration the fact that a number of staff (particularly group employees)
do not require computers for their day-to-day work, the ratio may be
closer to one per one, implying a high average access rate to computing
facilities. On the other hand, the usage of laptops by senior people needs
to be factored in; these tend to have both a PC and a laptop per person.
Secondly, many of the upper category offices have computers that are
normally unused.
Fixed lines/person. The average of 0.1 is seemingly very impressive,
especially with implementation of PABXs within most ministry build-
ings. This figure is, however, lower for typical staff in a ministry as it is
common to find more than three lines dedicated to the sole use of one
top official, leaving the rest of the staff sharing fewer lines. With the
ubiquity of mobile phones for a typical worker in Uganda, which usually
13 The number of computers is inclusive of laptops for contract staff, who are not included in thepermanent staff numbers submitted
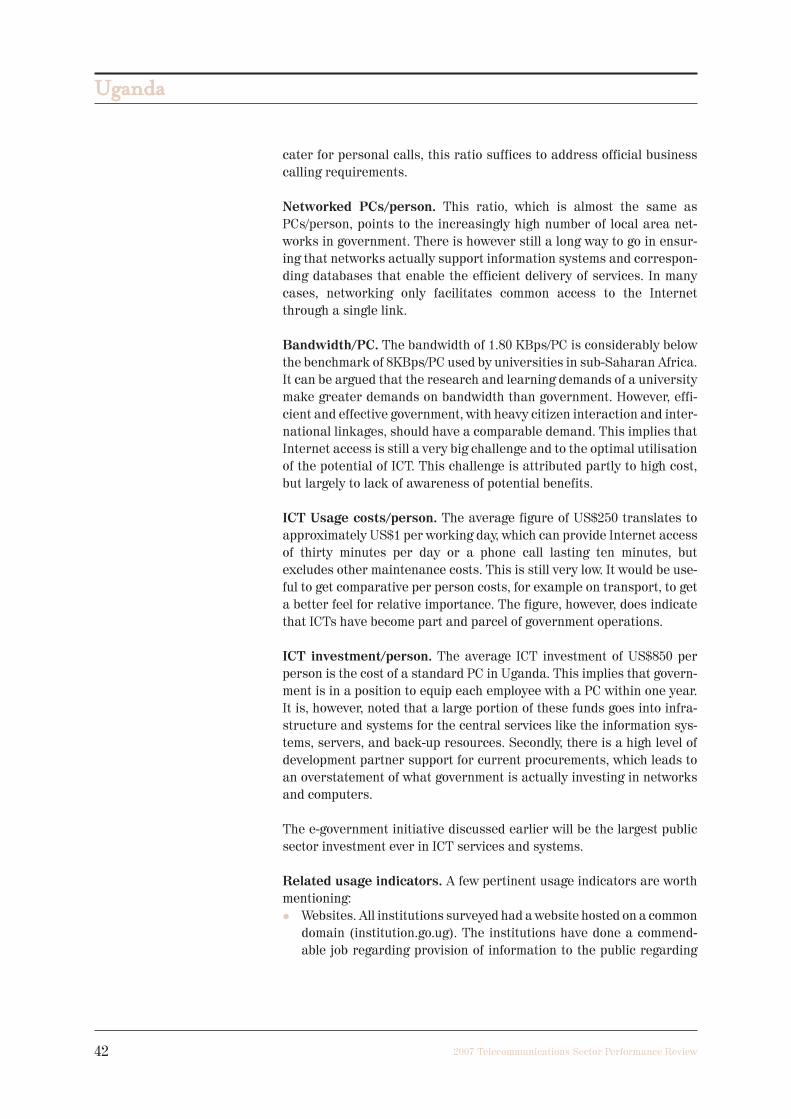
UUggaannddaa
42 2007 Telecommunications Sector Performance Review
cater for personal calls, this ratio suffices to address official business
calling requirements.
Networked PCs/person. This ratio, which is almost the same as
PCs/person, points to the increasingly high number of local area net-
works in government. There is however still a long way to go in ensur-
ing that networks actually support information systems and correspon-
ding databases that enable the efficient delivery of services. In many
cases, networking only facilitates common access to the Internet
through a single link.
Bandwidth/PC. The bandwidth of 1.80 KBps/PC is considerably below
the benchmark of 8KBps/PC used by universities in sub-Saharan Africa.
It can be argued that the research and learning demands of a university
make greater demands on bandwidth than government. However, effi-
cient and effective government, with heavy citizen interaction and inter-
national linkages, should have a comparable demand. This implies that
Internet access is still a very big challenge and to the optimal utilisation
of the potential of ICT. This challenge is attributed partly to high cost,
but largely to lack of awareness of potential benefits.
ICT Usage costs/person. The average figure of US$250 translates to
approximately US$1 per working day, which can provide Internet access
of thirty minutes per day or a phone call lasting ten minutes, but
excludes other maintenance costs. This is still very low. It would be use-
ful to get comparative per person costs, for example on transport, to get
a better feel for relative importance. The figure, however, does indicate
that ICTs have become part and parcel of government operations.
ICT investment/person. The average ICT investment of US$850 per
person is the cost of a standard PC in Uganda. This implies that govern-
ment is in a position to equip each employee with a PC within one year.
It is, however, noted that a large portion of these funds goes into infra-
structure and systems for the central services like the information sys-
tems, servers, and back-up resources. Secondly, there is a high level of
development partner support for current procurements, which leads to
an overstatement of what government is actually investing in networks
and computers.
The e-government initiative discussed earlier will be the largest public
sector investment ever in ICT services and systems.
Related usage indicators. A few pertinent usage indicators are worth
mentioning:
� Websites. All institutions surveyed had a website hosted on a common
domain (institution.go.ug). The institutions have done a commend-
able job regarding provision of information to the public regarding
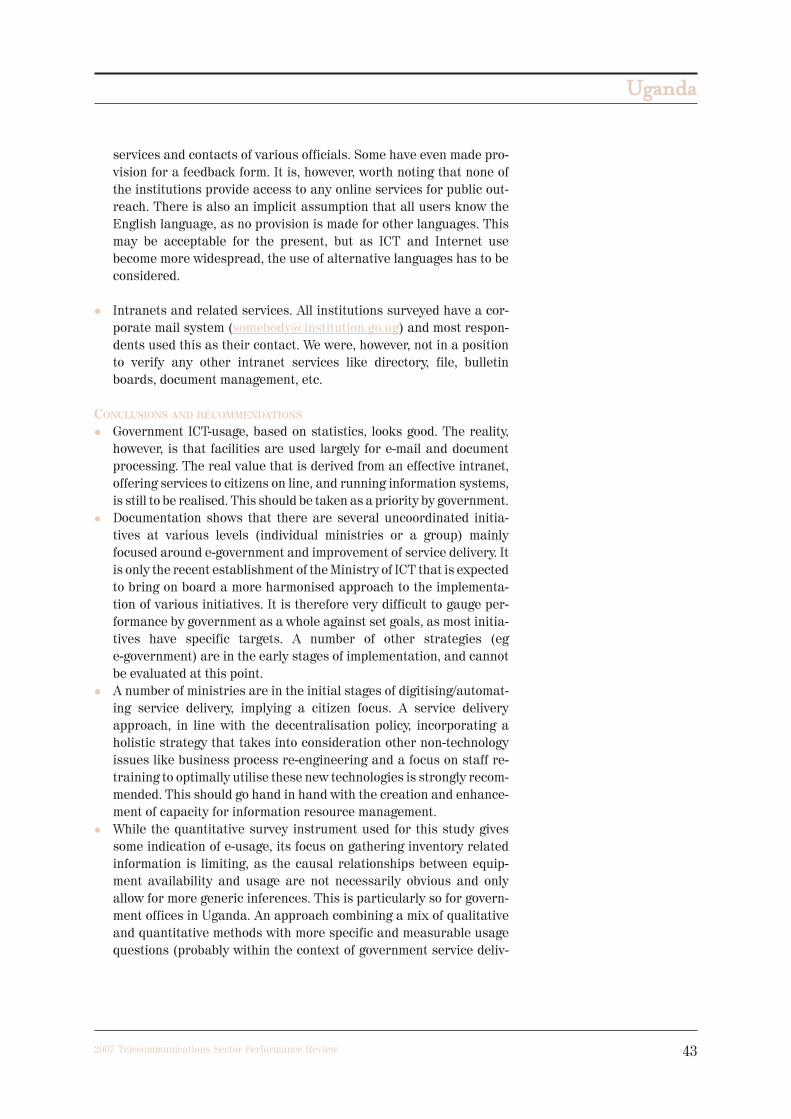
UUggaannddaa
432007 Telecommunications Sector Performance Review
services and contacts of various officials. Some have even made pro-
vision for a feedback form. It is, however, worth noting that none of
the institutions provide access to any online services for public out-
reach. There is also an implicit assumption that all users know the
English language, as no provision is made for other languages. This
may be acceptable for the present, but as ICT and Internet use
become more widespread, the use of alternative languages has to be
considered.
� Intranets and related services. All institutions surveyed have a cor-
porate mail system ([email protected]) and most respon-
dents used this as their contact. We were, however, not in a position
to verify any other intranet services like directory, file, bulletin
boards, document management, etc.
CONCLUSIONS AND RECOMMENDATIONS
� Government ICT-usage, based on statistics, looks good. The reality,
however, is that facilities are used largely for e-mail and document
processing. The real value that is derived from an effective intranet,
offering services to citizens on line, and running information systems,
is still to be realised. This should be taken as a priority by government.
� Documentation shows that there are several uncoordinated initia-
tives at various levels (individual ministries or a group) mainly
focused around e-government and improvement of service delivery. It
is only the recent establishment of the Ministry of ICT that is expected
to bring on board a more harmonised approach to the implementa-
tion of various initiatives. It is therefore very difficult to gauge per-
formance by government as a whole against set goals, as most initia-
tives have specific targets. A number of other strategies (eg
e-government) are in the early stages of implementation, and cannot
be evaluated at this point.
� A number of ministries are in the initial stages of digitising/automat-
ing service delivery, implying a citizen focus. A service delivery
approach, in line with the decentralisation policy, incorporating a
holistic strategy that takes into consideration other non-technology
issues like business process re-engineering and a focus on staff re-
training to optimally utilise these new technologies is strongly recom-
mended. This should go hand in hand with the creation and enhance-
ment of capacity for information resource management.
� While the quantitative survey instrument used for this study gives
some indication of e-usage, its focus on gathering inventory related
information is limiting, as the causal relationships between equip-
ment availability and usage are not necessarily obvious and only
allow for more generic inferences. This is particularly so for govern-
ment offices in Uganda. An approach combining a mix of qualitative
and quantitative methods with more specific and measurable usage
questions (probably within the context of government service deliv-
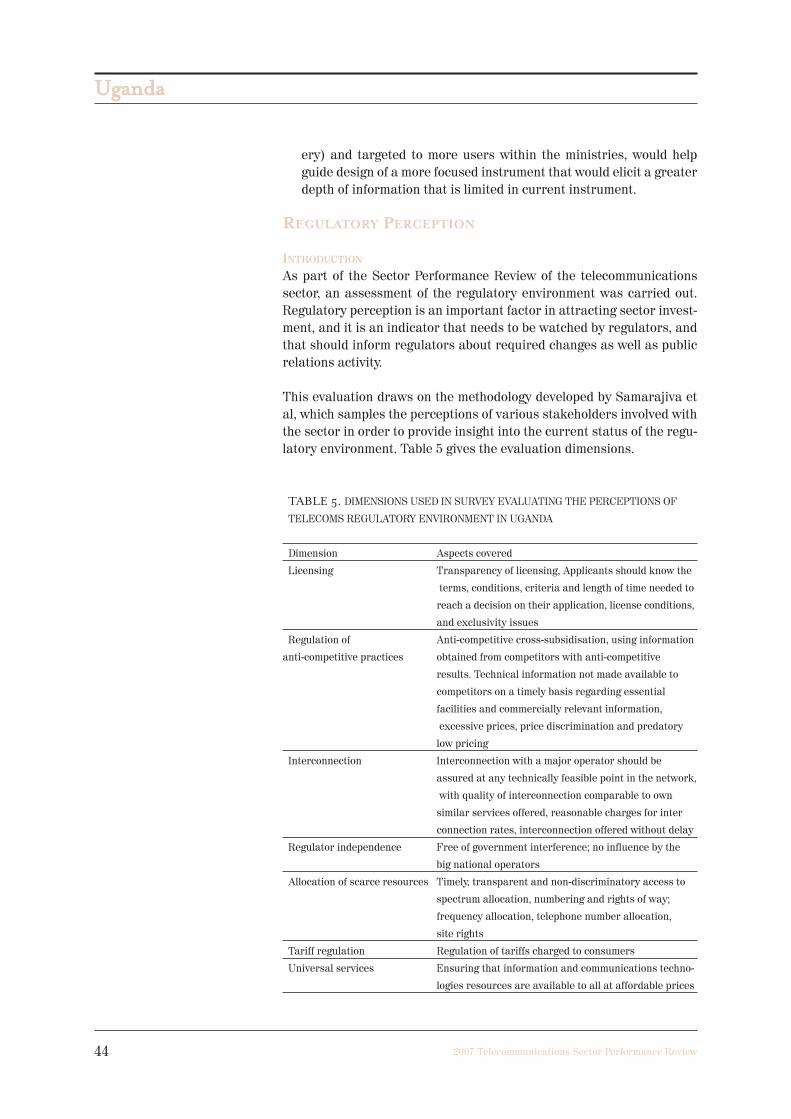
UUggaannddaa
44 2007 Telecommunications Sector Performance Review
ery) and targeted to more users within the ministries, would help
guide design of a more focused instrument that would elicit a greater
depth of information that is limited in current instrument.
REGULATORY PERCEPTION
INTRODUCTION
As part of the Sector Performance Review of the telecommunications
sector, an assessment of the regulatory environment was carried out.
Regulatory perception is an important factor in attracting sector invest-
ment, and it is an indicator that needs to be watched by regulators, and
that should inform regulators about required changes as well as public
relations activity.
This evaluation draws on the methodology developed by Samarajiva et
al, which samples the perceptions of various stakeholders involved with
the sector in order to provide insight into the current status of the regu-
latory environment. Table 5 gives the evaluation dimensions.
TABLE 5. DIMENSIONS USED IN SURVEY EVALUATING THE PERCEPTIONS OF
TELECOMS REGULATORY ENVIRONMENT IN UGANDA
Dimension Aspects covered
Licensing Transparency of licensing, Applicants should know the
terms, conditions, criteria and length of time needed to
reach a decision on their application, license conditions,
and exclusivity issues
Regulation of Anti-competitive cross-subsidisation, using information
anti-competitive practices obtained from competitors with anti-competitive
results. Technical information not made available to
competitors on a timely basis regarding essential
facilities and commercially relevant information,
excessive prices, price discrimination and predatory
low pricing
Interconnection Interconnection with a major operator should be
assured at any technically feasible point in the network,
with quality of interconnection comparable to own
similar services offered, reasonable charges for inter
connection rates, interconnection offered without delay
Regulator independence Free of government interference; no influence by the
big national operators
Allocation of scarce resources Timely, transparent and non-discriminatory access to
spectrum allocation, numbering and rights of way;
frequency allocation, telephone number allocation,
site rights
Tariff regulation Regulation of tariffs charged to consumers
Universal services Ensuring that information and communications techno-
logies resources are available to all at affordable prices

UUggaannddaa
452007 Telecommunications Sector Performance Review
METHODOLOGY
Sixty questionnaires were sent to a number of participant categories,
20 of which were returned as highlighted in Table 6. Follow-up inter-
views were then conducted with a few respondents based on their will-
ingness to participate and the knowledge they exhibited about the dif-
ferent dimensions.
The perception for each dimension was judged based on a Likert scale:
Poor (1 point)
Unsatisfactory (2 points)
Neutral (3 points)
Satisfactory (4 points)
Excellent (5 points)
There was room for respondents to elaborate on perception for each of
the dimensions of the survey.
TABLE 6. PARTICIPANT CATEGORIES
Participant Questionnaires Questionnaires Interviews
categories sent returned
Operators 10 3 1
Financial sector 2 0 0
Government agencies 10 2 1
Media 5 1 0
Private sector 12 3 1
Academics 12 9 1
NGOs 9 2 1
Totals 60 20 5
FINDINGS
Licensing Process. Most respondents perceive the licensing process to
be satisfactory. UCC provides detailed information about how to apply
for various licences, clearly spelling out the necessary terms and condi-
tions. Many of those who gave a neutral response (25%) admitted that
they did not know much about licensing procedures, perhaps an indica-
tion that the regulator needs to do more work to enlighten the stakehold-
ers to better understand the licensing procedures and their motivation.
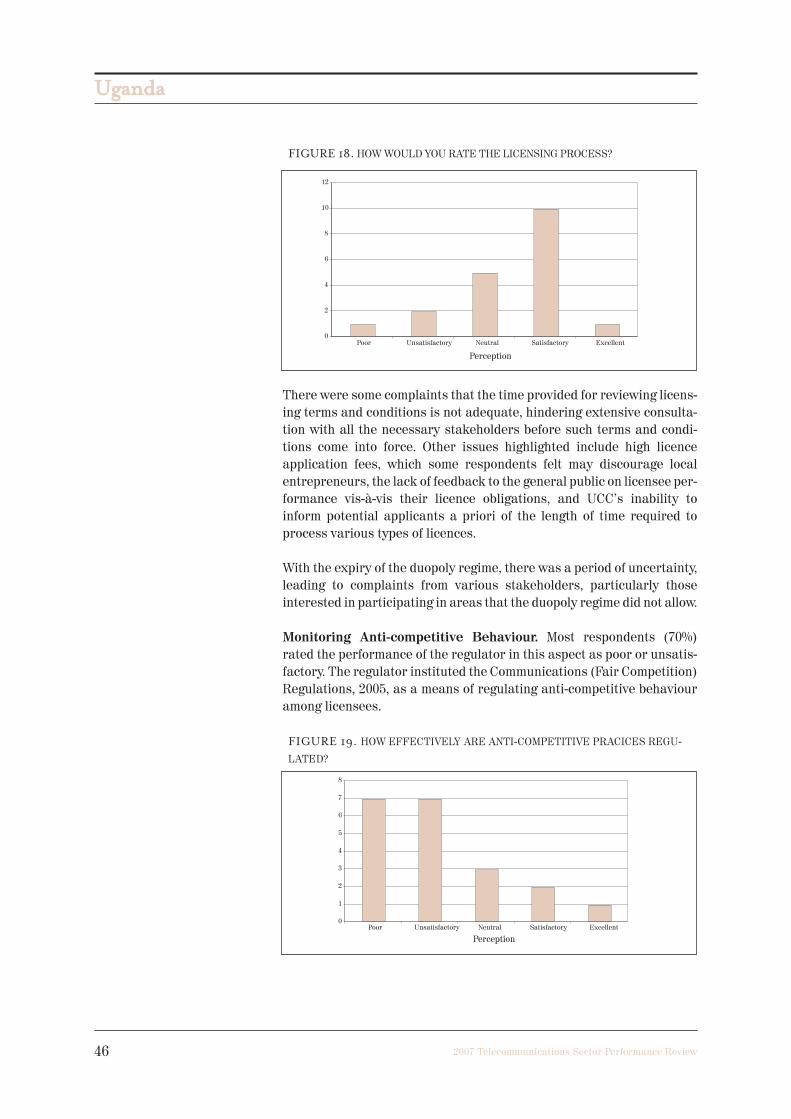
UUggaannddaa
46 2007 Telecommunications Sector Performance Review
FIGURE 18. HOW WOULD YOU RATE THE LICENSING PROCESS?
There were some complaints that the time provided for reviewing licens-
ing terms and conditions is not adequate, hindering extensive consulta-
tion with all the necessary stakeholders before such terms and condi-
tions come into force. Other issues highlighted include high licence
application fees, which some respondents felt may discourage local
entrepreneurs, the lack of feedback to the general public on licensee per-
formance vis-à-vis their licence obligations, and UCC’s inability to
inform potential applicants a priori of the length of time required to
process various types of licences.
With the expiry of the duopoly regime, there was a period of uncertainty,
leading to complaints from various stakeholders, particularly those
interested in participating in areas that the duopoly regime did not allow.
Monitoring Anti-competitive Behaviour. Most respondents (70%)
rated the performance of the regulator in this aspect as poor or unsatis-
factory. The regulator instituted the Communications (Fair Competition)
Regulations, 2005, as a means of regulating anti-competitive behaviour
among licensees.
FIGURE 19. HOW EFFECTIVELY ARE ANTI-COMPETITIVE PRACICES REGU-
LATED?
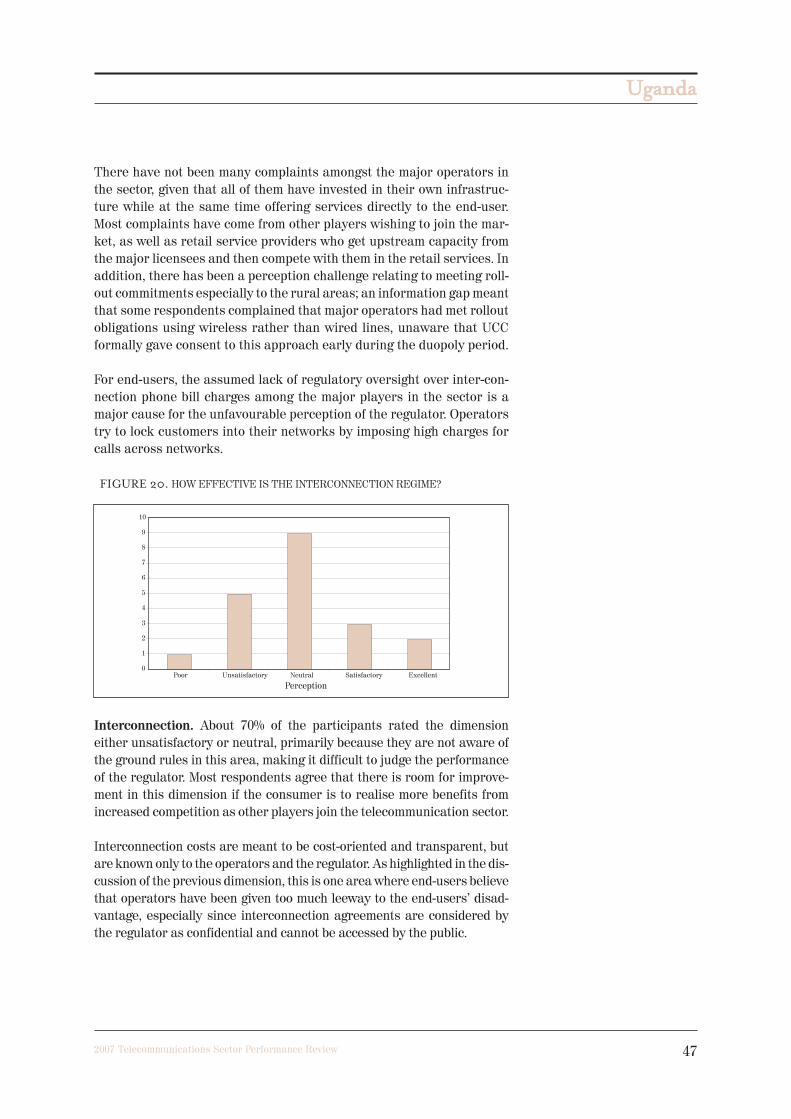
UUggaannddaa
472007 Telecommunications Sector Performance Review
There have not been many complaints amongst the major operators in
the sector, given that all of them have invested in their own infrastruc-
ture while at the same time offering services directly to the end-user.
Most complaints have come from other players wishing to join the mar-
ket, as well as retail service providers who get upstream capacity from
the major licensees and then compete with them in the retail services. In
addition, there has been a perception challenge relating to meeting roll-
out commitments especially to the rural areas; an information gap meant
that some respondents complained that major operators had met rollout
obligations using wireless rather than wired lines, unaware that UCC
formally gave consent to this approach early during the duopoly period.
For end-users, the assumed lack of regulatory oversight over inter-con-
nection phone bill charges among the major players in the sector is a
major cause for the unfavourable perception of the regulator. Operators
try to lock customers into their networks by imposing high charges for
calls across networks.
FIGURE 20. HOW EFFECTIVE IS THE INTERCONNECTION REGIME?
Interconnection. About 70% of the participants rated the dimension
either unsatisfactory or neutral, primarily because they are not aware of
the ground rules in this area, making it difficult to judge the performance
of the regulator. Most respondents agree that there is room for improve-
ment in this dimension if the consumer is to realise more benefits from
increased competition as other players join the telecommunication sector.
Interconnection costs are meant to be cost-oriented and transparent, but
are known only to the operators and the regulator. As highlighted in the dis-
cussion of the previous dimension, this is one area where end-users believe
that operators have been given too much leeway to the end-users’ disad-
vantage, especially since interconnection agreements are considered by
the regulator as confidential and cannot be accessed by the public.

UUggaannddaa
48 2007 Telecommunications Sector Performance Review
Regulatory Independence. The dominant perception is neutral. There
is agreement that the regulator’s independence exists legally and is gen-
erally practised. Having assets that generate income, providing financial
independence from Government, is seen as positive. Some respondents
were however unhappy with the regulator’s inability to guide govern-
ment policy. A few cited the example of increasing taxes on prepaid air-
time, which are ultimately borne by the consumer. The regulator is on
record as having advised government against imposing and later
increasing these taxes, but theirs is only an advisory role as far as gov-
ernment policy is concerned. This expectation indicates a lack of public
knowledge about roleplayers and their functions.
FIGURE 21. HOW WOULD YOU RATE THE INDEPENDENCE OF UCC?
Where the regulator is perceived as independent of government, there is
a general feeling that the incumbent operators have more influence on
government, especially in terms of policy formulation. This feeling is
driven by the fact that telecom operators are some of the biggest taxpay-
ers, making it easier for them to lobby government to take policy deci-
sions in their favour. Many respondents cited the long delay by govern-
ment and the regulator to liberalise the sector after the expiry of the
duopoly regime in July 2005 as an example. There is also a perceived
“cosy relationship” between the regulator and the national operators.
For example, government can still exert influence and affect the effec-
tiveness of the regulator by delaying required legislation. A respondent
also mentioned the unsuccessful efforts to block certain Internet web-
sites that were deemed to be detrimental to the government in power
during the political campaigns, a saga during which the regulator is
claimed to have been conspicuously silent.
Allocation of Scarce Resources. This is one dimension where the reg-
ulator is perceived to be doing a very good job. Many frequencies have
been allocated and issues of frequency dispute seem to be quickly
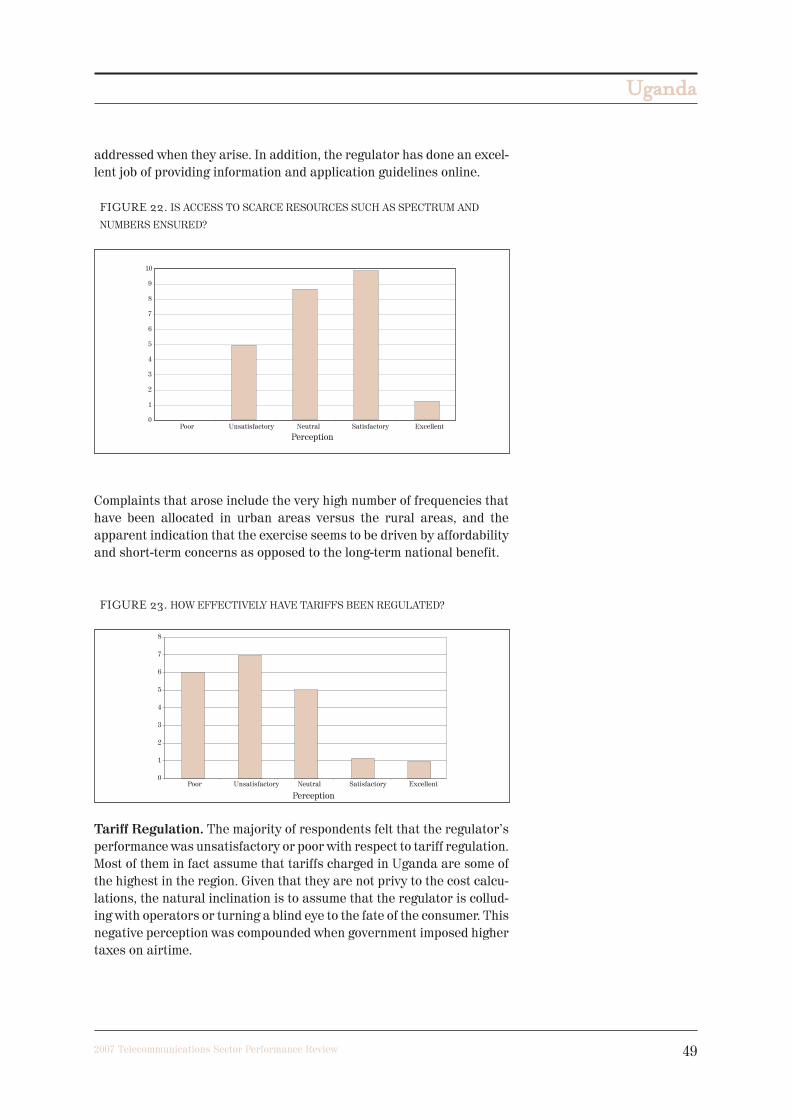
UUggaannddaa
492007 Telecommunications Sector Performance Review
addressed when they arise. In addition, the regulator has done an excel-
lent job of providing information and application guidelines online.
FIGURE 22. IS ACCESS TO SCARCE RESOURCES SUCH AS SPECTRUM AND
NUMBERS ENSURED?
Complaints that arose include the very high number of frequencies that
have been allocated in urban areas versus the rural areas, and the
apparent indication that the exercise seems to be driven by affordability
and short-term concerns as opposed to the long-term national benefit.
FIGURE 23. HOW EFFECTIVELY HAVE TARIFFS BEEN REGULATED?
Tariff Regulation. The majority of respondents felt that the regulator’s
performance was unsatisfactory or poor with respect to tariff regulation.
Most of them in fact assume that tariffs charged in Uganda are some of
the highest in the region. Given that they are not privy to the cost calcu-
lations, the natural inclination is to assume that the regulator is collud-
ing with operators or turning a blind eye to the fate of the consumer. This
negative perception was compounded when government imposed higher
taxes on airtime.
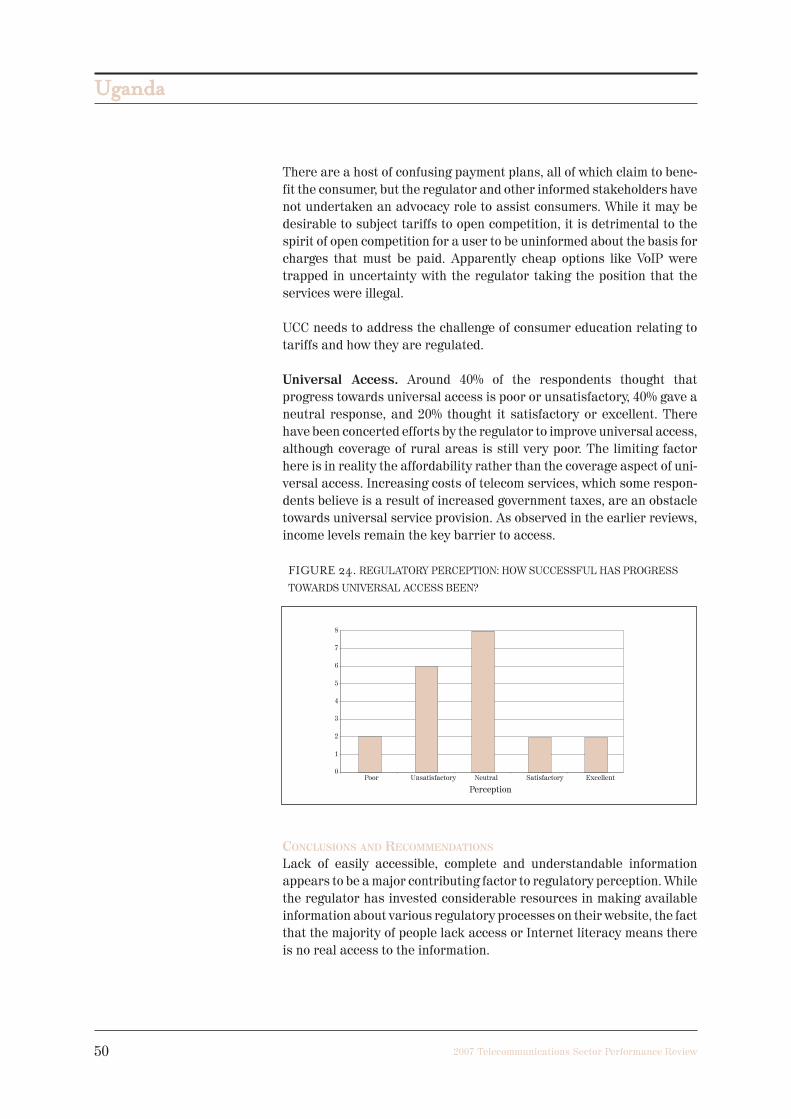
UUggaannddaa
50 2007 Telecommunications Sector Performance Review
There are a host of confusing payment plans, all of which claim to bene-
fit the consumer, but the regulator and other informed stakeholders have
not undertaken an advocacy role to assist consumers. While it may be
desirable to subject tariffs to open competition, it is detrimental to the
spirit of open competition for a user to be uninformed about the basis for
charges that must be paid. Apparently cheap options like VoIP were
trapped in uncertainty with the regulator taking the position that the
services were illegal.
UCC needs to address the challenge of consumer education relating to
tariffs and how they are regulated.
Universal Access. Around 40% of the respondents thought that
progress towards universal access is poor or unsatisfactory, 40% gave a
neutral response, and 20% thought it satisfactory or excellent. There
have been concerted efforts by the regulator to improve universal access,
although coverage of rural areas is still very poor. The limiting factor
here is in reality the affordability rather than the coverage aspect of uni-
versal access. Increasing costs of telecom services, which some respon-
dents believe is a result of increased government taxes, are an obstacle
towards universal service provision. As observed in the earlier reviews,
income levels remain the key barrier to access.
FIGURE 24. REGULATORY PERCEPTION: HOW SUCCESSFUL HAS PROGRESS
TOWARDS UNIVERSAL ACCESS BEEN?
CONCLUSIONS AND RECOMMENDATIONS
Lack of easily accessible, complete and understandable information
appears to be a major contributing factor to regulatory perception. While
the regulator has invested considerable resources in making available
information about various regulatory processes on their website, the fact
that the majority of people lack access or Internet literacy means there
is no real access to the information.
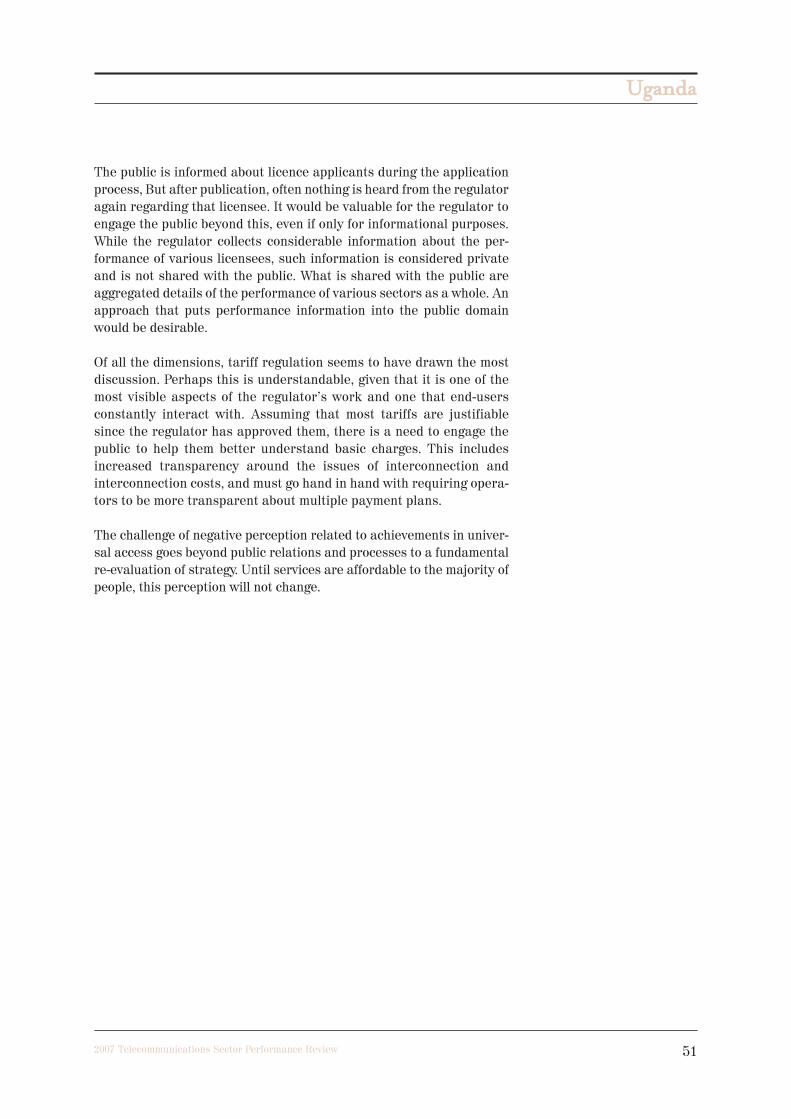
UUggaannddaa
512007 Telecommunications Sector Performance Review
The public is informed about licence applicants during the application
process, But after publication, often nothing is heard from the regulator
again regarding that licensee. It would be valuable for the regulator to
engage the public beyond this, even if only for informational purposes.
While the regulator collects considerable information about the per-
formance of various licensees, such information is considered private
and is not shared with the public. What is shared with the public are
aggregated details of the performance of various sectors as a whole. An
approach that puts performance information into the public domain
would be desirable.
Of all the dimensions, tariff regulation seems to have drawn the most
discussion. Perhaps this is understandable, given that it is one of the
most visible aspects of the regulator’s work and one that end-users
constantly interact with. Assuming that most tariffs are justifiable
since the regulator has approved them, there is a need to engage the
public to help them better understand basic charges. This includes
increased transparency around the issues of interconnection and
interconnection costs, and must go hand in hand with requiring opera-
tors to be more transparent about multiple payment plans.
The challenge of negative perception related to achievements in univer-
sal access goes beyond public relations and processes to a fundamental
re-evaluation of strategy. Until services are affordable to the majority of
people, this perception will not change.
UUggaannddaa
52 2007 Telecommunications Sector Performance Review
CHALLENGES AND CONCLUSION
This review has underlined the continuing dynamism of the ICT sector
in Uganda, responding, at policy and regulatory level, to observed policy
and implementation failures.
Key challenges as identified in the earlier reviews cited included the fol-
lowing:
� Unacceptably low access to basic telephony despite a perceived
exemplary regulatory environment;
� Extremely low level of access to the Internet;
� Cost of access (telephony and data) far beyond the affordability level
of the majority of the population;
� Marginalisation of ICT, compounded by multiple and sometimes con-
tradicting political and policy level challenges due to the splitting of
its key elements among several ministries;
� Marginalisation of Information Technology;
� Danger of complacency in the regulatory agency.
Government has, at policy level, responded to the specific challenges dis-
cussed in this review, by:
� Bringing all elements of ICT together under the Ministry of Infor-
mation and Communication Technology. This has also elevated the
national profile of ICT. A remaining challenge is the continuing
location of the technical side of broadcasting under the propa-
ganda arm of government, the Ministry of Information. This will be
a continuing source of disharmony and conflict until it is
addressed;
� Accepting the critical importance of public funding in rolling out
nationwide infrastructure. The planned national fibre backbone, if
successfully implemented, will not only boost access, it should also
increase affordability since a concessionary loan will be used for
implementation. The backbone will also greatly increase access to,
and affordability of the Internet. The risk here will be the tempta-
tion for government to control the operations of the backbone.
Operations of the backbone must be left to the private sector, with
independent oversight to ensure a balance between profit motive
and social objectives;
� Formally moving, under the cited concessionary loan, to implement e-
government. This will bring IT to the fore and will be a major stimu-
lus for growth and other opportunities around the sub-sector. The
greatest challenge here is transforming people and changing meth-
ods of work;
UUggaannddaa
532007 Telecommunications Sector Performance Review
� Moving to increase the profile and content related to ICT in major
national documents, including Vision 2035 (the planned successor to
Vision 2025) and the Poverty Eradication Action Programme (PEAP).
This is, however, not directly related to this review.
Other challenges to the success of the new policy initiatives are related
to the following:
� Regulation: Uganda Communications Commission has been
required to rapidly transform the sector from a market structure
dominated by the duopoly to a fully liberalised market. UCC must
develop a new approach to regulation, and should be not be
tempted to apply old solutions to new problems. A total rethinking
is called for. A poor licensing structure, poor regulations, and new
entry barriers can negate the policy objectives of government.
Financial entry barriers will not only keep players out, but will also
lead to higher usage charges, nullifying the benefits of full liberal-
isation. As discussed under the section on the regulatory environ-
ment, the regulator should address issues around increased public
education and awareness, increased transparency around tariffs
and tariff regulation and all related aspects,; and transparency
about the performance of specific operators (rather than present-
ing macro pictures);
� Laws: As noted in the discussion, many laws that are required to
enable a fully liberalised data-centric sector (competition law, cyber
laws, laws related to online financial transactions, etc) are not yet in
place. Inevitably, legal issues will become a major factor in a fully lib-
eralised technology-neutral environment;
� Institutions: Serious consideration needs to be given to the creation
of a converged regulator for the ICT sector, rather than the current
fragmented situation;
� The National Fibre Backbone is a strategic resource that should spur
national development. However, if institutions created to manage it
handle it badly, it will negatively distort instead of enhance competi-
tion, and it might bring to life the spectre of direct government
involvement in operations, eliminating private sector innovativeness
and efficiencies;
� Government re-engineering: The service delivery approach that is
core to the e-government initiative will only be achieved if it goes
hand in hand with a holistic strategy that takes into consideration
non-technology issues like business process re-engineering, govern-
ment restructuring to match new processes, and a focus on staff
re-training to optimally work in an ICT-enabled environment. Critical
skills in information resource management will need to be developed
among technical and non-technical operatives.
UUggaannddaa
54 2007 Telecommunications Sector Performance Review
It remains to be seen, over the next two years, how the new policy
directions will impact on access, affordability and, at the higher level,
development. It should nevertheless be noted in conclusion that, if the
challenges are documented from the beginning and tracked to ensure
they do not become major risks, Uganda appears to be on the right
path to ICT-enabled human development.
REFERENCES:Esselaar,S. Gillwald, A. and Stork, C. (2007) Telecommunications Sector Performance in 16 African
countries: a supply side analysis of policy outcomes, RIA!, LINK Centre, University of the Witwa-
tersrand, http://www.researchICTafrica.net

UUggaannddaa
552007 Telecommunications Sector Performance Review

Towards an
African e-Index 2007Telecommunications Sector
Performance in 16 African countries
a supply side analysis of policy outcomes
STEVE ESSELAAR
ALISON GILLWALD
CHRISTOPH STORK
This Policy Research Paper Series is madepossible through the support of the International Development Research Centre(IDRC)
For further information see http://link.wits.ac.za
Tel:+27 11 7173913
Fax:+27 11 7173910
LINK Centre
Graduate School of Public Development Management
Witwatersrand University
Johannesburg
Box 601, Wits, 2050
http://link.wits.ac.za
African comparative country profile.qxp 2008/02/13 04:02 PM Page 1