Embed Size (px)
Citation preview

11660000 EEaass tt NNoorr tthheerrnn AAvveennuuee,, SSuuii ttee 110000 PPhhooeenniixx,, AAZZ 8855002200 PPhhoonnee 660022..226644..66338822 FFaaxx 660022..224411..00775577
2007–2008 EXTERNAL QUALITY REVIEW
TECHNICAL REPORT for
Medicaid Health Plans
FFeebbrruuaarryy 22000099

2007-2008 MHP External Quality Review Technical Report Page i State of Michigan MI2007-8_PH-MHP_EQR-TR_F1_0209
CCOONNTTEENNTTSS
11.. EExxeeccuuttiivvee SSuummmmaarryy .............................................................................................................................................................................................................................................. 11--11 PPuurrppoossee ooff RReeppoorrtt .................................................................................................................................................................................................................... 11--11 SSccooppee ooff EExxtteerrnnaall QQuuaalliittyy RReevviieeww ((EEQQRR)) AAccttiivviittiieess CCoonndduucctteedd .......................................................................... 11--22 SSuummmmaarryy ooff FFiinnddiinnggss .......................................................................................................................................................................................................... 11--33
22.. EExxtteerrnnaall QQuuaalliittyy RReevviieeww AAccttiivviittiieess ................................................................................................................................................................................................ 22--11 IInnttrroodduuccttiioonn ........................................................................................................................................................................................................................................ 22--11 CCoommpplliiaannccee MMoonniittoorriinngg .................................................................................................................................................................................................... 22--11 VVaalliiddaattiioonn ooff PPeerrffoorrmmaannccee MMeeaassuurreess .......................................................................................................................................................... 22--44 VVaalliiddaattiioonn ooff PPeerrffoorrmmaannccee IImmpprroovveemmeenntt PPrroojjeeccttss ((PPIIPPss)) ............................................................................................ 22--77 CCoonnssuummeerr AAsssseessssmmeenntt ooff HHeeaalltthhccaarree PPrroovviiddeerrss aanndd SSyysstteemmss ((CCAAHHPPSS)) ...................................... 22--1100
33.. OOvveerraallll SSttaattee FFiinnddiinnggss ........................................................................................................................................................................................................................................ 33--11 AAnnnnuuaall CCoommpplliiaannccee RReevviieeww ...................................................................................................................................................................................... 33--11 PPeerrffoorrmmaannccee MMeeaassuurreess .................................................................................................................................................................................................. 33--44 PPeerrffoorrmmaannccee IImmpprroovveemmeenntt PPrroojjeeccttss ((PPIIPPss)) ...................................................................................................................................... 33--99 CCoonnssuummeerr AAsssseessssmmeenntt ooff HHeeaalltthhccaarree PPrroovviiddeerrss aanndd SSyysstteemmss ((CCAAHHPPSS)) ...................................... 33--1111 CCoonncclluussiioonnss//SSuummmmaarryy .................................................................................................................................................................................................. 33--1133

CCOONNTTEENNTTSS
2007-2008 MHP External Quality Review Technical Report Page ii State of Michigan MI2007-8_PH-MHP_EQR-TR_F1_0209
AACCKKNNOOWWLLEEDDGGMMEENNTTSS AANNDD CCOOPPYYRRIIGGHHTTSS CAHPS® refers to the Consumer Assessment of Healthcare Providers and Systems and is a registered trademark of the Agency for Healthcare Research and Quality (AHRQ). HEDIS® refers to the Healthcare Effectiveness Data and Information Set and is a registered trademark of the National Committee for Quality Assurance (NCQA). NCQA HEDIS Compliance Audit™ is a trademark of the NCQA.

2007-2008 MHP External Quality Review Technical Report Page 1-1State of Michigan MI2007-8_PH-MHP_EQR-TR_F1_0209
11.. EExxeeccuuttiivvee SSuummmmaarryy
PPuurrppoossee ooff RReeppoorrtt
The Balanced Budget Act of 1997 (BBA), Public Law 105-33, requires states to prepare an annual technical report that describes the manner in which data from activities conducted in accordance with the Code of Federal Regulations (CFR), 42 CFR 438.358, were aggregated and analyzed. The report must describe how conclusions were drawn as to the quality and timeliness of, and access to, care furnished by the states’ managed care organizations, called Medicaid Health Plans (MHPs) in Michigan. The report of results must also contain an assessment of the strengths and weaknesses of the plans regarding health care quality, timeliness, and access, and must make recommendations for improvement. Finally, the report must assess the degree to which any previous recommendations were addressed by the MHPs. To meet this requirement, the State of Michigan Department of Community Health (MDCH) contracted with Health Services Advisory Group, Inc. (HSAG), an external quality review organization (EQRO), to aggregate and analyze MHP data and prepare the annual technical report.
The State of Michigan contracted with the following MHPs represented in this report:
BlueCaid (BCD)1-1 Community Choice Michigan (CCM)1-2 Great Lakes Health Plan (GLH) Health Plan of Michigan, Inc. (HPM) HealthPlus Partners, Inc. (HPP) McLaren Health Plan (MCL) Midwest Health Plan (MID) Molina Healthcare of Michigan (MOL) OmniCare Health Plan (OCH) Physicians Health Plan of Mid-Michigan Family Care (PMD) Priority Health Government Programs, Inc. (PRI) Total Health Care, Inc. (THC) Upper Peninsula Health Plan (UPP)
1-1 Formerly M-Caid 1-2 The MHP’s name changed to CareSource-Michigan after April 18, 2008.

EEXXEECCUUTTIIVVEE SSUUMMMMAARRYY
2007-2008 MHP External Quality Review Technical Report Page 1-2State of Michigan MI2007-8_PH-MHP_EQR-TR_F1_0209
SSccooppee ooff EExxtteerrnnaall QQuuaalliittyy RReevviieeww ((EEQQRR)) AAccttiivviittiieess CCoonndduucctteedd
This EQR technical report analyzes and aggregates data from three mandatory EQR activities and one optional activity as listed below:
Compliance Monitoring: MDCH evaluated the compliance of the MHPs with federal Medicaid managed care regulations using an on-site review process. HSAG examined, compiled, and analyzed the on-site review results as presented in the MHP site visit documentation provided by MDCH.
Validation of Performance Measures: Each MHP underwent a National Committee for Quality Assurance (NCQA) Healthcare Effectiveness Data and Information Set (HEDIS) Compliance Audit™ conducted by an NCQA-licensed audit organization. HSAG performed an independent audit of the audit findings to determine the validity of each performance measure.
Validation of Performance Improvement Projects (PIPs): HSAG reviewed one PIP for each MHP to ensure that the projects were designed, conducted, and reported in a methodologically sound manner, allowing real improvements in care to be achieved and giving confidence in the reported improvements.
Consumer Assessment of Healthcare Providers and Systems (CAHPS): For 2008, MDCH required the administration of the CAHPS 4.0H Adult Medicaid Health Plan Survey. Adult members from each plan completed the surveys. The CAHPS 3.0H Child Medicaid Health Plan Survey was not required in 2008.

EEXXEECCUUTTIIVVEE SSUUMMMMAARRYY
2007-2008 MHP External Quality Review Technical Report Page 1-3State of Michigan MI2007-8_PH-MHP_EQR-TR_F1_0209
SSuummmmaarryy ooff FFiinnddiinnggss
The following is a statewide summary of the conclusions drawn regarding the MHPs’ general performance in 2007–2008 on the four activities. Appendices A–M contain detailed, MHP-specific findings, while Section 3 presents detailed statewide findings with year-to-year comparisons.
CCoommpplliiaannccee RReevviieeww
Table 1-1 shows the results of the 2007–2008 annual compliance review. The statewide average across all standards and MHPs was 93 percent. The Administrative standard showed both the highest statewide average score (98 percent) and the highest number of MHPs (12 of 13) meeting 100 percent of the contractual requirements that were assessed. None of the MHPs met all requirements related to the Provider and Quality/Utilization standards. On the Quality/Utilization standard, all MHPs demonstrated only partial compliance on the criterion related to the performance measures. The lowest statewide average was for the MIS/Data Reporting/Claims Processing standard; however, 10 of the 13 MHPs were able to improve their compliance score and 5 MHPs met 100 percent of the contractual requirements assessed in this standard. Overall, the annual compliance review demonstrated strengths for the MHPs, with appropriate knowledge of processes and documentation of policies and procedures.
Table 1-1—Summary of Data From the 2007–2008 Compliance Review
Standard Range of Scores Statewide Average Standard 1: Administrative 75%–100% 98% Standard 2: Provider 78%–97% 90% Standard 3: Member 91%–100% 95% Standard 4: Quality/Utilization 86%–95% 95% Standard 5: MIS/Data Reporting/Claims Processing 60%–100% 89% Standard 6: Fraud and Abuse 75%–100% 95%
Overall 86%–98% 93%

EEXXEECCUUTTIIVVEE SSUUMMMMAARRYY
2007-2008 MHP External Quality Review Technical Report Page 1-4State of Michigan MI2007-8_PH-MHP_EQR-TR_F1_0209
VVaalliiddaattiioonn ooff PPeerrffoorrmmaannccee MMeeaassuurreess
All of the MHPs demonstrated the ability to calculate and report accurate performance measures specified by the State. Table 1-2 displays the 2008 Michigan Medicaid weighted averages and performance levels compared to the NCQA HEDIS 2007 Medicaid percentiles. For most of the measures, the 90th percentile indicates above-average performance ( ), the 25th percentile represents below-average performance ( ), and average performance falls between these two percentiles ( ). Because lower rates indicate better performance for two measures (i.e., Comprehensive Diabetes Care—Poor HbA1c Control and Well-Child Visits in the First 15 Months of Life—Zero Visits), their performance levels are based on a different set of percentiles—i.e., the 10th percentile (rather than the 90th percentile) indicates above-average performance and the 75th percentile (rather than the 25th percentile) shows below-average performance.
Table 1-2—Overall Statewide Weighted Averages for Performance Measures
Performance Measure 2008 MI
Medicaid Performance Level for 2008
Pediatric Care Childhood Immunization Status—Combo 2 81.9%
Childhood Immunization Status—Combo 3 73.4%
Well-Child Visits in the First 15 Months of Life—Zero Visits* 1.4%
Well-Child Visits in the First 15 Months of Life—Six or More Visits 61.6%
Well-Child Visits in the Third, Fourth, Fifth, and Sixth Years of Life 69.5%
Adolescent Well-Care Visits 52.0%
Appropriate Treatment for Children With Upper Respiratory Infection (URI) 79.3%
Appropriate Testing for Children With Pharyngitis 47.7%
Women’s Care Breast Cancer Screening—42 to 51 Years 49.0%
Breast Cancer Screening—52 to 69 Years 56.5%
Breast Cancer Screening—Combined Rate 52.6%
Cervical Cancer Screening 68.5%
Chlamydia Screening in Women—16 to 20 Years 53.2%
Chlamydia Screening in Women—21 to 25 Years 61.5%
Chlamydia Screening in Women—Combined Rate 56.4%
Timeliness of Prenatal Care 84.5%
Postpartum Care 63.0%
* Lower rates are better for this measure. † National percentiles are not available for these measures.
= Below-average performance relative to national Medicaid results. = Average performance relative to national Medicaid results. = Above-average performance relative to national Medicaid results.

EEXXEECCUUTTIIVVEE SSUUMMMMAARRYY
2007-2008 MHP External Quality Review Technical Report Page 1-5State of Michigan MI2007-8_PH-MHP_EQR-TR_F1_0209
Table 1-2—Overall Statewide Weighted Averages for Performance Measures
Performance Measure 2008 MI
Medicaid Performance Level for 2008
Living With Illness Comprehensive Diabetes Care—HbA1c Testing 84.6%
Comprehensive Diabetes Care—Poor HbA1c Control* 38.4%
Comprehensive Diabetes Care—Good HbA1c Control 39.6%
Comprehensive Diabetes Care—Eye Exam 58.8%
Comprehensive Diabetes Care—LDL-C Screening 76.8%
Comprehensive Diabetes Care—LDL-C Level <100 40.0%
Comprehensive Diabetes Care—Medical Attention for Nephropathy 80.7%
Comprehensive Diabetes Care—Blood Pressure Control (<130/80) 28.6%
Comprehensive Diabetes Care—Blood Pressure Control (<140/90) 58.4%
Use of Appropriate Medications for People With Asthma—5 to 9 Years 90.6%
Use of Appropriate Medications for People With Asthma—10 to 17 Years 87.3%
Use of Appropriate Medications for People With Asthma—18 to 56 Years 86.3%
Use of Appropriate Medications for People With Asthma—Combined Rate 87.5%
Controlling High Blood Pressure 56.1%
Medical Assistance With Smoking Cessation—Advising Smokers to Quit 72.8% †† Medical Assistance With Smoking Cessation—Discussing Smoking Cessation Strategies
41.1% ††
Access to Care Children’s Access to Primary Care Practitioners—12 to24 Months 95.6%
Children’s Access to Primary Care Practitioners—25 Months to 6 Years 85.0%
Children’s Access to Primary Care Practitioners—7 to 11 Years 83.9%
Adolescents’ Access to Primary Care Practitioners—12 to 19 Years 82.1%
Adults’ Access to Preventive/Ambulatory Health Services—20 to 44 Years 81.1%
Adults’ Access to Preventive/Ambulatory Health Services—45 to 64 Years 86.8%
Adults’ Access to Preventive/Ambulatory Health Services—65 Years and Older 76.3%
* Lower rates are better for this measure. † National percentiles are not available for these measures.
= Below-average performance relative to national Medicaid results. = Average performance relative to national Medicaid results. = Above-average performance relative to national Medicaid results.
Of the 40 performance measures, 38 were compared to the HEDIS 2007 benchmarks. The statewide average rate for each of the comparable performance measures fell within its respective national Medicaid HEDIS 2007 average performance range.

EEXXEECCUUTTIIVVEE SSUUMMMMAARRYY
2007-2008 MHP External Quality Review Technical Report Page 1-6State of Michigan MI2007-8_PH-MHP_EQR-TR_F1_0209
PPeerrffoorrmmaannccee IImmpprroovveemmeenntt PPrroojjeeccttss ((PPIIPPss))
The PIPs submitted for the 2007–2008 validation addressed a new study topic. The MHPs chose between two topics provided by MDCH. Ten MHPs submitted PIPs on breast cancer screening disparity, while three MHPs chose the cervical cancer screening PIP topic. Twelve of the 13 MHPs received a validation status of Met for their PIPs, as shown in Table 1-3.
Table 1-3—MHP’s 2007–2008 PIP Validation Status Validation Status Number of MHPs
Met 12
Partially Met 1
Not Met 0
Table 1-4 presents a summary of the statewide 2007–2008 results of the validation of the ten activities of the protocol for conducting PIPs. Two MHPs completed all ten activities, and two MHPs completed Activities I through IX. One MHP progressed to Activity VI only, and eight MHPs completed Activities I through VIII. For Activities I, IV, V, and VII, all the MHPs demonstrated compliance with all applicable evaluation and critical elements. Overall, these findings indicated that for the activities completed, the MHPs had a thorough understanding of the requirements in the CMS protocol for conducting PIPs. The MHPs designed, conducted, and reported their PIPs in a methodologically sound manner, allowing achievement of real improvements in care and giving confidence in the reported results.
Table 1-4—Summary of Data From the 2007–2008 Validation of PIPs
Validation Activity
Number of PIPs Meeting all Evaluation
Elements/ Number Reviewed
Number of PIPs Meeting all Critical
Elements/ Number Reviewed
I. Appropriate Study Topic 13/13 13/13 II. Clearly Defined, Answerable Study Question 12/13 12/13 III. Clearly Defined Study Indicator 12/13 12/13 IV. Correctly Identified Study Population 13/13 13/13 V. Valid Sampling Techniques* 2/2 2/2 VI. Accurate/Complete Data Collection 12/13 12/13 VII. Appropriate Improvement Strategies 12/12 12/12 VIII. Sufficient Data Analysis and Interpretation 11/12 12/12 IX. Real Improvement Achieved 1/4 No Critical Elements X. Sustained Improvement 1/2 No Critical Elements * This activity is assessed only for PIPs that conduct sampling.

EEXXEECCUUTTIIVVEE SSUUMMMMAARRYY
2007-2008 MHP External Quality Review Technical Report Page 1-7State of Michigan MI2007-8_PH-MHP_EQR-TR_F1_0209
CCoonnssuummeerr AAsssseessssmmeenntt ooff HHeeaalltthhccaarree PPrroovviiddeerrss aanndd SSyysstteemmss ((CCAAHHPPSS))
Table 1-5 presents the statewide 2008 CAHPS composite scores.
Table 1-5—2008 Statewide Average Results for CAHPS Child and Adult Composite Scores
CAHPS Measure Top-Box
Percentage Three-Point Mean Score
Performance Level
Child† Getting Needed Care 79.3% 2.72 Getting Care Quickly 54.4% 2.33 How Well Doctors Communicate 68.9% 2.59 Courteous and Helpful Office Staff 72.6% 2.64 Customer Service 72.1% 2.65 Adult Getting Needed Care 51.4% 2.29 Getting Care Quickly 56.2% 2.38 How Well Doctors Communicate 66.3% 2.51 Customer Service 59.3% 2.39 Shared Decision Making 58.7% 2.48 — The top-box percentage indicates the percentage of responses of “Always,” “Definitely Yes,” or “Not a Problem.” Performance levels are based on a comparison to NCQA accreditation benchmarks and thresholds for the adult Medicaid population and to the distribution of NCQA national survey results for the child Medicaid population. † Child results for 2008 reflect 2007 data due to the measure being rotated in 2008. — Benchmarks and thresholds were not published for the Shared Decision Making composite.
= Below-average performance (<25th percentile) relative to national Medicaid results. = Average performance (≥25th to <75th percentile) relative to national Medicaid results. = Above-average performance (≥75th percentile) relative to national Medicaid results.
The MHPs showed average performance on all five of the 2008 child CAHPS composite measures: Getting Needed Care, Getting Care Quickly, How Well Doctors Communicate, Courteous and Helpful Office Staff, and Customer Service.
The MHPs showed above-average performance on one of the four comparable 2008 adult CAHPS composite measures, Customer Service. The MHPs showed average performance on the remaining measures: Getting Needed Care, Getting Care Quickly, and How Well Doctors Communicate.

EEXXEECCUUTTIIVVEE SSUUMMMMAARRYY
2007-2008 MHP External Quality Review Technical Report Page 1-8State of Michigan MI2007-8_PH-MHP_EQR-TR_F1_0209
Table 1-6 presents the statewide 2008 CAHPS global ratings.
Table 1-6—2008 Statewide Average Results for CAHPS Child and Adult Global Ratings
CAHPS Measure Top-Box
Percentage Three-Point Mean Score
Performance Level
Child† Rating of All Health Care 61.9% 2.50 Rating of Personal Doctor 59.7% 2.48 Rating of Specialist Seen Most Often 60.3% 2.47 Rating of Health Plan 57.9% 2.45 Adult Rating of All Health Care 45.9% 2.22 Rating of Personal Doctor 59.0% 2.40 Rating of Specialist Seen Most Often 60.4% 2.44 Rating of Health Plan 52.9% 2.33 The top-box percentage indicates the percentage of respondents rating 9 or 10 on a scale of 0 to 10. Performance levels are based on a comparison to NCQA accreditation benchmarks and thresholds for the adult Medicaid population and to the distribution of NCQA national survey results for the child Medicaid population. † Child results for 2008 reflect 2007 data due to the measure being rotated in 2008.
= Below-average performance (<25th percentile) relative to national Medicaid results. = Average performance (≥25th to <75th percentile) relative to national Medicaid results. = Above-average performance (≥75th percentile) relative to national Medicaid results.
The MHPs showed average performance on two of the four child CAHPS global ratings: Rating of Specialist Seen Most Often and Rating of Health Plan. However, Rating of All Health Care and Rating of Personal Doctor showed below-average performance compared to NCQA national survey results. These areas of below-average performance may be potential targets for quality improvement activities aimed at improving member satisfaction.
The MHPs showed average performance on all four of the adult CAHPS global ratings: Rating of All Health Care, Rating of Personal Doctor, Rating of Specialist Seen Most Often, and Rating of Health Plan.

EEXXEECCUUTTIIVVEE SSUUMMMMAARRYY
2007-2008 MHP External Quality Review Technical Report Page 1-9State of Michigan MI2007-8_PH-MHP_EQR-TR_F1_0209
QQuuaalliittyy,, TTiimmeelliinneessss,, aanndd AAcccceessss
The annual compliance review of the MHPs showed strengths across the domains of quality, timeliness, and access, which assess the quality and timeliness of, and access to, services provided to beneficiaries.
The validation of the MHPs’ performance improvement projects reflected strong performance in the quality domain. The projects were designed, conducted, and reported in a methodologically sound manner, allowing real improvements in care to be achieved and giving confidence in the reported results.
Thirty-eight of the 40 performance measures were compared with the available national Medicaid HEDIS percentiles. Overall, results of validated performance measures were average across the quality, timeliness, and access domains.
The MHPs showed average performance in the timeliness and access domains for CAHPS. The quality domain, on the other hand, exhibited mixed results. Most of the measures had average performance; however, two measures had below-average performance and one measure exhibited above-average performance.
Table 1-7 shows HSAG’s assignment of the compliance review standards, performance measures, PIPs, and CAHPS into the domains of quality, timeliness, and access.

EEXXEECCUUTTIIVVEE SSUUMMMMAARRYY
2007-2008 MHP External Quality Review Technical Report Page 1-10State of Michigan MI2007-8_PH-MHP_EQR-TR_F1_0209
Table 1-7—Assignment of Activities to Performance Domains Compliance Review Standards Quality Timeliness Access
Standard 1. Administrative Standard 2. Providers Standard 3. Members Standard 4. Quality/Utilization Standard 5. MIS/ Data Reporting/Claims Standard 6. Fraud and Abuse
Performance Measures Quality Timeliness Access Childhood Immunization Status Well-Child Visits in the First 15 Months of Life Well-Child Visits in the Third, Fourth, Fifth, and Sixth Years of Life Adolescent Well-Care Visits Appropriate Treatment for Children With Upper Respiratory Infection Appropriate Testing for Children With Pharyngitis Breast Cancer Screening Cervical Cancer Screening Chlamydia Screening in Women Prenatal and Postpartum Care Comprehensive Diabetes Care Use of Appropriate Medications for People With Asthma Controlling High Blood Pressure Medical Assistance With Smoking Cessation Children’s and Adolescents’ Access to Primary Care Practitioners Adults’ Access to Preventive/Ambulatory Health Services
PIPs Quality Timeliness Access One PIP for each MHP
CAHPS Topics Quality Timeliness Access Getting Needed Care Getting Care Quickly Customer Service Courteous and Helpful Office Staff How Well Doctors Communicate Shared Decision Making Rating of Health Plan Rating of Personal Doctor Rating of Specialist Seen Most Often

2007-2008 MHP External Quality Review Technical Report Page 2-1 State of Michigan MI2007-8_PH-MHP_EQR-TR_F1_0209
22.. EExxtteerrnnaall QQuuaalliittyy RReevviieeww AAccttiivviittiieess
IInnttrroodduuccttiioonn
This section of the report describes the manner in which data from the activities conducted in accordance with 42 CFR 438.358 were aggregated and analyzed.
CCoommpplliiaannccee MMoonniittoorriinngg
OObbjjeeccttiivveess
According to 42 CFR 438.358, the State or its EQRO must conduct a review within a three-year period to determine the Medicaid managed care organizations’ compliance with standards established by the State for access to care, structure and operations, and quality measurement and improvement. To meet this requirement, MDCH performed on-site reviews of its MHPs.
The objectives of evaluating contractual compliance with federal Medicaid managed care regulations were to identify any areas of noncompliance and to assist the MHPs in developing corrective actions to achieve compliance with the contractual requirements.
TTeecchhnniiccaall MMeetthhooddss ooff DDaattaa CCoolllleeccttiioonn
MDCH was responsible for the activities that assessed MHP compliance with federal Medicaid managed care regulations. This report reflects results from the annual compliance site visits that included all contracted MHPs and took place from October 1, 2007, through September 30, 2008.
In 2007, MDCH revised the tool used to conduct the on-site evaluations of the MHPs’ compliance with contractual requirements. MDCH conducted the reviews presented in this report using the new FY 2008 Site Visit Tool. While there were changes to the criteria assessed and the scoring methodology, the tool continued to evaluate the MHPs’ performance related to the following six standards:
1. Administrative (2 criteria) 2. Providers (16 criteria) 3. Members (11 criteria) 4. Quality (11 criteria) 5. Management Information and Data Reporting (5 criteria) 6. Fraud and Abuse (14 criteria)

EEXXTTEERRNNAALL QQUUAALLIITTYY RREEVVIIEEWW AACCTTIIVVIITTIIEESS
2007-2008 MHP External Quality Review Technical Report Page 2-2State of Michigan MI2007-8_PH-MHP_EQR-TR_F1_0209
DDeessccrriippttiioonn ooff DDaattaa OObbttaaiinneedd
To assess the MHPs’ compliance with federal and State requirements, MDCH obtained information from a wide range of written documents produced by the MHPs, including the following:
Policies and procedures Current quality assessment and performance improvement (QAPI) programs Minutes of meetings of the governing body, quality improvement (QI) committee, compliance
committee, utilization management (UM) committee, credentialing committee, and peer review committee
QI work plans, utilization reports, provider and member profiling reports, QI effectiveness reports
Internal auditing/monitoring plans, auditing/monitoring findings Claims review reports, prior authorization reports, complaint logs, grievance logs, telephone
contact logs, disenrollment logs, MDCH hearing requests, medical record review reports Provider service and delegation agreements and contracts Provider files, disclosure statements, current sanctioned/suspended provider lists Organizational charts Fraud and abuse logs, fraud and abuse reports Employee handbooks, fliers, employee newsletters, provider manuals, provider newsletters,
Web sites, educational/training materials, and sign-in sheets Member materials, including welcome letters, member handbooks, member newsletters,
provider directories, and certificates of coverage Provider manuals
For the 2007–2008 compliance site visits, MDCH automated the site visit tool as an Access database application. Prior to the scheduled site visit, each MHP received the tool with instructions for entering the required information. For each criterion, the Access application specified which supporting documents were required for submission, stated the previous score, and provided a space for the MHP’s response. Following the site visit, MDCH completed the section for State findings and assigned a score for each criterion. The new site visit tool was also used for the MHP to describe, after the site review, any required corrective action plan and to document MDCH’s action plan assessment.
For each of the MHPs, MDCH summarized the MHPs’ focus studies presented at the site visit in a focus study report.
HSAG examined, compiled, and analyzed the review results as contained in the MHP site visit documentation submitted by MDCH.

EEXXTTEERRNNAALL QQUUAALLIITTYY RREEVVIIEEWW AACCTTIIVVIITTIIEESS
2007-2008 MHP External Quality Review Technical Report Page 2-3State of Michigan MI2007-8_PH-MHP_EQR-TR_F1_0209
DDaattaa AAggggrreeggaattiioonn,, AAnnaallyyssiiss,, aanndd HHooww CCoonncclluussiioonnss WWeerree DDrraawwnn
MDCH reviewers used the site visit tool for each MHP to document their findings and to identify, when applicable, specific action(s) required of the plan to address any areas of noncompliance with contractual requirements.
For each criterion reviewed, MDCH assigned one of the following scores:
Pass—The MHP demonstrated full compliance with the requirement(s). Incomplete—The MHP demonstrated partial compliance with the requirement(s). Fail—The MHP failed to demonstrate compliance with the requirement(s).
HSAG calculated a total compliance score for each standard, reflecting the degree of compliance with contractual requirements related to that area, and an overall score for each MHP across all six standards. The total compliance scores were obtained by adding the number of criteria that received a score of Pass to the weighted (multiplied by 0.5) number of criteria that received a score of Incomplete. Statewide averages were calculated by summing the individual MHP scores, then dividing that sum by the total number of criteria reviewed across all MHPs.
To draw conclusions and make overall assessments about the quality and timeliness of, and access to, care provided by the MHPs using findings from the compliance reviews, the standards were categorized to evaluate each of these three domains. Using this framework, Table 1-7 (page 1-10) shows HSAG’s assignment of standards to the three domains of performance.
EEXXTTEERRNNAALL QQUUAALLIITTYY RREEVVIIEEWW AACCTTIIVVIITTIIEESS
2007-2008 MHP External Quality Review Technical Report Page 2-4State of Michigan MI2007-8_PH-MHP_EQR-TR_F1_0209
VVaalliiddaattiioonn ooff PPeerrffoorrmmaannccee MMeeaassuurreess
OObbjjeeccttiivveess
As set forth in 42 CFR 438.358, validation of performance measures is one of the mandatory EQR activities. The primary objectives of the performance measure validation process are to:
Evaluate the accuracy of the performance measure data collected by the MHP. Determine the extent to which the specific performance measures calculated by the MHP (or on
behalf of the MHP) followed the specifications established for each performance measure.
To meet the two primary objectives of the validation activity, a measure-specific review of all reported measures was performed, as well as a thorough information system evaluation, to assess each MHP’s support systems available to report accurate HEDIS measures.
TTeecchhnniiccaall MMeetthhooddss ooff DDaattaa CCoolllleeccttiioonn aanndd AAnnaallyyssiiss
MDCH required each MHP to collect and report a set of Medicaid HEDIS measures. Developed and maintained by NCQA, HEDIS is a set of performance data broadly accepted in the managed care environment as an industry standard.
Each MHP underwent an NCQA HEDIS Compliance Audit™ conducted by an NCQA-licensed audit organization. The NCQA HEDIS Compliance Audit followed NCQA audit methodology as set out in NCQA’s 2008 HEDIS Compliance Audit: Standards, Policies, and Procedures. The NCQA HEDIS Compliance Audit encompasses an in-depth examination of the health plans’ processes consistent with CMS’ protocols for validation of performance measures. To complete the validation of performance measures process according to the CMS protocols, HSAG performed an independent evaluation of the audit results and findings to determine the validity of each performance measure.
The HEDIS Compliance Audits, conducted by the licensed audit organizations, included the following activities:
Pre-review Activities: Each MHP was required to complete the NCQA Baseline Assessment Tool (BAT), which is comparable to the Information Systems Capabilities Assessment Tool, Appendix Z, of the CMS protocols. Pre-on-site conference calls were held to follow up on any outstanding questions. The audit team conducted a thorough review of the BAT and supporting documentation, including an evaluation of processes used for collecting, storing, validating, and reporting the performance measure data.
On-site Review: The on-site reviews, which typically lasted two days, included:
An evaluation of system compliance, focusing on the processing of claims and encounters. An overview of data integration and control procedures, including discussion and observation. A review of how all data sources were combined and the method used to produce the
performance measures.

EEXXTTEERRNNAALL QQUUAALLIITTYY RREEVVIIEEWW AACCTTIIVVIITTIIEESS
2007-2008 MHP External Quality Review Technical Report Page 2-5State of Michigan MI2007-8_PH-MHP_EQR-TR_F1_0209
Interviews with MHP staff members involved with any aspect of performance measure reporting.
A closing conference at which the audit team summarized preliminary findings and recommendations.
Post-on-site Review Activities: For each performance measure calculated and reported by the MHPs, the audit team aggregated the findings from the pre-on-site and on-site activities to determine whether the reported measures were valid, based on an allowable bias. The audit team assigned each measure one of four audit findings: (1) Report (the rate was valid and below the allowable threshold for bias), (2) Not Applicable (the MHP followed the specifications but the denominator was too small to report a valid rate), (3) No Benefit (the MHP did not offer the health benefits required by the measure), or (4) Not Report (the measure was significantly biased or the plan chose not to report the measure).
DDeessccrriippttiioonn ooff DDaattaa OObbttaaiinneedd
As identified in the CMS protocol, the following key types of data were obtained and reviewed as part of the validation of performance measures. Table 2-1 shows the data sources used in the validation of performance measures and the time period to which the data applied.
Table 2-1—Description of Data Sources
Data Obtained Time Period to Which the Data Applied
HEDIS Compliance Audit reports were obtained for each MHP, which included a description of the audit process, the results of the information systems findings, and the final audit designations for each performance measure.
Calendar Year (CY) 2007 (HEDIS 2008)
Performance measure reports, submitted by the MHPs using NCQA’s Information Data Submission System (IDSS), were analyzed and subsequently validated by the HSAG validation team.
CY 2007 (HEDIS 2008)
Previous performance measure reports were reviewed to assess trending patterns and the reasonability of rates.
CY 2006 (HEDIS 2007)

EEXXTTEERRNNAALL QQUUAALLIITTYY RREEVVIIEEWW AACCTTIIVVIITTIIEESS
2007-2008 MHP External Quality Review Technical Report Page 2-6State of Michigan MI2007-8_PH-MHP_EQR-TR_F1_0209
DDaattaa AAggggrreeggaattiioonn,, AAnnaallyyssiiss,, aanndd HHooww CCoonncclluussiioonnss WWeerree DDrraawwnn
HSAG performed a comprehensive review and analysis of the MHPs’ IDSS results, data submission tools, and the MHP-specific HEDIS Compliance Audit reports and performance measure reports.
HSAG ensured that the following criteria were met prior to accepting any validation results:
An NCQA-licensed audit organization completed the audit. An NCQA-certified HEDIS compliance auditor led the audit. The audit scope included all MDCH-selected HEDIS measures. The audit scope focused on the Medicaid product line. Data were submitted via an auditor-locked NCQA IDSS. A final Audit Opinion, signed by the lead auditor and responsible officer within the licensed
organization, was produced. To draw conclusions and make overall assessments about the quality and timeliness of, and access to, care provided by the MHPs using findings from the validation of performance measures, each measure was categorized to evaluate one or more of the three domains. Table 1-7 shows HSAG’s assignment of performance measures to these domains of performance.

EEXXTTEERRNNAALL QQUUAALLIITTYY RREEVVIIEEWW AACCTTIIVVIITTIIEESS
2007-2008 MHP External Quality Review Technical Report Page 2-7State of Michigan MI2007-8_PH-MHP_EQR-TR_F1_0209
VVaalliiddaattiioonn ooff PPeerrffoorrmmaannccee IImmpprroovveemmeenntt PPrroojjeeccttss ((PPIIPPss))
OObbjjeeccttiivveess As part of its QAPI program, each MHP is required by MDCH to conduct PIPs in accordance with 42 CFR 438.240. The purpose of the PIPs is to achieve, through ongoing measurements and interventions, significant improvement sustained over time in clinical and nonclinical areas. As one of the mandatory EQR activities under the BBA, the State is required to validate the PIPs conducted by its contracted Medicaid managed care organizations. To meet this validation requirement for the MHPs, MDCH contracted with HSAG.
The primary objective of PIP validation was to determine each MHP’s compliance with requirements set forth in 42 CFR 438.240(b)(1), including:
Measurement of performance using objective quality indicators. Implementation of systematic interventions to achieve improvement in quality. Evaluation of the effectiveness of the interventions. Planning and initiation of activities for increasing or sustaining improvement.
MDCH required that each MHP conduct one PIP subject to validation by HSAG. In 2007–2008, MDCH allowed the MHPs to select breast cancer screening disparity or cervical cancer screening disparity as a PIP topic for validation. Ten MHPs submitted a PIP on breast cancer screening disparity and three MHPs submitted a PIP on cervical cancer screening disparity.
TTeecchhnniiccaall MMeetthhooddss ooff DDaattaa CCoolllleeccttiioonn aanndd AAnnaallyyssiiss
The HSAG PIP Review Team consisted of, at a minimum, an analyst with expertise in statistics and study design, and a reviewer with expertise in performance improvement processes. The methodology used to validate the PIPs was based on Centers for Medicare & Medicaid Services (CMS) guidelines as outlined in the CMS publication, Validating Performance Improvement Projects: A Protocol for Use in Conducting Medicaid External Quality Review Activities, final protocol, Version 1.0, May 1, 2002 (CMS PIP Protocol). Using this protocol, HSAG, in collaboration with MDCH, developed the PIP Summary Form. Each MHP completed this form and submitted it to HSAG for review. The PIP Summary Form standardized the process for submitting information regarding the PIPs and assured that all CMS PIP Protocol requirements were addressed.
With MDCH input and approval, HSAG developed a PIP Validation Tool to ensure uniform assessment of PIPs. Using this tool, HSAG reviewed each of the PIPs for the following ten CMS protocol activities:
Activity I. Appropriate Study Topic Activity II. Clearly Defined, Answerable Study Question Activity III. Clearly Defined Study Indicator(s) Activity IV. Correctly Identified Study Population Activity V. Valid Sampling Techniques (if sampling was used) Activity VI. Accurate/Complete Data Collection
EEXXTTEERRNNAALL QQUUAALLIITTYY RREEVVIIEEWW AACCTTIIVVIITTIIEESS
2007-2008 MHP External Quality Review Technical Report Page 2-8State of Michigan MI2007-8_PH-MHP_EQR-TR_F1_0209
Activity VII. Appropriate Improvement Strategies Activity VIII. Sufficient Data Analysis and Interpretation Activity IX. Real Improvement Achieved Activity X. Sustained Improvement Achieved
DDeessccrriippttiioonn ooff DDaattaa OObbttaaiinneedd
HSAG obtained the data needed to conduct the PIP validations from the MHPs’ PIP Summary Form. This form provided detailed information about each MHP’s PIP as it related to the ten activities being reviewed and evaluated for the 2007–2008 validation cycle.
DDaattaa AAggggrreeggaattiioonn,, AAnnaallyyssiiss,, aanndd HHooww CCoonncclluussiioonnss WWeerree DDrraawwnn
Each of the ten protocol activities consisted of evaluation elements necessary for the successful completion of a valid PIP. The HSAG PIP Review Team scored the elements within each activity as Met, Partially Met, Not Met, or Not Applicable. The scoring methodology included a Not Applicable designation for evaluation elements (including critical elements) that did not apply to the PIP (e.g., a PIP that did not use any sampling techniques would have all elements in Activity V scored Not Applicable). HSAG used the Not Assessed designation when the PIP had not progressed to the remaining steps in the CMS protocol. Elements that were considered Not Applicable and Not Assessed were removed from all scoring.
HSAG identified a Point of Clarification when the documentation for an evaluation element included the basic components needed to meet the requirements of the evaluation element (as described in the narrative of the PIP), but enhanced documentation would demonstrate a stronger understanding of the CMS PIP Protocol.
To assure a valid and reliable review, HSAG designated some of the evaluation elements as “critical” elements. HSAG determined that these elements had to be Met for the MHP to produce an accurate and reliable PIP. Given the importance of critical elements to this scoring methodology, any critical element that received a Not Met status resulted in an overall validation rating for the PIP of Not Met. An MHP would be given a Partially Met score if 60 to 79 percent of all elements were Met across all activities, or one or more critical elements were Partially Met.
The MHPs had an opportunity to resubmit revised PIP Summary Forms and additional information in response to any Partially Met or Not Met evaluation scores, regardless of whether the evaluation element was critical or noncritical. HSAG re-reviewed the resubmitted documents and rescored the PIPs before determining a final score. With MDCH’s approval, HSAG offered to provide technical guidance to any MHP that requested an opportunity to review the scoring of the evaluation elements prior to a resubmission. Eight of the 13 MHPs requested technical guidance from HSAG. HSAG conducted conference calls to provide an opportunity for the MHPs to discuss areas of deficiencies. HSAG reviewed and discussed each Point of Clarification, Partially Met, and Not Met evaluation element. As a result of the technical guidance conference calls, HSAG provided each MHP with Summary Form Completion Instructions. The instructions outlined the evaluation elements and provided documentation resources to support CMS PIP Protocol requirements.

EEXXTTEERRNNAALL QQUUAALLIITTYY RREEVVIIEEWW AACCTTIIVVIITTIIEESS
2007-2008 MHP External Quality Review Technical Report Page 2-9State of Michigan MI2007-8_PH-MHP_EQR-TR_F1_0209
HSAG followed the above methodology for validating the PIPs for all MHPs to assess the degree to which the MHPs designed, conducted, and reported their projects in a methodologically sound manner.
After completing the validation review, HSAG prepared a report of its findings and recommendations for each validated PIP. These reports, which complied with 42 CFR 438.364, were forwarded to MDCH and the appropriate MHP.
Although an MHP’s purpose for conducting a PIP may have been to improve performance in an area related to quality and/or timeliness and/or access to care and services, the purpose of the EQR activities related to PIPs was to evaluate the validity and quality of the MHP’s processes in conducting PIPs. Therefore, to draw conclusions and make overall assessments about each MHP’s performance in conducting valid PIPs, HSAG assigned all PIPs to the quality domain.

EEXXTTEERRNNAALL QQUUAALLIITTYY RREEVVIIEEWW AACCTTIIVVIITTIIEESS
2007-2008 MHP External Quality Review Technical Report Page 2-10State of Michigan MI2007-8_PH-MHP_EQR-TR_F1_0209
CCoonnssuummeerr AAsssseessssmmeenntt ooff HHeeaalltthhccaarree PPrroovviiddeerrss aanndd SSyysstteemmss ((CCAAHHPPSS))
OObbjjeeccttiivveess
The CAHPS survey was designed to assess key satisfaction drivers throughout the continuum of care, including health plan performance and the member’s experience in the physician’s office.
The objective of the CAHPS survey was to provide performance feedback to help improve overall member satisfaction.
TTeecchhnniiccaall MMeetthhooddss ooff DDaattaa CCoolllleeccttiioonn aanndd AAnnaallyyssiiss
The technical method of data collection was through the administration of the CAHPS 4.0H Adult Medicaid Health Plan Survey and the CAHPS 3.0H Child Medicaid Health Plan Survey (without the children with chronic conditions measurement set). The survey encompasses a set of standardized items that assess patient perspectives on care (or, for the child survey, the parents’ or caretakers’ perspective). To achieve reliability and validity of findings, HEDIS Volume 3: Specifications for Survey Measures sampling and data collection procedures were followed for the selection of members and the distribution of surveys. These procedures were designed to capture accurate and complete information to promote both the standardized administration of the instruments and the comparability of the resulting data. Data from the multiple waves of mailings and response-gathering activities were aggregated into a database for analysis.
The survey questions were categorized into measures of satisfaction. These included four global ratings and five composite measures for the adult and child surveys. The global ratings reflected respondents’ overall satisfaction with their or their child’s personal doctor, specialist, health plan, and all health care. The composite scores were derived from sets of questions to address different aspects of care. The adult survey’s composites addressed: Getting Needed Care, Getting Care Quickly, How Well Doctors Communicate, Customer Service, and Shared Decision Making. The child survey’s composites addressed: Getting Needed Care, Getting Care Quickly, How Well Doctors Communicate, Courteous and Helpful Office Staff, and Customer Service. When a minimum of 100 responses for a measure was not received, the results of the measure were not applicable for reporting, resulting in a Not Applicable (NA) designation.
For each of the global ratings, the percentage of respondents who chose the top-box satisfaction rating (a response value of 9 or 10 on a scale of 0 to 10) was calculated. This was referred to as the question summary rate. In addition, a three-point mean was calculated. Response values of 0 to 6 were given a score of 1, response values of 7 to 8 were given a score of 2, and response values of 9 to 10 were given a score of 3. The three-point mean is determined by calculating a sum of the response scores (1, 2, or 3) and dividing the sum by the total number of responses to the global rating question.
For each of the composite scores, the percentage of respondents who chose a positive response was calculated. CAHPS questions used in composites were scaled in one of three ways:
Never/Sometimes/Usually/Always Big Problem/Small Problem/Not a Problem Definitely No/Somewhat No/Somewhat Yes/Definitely Yes

EEXXTTEERRNNAALL QQUUAALLIITTYY RREEVVIIEEWW AACCTTIIVVIITTIIEESS
2007-2008 MHP External Quality Review Technical Report Page 2-11State of Michigan MI2007-8_PH-MHP_EQR-TR_F1_0209
NCQA defined a top-box response for these composites as a response of Always, Not a Problem, or Definitely Yes. This is referred to as a global proportion for the composite scores.
In addition, a three-point mean was calculated for each of the composite measures. Scoring was based on a three-point scale. Responses of Always, Not a Problem, and Definitely Yes were given a score of 3; responses of Usually, Small Problem, and Somewhat Yes were given a score of 2; and all other responses were given a score of 1. The three-point mean is the average of the mean score for each question included in the composite (i.e., the mean of the means).
CAHPS reports prepared for each MHP by its vendor contain details on the global ratings and composite scores.
DDeessccrriippttiioonn ooff DDaattaa OObbttaaiinneedd
For the CAHPS 2008 reporting year, which represents an evaluation of the 2007 measurement year (MY), the CAHPS 4.0H Adult Medicaid Health Plan Survey was used to obtain adult member satisfaction ratings for members meeting enrollment criteria in 2007. The CAHPS 3.0H Child Medicaid Health Plan Survey was not administered to the MHPs’ members during the 2008 reporting year. Therefore, child CAHPS results reported for 2008 actually reflect 2007 data.
DDaattaa AAggggrreeggaattiioonn,, AAnnaallyyssiiss,, aanndd HHooww CCoonncclluussiioonnss WWeerree DDrraawwnn
The CAHPS questions for both surveys were summarized by the CAHPS measures of satisfaction. These measures were calculated as described above and assigned to the domains of quality, timeliness, and access, as shown in Table 1-7.

2007-2008 MHP External Quality Review Technical Report Page 3-1 State of Michigan MI2007-8_PH-MHP_EQR-TR_F1_0209
33.. OOvveerraallll SSttaattee FFiinnddiinnggss
The following section presents findings for the EQR activities of compliance reviews, validation of performance measures, validation of performance improvement projects, and CAHPS for the two reporting periods of 2006–2007 and 2007–2008.
Appendices A–M present additional details about the results of the plan-specific EQR activities.
AAnnnnuuaall CCoommpplliiaannccee RReevviieeww
MDCH conducted annual compliance reviews of the MHPs in 2006–2007 and 2007–2008, assessing the MHPs’ compliance with contractual requirements in six areas: Administrative, Provider, Member, Quality/Utilization, MIS/Data Reporting/Claims Processing, and Fraud and Abuse.
Table 3-1 presents the results of the two annual compliance reviews. As discussed in Section 2, the results from the two annual compliance reviews are not fully comparable due to changes to the review tool and scoring methodology. For each of the six standards, the table shows the range of scores across all MHPs and the statewide averages for each of the standards.
Table 3-1—Summary of Data From the 2006–2007 and 2007–2008 Annual Compliance Reviews
Standard Range of Scores Statewide Average
2006–2007 2007–2008 2006–2007 2007–2008 Standard 1: Administrative 33%–100% 75%–100% 92% 98% Standard 2: Provider 73%–100% 78%–97% 90% 90% Standard 3: Member 71%–100% 91%–100% 87% 95% Standard 4: Quality/Utilization 83%–100% 86%–95% 92% 95% Standard 5: MIS/Data Reporting/Claims 40%–100% 60%–100% 71% 89% Standard 6: Fraud and Abuse 63%–100% 75%–98% 92% 95%
Overall 74%–98% 86%–98% 89% 93%
Overall, the MHPs demonstrated strong and mostly improved performance related to their compliance with contractual requirements assessed in the annual reviews. The 2007–2008 review resulted in higher statewide scores, as shown in the table below.
OOVVEERRAALLLL SSTTAATTEE FFIINNDDIINNGGSS
2007-2008 MHP External Quality Review Technical Report Page 3-2State of Michigan MI2007-8_PH-MHP_EQR-TR_F1_0209
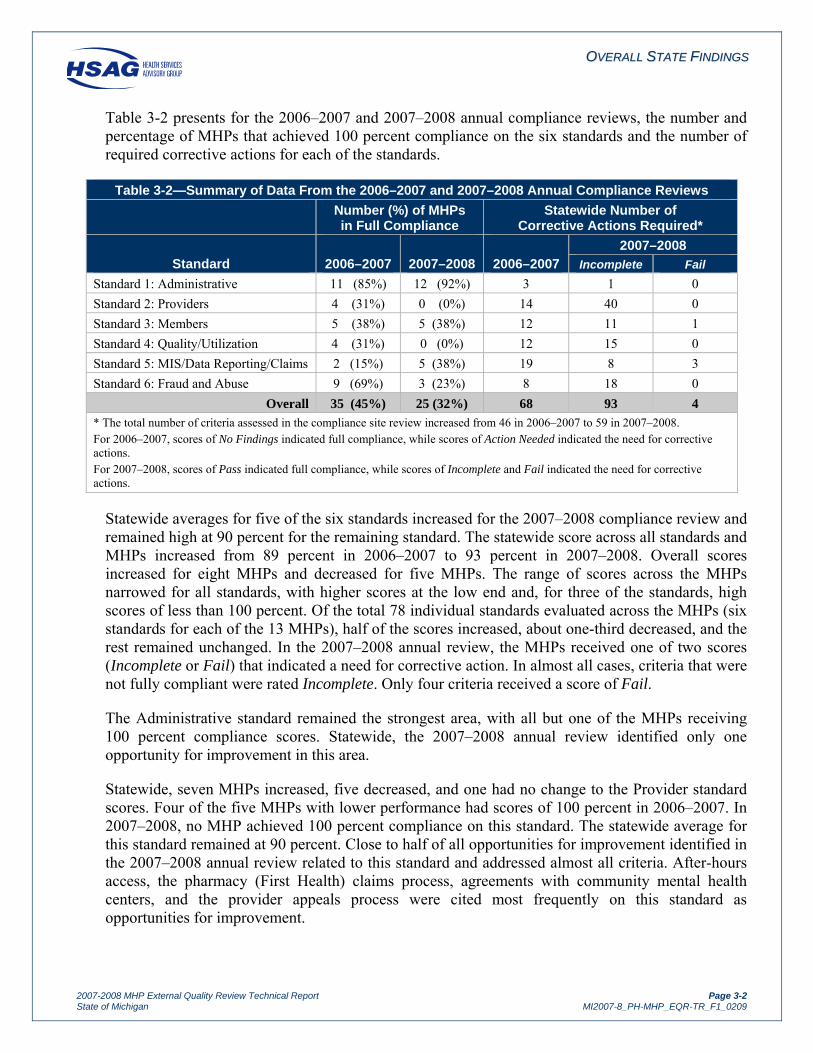
Table 3-2 presents for the 2006–2007 and 2007–2008 annual compliance reviews, the number and percentage of MHPs that achieved 100 percent compliance on the six standards and the number of required corrective actions for each of the standards.
Table 3-2—Summary of Data From the 2006–2007 and 2007–2008 Annual Compliance Reviews
Number (%) of MHPs in Full Compliance
Statewide Number of Corrective Actions Required*
Standard 2006–2007 2007–2008 2006–2007 2007–2008
Incomplete Fail Standard 1: Administrative 11 (85%) 12 (92%) 3 1 0 Standard 2: Providers 4 (31%) 0 (0%) 14 40 0 Standard 3: Members 5 (38%) 5 (38%) 12 11 1 Standard 4: Quality/Utilization 4 (31%) 0 (0%) 12 15 0 Standard 5: MIS/Data Reporting/Claims 2 (15%) 5 (38%) 19 8 3 Standard 6: Fraud and Abuse 9 (69%) 3 (23%) 8 18 0
Overall 35 (45%) 25 (32%) 68 93 4 * The total number of criteria assessed in the compliance site review increased from 46 in 2006–2007 to 59 in 2007–2008. For 2006–2007, scores of No Findings indicated full compliance, while scores of Action Needed indicated the need for corrective actions. For 2007–2008, scores of Pass indicated full compliance, while scores of Incomplete and Fail indicated the need for corrective actions.
Statewide averages for five of the six standards increased for the 2007–2008 compliance review and remained high at 90 percent for the remaining standard. The statewide score across all standards and MHPs increased from 89 percent in 2006–2007 to 93 percent in 2007–2008. Overall scores increased for eight MHPs and decreased for five MHPs. The range of scores across the MHPs narrowed for all standards, with higher scores at the low end and, for three of the standards, high scores of less than 100 percent. Of the total 78 individual standards evaluated across the MHPs (six standards for each of the 13 MHPs), half of the scores increased, about one-third decreased, and the rest remained unchanged. In the 2007–2008 annual review, the MHPs received one of two scores (Incomplete or Fail) that indicated a need for corrective action. In almost all cases, criteria that were not fully compliant were rated Incomplete. Only four criteria received a score of Fail.
The Administrative standard remained the strongest area, with all but one of the MHPs receiving 100 percent compliance scores. Statewide, the 2007–2008 annual review identified only one opportunity for improvement in this area.
Statewide, seven MHPs increased, five decreased, and one had no change to the Provider standard scores. Four of the five MHPs with lower performance had scores of 100 percent in 2006–2007. In 2007–2008, no MHP achieved 100 percent compliance on this standard. The statewide average for this standard remained at 90 percent. Close to half of all opportunities for improvement identified in the 2007–2008 annual review related to this standard and addressed almost all criteria. After-hours access, the pharmacy (First Health) claims process, agreements with community mental health centers, and the provider appeals process were cited most frequently on this standard as opportunities for improvement.

OOVVEERRAALLLL SSTTAATTEE FFIINNDDIINNGGSS
2007-2008 MHP External Quality Review Technical Report Page 3-3State of Michigan MI2007-8_PH-MHP_EQR-TR_F1_0209
Statewide average performance on the Member standard increased from 87 to 95 percent. Scores for eight MHPs increased for this standard, scores for three decreased, and scores for two did not change. The percentage of MHPs that achieved 100 percent compliance remained at about one-third of the plans. Most of the corrective actions identified in the 2007–2008 compliance review related to the member grievance and appeal policy and procedure. The criterion related to new member mailings received one of the four scores of Fail.
The statewide average for the Quality/Utilization standard increased slightly from 92 to 95 percent. Eight MHPs increased their scores and five MHPs saw a decrease. The percentage of MHPs that achieved 100 percent compliance on this standard dropped to none. Compliance with performance measure standards remained the primary area for improvement, with corrective actions required for all 13 MHPs in 2007–2008.
While the MIS/Data Reporting/Claims Processing standard remained the lowest scoring of the standards, with a statewide average of 71 percent in 2006–2007 and 89 percent in 2007–2008, the MHPs demonstrated marked improvement over the prior year’s performance. The number of MHPs that achieved 100 percent compliance increased from two MHPs in 2006–2007 to five in 2007–2008. Scores increased for ten MHPs (the largest number of increased scores of all the standards), decreased for two MHPs, and did not change for one MHP. Statewide, most of the corrective actions identified in the 2006–2007 review related to the timeliness of payments to providers for covered services rendered to beneficiaries, with three MHPs receiving a score of Fail and one receiving a score of Incomplete.
Even though the statewide score for the Fraud and Abuse standard increased from 92 to 95 percent, this standard showed the most MHPs with lower scores (8 of 13 MHPs). All of the declining scores were for MHPs that achieved 100 percent in 2006–2007. The total number of MHPs with 100 percent compliance fell from nine MHPs in 2006–2007 to three in 2007–2008. Four MHPs increased their scores and one MHP had no change in its score. While recommendations addressed most of the criteria on this standard, the criteria cited most frequently related to the MHPs providing contact information for reporting fraud and abuse and contractor attestations related to fraud and abuse policies and procedures.

OOVVEERRAALLLL SSTTAATTEE FFIINNDDIINNGGSS
2007-2008 MHP External Quality Review Technical Report Page 3-4State of Michigan MI2007-8_PH-MHP_EQR-TR_F1_0209
PPeerrffoorrmmaannccee MMeeaassuurreess
As set forth in 42 CFR 438.358, the primary objectives of the performance measure validation process are to evaluate the accuracy of the performance measure data collected by the MHP and determine the extent to which the specific performance measures calculated by the MHP (or on behalf of the MHP) followed the specifications established for each performance measure. To meet the two primary objectives of the validation activity, a thorough information system evaluation was performed to assess the ability of each MHP’s support system to report accurate HEDIS measures, as well as a measure-specific review of all reported measures.
Results from the validation of performance measures activities showed all 13 current MHPs receiving a finding of Report (i.e., appropriate processes, procedures, and corresponding documentation) for all assessed performance measures. The performance measure data were collected accurately from a wide variety of sources statewide. All of the MHPs demonstrated the ability to calculate and accurately report performance measures that complied with HEDIS specifications. This finding suggests that the information systems for reporting HEDIS measures are a statewide strength.
Table 3-3 shows each of the performance measures, the 2007 and 2008 rates for each measure, and the categorized performance for 2008 relative to national Medicaid results. For most of the measures, the 90th percentile indicates above-average performance ( ), the 25th percentile represents below-average performance ( ), and average performance falls between these two percentiles ( ). Because lower rates indicate better performance for two measures (i.e., Comprehensive Diabetes Care—Poor HbA1c Control and Well-Child Visits in the First 15 Months of Life—Zero Visits), their performance levels are based on a different set of percentiles—i.e., the 10th percentile (rather than the 90th percentile) is above-average performance and the 75th (rather than the 25th) shows below-average performance.

OOVVEERRAALLLL SSTTAATTEE FFIINNDDIINNGGSS
2007-2008 MHP External Quality Review Technical Report Page 3-5State of Michigan MI2007-8_PH-MHP_EQR-TR_F1_0209
Table 3-3—Overall Statewide Weighted Averages for Performance Measures
Performance Measure 2007 MI
Medicaid 2008 MI
Medicaid Performance Level for 2008
Pediatric Care Childhood Immunization Status—Combo 2 80.2% 81.9%
Childhood Immunization Status—Combo 3 62.3% 73.4%
Well-Child Visits in the First 15 Months of Life—Zero Visits* 1.5% 1.4%
Well-Child Visits in the First 15 Months of Life—Six or More Visits 59.3% 61.6%
Well-Child Visits in the Third, Fourth, Fifth, and Sixth Years of Life 66.1% 69.5%
Adolescent Well-Care Visits 47.7% 52.0%
Appropriate Treatment for Children With URI 77.1% 79.3%
Appropriate Testing for Children With Pharyngitis 45.0% 47.7%
Women’s Care Breast Cancer Screening—42 to 51 Years 46.4% 49.0%
Breast Cancer Screening—52 to 69 Years 56.6% 56.5%
Breast Cancer Screening—Combined Rate 51.2% 52.6%
Cervical Cancer Screening 67.1% 68.5%
Chlamydia Screening in Women—16 to 20 Years 53.3% 53.2%
Chlamydia Screening in Women—21 to 25 Years 61.0% 61.5%
Chlamydia Screening in Women—Combined Rate 56.6% 56.4%
Timeliness of Prenatal Care 83.2% 84.5%
Postpartum Care 61.6% 63.0%
Living with Illness Comprehensive Diabetes Care—HbA1c Testing 79.8% 84.6%
Comprehensive Diabetes Care—Poor HbA1c Control* 43.7% 38.4%
Comprehensive Diabetes Care—Good HbA1c Control 35.6% 39.6%
Comprehensive Diabetes Care—Eye Exam 57.5% 58.8%
Comprehensive Diabetes Care—LDL-C Screening 75.1% 76.8%
Comprehensive Diabetes Care—LDL-C Level <100 36.7% 40.0%
Comprehensive Diabetes Care—Medical Attention for Nephropathy 79.8% 80.7%
Comprehensive Diabetes Care—Blood Pressure Control (<130/80) 29.4% 28.6%
Comprehensive Diabetes Care—Blood Pressure Control (<140/90) 57.1% 58.4%
Use of Appropriate Medications for People With Asthma—5 to 9 Years 89.9% 90.6%
Use of Appropriate Medications for People With Asthma—10 to 17 Years 86.0% 87.3%
Use of Appropriate Medications for People With Asthma—18 to 56 Years 87.3% 86.3%
Use of Appropriate Medications for People With Asthma—Combined Rate 87.5% 87.5%
Controlling High Blood Pressure 51.9% 56.1%
Medical Assistance With Smoking Cessation— Advising Smokers to Quit 72.1% 72.8% †† Medical Assistance With Smoking Cessation— Discussing Smoking Cessation Strategies 38.1% 41.1% ††
* Lower rates are better for this measure. † National percentiles are not available for these measures.
= Below-average performance relative to national Medicaid results. = Average performance relative to national Medicaid results. = Above-average performance relative to national Medicaid results.

OOVVEERRAALLLL SSTTAATTEE FFIINNDDIINNGGSS
2007-2008 MHP External Quality Review Technical Report Page 3-6State of Michigan MI2007-8_PH-MHP_EQR-TR_F1_0209
Table 3-3—Overall Statewide Weighted Averages for Performance Measures
Performance Measure 2007 MI
Medicaid 2008 MI
Medicaid Performance Level for 2008
Access to Care Children’s Access to Primary Care Practitioners—12 to 24 Months 95.2% 95.6%
Children’s Access to Primary Care Practitioners—25 Months to 6 Years 82.7% 85.0%
Children’s Access to Primary Care Practitioners—7 to 11 Years 82.3% 83.9%
Adolescents’ Access to Primary Care Practitioners—12 to 19 Years 80.3% 82.1%
Adults’ Access to Preventive/Ambulatory Health Services—20 to 44 Years 80.2% 81.1%
Adults’ Access to Preventive/Ambulatory Health Services—45 to 64 Years 86.3% 86.8%
Adults’ Access to Preventive/Ambulatory Health Services—65 Years and Older 79.7% 76.3%
* Lower rates are better for this measure. † National percentiles are not available for these measures.
= Below-average performance relative to national Medicaid results. = Average performance relative to national Medicaid results. = Above-average performance relative to national Medicaid results.
Table 3-3 shows that the statewide average rates for 38 of the comparable performance measures were about average, falling between the national Medicaid HEDIS 2007 25th and 90th percentiles. None of the measures fell below the 25th percentile or above the 90th percentile.
From a quality improvement perspective, the 2008 average rates for 34 measures improved or remained the same compared to the MHPs’ 2007 performance. Childhood Immunization Status—Combo 3 had the largest improvement in its rate, increasing by 11.1 percentage points. This amount of improvement is a demonstrated strength.
The statewide average rates for six of the measures declined between 2007 and 2008: Breast Cancer Screening—52 to 69 Years, Chlamydia Screening in Women—16 to 20 Years, Chlamydia Screening in Women—Combined Rate, Comprehensive Diabetes Care—Blood Pressure Control (<130/80), Use of Appropriate Medications for People With Asthma—18 to 56 Years, and Adults’ Access to Preventive/Ambulatory Health Services—65 Years and Older. However, rates for first five measures declined only by 1 percentage point or less.

OOVVEERRAALLLL SSTTAATTEE FFIINNDDIINNGGSS
2007-2008 MHP External Quality Review Technical Report Page 3-7State of Michigan MI2007-8_PH-MHP_EQR-TR_F1_0209
Table 3-4 presents the number of MHPs with performance measure rates of below average, average, and above average for 2008.
Table 3-4—Distribution of MHP Performance Compared to National Medicaid Benchmarks
Performance Measure Number of Stars
Pediatric Care Childhood Immunization Status—Combo 2 0 10 3
Childhood Immunization Status—Combo 3 0 7 6
Well-Child Visits in the First 15 Months of Life—Zero Visits* 1 12 0
Well-Child Visits in the First 15 Months of Life—Six or More Visits 2 10 1
Well-Child Visits in the Third, Fourth, Fifth, and Sixth Years of Life 3 10 0
Adolescent Well-Care Visits 0 12 1
Appropriate Treatment for Children With URI 4 9 0
Appropriate Testing for Children With Pharyngitis 5 7 1
Women’s Care Breast Cancer Screening—42 to 51 Years 0 12 1 Breast Cancer Screening—52 to 69 Years 1 11 1 Breast Cancer Screening—Combined Rate 0 12 1 Cervical Cancer Screening 0 12 1 Chlamydia Screening in Women—16 to 20 Years 0 12 1 Chlamydia Screening in Women—21 to 25 Years 0 11 2 Chlamydia Screening in Women—Combined Rate 0 11 2 Timeliness of Prenatal Care 2 9 2 Postpartum Care 2 9 2 Living with Illness Comprehensive Diabetes Care—HbA1c Testing 0 11 2 Comprehensive Diabetes Care—Poor HbA1c Control* 0 10 3 Comprehensive Diabetes Care—Good HbA1c Control 0 6 7 Comprehensive Diabetes Care—Eye Exam 0 9 4 Comprehensive Diabetes Care—LDL-C Screening 0 11 2 Comprehensive Diabetes Care—LDL-C Level <100 0 12 1 Comprehensive Diabetes Care—Medical Attention for Nephropathy 0 11 2 Comprehensive Diabetes Care—Blood Pressure Control (<130/80) 2 10 1 Comprehensive Diabetes Care—Blood Pressure Control (<140/90) 2 8 3
* Lower rates indicate better performance.
= Below-average performance relative to national Medicaid results.
= Average performance relative to national Medicaid results.
= Above-average performance relative to national Medicaid results.

OOVVEERRAALLLL SSTTAATTEE FFIINNDDIINNGGSS
2007-2008 MHP External Quality Review Technical Report Page 3-8State of Michigan MI2007-8_PH-MHP_EQR-TR_F1_0209
Table 3-4—Distribution of MHP Performance Compared to National Medicaid Benchmarks
Performance Measure Number of Stars
Living with Illness (continued) Use of Appropriate Medications for People With Asthma—5 to 9 Years 5 6 2 Use of Appropriate Medications for People With Asthma—10 to 17 Years 5 6 2 Use of Appropriate Medications for People With Asthma—18 to 56 Years 2 11 0 Use of Appropriate Medications for People With Asthma—Combined Rate 4 7 2 Controlling High Blood Pressure 0 11 2 Medical Assistance With Smoking Cessation— Advising Smokers to Quit † † † Medical Assistance With Smoking Cessation— Discussing Smoking Cessation Strategies
† † †
Access to Care Children’s Access to Primary Care Practitioners—12 to 24 Months 2 11 0 Children’s Access to Primary Care Practitioners—25 Months to 6 Years 5 8 0 Children’s Access to Primary Care Practitioners—7 to 11 Years 7 6 0 Adolescents’ Access to Primary Care Practitioners—12 to 19 Years 5 8 0 Adults’ Access to Preventive/Ambulatory Health Services—20 to 44 Years 0 12 1 Adults’ Access to Preventive/Ambulatory Health Services—45 to 64 Years 0 10 3 Adults’ Access to Preventive/Ambulatory Health Services—65 Years and Older1 0 3 0
Total 59 363 62 * Lower rates indicate better performance. † National percentiles are not available for these measures. 1 10 MHPs reported the rate with NA, resulting in only 3 MHPs be compared with the national percentiles.
= Below-average performance relative to national Medicaid results. = Average performance relative to national Medicaid results.
= Above-average performance relative to national Medicaid results.
Table 3-4 shows that 75 percent of all rates for the performance measures fell into the average range relative to national Medicaid results. While 13 percent of the rates indicated above-average performance, 12 percent of the rates fell below the national average. The above-average rates were more often in the Women’s Care and Living with Illness dimensions, whereas the below-average rates were mostly in the Pediatric Care and Access to Care dimensions.
Together with the previous findings, the results of the current validation of performance measures show statewide improvement that reflects above-average performance, overall, from a national perspective.

OOVVEERRAALLLL SSTTAATTEE FFIINNDDIINNGGSS
2007-2008 MHP External Quality Review Technical Report Page 3-9State of Michigan MI2007-8_PH-MHP_EQR-TR_F1_0209
PPeerrffoorrmmaannccee IImmpprroovveemmeenntt PPrroojjeeccttss ((PPIIPPss))
Table 3-5 presents a summary of the MHPs’ PIP validation status results. The PIPs submitted for validation addressed a new study topic, disparity in breast cancer or cervical cancer screening. For the 2007–2008 validation, 12 of the 13 PIPs (92 percent) received a validation status of Met. This represents a slight decline from the prior year’s results, when all 13 PIPs received a validation status of Met. None of the PIPs received a validation status of Not Met.
Table 3-5—MHP’s PIP Validation Status
Validation Status
Percent of PIPs 2006–2007 2007–2008
Met 100% 92%
Partially Met 0% 8%
Not Met 0% 0%
The following presents a summary of the validation results for the MHPs for each of the ten activities from the CMS protocol. The MHPs were in different stages of implementation of their new PIPs. Therefore, the number of MHPs evaluated for the activities varied. All but one of the MHPs completed Activities I through VIII, two progressed through Activity IX, and two completed Activities I trough X. In 2006–2007, all but one MHP completed all ten activities.
Table 3-6 shows the percentages of MHPs having completed the activity that met all of the evaluation or critical elements within each of the ten activities.
Table 3-6—Summary of Data From Validation of Performance Improvement Projects
Validation Activity
Percent Meeting all Elements/ Percent Meeting all Critical Elements
2006–2007 2007–2008
I. Appropriate Study Topic 100%/100% 100%/100% II. Clearly Defined, Answerable Study Question 100%/100% 92%/92% III. Clearly Defined Study Indicator 100%/100% 92%/92% IV. Correctly Identified Study Population 100%/100% 100%/100% V. Valid Sampling Techniques* 100%/100% 100%/100% VI. Accurate/Complete Data Collection 100%/100% 92%/92% VII. Appropriate Improvement Strategies 100%/100% 100%/100% VIII. Sufficient Data Analysis and Interpretation 83%/100% 92%/92% IX. Real Improvement Achieved 92%/NCE 25%/NCE X. Sustained Improvement 100%/NCE 50%/NCE NCE = No Critical Elements * This activity is assessed only for PIPs that conduct sampling.

OOVVEERRAALLLL SSTTAATTEE FFIINNDDIINNGGSS
2007-2008 MHP External Quality Review Technical Report Page 3-10State of Michigan MI2007-8_PH-MHP_EQR-TR_F1_0209
Validation findings for 2007–2008 reflect strong performance in Activities I through VIII. The MHPs demonstrated high levels of compliance with the requirements of the CMS PIP Protocol for activities related to the study topic, study question, study indicator, sampling techniques, data collection, improvement strategies, and data analysis and interpretation. The two MHPs that had received recommendations for improvement successfully addressed all but one of the recommendations from the 2006–2007 validation in their new PIP submissions. These MHPs implemented improvements to identify statistical differences between baseline and remeasurement data and identified factors that could threaten the validity of the study findings or affect the ability to compare the initial measurement with the remeasurement. The lack of statistically significant improvement in the study indicator was the one element that the MHP did not succeed in resolving in the new PIP. This also was the element that most frequently scored less than Met for all MHPs that progressed far enough in the study to assess the effect of the interventions. Across all 13 MHPs, the 2007–2008 validation identified nine PIPs that met all applicable evaluation and critical elements, three PIPs that failed to demonstrate compliance with one of the elements, and one PIP that did not meet the requirements for nine elements across several activities. For several of the PIPs, HSAG identified Points of Clarification to strengthen the studies.
While the MHPs varied in how far they progressed with the new study topic, overall, the MHPs demonstrated compliance with the requirements of the CMS protocol for conducting PIPs, giving high confidence in the study results.

OOVVEERRAALLLL SSTTAATTEE FFIINNDDIINNGGSS
2007-2008 MHP External Quality Review Technical Report Page 3-11State of Michigan MI2007-8_PH-MHP_EQR-TR_F1_0209
CCoonnssuummeerr AAsssseessssmmeenntt ooff HHeeaalltthhccaarree PPrroovviiddeerrss aanndd SSyysstteemmss ((CCAAHHPPSS))
Table 3-7 presents the detailed, statewide 2007 and 2008 CAHPS composite scores. The child CAHPS survey was not administered in 2008 due to the measure being rotated; therefore, only 2007 CAHPS results are presented.
Table 3-7—Detailed State Average Results for CAHPS Child and Adult Composite Scores
CAHPS Measure
Top-Box Percentage
Three-Point Mean Score Performance
Level for 2008 2007 2008 2007 2008 Child† Getting Needed Care 79.3% † 2.72 † † Getting Care Quickly 54.4% † 2.33 † † How Well Doctors Communicate 68.9% † 2.59 † † Courteous and Helpful Office Staff 72.6% † 2.64 † † Customer Service 72.1% † 2.65 † † Adult Getting Needed Care 50.6% 51.4% 2.28 2.29 Getting Care Quickly 56.5% 56.2% 2.38 2.38 How Well Doctors Communicate 66.5% 66.3% 2.52 2.51 Customer Service †† 59.3% †† 2.39 Shared Decision Making 58.8% 58.7% 2.49 2.48 — The top-box percentage indicates the percentage of responses of “Always,” “Definitely Yes,” or “Not a Problem.” Performance levels are based on a comparison to NCQA accreditation benchmarks and thresholds for the adult Medicaid population and to the distribution of NCQA national survey results for the child Medicaid population. † The child survey was not administered in 2008. The performance level for 2008 reflects 2007 data due to the measure being rotated
in 2008. †† Due to changes in the adult Customer Service composite, 2008 results are not comparable to 2007 results. — Benchmarks and thresholds were not published for the Shared Decision Making composite.
= Below-average performance (<25th percentile) relative to national Medicaid results = Average performance (≥25th to <75th percentile) relative to national Medicaid results = Above-average performance (≥ 75th percentile) relative to national Medicaid results
All five of the child CAHPS composite measures showed average performance from a national perspective: Getting Needed Care, Getting Care Quickly, How Well Doctors Communicate, Courteous and Helpful Office Staff, and Customer Service.
The top-box percentages showed improvement for one of the four comparable adult composite measures, Getting Needed Care. However, those composite measures that had a top-box percentage that declined—Getting Care Quickly, How Well Doctors Communicate, and Shared Decision Making—had scores that decreased by less than 1 percentage point.
From a current quality perspective, the statewide results showed average performance. Eight of the nine comparable composite measures scored between the 25th and 74th percentiles. None of the composite measures had a rate below the national 25th percentile, and one adult composite measure, Customer Service, scored at or above the national 75th percentile.

OOVVEERRAALLLL SSTTAATTEE FFIINNDDIINNGGSS
2007-2008 MHP External Quality Review Technical Report Page 3-12State of Michigan MI2007-8_PH-MHP_EQR-TR_F1_0209
Table 3-8 presents the detailed, statewide 2007 and 2008 CAHPS global ratings. The child CAHPS survey was not administered in 2008 due to the measure being rotated; therefore, only 2007 CAHPS results are presented.
Table 3-8—Detailed State Average Scores for CAHPS Child and Adult Global Ratings
CAHPS Measure
Top-Box Percentage
Three-Point Mean Score Performance
Level for 2008 2007 2008 2007 2008 Child† Rating of All Health Care 61.9% † 2.50 † † Rating of Personal Doctor 59.7% † 2.48 † † Rating of Specialist Seen Most Often 60.3% † 2.47 † † Rating of Health Plan 57.9% † 2.45 † † Adult Rating of All Health Care 45.4% 45.9% 2.21 2.22 Rating of Personal Doctor 59.2% 59.0% 2.42 2.40 Rating of Specialist Seen Most Often 59.4% 60.4% 2.43 2.44 Rating of Health Plan 50.6% 52.9% 2.30 2.33 The top-box percentage indicates the percentage of respondents rating 9 or 10 on a scale of 0 to 10. Performance levels are based on a comparison to NCQA accreditation benchmarks and thresholds for the adult Medicaid population and to the distribution of NCQA national survey results for the child Medicaid population. † The child survey was not administered in 2008. The performance level for 2008 reflects 2007 data due to the measure being rotated
in 2008. = Below-average performance (<25th percentile) relative to national Medicaid results. = Average performance (≥25th to <75th percentile) relative to national Medicaid results. = Above-average performance (≥ 75th percentile) relative to national Medicaid results.
Two of the four child CAHPS global ratings showed below-average performance from a national perspective. This finding suggests a statewide opportunity for improvement for Rating of All Health Care and Rating of Personal Doctor for child members.
For the adult population, three of the four top-box percentages increased: Rating of All Health Care, Rating of Specialist Seen Most Often, and Rating of Health Plan. However, the one measure that decreased, Rating of Personal Doctor, only decreased by 0.2 percent. All four of the adult global ratings showed average performance from a national perspective.
From a current quality perspective, the statewide results for the global ratings showed average performance. Six of the eight global ratings scored between the 25th and 74th percentiles. Two of the global ratings had a rate below the national 25th percentile; however, none of the measures scored at or above the 75th percentile.

OOVVEERRAALLLL SSTTAATTEE FFIINNDDIINNGGSS
2007-2008 MHP External Quality Review Technical Report Page 3-13State of Michigan MI2007-8_PH-MHP_EQR-TR_F1_0209
CCoonncclluussiioonnss//SSuummmmaarryy
The current review of the MHPs showed both strengths and opportunities for improvement statewide.
Results of the annual compliance reviews reflected strong and improved performance by the MHPs related to their compliance with contractual requirements that were assessed on the six standards. The MHPs continued to show the highest level of compliance on the Administrative standard, with all but one MHP in full compliance with the requirements. Statewide scores for five of the six standards increased and one remained unchanged compared to the 2006–2007 results. The number of statewide standard scores at or above 90 percent increased to five, indicating that almost all contractual requirements were met across the MHPs.
The MHPs demonstrated average performance across the performance measures compared with the national Medicaid HEDIS 2007 results. When compared with the 2007 Michigan statewide rates, 34 measures improved or remained at the same level of performance, with the largest improvement in Childhood Immunization Status—Combo 3, demonstrating a statewide strength.
The 2007–2008 validation of the PIPs reflected high levels of compliance with the requirements of the CMS PIP Protocol. The PIPs validated this year addressed a new topic; therefore, most MHPs did not complete all ten activities. Twelve of the 13 PIPs received a validation status of Met, and one PIP was rated Partially Met, indicating that the PIPs were designed in a methodologically sound manner, giving confidence that the PIPs will produce valid results.
Overall, the MHPs showed average performance across the composite and global rating measures. Only one measure for the adult population, Customer Service, showed above-average performance. Two of the measures for the child population, Rating of All Health Care and Rating of Personal Doctor, fell below average.


![Dl-reamer Technical Presentation External[2]](https://img.pdfslide.net/doc/110x75/577cb4901a28aba7118c8803/dl-reamer-technical-presentation-external2.jpg)