Embed Size (px)
Citation preview

BChydro mJoanna SofieldChief Regulatory OfficerPhone: (604) 623-4046Fax: (604) 623-4407bchydroregulatoryg rou [email protected]
December 12, 2008
Ms. Erica M. HamiltonCommission SecretaryBritish Columbia Utilities CommissionSixth Floor - 900 Howe StreetVancouver, BC V6Z 2N3
Dear Ms. Hamilton:
RE: Project No. 3698455British Columbia Utilities Commission (BCUC)British Columbia Hydro and Power Authority (BC Hydro)BC Hydro 2007 Rate Design Application (2007 RDA)BCUC Order No. G-10-08 Compliance Filing
Pursuant to BCUC Directive No.2 of the 2007 RDA Decision, BC Hydro is submitting anupdated Fully Allocated Cost of Service (FACOS) study reflecting F2008 actual results asAppendix A.
This compliance filing incorporates the directives in BCUC Order Nos. G-111-07 and G-10-08and uses the same methodology as the FACOS study submitted in the January 30,2008compliance filing with one minor change. In the previously filed studies, net transfers to theHeritage, Non-Heritage, Trade Income, and BCTC deferral accounts were relatively minor intotal and for simplicity had been assigned directly to the generation function. In this update thenet transfers to the BCTC deferral account ($10.9 million) were directly assigned to thetransmission function, with the net transfers to the Heritage, Non-Heritage and Trade Incomedeferral accounts ($107.4 million) unchanged in their assignment to the generation function.
Revenue-to-cost ratios for all rate classes as compared to the January 30, 2008 compliancefiling are as summarized below:
Revenue to Cost Ratios
Rate Class F08 Forecast F08 Actual Change(January 2008) (December 2008)
(%) (%) (%)Residential 90.1 91.8 1.7
GS < 35 kW 123.3 123.8 0.5
GS > 35 kW 106.8 106.2 -0.6
Irrigation 83.2 83.4 0.2
Street Lighting 124.9 125.0 0.1
Transmission 102.5 100.1 -2.4
Total 100.0 100.0
British Columbia Hydro and Power Authority, 333 Dunsmuir Street, Vancouver BC V6B 5R3www.bchydro.com

Page 2 of 2
December 16, 2008Ms. Erica M. HamiltonCommission SecretaryBritish Columbia Utilities CommissionBC Hydro 2007 Rate Design Application (2007 RDA)BCUC Order No. G-10-08 Compliance Filing
For further information, please contact Guy Leroux at 604-623-3696.
Yours sincerely,
Joanna SofieldChief Regulatory Officer
Enclosure (1)
BChydro "'au
c. BCUC Project No. 3698455 (2007 RDA) Registered Intervenor Distribution List.

Schedule
1.02.02.1
2.22.2a
2.33.03.13.2
4.04.15.0
5.1
5.25.3
F2008 Cost of Service - Actual Cost
Actual F2008 in Compliance with Order G-111-07 and G-10-08
Table of ContentsDescription
Functionalization Details
Classification of Generation FunctionClassification of Transmission Function
Removal of DirectAssign Costs from DistributionClassification of Distribution Function
Classification of Customer Care
Allocation of Generation to Rate ClassesAllocation of Transmission to Rate ClassesAllocation of Distribution to Rate ClassesSummary of Costs by FunctionSummary of Costs by Classification
Allocator by Energy
Allocator by 4 CP & NCP DemandAllocator by Customer, Bill and Revenue
Meter Replacement Cost
Page
2
34567
891011
1213141516
Note: All costs are in $ X 1 million unless otherwise noted.
F2008 Actual CostCost of Service
Appendix A
Page 1 of 16

Functionalization Summary· FOaActual Costs
Cost of Energy F2008 RevenueGeneration Transmission Distribution
CustomerRequirement Care
Revenue Requirement Schedule (FOBActual, Exhibit 8-64 FOg F10 RRA)
Sched 4, L 11 IPPg and Long-term Purchases commitment 480.0 480.0Sched 4, L 14 Domestic Transmission 75.7 75.7Schad 4, L 12 NIA Generation 21.7 21.7Sched 4, L 13 Gas Transportation 11.5 11.5Schad 4, L 1 Water Rentals 315.0 315.0Sched 4, L 3 Market Purchases 153.3 153.3Schad 4, L 5 Natural gas for thermal generation 49.1 49.1Sched 4, L 6 Domestic Transmission 15.7 4.8 10.9Sched4, L 7, 8 Other, and Surplus Sales (25.9) ~
Cost of Energy 1,096.0 1,009.4 86.6
o M & A Expenses
Sched 3.2, L 2 + Schad 3.4 L 33 Generation 131.7 131.7Schad 3.4, L 2 • Sched 3.4 L 33 Transmission 89.3 89.3Sched 3.3, L 2, Sched 3.5, L 2 Distribution 237.4 132.9 104.5Sched3.1,L2 Corp Service 98.3 28.2 19.1 ~ ~
OM&A 556.7 159.9 108.4 161.4 126.9
Depreciation & Amortization
Sched 7, L46 Generation 145.6 145.6DSM Adjustment for Depreciation
Sched 7, L 48 Transmission 99.1 99.1Sched 7, L 49, L 47 Distribution 84.6 93.3 (8.8)
Engineering
Field SelVices
Sched 7, L 45 Corporate SelVices 44.2 ~ ~ --11DAmortization 373.4 173.5 99.1 111.2 (10.5)
Taxes
Schad 6, L 6 Generation 33.9 33.9Sched 6, L 12 Transmission 94.4 94.4Sched 6, L 15 Distribution 22.2 22.2Sched 6, 19 Customer Care
Sched 6, l3 Corporate 8.1 ___ 4._9 ___ 3_._2
Taxes 158.6 38.8 94.4 25.4
Finance Charges
Sched 8, l67 Generation 209.1 209.1Sched 8, l69 Transmission 121.8 121.8Sched 8, L 70 Distribution 128.1 128.1Sched 8, L 68 Customer Care 0.5 ___ 0._5
Finance Charges 459.4 209.1 121.8 128.1 0.5
Allowed Net Income
Sched 9, l44 Generation 167.9 167.9Sched 9, l46 Transmission 97.8 97.8Sched 9, l47 Distribution 102.9 102.9Sched 9, l45 Customer Care 0.4 ___ 0._4
Allowed Net Income 369.0 167.9 97.8 102.9 0.4
Miscellaneous Revenues
Sched 15, l8, 17, 18, 13 Non Tariff Revenue (Functionalized) (26.7) (3.0) (12.0) (2.0) (9.7)Sched 15, l4 Corporate Miscellaneous Revenue (4.7) -----.llQ) ~ ~
Miscellaneous Revenues (31.4) (4.0) (12.0) (2.6) (12.8)
Deferral Accounts, Revenue Offsets and Other
Sched 1, l19 Subsidiary Net Income (83.2) (83.2)Sched 2.1 Def Accout Additions 96.3 107.2 (10.9)Sched 2.2, l 78, 79, 80 Def Account Net Recovery 0.2 0.2Sched 14, L 17 Other Utility Revenue (15.4) (15.4)Sched 3, l24 Intersegment revenues (194.4) (140.0) (54.4)
Sched 3.4, L 11 (l9, L10) Internal Allocations (GRTA, SDA) ~ (62.8) ~Def Accounts, Offsets and Other (196.4) (93.2) (128.0) 24.9
Total Revenue Requirement 2,785.5 1,661.5 468.1 551.3 104.6
Schedule 1.0 F2008 Actual Cost
Cost of Service
Appendix A
Page 2 of 16

Classification of the Generation Function - FOa Actual
Cost of Energy Total Gen Demand Energy Demand Energy Comments
IPPs and Long-term Purchases commitment 479.97 0.00% 100.00% 479.97Domestic Transmission 0.00% 100.00%
NIA Generation 21.68 0.00% 100.00% 21.68Gas Transportation 11.46 0.00% 100.00% 11.46
Water Rentals 315.00 10.00% 90.00% 31.50 283.50 Based on Water Rental RateMarket Purchases 153.34 0.00% 100.00% 153.34Natural gas for thermal generation 49.10 0.00% 100.00% 49.10Domestic Transmission 4.80 100.00% 0.00% 4.80
Other, and Surplus Sales (25.90) 0.00% 100.pO% (25.90)
Cost 01 Energy 1,009.44 36.30 973.14
o M & A Expenses
Generation 131.70 57.90% 42.10% 76.26 55.44 Generation Gross Plant in ServiceTransmission 0.00% 0.00%
Distribution 0.00% 0.00%Corp Service 28.24 57.90% 42.10% 16.35 11.89
OM&A 159.94 92.61 67.33
Depreciation & Amortization
Generation 145.56 57.90% 42.10% 84.28 61.28 Generation Gross Plant in ServiceTransmission 0.00% 0.00%Distribution 0.00% 0.00%Engineering 57.90% 42.10%Field Services 57.90% 42.10%
Corporate Services 27.96 57.90% 42.10% 16.19 11.77
Amortization 173.52 100.47 73.05
Taxes
Generation 33.92 57.90% 42.10% 19.64 14.28 Generation Gross Plant in ServiceTransmission 0.00% 0.00%Distribution 0.00% 0.00%Customer Care 57.90% 42.10%
Corporate 4.89 57.90% 42.10% 2.83 2.06
Taxes 38.81 22.47 16.34
Finance Charges
Generation 209.08 56.70% 43.30% 118.54 90.54 Generation Net Plant in ServiceTransmission 0.00% 0.00%Distribution 0.00% 0.00%
Customer Care 56.70% 43.30%
Finance Charges . 209.08 118.54 90.54
Allowed Net Income
Generation 167.94 56.70% 43.30% 95.22 72.72 Generation Net Plant in ServiceTransmission 0.00% 0.00%
Distribution 0.00% 0.00%
Customer Care 0.00% 0.00%
Allowed Net Income 167.94 95.22 72.72
Miscellaneous Revenues
Non Tariff Revenue (Functionalized) (3.00) 57.90% 42.10% (1.74) (1.26) Generation GrasS Plant in Service
Corporate Miscellaneous Revenue (0.96) 57.90% 42.10% (0.56) (0.40)
Miscellaneous Revenues (3.96) (2.29) (1.67)
Deferral Accounts, Revenue Offsets and Other
Subsidiary Net Income (83.20) 26.22% 73.78% (21.82) (61.38)
Oef Accout Additions 107.20 57.90% 42.10% 62.07 45.13 Generation Gross Plant in ServiceOef Account Net Recovery 0.20 57.90% 42.10% 0.12 0.08
Other Utility Revenue (15.35) 57.90% 42.10% (8.89) (6.46)
lntersegment revenues (139.98) 57.90% 42.10% (81.05) (58.93)
Internal Allocations (GRTA, SDA) 37.90 57.90% 42.10% 21.94 15.96
Oef Accounts, Offsets and Other (93.23) (27.63) (65.61)
Generation Revenue Requirement 1,661.54 435.69 1,225.85
26.22% 73.78%
Schedule 2.0 F2008 Actual Cost
Cost of Service
Appendix A
Page 3 of 16
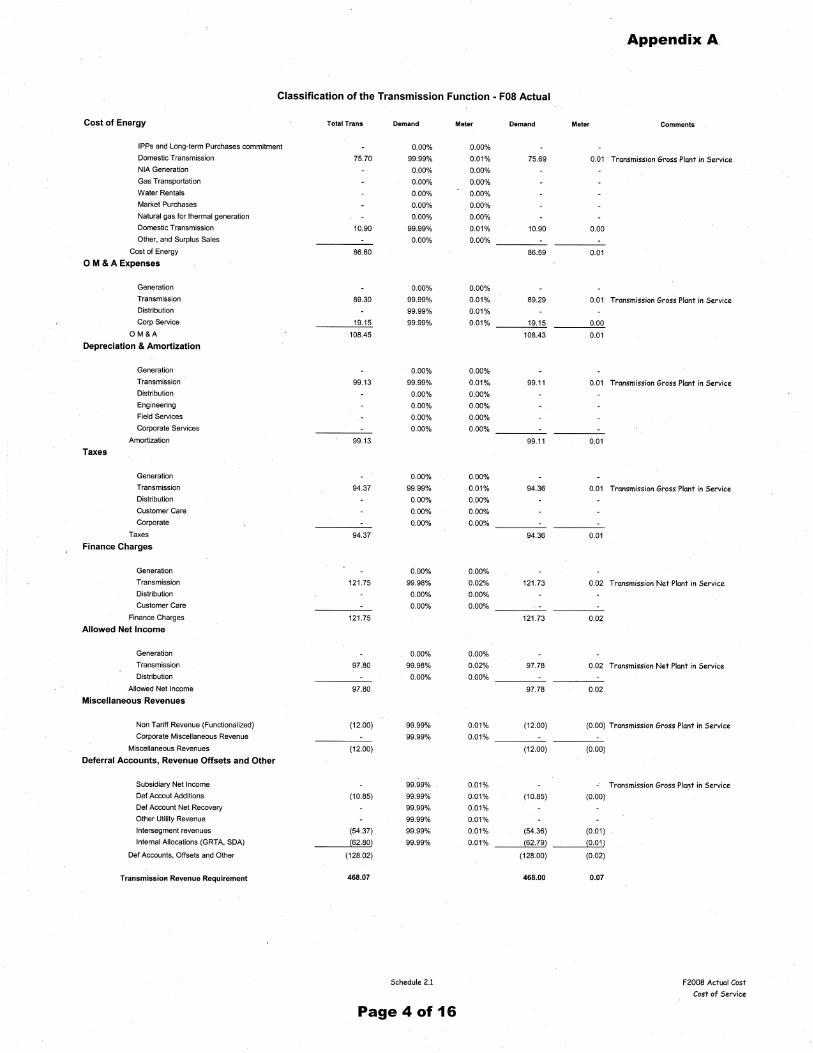
Classification of the Transmission Function - FOB Actual
Cost of Energy Total Trans Demand Meter Demand Meter Comments
IPPs and Long-term Purchases commitment 0.00% 0.00%Domestic Transmission 75.70 99.99% 0.01% 75.69 0.01 Transmission Gross Plant in ServiceNIA Generation 0.00% 0.00%Gas Transportation 0.00% 0.00%Water Rentals 0.00% 0.00%Market Purchases 0.00% 0.00%Natural gas for thermal generation 0.00% 0.00%Domestic Transmission 10.90 99.99% 0.01% 10.90 0.00Other, and Surplus Sales 0.00% 0.00%
Cost of Energy 86.60 86.59 0.01
o M & A Expenses
Generation 0.00% 0.00%Transmission 89.30 99.99% 0.01% 89.29 0.01 Transmission Gross Plant in ServiceDistribution 99.99% 0.01%Corp Service 19.15 99.99% 0.01% 19.15 0.00
OM&A 108.45 108.43 0.01
Depreciation & Amortization
Generation 0.00% 0.00%Transmission 99.13 99.99% 0.01% 99.11 0.01 Transmission Gross Plant in ServiceDistribution 0.00% 0.00%Engineering 0.00% 0.00%Field Services 0.00% 0.00%Corporate Services 0.00% 0.00%
Amortization 99.13 99.11 0.01
Taxes
Generation 0.00% 0.00%Transmission 94.37 99.99% 0.01% 94.36 0.01 Transmission Gross'Plant in ServiceDistribution 0.00% 0.00%Customer Care 0.00% 0.00%Corporate 0.00% 0.00%
Taxes 94.37 94.36 0.01
Finance Charges
Generation 0.00% 0.00%Transmission 121.75 99.98% 0.02% 121.73 0.02 Transmission Net Plant in ServiceDistribution 0.00% 0.00%Customer Care 0.00% 0.00%
Finance Charges 121.75 121.73 0.02
Allowed Net Income
Generation 0.00% 0.00%Transmission 97.80 99.98% 0.02% 97.78 0.02 Transmission Net Plant in ServiceDistribution 0.00% 0.00%
Allowed Net Income 97.80 97.78 0.02
Miscellaneous Revenues
Non Tariff Revenue (Functionalized) (12.00) 99.99% 0.01% (12.00) (0.00) Transmission Gross Plant in ServiceCorporate Miscellaneous Revenue 99.99% 0.01%
Miscellaneous Revenues (12.00) (12.00) (0.00)
Deferral Accounts, Revenue Offsets and Other
Subsidiary Net Income 99.99% 0.01% Transmission Gross Plant in ServiceDef Accout Additions (10.85) 99.99% 0.01% (10.85) (0.00)Def Account Net Recovery 99.99% 0.01%Other Utility Revenue 99.99% 0.01%Intersegment revenues (54.37) 99.99% 0.01% (54.36) (0.01)Internal Allocations (GRTA, SDA) (62.80) 99.99% 0.01% (62.79) (0.01)
Oef Accounts, Offsets and Other (128.02) (128.00) (0.02)
TransmissioR Revenue Requirement 468.07 468.00 0.07
Schedule 2.1 F200B Actuol Cost
Cost of Service
Appendix A
Page 4 of 16

Appendix A
Page 5 of 16

Classification of the Distribution Function (with out Direct Assign) • FOBActual
DistributionDistribution
DistributionDistribution
Cost of Energy DistCostsDemand Related
CustomerDemand Related
CustomerRelated Related
IPPs and Longwterm Purchases commitment 65% 35%
Domestic Transmission 65% 35%
NIA Generation 65% 35%
Gas Transportation 65% 35%
Water Rentals 65% 35%
Market Purchases 65% 35%
Natural gas for thermal generation 65% 35%
Domestic Transmission 65% 35%
Other, and Surplus Sates §§% ~%Cost of Energy
o M & A Expenses
Generation 65% 35%
Transmission 65% 35%
Distribution 129.90 65% 35% 84.44 45.47
Corp Service 28.22 65% 35% 18.34 9.88
OM&A 158.12 102.78 55.34
Depreciation & Amortization
Generation 65% 35%
DSM Adjustment for Depreciation 65% 35%
Transmission 65% 35%
Distrib'ution 92.53 65% 35% 60.14 32.39
Engineering 65% 35%
Field Services 65% 35%
Corporate Services 17.92 65% 35% 11.65 6.27
Amortization 110.45 71.79 38.66
Taxes
Generation 65% 35%
Transmission 65% 35%
Distribution 22.07 65% 35% 14.35 7.73
Customer Care 65% 35%
Corporate 3.20 ~% ~% 2.08 1.12
Taxes 25.27 16.42 8.84
Finance Charges65% 35%
Generation 65% 35%
Transmission 65% 35%
Distribution 127.37 65% 35% 82.79 44.58
Customer Care 65% 35%
Finance Charges 127.37 82.79 44.58
Allowed Net Income
Generation 65% 35%
Transmission 65% 35%
Distribution 102.25 65% 35% 66.47 35.79
Customer Care 65% 35%
Allowed Net Income 102.25 66.47 35.79
Miscellaneous Revenues
Non Tariff Revenue (Functionalized) (2.00) 65% 35% (1.30) (0.70)
Corporate Miscellaneous Revenue (0.64) 65% 35% (0.42) (022)
Miscellaneous Revenues (2.64) (1.72) (0.92)
Deferral Accounts, Revenue Offsets and Other
Subsidiary Net Income 65% 35%
Def Accout Additions 65% 35%
Def Account Net Recovery 65% 35%
Other Utility Revenue 65% 35%
Intersegment revenues 65% 35%
Internal Allocations (GRTA, SDA) 24.90 ~% ~% 16.19 8.72
Def Accounts, Offsets and Other 24.90 16.19 8.72
Total Revenue Requirement 545.73 354.72 191.01
Schedule 2.2a F2008 Actual Cost
Cost of Service
Appendix A
Page 6 of 16

Classification of the Customer Care Function· FOaActual
Cost of Energy
IPPs and Long-term Purchases commitment
Domestic Transmission
NIA Generation
Gas Transportation
Water Rentals
Market Purchases
Natural gas for thermal generation
Domestic TransmissionOther, and Surplus Sales
Cost of Energy
o M & A Expenses
CustomerCustomer Care Demand
Related
65%
65%
65%
65%
65%
65%
65%
65%
~%
Cust-Customer
Related
35%
35%
35%
35%
35%
35%
35%
35%
~%
Demand
Related
Costs
Customer
Related
Costs
Generation
TransmissionDistribution
Corp Service
OM&A
Depreciation & Amortization
Generation
TransmissionDistribution
Engineering
Field Services
Corporate Services
Amortization
Taxes
Generation
TransmissionDistribution
Customer Care
Corporate
Taxes
Finance Charges
Generation
TransmissionDistribution
Customer Care
Finance Charges
Allowed Net Income
Generation
Distribution
Customer Care
Allowed Net Income
Miscellaneous Revenues
Non Tariff Revenue (Functionalized)
Corporate Miscellaneous Revenue
Miscellaneous Revenues
Deferral Accounts, Revenue Offsets and Other
Subsidiary Net Income
Other Utility Revenue
Intersegment revenues
Internal Allocations (GRTA, SDA)
Del Accounts, Offsets and Other
Customer Care Revenue Requirement
Schedule 2.3
65% 35%
65% 35%
104.50 65% 35% 67.93 36.58
22.41 65% 35% ~ ~126.91 82.49 44.42
65% 35%
65% 35%
(8.77) 65% 35% (5.70) (3.07)
65% 35%
65% 35%
(1.68) 65% 35% ---L!:Q§!) ~(10.45) (6.79) (3.66)
65% 35%
65% 35%
65% 35%
65% 35%
~% ~%
65% 35%
65% 35%
65% 35%
0.51 65% 35% ~ 0.18
0.51 0.33 0.18
65% 35%
65% 35%
0.41 65% 35% 0.27 0.14
0.41 0.27 0.14
(9.70) 65% 35% (6.31) (3.40)
(3.10) 65% 35% ~ ---L!:Q§!)(12.80) (8.32) (4.48)
65% 35%
65% 35%
65% 35%
~% ~%
104.58 67.98 36.60
F2008 Actual Cost
Cost of Servi ce
Appendix A
Page 7 of 16

Allocation- of Classified Generation Costs to Rate Classes - FOB Actual
414.95
94.67
336.56
1.76
4.99
372.91
1,225.85
1,225.85
Generation EnergyRelatedCosts(Sched 2.0)
194.45 33.85%
33.16 7.72%
108.81 27.46%
0.00 0.14%
1.90 0.41%
97.37 30.42%
435.69 100.0%
435.69
GenerationGeneration Demand Generation EnergyRelated Costs(Sched 2.0)
100.0%
44.63%
7.61%
24.97%
0.00%
0.44%
22.35%
Total
Residential
GS<35
GS>35
Irrigation
Street Lighting
Transmission
Schedule 3.0 F2008 Actual Cost
Cost of Service
Appendix A
Page 8 of 16

Allocation of Classified Transmission Costs to Rate Classes - FOBActual
TransmissionDemand Related Transmission MeterCosts (Sched 2.1)
468.00
Transmission MeterRelated Costs (Sched
2.1)
0.07
Residential 44.63% 208.87 0.00% 0.00
GS<35 7.61% 35.61 0.00% 0.00
GS>35 24.97% 116.88 14.85% 0.01
Irrigation 0.00% 0.00 0.00% 0.00
Street Lighting 0.44% 2.04 0.00% 0.00
Transmission 22.35% 104.59 85.15% 0.06
Total 100.0% 468.00 100.0% 0.07
Schedule 3.1 F2008 Actual Cost
Cost of Service
Appendix A
Page 9 of 16

AllocationofClassifiedDistributionandCustomerCareCoststoRateClasses-FOaActual
Function
Distribution
includingDirectlyAssignedStreetLi
CostClasses
Distribution
Distribution
Distribution
StreetLight
StreetLight
StreetLight
StreetLightICustomerCareICustomerCareICustomerCareICustomer
Demand
Customer
Customer
Demand
Demand
Customer
Customer
Demand
DemandRelated
Customer
Care
Related
Related
Related
Related
RelatedCosts
RelatedCosts
Costs
Customer
(Sched2.2a)
(Sched2.2a)
Related
Costs
(Sched2.3)
Residential
55.29%
196.14
88.27%
168.61
0.00%
0.00
0.00%
0.00
55.29%
37.59
82.19%
30.08
GS<35
10.71%
37.99
9.67%
1847
0.00%
0.00
0.00%
0.00
10.71%
7.28
9.58%
3.51
GS>35
32.91%
116.75
1.31%
249
0.00%
0.00
0.00%
0.00
32.91%
22.37
5.00%
1.83
Irrigation
0.44%
1.56
0.19%
0.36
0.00%
0.00
0.00%
0.00
0.44%
0.30
0.07%
0.02
StreetLighting
0.64%
2.27
0.56%
1.08
100.00%
3.61
100.00%
1.95
0.64%
0.44
1.08%
040
Transm
ission
0.00%
0.00
0.00%
0.00
0.00%
0.00
0.00%
0.00
0.00%
0.00
208%
0.76
Total
100.0%
354.72
100.0%
191.01
100.0%
3.61
100.0%
1.95
100.0%
67.98
100.0%
36.60
Schedule3.2
F2008ActualCost
CostofService
Appendix A
Page 10 of 16

Summary of Costs by Function by Rate Glass - FOBActual
Rate Class
Summary of Costs by Function ($ X million) - All BCUCDirectives IncorporatedGeneration Transmission Distribution F08 Total F08 Actual Revenue - Rev/Cost
Costs Costs Costs Cost Revenue Cost Ratio($ million) ($ million) ($ million)
Residential 609.4 208.9 432.4 1,250.7 1,147.9 -102.8 91.8%
GS<35 127.8 35.6 67.2 230.7 285.5 54.8 123.8%
GS>35 445.4 116.9 143.5 705.7 749.3 43.6 106.2%
Irrigation 1.8 0.0 2.3 4.0 3.3 -0.7 83.4%
Street Lighting 6.9 2.0 9.7 18.7 23.3 4.7 125.0%
Transmission 470.3 104.7 0.8 575.7 576.1 0.4 100.1%
Total Classes 1,661.5 468.1 655.9 2,785.5 2,785.5 0.1 100.0%
Schedule 4.0 F2008 Actual Cost
Cost of Service
Appendix A
Page 11 of 16
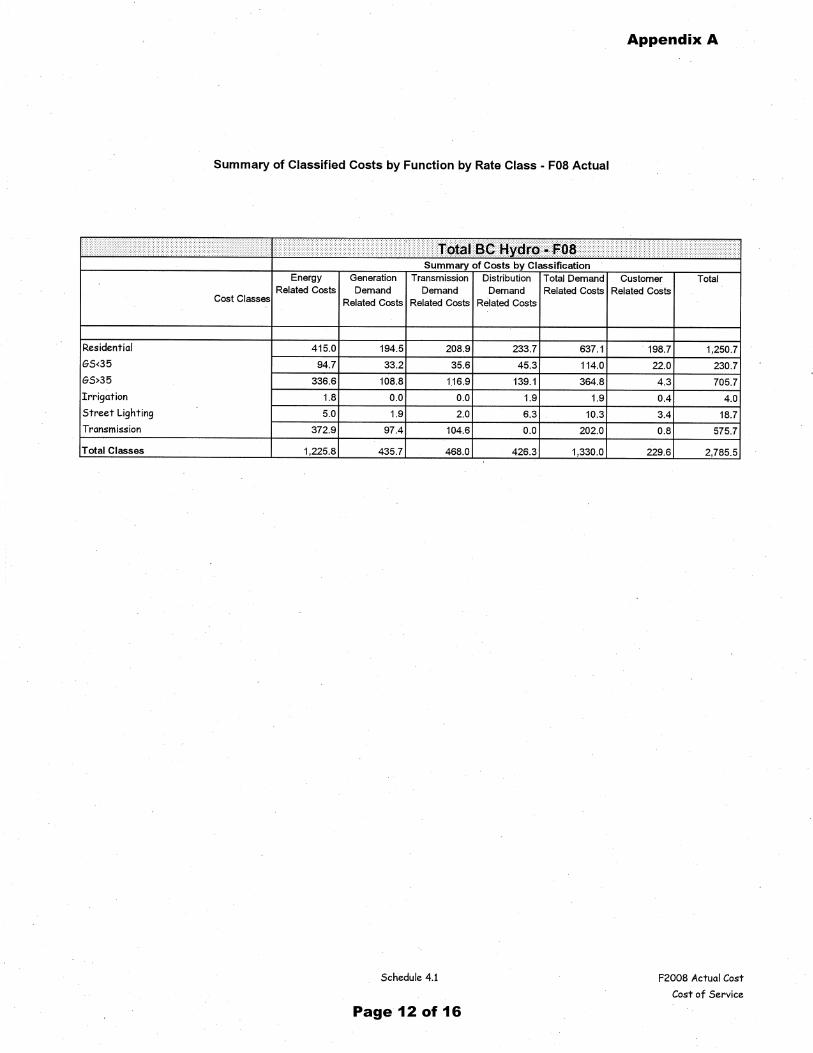
Summary of Classified Costs by Function by Rate Class - FOBActual
Summary of Costs by ClassificationEnergy Generation Transmission Distribution Total Demand Customer Total
Related Costs Demand Demand Demand Related Costs Related CostsCost Classes Related Costs Related Costs Related Costs
Residential 415.0 194.5 208.9 233.7 637.1 198.7 1,250.7GS<35 94.7 33.2 35.6 45.3 114.0 22.0 230.7GS>35 336.6 108.8 116.9 139.1 364.8 4.3 705.7Irrigation 1.8 0.0 0.0 1.9 1.9 0.4 4.0Street Lighting 5.0 1.9 2.0 6.3 10.3 3.4 18.7Transmission 372.9 97.4 104.6 0.0 202.0 0.8 575.7
Total Classes 1,225.8 435.7 468.0 426.3 1,330.0 229.6 2,785.5
Schedule 4.1 F2008 Actual Cost
Cost of Service
Appendix A
Page 12 of 16

Energy Allocators for Cost Allocation to Rate Classes - FOBActual
(MWh) (MWh) (MWh)
Residential 17,553,273 6.00% 18,606,469 6.00% 19,722,858GS Under 35 kW 4,004,810 6.00% 4,245,099 6.00% 4,499,805GS Over 35 kW Secondary 6,692,564 6.00% 7,094,118 6.00% 7,519,765GS Over 35 kW Primary 7,731,066 3.44% 7,997,014 6.00% 8,476,835Irrigation 74,597 6.00% 79,073 6.00% 83,817Street Lighting 211,149 ,6.00% 223,818 6.00% 237,247Transmission 16,720,980 0.00% 16,720,980 6.00% 17,724,239Total 52,988,439 54,966,571 58,264,566
(MWh)
ResidentialGS Under 35 kWGS Over 35 kWIrrigationStreet LightingTransmission
19,722,8584,499,80515,996,600
83,817237,247
17,724,239
58,264,566
33.85%7.72%27.46%0.14%0.41%30.42%
100.00%
Schedule 5.0 F2008 Actual CostCost of Service
Appendix A
Page 13 of 16

Demand Allocators - FOBActual
ResidentialGS<35GS>35IrrigationStreet LightingTransmissionTotal Integrated Area
Schedule 5.1
44.63%7.61%24.97%0.00%0.44%22.35%100.00%
55.29%10.71%32.91%0.44%0.64%0.00%
100.00%
F2008 Actual Cost
Cost of Service
Appendix A
Page 14 of 16

Customer Allocators - FOa Actual
Actual Number of# of bills sent # of bills sent # of BillsRate Class.
Accounts F08per account to rate class
Allocatoreach year each year
Residential 1,567,350 6 9,404,100 86.74%GS Under 35 kW 171,673 6 1,030,038 9.50%GS Over 35 kW 23,210 12 278,520 2.57%Irrigation 3,303 2 6,606 0.06%Street Lighting 10,015 12 120,180 1.11%Transmission 153 12 1,836 0.02%
TOTAL 1,775,704 10,841,280 100.00%
Actual Customer Distribution DistributionRate Class Count Customer Customer
F08 Count Allocator
Residential 1,567,350 1,567,350 88.27%GS<35 171,673 171,673 9.67%GS>35 23,210 23,177 1.31%Irrigation 3,303 3,354 0.19%Street Lighting 10,015 10,015 0.56%Transmission 153 0.00%TOTAL 1,775,704 1,775,569 100.00%
Rate Class Actual Revenue RevenueF08 Allocator
Residential 1,147.9 41.21%GS<35 285.5 10.25%GS>35 749.3 26.90%Irrigation 3.3 0.12%Street Lighting 23.3- 0.84%Transmission 576.1 20.68%TOTAL 2,785.5 100.00%
Weighting of # Weighting of BlendedRate Class of Bills Revenue Customer Care
Allocator Allocator Allocator90% 10%
Residential 78.1% 4.1% 82.19%GS<35 8.6% 1.0% 9.58%GS>35 2.3% 2.7% 5.00%Irrigation 0.1% 0.0% ·0.07%Street Lights 1.0% 0.1% 1.08%Transmission 0.0% 2.1% 2.08%TOTAL 100.00%
Schedule 5.2 f2008 Actual Cost
Cost of Service
Appendix A
Page 15 of 16
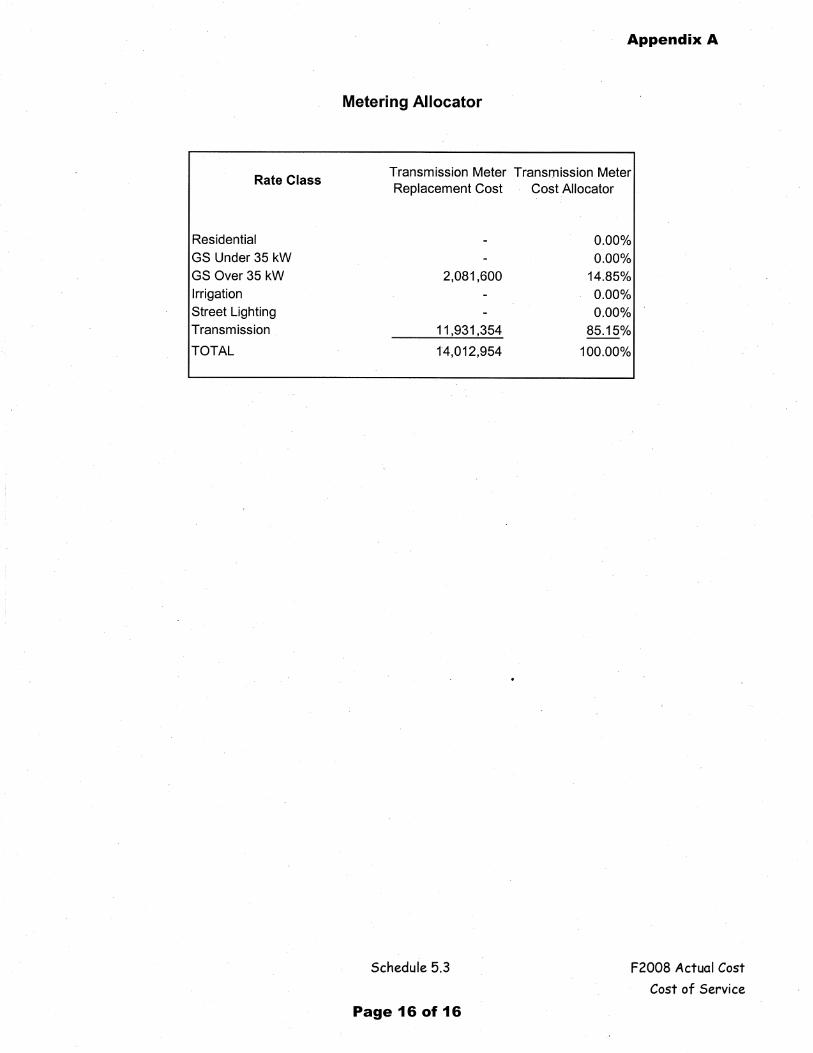
Rate Class
Metering Allocator
Transmission Meter Transmission MeterReplacement Cost Cost Allocator
ResidentialGS Under 35 kWGS Over 35 kWIrrigationStreet LightingTransmission
TOTAL
2,081,600
11,931,354
14,012,954
Schedule 5.3
0.00%0.00%14.85%0.00%0.00%85.15%
100.00%
F2008 Actual CostCost of Service
Appendix A
Page 16 of 16