Embed Size (px)
Citation preview
1
2008 ANNUAL REPORTNEW YORK STATE
THRUWAY AUTHORITY /CANAL CORPORATION
I. THRUWAY AUTHORITY
The Thruway Authority (“Authority”) is a public corporation organized and existing pursuant to Article 2, Title 9 of the New York State Public Authorities Law for the purpose of financing, constructing, reconstructing, improving, developing, maintaining and operating a highway system known as the Governor Thomas E. Dewey Thruway. The powers of the Authority are vested in and exercised by a seven-member Board appointed by the Governor and confirmed by the State Senate.
The Thruway is a 570-mile superhighway system crossing the State. It is the longest toll superhighway system in the United States. The Thruway route from the New York City line to the Pennsylvania line at Ripley is 496 miles long and includes the 426-mile mainline connecting the State’s two largest cities, New York City and Buffalo. Other Thruway sections make direct connections with the Connecticut and Massachusetts Turnpikes, New Jersey Garden State Parkway and other major expressways that lead to New England, Canada, the Midwest and the South. In 1991, the Cross-Westchester Expressway and in 1992, I-84 were added to the Thruway System. The Authority operated and maintained I-84 through October 2007 at the Authority’s expense. In October 2007, the Authority returned responsibility for I-84 to the New York State Department of Transportation (“NYSDOT”). However, pursuant to an agreement between the Authority and NYSDOT, the Authority currently continues to perform operation and maintenance of I-84 on behalf of NYSDOT at NYSDOT’s expense. In all, the Thruway (without I-84) is comprised of 2,818 lane miles of roadway, 806 bridges, more than 350 office and maintenance buildings, 27 travel plazas, 275 toll booths, nearly 120 water services, 18 water waste treatment plants and 26 motor fueling stations for Authority vehicles and equipment. Operationally, the Authority is segmented into four regional divisions – Albany, Buffalo, Syracuse and Suffern (referred to as New York Division) – with Administrative Headquarters located in Albany.
In 1992, legislation was enacted that transferred jurisdiction over the New York State Canal System from the NYSDOT to the Authority. This legislation also created the New York State Canal Corporation (“Corporation”), a subsidiary of the Authority, charged with operating, maintaining, constructing, reconstructing, improving, developing, financing and promoting the Canal System. This System consists of 524 miles of connected, navigable waterways encompassing: the Erie Canal (338 miles, east to west), the Champlain Canal (60 miles, south to north), the Oswego Canal (24 miles south-east to north-west, between Lake Ontario and the Erie Canal), and the Cayuga-Seneca Canal (12 miles, south-west to north-east linking the Erie Canal with Cayuga and Seneca Lakes). There are also 90 miles of navigable channel through Cayuga Lake to Ithaca and Seneca Lake to Watkins Glen, respectively. Comprised of both “canalized” natural rivers and dug channel, the Canal System’s 57 locks and 16 lift bridges facilitate navigation as part of a larger network of navigable waterways in New York State extending south to Florida, north to Canada, and west to the Great Lakes and the Mississippi River.
A. Capital Program
The Authority is in the midst of delivering its $2.1 billion multi-year highway and bridge Capital Program which will enable the Authority to rehabilitate or resurface nearly 500 lane miles, replace, rehabilitate or provide preventative maintenance of nearly 200 bridges and bring highway speed E-ZPass to specific locations along the Thruway.
Implementation of the Authority’s highway and bridge Capital Program through 2011, together with the Authority’s ongoing extensive and regular maintenance programs, will ensure that the operational and structural integrity of the Authority’s facilities are maintained. For more information visit: http://www.nysthruway.gov/news/announcement.html
In March and April 2008, the Authority conducted five widely publicized statewide public hearings, including a public comment period which concluded on April 10, 2008, to receive input from the public and interested groups on the Authority’s proposed toll adjustment and Capital Program. There were no suggestions within the Authority’s control that raised suitable alternatives to the toll adjustment.
On Friday April 25, 2008, Authority staff presented the Authority Board with a proposed phased-in toll adjustment plan that complimented cost containment efforts and would enable the Authority to fulfill its commitment to provide safe and reliable roads and bridges to Thruway motorists.
2
Recognizing the severity of the current economic climate, the Authority implemented significant operating cost containment measures that generated more than $13 million in cost reductions in 2008 alone. As part of these operational savings measures, the Authority will continue to reduce full-time positions, adding to the 500 eliminated since 1995. To further the Authority’s cost containment efforts and deliver more operational savings, in 2008, the Authority began working with the Volpe Transportation Center (part of US Department of Transportation) to provide an independent review of the Authority’s policies, processes and operations for the purpose of identifying organizational efficiencies.
B. Tappan Zee Bridge Deck Replacement
In August 2006, the Authority awarded the Tappan Zee Bridge Deck Replacement Project. When completed, approximately 40% of the entire deck will have been replaced, including four of the seven lanes on the west end of the bridge and the main truss. In previous years, the Authority replaced half of the length of the center lane of the causeway and the entire east truss deck.
While physical work on the Bridge’s steel and deck began in the Spring of 2007, by the end of 2008, the following work had been completed:
664 panels on the west causeway spans fabricated (100%)288 out of 288 panels on the main spans fabricated (100%)140 out of 140 panels on the west deck truss fabricated (100%)1092 total panels fabricated (100%)1080 out of 1092 panels installed (98.9%)
1328 out of 1328 west causeway stringers fabricated (100%)332 out of 332 permanent edge beams fabricated (100%)576 out of 576 main span stringers fabricated (100%)1,152 out of 1,152 main span stringer support brackets fabricated (100%)The total steel components fabricated by the end of 2008 was approximately 100%
332 barrier sections out of 334 total barrier sections on the west causeway span fabricated (99.4%)142 barrier sections out of 144 total barrier sections of the main span fabricated (98.61%)
Panels
Steel
Barrier
3
C. I-84/I-87 Interchange 17 Reconstruction Project
Phase II of the I-84/I-87 Interchange Reconstruction Project commenced in March 2006 and continued throughout 2007 and 2008. This Phase included utility work and construction of a number of new facilities. During the 2008 construction season, the new maintenance building, State Police building and the Natural Gas Turbine Electrical Co-Generation Plant were completed. Those two buildings and the plant are now fully operational and occupied. The former facilities have been removed to make room for new ramps and internal site roadways. Construction on the new toll facilities, detention ponds and landscaping are almost complete. The new toll facilities are scheduled to be operational in mid-2009.
Phase III of the I-84/I-87 Interchange Reconstruction Project commenced in March 2007 and continued throughout 2008. Phase III includes construction of all remaining service roadways, several new ramps, six new bridges and one bridge widening in the interchange to directly connect I-84 and I-87, two traffic signals on Route 300 and construction of a new, larger tandem lot. During the 2008 construction season, the six new bridges and bridge widening were completed. The new ramps and internal site roadways were significantly completed. Landscaping, Route 300 upgrades, and traffic lights, as well as the new tandem lot are well underway and expected to be completed in the Spring of 2009. Phase III is expected to be completed, providing a new direct connection between I-84 and I-87, by the Fall of 2009. For more information visit:http://www.nysthruway.gov/projectsandstudies/projects/i84-i87/index.html
Scheduled to be completed in 2009, the new deck, along with related repairs to the superstructure, lighting and rail, will provide more reliable service, increase safety and add convenience for motorists using this vital east-west corridor. For more information visit:www.nysthruway.gov/projectsandstudies/projects/tzbdeck/index.html
D. Innovation
1. E-ZPassIn 2008, more than 97,000 Thruway E-ZPass accounts were opened and the Authority issued more than 304,000 tags. E-ZPass is now used by more than 17 million motorists throughout North America. As of December 2008, there were 2,417,676 active Thruway Authority issued E-ZPass tags.
4
Introduced in 2004, the E-ZPass-On-the-Go Program has made obtaining an E-ZPass more convenient for Thruway motorists. By the end of 2008, there were 584 retail locations offering E-ZPass On-the-Go throughout the State, including several gift shops located in Thruway travel plazas. The Program has been successful in that 42% of Thruway E-ZPass accounts opened in 2008 were E-ZPass On-the-Go accounts. For more information visit http://www.nysthruway.gov/ezpass/index.html
2. Highway Speed E-ZPass
In January 2007, the Authority activated its first Highway Speed E-ZPass facility for commercial motorists along the Thruway at the Spring Valley Toll Barrier, in Rockland County. This major milestone was a step forward in the Authority’s ongoing effort to improve customer service along the Thruway.
Additionally, in late 2007, Contract 1 work at the Woodbury Toll Barrier was completed. In April 2008, Contract 2 was awarded to Yonkers Contracting Company. Contract 2 involves most of the highway and toll booth components necessary to implement Highway Speed E-ZPass. The majority of the project is expected to be completed in 2009 with the remaining finish work to be completed in 2010.
Work began by mobilizing equipment and clearing and grubbing within the project limits prior to a critical environmental calendar restriction for tree cutting, due to endangered species within the area (Indiana Bat). Various drainage modifications and major earthwork also began immediately and several T-Wall retaining wall structures were constructed throughout the project limits. Additionally, work began on three major retaining walls in the area of Arden House Road Bridge. Also in 2008, much of the pavement widening of the I-287 southbound and northbound approaches to the Woodbury Toll Plaza was completed. This will allow traffic to be shifted to the outsides and facilitate construction of the Highway Speed lanes in the middle. By August 2008, reconstruction of the toll lane pavement began at the Woodbury Toll Barrier and continues today, pending weather restrictions. Additionally, reconstruction of seven toll booths at Woodbury, construction of detention ponds, scuppers modification of the Route 6 Bridge, and a significant amount of drainage work were completed on this project.
This Highway Speed E-ZPass facility is scheduled to be open in the Fall of 2009. For more information visit:http://www.nysthruway.gov/projectsandstudies/projects/woodbury/index.html
5
E. Customer Focus
1. Tappan Zee Bridge / I-287 Corridor StudyThe long-term needs of the Tappan Zee Bridge and the adjacent I-287 Corridor are being addressed in a multi-agency study, managed by the NYSDOT. The Authority continues to maintain this critical structure through capital expenditures and with Authority maintenance forces. For more information visit: http://www.tzbsite.com
The Authority continues to implement the ATMS, automation of services to provide more accurate and timely information to travelers, thus increasing the level of service provided. The ATMS automatically updates the Authority’s website with incident information, provides real-time information to NYSDOT for the statewide real-time transportation status website, and sends an email regarding high priority traffic alerts to subscribers (TRANSalerts).
In 2008, Highway Advisory Radio (“HAR”) was automated using text to speech, allowing incidents to be updated in real-time to the Authority’s 11 HAR stations. Additionally, Regional Audio Messages were added to the Authority’s website, which provides travel information in both text and audio formats. This automation allows AMBER Alerts and emergency events to be simultaneously broadcast on all HAR stations. Authority travel information was also integrated into the Niagara International Transportation Technology Coalition Crossroads system in the Buffalo regional area.
Upon full implementation, ATMS will automate the Authority’s 1-800 number, monitor the TRANSMIT system, automatically update DMS, and improve dissemination of AMBER Alert information to DMS. These system improvements will continue to be implemented in 2009, and are scheduled to be fully operational by 2010.
2. Advanced Traffic Management System (“ATMS)
3. Mainitenance
In 2008, the Authority’s maintenance crews completed preventive and corrective maintenance efforts on Thruway assets including pavement, bridges, facilities, vehicles and equipment, the toll system and various Information Technology System elements. Maintenance crews attended to daily tasks, such as guiderail and pavement repairs, bridge repairs, assisting with accidents, bridge washing, mowing and litter removal. Maintenance crews also continued to respond successfully to emergencies, including major property damage incidents and major snow and ice events.
6
2. Snow and Ice Program
It is the Authority’s policy to provide its customers with a roadway that is safe to drive at a reasonable speed under the given weather conditions. The ultimate goal is to remove snow and ice from all pavement and facilities as soon as possible. To achieve this goal, the Authority uses more than 600 dedicated winter maintenance personnel assigned to 23 highway maintenance sections along the Thruway and approximately 800 pieces of motorized snow removal equipment to plow and de-ice the pavement. The Authority also provides 24 hour/7 days-a-week staffing coverage during the winter season which allows for a timely and effective response to winter conditions.
The 2007-2008 snow and ice season (November - April) was an active one across the System. Each of the Authority’s 23 maintenance sections responded to an average of 44 snow and ice events, ranging from localized squalls to multi-day events. Material usage for the season was approximately 17% higher than historical averages. In addition, overall
F. Safety
1. State Police Troop T (Troop T)
In 2008, Commander Major Robert C. Meyers continued to lead New York State Police Troop T.
Troop T, whose members patrol the 570-mile Thruway and 71 miles of I-84 exclusively, conducted numerous safety initiatives in 2008, including: “Operation Work Brake,” aimed at curbing aggressive driving, especially through work zones; “Buckle Up New York,” a 14-day statewide seatbelt enforcement initiative; “Operation Spring Brake” and “Operation Summer Brake,” targeting the prevention of crash-causing habits such as aggressive driving, speeding and DWI; Safety Break Demonstrations, aimed at educating motorists about safely sharing the road with trucks; and “Pumpkin Patrol,” aimed at preventing dangerous Halloween pranks. In addition, the Commercial Vehicle Enforcement Unit inspected thousands of these vehicles in 2008 ensuring that those with faulty equipment were placed out of service. In 2008, Troop T’s efforts to reduce speeding and DWI resulted in more than 194,000 tickets issued, approximately 99,000 of which were for speeding violations, and more than 1,240 were DWI arrests. For more information visit: www.troopers.state.ny.us/
7
labor hours for snow and ice control were higher than in each of the three previous seasons.
The Authority maintains covered storage capacity for approximately 135,000 tons of dry de-icing materials in more than 60 buildings strategically placed along the Thruway. Bulk storage tanks located across the System also provide storage capacity for approximately 100,000 gallons of liquid de-icers. Authority maintenance forces use these liquids in combination with the traditional de-icing materials to improve the performance and efficiency of snow and ice-control operations.
Pre-treatment of the road with liquid de-icing chemicals is used in some locations in response to a predicted winter storm event. The Authority’s trucks are also equipped with automatic spreader control systems that adjust the rate of application of de-icing materials to the speed of the vehicle. In addition, many trucks are also equipped with de-icing liquid that can be added to the salt as it is applied to the roadway, increasing effectiveness under certain conditions.
Weather forecasting information obtained from professional meteorological services is provided on the internet and to all Authority maintenance sections and the Thruway Statewide Operations Center. Field personnel use local resources to fine tune weather forecasts and responses. In addition, there are more than 40 locations Thruway-wide where pavement and air temperatures are used to monitor weather conditions and trends on the roadway. The data provided by these sensors is used in conjunction with weather information to more accurately manage snow and ice control procedures.
3. Construction
In the New York Division, work was performed on eight major projects during 2008, three of which were completed. The two contracts (combined value of $127.1 million) that will result in a direct connection between I-84 and I-87 are still ongoing; both are scheduled for completion in 2009. The New England Section (I-95) repaving project from Exit 8 (Orchard Beach, City Island) to Exit 17 (Larchmont) is ongoing and will be completed in the Spring of 2009. The Woodbury Toll Plaza reconstruction project ($79.0 million), which will result in the creation of highway speed E-ZPass lanes, is also ongoing. The Tappan Zee Bridge partial redecking project ($173 million) was substantially completed in 2008 (see specific project write up for further detail). Work was completed on the major repaving project on the Thruway from Interchange 14A (Garden State Parkway Connector) to Interchange 15 (Suffern) ($23.8 million) and a resurfacing project on the Thruway from the Woodbury Toll Barrier to Interchange 17 (Newburgh) ($12.2 million).
8
In the Albany Division, work was performed on seven major projects during 2008, two of which were completed. Two bridge projects on the Berkshire Connector were completed in 2008--they are the Castleton Bridge Rehabilitation ($31.1 million) and Route 980D over Berkshire Connector Bridge Replacement ($6.4 million) projects. Work started on a two-season project ($7.4 million) to replace the Interchange B1 (Post Road/Route 9) Bridges over the Berkshire Connector. Additionally, construction work started on a $3.3 million project to complete safety upgrades (including replacement of guiderail, slope flatting and culvert extensions) from Interchange 18 (New Paltz) to 5 miles north of Interchange 19 (Kingston). Finally, work continued on the following canal projects: rehabilitation of Movable Dam 6 at Erie Canal Lock 10 in Montgomery County ($18.2 million), rehabilitation of Movable Dam 10 at Erie Canal Lock 14 in Montgomery County ($17.1 million) and rehabilitation of Erie Canal Lock 6 in Saratoga County ($14.9 million).
In the Syracuse Division, work was performed on eight major projects during 2008, five of which were completed. Of these five projects, the first ($15.7 million) rehabilitated the Mainline between Interchange 34 (Canastota) and east of Interchange 34A (I-481). Three other projects resurfaced the Mainline from Interchange 29A (Little Falls) to Interchange 30 (Herkimer) ($8.2 million), West of Interchange 34 (Canastota) to Interchange 35 (Thompson Road) ($4.9 million) and Interchange 41 (Waterloo) to Interchange 42 (Geneva) ($4.7 million). The project to rehabilitate the Erie Canal Lock 26 taintor gate and dam ($7.5 million) was also completed. The $127.9 million project to reconstruct I-90 from Interchange 39 (I-690) to Interchange 40 (Weedsport) started in 2008. Finally, the projects to replace the Buckley Road Bridge over the Thruway ($4.7 million) and rehabilitate Oswego Canal Lock 5 ($10.1 million) continue.
In the Buffalo Division, work was performed on four major projects during 2008. The deck replacement project ($48.2 million) on the South Grand Island Northbound Bridge began in 2008. This project will also complete substructure repairs and other improvements to both of the South Grand Island Bridges. In addition, two projects to install two intelligent transportation systems equipment in the Buffalo region are ongoing. Lastly, a project ($5.0 million) to resurface several sections of the Mainline was completed during 2008.
9
G. Statistics
1. Commercial Traffic
Commercial traffic for 2008 totaled 26,545,121 trips, representing a 4.31% decrease from 2007.
2. Passenger Traffic
Passenger traffic for 2008 totaled 221,992,873 trips, representing a 2.73% decrease from 2007. (This number does not include traffic on I-287 orI-84.)
3. Maintenance
During the 2007-2008 winter maintenance season (November - April), the Authority used approximately 210,000 tons of salt at a cost of approximately $8.8 million. Based on a 15-year historical average, the Authority estimates usage for the 2008-2009 season will be approximately 180,000 tons, at an estimated cost of more than $9.8 million. Maintenance crews were involved in snow and ice activities on more than 250 work days requiring more than 250,000 labor hours. This included plowing mainline pavement and ramps, applying liquid anti-icing materials for pre-treatment before a storm, and cleanup activities in service areas, parking lots and around buildings.
Maintenance crews also spent more than 300,000 hours on more than 300 work days performing pavement and bridge repair activities, guiderail and safety work, and responding to accident damage repairs. Accomplishing these actions required the use of more than 25,000 tons of asphalt and 3,500 cubic yards of concrete. Crews were also occupied with more than 200,000 hours of landscape maintenance including right-of-way cleanup, grass mowing and general landscape maintenance.
In 2008, the Authority’s Central Sign Shop, responsible for producing nearly all of the signs along the Thruway, manufactured more than 46,000 square feet of signage. This included more than 350 large roadside regulatory, warning and directional signs, totaling more than 14,000 square feet. In addition, the Sign Shop also produced specialty signs and graphics for the Thruway Authority, Canal Corporation, State Police, as well as other agencies including New York State Economic Development Corporation “Shovel Ready” signs, Erie Canal Greenway Grant Logo sponsor signs and signs for New York State Fair events, and others.
10
4. Fatalities
Statistics indicate that 2008 was the third safest year in the Thruway’s 53-year history. A primary measure of safety is the fatality rate, which is calculated as the number of fatalities per 100 million vehicle miles (MVM) traveled. In 2008, there were 28 fatal accidents on the Thruway resulting in 33 deaths, reflecting a fatality rate of 0.32, the third lowest rate in Thruway history.
The fatality rate along the Thruway remains significantly below the national average as calculated by the National Center for Statistics and Analysis (NCSA) of the National Highway Traffic Safety Administration. According to NCSA, the United States had more than 41,000 fatalities in 2007 that resulted in a fatality rate of 1.36 fatalities per 100 MVM. In New York State there were more than 1,300 fatalities in 2007 that resulted in a fatality rate of 0.97 fatalities per 100 MVM. For more information please visit:http://www.nhtsa.dot.gov/
5. E-ZPass
In 2008, 63.31% of Thruway customers utilized E-ZPass, (electronic toll collection) for their toll transactions. More than 67.28% of the Authority’s toll revenue in 2008 came from E-ZPass users.
The E-ZPass Interagency Group, formed in 1990 to develop an interoperable electronic toll collection system in New York, New Jersey and Pennsylvania, has grown to include 24 toll agencies/authorities in 13 states. For more information visit http://www.e-zpassNY.com/
H. Environmental Stewardship
For more information about the Authority’s environmental initiatives, please visit: http://www.nysthruway.gov/environmental/index.html
In 2008, the Authority’s Bureau of Environmental Services (“Bureau”) continued to work to meet air, land and water-based environmental requirements. The Bureau developed the Environmental Stewardship Project Implementation and Planning Report (“Report”) for the Authority/Corporation; implementation of this Report is ongoing with an updated report and recommendations developed in January 2007.
To assist the Authority’s four Divisions with their operation and maintenance oversight, as well as construction oversight, environmental reminders were prepared for maintenance supervisors and construction inspectors to use during implementation of day-to-day projects and activities.
11
1. Recycling Containers
The Division Environmental Specialists provide field staff with compliance support and assistance with environmental enhancement projects such as:
Service Area Remediation projectsLiving snow fencing at critical highway locations in the Silver Creek Maintenance Section
In 2008, the Authority fully implemented a program to provide recycling containers at Thruway Travel Plazas to collect newspaper, plastic bottles, glass and aluminum cans from Thruway patrons. A pilot program, initiated in the Fall of 2007, involved installing clearly marked containers at six of the busiest Travel Plazas. The Authority completed a competitive procurement process and purchased containers for the remaining 21 Travel Plazas. Containers and overhead signs were installed at the remaining 21 Travel Plazas directly outside the main entrances in March 2008. Informational brochures have been developed and are available inside the Travel Plazas to provide information on the Authority’s recycling program, as well as New York State’s recycling program.
2. Alternative Fuel
The Authority continues to strive to meet the requirements of the Federal Energy Policy Act of 1992 and New York State Executive Orders 111 and 142, which urge State agencies and authorities to become less dependent on foreign oil and to provide cleaner air.
In 2008, the Authority expanded the use of Bio Diesel in multiple locations across the State, including the utilization of B20 in upstate locations during the winter months. The Authority also expanded its fleet of E85 vehicles in 2008. Currently, the Authority has more than 400 active E85 vehicles across the State. Two of the five E85 fueling stations were modified to allow outside State agencies to fuel-flex fuel vehicles with ethanol. The Authority’s use and proactive approach to alternative fuels has allowed it to meet the State and Federal objectives.
The Authority has been prepared to open the first E85 fueling station to the public at the New Baltimore Travel Plaza (approximately 15 miles south of Albany) since the Fall of 2006. Upon approval from Underwriters Laboratory, the Authority plans to implement retail sale of E85 fuel at the New Baltimore and Sloatsburg Travel Plazas. The Authority also has plans to construct additional E85 fuel facilities at the Clarence Travel Plaza in the Fall of 2009.
12
3. Invasive Species
The Authority/Corporation is an active member of the NYS Invasive Species Council (“Council”). The Council is charged with implementing specific initiatives to protect native species and prevent the spread of invasive plants and animals. For more information on the Council visit:http://www.dec.ny.gov/environmentdec/38219.html
4. US Army Corps of Engineers Nationwide Permit Program
In September 2006, the US Army Corps of Engineers (“Corps”) proposed to reissue and modify the 2002 nationwide permit program. In March 2007, the Corps executed the modified permits. Authority staff continues to work with the Corps and project design and maintenance staff to ensure compliance with these new permit conditions. Throughout 2008, Authority/Corporation staff participated in working groups, involving state agencies and the Corps, to discuss opportunities to simplify the implementation of these new permit conditions. Supreme Court decisions issued in 2008 had an impact on the Clean Water Act Section 404 permitting process. The Authority/Corporation continues to work with the Corps to understand and meet the new reporting requirements for permit applications.
5. Municipal Separate Storm Sewer Systems (“MS4”)
The Authority/Corporation’s MS4 public outreach campaign, “Connecting the Drops,” continued in 2008. This initiative is part of a comprehensive Stormwater Management Program intended to educate New Yorkers on the importance of water quality and stormwater pollution prevention and remind them that what is released into the environment can reach water bodies and put aquatic life, recreation and even drinking water at risk. The “Connecting the Drops” effort includes educating Authority/Corporation employees, as well as the motorists and boaters who use the Thruway and Canal Systems. During the Summer of 2008, the Authority/Corporation provided educational lessons to fourth grade students who participated in the Canal Corporation’s Tugboat Urger program. More than 2,260 fourth grade students learned the importance of protecting water quality and preventing water pollution. Materials including “Help Keep the Canal Clean” brochures, Children’s Activity Booklets and “Connecting the Drops” Fact Sheets were made available. In addition, a video about stormwater pollution prevention is played several times a day to travelers at all Thruway travel plazas.
13
6. Service Area Remediation
As required under the Authority’s new fueling service contracts, construction of capital improvements was initiated by the respective facility operators in the Spring of 2008. As these projects were implemented, new and open spill records were identified at the various stations, resulting in the New York State Department of Environmental Conservation (“NYSDEC”) requesting expedited site-specific remediation. As previously reported, the Authority Board was notified in April 2008 that NYSDEC requested the execution of stipulation agreements on four stations: Clifton Springs, Pembroke, Seneca, and Scottsville. Remedial work at Clifton Springs has been completed and the required post closure monitoring has begun. In coordination with the NYSDEC and the facility operators, the Authority has initiated investigations at the other sites in accordance with NYSDEC stipulation agreements for final site remediation. Specifically, a contract has been approved to initiate remediation work at Pembroke. In 2009, contract documents will be prepared to initiate remediation projects at Seneca and Scottsville. The remedial status of all open NYSDEC spill records assigned to the Authority is being reviewed and discussions will continue with NYSDEC regional offices to schedule various remedial projects.
7. Syracuse Reconstruction Project
Environmental stewardship drives the Authority to incorporate elements of environmental preservation into its operations to every extent practicable. Consistent with this objective, consideration for the environment has been integral to the design and construction of the Syracuse Reconstruction Project. Commenced in 2008, the project includes the complete reconstruction of 15 miles of two travel lanes, in both directions, between Interchanges 39 and 40 of I-90. The Authority continues to work closely with the US Army Corps of Engineers, NYSDEC, the US Fish and Wildlife Service and the US Environmental Protection Agency (“USEPA”) to protect the environment from construction impacts. At least 11 acres of wetlands will be created to mitigate any potential effects of construction to existing wetlands. As the project progresses, additional environmental protection measures will include: soil and erosion control, the prevention of the introduction of invasive plant species in wetlands, the avoidance of impacts to endangered species, and landscaping, such as planting trees at interchanges and other selected areas throughout the 15-mile corridor. The project is slated for completion in 2011.
14
Construction activities that disturb one or more acres of land must be authorized under a State Pollutant Discharge Elimination System (“SPDES”) Permit for Stormwater Discharges from Construction Activity. In April 2008, NYSDEC issued a new SPDES General Permit for Stormwater Discharges from Construction Activity (GP-0-08-001). This general permit is effective for two years and replaced the SPDES General Permit for Stormwater Discharges from Construction Activity (GP-02-01).
The Authority/Canal provided comment to NYSDEC on the draft permit. In response to the significant public comment received by NYSDEC on the permit, NYSDEC scheduled stakeholder meetings with entities who provided formal comment on the permit. The Authority/Corporation attended these NYSDEC sponsored meetings to discuss comments.
Upon issuance of the final permit in April 2008, Authority/Corporation staff worked diligently to develop internal guidance and processes to implement the new permit requirements to ensure compliance for all Authority/Corporation construction projects.
8. NYSDEC General Permit for Stormwater Discharge from Construction Activity
II. CANAL CORPORATION
Historically, New York State’s Canal System has produced significant economic growth for the State and the nation, creating inland trade and propelling economic development. The mule-towed barges of the Erie Canal and the steam-powered tugboats of the Barge Canal of years past have given way to pleasure boats, hikers, bicyclists and landside visitors of every kind. Over the last decade, implementation of the Canal Revitalization Program, administered by the New York State Canal Corporation (“Corporation”), has begun transforming the Canal System into a first class tourist destination, bringing new energy to its surrounding communities. While primarily used for recreational purposes today, the Canal System has seen an increase in commercial shipping over the past couple of years. For more information, please visit: http://www.nyscanals.gov/
15
A. Operations and Maintenance
1. Capital Program
Several critical Capital Projects were completed in 2008. These projects included the rehabilitation of the taintor gate and dam at Lock E-26 in Clyde and the waste weir in Cartersville.
Additionally, the rehabilitations of Lock E-6 in Waterford, Lock O-5 in Minetto and Lock O-8 in Oswego were initiated in 2008. Several rehabilitation projects also continued from prior years into 2008, including Movable Dam 6 in Cranesville and Movable Dam 10 in Canajoharie.
The flood of June 2006 was the worst high water event in the history of the modern Canal System. Staff worked around the clock to clean debris and make the necessary repairs for a System-wide recovery and re-opening.
The restoration effort that began immediately following the 2006 event continued throughout 2008. Projects completed in 2008 included site and building rehabilitation at Locks E-9, and E-13 through E-15 in Schenectady and Montgomery Counties, and steel and concrete repairs at Locks E-8, E-9 and E-11 through E-15 in Schenectady and Montgomery counties.
The flood recovery repair work will continue in 2009 and complete recovery is expected in 2010.
2. Flood Recovery
In November 2005, voters approved the Rebuild and Renew New York Transportation Bond Act of 2005 which included $50 million for specific canal related projects. The miter gates replacement project at Lock C-6 in Fort Miller, begun in 2006, was completed in 2008. Additionally, the contract portion of the Herkimer Bank Repair project, initiated in late 2007, was completed in 2008.
3. Rebuild and Renew New York Transportation Bond Act of 2005
During 2008, Spectra Engineering, P. C. and its subconsultants continued water inspections of Corporation structures, completing 90 inspections. In total, 277 Corporation structures were inspected. The inspection reports are in the process of being entered in the new Canal Infrastructure Management System (“CIMS”), a system that will provide more information, and make that information even more accessible than the existing system.
4. Structure Inspections
16
Also during 2008, Collins Engineers, P.C. and its subconsultants completed the underwater inspections of one round of 106 Corporation structures, and began another round of inspections of 106 structures. These inspections are also being entered into CIMS. Collins Engineering, P.C. was designated to perform the next two-year cycle of above water inspections.
The remaining Corporation structures – those structures not considered “major” and without underwater elements – are routinely inspected by in-house Division Canal personnel.
The Corporation continued its aggressive dredging program in 2008 with a total of 636,079 cubic yards (“cy”) dredged from the navigation channel. Although this figure is lower than 2007, many high priority projects were undertaken which have been a major factor in the marked increase of commercial shipping.
While routine dredging occurred at many locations, 2008 continued the emphasis on restoring long sections of the Canal System channel to full depth. Three such sections included Indian Castle (Lock E-16 to E-17 pool), Utica (Lock E-19 to E-20 pool) and Palmyra (Lock E-28B to Lock E-29 pool). Dry dredging operations took place at several creek mouths with the goal of removing the dredge material before it migrates into the navigation channel. The dry dredging program has extended the dredge season throughout the winter and has had a significant impact on the condition of the channel.
Also, during 2008 two hydraulic dredge attachments for existing Corporation track excavators were placed into service. These attachments were purchased for barge offloading of dredge material to meet the goal of eliminating in-water disposal of dredge material as mandated by the US Army Corps of Engineers and NYSDEC.
The total volumes dredged by the respective floating plants during 2008 were:
84,815cy dredged by the Waterford Floating Plant234,831cy dredged by the Utica Floating Plant185,556cy dredged by the Syracuse Floating Plant130,877cy dredged by the Albion Floating Plant636,079cy - Total
5. Dredging Program
17
The Corporation’s varied historic vessels in the Floating Plant are floating museums. Going back to the inception of the Canal Floating Plant in the 1930s, canal vessels have been continuously and rigorously maintained in excellent working condition. These vessels, many more than 50 years old, continue to perform the necessary Corporation tasks of placing, maintaining, and removing buoys, moving dredges, taking depth soundings, and myriad other jobs on the historic New York State Canal System.
During 2008, the Corporation developed an inventory of its Floating Plant, including photographs, facts and figures on each vessel. This information, along with a Management Plan detailing the future plans and strategies for preserving and maintaining the vessels, will be published in 2009.
6. Vessel Inventory Management Plan
Safe and reliable navigation throughout the Canal System was maintained throughout the 2008 navigation season.
7. Water Management
The Corporation continued to work closely with the USEPA, state agencies, including NYSDEC, New York State Department of Health (“NYSDOH”) and the New York State Attorney General’s Office, and local officials, to support the USEPA environmental remediation of the Hudson River. The Corporation also began planning and coordinating operational issues related to the dredging and processing of dredge spoils with General Electric and their contractor, Cashman, in advance of the scheduled May 2009 start date for “Phase 1” dredging. Significant construction on two properties proximate to Lock C-8, formerly owned by the Corporation and acquired through a condemnation process by USEPA, was completed. This construction included completion of a two-mile access road and construction of a wharf for the transfer of dredge spoils to the dewatering facility. The Corporation continued to participate in this process by attending Community Advisory Group meetings, State agency monthly coordination meetings and bi-weekly conference calls with USEPA and state agency officials. Corporation staff provided significant input and recommendations into a variety of planning, design and construction documents related to the dredging, and worked closely with NYSDEC and NYSDOH on issues related to Hudson River floodplain contamination and remediation. The Corporation is also working with USEPA to establish two Corporation positions which will be funded by USEPA and coordinate canal operations during the dredging project.
8. General Electric Hudson River Dredging
18
B. Office of Community Relationis (“OCR”)
During 2008, efforts to increase and improve local canal-side amenities and public access were enhanced by the continued implementation of the Erie Canal Greenway Grant Program, and by active participation in state, federal and local partnerships dedicated to revitalizing and promoting canal communities. The OCR participated as a member on waterfront planning committees for numerous canal regions and communities, including Oneida County, Western Montgomery County, Western Erie Canal Heritage Commission, Village of Fort Ann, and the Village of Scotia.
In addition, the OCR provided community outreach assistance to Champlain Canal communities along the Quadricentennial event route and performed active community outreach at venues such as the annual Association of Towns Conference, annual New York Conference of Mayors Winter Legislative Meeting, Audobon Sustainable Communities Conference, and the Genessee Finger Lakes regional energy and environment forum.
During 2008, State Police - Troop T - Canal Detail continued to provide a Recreational Vehicle Enforcement Unit assigned to the Canal System waterways and trails. The nine-member unit utilized All-Terrain Vehicles (“ATV”), bikes, boats, Personal Water Crafts and snowmobiles to patrol canal properties and waters. In 2008, the troopers assigned to the Canal Detail issued more than 1,000 Navigation Law tickets for violations including, speed/reckless operation, alcohol related offenses and other safety violations. Detail members were also responsible for making more than 800 Criminal, Environmental, and Vehicle & Traffic Law arrests. Troopers continued to utilize ATVs to assist in searches for lost/missing persons, criminal investigations and to assist patrols on the Thruway during severe winter storms.
9. State Police Troop T
During 2008, the Corporation continued to implement the 2006 Erie Canal Greenway Grant Program, which was funded by $10 million in the 2006-2007 New York State Budget. Since its inception, the Program has been providing matching grants to municipalities and not-for-profit corporations for capital projects consistent with the recommendations in the Report on the Future of New York State Canals and the 1995 Canal Recreationway Plan. The Corporation solicited grant applications from municipalities and non-profits for capital projects along the Canal System to preserve and rehabilitate canal infrastructure, enhance recreational opportunities for water and land-based users, and promote tourism, historic interpretation and community revitalization. The Corporation selected 57 projects for $8.9 million in funding.
1. Erie Canal Greenway Grant Program
19
To date, Corporation staff continues to work with the Erie Canal Greenway Grant Program recipients monitoring various stages of design and construction and processing reimbursement requests. Many projects began design and construction in 2008, with several expected to complete their bidding process for construction in the Spring of 2009.
In 2007, the Welcome Center at the Fort Plain Free Library and the construction of floating docks along the Geneva Lakefront/Cayuga-Seneca Canal in the City of Geneva were completed. In 2008, the Lake Champlain Visitors Center in Essex County had its roof replaced, and floating docks and marina improvements were completed in St. Johnsville. In the Village of Pittsford, sidewalks and crosswalks were installed; lighting, landscaping and a public water supply were provided along the Canalway Trail. In Baldwinsville, new marine electrical and water connections were installed along the seawall. In the Town of Halfmoon, the Champlain Canal Trail was completed.
The grant funding also included $150,000 to help reconstruct and rehabilitate the main building at the Matton’s Shipyard site in Cohoes, transforming it into a classroom and exhibit space. In 2008, the funds were used to replace the deteriorating roof on the main building. Grant funding through the Erie Canal Greenway Grant program totaling $120,000 was also provided to support the 2010 World Canals Conference, an international event underscoring the accomplishments of New York State Canal System. The event will be held in Rochester on September 19-24, 2010, and will focus on local initiatives and innovative development schemes in urban and rural settings.
In 1992, “Thruway 2000” legislation was enacted, transferring responsibility for the New York State Canal System to the Thruway Authority and establishing the New York State Canal Corporation as the Authority’s subsidiary. The legislation also created the 24-member Canal Recreationway Commission (“CRC”) to advise the Authority/Corporation on canal-related activities. The CRC membership consists of ten individuals involved in Canal use, development, preservation or enhancement, and local governments from counties adjacent to or intersected by the Canal System, six New York State agencies and the eight regional planning commissions located within the Canal System. Meetings were webcast in 2008 pursuant to Executive Order No. 3 of 2007, Promotion of Public Access to Government Decisionmaking, and remain posted on the Corporation’s website for a four-month period following each meeting.
2. Canal Recreationway Activities
20
C. Government Partnerships
During 2008, the CRC approved one transfer of jurisdiction of Corporation lands to the US Department of Transportation for highway improvements, one proposed lease by the Herkimer County Chamber of Commerce for the purpose of constructing a new welcome and office facility for the Chamber, one hydroelectric power easement, and ten abandonments of Canal-owned lands. All Corporation real property transactions are progressed in accordance with the Public Authorities Accountability Act. Additionally, the CRC approved the Canal System Development Fund Budget for Fiscal Year 2009.
The Corporation partnered with the ECNHC on several canal-wide initiatives during 2008, including an economic impact study of canal heritage tourism sites, an arts-in-heritage partnership with arts organizations along the canal, the first annual canalway heritage award established to recognize places in the canal corridor that embody the goals of preservation and revitalization, and the Canal Splash!
1. Erie Canalway Nationial Heritage Corridor (“ECNHC”)
The Corporation worked closely with NYSDOS on its Local Waterfront Revitalization Program (“LWRP”) and sits on the advisory committee for LWRPs that include canal communities. Canal LWRPs developed during 2008 included the upper Hudson/Champlain Canal, Town of Saratoga, and western Montgomery County.
2. New York State Department of State (“NYSDOS”)
The Corporation partnered with NYSEFC to conduct outreach to appropriate sites for pump out installation grants and on-data gathering to document the ration of canal boat traffic to pump-out facilities. In addition, NYSEFC was a major partner in the Canal “Clean Sweep” event. As part of the “Clean Sweep”, NYSEFC sponsored a local clean-up event and assisted the Corporation with promotion efforts for the statewide event.
3. New York State Environmental Facilities Corporation (NYSEFC”)
21

During 2008, the Corporation participated in an inter-agency working group headed by NYSDEC, and including NYSDOS and NYSEFC, to research and petition the USEPA for a “No Discharge” Designation for the waterways that comprise the New York State Canal System. The petition is expected to be completed during 2009.
In addition, the Corporation served on the NYS Invasive Species Council, headed by NYSDEC and the New York State Department of Agriculture and Markets to coordinate statewide efforts to prevent the introduction and spread of aquatic and terrestrial invasive species in New York State.
4. New York State Department of Environmental Conservation(“NYSDEC”)
The Corporation continued to work with I Love NY in 2008 to help promote the Canal System. In addition to being a member of the Interagency Tourism Task Force, the Corporation attended and sponsored the I Love New York Governor’s Tourism Conference in May, as well as attended Tourism Promotion Agency Summits. The Corporation also partnered with I Love NY for Call Center Services through a Memorandum of Agreement.
5. New York State Department of Economic Development / I Love NY (“I Love NY)State (“NYSDOS”)
D. Canalway Trail
In 2008, further progress was made on the multi-year plan to complete the Erie Canalway Trail across New York State from the Hudson River to Lake Erie. When complete, the 338-mile Erie Canal portion of the Canalway Trail will be the longest multi-use recreational trail in the United States.
The Tonawanda to Amherst Canalway Trail segment was completed in August 2008. The four-mile trail segment between the City of Tonawanda line and Sweet Home Road in Amherst helps complete the Canalway Trail in the western part of the state. The $1 million project was funded with a combination of Corporation and Federal Transportation Enhancement funds and was developed in partnership with Erie County, which administered the design and construction. More than 270 miles of Erie Canalway Trail are now complete.
22
During 2008, the Corporation sponsored Parks and Trails NY’s 10th annual Cycle the Erie Canal bike tour from Buffalo to Albany. The July event drew approximately 500 participants from across the United States and abroad. Hundreds of volunteers in communities along the route welcomed the riders and provided food and refreshments. Participants also had the opportunity to participate in boat rides on the canal, museum tours and visits to the many historic sites along the corridor. More than half of the 400-mile tour was on completed sections of the Erie Canalway Trail.
1. Cycle the Erie Canal
On June 7, 2008, the Corporation partnered with Parks and Trails NY to sponsor the 5th annual Canalway Trail Celebration in conjunction with National Trails Day. More than 40 events, ranging from trail cleanups to group cycling and walking tours, took place across the state to highlight the importance of the Canalway Trail as a premier recreational destination and acknowledge the many volunteers who support the Canalway Trail throughout the year.
2. Canalway Trail Celebration
E. Land Management
In 2008, the Canal Corporation Board approved and/or extended the approval of the following land transactions:
19.43 acres in Halfmoon, Saratoga County, to Gail KrauseExtension of 180 days to complete the amendment to the lease of approximately 1.89 acres in the Village and Town of Herkimer, Herkimer County, to Unlocked Legends, Inc.0.32 acre in the Town of Forestport, Oneida County, to Donna and Gardner Broadbent7,928 square feet (“sf”) in the Town of Halfmoon, Saratoga County, to Paul and Gayle Allen9.455 acres in the Town of Glenville, Schenectady County, to the Schenectady County Historical SocietyExtension of one year to complete the transfer of jurisdiction of approximately .79 acres located in the Village and Town of Fort Ann, Washington County, to the NYSDOT
23
The Corporation also closed on the sales of the following surplus property:
2,638 sf in the Town of Glenville, Schenectady County to Pasquale Popolizio.32 acre in the Town of Forestport, Oneida County to Gardner and Donna Broadbent.23 acre in the Town of Pendleton, Niagara County to Edward Trouse14,810 sf in the Town of Arcadia, Wayne County to Helen Fellows12,197 sf in the Town of Arcadia, Wayne County to June Renner16,117 sf in the Town of Arcadia, Wayne County to Christina Robertson13,504 sf in the Town of Arcadia, Wayne County to Jane Mullin and Jackie Smith
The Corporation also completed the sale of approximately 44.37 acres of land to the USEPA, acquired by USEPA through a condemnation proceeding, for purposes related to the dredging of the Hudson River
F. Recreationial Boating
Although built to facilitate the transport of goods, the Canal System has evolved into a recreational boating destination. While still very much viable for commercial shipping, the Canal System is now primarily used as a recreational waterway. Recreational use of the Canal System has mirrored industry trends over the years, peaking in 1989 with 159,141 recreational lockings recorded that year.
Recreational traffic decreased in 2008 with 93,073 lockings, a 24% decrease as compared to 2007.
For the first time since 2005, recreational tolls were implemented for all motorized boats using the Canal System locks and lift bridges.
G. Traffic Statistics
Commercial tonnage increased by 123% from 13,195 tons in 2007, to 29,495.5 tons in 2008.
1. Commercial:
Recreational traffic decreased by 24% from 123,358 in 2007, to 93,073 in 2008. *
2. Recreational:
24
Hire boat traffic decreased by 14.3% from 7,557 in 2007, to 6,478 in 2008.*
*Note: The traffic figures above are measured by cumulative vessel lockings, representing each time a vessel passed through a lock.
4. Hire Boat:
H. Events
The Corporation’s two major statewide annual promotional events experienced continued growth in their third year.
In recognition of Earth Day, the third annual “Canal Clean Sweep” was held the weekend of April 19-20, 2008. This event encouraged communities, businesses and non-profit organizations along the entire Canal Corridor to help prepare for the opening of the New York State Canal System on May 1, by participating in cleanup and beautification activities along the Canal and the Canalway Trail. The Corporation partnered with Parks and Trails NY, as well as NYSEFC, in order to expand the event. More than 60 clean-up events were held in preparation for the 183rd navigation season.
1. Canal Clean Sweep
During the weekend of August 8-10, 2008, the Corporation held the third annual statewide signature event, “Canal Splash!” to highlight the history, beauty, culture and recreational appeal of the New York State Canal System. In 2008, the “Canal Splash!” featured more than 120 local events, guided walks, bike tours, discounted kayak and canoe rentals, canal cruises, cultural offerings and much more throughout the Canal Corridor. The three-day, multi-location celebration attracted tens of thousands of people to the events organized by State agencies, communities, non-profits and local businesses. The event was widely publicized throughout the Canal Corridor through distribution of more than 10,000 newly designed “Canal Splash!” brochures. New to this year’s event, event organizers were able to register their events online at www.canalsplash.com. The Corporation partnered with Erie Canalway National Heritage Corridor Commission and Parks and Trails NY to organize the event.
2. Canal Splash!
Tour boat traffic increased by 4.8% from 7,966 in 2007, to 8,348 in 2008.*
3. Tour Boat:
25
I. Tugboat Urger Education Program
The Tugboat Urger, the Corporation’s flagship vessel, continued to serve as the focal point of a program to educate school children and adults regarding the importance of New York’s historic Canal System. In the Spring and Fall of 2008, the Tugboat Urger visited communities along the Canal and students in fourth-grade classes at local schools participated in field trips to the Tugboat for “hands-on” shore-side educational sessions. The students learned about the history of the Canals and the role construction of the Erie Canal played in making New York the “Empire State.”
In 2008, the Tugboat Urger was visited by more than 5,500 school children throughout the Canal Corridor. For the fifth consecutive year, the Tugboat Urger program partnered with the Waterford Maritime Historical Society, the Waterford Visitors Center, and Peebles Island Visitor Center for the “Canalways Program”, a full day of educational activities related to the Canal System. In 2008, this successful program took place over 5 days and accommodated nearly 900 students.
The Tugboat Urger was also part of the “Greater Capital Region Teacher Hostel”, a summer workshop for fourth grade teachers from throughout New York State. Additionally, in 2008 the Tugboat Urger participated in 9 Canal festivals and entertained and educated over 10,000 visitors.
In 2008, the Tugboat Urger, in partnership with the Authority, introduced a new element to their educational program entitled “Connecting the Drops”. The purpose of this joint effort was to introduce the school children to what stormwater pollution consists of, how it affects plants, animals and people and what steps they can take to make a difference.
For more information about the Urger program, please visit:http://www.nyscanals.gov/cculture/tugboat.html
J. Day Peckinpaugh
In 2008, Corporation staff worked closely with the New York State Museum (“NYSM”), Office of Parks, Recreation and Historic Preservation, and the Erie Canalway National Heritage Corridor Commission on the Day Peckinpaugh program. The last remaining Barge canal motorship in existence, the Peckinpaugh was acquired by the NYSM and returned to the Canal in 2005 through a partnership between the Corporation and these agencies. Staff has also worked closely with the New York State Quadricentennial Commission on the Peckinpaugh’s proposed voyage from New York Harbor to Rouses Point on Lake Champlain for 2009. The Corporation contributed mooring space and use of the Waterford dry dock during the 2008 season and continued to be an active partner in this project.
26
K. Hudson Fulton Champlain Quadricentennial Celebration (“HFCQ”)
The Corporation continues to work closely with the HFCQ Commission on the planning for the 2009 Celebration. The Corporation attended several HFCQ Commission meetings and began making preparations in 2008 to participate in Working on Water: Celebrating 400 Years of Maritime History (“WOW”). During the months of August and September 2009, the Corporation will be a major partner of WOW, a journey of historic vessels, including the motorship Day Peckinpaugh and the Tugboat Urger. The Corporation has been involved in the planning of this flotilla and will continue to work on this event throughout 2009. For more information, please visit: http://exploreny400.com/Home.aspx
27
FINANCE
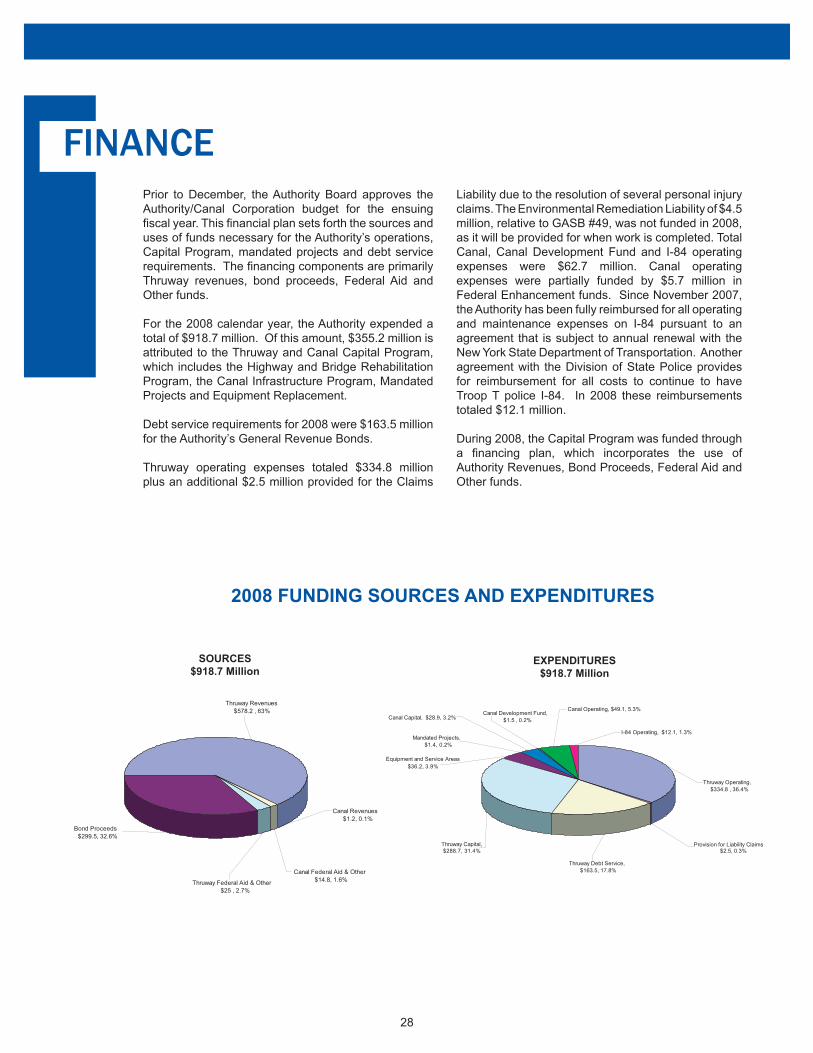
2008 FUNDING SOURCES AND EXPENDITURES
SOURCES$918.7 Million
EXPENDITURES$918.7 Million
Bond Proceeds $299.5, 32.6%
Thruway Federal Aid & Other$25 , 2.7%
Canal Federal Aid & Other $14.8, 1.6%
Thruway Revenues $578.2 , 63%
Canal Revenues $1.2, 0.1%
Canal Development Fund, $1.5 , 0.2%
Thruway Capital,$288.7, 31.4%
Thruway Debt Service, $163.5, 17.8%
Canal Capital, $28.9, 3.2%
Mandated Projects,$1.4, 0.2%
I-84 Operating, $12.1, 1.3%
Thruway Operating, $334.8 , 36.4%
Equipment and Service Areas $36.2, 3.9%
Provision for Liability Claims $2.5, 0.3%
Canal Operating, $49.1, 5.3%
Prior to December, the Authority Board approves the Authority/Canal Corporation budget for the ensuing fiscal year. This financial plan sets forth the sources and uses of funds necessary for the Authority’s operations, Capital Program, mandated projects and debt service requirements. The financing components are primarily Thruway revenues, bond proceeds, Federal Aid and Other funds.
For the 2008 calendar year, the Authority expended a total of $918.7 million. Of this amount, $355.2 million is attributed to the Thruway and Canal Capital Program, which includes the Highway and Bridge Rehabilitation Program, the Canal Infrastructure Program, Mandated Projects and Equipment Replacement.
Debt service requirements for 2008 were $163.5 million for the Authority’s General Revenue Bonds.
Thruway operating expenses totaled $334.8 million plus an additional $2.5 million provided for the Claims
Liability due to the resolution of several personal injury claims. The Environmental Remediation Liability of $4.5 million, relative to GASB #49, was not funded in 2008, as it will be provided for when work is completed. Total Canal, Canal Development Fund and I-84 operating expenses were $62.7 million. Canal operating expenses were partially funded by $5.7 million in Federal Enhancement funds. Since November 2007, the Authority has been fully reimbursed for all operating and maintenance expenses on I-84 pursuant to an agreement that is subject to annual renewal with the New York State Department of Transportation. Another agreement with the Division of State Police provides for reimbursement for all costs to continue to have Troop T police I-84. In 2008 these reimbursements totaled $12.1 million. During 2008, the Capital Program was funded through a financing plan, which incorporates the use of Authority Revenues, Bond Proceeds, Federal Aid and Other funds.
28
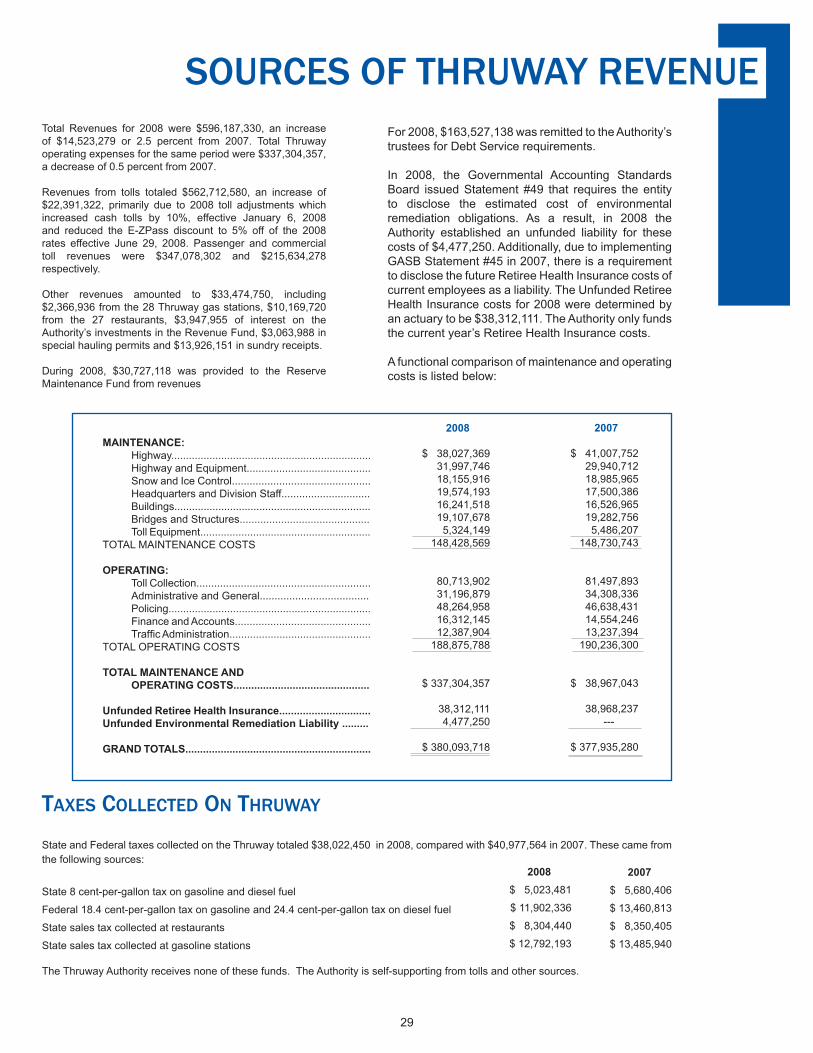
2007
$ 41,007,75229,940,71218,985,96517,500,38616,526,96519,282,7565,486,207
148,730,743
81,497,89334,308,33646,638,43114,554,24613,237,394
190,236,300
$ 38,967,043
38,968,237 ---
$ 377,935,280
State and Federal taxes collected on the Thruway totaled $38,022,450 in 2008, compared with $40,977,564 in 2007. These came from the following sources:
State 8 cent-per-gallon tax on gasoline and diesel fuel
Federal 18.4 cent-per-gallon tax on gasoline and 24.4 cent-per-gallon tax on diesel fuel
State sales tax collected at restaurants
State sales tax collected at gasoline stations
The Thruway Authority receives none of these funds. The Authority is self-supporting from tolls and other sources.
MAINTENANCE:Highway....................................................................Highway and Equipment..........................................Snow and Ice Control...............................................Headquarters and Division Staff..............................Buildings...................................................................Bridges and Structures............................................Toll Equipment..........................................................
TOTAL MAINTENANCE COSTS
OPERATING:Toll Collection...........................................................Administrative and General.....................................Policing.....................................................................Finance and Accounts..............................................Traffic Administration................................................
TOTAL OPERATING COSTS
TOTAL MAINTENANCE ANDOPERATING COSTS..............................................
Unfunded Retiree Health Insurance...............................Unfunded Environmental Remediation Liability .........
GRAND TOTALS...............................................................
2008
$ 38,027,36931,997,74618,155,91619,574,19316,241,51819,107,6785,324,149
148,428,569
80,713,90231,196,87948,264,95816,312,14512,387,904
188,875,788
$ 337,304,357
38,312,1114,477,250
$ 380,093,718
TAXES COLLECTED ON THRUWAY
2008$ 5,023,481
$ 11,902,336
$ 8,304,440
$ 12,792,193
2007$ 5,680,406
$ 13,460,813
$ 8,350,405
$ 13,485,940
SOURCES OF THRUWAY REVENUETotal Revenues for 2008 were $596,187,330, an increase of $14,523,279 or 2.5 percent from 2007. Total Thruway operating expenses for the same period were $337,304,357, a decrease of 0.5 percent from 2007.
Revenues from tolls totaled $562,712,580, an increase of $22,391,322, primarily due to 2008 toll adjustments which increased cash tolls by 10%, effective January 6, 2008 and reduced the E-ZPass discount to 5% off of the 2008 rates effective June 29, 2008. Passenger and commercial toll revenues were $347,078,302 and $215,634,278 respectively.
Other revenues amounted to $33,474,750, including $2,366,936 from the 28 Thruway gas stations, $10,169,720 from the 27 restaurants, $3,947,955 of interest on the Authority’s investments in the Revenue Fund, $3,063,988 in special hauling permits and $13,926,151 in sundry receipts.
During 2008, $30,727,118 was provided to the Reserve Maintenance Fund from revenues
For 2008, $163,527,138 was remitted to the Authority’s trustees for Debt Service requirements.
In 2008, the Governmental Accounting Standards Board issued Statement #49 that requires the entity to disclose the estimated cost of environmental remediation obligations. As a result, in 2008 the Authority established an unfunded liability for these costs of $4,477,250. Additionally, due to implementing GASB Statement #45 in 2007, there is a requirement to disclose the future Retiree Health Insurance costs of current employees as a liability. The Unfunded Retiree Health Insurance costs for 2008 were determined by an actuary to be $38,312,111. The Authority only funds the current year’s Retiree Health Insurance costs.
A functional comparison of maintenance and operating costs is listed below:
29
INVESTMENTS AND BONDS DEBT SERVICE
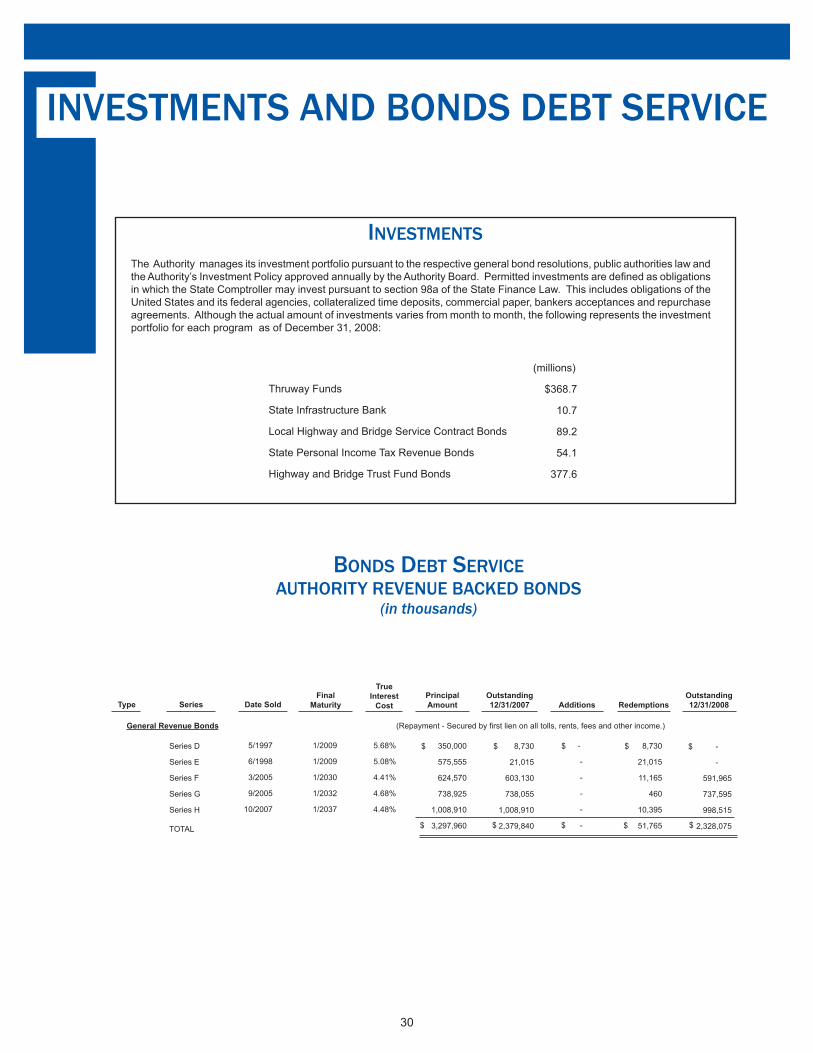
INVESTMENTSThe Authority manages its investment portfolio pursuant to the respective general bond resolutions, public authorities law and the Authority’s Investment Policy approved annually by the Authority Board. Permitted investments are defined as obligations in which the State Comptroller may invest pursuant to section 98a of the State Finance Law. This includes obligations of the United States and its federal agencies, collateralized time deposits, commercial paper, bankers acceptances and repurchase agreements. Although the actual amount of investments varies from month to month, the following represents the investment portfolio for each program as of December 31, 2008:
Thruway Funds
State Infrastructure Bank
Local Highway and Bridge Service Contract Bonds
State Personal Income Tax Revenue Bonds
Highway and Bridge Trust Fund Bonds
(millions)
$368.7
10.7
89.2
54.1
377.6
BONDS DEBT SERVICEAUTHORITY REVENUE BACKED BONDS
(in thousands)
Type
Series D
Series E
Series F
Series G
Series H
TOTAL
Date SoldFinal
Maturity
TrueInterest
CostPrincipalAmount
5/1997
6/1998
3/2005
9/2005
10/2007
1/2009
1/2009
1/2030
1/2032
1/2037
5.68%
5.08%
4.41%
4.68%
4.48%
350,000
575,555
624,570
738,925
1,008,910
3,297,960
Outstanding12/31/2007 Additions Redemptions
Outstanding12/31/2008Series
8,730
21,015
603,130
738,055
1,008,910
2,379,840
-
-
-
-
-
-
8,730
21,015
11,165
460
10,395
51,765
-
-
591,965
737,595
998,515
2,328,075
General Revenue Bonds (Repayment - Secured by first lien on all tolls, rents, fees and other income.)
$ $ $
$ $ $ $
$
$
$
30

$ 127,375380,040504,915337,910451,865421,355338,715437,910435,805628,130476,375532,755328,565406,915194,740
2,786,000350,895356,390360,115493,720658,855
$ 11,009,345
BONDS DEBT SERVICE (Continued)
STATE OF NEW YORK SUPPORTED BONDS(in thousands)
Type
Local Highway and Bridge Service Contract Bonds (Repayment - Secured by a service contract with the State of NY)
Date SoldFinal
Maturity
TrueInterestCost*
PrincipalAmount
9/1995 9/1997 9/1998 9/1998 8/1999 9/2000
11/2001 8/2002
11/2003 5/2007 2/2008
1/2008 4/2008 4/2008 4/2008 4/2010 2/2012 4/2015 4/2017 3/2021 4/2017 4/2017
5.74%5.35%4.97%4.96%5.56%5.26%4.56%4.18%3.96%3.98%2.94%
$ 77,530 452,800 429,845 133,245 370,920 364,465 205,145 650,000 754,045 203,760 247,045
$ 3,888,800
Outstanding12/31/2007 Additions Redemptions
Outstanding12/31/2008Series
$ 10,815 63,305 96,460
127,145 18,155 27,070 47,630
493,125 680,035 203,760
-
$ 1,767,500
$ - - - - - - - - - - 247,045
$ 247,045
10,815 63,30596,460
127,145 - -
8,25026,48067,1852,5502,510
$ 404,700
$ - - - -
18,15527,07039,380
466,645612,850201,210244,535
$ 1,609,845
1995A19971998A1998B1999200020012002200320072008
TOTAL
* As of Issue Date
Highway and Bridge Trust Fund Bonds (Repayment - Secured by a Cooperative Agreement with the State of NY)
3/1998 3/1999 6/1999 3/2000 7/2000 3/2001
10/2001 3/2002 6/2002 8/2002 4/2003 7/2002 3/2004 7/2004 3/2005 9/2005 7/2006 3/2007 6/2007 3/2008 9/2008
5/2008 4/2012 9/2008 4/2011 9/2008 4/2011 4/2012 4/2018 4/2013 4/2020 4/2023 4/2023 4/2024 4/2024 4/2025 4/2025 4/2026 4/2027 4/2027 4/2028 4/2028
5.03%4.62%4.84%5.57%5.27%4.71%4.35%4.49%4.37%4.28%4.07%3.73%3.59%4.17%4.11%4.12%4.54%4.22%4.45%4.64%4.17%
$ 104,05558,3707,6459,810
16,66590,675
120,550178,240175,620562,980150,725271,075202,825233,445150,295
2,770,485334,655356,390360,115
- -
$ 6,154,620
$ - - - - - - - - - - - - - - - - - - -
493,720658,855
$ 1,152,575
$ 104,055 13,075 7,645
- 16,665 39,250 38,015 27,845 46,295 26,735 32,655 70,890 51,180 51,365 20,175 13,405 37,960 11,100 9,080
- -
$ 617,390
$ - 45,295
- 9,810
- 51,425 82,535
150,395 129,325 536,245 118,070 200,185 151,645 182,080 130,120
2,757,080 296,695 345,290 351,035 493,720 658,855
$ 6,689,805
1998B1999A1999B2000A2000B2001A2001B2002A2002B2002C2003A2003B2004A2004B2005A2005B2006A2007A2007B2008A2008B
TOTAL
2002A2003A2004A2005A2006A2007A2007A (Ref)2008A
TOTAL
8/20027/2003
10/20047/20058/20068/20078/20079/2008
3/20223/20233/20243/20253/20263/20273/20183/2028
4.53%4.13%4.09%4.04%4.34%4.67%4.12%4.25%
$ 250,915347,880352,300333,245338,270325,160171,070466,905
$ 2,585,745
$ 102,260218,845266,960296,205332,005325,160171,070
-
$ 1,712,505
$ - - - - - - -
466,905
$ 466,905
$ 22,68533,99032,93034,42032,55010,365
- -
$ 166,940
$ 79,575184,855234,030261,785299,455314,795171,070466,905
$ 2,012,470
State Personal Income Tax Revenue Bonds (Transportation) (Repayment - Secured by a Financing Agreement with the State of NY)
$
31
AUTHORITY BOND PROGRAMS
The Thruway Authority is authorized to issue notes and bonds through private (negotiated) sales. The Authority has issued notes and bonds to finance a portion of our capital program as well as to fund various state and local municipal capital transportation programs. The total amount of bonds and notes issued since l990 for Thruway purposes is $5.426 billion and for state and local projects is $21.574 billion. The following describes these bond programs:
GENERAL REVENUE BONDS - The General Revenue Bonds are secured by a first lien on all tolls, rents, fees and other income derived from the operation of the Thruway. The Series F bonds were issued to pay at maturity the CP-1 Notes, to refund portions of the outstanding Series B, D and E bonds at a present value savings of $18.6 million, and to provide $25 million for the Authority’s Capital Program. The Series G bonds were issued to pay at maturity the 2004A BANs and the CP-2 Notes and to provide $200 million for the Authority’s Capital Program. The Series H bonds were issued to refund a portion of the outstanding Series E bonds at a net present value savings of $18.4 million, and to provide $537 million for the Authority’s Capital Program. The amount issued for capital projects and refunding is $4.170 billion with $2.328 billion currently outstanding. The final maturity of these bonds is January 1, 2037.
LOCAL HIGHWAY AND BRIDGE SERVICE CONTRACT BONDS - The bonds have no pledge on Thruway revenues and are secured solely by payments made by the State under a service contract. These bonds were issued between 1991 and 2003 to provide the Authority with funds to reimburse approximately 1,600 municipalities throughout the State for qualifying capital expenditures for local highway, bridge and multi-modal projects. Additionally, in 2007 the Authority issued $203.8 million of bonds, which refunded certain outstanding bonds and produced $7.2 million in net present value savings. In 2008, the Authority issued $247.0 million of bonds, which refunded certain outstanding bonds and produced $16.4 million in net present value savings. The total amount of bonds issued since 1991 is $5.177 billion with $1.610 billion currently outstanding. The final maturity is March 15, 2021.
STATE PERSONAL INCOME TAX REVENUE BONDS (TRANSPORTATION) - The bonds have no pledge on Thruway revenues and are secured solely by payments made by the State to the Trustee on behalf of the Authority from state personal income tax receipts. The Authority has issued state personal income tax bonds (PIT) each year since August, 2002 for the same program purposes as the local highway and bridge projects under the service contract bonds described above. The Authority is one of five authorized issuers of the PIT bonds. In 2008, the Authority issued bonds totaling $466.9 million, which included $98.4 million to refund certain outstanding bonds and produced $3.5 million in net present value savings. The total amount issued since 2002 is $2.586 billion with $2.012 billion currently outstanding. The final maturity of these bonds is March 15, 2028.
HIGHWAY AND BRIDGE TRUST FUND BONDS - The bonds have no pledge on Thruway revenues and are secured by a pledge of certain payments to the Authority from funds held in the State’s Dedicated Highway and Bridge Trust Fund. These bonds have been issued each year since 1994 to provide funds to reimburse the State for certain expenditures made or to be made by the Department of Transportation in connection with the State’s multi-year Highway and Bridge Capital Program. In 2008, the Authority issued two series of these bonds totaling $1.153 billion, which included $415.6 million to refund certain outstanding bonds and produced $13.8 million in net present value savings. The total amount of bonds issued since 1994 is $13.811 billion with $6.690 billion currently outstanding. The final maturity of the bonds is April 1, 2028.
32
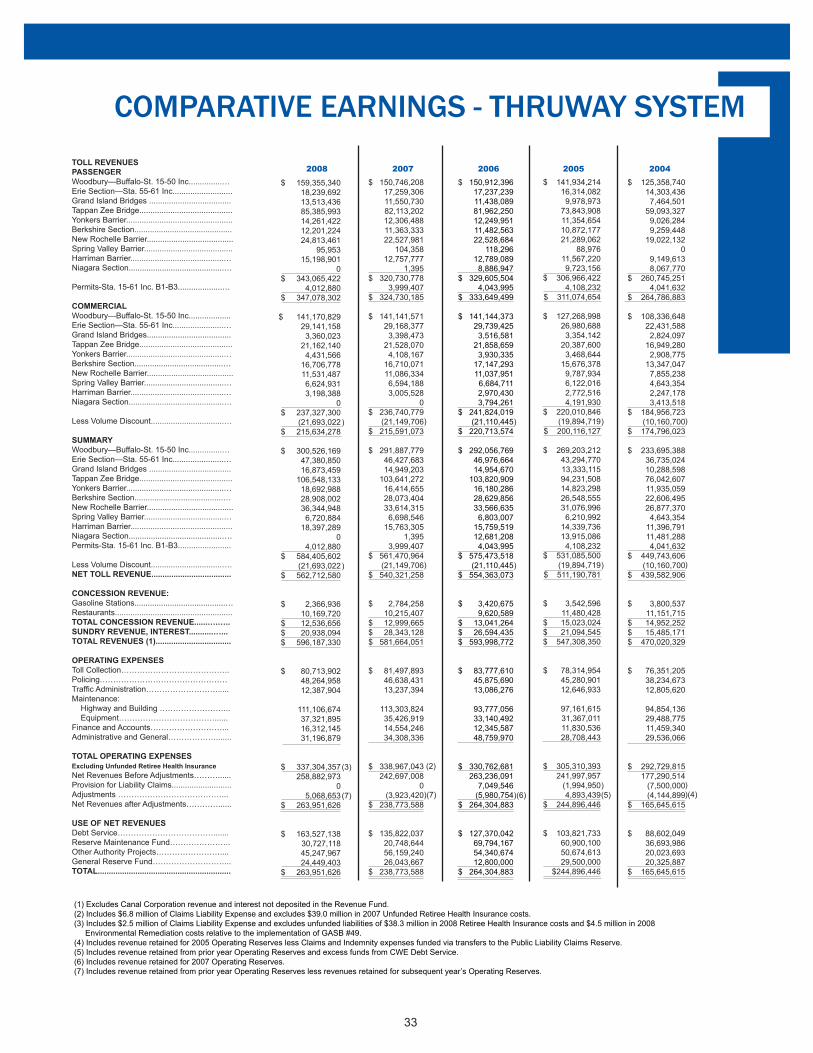
(1) Excludes Canal Corporation revenue and interest not deposited in the Revenue Fund.(2) Includes $6.8 million of Claims Liability Expense and excludes $39.0 million in 2007 Unfunded Retiree Health Insurance costs.(3) Includes $2.5 million of Claims Liability Expense and excludes unfunded liabilities of $38.3 million in 2008 Retiree Health Insurance costs and $4.5 million in 2008 Environmental Remediation costs relative to the implementation of GASB #49.(4) Includes revenue retained for 2005 Operating Reserves less Claims and Indemnity expenses funded via transfers to the Public Liability Claims Reserve.(5) Includes revenue retained from prior year Operating Reserves and excess funds from CWE Debt Service.(6) Includes revenue retained for 2007 Operating Reserves.(7) Includes revenue retained from prior year Operating Reserves less revenues retained for subsequent year’s Operating Reserves.
COMPARATIVE EARNINGS - THRUWAY SYSTEM
33
TOLL REVENUESPASSENGERWoodbury—Buffalo-St. 15-50 Inc...............…Erie Section—Sta. 55-61 Inc...........................Grand Island Bridges .....................................Tappan Zee Bridge..........................................Yonkers Barrier................................................Berkshire Section............................................New Rochelle Barrier.......................................Spring Valley Barrier........................................Harriman Barrier..........................................…Niagara Section...........................................…
Permits-Sta. 15-61 Inc. B1-B3....................…
COMMERCIALWoodbury—Buffalo-St. 15-50 Inc...................Erie Section—Sta. 55-61 Inc.......................…Grand Island Bridges......................................Tappan Zee Bridge..........................................Yonkers Barrier............................................…Berkshire Section........................................…New Rochelle Barrier.......................................Spring Valley Barrier....................................…Harriman Barrier..........................................…Niagara Section...........................................…
Less Volume Discount.................................…
SUMMARYWoodbury—Buffalo-St. 15-50 Inc...............…Erie Section—Sta. 55-61 Inc.......................…Grand Island Bridges .....................................Tappan Zee Bridge..........................................Yonkers Barrier............................................…Berkshire Section........................................…New Rochelle Barrier.......................................Spring Valley Barrier....................................…Harriman Barrier..............................................Niagara Section..........................................….Permits-Sta. 15-61 Inc. B1-B3........................
Less Volume Discount................................….NET TOLL REVENUE....................................
CONCESSION REVENUE:Gasoline Stations.........................................…Restaurants..................................................... TOTAL CONCESSION REVENUE......….…..SUNDRY REVENUE, INTEREST...........…...TOTAL REVENUES (1)..................................
OPERATING EXPENSESToll Collection…………………………………..Policing…………………………………………Traffic Administration……………………….....Maintenance: Highway and Building ……………………... Equipment………………………………......Finance and Accounts………………………...Administrative and General……………….......
TOTAL OPERATING EXPENSESExcluding Unfunded Retiree Health InsuranceNet Revenues Before Adjustments………......Provision for Liability Claims...........................Adjustments …………………………………...Net Revenues after Adjustments…………......
USE OF NET REVENUESDebt Service……………………………….......Reserve Maintenance Fund…………………..Other Authority Projects……………………....General Reserve Fund………………………...TOTAL............................................................
$ 150,746,20817,259,306 11,550,73082,113,20212,306,48811,363,333 22,527,981
104,35812,757,777
1,395 $ 320,730,778
3,999,407 $ 324,730,185
$ 141,141,57129,168,3773,398,473
21,528,0704,108,167
16,710,07111,086,3346,594,1883,005,528
0 $ 236,740,779
(21,149,706 $ 215,591,073
$ 291,887,77946,427,68314,949,203
103,641,27216,414,65528,073,40433,614,3156,698,546
15,763,3051,395
3,999,407 $ 561,470,964
(21,149,706 $ 540,321,258
$ 2,784,25810,215,407
$ 12,999,665 $ 28,343,128 $ 581,664,051
$ 81,497,89346,638,43113,237,394
113,303,82435,426,91914,554,24634,308,336
$ 338,967,043242,697,008
0(3,923,420
$ 238,773,588
$ 135,822,03720,748,64456,159,24026,043,667
$ 238,773,588
)
)
(2)
)(7)
$ 159,355,340 18,239,692 13,513,436 85,385,993 14,261,422 12,201,224 24,813,461
95,953 15,198,901
0 $ 343,065,422
4,012,880 $ 347,078,302
$ 141,170,829 29,141,158 3,360,023
21,162,140 4,431,566
16,706,778 11,531,487 6,624,931 3,198,388
0 $ 237,327,300
(21,693,022 $ 215,634,278
$ 300,526,169 47,380,850 16,873,459
106,548,133 18,692,988 28,908,002 36,344,948 6,720,884
18,397,289 0
4,012,880 $ 584,405,602
(21,693,022 $ 562,712,580
$ 2,366,936 10,169,720
$ 12,536,656 $ 20,938,094 $ 596,187,330
$ 80,713,902 48,264,958 12,387,904
111,106,674 37,321,895 16,312,145 31,196,879
$ 337,304,357 258,882,973
0 5,068,653
$ 263,951,626
$ 163,527,138 30,727,118 45,247,967 24,449,403
$ 263,951,626
)
)
(3)
(7)
$ 141,934,21416,314,0829,978,973
73,843,90811,354,65410,872,17721,289,062
88,97611,567,2209,723,156
$ 306,966,4224,108,232
$ 311,074,654
$ 127,268,99826,980,6883,354,142
20,387,6003,468,644
15,676,3789,787,9346,122,0162,772,5164,191,930
$ 220,010,846(19,894,719
$ 200,116,127
$ 269,203,21243,294,770 13,333,115 94,231,50814,823,298 26,548,555 31,076,996 6,210,992
14,339,736 13,915,086 4,108,232
$ 531,085,500 (19,894,719
$ 511,190,781
$ 3,542,59611,480,428
$ 15,023,024$ 21,094,545 $ 547,308,350
$ 78,314,954 45,280,901
12,646,933 97,161,615 31,367,011 11,830,536 28,708,443
$ 305,310,393 241,997,957 (1,994,950
4,893,439$ 244,896,446
$ 103,821,733 60,900,100 50,674,613 29,500,000
$244,896,446
)
)
)(5)
$ 125,358,74014,303,4367,464,501
59,093,3279,026,2849,259,448
19,022,1320
9,149,6138,067,770
$ 260,745,2514,041,632
$ 264,786,883
$ 108,336,64822,431,5882,824,097
16,949,2802,908,775
13,347,0477,855,2384,643,3542,247,1783,413,518
$ 184,956,723(10,160,700
$ 174,796,023
$ 233,695,38836,735,02410,288,59876,042,60711,935,05922,606,49526,877,3704,643,354
11,396,79111,481,2884,041,632
$ 449,743,606(10,160,700
$ 439,582,906
$ 3,800,53711,151,715
$ 14,952,252$ 15,485,171$ 470,020,329
$ 76,351,20538,234,67312,805,620
94,854,13629,488,77511,459,34029,536,066
$ 292,729,815177,290,514
(7,500,000(4,144,899
$ 165,645,615
$ 88,602,04936,693,98620,023,69320,325,887
$ 165,645,615
20042005200620072008
$ 150,912,396 17,237,239 11,438,089 81,962,250 12,249,951 11,482,563 22,528,684
118,296 12,789,089 8,886,947
$ 329,605,504 4,043,995
$ 333,649,499
$ 141,144,373 29,739,425 3,516,581
21,858,659 3,930,335
17,147,293 11,037,951 6,684,711 2,970,430 3,794,261
$ 241,824,019 (21,110,445
$ 220,713,574
$ 292,056,769 46,976,664 14,954,670
103,820,909 16,180,286 28,629,856 33,566,635 6,803,007
15,759,519 12,681,208 4,043,995
$ 575,473,518 (21,110,445
$ 554,363,073
$ 3,420,675 9,620,589
$ 13,041,264 $ 26,594,435 $ 593,998,772
$ 83,777,610 45,875,690 13,086,276
93,777,056 33,140,492 12,345,587 48,759,970
$ 330,762,681 263,236,091 7,049,546
(5,980,754 $ 264,304,883
$ 127,370,042 69,794,167 54,340,674 12,800,000
$ 264,304,883
)
)
)(6)
)
)
))(4)
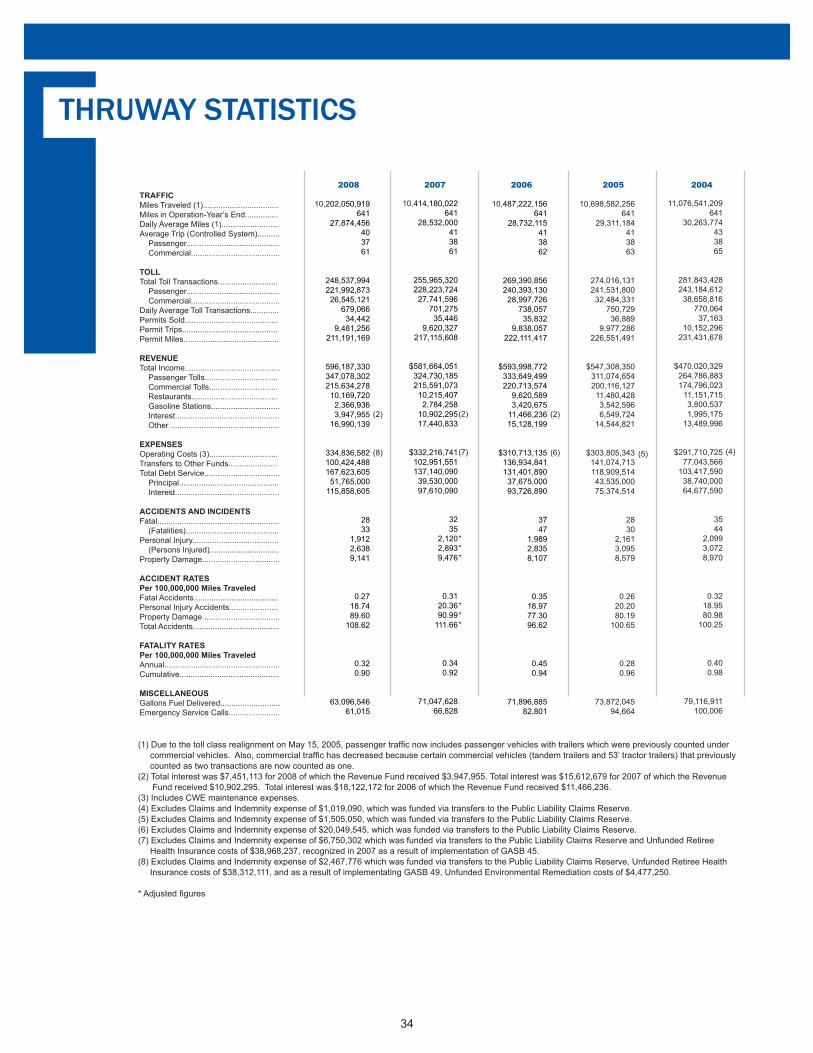
TRAFFICMiles Traveled (1)..................................Miles in Operation-Year’s End...............Daily Average Miles (1)..........................Average Trip (Controlled System).......... Passenger.......................................... Commercial........................................
TOLLTotal Toll Transactions........................... Passenger.......................................... Commercial........................................Daily Average Toll Transactions.............Permits Sold..........................................Permit Trips...........................................Permit Miles...........................................
REVENUETotal Income........................................... Passenger Tolls................................. Commercial Tolls............................... Restaurants....................................... Gasoline Stations............................... Interest............................................... Other .................................................
EXPENSESOperating Costs (3)...............................Transfers to Other Funds......................Total Debt Service.................................. Principal............................................. Interest...............................................
ACCIDENTS AND INCIDENTSFatal....................................................... (Fatalities)..........................................Personal Injury....................................... (Persons Injured)...............................Property Damage...................................
ACCIDENT RATESPer 100,000,000 Miles TraveledFatal Accidents......................................Personal Injury Accidents......................Property Damage...................................Total Accidents.......................................
FATALITY RATESPer 100,000,000 Miles TraveledAnnual....................................................Cumulative.............................................
MISCELLANEOUSGallons Fuel Delivered...........................Emergency Service Calls.......................
(4)
11,076,541,209 641
30,263,774 43 38 65
281,843,428 243,184,612 38,658,816 770,064 37,163
10,152,296 231,431,678
$470,020,329 264,786,883 174,796,023 11,151,715 3,800,537 1,995,175 13,489,996
$291,710,725 77,043,566 103,417,590 38,740,000 64,677,590
35 44 2,099 3,072 8,970
0.3218.9580.98
100.25
0.400.98
79,116,911 100,006
(5)
10,698,582,256 641
29,311,184 41 38 63
274,016,131 241,531,800 32,484,331 750,729 36,889 9,977,286
226,551,491
$547,308,350 311,074,654 200,116,127 11,480,428 3,542,596 6,549,724 14,544,821
$303,805,343 141,074,713
118,909,514 43,535,000 75,374,514
28 30 2,161 3,095 8,579
0.2620.2080.19
100.65
0.280.96
73,872,045 94,664
(2)
(6)
10,487,222,156 641
28,732,115 41 38 62
269,390,856 240,393,130 28,997,726
738,057 35,832
9,838,057 222,111,417
$593,998,772 333,649,499 220,713,574
9,620,589 3,420,675
11,466,236 15,128,199
$310,713,135 136,934,841 131,401,890 37,675,000 93,726,890
37 47 1,989 2,835 8,107
0.3518.9777.3096.62
0.450.94
71,896,885 82,801
THRUWAY STATISTICS
(2)
(7)
***
***
10,414,180,022 641
28,532,000 41 38 61
255,965,320 228,223,724 27,741,596
701,275 35,446
9,620,327 217,115,608
$581,664,051 324,730,185 215,591,073 10,215,407 2,784,258
10,902,295 17,440,833
$332,216,741 102,951,551 137,140,090 39,530,000 97,610,090
32 35 2,120 2,893 9,476
0.3120.3690.99
111.66
0.340.92
71,047,628 66,828
(2)
(8)
10,202,050,919 641
27,874,456 40 37 61
248,537,994 221,992,87326,545,121
679,06634,442
9,481,256211,191,169
596,187,330347,078,302215,634,27810,169,7202,366,9363,947,955
16,990,139
334,836,582100,424,488167,623,60551,765,000
115,858,605
2833
1,9122,6389,141
0.2718.7489.60
108.62
0.320.90
63,096,54661,015
(1) Due to the toll class realignment on May 15, 2005, passenger traffic now includes passenger vehicles with trailers which were previously counted under commercial vehicles. Also, commercial traffic has decreased because certain commercial vehicles (tandem trailers and 53’ tractor trailers) that previously counted as two transactions are now counted as one.(2) Total interest was $7,451,113 for 2008 of which the Revenue Fund received $3,947,955. Total interest was $15,612,679 for 2007 of which the Revenue Fund received $10,902,295. Total interest was $18,122,172 for 2006 of which the Revenue Fund received $11,466,236.(3) Includes CWE maintenance expenses. (4) Excludes Claims and Indemnity expense of $1,019,090, which was funded via transfers to the Public Liability Claims Reserve. (5) Excludes Claims and Indemnity expense of $1,505,050, which was funded via transfers to the Public Liability Claims Reserve. (6) Excludes Claims and Indemnity expense of $20,049,545, which was funded via transfers to the Public Liability Claims Reserve. (7) Excludes Claims and Indemnity expense of $6,750,302 which was funded via transfers to the Public Liability Claims Reserve and Unfunded Retiree Health Insurance costs of $38,968,237, recognized in 2007 as a result of implementation of GASB 45.(8) Excludes Claims and Indemnity expense of $2,467,776 which was funded via transfers to the Public Liability Claims Reserve, Unfunded Retiree Health Insurance costs of $38,312,111, and as a result of implementating GASB 49, Unfunded Environmental Remediation costs of $4,477,250. * Adjusted figures
34
2008 2007 2006 2005 2004
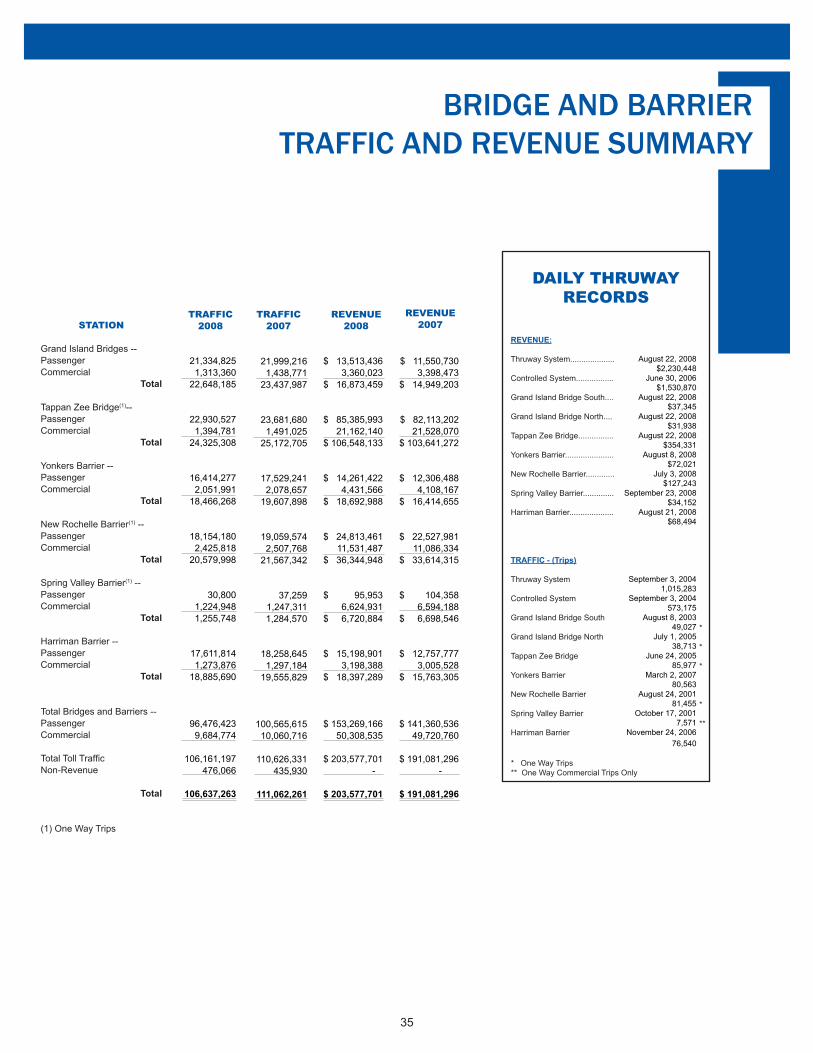
$ 11,550,730 3,398,473 $ 14,949,203
$ 82,113,20221,528,070
$ 103,641,272
$ 12,306,488 4,108,167
$ 16,414,655
$ 22,527,981 11,086,334
$ 33,614,315
$ 104,358 6,594,188
$ 6,698,546
$ 12,757,777
3,005,528 $ 15,763,305
$ 141,360,536 49,720,760
$ 191,081,296
-
$ 191,081,296
$ 13,513,436 3,360,023 $ 16,873,459
$ 85,385,99321,162,140
$ 106,548,133
$ 14,261,422 4,431,566
$ 18,692,988
$ 24,813,461 11,531,487
$ 36,344,948
$ 95,953 6,624,931
$ 6,720,884
$ 15,198,901
3,198,388 $ 18,397,289
$ 153,269,166 50,308,535
$ 203,577,701
-
$ 203,577,701
21,334,8251,313,360
22,648,185
22,930,5271,394,781
24,325,308
16,414,2772,051,991
18,466,268
18,154,1802,425,818
20,579,998
30,8001,224,9481,255,748
17,611,8141,273,876
18,885,690
96,476,4239,684,774
106,161,197476,066
106,637,263
STATION
Grand Island Bridges --PassengerCommercial
Total
Tappan Zee Bridge(1)--PassengerCommercial
Total
Yonkers Barrier --PassengerCommercial
Total
New Rochelle Barrier(1) --PassengerCommercial
Total
Spring Valley Barrier(1) --PassengerCommercial
Total
Harriman Barrier --PassengerCommercial
Total
Total Bridges and Barriers --PassengerCommercial
Total Toll TrafficNon-Revenue
Total
(1) One Way Trips
DAILY THRUWAY RECORDS
REVENUE:
Thruway System....................
Controlled System.................
Grand Island Bridge South....
Grand Island Bridge North....
Tappan Zee Bridge................
Yonkers Barrier......................
New Rochelle Barrier.............
Spring Valley Barrier..............
Harriman Barrier....................
TRAFFIC - (Trips)
Thruway System
Controlled System
Grand Island Bridge South
Grand Island Bridge North
Tappan Zee Bridge
Yonkers Barrier
New Rochelle Barrier
Spring Valley Barrier
Harriman Barrier
*
*
*
*
**
REVENUE2008
TRAFFIC2008
REVENUE2007
TRAFFIC2007
BRIDGE AND BARRIERTRAFFIC AND REVENUE SUMMARY
* One Way Trips** One Way Commercial Trips Only
21,999,2161,438,771
23,437,987
23,681,6801,491,025
25,172,705
17,529,2412,078,657
19,607,898
19,059,5742,507,768
21,567,342
37,2591,247,3111,284,570
18,258,6451,297,184
19,555,829
100,565,61510,060,716
110,626,331435,930
111,062,261
August 22, 2008$2,230,448
June 30, 2006$1,530,870
August 22, 2008$37,345
August 22, 2008$31,938
August 22, 2008$354,331
August 8, 2008$72,021
July 3, 2008$127,243
September 23, 2008$34,152
August 21, 2008$68,494
September 3, 20041,015,283
September 3, 2004573,175
August 8, 200349,027
July 1, 200538,713
June 24, 200585,977
March 2, 200780,563
August 24, 200181,455
October 17, 20017,571
November 24, 200676,540
35
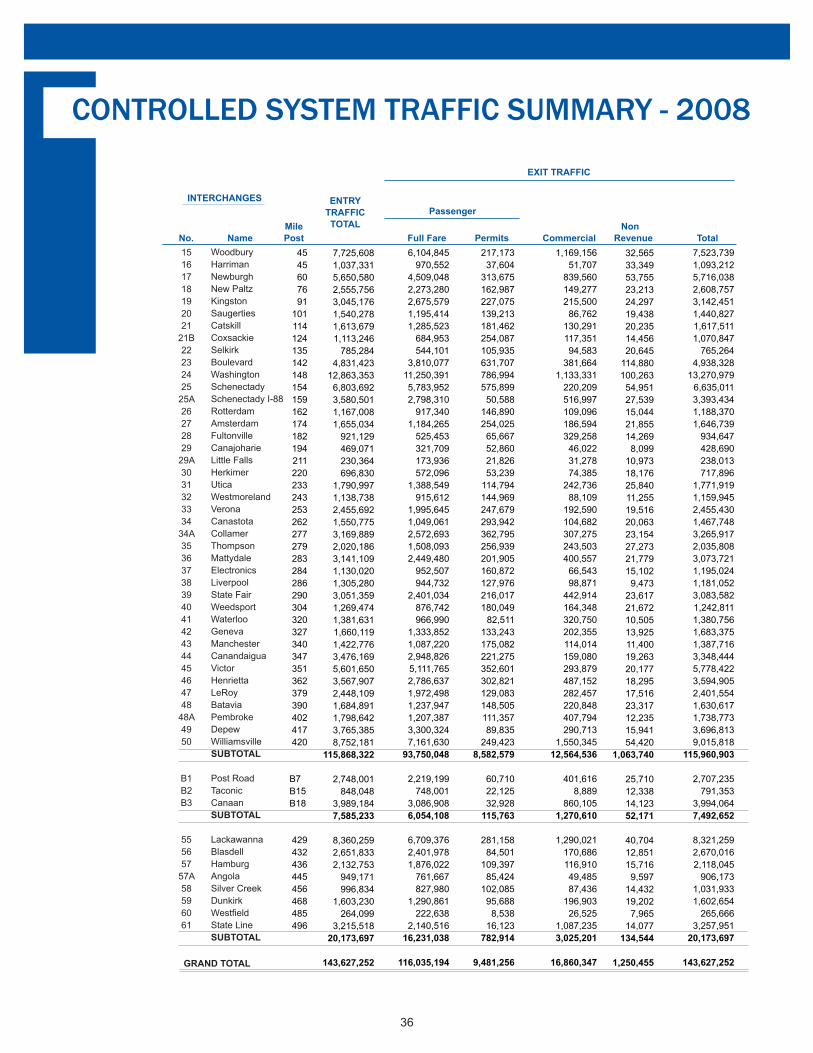
EXIT TRAFFIC
INTERCHANGES
Mile Non No. Name Post Full Fare Permits Commercial Revenue Total
PassengerENTRY
TRAFFICTOTAL
15161718192021
21B22232425
25A26272829
29A3031323334
34A3536373839404142434445464748
48A4950
B1B2B3
555657
57A58596061
Woodbury Harriman Newburgh New Paltz Kingston Saugerties Catskill Coxsackie Selkirk Boulevard Washington Schenectady Schenectady I-88 Rotterdam Amsterdam Fultonville Canajoharie Little Falls Herkimer Utica Westmoreland Verona Canastota Collamer Thompson Mattydale Electronics Liverpool State Fair Weedsport Waterloo Geneva Manchester Canandaigua Victor Henrietta LeRoy Batavia Pembroke Depew WilliamsvilleSUBTOTAL
Post RoadTaconicCanaanSUBTOTAL
LackawannaBlasdellHamburgAngolaSilver CreekDunkirkWestfieldState LineSUBTOTAL
GRAND TOTAL
4545607691
101114124135142148154159162174182194211220233243253262277279283284286290304320327340347351362379390402417420
B7B15B18
429432436445456468485496
CONTROLLED SYSTEM TRAFFIC SUMMARY - 2008
7,523,7391,093,2125,716,0382,608,7573,142,4511,440,8271,617,5111,070,847
765,2644,938,328
13,270,9796,635,0113,393,4341,188,3701,646,739
934,647428,690238,013717,896
1,771,9191,159,9452,455,4301,467,7483,265,9172,035,8083,073,7211,195,0241,181,0523,083,5821,242,8111,380,7561,683,3751,387,7163,348,4445,778,4223,594,9052,401,5541,630,6171,738,7733,696,8139,015,818
115,960,903
2,707,235791,353
3,994,0647,492,652
8,321,2592,670,0162,118,045
906,1731,031,9331,602,654
265,6663,257,951
20,173,697
143,627,252
32,56533,34953,75523,21324,29719,43820,23514,45620,645
114,880100,26354,95127,53915,04421,85514,2698,099
10,97318,17625,84011,25519,51620,06323,15427,27321,77915,1029,473
23,61721,67210,50513,92511,40019,26320,17718,29517,51623,31712,23515,94154,420
1,063,740
25,71012,33814,12352,171
40,70412,85115,7169,597
14,43219,2027,965
14,077134,544
1,250,455
1,169,15651,707
839,560149,277215,50086,762
130,291117,35194,583
381,6641,133,331
220,209516,997109,096186,594329,25846,02231,27874,385
242,73688,109
192,590104,682307,275243,503400,55766,54398,871
442,914164,348320,750202,355114,014159,080293,879487,152282,457220,848407,794290,713
1,550,34512,564,536
401,6168,889
860,1051,270,610
1,290,021170,686116,91049,48587,436
196,90326,525
1,087,2353,025,201
16,860,347
217,17337,604
313,675162,987227,075139,213181,462254,087105,935631,707786,994575,89950,588
146,890254,02565,66752,86021,82653,239
114,794144,969247,679293,942362,795256,939201,905160,872127,976216,017180,049
82,511133,243175,082221,275352,601302,821129,083148,505111,35789,835
249,4238,582,579
60,71022,12532,928
115,763
281,15884,501
109,39785,424
102,08595,6888,538
16,123782,914
9,481,256
6,104,845970,552
4,509,0482,273,2802,675,5791,195,4141,285,523
684,953544,101
3,810,07711,250,3915,783,9522,798,310
917,3401,184,265
525,453321,709173,936572,096
1,388,549915,612
1,995,6451,049,0612,572,6931,508,0932,449,480
952,507944,732
2,401,034876,742966,990
1,333,8521,087,2202,948,8265,111,7652,786,6371,972,4981,237,9471,207,3873,300,3247,161,630
93,750,048
2,219,199748,001
3,086,9086,054,108
6,709,3762,401,9781,876,022
761,667827,980
1,290,861222,638
2,140,51616,231,038
116,035,194
7,725,6081,037,3315,650,5802,555,7563,045,1761,540,2781,613,6791,113,246
785,2844,831,423
12,863,3536,803,6923,580,5011,167,0081,655,034
921,129469,071230,364696,830
1,790,9971,138,7382,455,6921,550,7753,169,8892,020,1863,141,1091,130,0201,305,2803,051,3591,269,4741,381,6311,660,1191,422,7763,476,1695,601,6503,567,9072,448,1091,684,8911,798,6423,765,3858,752,181
115,868,322
2,748,001848,048
3,989,1847,585,233
8,360,2592,651,8332,132,753
949,171996,834
1,603,230264,099
3,215,51820,173,697
143,627,252
36
NEW YORK STATE THRUWAY AUTHORITY
AUDITED FINANCIAL STATEMENTS
Years ended December 31, 2008 and 2007
NEW YORK STATE THRUWAY AUTHORITY TABLE OF CONTENTS
Page Independent Auditors’ Report 1 Management’s Discussion and Analysis 2-8 Basic Financial Statements Statements of Net Assets 9 Statements of Revenues, Expenses, and Changes in Net Assets 10 Statements of Cash Flows 11-12 Notes to Basic Financial Statements 13-33 Independent Auditors’ Report on Internal Control Over Financial Reporting and on Compliance and Other Matters, Including Compliance with Investment Guidelines, Based on an Audit of Financial Statements Performed in Accordance with Government Auditing Standards 34-35
UHY LLP is an independent member of Urbach Hacker Young International Limited
INDEPENDENT AUDITORS’ REPORT Members of the Board New York State Thruway Authority We have audited the accompanying basic financial statements of New York State Thruway Authority (the “Authority”), a component unit of the State of New York, as of and for the years ended December 31, 2008 and 2007, as listed in the table of contents. These financial statements are the responsibility of the Authority’s management. Our responsibility is to express an opinion on these financial statements based on our audits. We conducted our audit in accordance with auditing standards generally accepted in the United States of America and the standards applicable to financial audits contained in Government Auditing Standards, issued by the Comptroller General of the United States. Those standards require that we plan and perform the audit to obtain reasonable assurance about whether the financial statements are free of material misstatement. An audit includes examining, on a test basis, evidence supporting the amounts and disclosures in the financial statements. An audit also includes assessing the accounting principles used and significant estimates made by management, as well as evaluating the overall financial statement presentation. We believe that our audits provide a reasonable basis for our opinion. In our opinion, the financial statements referred to above present fairly, in all material respects, the financial position of the Authority as of December 31, 2008 and 2007, and the changes in its financial position and its cash flows for the years then ended in conformity with accounting principles generally accepted in the United States of America. The management’s discussion and analysis on pages 2 through 8 is not a required part of the basic financial statements but is supplementary information required by accounting principles generally accepted in the United States of America. We have applied certain limited procedures, which consisted principally of inquiries of management regarding the methods of measurement and presentation of the required supplementary information. However, we did not audit the information and express no opinion on it. In accordance with Government Auditing Standards, we have also issued a report dated March 31, 2009 on our consideration of the Authority’s internal control over financial reporting and on our tests of its compliance with certain provisions of laws, regulations, contracts, and grant agreements and other matters, including Compliance with Investment Guidelines. The purpose of that report is to describe the scope of our testing of internal control over financial reporting and compliance and the results of that testing, and not to provide an opinion on internal control over financial reporting or on compliance. That report is an integral part of an audit performed in accordance with Government Auditing Standards and should be read in conjunction with this report in considering the results of our audit.
Albany, New York March 31, 2009
NEW YORK STATE THRUWAY AUTHORITY (A Component Unit of the State of New York)
Management’s Discussion and Analysis
December 31, 2008 and 2007
Page 2
The following discussion and analysis of the New York State Thruway Authority’s (Authority) financial performance provides an overview of the Authority’s activities for the calendar years ended December 31, 2008 and 2007. Please read it in conjunction with the Authority’s financial statements that follow this section. This discussion and analysis is intended to serve as an introduction to the Authority’s financial statements which are comprised of the basic financial statements and the notes to the financial statements. 2008 Financial Highlights
• Toll revenue for the year was $562.7 million, an increase of $22.4 million or 4.1% compared to 2007. This increase is primarily due to toll adjustments implemented in 2008.
• Total operating expenses for the New York State Thruway, the Canal Corporation, Interstate 84 and for
Other Authority Projects for the year, excluding depreciation and amortization, were $453.3 million, a decrease of $5.1 million or 1.1% compared to 2007.
• Total net assets as of December 31, 2008 were approximately $2.35 billion, a decrease of $129.9 million or
5.2% compared to December 31, 2007.
• Total capital assets (net of depreciation) as of December 31, 2008 were approximately $4.46 billion, an increase of $113 million or 2.6% compared to December 31, 2007.
2007 Financial Highlights
• Toll revenue for the year was $540.3 million, a decrease of $14.0 million or 2.5% compared to 2006. This decrease was primarily due to the permanent closing of the Buffalo City Line and Black Rock Toll Barriers in October 2006.
• Total operating expenses for the New York State Thruway, the Canal Corporation, Interstate 84 and for
Other Authority Projects for the year, excluding depreciation and amortization, were $458.4 million, an increase of $57.2 million or 14.3% compared to 2006. This increase was primarily due to the implementation of Government Accounting Standard Board Statement 45 (GASB 45) which established new financial reporting standards for post employment health care benefits offered by state and local governments. More detailed information about GASB 45 is presented in Note 9.
• Total net assets as of December 31, 2007 were approximately $2.48 billion, a decrease of $121.8 million
compared to December 31, 2006.
• Total capital assets (net of depreciation) as of December 31, 2007 were approximately $4.34 billion, an increase of $190.2 million compared to December 31, 2006.
• Effective November 2007 the Authority entered into an agreement with the State of New York (State)
whereby the State fully reimburses the Authority for the costs of maintaining and operating Interstate 84. Overview of the Financial Statements This report consists of three parts: management’s discussion and analysis, the basic financial statements, and the notes to the financial statements. The financial statements provide summary information about the Authority’s overall financial condition, including the Authority’s net assets and related changes. The notes provide explanation and additional disclosures about the financial statements.
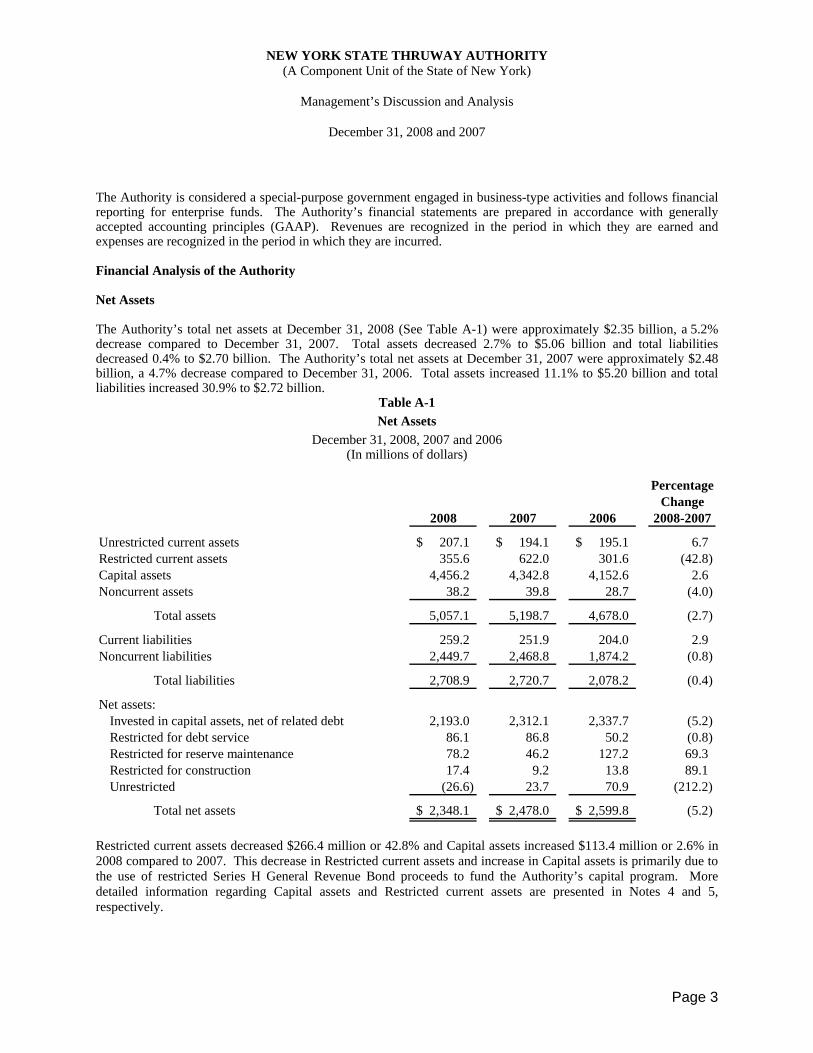
NEW YORK STATE THRUWAY AUTHORITY (A Component Unit of the State of New York)
Management’s Discussion and Analysis
December 31, 2008 and 2007
Page 3
The Authority is considered a special-purpose government engaged in business-type activities and follows financial reporting for enterprise funds. The Authority’s financial statements are prepared in accordance with generally accepted accounting principles (GAAP). Revenues are recognized in the period in which they are earned and expenses are recognized in the period in which they are incurred. Financial Analysis of the Authority Net Assets The Authority’s total net assets at December 31, 2008 (See Table A-1) were approximately $2.35 billion, a 5.2% decrease compared to December 31, 2007. Total assets decreased 2.7% to $5.06 billion and total liabilities decreased 0.4% to $2.70 billion. The Authority’s total net assets at December 31, 2007 were approximately $2.48 billion, a 4.7% decrease compared to December 31, 2006. Total assets increased 11.1% to $5.20 billion and total liabilities increased 30.9% to $2.72 billion.
Table A-1 Net Assets
December 31, 2008, 2007 and 2006 (In millions of dollars)
Percentage
Change2008 2007 2006 2008-2007
Unrestricted current assets 207.1$ 194.1$ 195.1$ 6.7 Restricted current assets 355.6 622.0 301.6 (42.8) Capital assets 4,456.2 4,342.8 4,152.6 2.6 Noncurrent assets 38.2 39.8 28.7 (4.0)
Total assets 5,057.1 5,198.7 4,678.0 (2.7)
Current liabilities 259.2 251.9 204.0 2.9 Noncurrent liabilities 2,449.7 2,468.8 1,874.2 (0.8)
Total liabilities 2,708.9 2,720.7 2,078.2 (0.4)
Net assets:Invested in capital assets, net of related debt 2,193.0 2,312.1 2,337.7 (5.2) Restricted for debt service 86.1 86.8 50.2 (0.8) Restricted for reserve maintenance 78.2 46.2 127.2 69.3 Restricted for construction 17.4 9.2 13.8 89.1 Unrestricted (26.6) 23.7 70.9 (212.2)
Total net assets 2,348.1$ 2,478.0$ 2,599.8$ (5.2) Restricted current assets decreased $266.4 million or 42.8% and Capital assets increased $113.4 million or 2.6% in 2008 compared to 2007. This decrease in Restricted current assets and increase in Capital assets is primarily due to the use of restricted Series H General Revenue Bond proceeds to fund the Authority’s capital program. More detailed information regarding Capital assets and Restricted current assets are presented in Notes 4 and 5, respectively.
NEW YORK STATE THRUWAY AUTHORITY (A Component Unit of the State of New York)
Management’s Discussion and Analysis
December 31, 2008 and 2007
Page 4
Non-current liabilities decreased $19.1 million or 0.8% compared to 2007. This decrease is due to the annual defeasance of principal on the Authority’s General Revenue Bonds and a nearly offsetting increase in the liability for post employment health care benefits. More detailed information regarding non-current liabilities and post employment health care benefits are presented in Notes 6 and 9, respectively. Net assets invested in capital assets, net of related debt consists of capital assets net of accumulated depreciation reduced by the amount of outstanding indebtedness attributable to the acquisition, construction, rehabilitation, or improvement of those assets. Net Assets invested in capital assets, net of related debt decreased $119.1 million or 5.2% compared to 2007. This decrease is primarily due to the use of debt proceeds to fund the majority of the Authority’s capital program expenditures. Unrestricted net assets decreased $50.3 million or 212.2% compared to 2007. This decrease is primarily due to increased liabilities for post employment health care benefits. Changes in Net Assets Net assets decreased by $129.9 million in 2008 compared to 2007 (See Table A-2). The Authority’s total operating revenues for 2008 were $598.8 million, an increase of $15.2 million or 2.6% compared to 2007. Total operating expenses including depreciation and amortization were $676.3 million, an increase of $6.7 million or 1.0% compared to 2007. Net assets decreased by $121.8 million in 2007 compared to 2006. The Authority’s total operating revenues for 2007 were $583.6 million, a decrease of $12.4 million or 2.1% compared to 2006. Total operating expenses including depreciation and amortization were $669.6 million, an increase of $63.5 million or 10.5% compared to 2006.
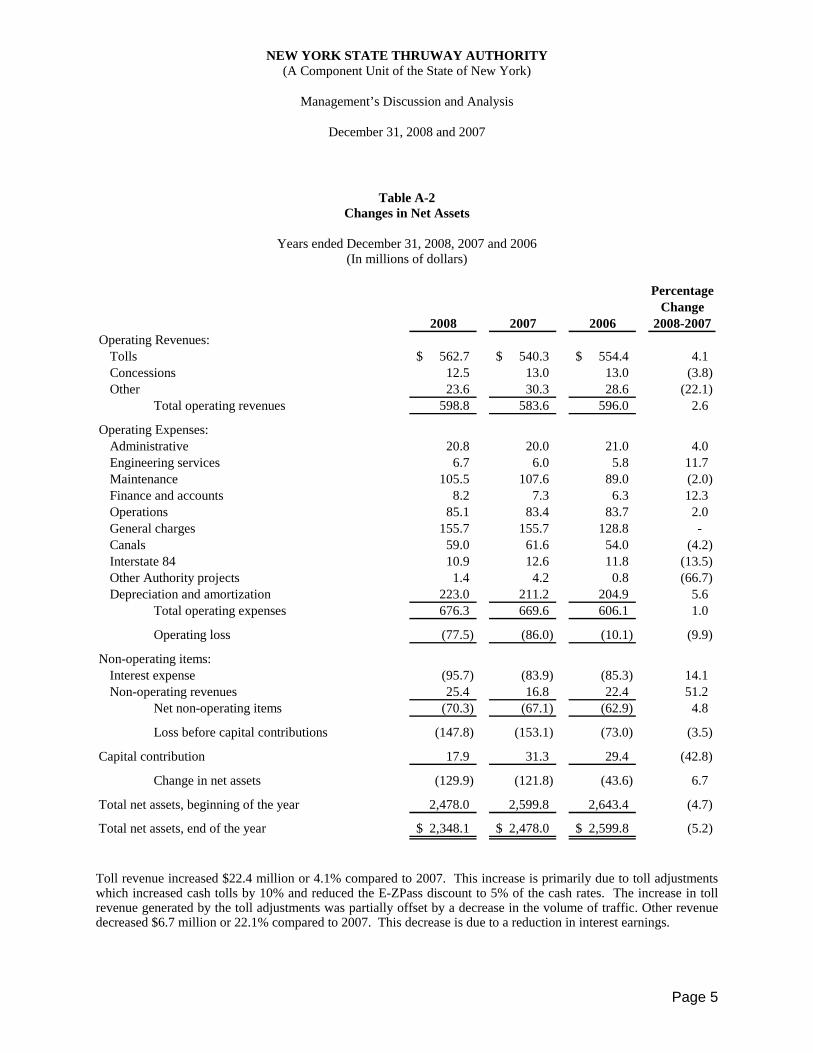
NEW YORK STATE THRUWAY AUTHORITY (A Component Unit of the State of New York)
Management’s Discussion and Analysis
December 31, 2008 and 2007
Page 5
Table A-2 Changes in Net Assets
Years ended December 31, 2008, 2007 and 2006
(In millions of dollars)
PercentageChange
2008 2007 2006 2008-2007Operating Revenues:
Tolls 562.7$ 540.3$ 554.4$ 4.1 Concessions 12.5 13.0 13.0 (3.8) Other 23.6 30.3 28.6 (22.1)
Total operating revenues 598.8 583.6 596.0 2.6
Operating Expenses:Administrative 20.8 20.0 21.0 4.0 Engineering services 6.7 6.0 5.8 11.7 Maintenance 105.5 107.6 89.0 (2.0) Finance and accounts 8.2 7.3 6.3 12.3 Operations 85.1 83.4 83.7 2.0 General charges 155.7 155.7 128.8 - Canals 59.0 61.6 54.0 (4.2) Interstate 84 10.9 12.6 11.8 (13.5) Other Authority projects 1.4 4.2 0.8 (66.7) Depreciation and amortization 223.0 211.2 204.9 5.6
Total operating expenses 676.3 669.6 606.1 1.0
Operating loss (77.5) (86.0) (10.1) (9.9)
Non-operating items:Interest expense (95.7) (83.9) (85.3) 14.1 Non-operating revenues 25.4 16.8 22.4 51.2
Net non-operating items (70.3) (67.1) (62.9) 4.8
Loss before capital contributions (147.8) (153.1) (73.0) (3.5)
Capital contribution 17.9 31.3 29.4 (42.8)
Change in net assets (129.9) (121.8) (43.6) 6.7
Total net assets, beginning of the year 2,478.0 2,599.8 2,643.4 (4.7)
Total net assets, end of the year 2,348.1$ 2,478.0$ 2,599.8$ (5.2) Toll revenue increased $22.4 million or 4.1% compared to 2007. This increase is primarily due to toll adjustments which increased cash tolls by 10% and reduced the E-ZPass discount to 5% of the cash rates. The increase in toll revenue generated by the toll adjustments was partially offset by a decrease in the volume of traffic. Other revenue decreased $6.7 million or 22.1% compared to 2007. This decrease is due to a reduction in interest earnings.
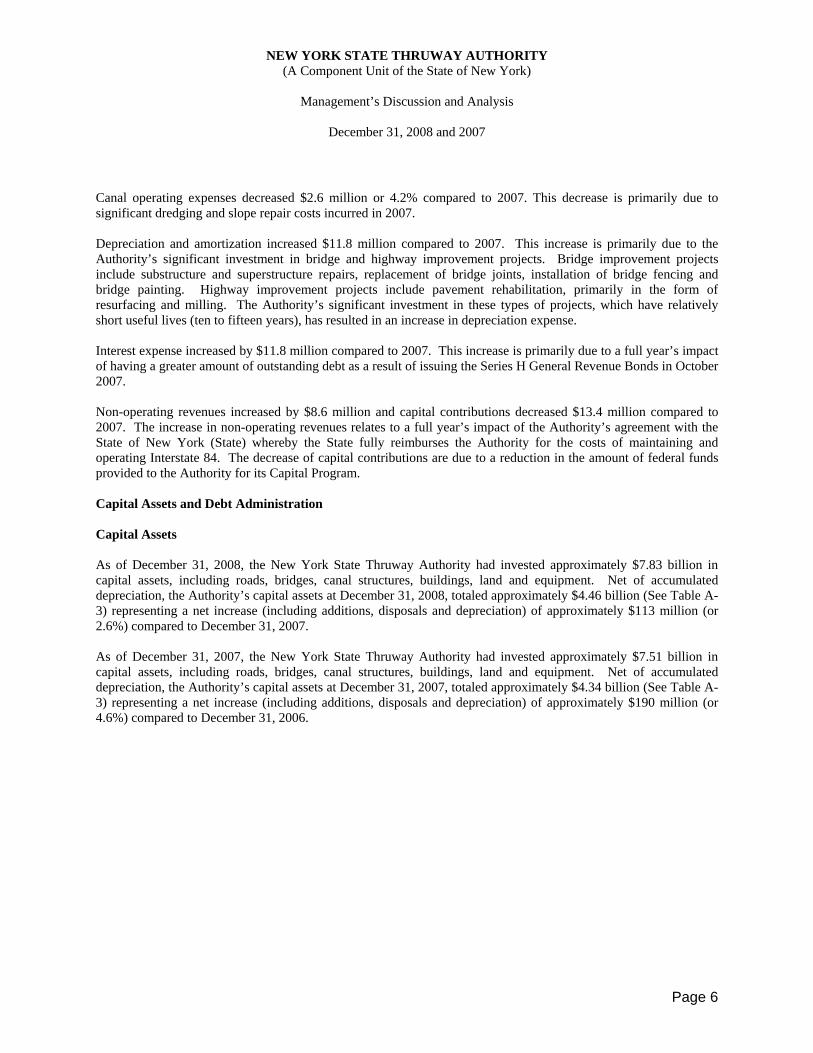
NEW YORK STATE THRUWAY AUTHORITY (A Component Unit of the State of New York)
Management’s Discussion and Analysis
December 31, 2008 and 2007
Page 6
Canal operating expenses decreased $2.6 million or 4.2% compared to 2007. This decrease is primarily due to significant dredging and slope repair costs incurred in 2007. Depreciation and amortization increased $11.8 million compared to 2007. This increase is primarily due to the Authority’s significant investment in bridge and highway improvement projects. Bridge improvement projects include substructure and superstructure repairs, replacement of bridge joints, installation of bridge fencing and bridge painting. Highway improvement projects include pavement rehabilitation, primarily in the form of resurfacing and milling. The Authority’s significant investment in these types of projects, which have relatively short useful lives (ten to fifteen years), has resulted in an increase in depreciation expense. Interest expense increased by $11.8 million compared to 2007. This increase is primarily due to a full year’s impact of having a greater amount of outstanding debt as a result of issuing the Series H General Revenue Bonds in October 2007. Non-operating revenues increased by $8.6 million and capital contributions decreased $13.4 million compared to 2007. The increase in non-operating revenues relates to a full year’s impact of the Authority’s agreement with the State of New York (State) whereby the State fully reimburses the Authority for the costs of maintaining and operating Interstate 84. The decrease of capital contributions are due to a reduction in the amount of federal funds provided to the Authority for its Capital Program. Capital Assets and Debt Administration Capital Assets As of December 31, 2008, the New York State Thruway Authority had invested approximately $7.83 billion in capital assets, including roads, bridges, canal structures, buildings, land and equipment. Net of accumulated depreciation, the Authority’s capital assets at December 31, 2008, totaled approximately $4.46 billion (See Table A-3) representing a net increase (including additions, disposals and depreciation) of approximately $113 million (or 2.6%) compared to December 31, 2007. As of December 31, 2007, the New York State Thruway Authority had invested approximately $7.51 billion in capital assets, including roads, bridges, canal structures, buildings, land and equipment. Net of accumulated depreciation, the Authority’s capital assets at December 31, 2007, totaled approximately $4.34 billion (See Table A-3) representing a net increase (including additions, disposals and depreciation) of approximately $190 million (or 4.6%) compared to December 31, 2006.
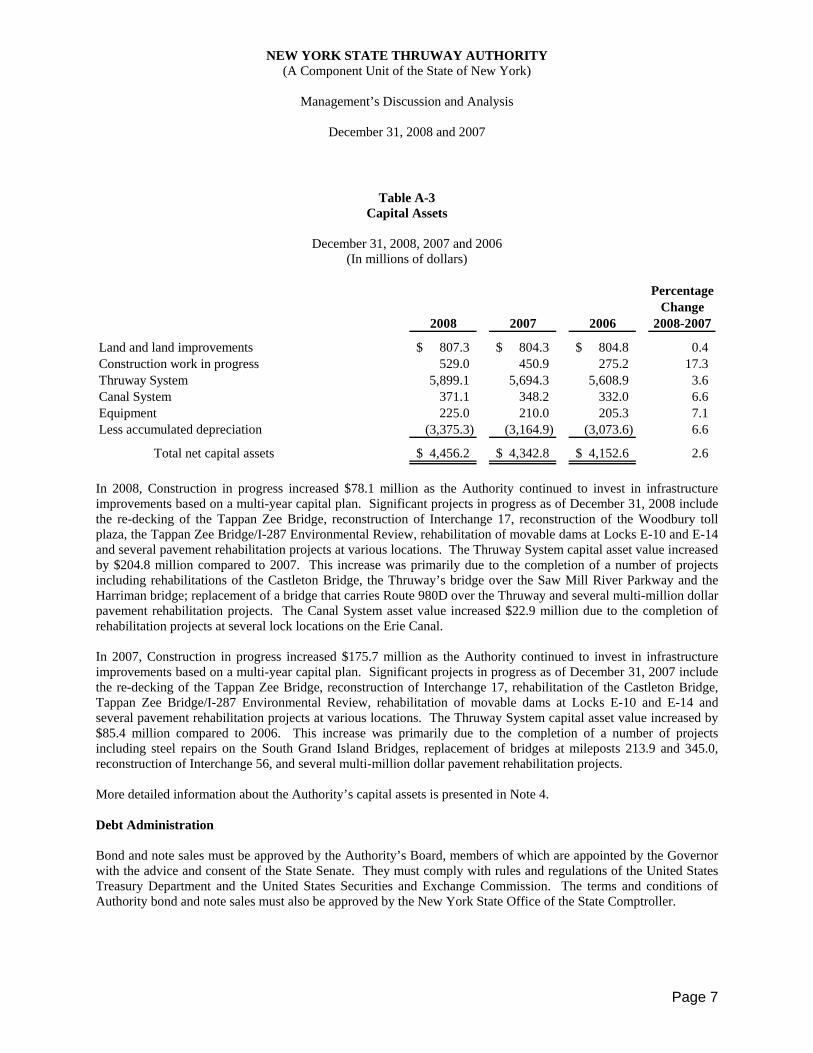
NEW YORK STATE THRUWAY AUTHORITY (A Component Unit of the State of New York)
Management’s Discussion and Analysis
December 31, 2008 and 2007
Page 7
Table A-3 Capital Assets
December 31, 2008, 2007 and 2006
(In millions of dollars)
PercentageChange
2008 2007 2006 2008-2007
Land and land improvements 807.3$ 804.3$ 804.8$ 0.4 Construction work in progress 529.0 450.9 275.2 17.3 Thruway System 5,899.1 5,694.3 5,608.9 3.6 Canal System 371.1 348.2 332.0 6.6 Equipment 225.0 210.0 205.3 7.1 Less accumulated depreciation (3,375.3) (3,164.9) (3,073.6) 6.6
Total net capital assets 4,456.2$ 4,342.8$ 4,152.6$ 2.6 In 2008, Construction in progress increased $78.1 million as the Authority continued to invest in infrastructure improvements based on a multi-year capital plan. Significant projects in progress as of December 31, 2008 include the re-decking of the Tappan Zee Bridge, reconstruction of Interchange 17, reconstruction of the Woodbury toll plaza, the Tappan Zee Bridge/I-287 Environmental Review, rehabilitation of movable dams at Locks E-10 and E-14 and several pavement rehabilitation projects at various locations. The Thruway System capital asset value increased by $204.8 million compared to 2007. This increase was primarily due to the completion of a number of projects including rehabilitations of the Castleton Bridge, the Thruway’s bridge over the Saw Mill River Parkway and the Harriman bridge; replacement of a bridge that carries Route 980D over the Thruway and several multi-million dollar pavement rehabilitation projects. The Canal System asset value increased $22.9 million due to the completion of rehabilitation projects at several lock locations on the Erie Canal. In 2007, Construction in progress increased $175.7 million as the Authority continued to invest in infrastructure improvements based on a multi-year capital plan. Significant projects in progress as of December 31, 2007 include the re-decking of the Tappan Zee Bridge, reconstruction of Interchange 17, rehabilitation of the Castleton Bridge, Tappan Zee Bridge/I-287 Environmental Review, rehabilitation of movable dams at Locks E-10 and E-14 and several pavement rehabilitation projects at various locations. The Thruway System capital asset value increased by $85.4 million compared to 2006. This increase was primarily due to the completion of a number of projects including steel repairs on the South Grand Island Bridges, replacement of bridges at mileposts 213.9 and 345.0, reconstruction of Interchange 56, and several multi-million dollar pavement rehabilitation projects. More detailed information about the Authority’s capital assets is presented in Note 4. Debt Administration Bond and note sales must be approved by the Authority’s Board, members of which are appointed by the Governor with the advice and consent of the State Senate. They must comply with rules and regulations of the United States Treasury Department and the United States Securities and Exchange Commission. The terms and conditions of Authority bond and note sales must also be approved by the New York State Office of the State Comptroller.

NEW YORK STATE THRUWAY AUTHORITY (A Component Unit of the State of New York)
Management’s Discussion and Analysis
December 31, 2008 and 2007
Page 8
Long-term debt includes general revenue bonds of varying rates and maturities issued primarily to fund a portion of the cost of the Authority’s capital plan. At December 31, 2008, the Authority had approximately $2,400.1 million in general revenue bonds outstanding, a decrease of $53.9 million from December 31, 2007 (See Table A-4). Of the $2,400.1 million in general revenue bonds outstanding, approximately $736.6 million are insured and rated Aa3 by Moody’s and AAA by Standard and Poor’s (S&P). The remaining revenue bonds of approximately $1,663.5 million are rated A1 by Moody’s and A+ by S&P. In December 2008, Moody’s and S&P lowered the ratings on the Authority’s outstanding debt to A1 and A+ from Aa3 and AA-, respectively. The rating downgrades reflect recent traffic declines and an erosion of debt service coverage ratios. At December 31, 2007, the Authority had approximately $2,454 million in general revenue bonds outstanding, an increase of $558.1 from December 31, 2006 (See Table A-4). During 2007, the Authority issued $1,009 million in General Revenue Bonds, Series H, whose proceeds were issued to fund a portion of the Authority’s multi-year Capital Program and to refund $450 million of the Authority’s General Revenue Bonds, Series E, for a present value savings of $18.6 million.
Table A-4 Outstanding Debt
Year ended December 31, 2008
(In millions of dollars)
Beginning EndingBalance Additions Retired Balance
General Revenue Bonds 2,454.0$ 0.2$ (54.1)$ 2,400.1$
Year ended December 31, 2007 (In millions of dollars)
Beginning EndingBalance Additions Retired Balance
General Revenue Bonds 1,895.9$ 1,050.3$ (492.2)$ 2,454.0$ More detailed information about the Authority’s long-term debt is presented in Note 6. Contacting the New York State Thruway Authority’s Financial Management This financial report is designed to provide our bondholders, patrons, and other interested parties with a general overview of the Authority’s finances and to demonstrate its accountability for the money it receives. If you have questions about this report, or need additional information, contact the New York State Thruway Authority’s Department of Finance and Accounts, P.O. Box 189, Albany, NY 12201-0189.
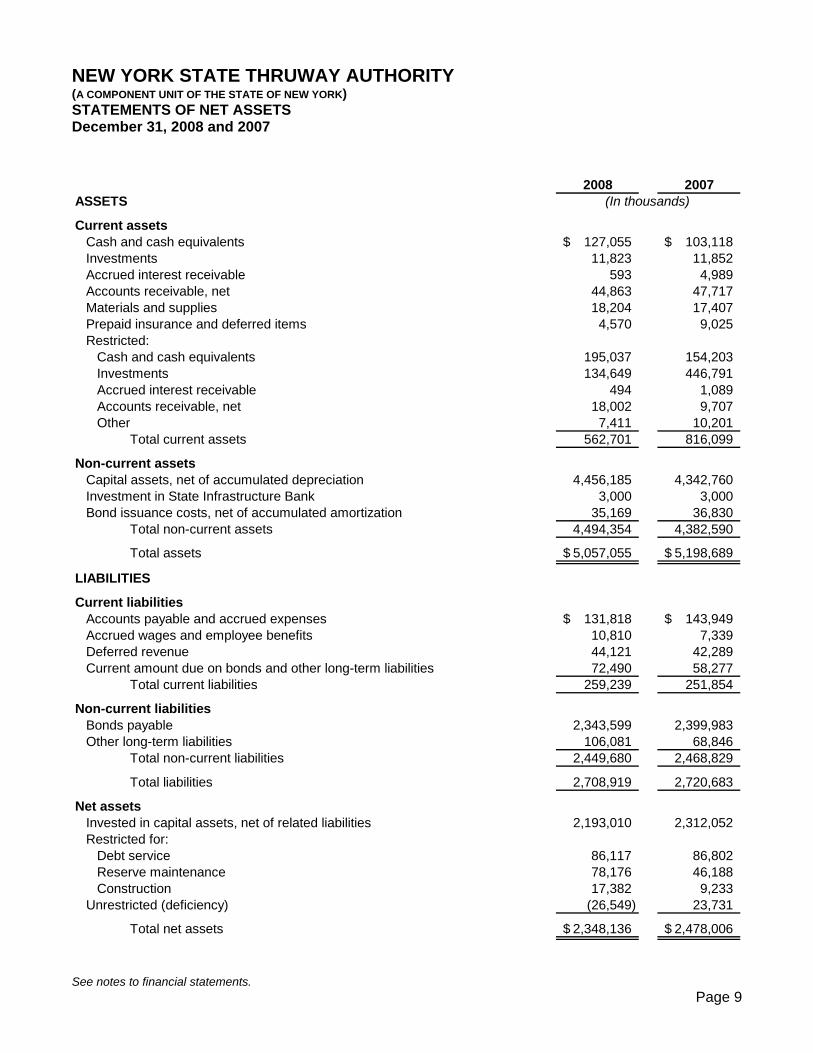
See notes to financial statements. Page 9
NEW YORK STATE THRUWAY AUTHORITY (A COMPONENT UNIT OF THE STATE OF NEW YORK) STATEMENTS OF NET ASSETS December 31, 2008 and 2007
2008 2007ASSETS (In thousands)
Current assetsCash and cash equivalents 127,055$ 103,118$ Investments 11,823 11,852 Accrued interest receivable 593 4,989 Accounts receivable, net 44,863 47,717 Materials and supplies 18,204 17,407 Prepaid insurance and deferred items 4,570 9,025 Restricted:
Cash and cash equivalents 195,037 154,203 Investments 134,649 446,791 Accrued interest receivable 494 1,089 Accounts receivable, net 18,002 9,707 Other 7,411 10,201
Total current assets 562,701 816,099
Non-current assetsCapital assets, net of accumulated depreciation 4,456,185 4,342,760 Investment in State Infrastructure Bank 3,000 3,000 Bond issuance costs, net of accumulated amortization 35,169 36,830
Total non-current assets 4,494,354 4,382,590
Total assets 5,057,055$ 5,198,689$
LIABILITIES
Current liabilitiesAccounts payable and accrued expenses 131,818$ 143,949$ Accrued wages and employee benefits 10,810 7,339 Deferred revenue 44,121 42,289 Current amount due on bonds and other long-term liabilities 72,490 58,277
Total current liabilities 259,239 251,854
Non-current liabilitiesBonds payable 2,343,599 2,399,983 Other long-term liabilities 106,081 68,846
Total non-current liabilities 2,449,680 2,468,829
Total liabilities 2,708,919 2,720,683
Net assetsInvested in capital assets, net of related liabilities 2,193,010 2,312,052 Restricted for:
Debt service 86,117 86,802 Reserve maintenance 78,176 46,188 Construction 17,382 9,233
Unrestricted (deficiency) (26,549) 23,731
Total net assets 2,348,136$ 2,478,006$
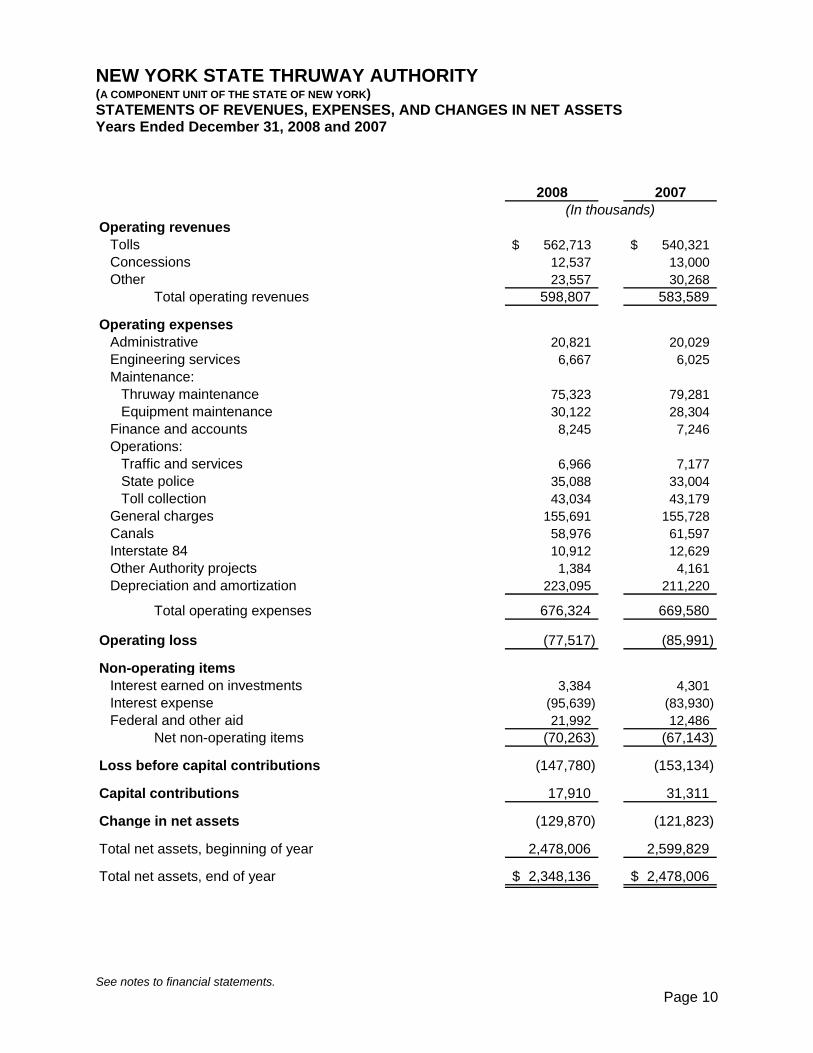
See notes to financial statements. Page 10
NEW YORK STATE THRUWAY AUTHORITY (A COMPONENT UNIT OF THE STATE OF NEW YORK) STATEMENTS OF REVENUES, EXPENSES, AND CHANGES IN NET ASSETS Years Ended December 31, 2008 and 2007
2008 2007(In thousands)
Operating revenuesTolls 562,713$ 540,321$ Concessions 12,537 13,000 Other 23,557 30,268
Total operating revenues 598,807 583,589
Operating expenses Administrative 20,821 20,029 Engineering services 6,667 6,025 Maintenance:
Thruway maintenance 75,323 79,281 Equipment maintenance 30,122 28,304
Finance and accounts 8,245 7,246 Operations:
Traffic and services 6,966 7,177 State police 35,088 33,004 Toll collection 43,034 43,179
General charges 155,691 155,728 Canals 58,976 61,597 Interstate 84 10,912 12,629 Other Authority projects 1,384 4,161 Depreciation and amortization 223,095 211,220
Total operating expenses 676,324 669,580
Operating loss (77,517) (85,991)
Non-operating itemsInterest earned on investments 3,384 4,301 Interest expense (95,639) (83,930) Federal and other aid 21,992 12,486
Net non-operating items (70,263) (67,143)
Loss before capital contributions (147,780) (153,134)
Capital contributions 17,910 31,311
Change in net assets (129,870) (121,823)
Total net assets, beginning of year 2,478,006 2,599,829
Total net assets, end of year 2,348,136$ 2,478,006$
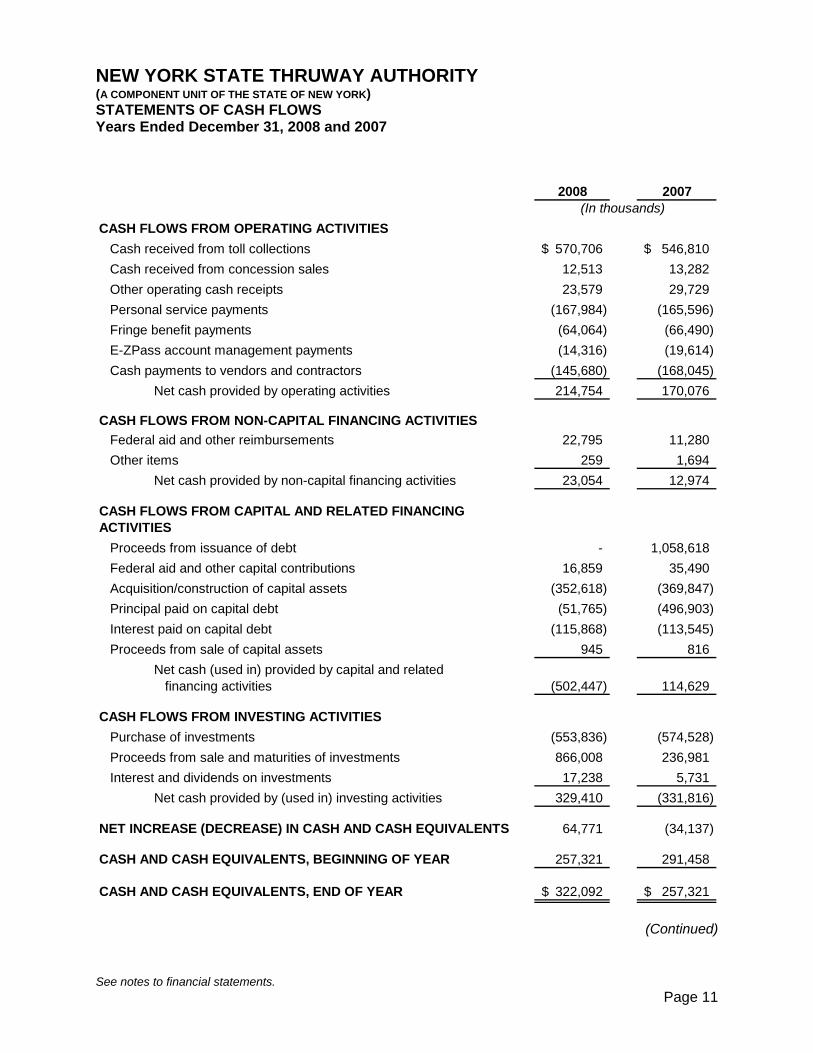
See notes to financial statements. Page 11
NEW YORK STATE THRUWAY AUTHORITY (A COMPONENT UNIT OF THE STATE OF NEW YORK) STATEMENTS OF CASH FLOWS Years Ended December 31, 2008 and 2007
2008 2007(In thousands)
CASH FLOWS FROM OPERATING ACTIVITIESCash received from toll collections 570,706$ 546,810$ Cash received from concession sales 12,513 13,282 Other operating cash receipts 23,579 29,729 Personal service payments (167,984) (165,596) Fringe benefit payments (64,064) (66,490) E-ZPass account management payments (14,316) (19,614) Cash payments to vendors and contractors (145,680) (168,045)
Net cash provided by operating activities 214,754 170,076
CASH FLOWS FROM NON-CAPITAL FINANCING ACTIVITIESFederal aid and other reimbursements 22,795 11,280 Other items 259 1,694
Net cash provided by non-capital financing activities 23,054 12,974
CASH FLOWS FROM CAPITAL AND RELATED FINANCINGACTIVITIES
Proceeds from issuance of debt - 1,058,618 Federal aid and other capital contributions 16,859 35,490 Acquisition/construction of capital assets (352,618) (369,847) Principal paid on capital debt (51,765) (496,903) Interest paid on capital debt (115,868) (113,545) Proceeds from sale of capital assets 945 816
Net cash (used in) provided by capital and relatedfinancing activities (502,447) 114,629
CASH FLOWS FROM INVESTING ACTIVITIESPurchase of investments (553,836) (574,528) Proceeds from sale and maturities of investments 866,008 236,981 Interest and dividends on investments 17,238 5,731
Net cash provided by (used in) investing activities 329,410 (331,816)
NET INCREASE (DECREASE) IN CASH AND CASH EQUIVALENTS 64,771 (34,137)
CASH AND CASH EQUIVALENTS, BEGINNING OF YEAR 257,321 291,458
CASH AND CASH EQUIVALENTS, END OF YEAR 322,092$ 257,321$
(Continued)
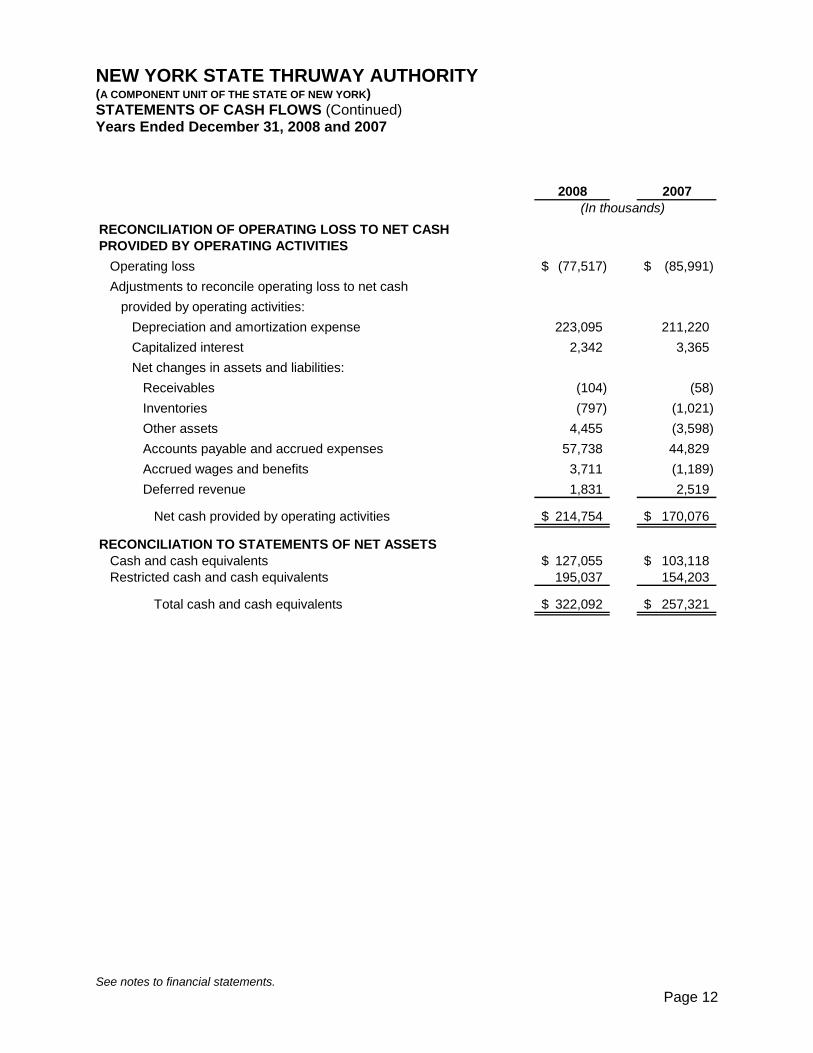
See notes to financial statements. Page 12
NEW YORK STATE THRUWAY AUTHORITY (A COMPONENT UNIT OF THE STATE OF NEW YORK) STATEMENTS OF CASH FLOWS (Continued) Years Ended December 31, 2008 and 2007
2008 2007(In thousands)
RECONCILIATION OF OPERATING LOSS TO NET CASHPROVIDED BY OPERATING ACTIVITIES
Operating loss (77,517)$ (85,991)$ Adjustments to reconcile operating loss to net cash
provided by operating activities:Depreciation and amortization expense 223,095 211,220 Capitalized interest 2,342 3,365 Net changes in assets and liabilities:
Receivables (104) (58) Inventories (797) (1,021) Other assets 4,455 (3,598) Accounts payable and accrued expenses 57,738 44,829 Accrued wages and benefits 3,711 (1,189) Deferred revenue 1,831 2,519
Net cash provided by operating activities 214,754$ 170,076$
RECONCILIATION TO STATEMENTS OF NET ASSETSCash and cash equivalents 127,055$ 103,118$ Restricted cash and cash equivalents 195,037 154,203
Total cash and cash equivalents 322,092$ 257,321$
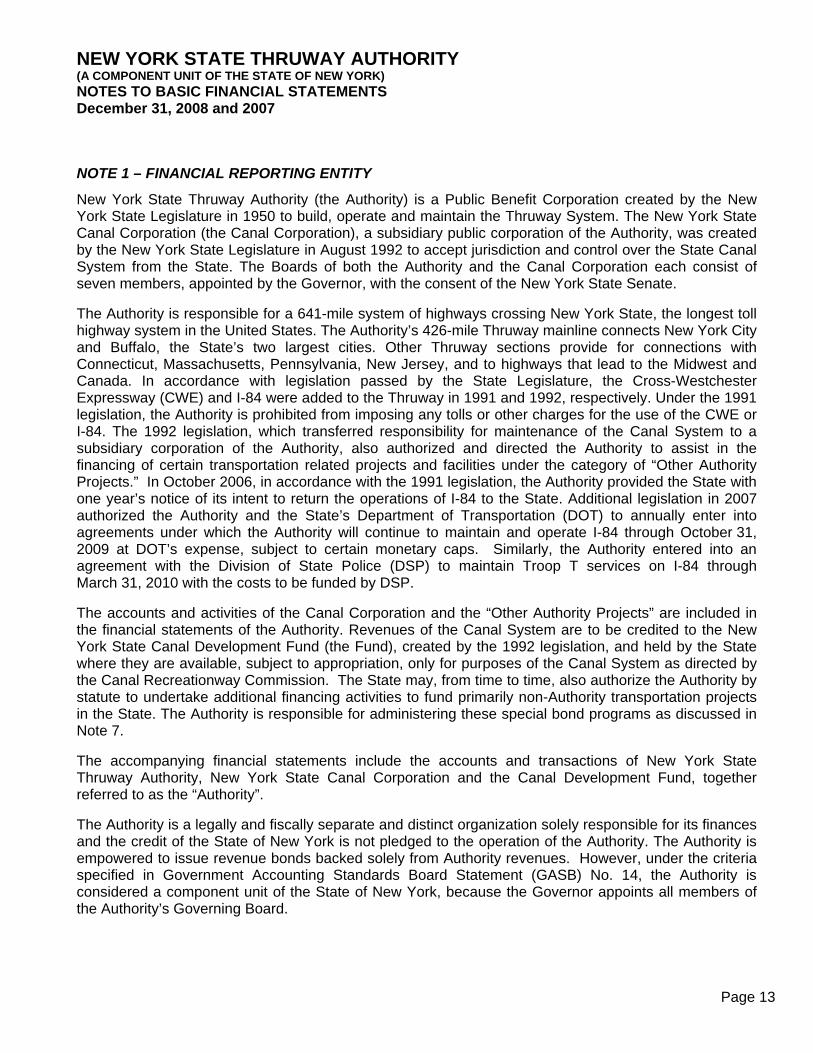
NEW YORK STATE THRUWAY AUTHORITY (A COMPONENT UNIT OF THE STATE OF NEW YORK) NOTES TO BASIC FINANCIAL STATEMENTS December 31, 2008 and 2007
Page 13
NOTE 1 – FINANCIAL REPORTING ENTITY
New York State Thruway Authority (the Authority) is a Public Benefit Corporation created by the New York State Legislature in 1950 to build, operate and maintain the Thruway System. The New York State Canal Corporation (the Canal Corporation), a subsidiary public corporation of the Authority, was created by the New York State Legislature in August 1992 to accept jurisdiction and control over the State Canal System from the State. The Boards of both the Authority and the Canal Corporation each consist of seven members, appointed by the Governor, with the consent of the New York State Senate.
The Authority is responsible for a 641-mile system of highways crossing New York State, the longest toll highway system in the United States. The Authority’s 426-mile Thruway mainline connects New York City and Buffalo, the State’s two largest cities. Other Thruway sections provide for connections with Connecticut, Massachusetts, Pennsylvania, New Jersey, and to highways that lead to the Midwest and Canada. In accordance with legislation passed by the State Legislature, the Cross-Westchester Expressway (CWE) and I-84 were added to the Thruway in 1991 and 1992, respectively. Under the 1991 legislation, the Authority is prohibited from imposing any tolls or other charges for the use of the CWE or I-84. The 1992 legislation, which transferred responsibility for maintenance of the Canal System to a subsidiary corporation of the Authority, also authorized and directed the Authority to assist in the financing of certain transportation related projects and facilities under the category of “Other Authority Projects.” In October 2006, in accordance with the 1991 legislation, the Authority provided the State with one year’s notice of its intent to return the operations of I-84 to the State. Additional legislation in 2007 authorized the Authority and the State’s Department of Transportation (DOT) to annually enter into agreements under which the Authority will continue to maintain and operate I-84 through October 31, 2009 at DOT’s expense, subject to certain monetary caps. Similarly, the Authority entered into an agreement with the Division of State Police (DSP) to maintain Troop T services on I-84 through March 31, 2010 with the costs to be funded by DSP.
The accounts and activities of the Canal Corporation and the “Other Authority Projects” are included in the financial statements of the Authority. Revenues of the Canal System are to be credited to the New York State Canal Development Fund (the Fund), created by the 1992 legislation, and held by the State where they are available, subject to appropriation, only for purposes of the Canal System as directed by the Canal Recreationway Commission. The State may, from time to time, also authorize the Authority by statute to undertake additional financing activities to fund primarily non-Authority transportation projects in the State. The Authority is responsible for administering these special bond programs as discussed in Note 7.
The accompanying financial statements include the accounts and transactions of New York State Thruway Authority, New York State Canal Corporation and the Canal Development Fund, together referred to as the “Authority”.
The Authority is a legally and fiscally separate and distinct organization solely responsible for its finances and the credit of the State of New York is not pledged to the operation of the Authority. The Authority is empowered to issue revenue bonds backed solely from Authority revenues. However, under the criteria specified in Government Accounting Standards Board Statement (GASB) No. 14, the Authority is considered a component unit of the State of New York, because the Governor appoints all members of the Authority’s Governing Board.
NEW YORK STATE THRUWAY AUTHORITY (A COMPONENT UNIT OF THE STATE OF NEW YORK) NOTES TO BASIC FINANCIAL STATEMENTS December 31, 2008 and 2007
Page 14
NOTE 2 – SUMMARY OF SIGNIFICANT ACCOUNTING POLICIES
The accompanying financial statements have been prepared in conformity with generally accepted accounting principles as applied to governmental units. The GASB is the accepted standard-setting body for establishing governmental accounting and financial reporting principles. In accordance with the provisions of the GASB Statement No. 20, Accounting and Financial Reporting for Proprietary Funds and Other Governmental Entities that use Proprietary Fund Accounting, the Authority has elected to apply all Financial Accounting Standards Board statements and interpretations issued before November 1989, unless these standards and interpretations conflict with or contradict GASB pronouncements. The more significant accounting policies are described below:
(a) Basis of Accounting
The Authority’s activities are accounted for similar to those often found in the private sector using the flow of economic resources measurement focus and the accrual basis of accounting. All assets, liabilities, net assets, revenues, and expenses are accounted for through a single enterprise fund with revenues recorded when earned and expenses recorded at the time liabilities are incurred.
The principal revenues of the Authority are toll revenues received from patrons. The Authority also recognizes as operating revenue the rental fees received from concessionaires from operating leases on concession property, special hauling fees charged to overweight or oversize vehicles, and certain revenue collected from the lease of property. Operating expenses for the Authority include maintenance costs, administrative expenses, and depreciation on capital assets. All revenues and expenses not meeting this definition are reported as non-operating items.
The New York State Office of the State Comptroller requires that the Authority report in accordance with generally accepted accounting principles as it is a component unit of the State. The Authority’s bond resolution, however, requires that certain funds and accounts be established and maintained. The Authority consolidates these funds and accounts for the purpose of providing an enterprise fund presentation in its basic financial statements.
(b) Cash, Cash Equivalents and Investments
Cash includes amounts in demand deposits. Cash equivalents include all highly liquid deposits with an original maturity of three months or less when purchased. These deposits are fully collateralized or covered by federal deposit insurance.
Investments include financial instruments with an original maturity of more than three months and are recorded at amortized cost. These investments are not included in cash and cash equivalents in the Statement of Cash Flows.
The Authority manages its investments pursuant to the respective bond resolutions, Public Authorities Law and the Authority’s Investment Policy approved annually by the Authority’s Board. Permitted investments are defined as obligations in which the State Comptroller may invest pursuant to Section 98(a) of the State Finance Law, including obligations of the United States and its Federal agencies, collateralized time deposits, commercial paper, bankers acceptances and repurchase agreements.
NEW YORK STATE THRUWAY AUTHORITY (A COMPONENT UNIT OF THE STATE OF NEW YORK) NOTES TO BASIC FINANCIAL STATEMENTS December 31, 2008 and 2007
Page 15
NOTE 2 – SUMMARY OF SIGNIFICANT ACCOUNTING POLICIES (Continued)
The Authority’s investment policy has established criteria that mitigates certain credit risks and interest rate risks. The policy has established investment concentration limits for each of the Authority’s investment portfolios. The policy also requires that deposits and investments be held by a third-party custodian who may not otherwise be a counter-party to the transactions, and that securities are held in the name of the Authority.
Custodial credit risk for deposits is the risk that, in the event of a bank failure, the Authority’s deposits may not be returned. The Authority’s policy to address this risk requires the custodian or depository bank to provide collateral in an amount equal to or greater than the amount on deposit, with a third-party custodian in the Authority’s name.
Interest rate risk is also addressed in the Authority’s policy which requires the purchase of securities with the intention of holding them to maturity and does not limit the term of any investment. It is the Authority’s practice to invest funds to the date of the anticipated need of the funds. Consequently, the Authority’s investments have maturities of 12 months or less.
(c) Accounts Receivable Accounts receivable consist primarily of receivables from commercial transportation companies and
Federal and State governments under various Federal and State grant programs. All commercial accounts receivable are guaranteed by surety bonds and/or cash deposits.
(d) Materials and Supplies Materials and supplies are principally valued at weighted average cost. The cost of such items is
recognized as an expense when used. (e) Deferred Revenue Deferred revenue consists of prepaid deposits made by private and commercial customers into
E-ZPass accounts held by the Authority and 2009 and 2008 annual permit revenues collected in 2008 and 2007, respectively.
(f) Restricted Assets Certain proceeds of the Thruway revenue bonds are restricted by applicable bond covenants for
construction or set aside as reserves to ensure repayment of the Authority’s bonds. Certain other assets are accumulated and restricted in accordance with the bond resolutions for the purpose of paying interest and principal debt payments that are due on a semi-annual and annual basis, respectively, and for the purpose of maintaining reserve funds at required levels. Payments from restricted funds are governed by the bond resolutions and, as such, expenses which do not meet these standards are paid from unrestricted funds.
NEW YORK STATE THRUWAY AUTHORITY (A COMPONENT UNIT OF THE STATE OF NEW YORK) NOTES TO BASIC FINANCIAL STATEMENTS December 31, 2008 and 2007
Page 16
NOTE 2 – SUMMARY OF SIGNIFICANT ACCOUNTING POLICIES (Continued) (g) Toll Revenues Toll revenues are stated net of volume and other discounts approximating $21.7 million and $21.1
million in 2008 and 2007. During 2008, the Authority implemented certain toll rate adjustments which impacted revenues, including a 10% increase in cash tolls (in January 2008) and a 5% reduction in the E-ZPass discount (in June 2008).
(h) Pensions Substantially all Authority employees, as well as the State Police assigned to the Thruway System,
are members of cost sharing multiple-employer public employee retirement systems. Expenses are based on billings which are paid currently.
(i) Other Post-Employment Benefits
In accordance with GASB Statement No. 45, the Authority recognizes in its financial statements, the financial impact of post-employment benefits, principally employer funded health care costs. The impact on the Authority’s financial position and results of operations is more fully disclosed under Note 9.
(j) Compensated Absences
Vacation leave accumulates for all full-time employees of the Authority, ranging from 13 to 25 days per year, and any unused amounts up to 30 days are considered vested and paid upon retirement or termination. Authority employees also accumulate sick leave at the rate of 10 to 13 days per year and personal leave credits at the rate of 3 to 5 days per year. Employees may use the accumulated sick and personal leave credits according to the established policy; however, generally no cash is paid for these accumulated credits at the time of retirement or termination. The liability for vested compensated absences has been computed to approximate $11,315,000 and $11,075,000 at December 31, 2008 and 2007, respectively, and is classified as a long term liability.
(k) Bond Discounts/Premiums, Deferred Losses on Advanced and Current Refunding and Bond
Issuance Costs
Bond discounts/premiums and deferred losses on advanced and current refunding are presented as components of bonds payable and bond issuance costs are presented as a component of non-current assets on the Statements of Net Assets. The discounts/premiums and issuance costs are amortized over the life of the bonds on a method that approximates the effective interest method. Deferred losses on advanced and current refunding are amortized over the remaining life of the old debt or the life of the new debt, whichever is shorter. Net amortization related to net bond discounts/premiums and deferred losses on advanced and current refunding was approximately $2,066,000 and $2,225,000 for 2008 and 2007, respectively, and was included as an offset of interest expense. Depreciation and amortization expense includes amortization of bond issuance costs and surety bond costs totaling approximately $1,726,000 in both 2008 and 2007.
NEW YORK STATE THRUWAY AUTHORITY (A COMPONENT UNIT OF THE STATE OF NEW YORK) NOTES TO BASIC FINANCIAL STATEMENTS December 31, 2008 and 2007
Page 17
NOTE 2 – SUMMARY OF SIGNIFICANT ACCOUNTING POLICIES (Continued) (l) Arbitrage
The Tax Reform Act of 1986 imposed additional restrictive regulations, reporting requirements and an arbitrage rebate liability on issuers of tax-exempt debt. This Act requires the remittance to the IRS of 90% of the cumulative rebatable arbitrage within 60 days of the end of each five-year reporting period following the issuance of governmental bonds. The Authority’s policy is to annually record a liability representing the estimated amount owed. The Authority actively manages its invested bond proceeds to minimize any arbitrage liability. The Authority had no cumulative arbitrage rebate liability for the years ended December 31, 2008 and 2007.
(m) Income Taxes
The Authority is a public benefit corporation of the State of New York. As such, income earned in the exercise of its essential government functions is exempt from state and federal income taxes.
(n) Implementation of Accounting Pronouncements
During 2008, the Authority adopted GASB Statement No. 49, Accounting and Financial Reporting for Pollution Remediation Obligations. Statement No. 49 requires governmental entities, including the Authority, to disclose the nature and estimated cost for environmental remediation obligations. The impact on the Authority’s financial position and results of operations is more fully disclosed under Note 10 as Environmental Remediation.
During 2007, the Authority adopted, on a prospective basis, GASB Statement No. 45, Accounting and Financial Reporting by Employers for Post Employment Benefits Other than Pensions. Statement No. 45 requires governmental entities, including the Authority, to recognize in its financial statements the financial impact of post employment benefits, principally employer funded health care costs. The impact on the Authority’s financial position and results of operations is more fully disclosed under Note 9.
(o) Use of Estimates
The preparation of financial statements in conformity with accounting principles generally accepted in the United States of America requires management to make estimates and assumptions that affect the reported amounts of assets and liabilities, the disclosure of contingencies at the date of the financial statements, and the reporting of revenues and expenses during the reporting period. Actual results could differ from those estimates.
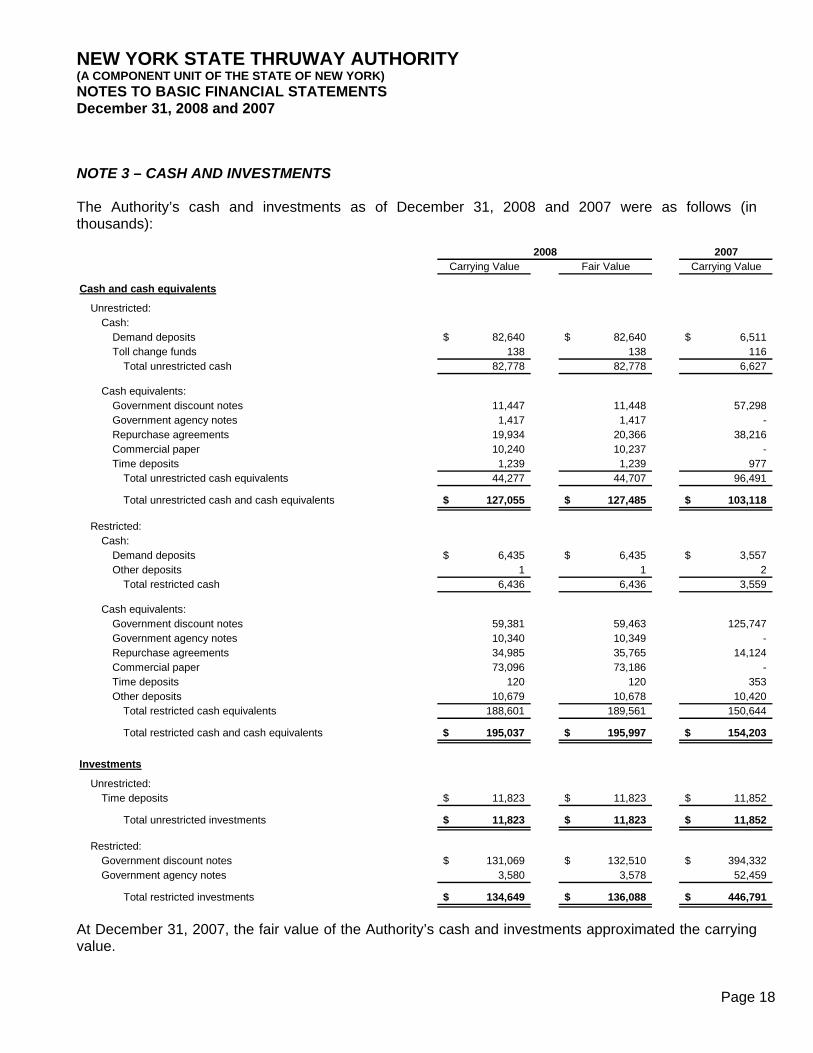
NEW YORK STATE THRUWAY AUTHORITY (A COMPONENT UNIT OF THE STATE OF NEW YORK) NOTES TO BASIC FINANCIAL STATEMENTS December 31, 2008 and 2007
Page 18
NOTE 3 – CASH AND INVESTMENTS The Authority’s cash and investments as of December 31, 2008 and 2007 were as follows (in thousands):
2007Carrying Value Fair Value Carrying Value
Cash and cash equivalents
Unrestricted:Cash:
Demand deposits 82,640$ 82,640$ 6,511$ Toll change funds 138 138 116
Total unrestricted cash 82,778 82,778 6,627
Cash equivalents:Government discount notes 11,447 11,448 57,298 Government agency notes 1,417 1,417 - Repurchase agreements 19,934 20,366 38,216 Commercial paper 10,240 10,237 - Time deposits 1,239 1,239 977
Total unrestricted cash equivalents 44,277 44,707 96,491
Total unrestricted cash and cash equivalents 127,055$ 127,485$ 103,118$
Restricted:Cash:
Demand deposits 6,435$ 6,435$ 3,557$ Other deposits 1 1 2
Total restricted cash 6,436 6,436 3,559
Cash equivalents:Government discount notes 59,381 59,463 125,747 Government agency notes 10,340 10,349 - Repurchase agreements 34,985 35,765 14,124 Commercial paper 73,096 73,186 - Time deposits 120 120 353 Other deposits 10,679 10,678 10,420
Total restricted cash equivalents 188,601 189,561 150,644
Total restricted cash and cash equivalents 195,037$ 195,997$ 154,203$
Investments
Unrestricted:Time deposits 11,823$ 11,823$ 11,852$
Total unrestricted investments 11,823$ 11,823$ 11,852$
Restricted:Government discount notes 131,069$ 132,510$ 394,332$ Government agency notes 3,580 3,578 52,459
Total restricted investments 134,649$ 136,088$ 446,791$
2008
At December 31, 2007, the fair value of the Authority’s cash and investments approximated the carrying value.
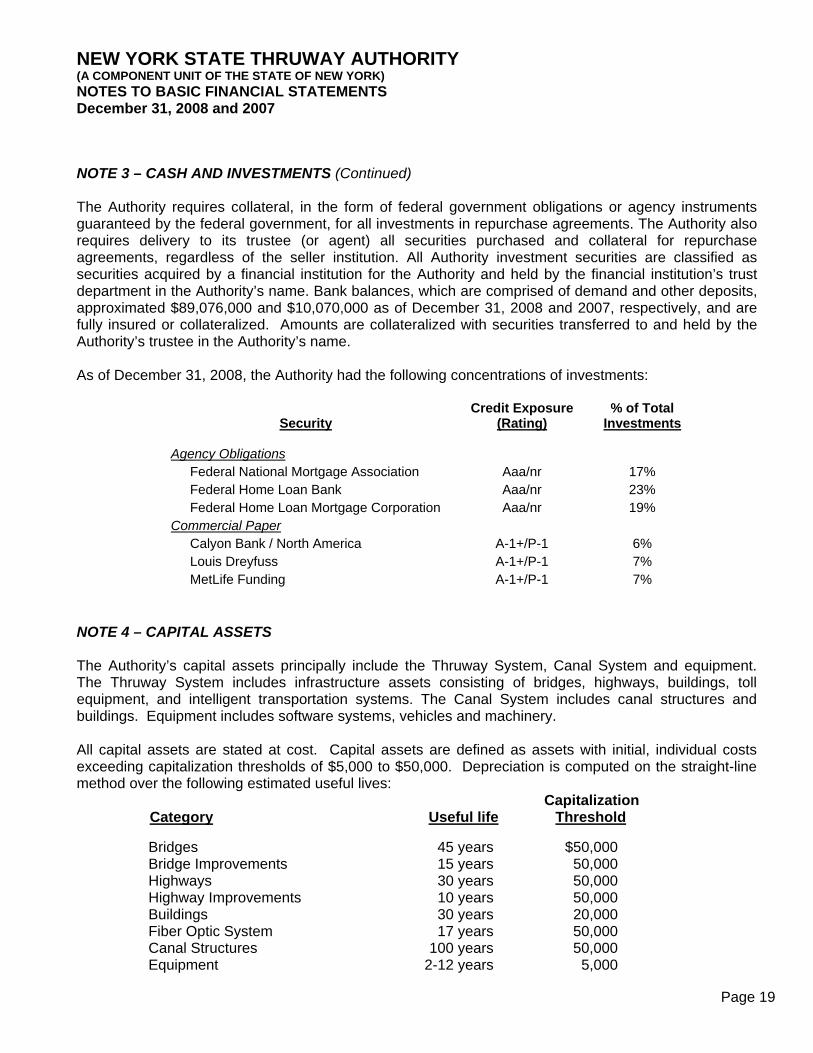
NEW YORK STATE THRUWAY AUTHORITY (A COMPONENT UNIT OF THE STATE OF NEW YORK) NOTES TO BASIC FINANCIAL STATEMENTS December 31, 2008 and 2007
Page 19
NOTE 3 – CASH AND INVESTMENTS (Continued) The Authority requires collateral, in the form of federal government obligations or agency instruments guaranteed by the federal government, for all investments in repurchase agreements. The Authority also requires delivery to its trustee (or agent) all securities purchased and collateral for repurchase agreements, regardless of the seller institution. All Authority investment securities are classified as securities acquired by a financial institution for the Authority and held by the financial institution’s trust department in the Authority’s name. Bank balances, which are comprised of demand and other deposits, approximated $89,076,000 and $10,070,000 as of December 31, 2008 and 2007, respectively, and are fully insured or collateralized. Amounts are collateralized with securities transferred to and held by the Authority’s trustee in the Authority’s name. As of December 31, 2008, the Authority had the following concentrations of investments:
Security
Credit Exposure (Rating)
% of Total Investments
Agency Obligations Federal National Mortgage Association Aaa/nr 17% Federal Home Loan Bank Aaa/nr 23% Federal Home Loan Mortgage Corporation Aaa/nr 19% Commercial Paper Calyon Bank / North America A-1+/P-1 6% Louis Dreyfuss A-1+/P-1 7% MetLife Funding A-1+/P-1 7%
NOTE 4 – CAPITAL ASSETS The Authority’s capital assets principally include the Thruway System, Canal System and equipment. The Thruway System includes infrastructure assets consisting of bridges, highways, buildings, toll equipment, and intelligent transportation systems. The Canal System includes canal structures and buildings. Equipment includes software systems, vehicles and machinery. All capital assets are stated at cost. Capital assets are defined as assets with initial, individual costs exceeding capitalization thresholds of $5,000 to $50,000. Depreciation is computed on the straight-line method over the following estimated useful lives:
Capitalization Category Useful life Threshold
Bridges 45 years $50,000 Bridge Improvements 15 years 50,000 Highways 30 years 50,000 Highway Improvements 10 years 50,000 Buildings 30 years 20,000 Fiber Optic System 17 years 50,000 Canal Structures 100 years 50,000 Equipment 2-12 years 5,000
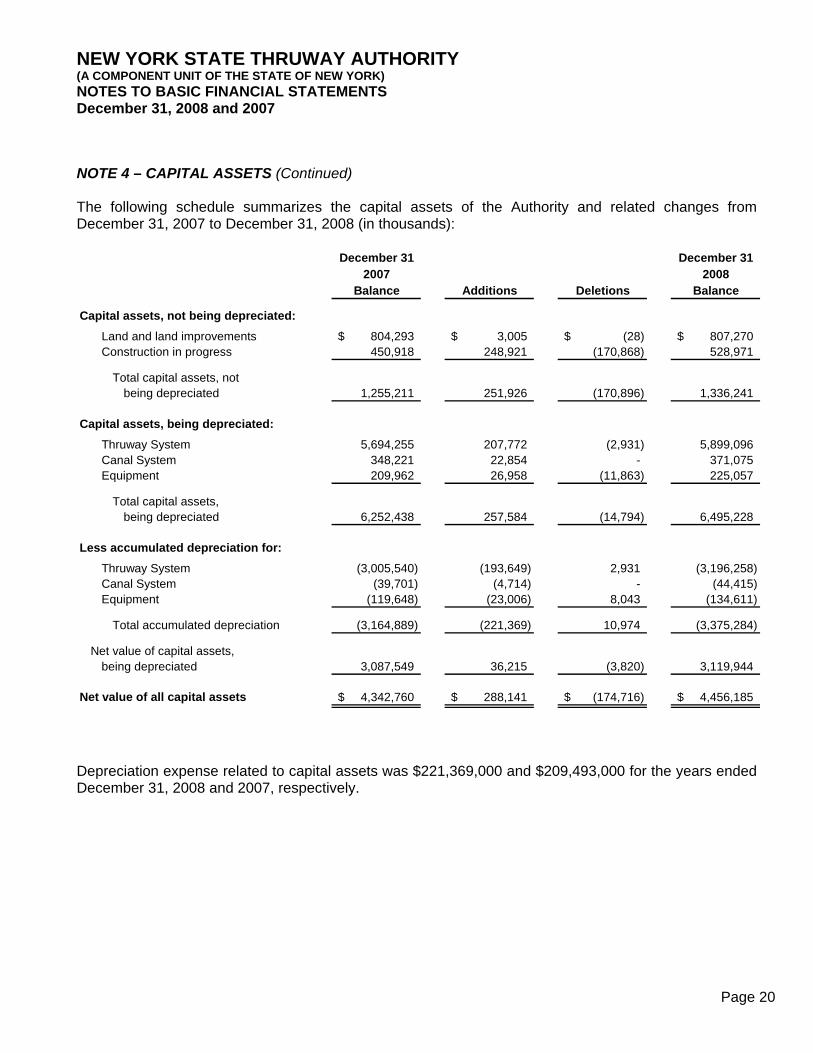
NEW YORK STATE THRUWAY AUTHORITY (A COMPONENT UNIT OF THE STATE OF NEW YORK) NOTES TO BASIC FINANCIAL STATEMENTS December 31, 2008 and 2007
Page 20
NOTE 4 – CAPITAL ASSETS (Continued) The following schedule summarizes the capital assets of the Authority and related changes from December 31, 2007 to December 31, 2008 (in thousands):
December 31 December 312007 2008
Balance Additions Deletions Balance
Capital assets, not being depreciated:Land and land improvements 804,293$ 3,005$ (28)$ 807,270$ Construction in progress 450,918 248,921 (170,868) 528,971
Total capital assets, notbeing depreciated 1,255,211 251,926 (170,896) 1,336,241
Capital assets, being depreciated:Thruway System 5,694,255 207,772 (2,931) 5,899,096 Canal System 348,221 22,854 - 371,075 Equipment 209,962 26,958 (11,863) 225,057
Total capital assets, being depreciated 6,252,438 257,584 (14,794) 6,495,228
Less accumulated depreciation for:Thruway System (3,005,540) (193,649) 2,931 (3,196,258) Canal System (39,701) (4,714) - (44,415) Equipment (119,648) (23,006) 8,043 (134,611)
Total accumulated depreciation (3,164,889) (221,369) 10,974 (3,375,284)
Net value of capital assets,being depreciated 3,087,549 36,215 (3,820) 3,119,944
Net value of all capital assets 4,342,760$ 288,141$ (174,716)$ 4,456,185$
Depreciation expense related to capital assets was $221,369,000 and $209,493,000 for the years ended December 31, 2008 and 2007, respectively.
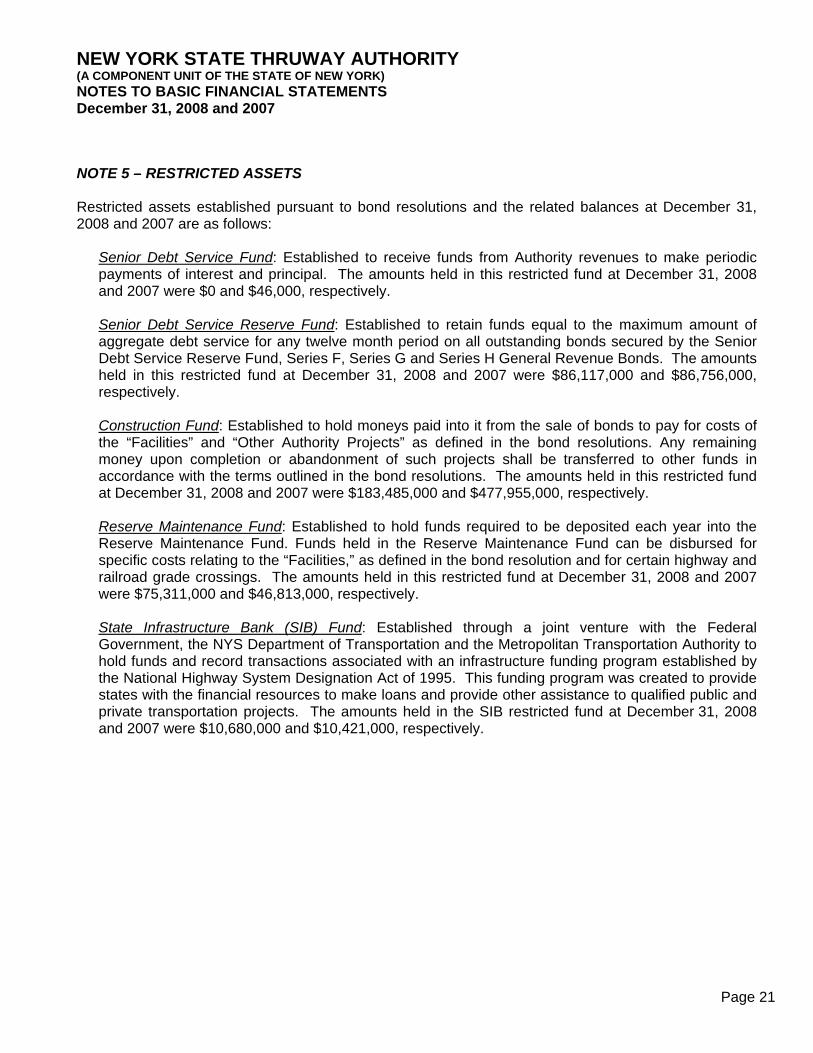
NEW YORK STATE THRUWAY AUTHORITY (A COMPONENT UNIT OF THE STATE OF NEW YORK) NOTES TO BASIC FINANCIAL STATEMENTS December 31, 2008 and 2007
Page 21
NOTE 5 – RESTRICTED ASSETS Restricted assets established pursuant to bond resolutions and the related balances at December 31, 2008 and 2007 are as follows:
Senior Debt Service Fund: Established to receive funds from Authority revenues to make periodic payments of interest and principal. The amounts held in this restricted fund at December 31, 2008 and 2007 were $0 and $46,000, respectively.
Senior Debt Service Reserve Fund: Established to retain funds equal to the maximum amount of aggregate debt service for any twelve month period on all outstanding bonds secured by the Senior Debt Service Reserve Fund, Series F, Series G and Series H General Revenue Bonds. The amounts held in this restricted fund at December 31, 2008 and 2007 were $86,117,000 and $86,756,000, respectively. Construction Fund: Established to hold moneys paid into it from the sale of bonds to pay for costs of the “Facilities” and “Other Authority Projects” as defined in the bond resolutions. Any remaining money upon completion or abandonment of such projects shall be transferred to other funds in accordance with the terms outlined in the bond resolutions. The amounts held in this restricted fund at December 31, 2008 and 2007 were $183,485,000 and $477,955,000, respectively. Reserve Maintenance Fund: Established to hold funds required to be deposited each year into the Reserve Maintenance Fund. Funds held in the Reserve Maintenance Fund can be disbursed for specific costs relating to the “Facilities,” as defined in the bond resolution and for certain highway and railroad grade crossings. The amounts held in this restricted fund at December 31, 2008 and 2007 were $75,311,000 and $46,813,000, respectively. State Infrastructure Bank (SIB) Fund: Established through a joint venture with the Federal Government, the NYS Department of Transportation and the Metropolitan Transportation Authority to hold funds and record transactions associated with an infrastructure funding program established by the National Highway System Designation Act of 1995. This funding program was created to provide states with the financial resources to make loans and provide other assistance to qualified public and private transportation projects. The amounts held in the SIB restricted fund at December 31, 2008 and 2007 were $10,680,000 and $10,421,000, respectively.
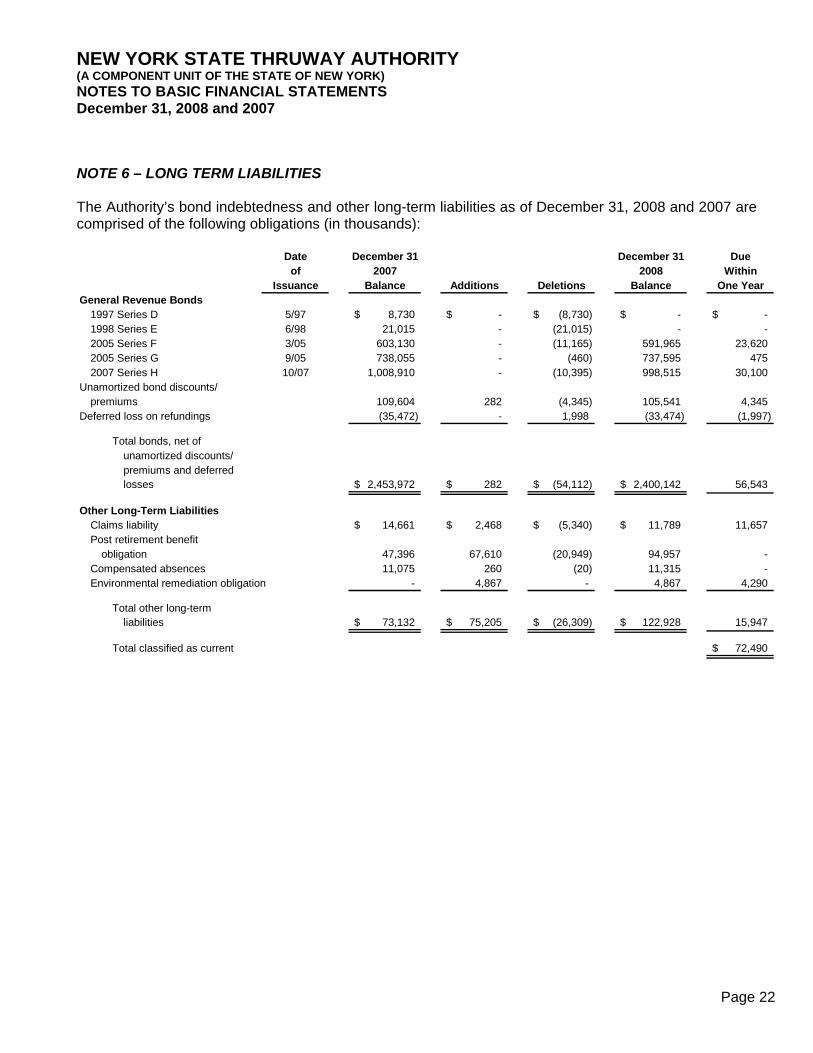
NEW YORK STATE THRUWAY AUTHORITY (A COMPONENT UNIT OF THE STATE OF NEW YORK) NOTES TO BASIC FINANCIAL STATEMENTS December 31, 2008 and 2007
Page 22
NOTE 6 – LONG TERM LIABILITIES The Authority’s bond indebtedness and other long-term liabilities as of December 31, 2008 and 2007 are comprised of the following obligations (in thousands):
Date December 31 December 31 Dueof 2007 2008 Within
Issuance Balance Additions Deletions Balance One YearGeneral Revenue Bonds
1997 Series D 5/97 8,730$ -$ (8,730)$ -$ -$ 1998 Series E 6/98 21,015 - (21,015) - - 2005 Series F 3/05 603,130 - (11,165) 591,965 23,620 2005 Series G 9/05 738,055 - (460) 737,595 475 2007 Series H 10/07 1,008,910 - (10,395) 998,515 30,100
Unamortized bond discounts/premiums 109,604 282 (4,345) 105,541 4,345
Deferred loss on refundings (35,472) - 1,998 (33,474) (1,997)
Total bonds, net ofunamortized discounts/premiums and deferredlosses 2,453,972$ 282$ (54,112)$ 2,400,142$ 56,543
Other Long-Term LiabilitiesClaims liability 14,661$ 2,468$ (5,340)$ 11,789$ 11,657 Post retirement benefit
obligation 47,396 67,610 (20,949) 94,957 - Compensated absences 11,075 260 (20) 11,315 - Environmental remediation obligation - 4,867 - 4,867 4,290
Total other long-termliabilities 73,132$ 75,205$ (26,309)$ 122,928$ 15,947
Total classified as current 72,490$
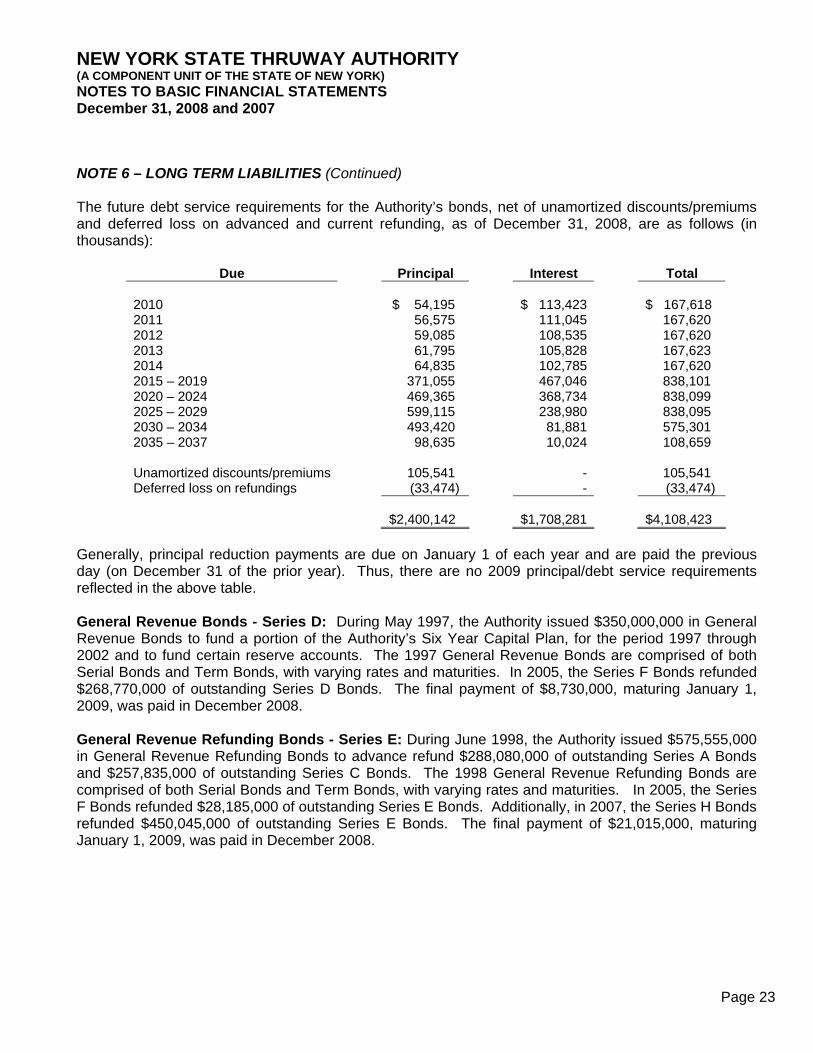
NEW YORK STATE THRUWAY AUTHORITY (A COMPONENT UNIT OF THE STATE OF NEW YORK) NOTES TO BASIC FINANCIAL STATEMENTS December 31, 2008 and 2007
Page 23
NOTE 6 – LONG TERM LIABILITIES (Continued) The future debt service requirements for the Authority’s bonds, net of unamortized discounts/premiums and deferred loss on advanced and current refunding, as of December 31, 2008, are as follows (in thousands):
Due Principal Interest Total 2010 $ 54,195 $ 113,423 $ 167,618 2011 56,575 111,045 167,620 2012 59,085 108,535 167,620 2013 61,795 105,828 167,623 2014 64,835 102,785 167,620 2015 – 2019 371,055 467,046 838,101 2020 – 2024 469,365 368,734 838,099 2025 – 2029 599,115 238,980 838,095 2030 – 2034 493,420 81,881 575,301 2035 – 2037 98,635 10,024 108,659 Unamortized discounts/premiums 105,541 - 105,541 Deferred loss on refundings (33,474) - (33,474) $2,400,142c $1,708,281 $4,108,423c
Generally, principal reduction payments are due on January 1 of each year and are paid the previous day (on December 31 of the prior year). Thus, there are no 2009 principal/debt service requirements reflected in the above table. General Revenue Bonds - Series D: During May 1997, the Authority issued $350,000,000 in General Revenue Bonds to fund a portion of the Authority’s Six Year Capital Plan, for the period 1997 through 2002 and to fund certain reserve accounts. The 1997 General Revenue Bonds are comprised of both Serial Bonds and Term Bonds, with varying rates and maturities. In 2005, the Series F Bonds refunded $268,770,000 of outstanding Series D Bonds. The final payment of $8,730,000, maturing January 1, 2009, was paid in December 2008. General Revenue Refunding Bonds - Series E: During June 1998, the Authority issued $575,555,000 in General Revenue Refunding Bonds to advance refund $288,080,000 of outstanding Series A Bonds and $257,835,000 of outstanding Series C Bonds. The 1998 General Revenue Refunding Bonds are comprised of both Serial Bonds and Term Bonds, with varying rates and maturities. In 2005, the Series F Bonds refunded $28,185,000 of outstanding Series E Bonds. Additionally, in 2007, the Series H Bonds refunded $450,045,000 of outstanding Series E Bonds. The final payment of $21,015,000, maturing January 1, 2009, was paid in December 2008.
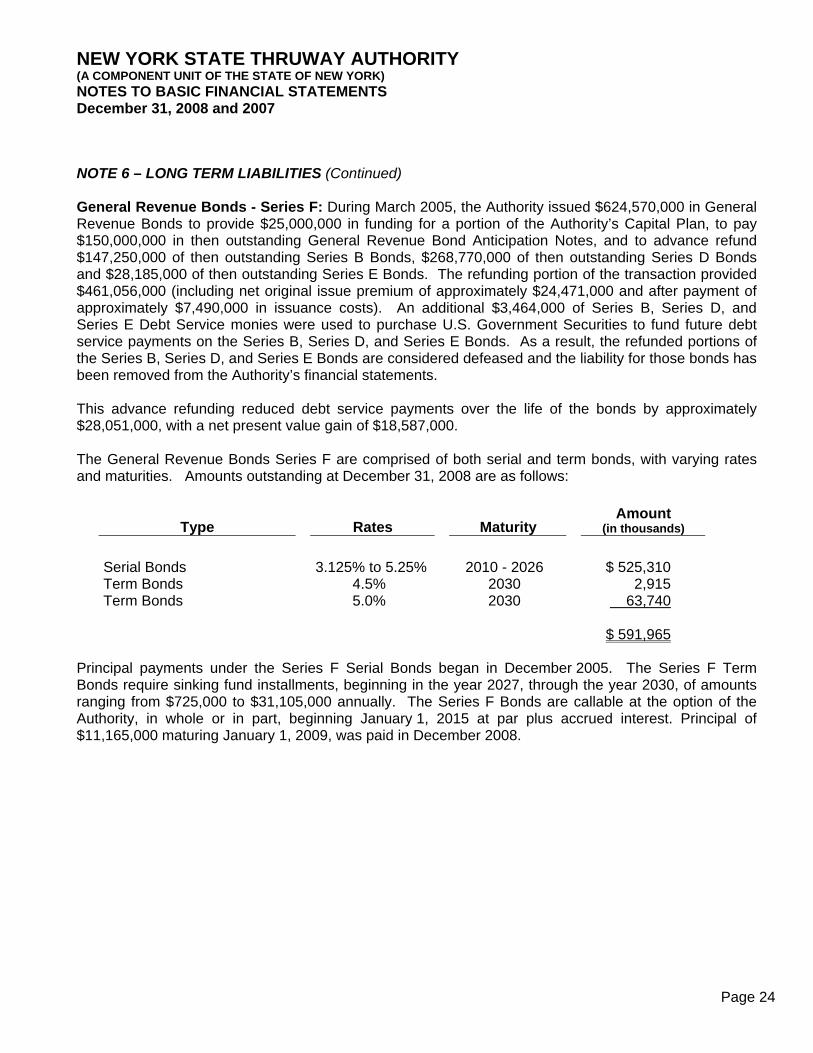
NEW YORK STATE THRUWAY AUTHORITY (A COMPONENT UNIT OF THE STATE OF NEW YORK) NOTES TO BASIC FINANCIAL STATEMENTS December 31, 2008 and 2007
Page 24
NOTE 6 – LONG TERM LIABILITIES (Continued) General Revenue Bonds - Series F: During March 2005, the Authority issued $624,570,000 in General Revenue Bonds to provide $25,000,000 in funding for a portion of the Authority’s Capital Plan, to pay $150,000,000 in then outstanding General Revenue Bond Anticipation Notes, and to advance refund $147,250,000 of then outstanding Series B Bonds, $268,770,000 of then outstanding Series D Bonds and $28,185,000 of then outstanding Series E Bonds. The refunding portion of the transaction provided $461,056,000 (including net original issue premium of approximately $24,471,000 and after payment of approximately $7,490,000 in issuance costs). An additional $3,464,000 of Series B, Series D, and Series E Debt Service monies were used to purchase U.S. Government Securities to fund future debt service payments on the Series B, Series D, and Series E Bonds. As a result, the refunded portions of the Series B, Series D, and Series E Bonds are considered defeased and the liability for those bonds has been removed from the Authority’s financial statements. This advance refunding reduced debt service payments over the life of the bonds by approximately $28,051,000, with a net present value gain of $18,587,000. The General Revenue Bonds Series F are comprised of both serial and term bonds, with varying rates and maturities. Amounts outstanding at December 31, 2008 are as follows:
Type Rates Maturity Amount
(in thousands)
Serial Bonds 3.125% to 5.25% 2010 - 2026 $ 525,310 Term Bonds 4.5% 2030 2,915 Term Bonds 5.0% 2030 63,740 $ 591,965
Principal payments under the Series F Serial Bonds began in December 2005. The Series F Term Bonds require sinking fund installments, beginning in the year 2027, through the year 2030, of amounts ranging from $725,000 to $31,105,000 annually. The Series F Bonds are callable at the option of the Authority, in whole or in part, beginning January 1, 2015 at par plus accrued interest. Principal of $11,165,000 maturing January 1, 2009, was paid in December 2008.
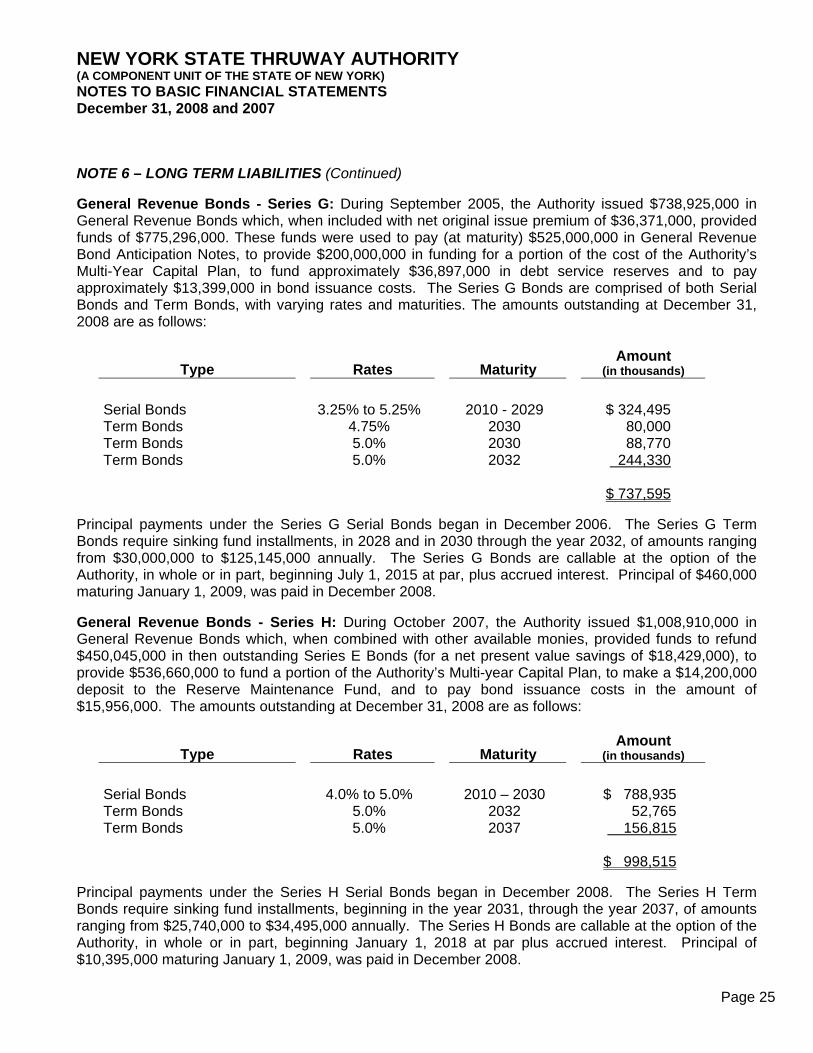
NEW YORK STATE THRUWAY AUTHORITY (A COMPONENT UNIT OF THE STATE OF NEW YORK) NOTES TO BASIC FINANCIAL STATEMENTS December 31, 2008 and 2007
Page 25
NOTE 6 – LONG TERM LIABILITIES (Continued) General Revenue Bonds - Series G: During September 2005, the Authority issued $738,925,000 in General Revenue Bonds which, when included with net original issue premium of $36,371,000, provided funds of $775,296,000. These funds were used to pay (at maturity) $525,000,000 in General Revenue Bond Anticipation Notes, to provide $200,000,000 in funding for a portion of the cost of the Authority’s Multi-Year Capital Plan, to fund approximately $36,897,000 in debt service reserves and to pay approximately $13,399,000 in bond issuance costs. The Series G Bonds are comprised of both Serial Bonds and Term Bonds, with varying rates and maturities. The amounts outstanding at December 31, 2008 are as follows:
Type Rates Maturity Amount
(in thousands)
Serial Bonds 3.25% to 5.25% 2010 - 2029 $ 324,495 Term Bonds 4.75% 2030 80,000 Term Bonds 5.0% 2030 88,770 Term Bonds 5.0% 2032 244,330 $ 737,595
Principal payments under the Series G Serial Bonds began in December 2006. The Series G Term Bonds require sinking fund installments, in 2028 and in 2030 through the year 2032, of amounts ranging from $30,000,000 to $125,145,000 annually. The Series G Bonds are callable at the option of the Authority, in whole or in part, beginning July 1, 2015 at par, plus accrued interest. Principal of $460,000 maturing January 1, 2009, was paid in December 2008. General Revenue Bonds - Series H: During October 2007, the Authority issued $1,008,910,000 in General Revenue Bonds which, when combined with other available monies, provided funds to refund $450,045,000 in then outstanding Series E Bonds (for a net present value savings of $18,429,000), to provide $536,660,000 to fund a portion of the Authority’s Multi-year Capital Plan, to make a $14,200,000 deposit to the Reserve Maintenance Fund, and to pay bond issuance costs in the amount of $15,956,000. The amounts outstanding at December 31, 2008 are as follows:
Type Rates Maturity Amount
(in thousands)
Serial Bonds 4.0% to 5.0% 2010 – 2030 $ 788,935 Term Bonds 5.0% 2032 52,765 Term Bonds 5.0% 2037 156,815 $ 998,515
Principal payments under the Series H Serial Bonds began in December 2008. The Series H Term Bonds require sinking fund installments, beginning in the year 2031, through the year 2037, of amounts ranging from $25,740,000 to $34,495,000 annually. The Series H Bonds are callable at the option of the Authority, in whole or in part, beginning January 1, 2018 at par plus accrued interest. Principal of $10,395,000 maturing January 1, 2009, was paid in December 2008.
NEW YORK STATE THRUWAY AUTHORITY (A COMPONENT UNIT OF THE STATE OF NEW YORK) NOTES TO BASIC FINANCIAL STATEMENTS December 31, 2008 and 2007
Page 26
NOTE 6 – LONG TERM LIABILITIES (Continued) General Revenue Bonds - Revenue Pledge and Security: The 1997 (Series D), 1998 (Series E), 2005 (Series F), 2005 (Series G) and 2007 (Series H) General Revenue Bonds are all direct obligations of the Authority, secured by a pledge of revenues and funds established under the Bond Resolution. In accordance with the Bond Resolution, a Senior Debt Service Reserve Fund was established and is funded in an amount equal to the maximum aggregate debt service for any 12 month period. At both December 31, 2008 and 2007, the Senior Debt Service Reserve Fund, which may be used should amounts in the Senior Debt Service Fund be insufficient to pay debt service payments, was fully funded. NOTE 7 – SPECIAL BOND PROGRAMS The Authority’s special bond programs, and the related projects and activities, are entirely separate from the Authority’s financing, operation, and maintenance of the Thruway System. As such, these special bond programs are not reflected in the accompanying financial statements. The special bond programs require varying debt service payments which are funded under contractual agreements with the State of New York. The obligation of the State to make such payments is subject to, and dependent upon, annual appropriations by the State Legislature. These bond programs, however, result in no cost to the Authority and provide for no lien on Authority revenues or assets. The following are descriptions of the Authority’s special bond programs: Local Highway and Bridge Service Contract Special Bond Program: The Legislature of the State of New York empowered the Authority to issue Local Highway and Bridge Service Contract Bonds, also known as the Consolidated Local Street and Highway Improvement Program (often referred to as the CHIPS Program) to provide funds to reimburse municipalities and other project sponsors throughout the State for qualifying local highway, bridge and multi-modal capital project expenditures under established State programs. In February 2008, the Authority issued $247,045,000 of Local Highway and Bridge Service Contract Bonds, series 2008, to refund certain outstanding bonds for a net present value savings of approximately $16,365,000. The Authority receives funds from New York State for debt service on these bonds and to fund related administrative costs. Bonds outstanding under this program were $1,609,845,000 and $1,767,500,000 at December 31, 2008 and 2007, respectively. Highway and Bridge Trust Fund Bond Program: The Legislature of the State of New York empowered the Authority to issue Highway and Bridge Trust Fund Bonds to reimburse the State for expenditures made by the State’s Department of Transportation in connection with the State’s Multi-Year Highway and Bridge Capital Program. In March 2008, a bond sale was issued with a total par of $493,720,000 for State Department of Transportation expenditures, and to refund certain outstanding bonds for a net present value savings of $4,722,000. In September 2008, a bond sale was issued with a total par of $658,855,000 for State Department of Transportation expenditures, and to refund certain outstanding bonds for a net present value savings of approximately $9,087,000. The Authority receives funds from New York State for debt service on these bonds and to fund related administrative costs. Bonds outstanding under this program were $6,689,805,000 and $6,154,620,000 at December 31, 2008 and 2007, respectively.
NEW YORK STATE THRUWAY AUTHORITY (A COMPONENT UNIT OF THE STATE OF NEW YORK) NOTES TO BASIC FINANCIAL STATEMENTS December 31, 2008 and 2007
Page 27
NOTE 7 – SPECIAL BOND PROGRAMS (Continued) State Personal Income Tax Revenue Bonds: The Legislature of the State of New York empowered the Authority to issue Personal Income Tax (PIT) Revenue Bonds to provide funds to municipalities and other project sponsors throughout the State for qualifying local highway, bridge and multi-modal capital project expenditures under established State programs. In September 2008, the Authority issued $466,905,000 in bonds for capital projects and to refund certain outstanding PIT bonds for a net present value savings of approximately $3,488,000. The Authority receives funds from New York State for debt service on the bonds and related administrative costs. Bonds outstanding under this program were $2,012,470,000 and $1,712,505,000 at December 31, 2008 and 2007, respectively. NOTE 8 – RETIREMENT BENEFITS The Authority provides its retirees certain retirement benefits made available to participating employers by the New York State Retirement and Social Security Laws, including Chapters 1046 and 1047 of the Laws of 1973. Pension Plan: The Authority participates in the New York State and Local Employees’ Retirement System (ERS) for Authority employees and the Police and Fire Retirement Systems (PFRS) for New York State Police assigned to the Authority. Both ERS and PFRS are cost-sharing multiple-employer retirement systems that provide retirement benefits as well as death and disability benefits. These benefits are provided in accordance with the New York State Retirement and Social Security Law (NYSRSSL), which also governs obligations of employers and employees to contribute. The benefits to employees are guaranteed under the State constitution. The Authority’s election to participate in the State plans is irrevocable. As set forth in the NYSRSSL, the Comptroller of the State of New York (Comptroller) serves as sole trustee and administrative head of ERS and PFRS. The Comptroller shall adopt and may amend rules and regulations for the administration and transaction of the business of ERS and PFRS and for the custody and control of their funds. ERS and PFRS issue a publicly available financial report that includes financial statements and required supplementary information. That report may be obtained by writing to the New York State and Local Retirement Systems, 110 State Street, Albany, NY 12244-0001. ERS and PFRS are noncontributory except for employees with less than 10 years of service who contribute 3% of their salary. Under the authority of the NYSRSSL, the Comptroller shall certify annually the rates, expressed as proportions of payroll of members, which shall be used in computing the contributions required to be made by employers. The rates billed by the Comptroller for ERS during the year ended December 31, 2008 ranged from 8.0% to 10.8% and during the year ending December 31, 2007 ranged from 8.9% to 12.1%. The PFRS is paid as part of a fringe benefit rate billed to the Authority for the State Police. The PFRS benefit rates billed were 10.50% for April through December 2008, 10.84% for April 2007 through March 2008, and 11.65% for January through March 2007.
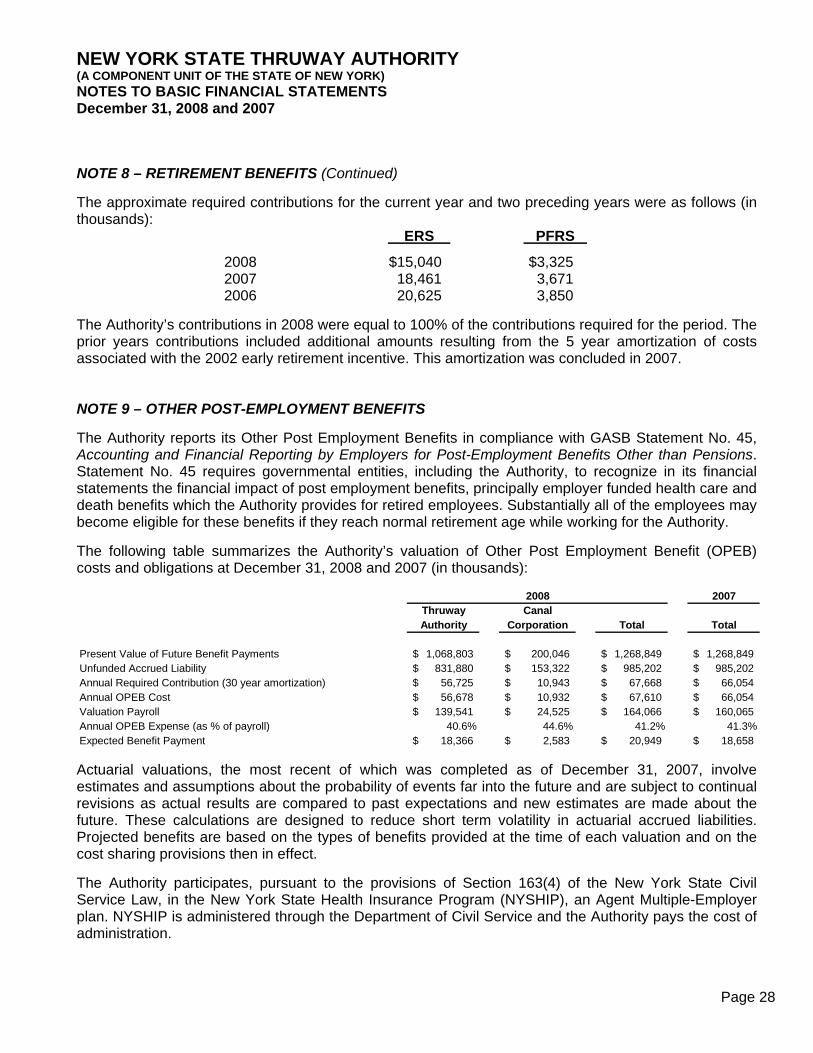
NEW YORK STATE THRUWAY AUTHORITY (A COMPONENT UNIT OF THE STATE OF NEW YORK) NOTES TO BASIC FINANCIAL STATEMENTS December 31, 2008 and 2007
Page 28
NOTE 8 – RETIREMENT BENEFITS (Continued) The approximate required contributions for the current year and two preceding years were as follows (in thousands):
ERS X PFRS X
2008 $15,040 $3,325 2007 18,461 3,671 2006 20,625 3,850
The Authority’s contributions in 2008 were equal to 100% of the contributions required for the period. The prior years contributions included additional amounts resulting from the 5 year amortization of costs associated with the 2002 early retirement incentive. This amortization was concluded in 2007. NOTE 9 – OTHER POST-EMPLOYMENT BENEFITS The Authority reports its Other Post Employment Benefits in compliance with GASB Statement No. 45, Accounting and Financial Reporting by Employers for Post-Employment Benefits Other than Pensions. Statement No. 45 requires governmental entities, including the Authority, to recognize in its financial statements the financial impact of post employment benefits, principally employer funded health care and death benefits which the Authority provides for retired employees. Substantially all of the employees may become eligible for these benefits if they reach normal retirement age while working for the Authority. The following table summarizes the Authority’s valuation of Other Post Employment Benefit (OPEB) costs and obligations at December 31, 2008 and 2007 (in thousands):
2007Thruway CanalAuthority Corporation Total Total
Present Value of Future Benefit Payments 1,068,803$ 200,046$ 1,268,849$ 1,268,849$ Unfunded Accrued Liability 831,880$ 153,322$ 985,202$ 985,202$ Annual Required Contribution (30 year amortization) 56,725$ 10,943$ 67,668$ 66,054$ Annual OPEB Cost 56,678$ 10,932$ 67,610$ 66,054$ Valuation Payroll 139,541$ 24,525$ 164,066$ 160,065$ Annual OPEB Expense (as % of payroll) 40.6% 44.6% 41.2% 41.3%Expected Benefit Payment 18,366$ 2,583$ 20,949$ 18,658$
2008
Actuarial valuations, the most recent of which was completed as of December 31, 2007, involve estimates and assumptions about the probability of events far into the future and are subject to continual revisions as actual results are compared to past expectations and new estimates are made about the future. These calculations are designed to reduce short term volatility in actuarial accrued liabilities. Projected benefits are based on the types of benefits provided at the time of each valuation and on the cost sharing provisions then in effect. The Authority participates, pursuant to the provisions of Section 163(4) of the New York State Civil Service Law, in the New York State Health Insurance Program (NYSHIP), an Agent Multiple-Employer plan. NYSHIP is administered through the Department of Civil Service and the Authority pays the cost of administration.
NEW YORK STATE THRUWAY AUTHORITY (A COMPONENT UNIT OF THE STATE OF NEW YORK) NOTES TO BASIC FINANCIAL STATEMENTS December 31, 2008 and 2007
Page 29
NOTE 9 – OTHER POST-EMPLOYMENT BENEFITS (Continued) NYSHIP does not currently issue a stand alone financial report since there are no assets legally segregated for the sole purpose of paying benefits under the plan. The Authority’s specific obligation to pay OPEB costs is dependent on the employee’s date of hire and labor agreement. Certain retiree costs, described below, are first applied against the value of the retiree’s existing sick leave bank balance. A plan summary follows: a. Plan Types Medical: New York State Health Insurance Program which includes participation in various insurance plans and HMO’s and which also includes drug coverage. Details may be found in the Summary Program Description of the New York State Health Insurance Program Booklet. Medicare Part B Reimbursement: The Thruway Authority and Canal Corporation reimburses the retiree and his/her Medicare eligible spouse for the Medicare Part B premium. b. Eligibility At least 55 years old with 5 years of service if date of hire is before April 1, 1975 or 10 years of service if date of hire is after April 1, 1975. c. Benefit/Cost Sharing The Authority contributes 80% - 100% of costs for retirees and 75% - 80% for a retiree’s spouse. d. Spouse Benefit Yes e. Surviving Spouse Benefit Coverage continues f. Survivor Benefit $3,000 payable to retiree’s designated beneficiary.

NEW YORK STATE THRUWAY AUTHORITY (A COMPONENT UNIT OF THE STATE OF NEW YORK) NOTES TO BASIC FINANCIAL STATEMENTS December 31, 2008 and 2007
Page 30
NOTE 9 – OTHER POST-EMPLOYMENT BENEFITS (Continued) The following summary schedule presents the Annual OPEB Cost and Net OPEB Obligation for the years ending December 31, 2008 and 2007 (in thousands):
2008 2007
Normal Cost 23,330$ 22,761$ Amortization of Unfunded Actuarial Accrued Liability 42,056 41,030 Interest 2,282 2,263
Annual Required Contribution (ARC) 67,668 66,054 Interest on net OPEB Obligation 1,969 - Adjustment to ARC (2,027) -
Annual OPEB Cost 67,610 66,054 Contribution/expected benefit payment (20,949) (18,658)
Increase in net OPEB Obligation 46,661 47,396 Net OPEB Obligation – beginning of year 47,396 -
Net OPEB Obligation – end of year 94,057$ 47,396$ The annual OPEB costs are recorded in the Authority’s 2008 and 2007 Statements of Revenues, Expenses, and Changes in Net Assets as a component of general charges in the amount of $67,610,000 and $66,054,000. The net OPEB obligation is recorded in the Authority’s Statements of Net Assets as a component of other long-term liabilities in the amount of $94,057,000 and $47,396,000, at December 31, 2008 and 2007, respectively. The annual OPEB Cost, the percentage of annual OPEB cost contributed to the plan, and the net OPEB obligation for 2008 and 2007 are as follows (in thousands):
Year Canal Canal CanalEnding Thruway Corporation Total Thruway Corporation Total Thruway Corporation Total
12/31/07 $55,373 $10,681 $66,054 29.6% 21.1% 28.2% $38,968 $8,428 $47,39612/31/08 56,678 10,932 67,610 32.4% 23.6% 31.0% 77,281 16,776 94,057
Percentage of
Net OPEB ObligationAnnual OPEB Cost Cost ContributedAnnual OPEB
The following are the actuarial methods and assumptions used in calculating the obligations related to the Authority post employment benefit plan:
Funding Interest Rate 4.155%2007 Medical Trend Rate (Med/Rx) 10% / 12%2008 Medical Trend Rate (Med/Rx) 9% / 11%Ultimate Trend Rate (Med/Rx) 5% / 5%Year ultimate trend rate reached 2012 / 2014Annual Payroll Growth Rate 2.50%Actuarial Cost Method Attained AgeRemaining amortization period at December 31, 2008 28 yearsAmortization method 30 year level percentage of payroll
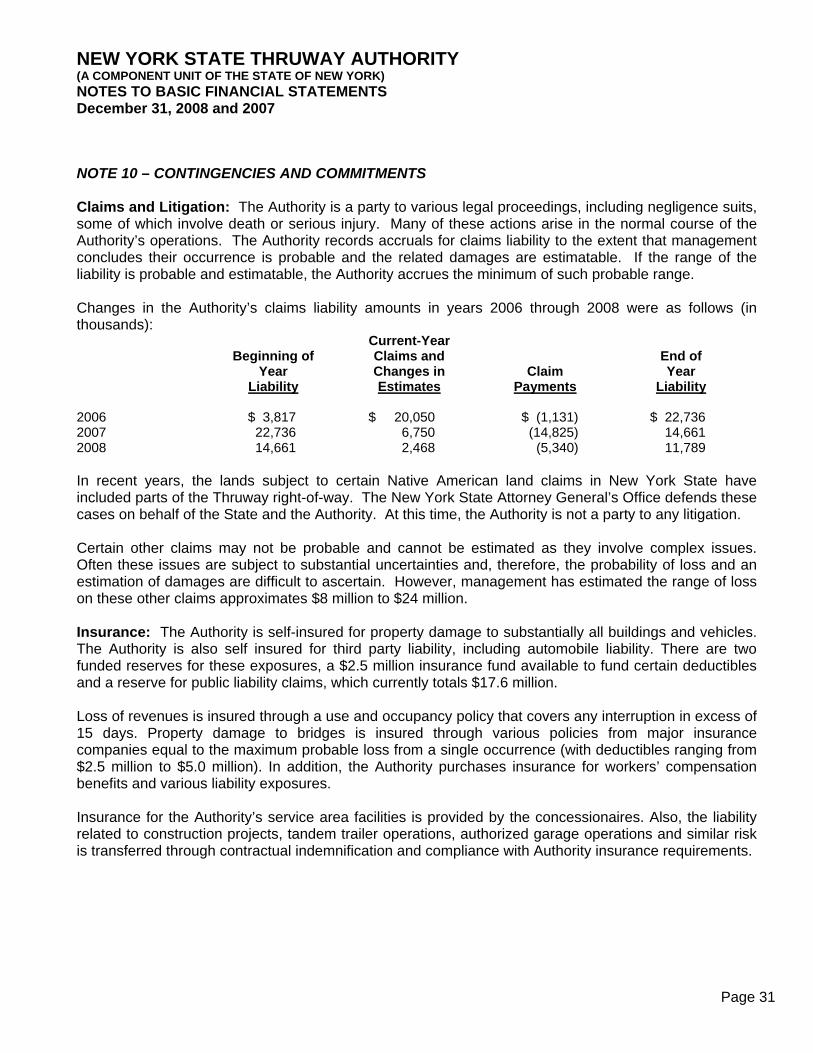
NEW YORK STATE THRUWAY AUTHORITY (A COMPONENT UNIT OF THE STATE OF NEW YORK) NOTES TO BASIC FINANCIAL STATEMENTS December 31, 2008 and 2007
Page 31
NOTE 10 – CONTINGENCIES AND COMMITMENTS Claims and Litigation: The Authority is a party to various legal proceedings, including negligence suits, some of which involve death or serious injury. Many of these actions arise in the normal course of the Authority’s operations. The Authority records accruals for claims liability to the extent that management concludes their occurrence is probable and the related damages are estimatable. If the range of the liability is probable and estimatable, the Authority accrues the minimum of such probable range. Changes in the Authority’s claims liability amounts in years 2006 through 2008 were as follows (in thousands):
Beginning of Year
Liability
Current-Year Claims and Changes in Estimates
Claim Payments
End of Year
Liability 2006 $ 3,817 $ 20,050 $ (1,131) $ 22,736 2007 22,736 6,750 (14,825) 14,661 2008 14,661 2,468 (5,340) 11,789 In recent years, the lands subject to certain Native American land claims in New York State have included parts of the Thruway right-of-way. The New York State Attorney General’s Office defends these cases on behalf of the State and the Authority. At this time, the Authority is not a party to any litigation. Certain other claims may not be probable and cannot be estimated as they involve complex issues. Often these issues are subject to substantial uncertainties and, therefore, the probability of loss and an estimation of damages are difficult to ascertain. However, management has estimated the range of loss on these other claims approximates $8 million to $24 million. Insurance: The Authority is self-insured for property damage to substantially all buildings and vehicles. The Authority is also self insured for third party liability, including automobile liability. There are two funded reserves for these exposures, a $2.5 million insurance fund available to fund certain deductibles and a reserve for public liability claims, which currently totals $17.6 million. Loss of revenues is insured through a use and occupancy policy that covers any interruption in excess of 15 days. Property damage to bridges is insured through various policies from major insurance companies equal to the maximum probable loss from a single occurrence (with deductibles ranging from $2.5 million to $5.0 million). In addition, the Authority purchases insurance for workers’ compensation benefits and various liability exposures. Insurance for the Authority’s service area facilities is provided by the concessionaires. Also, the liability related to construction projects, tandem trailer operations, authorized garage operations and similar risk is transferred through contractual indemnification and compliance with Authority insurance requirements.
NEW YORK STATE THRUWAY AUTHORITY (A COMPONENT UNIT OF THE STATE OF NEW YORK) NOTES TO BASIC FINANCIAL STATEMENTS December 31, 2008 and 2007
Page 32
NOTE 10 – CONTINGENCIES AND COMMITMENTS (Continued) Construction Commitments: At December 31, 2008, the amounts of remaining unexpended commitments for projects undertaken and the detail by type of contract are as follows:
Project Commitments
(in thousands) Highway, bridge and facility, construction and design $447,300 Personal service and miscellaneous 255,100 Economic development and Canal 35,000 Total $737,400
Environmental Remediation: During 2008, the Authority adopted GASB Statement No. 49, Accounting and Financial Reporting for Pollution Remediation Obligations. Statement No. 49 requires governmental entities, including the Authority, to disclose the nature and estimated cost for environmental remediation obligations. At December 31, 2008, the Authority recorded in its financial statements a cost estimate for environmental remediation of a number of sites on Thruway Authority, Canal Corporation and New York State property. These sites have been identified by the New York State Department of Environmental Conservation as locations where operational uses have contributed to various forms of environmental pollution. The estimated costs were developed by Authority engineers and remedial contractors based on the nature of remediation needed and comparable clean-up costs at similar sites. Estimating environmental remediation obligations requires that a number of assumptions be made. Therefore, it is possible that price fluctuations, changes in technology, changes in potential responsible parties, results of environmental studies and other factors could result in revisions to these estimates. At December 31, 2008, the Authority has estimated its environmental remediation obligations, net of expected recoveries from other responsible parties, as follows (in thousands):
Beginning Current-Yearof Value and End of
Year Estimated Payments YearLiability Changes Made Liability
Thruway Authority -$ 4,477$ -$ 4,477$ Canal Corporation - 390 - 390
Total -$ 4,867$ -$ 4,867$ Lease Revenues: The Authority has entered into various non-cancelable contracts with concessionaires to provide patron services on the Thruway System. These contracts provide the Authority with concession revenue, including minimum rentals and contingent revenues based on sales volume. The Authority also leases land, used for antennas and fiber optic cable, under various non-cancelable contracts. Concession contract terms generally range from 16 to 25 years, inclusive of renewal options. Radio tower contract terms generally range from 5 to 10 years, with renewal options up to 10 years, and fiber optic contract terms range from 17 to 20 years.
NEW YORK STATE THRUWAY AUTHORITY (A COMPONENT UNIT OF THE STATE OF NEW YORK) NOTES TO BASIC FINANCIAL STATEMENTS December 31, 2008 and 2007
Page 33
NOTE 10 – CONTINGENCIES AND COMMITMENTS (Continued) The following schedule summarizes the future minimum rental revenues to be earned as of December 31, 2008: Future Minimum Lease Revenue Year (in thousands) 2009 $ 12,000 2010 10,000 2011 10,000 2012 10,000 2013 10,000 Thereafter 57,800 Total $110,000 NOTE 11 – STATE INFRASTRUCTURE BANK The State Infrastructure Bank (SIB) is an infrastructure funding program established by the National Highway System Designation Act of 1995 to provide states with the financial resources to make loans and provide other assistance to qualified public and private transportation projects. The Authority cooperatively constitutes and administers the New York SIB under a Memorandum of Understanding (MOU) with the NYS Department of Transportation and the Metropolitan Transportation Authority. The SIB was capitalized with 80% Federal Funds and a 20% match provided by the parties to the MOU. As of both December 31, 2008 and 2007, the Authority has contributed $3 million toward the capitalization of the SIB.
Page 34 UHY LLP is an independent member of Urbach Hacker Young International Limited
INDEPENDENT AUDITOR’S REPORT ON INTERNAL CONTROL OVER FINANCIAL REPORTING AND ON COMPLIANCE AND OTHER MATTERS, INCLUDING COMPLIANCE WITH INVESTMENT GUIDELINES, BASED ON AN AUDIT OF FINANCIAL STATEMENTS PERFORMED IN ACCORDANCE WITH GOVERNMENT AUDITING STANDARDS Members of the Board New York State Thruway Authority We have audited the financial statements of New York State Thruway Authority (the Authority), a component unit of the State of New York, as of and for the year ended December 31, 2008, and have issued our report thereon dated March 31, 2009. We conducted our audit in accordance with auditing standards generally accepted in the United States of America and the standards applicable to financial audits contained in Government Auditing Standards, issued by the Comptroller General of the United States. Internal Control Over Financial Reporting In planning and performing our audit, we considered the Authority’s internal control over financial reporting as a basis for designing our auditing procedures for the purpose of expressing our opinion on the financial statements, but not for the purpose of expressing an opinion on the effectiveness of the Authority’s internal control over financial reporting. Accordingly, we do not express an opinion on the effectiveness of the Authority’s internal control over financial reporting. A control deficiency exists when the design or operation of a control does not allow management or employees, in the normal course of performing their assigned functions, to prevent or detect misstatements on a timely basis. A significant deficiency is a control deficiency, or combination of control deficiencies, that adversely affects the entity’s ability to initiate, authorize, record, process or report financial data reliably in accordance with generally accepted accounting principles such that there is more than a remote likelihood that a misstatement of the entity’s financial statements, that is more than inconsequential, will not be prevented or detected by the entity’s internal control. A material weakness is a significant deficiency, or combination of significant deficiencies, that results in more than a remote likelihood that a material misstatement of the financial statements will not be prevented or detected by the entity’s control. Our consideration of the internal control over financial reporting was for the limited purpose described in the first paragraph of this section and would not necessarily identify all deficiencies in internal control that might be significant deficiencies or material weaknesses. We did not identify any deficiencies in internal control over financial reporting that we consider to be material weaknesses, as defined above.
Page 35
INDEPENDENT AUDITOR’S REPORT ON INTERNAL CONTROL OVER FINANCIAL REPORTING AND ON COMPLIANCE AND OTHER MATTERS, INCLUDING COMPLIANCE WITH INVESTMENT GUIDELINES, BASED ON AN AUDIT OF FINANCIAL STATEMENTS PERFORMED IN ACCORDANCE WITH GOVERNMENT AUDITING STANDARDS, CONTINUED Compliance and Other Matters As part of obtaining reasonable assurance about whether the Authority’s financial statements are free of material misstatement, we performed tests of its compliance with certain provisions of laws, regulations, contracts and grant agreements, including Investment Guidelines for Public Authorities and the Authority’s Investment Guidelines, noncompliance with which could have a direct and material effect on the determination of financial statement amounts. However, providing an opinion on compliance with those provisions was not an objective of our audit and, accordingly, we do not express such an opinion. The results of our tests disclosed no instances of noncompliance or other matters that are required to be reported under Government Auditing Standards. This report is intended solely for the information and use of the Members of the Board of the New York State Thruway Authority, management of the Authority, the United States Department of Transportation, and the New York State Department of Transportation and is not intended to be and should not be used by anyone other than these specified parties.
Albany, New York March 31, 2009